Nutritional Correlates of Perceived Stress among University Students...
14
Syddansk Universitet Nutritional Correlates of Perceived Stress among University Students in Egypt El Ansari, Walid; Berg-Beckhoff, Gabriele Published in: International Journal of Environmental Research and Public Health DOI: 10.3390/ijerph121114164 Publication date: 2015 Document version Publisher's PDF, also known as Version of record Citation for pulished version (APA): El Ansari, W., & Berg-Beckhoff, G. (2015). Nutritional Correlates of Perceived Stress among University Students in Egypt. International Journal of Environmental Research and Public Health, 12(11), 14164-14176. DOI: 10.3390/ijerph121114164 General rights Copyright and moral rights for the publications made accessible in the public portal are retained by the authors and/or other copyright owners and it is a condition of accessing publications that users recognise and abide by the legal requirements associated with these rights. • Users may download and print one copy of any publication from the public portal for the purpose of private study or research. • You may not further distribute the material or use it for any profit-making activity or commercial gain • You may freely distribute the URL identifying the publication in the public portal ? Take down policy If you believe that this document breaches copyright please contact us providing details, and we will remove access to the work immediately and investigate your claim. Download date: 04. jun.. 2018
-
Upload
phungkhuong -
Category
Documents
-
view
217 -
download
4
Transcript of Nutritional Correlates of Perceived Stress among University Students...

Syddansk Universitet
Nutritional Correlates of Perceived Stress among University Students in Egypt
El Ansari, Walid; Berg-Beckhoff, Gabriele
Published in:International Journal of Environmental Research and Public Health
DOI:10.3390/ijerph121114164
Publication date:2015
Document versionPublisher's PDF, also known as Version of record
Citation for pulished version (APA):El Ansari, W., & Berg-Beckhoff, G. (2015). Nutritional Correlates of Perceived Stress among University Studentsin Egypt. International Journal of Environmental Research and Public Health, 12(11), 14164-14176. DOI:10.3390/ijerph121114164
General rightsCopyright and moral rights for the publications made accessible in the public portal are retained by the authors and/or other copyright ownersand it is a condition of accessing publications that users recognise and abide by the legal requirements associated with these rights.
• Users may download and print one copy of any publication from the public portal for the purpose of private study or research. • You may not further distribute the material or use it for any profit-making activity or commercial gain • You may freely distribute the URL identifying the publication in the public portal ?
Take down policyIf you believe that this document breaches copyright please contact us providing details, and we will remove access to the work immediatelyand investigate your claim.
Download date: 04. jun.. 2018

Int. J. Environ. Res. Public Health 2015, 12, 14164-14176; doi:10.3390/ijerph121114164
International Journal of Environmental Research and
Public Health ISSN 1660-4601
www.mdpi.com/journal/ijerph
Article
Nutritional Correlates of Perceived Stress among University Students in Egypt
Walid El Ansari 1,* and Gabriele Berg-Beckhoff 2
1 Faculty of Sport, Health and Social Care, University of Gloucestershire, Gloucester GL2 9HW, UK 2 Unit for Health Promotion Research, Institute of Public Health, University of Southern Denmark,
Niels Bohrs Vej 9-10, 6700 Esbjerg, Denmark; E-Mail: [email protected]
* Author to whom correspondence should be addressed; E-Mail: [email protected];
Tel.: +44-0-1242-715274; Fax: +44-0-1242-715222.
Academic Editor: María M. Morales Suárez-Varela
Received: 10 August 2015 / Accepted: 3 November 2015/ Published: 6 November 2015
Abstract: Food intake choice and amount might change with stress. However, this has not
been examined among Egyptian students. We examined students’ stress levels, its correlation
with their consumption of a range of food groups, and adherence to dietary guidelines. A cross
sectional survey (N = 2810 undergraduates at 11 faculties at Assiut University, Egypt) assessed
two composite food intake pattern scores (one unhealthy: sweets, cakes, snacks; and a healthy
one: fruits and vegetables), and two indicators of healthy eating (subjective importance of
healthy eating; and dietary guideline adherence index). Multiple linear regression tested the
associations of stress with two food intake pattern scores and two indicators of healthy
eating, controlling for six potential confounders for the sample and separately for males and
females. Higher perceived stress score was significantly associated with less frequent food
intake of fruit and vegetables in males and females. The association was more pronounced
among males than in females. No significant association was observed between the sweets
cakes and snacks score and stress. Of the two indicators of healthy eating, the dietary guideline
adherence index was not associated with stress, while the subjective judgment of healthy
eating was consistently negatively associated with stress. Stress related decreased-eating was
present. Recent studies suggest that stress could be associated with either decreased or
increased eating depending on the study population, food group, and type of stressor. Further
research is necessary to understand stress related over- and undereating.
OPEN ACCESS

Int. J. Environ. Res. Public Health 2015, 12 14165
Keywords: stress and food intake; student health; healthy eating; dietary guidelines adherence
1. Introduction
Entry to college, whilst exciting, can be stressful for some students. This is due to being away from
their family home (sometimes for the first time), new socializations, personal expectations, peer
competition, the need to achieve good grades, trying to achieve academic success despite financial
constraints, and distress about failing and repeating their course [1]. College students’ stress levels are
important as students use different strategies to cope with stress (e.g., alcohol, smoking, illicit drug/s use)
that might include unhealthy eating. For many people, eating in response to negative emotions or stress is
quite common, and may be considered as an emotional relief and a form of maladaptive coping [2]. Studies
of stress and food choice found that individuals experiencing periods of stress overate food items they would
customarily avoid [3]. However, findings of the association between stress and food selection seem partly
conflicting [4–7]. For a minority of individuals stress or reactions to stress decreases food intake and is
associated with weight loss, however, in most stressed people, food intake, particular energy dense, sweet or
fat foods, is increased [8].
To date, there seems to be no clear understanding of stress-related under- and overeating. Cultural or
religious behavior might be a potential explanation. In Western countries, it is documented that
emotional symptoms and stress affect eating behavior and food intake. However, very little studies have
been undertaken on the relationships between dietary habits, dietary guidelines adherence and stress in the
Eastern Mediterranean Region. Although patchy research on food habits has been conducted in Saudi
Arabia [9,10] and on the impact of life style on the nutritional status of medical students in Egypt [11], to
the best of our knowledge, no study has explicitly considered the association between food habits and
stress. Researchers have also voiced that little is known about the association of stress with the frequency
of consumption of various food groups among college/ university students [12,13].
Therefore the current study aimed to correlate specific nutritional behaviour with perceived stress.
The research contributes to the existing knowledge by examining the association between perceived
stress of male and female university students in Egypt and their self-reported food intake, subjective
importance of healthy eating, and dietary guidelines adherence.
2. Methods
2.1. Study Design, Sample and Data Collection
This cross sectional study comprised self-administered questionnaires that were distributed to students
attending lectures of randomly selected courses at the University of Assiut, Egypt. The University
Research Committee approved the study ethics, and data were collected at the same time (2009–2010,
between the months of September and June) from all participating faculties. Participation was voluntary,
anonymous and data were confidential. Data comprised 3271 students, out of which 461 participants
were excluded due to missing data of the important variables (perceived stress, food frequency
questionnaire, and gender), leaving 1483 females (52.8%) and 1327 male (47.2%) from 11 faculties

Int. J. Environ. Res. Public Health 2015, 12 14166
(Business, Engineering, Education, Arts, Social Work, Sciences, Physical Education, Computers and
Information, Veterinary Medicine, Specific Education, and Agriculture). The response rate was quite
high (about 90%), probably due to the general culture of university students in Egypt, the fact that the
survey was administered usually in the last 10 min of lectures that students attended, thus facilitating
students’ participation, and that it was a paper and pencil questionnaire (i.e., not an online survey which
could yield lower response rates).
The study was a general student health and wellbeing survey similar to studies implemented in several
countries [14]. It included self-reported socio-demographic information, nutritional habits (consumption
frequency of 12 food groups), two food intake pattern scores, two indicators of healthy eating (subjective
importance of healthy eating; and objective computed healthy eating guideline adherence index);
perceived stress; and further covariates.
2.1.1. Perceived Stress Scale
Cohen’s Perceived Stress Scale (PSS) in its four-item short form [15] assessed the degree to which
situations in one’s life over the past month are appraised as stressful. (5-point scale: 0 = “never”,
1 = “almost never”, 2 = “sometimes”, 3 = “fairly often”, 4 = “very often”). The responses were summed
up so that higher scores indicated more perceived stress. Cronbach’s Alpha was 0.47.
The same questionnaire used for Finnish University students revealed a Cronbach’s Alpha 0.76 [16].
2.1.2. Assessment of Food Intake
Students self-reported their food intake habits in a food frequency questionnaire (FFQ) that measured
their usual consumption of 12 food groups (each food group individually) (5 = “several times a day”,
4 = “daily”, 3 = “several times a week”, 2 = “1–4 times a month”, and 1 = “never”) (Table 1).
The instrument was based on pre-existing food frequency questionnaires, adapted for the study [17] and
analogous to other validated FFQs [18,19]. The categories “several times a week” and “daily” were
collapsed together. Then, in order to bring together (bundle) each of the healthy and less healthy food
groups, we calculated two composite food intake pattern scores. The first score was for the less healthy
options—sweets, cake/cookies, and snacks where their relevant scales were added; and the second food
intake pattern score was for the healthier options—fruits, and raw and cooked vegetables where their
relevant scales were added.
2.1.3. Dietary Guideline Adherence Index
Using the students’ responses to the FFQ, a dietary guideline adherence index with maximum of eight
points (eight guidelines) was computed, derived from eight foods: (1) sweets, cookies and snacks;
(2) fast food/ canned food; (3) lemonade/soft drinks; (4) fruits; (5) salad and raw vegetables; (6) cooked
vegetables; (7) meat; and; (8) fish. For sweets, cake/cookies, snacks, fast food/canned food and
lemonade/soft drinks, no specific guidelines exist; hence we employed “1–4 times a month” and “never”
as recommended. To consider all sweets, cake/cookies and snacks together, we used the above composite
food intake pattern score for “sweets, cookies and snacks score”, and healthy eating was considered
present if this score was ≤ 6 corresponding to intake of these items “less often than 1–4 times a month”

Int. J. Environ. Res. Public Health 2015, 12 14167
three times. Each of the fast food/canned food and lemonade/soft drinks were included as individual
items in computing the objective guideline adherence index. For the remaining food groups, we used the
WHO dietary guidelines recommendations for Eastern Mediterranean region [20]. Consequently, for the
number of daily fruit, raw and cooked vegetables servings, the cutoff was “daily” or “several times a
day”. For meat, the cutoff was “less than daily”; and for fish “several times/week” was employed as a
cutoff. Milk and cereals were not included in computing the healthy eating adherence index. Milk
consumption is healthy if lactose intolerance is not present, a condition that appears quite often (74%)
among Egyptian children [21]; and the information about cereals is generally too unspecific in order to
categorize as healthy or unhealthy nutrition.
2.1.4. Importance of Eating Healthy
“How important is for you to eat healthy?” (1 = “Not at all important”, 5 = “very important”).
2.1.5. Potential Confounders That Were Controlled for in the Regression Analysis
These included: (1) age; (2) gender; (3) respondent’s subjective economic situation (“How sufficient
is your income?” coded into sufficient vs. not sufficient); (4) living situation/arrangements during
university terms (“Where do you live during university/college term time?” coded into living at parental
home vs. not living at home); (5) Vigorous and moderate physical activity. Vigorous physical activity was
measured using the question: “On how many of the past 7 days did you participate in vigorous exercise
for at least 20 min?” Participants answered with 0–7 days. We used a cut-off of ≥3 days/week as
adherence to the physical activity guidelines [22]. Moderate physical activity was measured using the
question: (“On how many of the past 7 days did you participate in moderate exercise for at least
30 min?” Participants answered with 0–7 days. We used a cut-off of ≥5 days/week as adherence to the
physical activity guidelines [22]; (6) Faculties (business, engineering and computer science, education
and physical education, arts, social science, science, veterinary medicine, and other); and, (7) body mass
index (BMI), calculated from measured weight and height (kg/m2).
2.2. Statistical Analysis
Analysis was conducted in SAS Version 9.4 (SAS Institute Inc., Cary, NC, USA, p set at < 0.05). For
descriptions, spearman rank coefficient quantified the correlation between each of the nutrition related
variables and the perceived stress score. Multiple linear regression models analysed the effects of the
different nutrition related exposures on perceived stress. Data were adjusted for age, sex, living situation
(accommodation during term time), economic situation, vigorous and moderate physical activity,
Faculty, and BMI. Model assumptions were graphically tested and fulfilled for all models. We tested for
interaction between sex and food pattern on perceived stress. We found significant interaction between
both food intake pattern score (fruit, and raw and cooked vegetable and sweets, cookies and snacks) and
gender, but no interaction was found between subjective importance of healthy eating and dietary
guideline adherence index and gender. For better interpretation, we present all results stratified
by gender.
Int. J. Environ. Res. Public Health 2015, 12 14168
3. Results
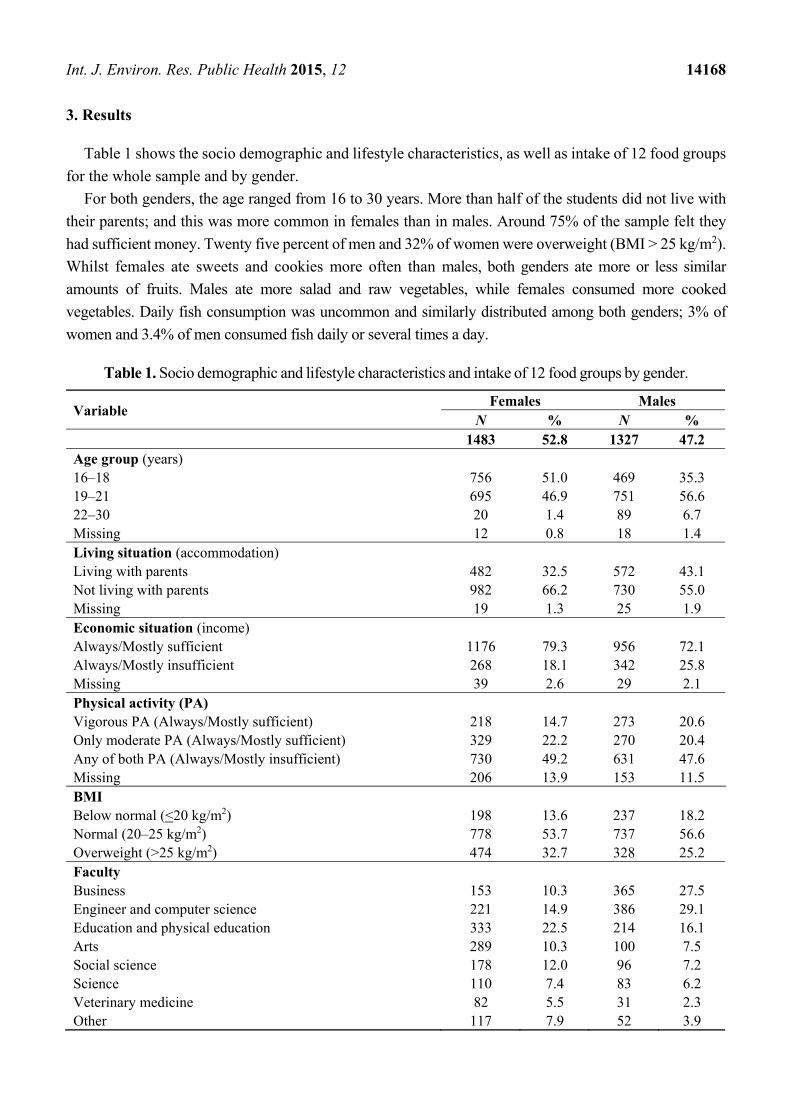
Table 1 shows the socio demographic and lifestyle characteristics, as well as intake of 12 food groups
for the whole sample and by gender.
For both genders, the age ranged from 16 to 30 years. More than half of the students did not live with
their parents; and this was more common in females than in males. Around 75% of the sample felt they
had sufficient money. Twenty five percent of men and 32% of women were overweight (BMI > 25 kg/m2).
Whilst females ate sweets and cookies more often than males, both genders ate more or less similar
amounts of fruits. Males ate more salad and raw vegetables, while females consumed more cooked
vegetables. Daily fish consumption was uncommon and similarly distributed among both genders; 3% of
women and 3.4% of men consumed fish daily or several times a day.
Table 1. Socio demographic and lifestyle characteristics and intake of 12 food groups by gender.
Variable Females Males
N % N % 1483 52.8 1327 47.2 Age group (years) 16–18 756 51.0 469 35.3 19–21 695 46.9 751 56.6 22–30 20 1.4 89 6.7 Missing 12 0.8 18 1.4 Living situation (accommodation) Living with parents 482 32.5 572 43.1 Not living with parents 982 66.2 730 55.0 Missing 19 1.3 25 1.9 Economic situation (income) Always/Mostly sufficient 1176 79.3 956 72.1 Always/Mostly insufficient 268 18.1 342 25.8 Missing 39 2.6 29 2.1 Physical activity (PA) Vigorous PA (Always/Mostly sufficient) 218 14.7 273 20.6 Only moderate PA (Always/Mostly sufficient) 329 22.2 270 20.4 Any of both PA (Always/Mostly insufficient) 730 49.2 631 47.6 Missing 206 13.9 153 11.5 BMI Below normal (<20 kg/m2) 198 13.6 237 18.2 Normal (20–25 kg/m2) 778 53.7 737 56.6 Overweight (>25 kg/m2) 474 32.7 328 25.2 Faculty Business 153 10.3 365 27.5 Engineer and computer science 221 14.9 386 29.1 Education and physical education 333 22.5 214 16.1 Arts 289 10.3 100 7.5 Social science 178 12.0 96 7.2 Science 110 7.4 83 6.2 Veterinary medicine 82 5.5 31 2.3 Other 117 7.9 52 3.9

Int. J. Environ. Res. Public Health 2015, 12 14169
Table 1. Cont.
Variable Females Males
N % N % 1483 52.8 1327 47.2 Food frequency questionnaire (FFQ) * Sweets 320 21.6 154 11.6 Cake, cookies 286 19.3 189 14.2 Snacks 588 39.7 306 23.6 Fresh fruits 323 21.8 273 20.6 Salad, raw vegetables 261 17.6 372 28.0 Cooked vegetables 630 42.5 428 32.3 Fast food, canned food 293 19.7 410 30.9 Lemonade, soft drinks 272 18.3 278 21.0 Meat, sausages 238 16.5 202 15.2 Fish, sea food 44 3.0 45 3.4 Milk and milk products 252 17.0 288 21.7 Cereals and their products 1053 71.0 962 72.5
FFQ = food frequency questionnaire; * percentages calculated for intake of “several times per day” or “daily”.
Table 2 depicts the perceived stress levels, stressors, two food intake pattern scores, subjective
importance of healthy eating, and objective computed healthy eating adherence index of Egyptian
university students by gender. Women were, as expected, more stressed than men. Only marginal gender
differences were observed with regard to fruit and vegetable consumption, but females ate more sweets,
cookies and snacks than men. No gender difference was present with regard to healthy eating habits.
Nearly all participants agreed that healthy eating was important, where the mean score for both genders
was > 4 (out of a maximum score of 5). As for the healthy eating adherence index, men and women
adhered to a mean 3 out of 8 considered guidelines (foods).
Table 2. Stress and eating habits of Egyptian university students by gender.
Variable Females Males p Value
N Mean (SD) N Mean (SD)
Perceived stress * 1483 9.14 (3.06) 1327 8.04 (2.85) <0.001
Food intake pattern score
Fruit, and raw & cooked vegetable ‡ 1483 8.63 (2.26) 1327 8.82 (2.19) 0.01 Sweets, cookies and snacks ‡ 1483 8.79 (2.48) 1327 7.81 (2.27) <0.001
Healthy eating
Subjective importance of healthy eating § 1434 4.33 (1.05) 1274 4.36 (0.99) 0.77 Dietary guideline adherence index || 1483 3.05 (1.22) 1327 3.02 (1.26) 0.34 p values based on Wilcoxon ranks sum test; SD = standard deviation; * range 0–16, higher values correspond to more perceived stress; ‡ range: 3–15 each, scores increase as more is reported to be eaten; § range: 1–5, higher values indicate higher importance of healthy eating; || range: 1–8, each point increase presents an additional food group that exhibited adherence to dietary guidelines.
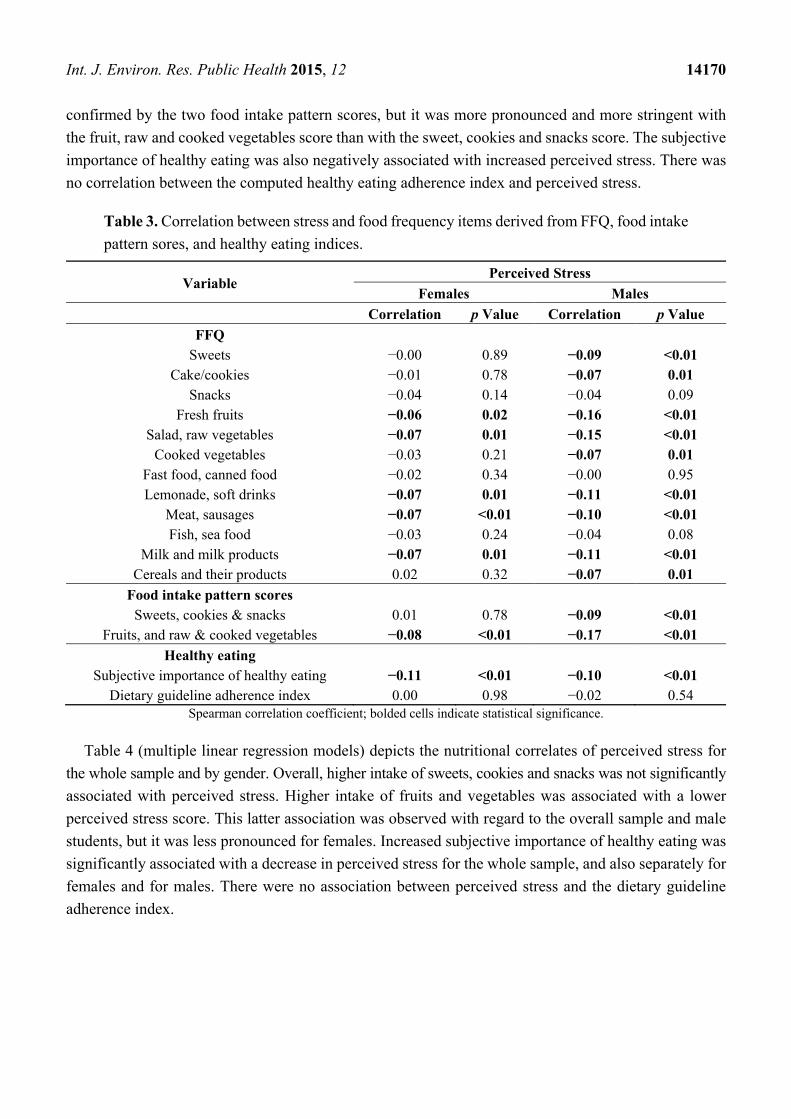
Table 3 shows the correlation coefficients between stress and all nutritional variables (FFQ, two food
intake pattern sores, subjective importance of healthy eating, and dietary guideline adherence index)
stratified for females and for males. All the FFQ food groups were negatively associated with stress,
showing that generally, perceived stress was associated with less food intake. These results were also
Int. J. Environ. Res. Public Health 2015, 12 14170
confirmed by the two food intake pattern scores, but it was more pronounced and more stringent with
the fruit, raw and cooked vegetables score than with the sweet, cookies and snacks score. The subjective
importance of healthy eating was also negatively associated with increased perceived stress. There was
no correlation between the computed healthy eating adherence index and perceived stress.
Table 3. Correlation between stress and food frequency items derived from FFQ, food intake
pattern sores, and healthy eating indices.
Variable Perceived Stress
Females Males
Correlation p Value Correlation p Value
FFQ Sweets −0.00 0.89 −0.09 <0.01
Cake/cookies −0.01 0.78 −0.07 0.01 Snacks −0.04 0.14 −0.04 0.09
Fresh fruits −0.06 0.02 −0.16 <0.01 Salad, raw vegetables −0.07 0.01 −0.15 <0.01
Cooked vegetables −0.03 0.21 −0.07 0.01 Fast food, canned food −0.02 0.34 −0.00 0.95 Lemonade, soft drinks −0.07 0.01 −0.11 <0.01
Meat, sausages −0.07 <0.01 −0.10 <0.01 Fish, sea food −0.03 0.24 −0.04 0.08
Milk and milk products −0.07 0.01 −0.11 <0.01 Cereals and their products 0.02 0.32 −0.07 0.01
Food intake pattern scores Sweets, cookies & snacks 0.01 0.78 −0.09 <0.01
Fruits, and raw & cooked vegetables −0.08 <0.01 −0.17 <0.01
Healthy eating Subjective importance of healthy eating −0.11 <0.01 −0.10 <0.01
Dietary guideline adherence index 0.00 0.98 −0.02 0.54 Spearman correlation coefficient; bolded cells indicate statistical significance.
Table 4 (multiple linear regression models) depicts the nutritional correlates of perceived stress for
the whole sample and by gender. Overall, higher intake of sweets, cookies and snacks was not significantly
associated with perceived stress. Higher intake of fruits and vegetables was associated with a lower
perceived stress score. This latter association was observed with regard to the overall sample and male
students, but it was less pronounced for females. Increased subjective importance of healthy eating was
significantly associated with a decrease in perceived stress for the whole sample, and also separately for
females and for males. There were no association between perceived stress and the dietary guideline
adherence index.

Int. J. Environ. Res. Public Health 2015, 12 14171
Table 4. Multiple linear regression model on nutritional correlates of perceived stress:
two food pattern scores and two healthy eating indices.
Variable Perceived Stress
Whole Sample Females Males
β (95% CI) β (95% CI) β (95% CI)
Food intake pattern score
Sweets, cookies & snacks −0.02 (−0.07; 0.03) 0.01 (−0.06; 0.07) −0.06 (−0.12; 0.01)
Fruits, and raw & cooked vegetables −0.12 (−0.17; −0.07) −0.06 (−0.13; 0.02) −0.19 (−0.26;−0.11)
Healthy eating
Subjective importance of healthy eating −0.30 (−0.41; −0.19) −0.30 (−0.45; −0.14) −0.30 (−0.46; −0.14)
Objective healthy eating adherence index −0.02 (−0.11; 0.07) 0.00 (−0.13; 0.13) −0.04 (−0.17; 0.08) All models adjusted for age, living situation, economic situation, vigorous and moderate physical activity, faculty, and BMI, and the model for the whole sample is additionally adjusted for sex; bolded cells indicate statistical significance (p < 0.05).
4. Discussion
Higher food intake was associated with lower perceived stress across this sample of Egyptian
undergraduates. This association was true for all the FFQ foods groups, even though the association was
not significant for snacks, fish and fast food. However, when controlled for the many potential confounders
e.g., age, living situation, economic situation, physical activity, and BMI, this negative association
disappeared for sweets, cakes and snacks but remained significant for fruit and vegetables. Upon the
first inspection, our observed finding contrasts with previous research [3–5,11,12,23–25];
but a recent review found that stress results in either increased or reduced food intake depending on the
types of external or psychological stressors [26]. Similarly, another review of emotions and eating habits
summarized the findings of eight surveys in terms of changes of eating habits in response to emotional
stress. All the reviewed surveys reported stress related over- and under- eating, with a generally lower
percentage of more appetite due to stress (4%–55%), and a higher percentage of having less appetite due
to stress (42%–70%) [27]. Particularly in terms of consuming fruits and vegetables, our findings of
eating behavior and stress support that higher stress is associated with lower consumption of fruits and
vegetables [6,23,28]. In addition, an experimental study of the effects of academic examination stress
on eating behaviors among students in the UK found no effects of exam stress on food intake [7]. Hence,
our findings agree with and are confirmed by some of the more recent studies. It is worth exploring the
potential underlying mechanisms for our observed negative association between stress and food intake.
It has been suggested that stress eating habits depend on the types of stressors [24]. For instance, exam
related stress at universities might need to be interpreted differently than overall lifetime or chronic
stress situations.
In terms of eating habits, research has observed that eating habits and stress might be associated in
different ways depending on the type of eating habits [26]. There are, for example, different associations
between stress and food intake that are seen among emotional eaters, restraint eaters and uncontrolled
eaters [24,27,29]. Given that the effect of stress among these diverse eating behavior subgroups is not
homogenous, and in fact differed in the cited publications, such heterogeneity in the stress-food intake
association suggested at minimum that there were sub populations or “vulnerable groups”, where the
association between food habits and stress was “not traditional”. In addition, other potential features that
Int. J. Environ. Res. Public Health 2015, 12 14172
could contribute to explaining the different associations between stress and food habits might relate to
the overall stress type/load [29], or alternatively to cultural and sociological background, or religion.
Such aspects seem to be very under-researched in the literature. Future research would benefit from
exploring the underlying mechanism/s for different (positive or negative) stress-food intake relationships,
and examining the potential predictors that might assist in the differentiation between “stress over-eaters”
and “stress under-eaters”.
In addition, we examined the association between perceived stress and the extent of adherence to
healthy eating guidelines. Our computed healthy eating guideline adherence index was not at all
associated with perceived stress in this sample of Egypt undergraduates. To date, only very few studies
have examined the association between adherence to nutritional guidelines and stress. A cross sectional
study among a community-based sample of African Americans showed that more perceived stress was
associated with haphazard planning of meals, to conclude that during stressful periods, individuals were
less likely to plan their meals carefully [24]. Whilst over-eating sweets and snacks, meat and fatty products
is unhealthy; over-eating fruit and vegetables is healthy. All things considered, it is the combination of
all these different food intake patterns that ultimately defines unhealthy or healthy eating habits. In our
data, all the FFQ foods were under-eaten by students who perceived stress. A cross sectional survey
among university students in the UK [28] found both overeating of snacks, sweets and fast food but also
under eating of fruit and vegetables by those reporting high stress levels, which might suggest that
nutritional guideline adherence index would be worse among persons with higher perceived stress. Further
research would be beneficial to clarify the relationships between food guideline adherence and stress.
In terms of the subjective judgment/importance of healthy eating, we observed that this was most
pronounced, consistent across males and females, and negatively associated with perceived stress: the
higher the stress level—the less important healthy eating was judged. Our finding is in line with Sim’s
interpretation that during stressful periods, individuals were less likely to plan their meals
carefully [24]. However, an interesting point to note is the miscongruency between the subjective
importance of healthy eating (most significantly associated with perceived stress) on the one hand; and
the objective computed healthy eating guideline adherence (no association with perceived stress at all)
on the other hand.
As for gender, we observed higher stress levels amongst females (Table 2), in support of research in
Egypt that reported that female gender was associated with stress [30]. Despite this finding, we found
that the correlations between stress and food frequency items (derived from FFQ), food intake pattern
sores, and healthy eating indices were generally lower among females than males (Table 3) (association
was more pronounced among male students). Likewise, in the regression analysis, higher intake of fruits
and vegetables was associated with a lower perceived stress, but this was less pronounced among female
students. Our findings support research on stress and dietary behaviour among first-year university
students in Australia that found a distinct difference in food selection patterns between stressed male
and female students, with stress being a more significant predictor of unhealthy food selection among
male students [31]. Future research is needed, perhaps employing qualitative methodologies to uncover
how stress and eating behavior are associated among university populations of young adults.
This study has limitations, and generalization of the findings needs to be cautious. Self-reporting
of perceived stress and dietary food consumption might be subject to sociability and social desirability.
As a cross-sectional survey, the direction of the association between food consumption and perceived

Int. J. Environ. Res. Public Health 2015, 12 14173
stress cannot be ascertained. The semi quantitative FFQ should be interpreted with caution, and as we
did not assess serving sizes, it does not allow the calculation of the precise amounts of food intakes.
Further, there is no information on the validity of this specific FFQ among Egyptian students. Nonetheless,
the tool was comparable to other published food frequency questionnaires that have been validated [18,19].
However, analyses of the food pattern scores and the dietary adherence index were based on the food
intake frequencies (i.e., how often students reported that they ate a given food). Due to the cross sectional
study design, and the coarse assessment of the exposure, future research is necessary to deepen the
understanding of these issues, and should focus on follow up/longitudinal study designs that employ
validated and sophisticated assessments of the dietary habits. Our response rate was below 100%, and it
could have been that students with higher stress levels might not have been at the university on the data
collection days and might have had no further opportunity to participate in the study. It would have been
useful to have had any available information on our non-responders in order to compare them with those
who responded in an attempt to detect any differences in their characteristics or bias in the responses of
the sample. Despite these limitations, the study’s main strengths include the use of a large sample, with
high response rate, across many faculties, and comprising a broad variety of disciplines. Very little
research has been undertaken in the Eastern Mediterranean Region on the dietary habits, dietary
guidelines adherence and their relationships with stress. Less is known about the association of stress
with the frequency of consumption of various food groups among college/ university students. We are
not aware of previous research in Egypt that has assessed such relationships in detail.
5. Conclusions
In the current sample, women were more stressed than men. Only marginal gender differences were
apparent with regard to fruit and vegetable consumption, but females ate more sweets, cookies and snacks
than men. No gender difference was present with regard to healthy eating habits. Higher fruits and
vegetables intake was associated with a lower perceived stress score. This latter association was seen
with regard to the overall sample and among males, but it was less pronounced for females.
Stress-related decreased eating was present across this Egyptian sample. Recent studies seem to
suggest that stress could be associated with both, eating less and/or eating more depending on several
factors e.g., study population, food group, and type of stressor. Further research is necessary to differentiate
between stress related over- and under-eating.
The lower subjective judgment of healthy eating while people are perceiving stress implies that
during stressful periods, individuals might be less likely to plan their meals carefully. However,
this does not seem to play a role in terms of their adherence to nutritional guidelines because adherence
was not associated with perceived stress. Further research could outline the potential predictors in order
to differentiate stress related under and over-eater, and to deepen our understanding of the
association between stress related eating habits and nutritional recommendations across student
populations in different faculties and countries, and by the type of stressor/s and other characteristics of
the diet patterns.

Int. J. Environ. Res. Public Health 2015, 12 14174
Acknowledgments
The authors thank the university, faculties and students who participated in this study. We also
acknowledge Labeeb S, Kotb S and El-Houfey A for their assistance in the collection of the data.
Author Contributions
Walid El Ansari does conception of the study and supervision of its implementation, contribution to
analysis, interpretation of analysis, write up of manuscript. Gabriele Berg-Beckhoff does statistical
analysis, contribution to interpretation of analysis, review of manuscript.
Conflicts of Interest
The authors declare no conflict of interest.
References
1. Chan, G.C.; Koh, D. Understanding the psychosocial and physical work environment in a Singapore
medical school. Singapore Med. J. 2007, 48, 166–171.
2. Manzoni, G.M.; Pagnini, F.; Gorini, A.; Preziosa, A.; Castelnuovo, G.; Molinari, E.; Riva, G.
Can relaxation training reduce emotional eating in women with obesity? An exploratory study with
3 months of follow-up. J. Am. Diet. Assoc. 2009, 109, 1427–1432.
3. Zellner, D.A.; Saito, S.; Gonzalez, J. The effect of stress on men’s food selection. Appetite 2007,
49, 696–699.
4. McCann, B.S.; Warnick, G.R.; Knopp, R.H. Changes in plasma lipids and dietary intake accompanying
shifts in perceived work-load and stress. Psychosom. Med. 1990, 52, 97–108.
5. Michaud, C.; Kahn, J.P.; Musse, N.; Burlet, C.; Nicolas, J.P.; MeJean, L. Relationships between a
critical life event and eating behavior in highschool students. Stress Med. 1990, 6, 57–64.
6. Oliver, G.; Wardle, J. Perceived effects of stress on food choice. Physiol. Behav. 1998, 66, 511–515.
7. Pollard, T.M.; Steptoe, A.; Canaan, L.; Davies, G.J.; Wardle, J. Effects of academic examination
stress on eating behavior and blood lipid levels. Int. J. Behav. Med. 1995, 2, 299–320.
8. Epel, E.; Jimenez, S.; Brownell, K.; Stroud, L.; Stoney, C.; Niaura, R. Are stress eaters at risk for
the metabolic syndrome? Ann. N. Y. Acad. Sci. 2004, 1032, 208–210.
9. El Hamid Hussein, R.A. Socioeconomic status and dietary habits as predictors of home breakfast
skipping in young women. J. Egypt Public Health Assoc. 2014, 89, 100–104.
10. AL-Qauhiz, N.M. Obesity among Saudi Female University Students: Dietary Habits and Health
Behaviors. J. Egypt Public Health Assoc. 2010, 85, 45–59.
11. Bakr, E.M.; Ismail, N.A.; Mahaba, H.M. Impact of life style on the nutritional status of medical
students at Ain Shams University. J. Egypt Public Health Assoc. 2002, 77, 29–49.
12. Mikolajczyk, R.T.; El Ansari, W.; Maxwell, A.E. Food consumption frequency and perceived stress
and depressive symptoms among students in three European countries. Nutr. J. 2009, 8, 31.
13. Liu, C.; Xie, B.; Chou, C.P.; Koprowski, C.; Zhou, D.; Palmer, P.; Sun, P.; Guo, Q.; Duan, L.; Sun, X.;
Anderson Johnson, C. Perceived stress, depression and food consumption frequency in the college
students of China Seven Cities. Physiol. Behav. 2007, 92, 748–754.

Int. J. Environ. Res. Public Health 2015, 12 14175
14. El Ansari, W.; Dibba, E.; Stock, C. Body image concerns: Levels, correlates and gender differences
among students in the United Kingdom. Cent. Eur. J. Public Health 2014, 22, 106–117.
15. Cohen, S.; Kamarck, T.; Mermelstein, R. A global measure of perceived stress. J. Health Soc. Behav.
1983, 24, 385–396.
16. El Ansari, W.; Suominen S.; Berg-Beckhoff, G. Mood and food at the university of Turku in
Finland: Nutritional correlates of perceived stress are most pronounced among overweight students.
Int. J. Public Health 2015, 60, 707–716.
17. El Ansari, W.; Stock, C.; Mikolajczyk, R.T. Relationships between food consumption and living
arrangements among university students in four European countries—A cross-sectional study.
Nutr. J. 2012, 11, doi:10.1186/1475-2891-11-28.
18. Osler, M.; Heitmann, B.L. The validity of a short food frequency questionnaire and its ability to
measure changes in food intake: A longitudinal study. Int. J. Epidemiol. 1996, 25, 1023–1029.
19. Roddam, A.W.; Spencer, E.; Banks, E.; Beral, V.; Reeves, G.; Appleby, P.; Barnes, I.;
Whiteman, D.C.; Key, T.J. Reproducibility of a short semi-quantitative food group questionnaire
and its performance in estimating nutrient intake compared with a 7-day diet diary in the Million
Women Study. Public Health Nutr. 2005, 8, 201–213.
20. WHO. Promoting a Healthy Diet for the WHO Eastern Mediterranean Region. Cairo: WHO,
Regional Office for Eastern Mediterranean; WHO: Geneva, Switzerland, 2012.
21. Abuhamdah, S.M.A.; Oriquat, G.A.; Saleem, T.H.; Hassan, M.H. Prevalence of Lactose Intolerance
in Primary School Children in Qena Governorate, Egypt. Jordan J. Biol. Sci. 2013, 6, 334–336.
22. Haskell, W.L.; Lee, I.M.; Pate, R.R.; Powell, K.E.; Blair, S.N.; Franklin, B.A.; Macera, C.A.;
Heath, G.W.; Thompson, P.D.; Bauman, A. A physical activity and public health: Updated
recommendation for adults from the American College of Sports Medicine and the American Heart
Association. Circulation 2007, 116, 1081–1093.
23. Groesz, L.M.; McCoy, S.; Carl, J.; Saslow, L.; Stewart, J.; Adler, N.; Laraia, B.; Epel, E. What is
eating you? Stress and the drive to eat. Appetite 2012, 58, 717–721.
24. Sims, R.; Gordon, S.; Garcia, W.; Clark, E.; Monye, D.; Callender, C.; Campbell, A. Perceived
stress and eating behaviors in a community-based sample of African Americans. Eat. Behav. 2008,
9, 137–142.
25. Lääskeläinen, A.; Nevanperä, N.; Remes, J.; Fahkonen, F.; Järvelin, M.R.; Laitinen, J. Stress related
eating, obesity and associated behavioural traits in adolescents: A prospective population based
cohort study. BMC Public Health 2014, 14, 321.
26. Singh, M. Mood, food and obesity. Front. Psychol. 2014, 5, 925.
27. Macht, M. How emotions affect eating: A five-way model. Appetite 2008, 50, 1–11.
28. El Ansari, W.; Adetunji, H.; Oskrochi, R. Food and mental health: Relationship between food and
perceived stress and depressive symptoms among university students in the United Kingdom.
Cent. Eur. J. Public Health 2014, 22, 90–97.
29. Wallis, D.J.; Hetherington, M.M. Emotions and eating. Self-reported and experimentally induced
changes in food intake under stress. Appetite 2008, 52, 355–362.

Int. J. Environ. Res. Public Health 2015, 12 14176
30. El Ansari, W.; Oskrochi, R.; Haghgoo, G. Are students’ symptoms and health complaints associated
with perceived stress at university? Perspectives from the United Kingdom and Egypt. Int. J.
Environ. Res. Public Health 2014, 11, 9981–10002.
31. Papier, K.; Ahmed, F.; Lee, P.; Wiseman, J. Stress and dietary behaviour among first-year university
students in Australia: Sex differences. Nutrition 2015, 31, 324–330.
© 2015 by the authors; licensee MDPI, Basel, Switzerland. This article is an open access article
distributed under the terms and conditions of the Creative Commons Attribution license
(http://creativecommons.org/licenses/by/4.0/).