Human Cortical Activity Correlates With …fleet/research/Papers/jneurophys01.pdfHuman Cortical...
15
Human Cortical Activity Correlates With Stereoscopic Depth Perception BENJAMIN T. BACKUS, 1 DAVID J. FLEET, 3 ANDREW J. PARKER, 2 AND DAVID J. HEEGER 4 1 Department of Psychology, University of Pennsylvania, Philadelphia, Pennsylvania 19104-6196; 2 Department of Physiology, Oxford University, Oxford OX1 3PT, United Kingdom; 3 Xerox Palo Alto Research Center, Palo Alto 94034; and 4 Department of Psychology, Stanford University, Stanford, California 94305-2130 Received 25 August 2000; accepted in final form 4 May 2001 Backus, Benjamin T., David J. Fleet, Andrew J. Parker, and David J. Heeger. Human cortical activity correlates with stereoscopic depth perception. J Neurophysiol 86: 2054–2068, 2001. Stereoscopic depth perception is based on binocular disparities. Although neurons in primary visual cortex (V1) are selective for binocular disparity, their responses do not explicitly code perceived depth. The stereoscopic path- way must therefore include additional processing beyond V1. We used functional magnetic resonance imaging (fMRI) to examine stereo pro- cessing in V1 and other areas of visual cortex. We created stereoscopic stimuli that portrayed two planes of dots in depth, placed symmetrically about the plane of fixation, or else asymmetrically with both planes either nearer or farther than fixation. The interplane disparity was varied para- metrically to determine the stereoacuity threshold (the smallest detectable disparity) and the upper depth limit (largest detectable disparity). fMRI was then used to quantify cortical activity across the entire range of detectable interplane disparities. Measured cortical activity covaried with psychophysical measures of stereoscopic depth perception. Activity in- creased as the interplane disparity increased above the stereoacuity threshold and dropped as interplane disparity approached the upper depth limit. From the fMRI data and an assumption that V1 encodes absolute retinal disparity, we predicted that the mean response of V1 neurons should be a bimodal function of disparity. A post hoc analysis of elec- trophysiological recordings of single neurons in macaques revealed that, although the average firing rate was a bimodal function of disparity (as predicted), the precise shape of the function cannot fully explain the fMRI data. Although there was widespread activity within the extrastriate cortex (consistent with electrophysiological recordings of single neu- rons), area V3A showed remarkable sensitivity to stereoscopic stimuli, suggesting that neurons in V3A may play a special role in the stereo pathway. INTRODUCTION Since Wheatstone’s report in 1838 that binocular disparity is sufficient to evoke a percept of depth (Wheatstone 1838), the remarkable computations that support stereopsis have been under study. Neurons selective for binocular disparity were first described in the primary visual cortex of the cat (Barlow et al. 1967; Nikara et al. 1968; Pettigrew et al. 1968). In nonhuman primates, disparity-selective cells have been identi- fied in visual areas V1, V2, V3, V3A, V4, MT (V5), and MST (Burkhalter and Van Essen 1986; DeAngelis and Newsome 1999; Gonzalez and Perez 1998; Hinkle and Conner 2001; Maunsell and Van Essen 1983; Poggio 1995). The great ma- jority of electrophysiological studies have been performed in V1, but disparity-selective activity in V1 is not always corre- lated with stereo depth perception (Cumming and Parker 1997). Although they might contribute directly as the sensory input to the vergence system, there are several respects in which the neuronal signals in V1 would need further process- ing to extract an unambiguous representation of stereoscopic depth (Cumming and Parker 2000; Fleet et al. 1996; Parker et al. 2000; Prince et al. 2000). For example, neurons in V1 respond to the absolute disparity of visual stimuli, showing essentially no sensitivity to relative disparity (Cumming and Parker 1999), whereas the finest stereoacuity judgments are generated psychophysically only by stimuli that contain rela- tive disparity information (Kumar and Glaser 1992; Westhei- mer 1979). Absolute disparity reflects a disparity of features within the left and right retinal images with respect to anatom- ical landmarks on the left and right retinae, whereas relative disparity reflects the differences in the absolute disparities of two visual features in the three-dimensional (3-D) scene. It is therefore of particular interest to investigate how the signals from disparity-selective neurons in V1 are transformed by other visual areas in extrastriate cortex (analogous to the well- characterized visual motion pathway). As a step toward that goal, we have used functional magnetic imaging (fMRI) to measure the response of several human visual areas to stimuli that contain binocular disparity. Although human perceptual responses to binocular disparity have been studied extensively (Howard and Rogers 1995), there have been relatively few studies of how human cortical activity is related to stereo depth perception. Of these few studies, most relied on measurements of visual evoked poten- tials, a method that has limited spatial resolution (Braddick and Atkinson 1983; Fiorentini and Maffei 1970; Norcia and Tyler 1984; Norcia et al. 1985). A handful of positron emission tomography (PET) and fMRI experiments have been per- formed, focusing primarily on localizing those cortical areas that are most strongly activated by stereoscopic stimuli (Gulyas and Roland 1994; Khan et al. 1997; Nakadomari et al. 1999; Ptito et al. 1993; Rutschmann and Greenlee 1999). In contrast, we measured fMRI responses as a parametric function of disparity in each of several predefined visual cortical areas, Address for reprint requests: B. T. Backus, Dept. of Psychology, University of Pennsylvania, 3815 Walnut St., Philadelphia, PA 19104-6196. The costs of publication of this article were defrayed in part by the payment of page charges. The article must therefore be hereby marked ‘‘advertisement’’ in accordance with 18 U.S.C. Section 1734 solely to indicate this fact. 2054 0022-3077/01 $5.00 Copyright © 2001 The American Physiological Society www.jn.org
Transcript of Human Cortical Activity Correlates With …fleet/research/Papers/jneurophys01.pdfHuman Cortical...
Human Cortical Activity Correlates With StereoscopicDepth Perception
BENJAMIN T. BACKUS,1 DAVID J. FLEET,3 ANDREW J. PARKER,2 AND DAVID J. HEEGER4
1Department of Psychology, University of Pennsylvania, Philadelphia, Pennsylvania 19104-6196;2Department ofPhysiology, Oxford University, Oxford OX1 3PT, United Kingdom;3Xerox Palo Alto Research Center, Palo Alto94034; and4Department of Psychology, Stanford University, Stanford, California 94305-2130
Received 25 August 2000; accepted in final form 4 May 2001
Backus, Benjamin T., David J. Fleet, Andrew J. Parker, andDavid J. Heeger.Human cortical activity correlates with stereoscopicdepth perception.J Neurophysiol86: 2054–2068, 2001.Stereoscopicdepth perception is based on binocular disparities. Although neurons inprimary visual cortex (V1) are selective for binocular disparity, theirresponses do not explicitly code perceived depth. The stereoscopic path-way must therefore include additional processing beyond V1. We usedfunctional magnetic resonance imaging (fMRI) to examine stereo pro-cessing in V1 and other areas of visual cortex. We created stereoscopicstimuli that portrayed two planes of dots in depth, placed symmetricallyabout the plane of fixation, or else asymmetrically with both planes eithernearer or farther than fixation. The interplane disparity was varied para-metrically to determine the stereoacuity threshold (the smallest detectabledisparity) and the upper depth limit (largest detectable disparity). fMRIwas then used to quantify cortical activity across the entire range ofdetectable interplane disparities. Measured cortical activity covaried withpsychophysical measures of stereoscopic depth perception. Activity in-creased as the interplane disparity increased above the stereoacuitythreshold and dropped as interplane disparity approached the upper depthlimit. From the fMRI data and an assumption that V1 encodes absoluteretinal disparity, we predicted that the mean response of V1 neuronsshould be a bimodal function of disparity. A post hoc analysis of elec-trophysiological recordings of single neurons in macaques revealed that,although the average firing rate was a bimodal function of disparity (aspredicted), the precise shape of the function cannot fully explain the fMRIdata. Although there was widespread activity within the extrastriatecortex (consistent with electrophysiological recordings of single neu-rons), area V3A showed remarkable sensitivity to stereoscopic stimuli,suggesting that neurons in V3A may play a special role in the stereopathway.
I N T R O D U C T I O N
Since Wheatstone’s report in 1838 that binocular disparity issufficient to evoke a percept of depth (Wheatstone 1838), theremarkable computations that support stereopsis have beenunder study. Neurons selective for binocular disparity werefirst described in the primary visual cortex of the cat (Barlowet al. 1967; Nikara et al. 1968; Pettigrew et al. 1968). Innonhuman primates, disparity-selective cells have been identi-fied in visual areas V1, V2, V3, V3A, V4, MT (V5), and MST(Burkhalter and Van Essen 1986; DeAngelis and Newsome1999; Gonzalez and Perez 1998; Hinkle and Conner 2001;Maunsell and Van Essen 1983; Poggio 1995). The great ma-
jority of electrophysiological studies have been performed inV1, but disparity-selective activity in V1 is not always corre-lated with stereo depth perception (Cumming and Parker1997). Although they might contribute directly as the sensoryinput to the vergence system, there are several respects inwhich the neuronal signals in V1 would need further process-ing to extract an unambiguous representation of stereoscopicdepth (Cumming and Parker 2000; Fleet et al. 1996; Parker etal. 2000; Prince et al. 2000). For example, neurons in V1respond to the absolute disparity of visual stimuli, showingessentially no sensitivity to relative disparity (Cumming andParker 1999), whereas the finest stereoacuity judgments aregenerated psychophysically only by stimuli that contain rela-tive disparity information (Kumar and Glaser 1992; Westhei-mer 1979). Absolute disparity reflects a disparity of featureswithin the left and right retinal images with respect to anatom-ical landmarks on the left and right retinae, whereas relativedisparity reflects the differences in the absolute disparities oftwo visual features in the three-dimensional (3-D) scene. It istherefore of particular interest to investigate how the signalsfrom disparity-selective neurons in V1 are transformed byother visual areas in extrastriate cortex (analogous to the well-characterized visual motion pathway). As a step toward thatgoal, we have used functional magnetic imaging (fMRI) tomeasure the response of several human visual areas to stimulithat contain binocular disparity.
Although human perceptual responses to binocular disparityhave been studied extensively (Howard and Rogers 1995),there have been relatively few studies of how human corticalactivity is related to stereo depth perception. Of these fewstudies, most relied on measurements of visual evoked poten-tials, a method that has limited spatial resolution (Braddick andAtkinson 1983; Fiorentini and Maffei 1970; Norcia and Tyler1984; Norcia et al. 1985). A handful of positron emissiontomography (PET) and fMRI experiments have been per-formed, focusing primarily on localizing those cortical areasthat are most strongly activated by stereoscopic stimuli (Gulyasand Roland 1994; Khan et al. 1997; Nakadomari et al. 1999;Ptito et al. 1993; Rutschmann and Greenlee 1999). In contrast,we measured fMRI responses as a parametric function ofdisparity in each of several predefined visual cortical areas,
Address for reprint requests: B. T. Backus, Dept. of Psychology, Universityof Pennsylvania, 3815 Walnut St., Philadelphia, PA 19104-6196.
The costs of publication of this article were defrayed in part by the paymentof page charges. The article must therefore be hereby marked ‘‘advertisement’’in accordance with 18 U.S.C. Section 1734 solely to indicate this fact.
2054 0022-3077/01 $5.00 Copyright © 2001 The American Physiological Society www.jn.org
analogous to parametric measurements of contrast (Boynton etal. 1996, 1999; Wandell et al. 1999) and motion coherence(Rees et al. 2000b).
Our goals in the present study were to quantify the disparity-related responses in early cortical visual areas, and to examinehow the responses of these areas are related to stereoscopicdepth perception. We focused on two psychophysical measuresof stereoscopic vision: thestereoacuity thresholdand theupperdepth limit. These measures characterize, respectively, thesmallest and largest disparities that can be detected by thevisual system. With fMRI, we measured cortical activity as afunction of stimulus disparity. We found that responses in eachof several cortical areas covaried with psychophysics and per-ception, and that area V3A was relatively more sensitive tobinocular disparity.
M E T H O D S
Visual stimuli
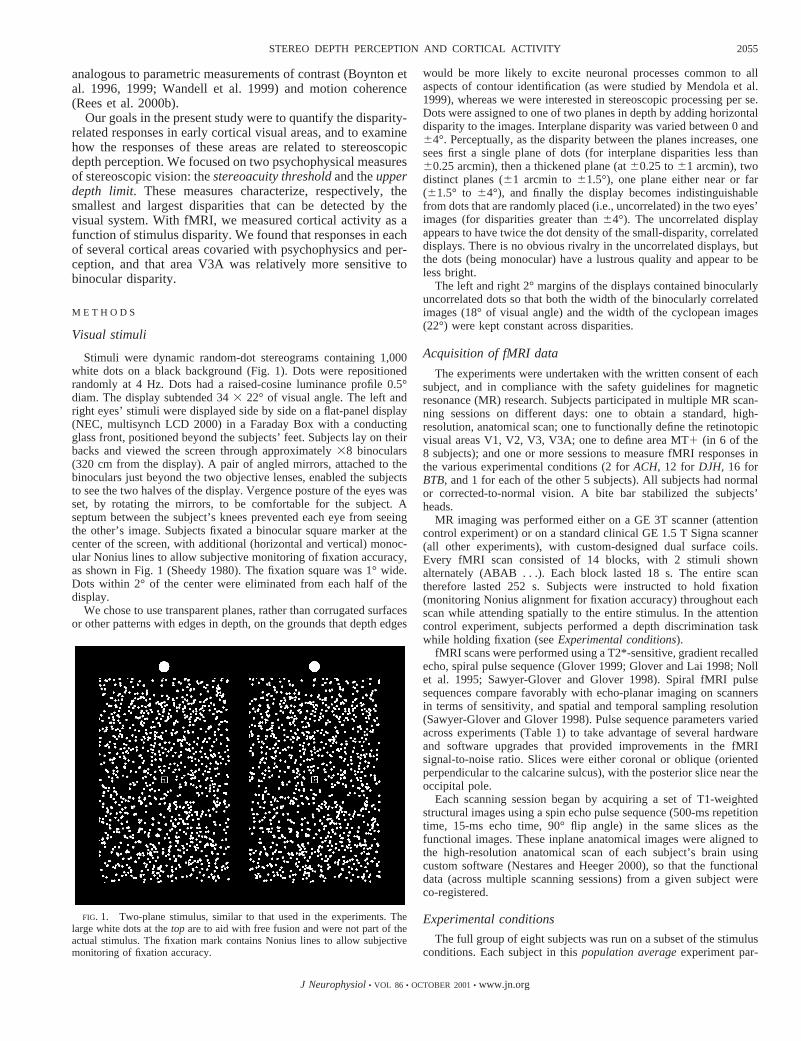
Stimuli were dynamic random-dot stereograms containing 1,000white dots on a black background (Fig. 1). Dots were repositionedrandomly at 4 Hz. Dots had a raised-cosine luminance profile 0.5°diam. The display subtended 343 22° of visual angle. The left andright eyes’ stimuli were displayed side by side on a flat-panel display(NEC, multisynch LCD 2000) in a Faraday Box with a conductingglass front, positioned beyond the subjects’ feet. Subjects lay on theirbacks and viewed the screen through approximately38 binoculars(320 cm from the display). A pair of angled mirrors, attached to thebinoculars just beyond the two objective lenses, enabled the subjectsto see the two halves of the display. Vergence posture of the eyes wasset, by rotating the mirrors, to be comfortable for the subject. Aseptum between the subject’s knees prevented each eye from seeingthe other’s image. Subjects fixated a binocular square marker at thecenter of the screen, with additional (horizontal and vertical) monoc-ular Nonius lines to allow subjective monitoring of fixation accuracy,as shown in Fig. 1 (Sheedy 1980). The fixation square was 1° wide.Dots within 2° of the center were eliminated from each half of thedisplay.
We chose to use transparent planes, rather than corrugated surfacesor other patterns with edges in depth, on the grounds that depth edges
would be more likely to excite neuronal processes common to allaspects of contour identification (as were studied by Mendola et al.1999), whereas we were interested in stereoscopic processing per se.Dots were assigned to one of two planes in depth by adding horizontaldisparity to the images. Interplane disparity was varied between 0 and64°. Perceptually, as the disparity between the planes increases, onesees first a single plane of dots (for interplane disparities less than60.25 arcmin), then a thickened plane (at60.25 to61 arcmin), twodistinct planes (61 arcmin to61.5°), one plane either near or far(61.5° to 64°), and finally the display becomes indistinguishablefrom dots that are randomly placed (i.e., uncorrelated) in the two eyes’images (for disparities greater than64°). The uncorrelated displayappears to have twice the dot density of the small-disparity, correlateddisplays. There is no obvious rivalry in the uncorrelated displays, butthe dots (being monocular) have a lustrous quality and appear to beless bright.
The left and right 2° margins of the displays contained binocularlyuncorrelated dots so that both the width of the binocularly correlatedimages (18° of visual angle) and the width of the cyclopean images(22°) were kept constant across disparities.
Acquisition of fMRI data
The experiments were undertaken with the written consent of eachsubject, and in compliance with the safety guidelines for magneticresonance (MR) research. Subjects participated in multiple MR scan-ning sessions on different days: one to obtain a standard, high-resolution, anatomical scan; one to functionally define the retinotopicvisual areas V1, V2, V3, V3A; one to define area MT1 (in 6 of the8 subjects); and one or more sessions to measure fMRI responses inthe various experimental conditions (2 forACH, 12 for DJH, 16 forBTB,and 1 for each of the other 5 subjects). All subjects had normalor corrected-to-normal vision. A bite bar stabilized the subjects’heads.
MR imaging was performed either on a GE 3T scanner (attentioncontrol experiment) or on a standard clinical GE 1.5 T Signa scanner(all other experiments), with custom-designed dual surface coils.Every fMRI scan consisted of 14 blocks, with 2 stimuli shownalternately (ABAB . . .). Each block lasted 18 s. The entire scantherefore lasted 252 s. Subjects were instructed to hold fixation(monitoring Nonius alignment for fixation accuracy) throughout eachscan while attending spatially to the entire stimulus. In the attentioncontrol experiment, subjects performed a depth discrimination taskwhile holding fixation (seeExperimental conditions).
fMRI scans were performed using a T2*-sensitive, gradient recalledecho, spiral pulse sequence (Glover 1999; Glover and Lai 1998; Nollet al. 1995; Sawyer-Glover and Glover 1998). Spiral fMRI pulsesequences compare favorably with echo-planar imaging on scannersin terms of sensitivity, and spatial and temporal sampling resolution(Sawyer-Glover and Glover 1998). Pulse sequence parameters variedacross experiments (Table 1) to take advantage of several hardwareand software upgrades that provided improvements in the fMRIsignal-to-noise ratio. Slices were either coronal or oblique (orientedperpendicular to the calcarine sulcus), with the posterior slice near theoccipital pole.
Each scanning session began by acquiring a set of T1-weightedstructural images using a spin echo pulse sequence (500-ms repetitiontime, 15-ms echo time, 90° flip angle) in the same slices as thefunctional images. These inplane anatomical images were aligned tothe high-resolution anatomical scan of each subject’s brain usingcustom software (Nestares and Heeger 2000), so that the functionaldata (across multiple scanning sessions) from a given subject wereco-registered.
Experimental conditions
The full group of eight subjects was run on a subset of the stimulusconditions. Each subject in thispopulation averageexperiment par-
FIG. 1. Two-plane stimulus, similar to that used in the experiments. Thelarge white dots at thetop are to aid with free fusion and were not part of theactual stimulus. The fixation mark contains Nonius lines to allow subjectivemonitoring of fixation accuracy.
2055STEREO DEPTH PERCEPTION AND CORTICAL ACTIVITY
J Neurophysiol• VOL 86 • OCTOBER 2001• www.jn.org
ticipated in one scanning session that included:1) four repeated scansof a 67.5 arcmin (2-plane) stimulus alternated with a zero disparity(1-plane) stimulus, and2) five repeats of the67.5 arcmin (2-plane)stimulus alternated with a blank screen. After establishing throughthese measurements that cortical activity depended on stereoscopicdepth, we proceeded to study this dependence in greater detail in twosubjects (authorsBTB andDJH) in the stereoacuity and upper depthlimit experiments.
In the stereoacuityexperiments, two-plane stimuli were alternatedwith a one-plane (zero-disparity) stimulus. The interplane disparitiesof the two-plane stimuli were systematically varied in separate scans.Theoff-horopter stereoacuityexperiments were similar to the stereo-acuity experiments except that the stimuli were displaced in depth(relative to fixation) by some common amount. In theupper depthexperiments, two-plane stimuli were alternated with a stimulus con-sisting of dots whose positions were uncorrelated between the left andright images. These experiments were performed on only two of thesubjects because of the large number of stimulus conditions; eachsubject repeated each of 15 experimental conditions between 4 and 12times in separate fMRI scans (Table 2). The repeated measurements ofeach stimulus condition were typically distributed across multiplescanning sessions on different days.
Psychophysical stereoacuity and upper depth limit thresholds weremeasured for comparison with the fMRI data. These psychophysicalthresholds were measured in separate sessions using a standardforced-choice protocol. In a stereoacuity trial, 3 s of the(1-plane)zero-disparity stimulus were followed by 5 s either of the samezero-disparity stimulus or a two-plane stimulus with small (60.25 to61.0 arcmin) disparity. In an upper depth limit trial, 3 s of theuncorrelated stimulus were followed by 5 s ofeither the uncorrelatedstimulus or a two-plane stimulus with large (61 to 66°) disparity.The subject made a yes-no response to indicate whether the secondinterval contained stereoscopic depth. The experience was thus similarto being in the scanner, noticing that the zero-disparity (or uncorre-lated) stimulus had or had not been replaced by a stimulus containingnonzero disparity. A discrimination index (d9) was computed from thehit and false alarm rates (Green and Swets 1966). A value ofd9 5 1corresponds approximately to 80% correct performance. Althoughthese psychophysical experiments and the fMRI measurements were
performed in separate sessions using different experimental appara-tuses, the stimuli were as similar as possible: the two LCD monitorswere calibrated to have approximately the same mean luminance anddisplay size (seeVisual stimuli), but the screen was viewed in thepsychophysical experiments with a modified Wheatstone stereoscope(optical path length 40 cm) rather than binoculars and mirrors.
Two further experiments served as controls. In theattention controlexperiment, subjects performed a demanding depth discrimination taskthroughout each scan. Each trial lasted 6 s and consisted of a pair of 2.7-sstimulus intervals, separated by a 50-ms blank interval, and followed bya 550-ms response interval. One stimulus interval contained an interplanedisparity with a base value (either67.5 or 0 arcmin), and the otherinterval contained an increment over and above the base value. Thesubject indicated which interval had greater depth by a button press.Throughout each fMRI scan, subjects performed three successive trials ofthe depth discrimination task at a base disparity of67.5 arcmin, followedby three trials of the task at a base disparity of 0 arcmin, and so on.Subjects practiced the task extensively before scanning until their thresh-olds reached asymptotic performance. Feedback was not provided tosubjects during the fMRI scans. Task difficulty was controlled by a2-down 1-up staircase procedure (i.e., the disparity increment variedslightly from trial to trial) to keep the stimuli at the subjects’ psycho-physical threshold. The stimuli in this experiment were limited to theperipheral visual field (.4°) to minimize the possibility that subjectsmight rely on differential shifts of spatial attention to perform the task atthe two different base disparities, e.g., to avoid the possibility of attendingcentrally for 0 arcmin and peripherally for67.5 arcmin. The attentioncontrol experiment was performed in one scanning session, for each oftwo subjects (BTBandDJH). During that scanning session, each subjectparticipated in1) four repeated scans of depth discrimination alternatingbetween large (67.5 to 69.0 arcmin) and small (0 to62 arcmin)interplane disparities,2) four repeated scans of essentially the samestimulus conditions, but without performing the depth discrimination taskand without the threshold changes in interplane disparity (to preventsubjects from covertly performing the task), and3) four repeated scans ofthe67.5-arcmin stimulus alternated with a blank screen.
The response saturation controlexperiment was similar to thetwo-plane/one-plane (67.5 vs. 0 arcmin interplane disparity) condi-tion of the population average experiment, except that stimulus con-trast was lower. Light gray dots were shown against a medium graybackground (15% Michelson contrast). The response saturation ex-periment was performed in one scanning session, for each of threesubjects (BTB, DJH,and ACH). During that scanning session, eachsubject participated in1) four repeats of the low-contrast,67.5arcmin (2-plane) stimulus alternated with the low-contrast, zero dis-parity (1-plane) stimulus, and2) four repeats of the low-contrast,67.5arcmin (2-plane) stimulus alternated with a blank (gray) screen.
Analysis of fMRI data
Details of the analysis methods have been described previously(Heeger et al. 1999). Data from the first 36-s cycle were discarded toavoid effects of magnetic saturation and to allow the hemodynamicsto reach steady state (noting that the full duration of the hemodynamic
TABLE 1. Pulse sequence parameters for each experiment
FieldStrength,
TeslaRepetitionTime, ms
NumberInterleaves
EchoTime, ms
Flip Angle,deg
InplaneResolution,
mm
SliceThickness,
mmNumberSlices
Population average 1.5 1,500 2 40 90 2.93 2.9 4 12Stereoacuity and
upper depth (DJH) 1.5 2,000 1 40 90 3.23 3.2 4 16Stereoacuity and
upper depth (BTB) 1.5 1,500 2 40 90 1.93 1.9 4 8Saturation control 1.5 750 2 40 90 33 3 4 12Attention control 3 750 2 30 65 2.93 2.9 4 12
TABLE 2. Number of observations (scans) for the stereoacuity andupper depth limit experiments
Baseline
DJH BTB
9 12 (4 for area MT1)
Stereoacuity (Fig. 5) 4, 4, 4, 4 6, 10, 9, 13Off-horopter (Fig. 7) 4, 3, 4, 4 9, 6, 4Upper depth (Fig. 8) 5, 4, 5, 5, 4, 5 12, 3, 5, 5, 5, 5, 6
Number of repeated measurements, in separate scans, of each stimuluscondition. In general, each scan produced a simultaneous observation in allvisual areas. Scan counts correspond from left to right with the abscissae ofdata in the indicated figures, respectively.
2056 BACKUS, FLEET, PARKER, AND HEEGER
J Neurophysiol• VOL 86 • OCTOBER 2001• www.jn.org
impulse reponse is well over 20 s). Data from each scan were analyzedseparately in each of the identifiable visual areas (seeLocalization ofvisual areas). We computed the fMRI response amplitudes and phasesby 1) correcting for any residual head movements during each scanusing custom software (Nestares and Heeger 2000);2) removing thelinear trend in the time-series to compensate for the fact that the fMRIsignal tends to drift very slowly over time (Smith et al. 1999);3)dividing each voxel’s time series by its mean intensity (to convert thedata from arbitrary intensity units to units of percent signal modula-tion, and because the mean image intensity varies substantially withdistance from the surface coil);4) averaging the resulting time seriesover the set of voxels corresponding to the stimulus representationwithin a visual area;5) calculating the amplitude and phase of the bestfitting 36-s period sinusoid (the phase is a measure of the temporaldelay of the hemodynamic response relative to the onset of thestimulus cycle and the amplitude is a measure of the level of modu-lation of cortical activity); and then6) extracting the projected am-plitude (as described in Heeger et al. 1999). Finally, we computed themean and standard error of the mean (SE) of the amplitudes acrossrepeated scans of each stimulus condition. The final mean amplituderepresents our estimate of the response of a given visual area for agiven stimulus condition.
In addition, correlation maps were computed by calculating acorrelation coefficient between the best-fitting 36-s period sinusoidand the corresponding time series, separately for each voxel (Fig. 3).The correlation is a measure of signal-to-noise (Engel et al. 1997); ittakes on a value near 1 when the signal modulation (the 36-s periodcomponent of the fMRI time series) is large relative to the noise (theother frequency components of the time series), and it takes on a valuenear 0 either when there is no signal modulation or when the signal isoverwhelmed by noise. The correlation maps thus locate regions thatresponded reliably to the periodic changes in the stimuli. Amplitudeand correlation differ in that measurement noise (both noise inherentin the MR signal and physiological noise) directly reduces correlation,but affects only the variance and not the true mean of the responseamplitude measurements.
Localization of visual areas
Following well-established methods (DeYoe et al. 1996; Engel etal. 1994, 1997; Sereno et al. 1995) the polar angle component of theretinotopic map was measured by recording fMRI responses as astimulus rotated slowly (like the second hand of a clock) in the visualfield. To visualize these retinotopy measurements, a high-resolutionMRI of each subject’s brain was computationally flattened (Teo et al.1997; Wandell et al. 2000). In each hemisphere, areas V1, V2d, V2v,V3d, V3v (also known as VP), and V3A were identified. Areaboundaries were drawn by hand on the flat maps near reversals ofpolar angle, leaving a gap of approximately 2 mm near the reversalsthat was unassigned to either area. We found neither ventral/dorsal norleft-/right-hemisphere differences in activity within a given cortical
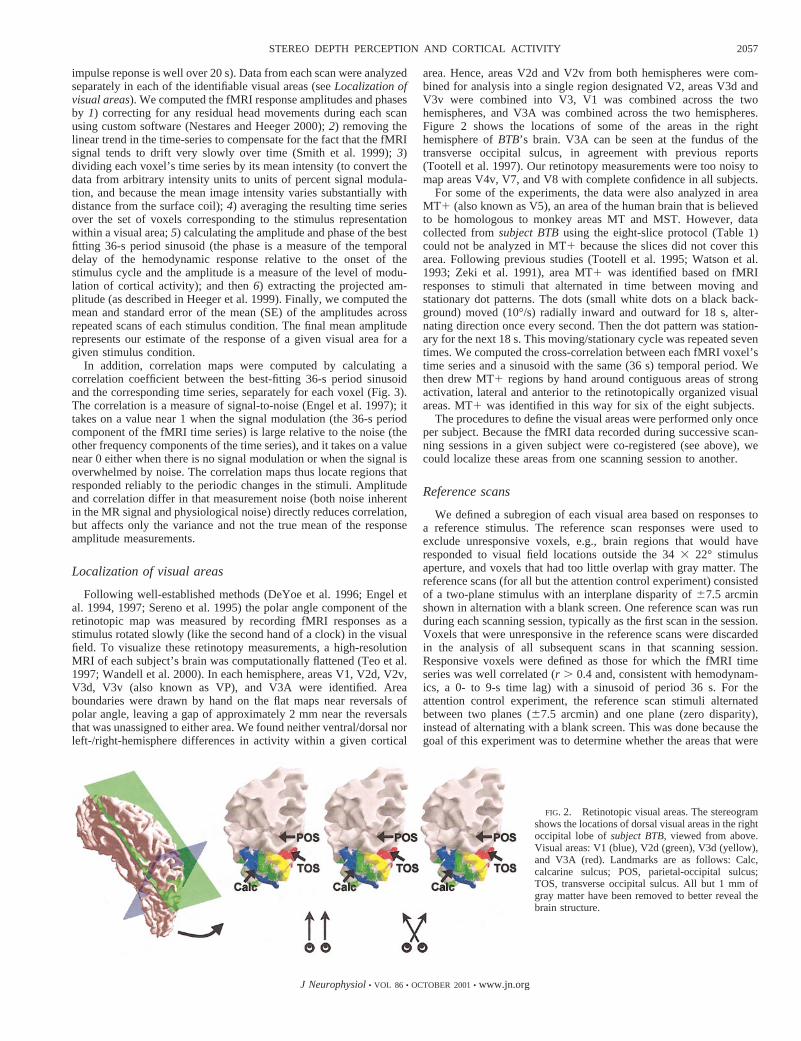
area. Hence, areas V2d and V2v from both hemispheres were com-bined for analysis into a single region designated V2, areas V3d andV3v were combined into V3, V1 was combined across the twohemispheres, and V3A was combined across the two hemispheres.Figure 2 shows the locations of some of the areas in the righthemisphere ofBTB’s brain. V3A can be seen at the fundus of thetransverse occipital sulcus, in agreement with previous reports(Tootell et al. 1997). Our retinotopy measurements were too noisy tomap areas V4v, V7, and V8 with complete confidence in all subjects.
For some of the experiments, the data were also analyzed in areaMT1 (also known as V5), an area of the human brain that is believedto be homologous to monkey areas MT and MST. However, datacollected fromsubject BTBusing the eight-slice protocol (Table 1)could not be analyzed in MT1 because the slices did not cover thisarea. Following previous studies (Tootell et al. 1995; Watson et al.1993; Zeki et al. 1991), area MT1 was identified based on fMRIresponses to stimuli that alternated in time between moving andstationary dot patterns. The dots (small white dots on a black back-ground) moved (10°/s) radially inward and outward for 18 s, alter-nating direction once every second. Then the dot pattern was station-ary for the next 18 s. This moving/stationary cycle was repeated seventimes. We computed the cross-correlation between each fMRI voxel’stime series and a sinusoid with the same (36 s) temporal period. Wethen drew MT1 regions by hand around contiguous areas of strongactivation, lateral and anterior to the retinotopically organized visualareas. MT1 was identified in this way for six of the eight subjects.
The procedures to define the visual areas were performed only onceper subject. Because the fMRI data recorded during successive scan-ning sessions in a given subject were co-registered (see above), wecould localize these areas from one scanning session to another.
Reference scans
We defined a subregion of each visual area based on responses toa reference stimulus. The reference scan responses were used toexclude unresponsive voxels, e.g., brain regions that would haveresponded to visual field locations outside the 343 22° stimulusaperture, and voxels that had too little overlap with gray matter. Thereference scans (for all but the attention control experiment) consistedof a two-plane stimulus with an interplane disparity of67.5 arcminshown in alternation with a blank screen. One reference scan was runduring each scanning session, typically as the first scan in the session.Voxels that were unresponsive in the reference scans were discardedin the analysis of all subsequent scans in that scanning session.Responsive voxels were defined as those for which the fMRI timeseries was well correlated (r . 0.4 and, consistent with hemodynam-ics, a 0- to 9-s time lag) with a sinusoid of period 36 s. For theattention control experiment, the reference scan stimuli alternatedbetween two planes (67.5 arcmin) and one plane (zero disparity),instead of alternating with a blank screen. This was done because thegoal of this experiment was to determine whether the areas that were
FIG. 2. Retinotopic visual areas. The stereogramshows the locations of dorsal visual areas in the rightoccipital lobe ofsubject BTB,viewed from above.Visual areas: V1 (blue), V2d (green), V3d (yellow),and V3A (red). Landmarks are as follows: Calc,calcarine sulcus; POS, parietal-occipital sulcus;TOS, transverse occipital sulcus. All but 1 mm ofgray matter have been removed to better reveal thebrain structure.
2057STEREO DEPTH PERCEPTION AND CORTICAL ACTIVITY
J Neurophysiol• VOL 86 • OCTOBER 2001• www.jn.org
activated during passive viewing would again be activated whensubjects performed the depth discrimination task.
Our results were not biased by subselecting voxels based on thereference scan responses. The reference scans activated large, contig-uous regions of visual cortex, corresponding to the retinotopic repre-sentations of the stimuli within each visual area (Fig. 3,B andC). Theparticular interplane disparity used in the reference scans (67.5 arc-min) was chosen because it gave stronger responses than did a singleplane, in all of the studied visual areas. The correlation threshold waschosen to exclude only gray matter voxels that corresponded retino-topically to visual field locations outside the 343 22° stimulusaperture, and the results were similar when the data were reanalyzedfor a range of different correlation thresholds fromr . 0.2 tor . 0.5.There is evidence for spatial clustering of disparity-tuned neurons inmacaque cortical visual areas V2 (Hubel and Livingstone 1987; Hubeland Wiesel 1970; Peterhans and von der Heydt 1993; Roe and Ts’o1995) and MT (DeAngelis and Newsome 1999). Organization of thistype is presumably invisible in our fMRI measurements because it
occurs on a spatial scale (;1 mm) that is much smaller than the sizeof our voxels (;3 3 3 3 4 mm).
A second use of the reference scans was to validate comparisons ofdata collected with the different scanning protocols (Table 1). Thiscomparison was performed forsubject BTBbecause we measuredreference scan responses for that subject using each of the protocols.The reference scan responses in all of the visual areas were highlyreproducible; the 68% confidence interval obtained from one protocolcontained the respective means from each of the other protocols.
Normalized responses
We normalized the responses of each visual area and each stimuluscondition by dividing by the mean responses to a baseline stimuluscondition in each visual area. The normalized responses are analogousto selectivity indices (e.g., disparity- or direction-selectivity indexes)that are commonly reported in single-unit electrophysiology studies.The normalized responses characterize how responsive a cortical area
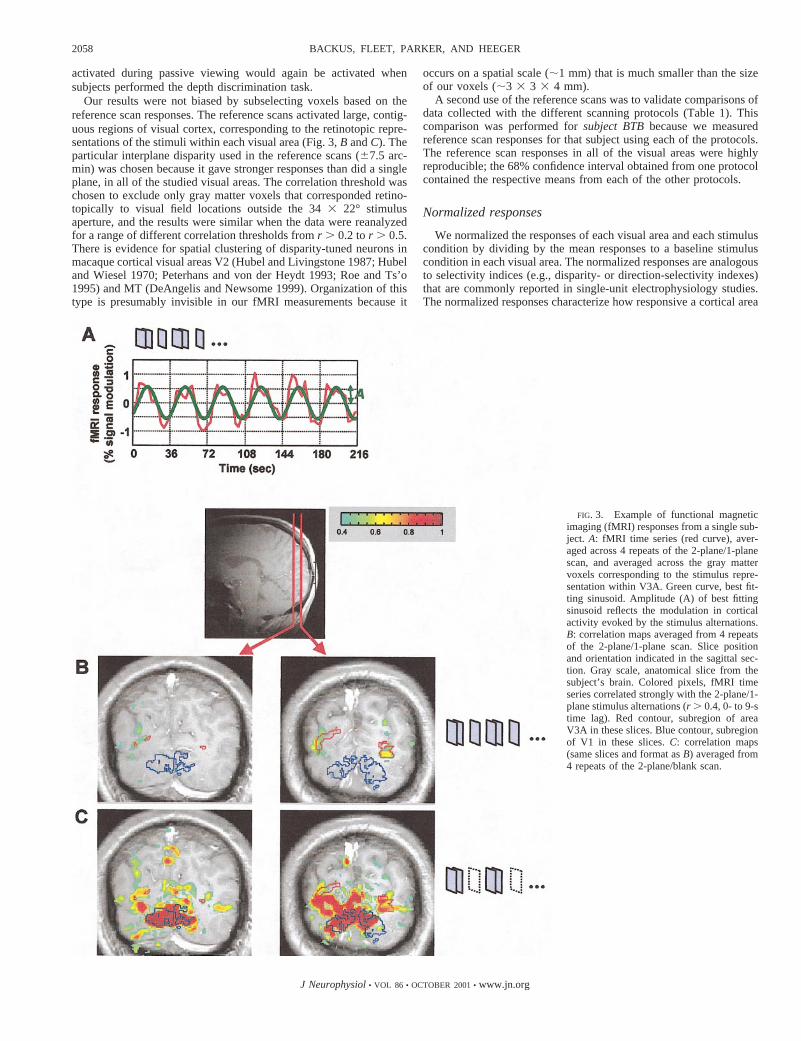
FIG. 3. Example of functional magneticimaging (fMRI) responses from a single sub-ject. A: fMRI time series (red curve), aver-aged across 4 repeats of the 2-plane/1-planescan, and averaged across the gray mattervoxels corresponding to the stimulus repre-sentation within V3A. Green curve, best fit-ting sinusoid. Amplitude (A) of best fittingsinusoid reflects the modulation in corticalactivity evoked by the stimulus alternations.B: correlation maps averaged from 4 repeatsof the 2-plane/1-plane scan. Slice positionand orientation indicated in the sagittal sec-tion. Gray scale, anatomical slice from thesubject’s brain. Colored pixels, fMRI timeseries correlated strongly with the 2-plane/1-plane stimulus alternations (r . 0.4, 0- to 9-stime lag). Red contour, subregion of areaV3A in these slices. Blue contour, subregionof V1 in these slices.C: correlation maps(same slices and format asB) averaged from4 repeats of the 2-plane/blank scan.
2058 BACKUS, FLEET, PARKER, AND HEEGER
J Neurophysiol• VOL 86 • OCTOBER 2001• www.jn.org

is to the change between two visual stimuli, relative to its response toa baseline stimulus condition. The normalized responses are thuscomplementary to the unnormalized responses, being particularlyuseful when comparing responses across subjects, cortical areas, andstimulus conditions.
The baseline responses were measured using stimulus conditionsidentical to those used for the reference scans (67.5 arcmin alternatedwith a blank screen). The baseline responses were averaged over a setof repeated scans (between 4 and 9), that excluded those scans used toselect the subregions of each visual area (seeReference scans). Thethree panels of Fig. 4 plot the unnormalized responses, the baselineresponses, and the normalized responses. Figures 5–10 plot responsesthat have also been normalized in this way. The normalized responsesare expressed in units of percent, that is the percentage of the baselineresponse evoked by each stimulus condition. For example, a normal-ized response of 50% in the stereoacuity experiment would mean thatalternating the two-plane stimulus with the one-plane stimulus evokedone-half the modulation in cortical activity as alternating the two-plane stimulus with a blank screen. Normalizing the responses in thisway simplified the interpretation of the results because it compensatedfor any differences in the hemodynamic response across individualsand/or across cortical areas within an individual. One visual areamight have been more responsive to all stimulus conditions thananother visual area for reasons unrelated to the stimulus disparity.First, the stimuli might have been more effective in driving one visualarea than another (e.g., in terms of spatial or temporal frequencycontent). Second, the vasculature, and consequently the hemodynamicresponse, might have differed between the visual areas and/or betweensubjects (Aguirre et al. 1998). Third, errors in identifying the visualareas (for example, by including different fractions of unresponsivetissue, such as white matter or cerebrospinal fluid) could have intro-duced a systematic scaling of the measured responses in one of theareas. Fourth, some areas may have been more susceptible to theinfluences of attention. To the extent that such effects were multipli-cative and of the same size for all stimulus conditions, they weremitigated by normalization.
Statistics
One-tailedt-tests were used to determine the statistical significanceof the responses by testing the null hypothesis that the mean responseamplitudes were zero, i.e., that there was no modulation of corticalactivity. Analogoust-tests were used to compare the relative re-sponses across visual areas, e.g., to show that the responses in areaV3A were larger than those in other visual areas. These statistical testswere always performed on the unnormalized responses. These weretypically more conservative tests than the comparable tests on thenormalized responses.
The error bars for the normalized responses in Figs. 4–10 werecomputed using a parametric bootstrapping procedure (Efron andTibshirani 1993). This procedure works by randomly resampling fromthe measured responses. In particular, we randomly sampled valuesfrom the normal distributions defined by the mean and SE for each testcondition and for the baseline (reference scan) condition. The numberof samples was equal to the actual number of repeated measurementsfor each condition. We then analyzed the resampled data as describedabove. These steps were repeated 1,000 times for each condition ineach visual area. Finally, 68% confidence intervals were computedfrom the resulting bootstrapped response distributions.
Error bars estimate different quantities in different Figs. In Fig. 4,bars show confidence for the population mean (based on 8 subjects, 6for area MT1). In Figs. 5–8 bars show confidence for the mean of asingle subject in a given condition. In Figs. 9 and 10 bars showconfidence for the mean of the two (and 3) particular subjects,estimated as the square root of the summed variance for subjectmeans, divided by number of subjects.
FIG. 4. Activity in early visual cortex was larger for stimuli with stereo-scopic depth than for a single flat plane.A: fMRI responses in each of severalvisual areas, averaged across 8 subjects, during scans that alternated between2 planes (67.5 arcmin disparity) and a single plane (zero disparity).B: baselineresponses to alternation between the 2-plane stimulus and a blank screen.C:normalized responses computed by dividing the responses inA by those inB.The responses were normalized separately for each subject, before averagingacross subjects, to compensate for the inter-subject differences. Error barsrepresent 1 SE across subjects (i.e., to yield a confidence interval on thepopulation mean).
2059STEREO DEPTH PERCEPTION AND CORTICAL ACTIVITY
J Neurophysiol• VOL 86 • OCTOBER 2001• www.jn.org
Eye tracking
Eye-tracking measurements were performed to determine whetherpatterns of eye movements might account for some of our results.These experiments were performed in a psychophysical laboratory,not in the MR scanner, but the stimuli were identical to those dis-played in the scanner, calibrated for the same luminance, contrast, anddisplay size. Although it would have been ideal to record eye move-ments and acquire functional data simultaneously, that was not pos-sible with the equipment we had available. We recorded eye move-ments using an infrared eye-tracking system (Ober 2, Timra, Sweden)that sampled horizontal and vertical eye positions at 100 Hz.
R E S U L T S
Population average
Activity in early visual cortex was larger for stimuli withstereoscopic depth than for a single flat plane. A representativeexample from one subject is shown in Fig. 3. Figure 3A plotsthe fMRI time series (red curve) averaged across the set of graymatter voxels corresponding to the stimulus representationwithin V3A, for scans that alternated between two planes(67.5 arcmin) and a single plane (zero disparity). Note that thesignal increased during the presentation of the two-plane stim-ulus and decreased during the presentation of the one-plane
stimulus. The thick green curve is the best-fitting sinusoid. Theamplitude of this sinusoid reflects the difference in corticalactivity evoked by the two stimuli.
Figure 3,B andC, shows examples of correlation maps (seeMETHODS) superimposed on the inplane anatomical slices fromone subject’s brain. The correlation between the fMRI timeseries and the best-fit sinusoid at each voxel is a measure of thesignal-to-noise ratio (Engel et al. 1997); it takes on a value near1 when the stimulus-driven signal modulation is large relativeto the noise in the fMRI time series, and it takes on a value near0 either when there is no signal modulation or when the signalis overwhelmed by noise. Figure 3B shows regions, includingV3A (indicated by the red contour), where the cortical activitymodulated strongly with the two-plane/one-plane stimulus al-ternations. Figure 3C shows regions, including V1 (indicatedby the blue contour), where the cortical activity modulatedstrongly for stimuli that alternated between two planes (67.5arcmin) and a blank screen.
We observed additional regions of visual cortex that alsogave large responses in the two-plane/one-plane scans (Fig.3B), including a ventral area, perhaps V4v or V8 (Hadjikhaniet al. 1998), and a dorsal area adjacent to V3A, perhaps V7(Mendola et al. 1999; Tootell et al. 1998a,b) or V3B (Smith etal. 1998). However, our retinotopy measurements were toonoisy to map these areas with complete confidence in allsubjects.
Similar results were evident across the eight subjects. Figure4A plots fMRI response amplitudes (seeMETHODS) in each ofseveral visual areas, averaged across subjects, for the two-plane/one-plane stimulus alternations. The fMRI responseswere generally small in magnitude, but they could neverthelessbe measured reliably. The mean responses were statisticallysignificant in all visual areas except for MT1 (P , 0.001,1-tailed t-tests of the unnormalized responses).
Area V3A was highly sensitive to stereoscopic depth. Theresponses were largest in V3A, smaller in V1, V2, and V3, andnot significantly different from zero in MT1. The mean re-sponse in V3A tended to be larger than that in any of the othervisual areas, although this was statistically significant only incomparison with V3 and MT1 (P , 0.01, 1-tailedt-tests onthe unnormalized responses). The high sensitivity of area V3Awas particularly evident after normalizing the responses. Fig-ure 4B plots the responses from the two-plane/blank baselinescans. The baseline responses were largest in V1 and progres-sively smaller in the later visual areas (a 2-way ANOVA on thebaseline responses showed significant effects of both subject,P , 0.01, and visual area,P , 0.0001). Figure 4C plots thenormalized responses, i.e., after dividing the responses in theFig. 4A by the respective baseline responses in Fig. 4B. Theresponses were normalized separately for each subject, beforeaveraging across subjects, to compensate for the inter-subjectdifferences in the baseline responses. V1 was distinguished bygiving large responses in the baseline condition (Fig. 4B) butsmall responses in the two planes/one plane condition (Fig.4A), so it had small normalized responses (Fig. 4C). In partic-ular, alternating the two-plane stimulus with the one-planestimulus evoked a modulation of V1 activity that was only 5%of that evoked by alternating the two-plane stimulus with ablank screen. V3A, by contrast, gave small responses in thebaseline condition (Fig. 4B) but the largest responses whenalternating between two planes and one plane (Fig. 4A), so it
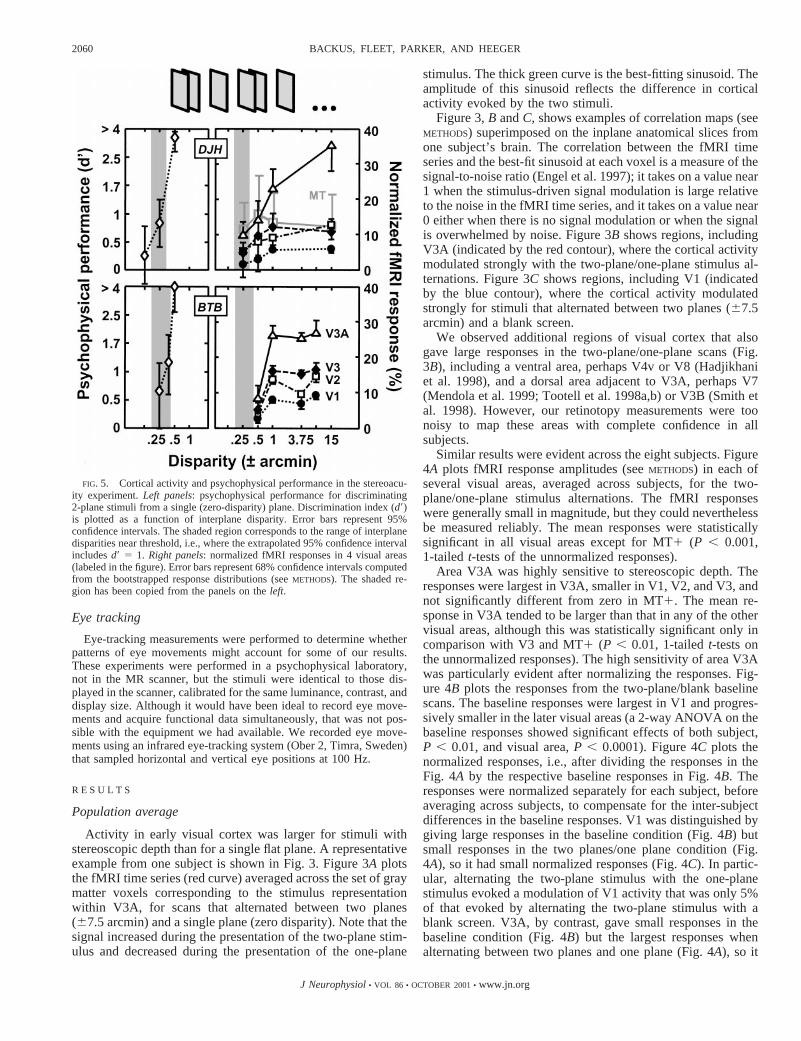
FIG. 5. Cortical activity and psychophysical performance in the stereoacu-ity experiment.Left panels: psychophysical performance for discriminating2-plane stimuli from a single (zero-disparity) plane. Discrimination index (d9)is plotted as a function of interplane disparity. Error bars represent 95%confidence intervals. The shaded region corresponds to the range of interplanedisparities near threshold, i.e., where the extrapolated 95% confidence intervalincludesd9 5 1. Right panels: normalized fMRI responses in 4 visual areas(labeled in the figure). Error bars represent 68% confidence intervals computedfrom the bootstrapped response distributions (seeMETHODS). The shaded re-gion has been copied from the panels on theleft.
2060 BACKUS, FLEET, PARKER, AND HEEGER
J Neurophysiol• VOL 86 • OCTOBER 2001• www.jn.org
had the largest (18%) normalized responses (Fig. 4C). Thehigher sensitivity of V3A to stereo disparity was evident in thenormalized responses from all of the individual subjects.
Having established that cortical activity depends on stereo-scopic depth, we proceeded to study this dependence in greaterdetail in two subjects (BTB andDJH) in the stereoacuity andupper depth limit experiments.
Stereoacuity
Psychophysical performance in the stereoacuity task is plot-ted in the pair of graphs on the left side of each panel in Fig.5. Both subjects reliably distinguished the two-plane stimulifrom the one-plane stimulus when the interplane disparitieswere greater than or equal to60.5 arcmin. Below this dispar-ity, performance dropped off; at half this disparity,d9 wasestimated to be,1, with the 95% confidence interval forpercent correct no longer including the 75 percent correct point(assuming a binomial distribution for the behavioral re-sponses). These psychophysical thresholds are consistent withreports in the literature for stimuli like ours (Stevenson et al.1989).
Cortical activity as a function of interplane disparity isplotted on theright sideof each panel in Fig. 5. The measuredactivity rose quickly as disparity increased. Forsubject BTB,the responses in all visual areas were statistically significant(P , 0.05, 1-tailedt-tests on the unnormalized responses)when the interplane disparity was60.5 arcmin or more. Forsubject DJH,the responses in all areas were significant (P ,0.05, 1-tailedt-tests on the unnormalized respones) at61arcmin or more.
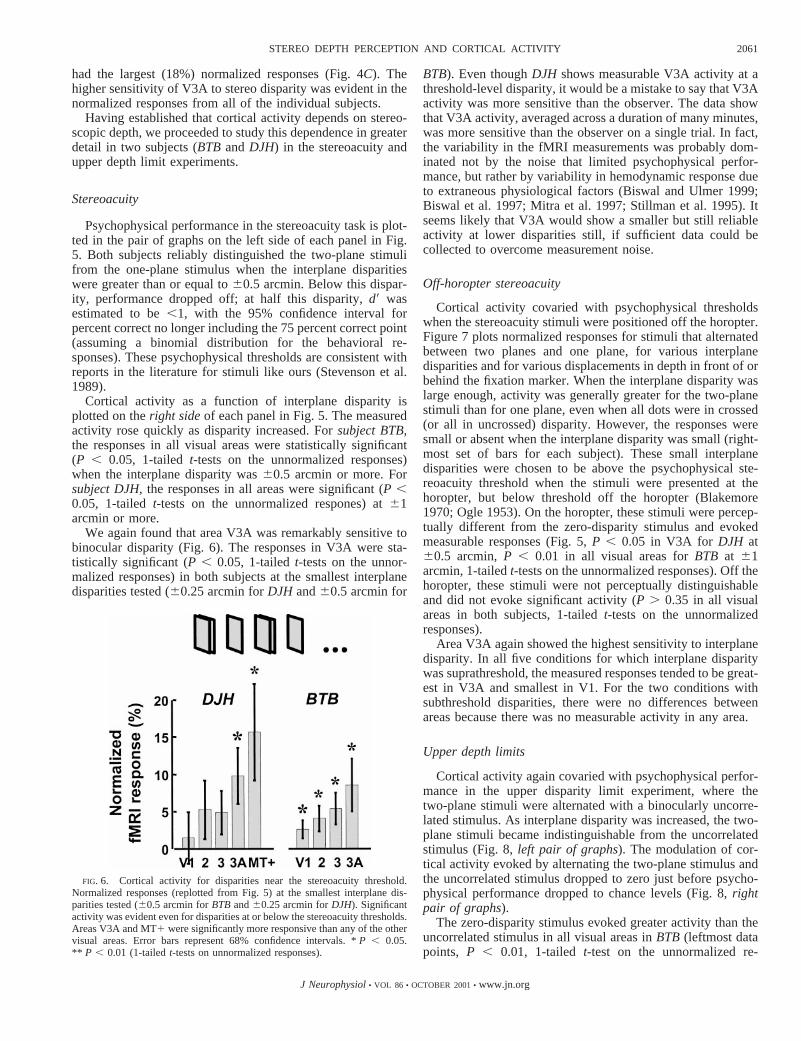
We again found that area V3A was remarkably sensitive tobinocular disparity (Fig. 6). The responses in V3A were sta-tistically significant (P , 0.05, 1-tailedt-tests on the unnor-malized responses) in both subjects at the smallest interplanedisparities tested (60.25 arcmin forDJH and60.5 arcmin for
BTB). Even thoughDJH shows measurable V3A activity at athreshold-level disparity, it would be a mistake to say that V3Aactivity was more sensitive than the observer. The data showthat V3A activity, averaged across a duration of many minutes,was more sensitive than the observer on a single trial. In fact,the variability in the fMRI measurements was probably dom-inated not by the noise that limited psychophysical perfor-mance, but rather by variability in hemodynamic response dueto extraneous physiological factors (Biswal and Ulmer 1999;Biswal et al. 1997; Mitra et al. 1997; Stillman et al. 1995). Itseems likely that V3A would show a smaller but still reliableactivity at lower disparities still, if sufficient data could becollected to overcome measurement noise.
Off-horopter stereoacuity
Cortical activity covaried with psychophysical thresholdswhen the stereoacuity stimuli were positioned off the horopter.Figure 7 plots normalized responses for stimuli that alternatedbetween two planes and one plane, for various interplanedisparities and for various displacements in depth in front of orbehind the fixation marker. When the interplane disparity waslarge enough, activity was generally greater for the two-planestimuli than for one plane, even when all dots were in crossed(or all in uncrossed) disparity. However, the responses weresmall or absent when the interplane disparity was small (right-most set of bars for each subject). These small interplanedisparities were chosen to be above the psychophysical ste-reoacuity threshold when the stimuli were presented at thehoropter, but below threshold off the horopter (Blakemore1970; Ogle 1953). On the horopter, these stimuli were percep-tually different from the zero-disparity stimulus and evokedmeasurable responses (Fig. 5,P , 0.05 in V3A for DJH at60.5 arcmin,P , 0.01 in all visual areas forBTB at 61arcmin, 1-tailedt-tests on the unnormalized responses). Off thehoropter, these stimuli were not perceptually distinguishableand did not evoke significant activity (P . 0.35 in all visualareas in both subjects, 1-tailedt-tests on the unnormalizedresponses).
Area V3A again showed the highest sensitivity to interplanedisparity. In all five conditions for which interplane disparitywas suprathreshold, the measured responses tended to be great-est in V3A and smallest in V1. For the two conditions withsubthreshold disparities, there were no differences betweenareas because there was no measurable activity in any area.
Upper depth limits
Cortical activity again covaried with psychophysical perfor-mance in the upper disparity limit experiment, where thetwo-plane stimuli were alternated with a binocularly uncorre-lated stimulus. As interplane disparity was increased, the two-plane stimuli became indistinguishable from the uncorrelatedstimulus (Fig. 8,left pair of graphs). The modulation of cor-tical activity evoked by alternating the two-plane stimulus andthe uncorrelated stimulus dropped to zero just before psycho-physical performance dropped to chance levels (Fig. 8,rightpair of graphs).
The zero-disparity stimulus evoked greater activity than theuncorrelated stimulus in all visual areas inBTB (leftmost datapoints, P , 0.01, 1-tailed t-test on the unnormalized re-
FIG. 6. Cortical activity for disparities near the stereoacuity threshold.Normalized responses (replotted from Fig. 5) at the smallest interplane dis-parities tested (60.5 arcmin forBTBand60.25 arcmin forDJH). Significantactivity was evident even for disparities at or below the stereoacuity thresholds.Areas V3A and MT1 were significantly more responsive than any of the othervisual areas. Error bars represent 68% confidence intervals. *P , 0.05.** P , 0.01 (1-tailedt-tests on unnormalized responses).
2061STEREO DEPTH PERCEPTION AND CORTICAL ACTIVITY
J Neurophysiol• VOL 86 • OCTOBER 2001• www.jn.org
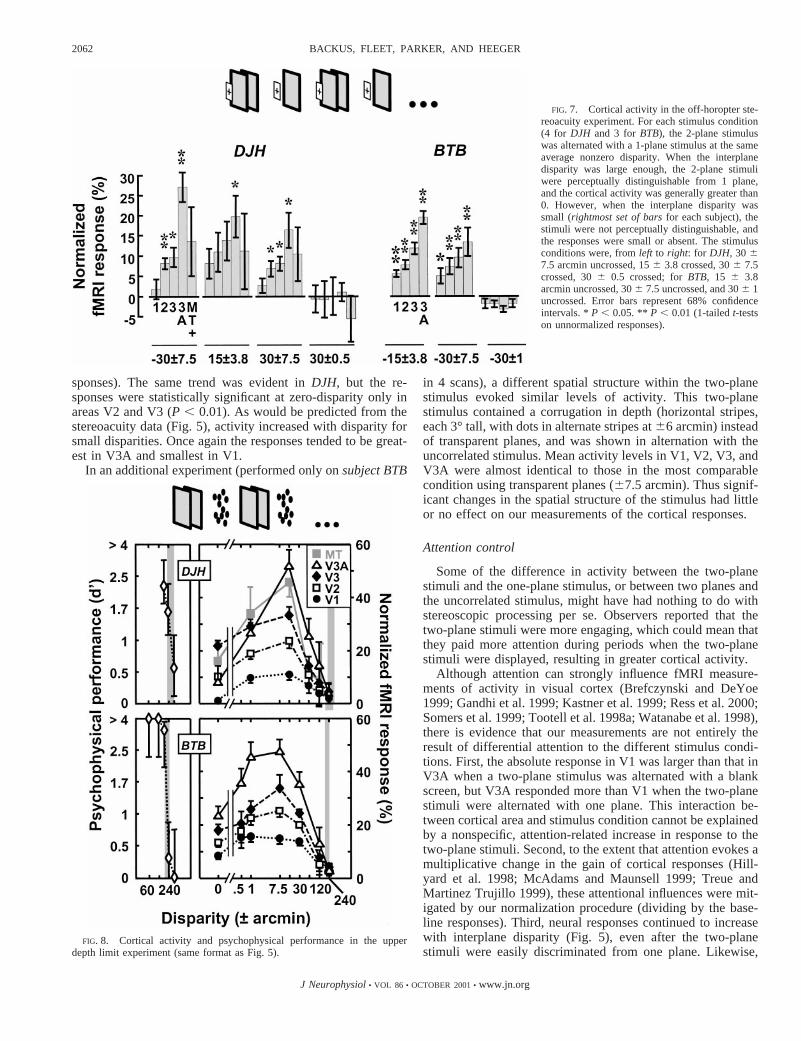
sponses). The same trend was evident inDJH, but the re-sponses were statistically significant at zero-disparity only inareas V2 and V3 (P , 0.01). As would be predicted from thestereoacuity data (Fig. 5), activity increased with disparity forsmall disparities. Once again the responses tended to be great-est in V3A and smallest in V1.
In an additional experiment (performed only onsubject BTB
in 4 scans), a different spatial structure within the two-planestimulus evoked similar levels of activity. This two-planestimulus contained a corrugation in depth (horizontal stripes,each 3° tall, with dots in alternate stripes at66 arcmin) insteadof transparent planes, and was shown in alternation with theuncorrelated stimulus. Mean activity levels in V1, V2, V3, andV3A were almost identical to those in the most comparablecondition using transparent planes (67.5 arcmin). Thus signif-icant changes in the spatial structure of the stimulus had littleor no effect on our measurements of the cortical responses.
Attention control
Some of the difference in activity between the two-planestimuli and the one-plane stimulus, or between two planes andthe uncorrelated stimulus, might have had nothing to do withstereoscopic processing per se. Observers reported that thetwo-plane stimuli were more engaging, which could mean thatthey paid more attention during periods when the two-planestimuli were displayed, resulting in greater cortical activity.
Although attention can strongly influence fMRI measure-ments of activity in visual cortex (Brefczynski and DeYoe1999; Gandhi et al. 1999; Kastner et al. 1999; Ress et al. 2000;Somers et al. 1999; Tootell et al. 1998a; Watanabe et al. 1998),there is evidence that our measurements are not entirely theresult of differential attention to the different stimulus condi-tions. First, the absolute response in V1 was larger than that inV3A when a two-plane stimulus was alternated with a blankscreen, but V3A responded more than V1 when the two-planestimuli were alternated with one plane. This interaction be-tween cortical area and stimulus condition cannot be explainedby a nonspecific, attention-related increase in response to thetwo-plane stimuli. Second, to the extent that attention evokes amultiplicative change in the gain of cortical responses (Hill-yard et al. 1998; McAdams and Maunsell 1999; Treue andMartinez Trujillo 1999), these attentional influences were mit-igated by our normalization procedure (dividing by the base-line responses). Third, neural responses continued to increasewith interplane disparity (Fig. 5), even after the two-planestimuli were easily discriminated from one plane. Likewise,
FIG. 7. Cortical activity in the off-horopter ste-reoacuity experiment. For each stimulus condition(4 for DJH and 3 forBTB), the 2-plane stimuluswas alternated with a 1-plane stimulus at the sameaverage nonzero disparity. When the interplanedisparity was large enough, the 2-plane stimuliwere perceptually distinguishable from 1 plane,and the cortical activity was generally greater than0. However, when the interplane disparity wassmall (rightmost set of barsfor each subject), thestimuli were not perceptually distinguishable, andthe responses were small or absent. The stimulusconditions were, fromleft to right: for DJH, 30 67.5 arcmin uncrossed, 156 3.8 crossed, 306 7.5crossed, 306 0.5 crossed; forBTB, 15 6 3.8arcmin uncrossed, 306 7.5 uncrossed, and 306 1uncrossed. Error bars represent 68% confidenceintervals. *P , 0.05. ** P , 0.01 (1-tailedt-testson unnormalized responses).
FIG. 8. Cortical activity and psychophysical performance in the upperdepth limit experiment (same format as Fig. 5).
2062 BACKUS, FLEET, PARKER, AND HEEGER
J Neurophysiol• VOL 86 • OCTOBER 2001• www.jn.org
responses in the upper depth limit experiment started to dropwell before the two-plane stimuli became indiscriminable fromthe uncorrelated stimulus (Fig. 8). These findings are consistentwith a previous observation that the amplitudes of evokedpotentials increased with disparity for a single random-dotplane alternating in depth (Norcia et al. 1985).
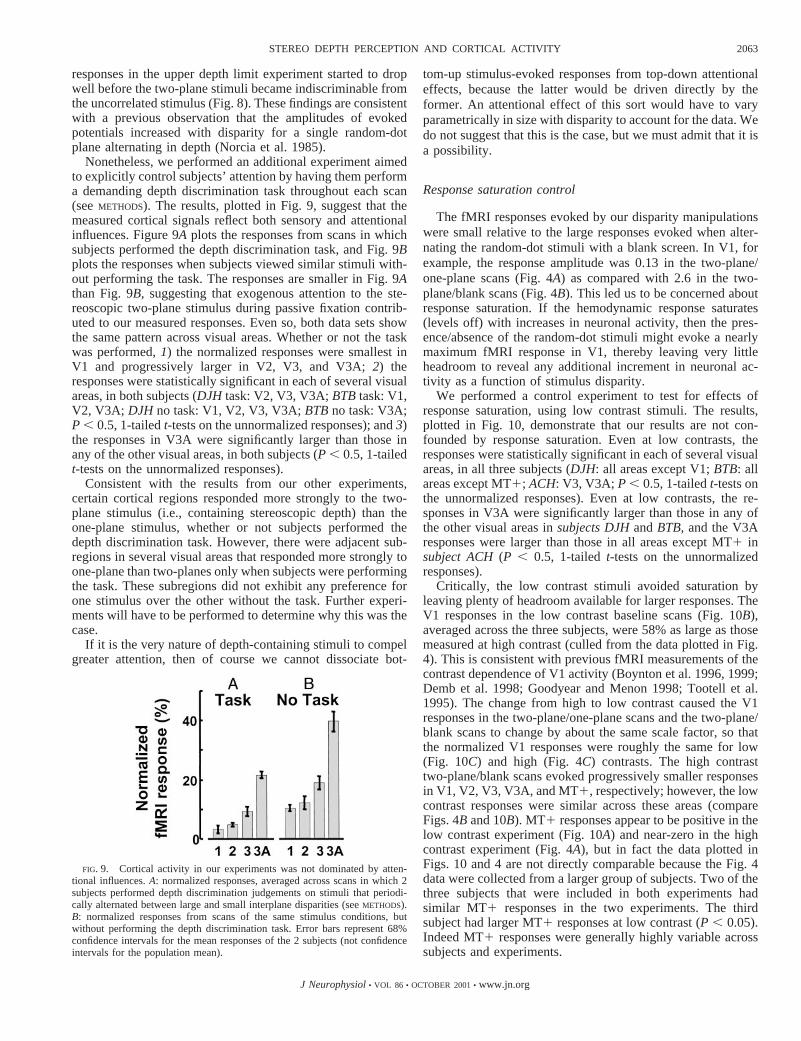
Nonetheless, we performed an additional experiment aimedto explicitly control subjects’ attention by having them performa demanding depth discrimination task throughout each scan(seeMETHODS). The results, plotted in Fig. 9, suggest that themeasured cortical signals reflect both sensory and attentionalinfluences. Figure 9A plots the responses from scans in whichsubjects performed the depth discrimination task, and Fig. 9Bplots the responses when subjects viewed similar stimuli with-out performing the task. The responses are smaller in Fig. 9Athan Fig. 9B, suggesting that exogenous attention to the ste-reoscopic two-plane stimulus during passive fixation contrib-uted to our measured responses. Even so, both data sets showthe same pattern across visual areas. Whether or not the taskwas performed,1) the normalized responses were smallest inV1 and progressively larger in V2, V3, and V3A;2) theresponses were statistically significant in each of several visualareas, in both subjects (DJH task: V2, V3, V3A;BTBtask: V1,V2, V3A; DJH no task: V1, V2, V3, V3A;BTBno task: V3A;P , 0.5, 1-tailedt-tests on the unnormalized responses); and3)the responses in V3A were significantly larger than those inany of the other visual areas, in both subjects (P , 0.5, 1-tailedt-tests on the unnormalized responses).
Consistent with the results from our other experiments,certain cortical regions responded more strongly to the two-plane stimulus (i.e., containing stereoscopic depth) than theone-plane stimulus, whether or not subjects performed thedepth discrimination task. However, there were adjacent sub-regions in several visual areas that responded more strongly toone-plane than two-planes only when subjects were performingthe task. These subregions did not exhibit any preference forone stimulus over the other without the task. Further experi-ments will have to be performed to determine why this was thecase.
If it is the very nature of depth-containing stimuli to compelgreater attention, then of course we cannot dissociate bot-
tom-up stimulus-evoked responses from top-down attentionaleffects, because the latter would be driven directly by theformer. An attentional effect of this sort would have to varyparametrically in size with disparity to account for the data. Wedo not suggest that this is the case, but we must admit that it isa possibility.
Response saturation control
The fMRI responses evoked by our disparity manipulationswere small relative to the large responses evoked when alter-nating the random-dot stimuli with a blank screen. In V1, forexample, the response amplitude was 0.13 in the two-plane/one-plane scans (Fig. 4A) as compared with 2.6 in the two-plane/blank scans (Fig. 4B). This led us to be concerned aboutresponse saturation. If the hemodynamic response saturates(levels off) with increases in neuronal activity, then the pres-ence/absence of the random-dot stimuli might evoke a nearlymaximum fMRI response in V1, thereby leaving very littleheadroom to reveal any additional increment in neuronal ac-tivity as a function of stimulus disparity.
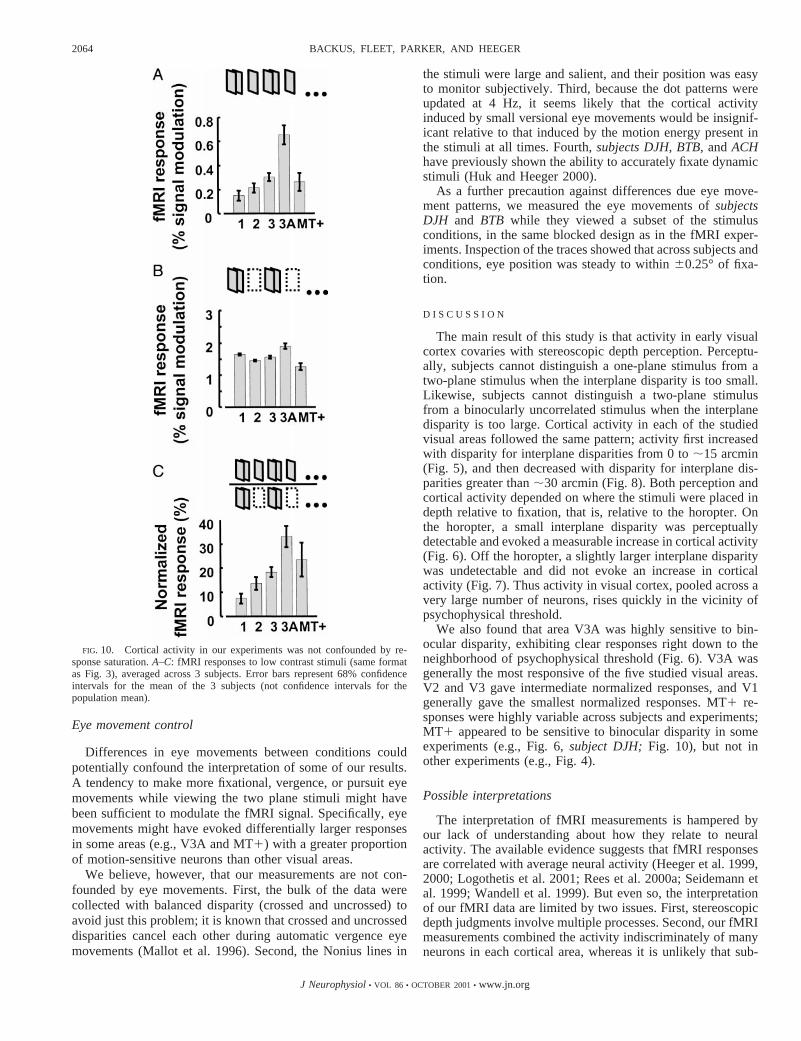
We performed a control experiment to test for effects ofresponse saturation, using low contrast stimuli. The results,plotted in Fig. 10, demonstrate that our results are not con-founded by response saturation. Even at low contrasts, theresponses were statistically significant in each of several visualareas, in all three subjects (DJH: all areas except V1;BTB: allareas except MT1; ACH: V3, V3A; P , 0.5, 1-tailedt-tests onthe unnormalized responses). Even at low contrasts, the re-sponses in V3A were significantly larger than those in any ofthe other visual areas insubjects DJHandBTB,and the V3Aresponses were larger than those in all areas except MT1 insubject ACH(P , 0.5, 1-tailedt-tests on the unnormalizedresponses).
Critically, the low contrast stimuli avoided saturation byleaving plenty of headroom available for larger responses. TheV1 responses in the low contrast baseline scans (Fig. 10B),averaged across the three subjects, were 58% as large as thosemeasured at high contrast (culled from the data plotted in Fig.4). This is consistent with previous fMRI measurements of thecontrast dependence of V1 activity (Boynton et al. 1996, 1999;Demb et al. 1998; Goodyear and Menon 1998; Tootell et al.1995). The change from high to low contrast caused the V1responses in the two-plane/one-plane scans and the two-plane/blank scans to change by about the same scale factor, so thatthe normalized V1 responses were roughly the same for low(Fig. 10C) and high (Fig. 4C) contrasts. The high contrasttwo-plane/blank scans evoked progressively smaller responsesin V1, V2, V3, V3A, and MT1, respectively; however, the lowcontrast responses were similar across these areas (compareFigs. 4B and 10B). MT1 responses appear to be positive in thelow contrast experiment (Fig. 10A) and near-zero in the highcontrast experiment (Fig. 4A), but in fact the data plotted inFigs. 10 and 4 are not directly comparable because the Fig. 4data were collected from a larger group of subjects. Two of thethree subjects that were included in both experiments hadsimilar MT1 responses in the two experiments. The thirdsubject had larger MT1 responses at low contrast (P , 0.05).Indeed MT1 responses were generally highly variable acrosssubjects and experiments.
FIG. 9. Cortical activity in our experiments was not dominated by atten-tional influences.A: normalized responses, averaged across scans in which 2subjects performed depth discrimination judgements on stimuli that periodi-cally alternated between large and small interplane disparities (seeMETHODS).B: normalized responses from scans of the same stimulus conditions, butwithout performing the depth discrimination task. Error bars represent 68%confidence intervals for the mean responses of the 2 subjects (not confidenceintervals for the population mean).
2063STEREO DEPTH PERCEPTION AND CORTICAL ACTIVITY
J Neurophysiol• VOL 86 • OCTOBER 2001• www.jn.org
Eye movement control
Differences in eye movements between conditions couldpotentially confound the interpretation of some of our results.A tendency to make more fixational, vergence, or pursuit eyemovements while viewing the two plane stimuli might havebeen sufficient to modulate the fMRI signal. Specifically, eyemovements might have evoked differentially larger responsesin some areas (e.g., V3A and MT1) with a greater proportionof motion-sensitive neurons than other visual areas.
We believe, however, that our measurements are not con-founded by eye movements. First, the bulk of the data werecollected with balanced disparity (crossed and uncrossed) toavoid just this problem; it is known that crossed and uncrosseddisparities cancel each other during automatic vergence eyemovements (Mallot et al. 1996). Second, the Nonius lines in
the stimuli were large and salient, and their position was easyto monitor subjectively. Third, because the dot patterns wereupdated at 4 Hz, it seems likely that the cortical activityinduced by small versional eye movements would be insignif-icant relative to that induced by the motion energy present inthe stimuli at all times. Fourth,subjects DJH, BTB,andACHhave previously shown the ability to accurately fixate dynamicstimuli (Huk and Heeger 2000).
As a further precaution against differences due eye move-ment patterns, we measured the eye movements ofsubjectsDJH and BTB while they viewed a subset of the stimulusconditions, in the same blocked design as in the fMRI exper-iments. Inspection of the traces showed that across subjects andconditions, eye position was steady to within60.25° of fixa-tion.
D I S C U S S I O N
The main result of this study is that activity in early visualcortex covaries with stereoscopic depth perception. Perceptu-ally, subjects cannot distinguish a one-plane stimulus from atwo-plane stimulus when the interplane disparity is too small.Likewise, subjects cannot distinguish a two-plane stimulusfrom a binocularly uncorrelated stimulus when the interplanedisparity is too large. Cortical activity in each of the studiedvisual areas followed the same pattern; activity first increasedwith disparity for interplane disparities from 0 to;15 arcmin(Fig. 5), and then decreased with disparity for interplane dis-parities greater than;30 arcmin (Fig. 8). Both perception andcortical activity depended on where the stimuli were placed indepth relative to fixation, that is, relative to the horopter. Onthe horopter, a small interplane disparity was perceptuallydetectable and evoked a measurable increase in cortical activity(Fig. 6). Off the horopter, a slightly larger interplane disparitywas undetectable and did not evoke an increase in corticalactivity (Fig. 7). Thus activity in visual cortex, pooled across avery large number of neurons, rises quickly in the vicinity ofpsychophysical threshold.
We also found that area V3A was highly sensitive to bin-ocular disparity, exhibiting clear responses right down to theneighborhood of psychophysical threshold (Fig. 6). V3A wasgenerally the most responsive of the five studied visual areas.V2 and V3 gave intermediate normalized responses, and V1generally gave the smallest normalized responses. MT1 re-sponses were highly variable across subjects and experiments;MT1 appeared to be sensitive to binocular disparity in someexperiments (e.g., Fig. 6,subject DJH;Fig. 10), but not inother experiments (e.g., Fig. 4).
Possible interpretations
The interpretation of fMRI measurements is hampered byour lack of understanding about how they relate to neuralactivity. The available evidence suggests that fMRI responsesare correlated with average neural activity (Heeger et al. 1999,2000; Logothetis et al. 2001; Rees et al. 2000a; Seidemann etal. 1999; Wandell et al. 1999). But even so, the interpretationof our fMRI data are limited by two issues. First, stereoscopicdepth judgments involve multiple processes. Second, our fMRImeasurements combined the activity indiscriminately of manyneurons in each cortical area, whereas it is unlikely that sub-
FIG. 10. Cortical activity in our experiments was not confounded by re-sponse saturation.A–C: fMRI responses to low contrast stimuli (same formatas Fig. 3), averaged across 3 subjects. Error bars represent 68% confidenceintervals for the mean of the 3 subjects (not confidence intervals for thepopulation mean).
2064 BACKUS, FLEET, PARKER, AND HEEGER
J Neurophysiol• VOL 86 • OCTOBER 2001• www.jn.org
jects monitored total neuronal activity to distinguish two-planefrom one-plane stimuli.
No fewer than six processes are active during stereoscopicvision, any of which could in principle contribute to changes inneural activity that we observed as a function of disparity.First, and most obvious, is the computation (and neural repre-sentation) of the absolute disparities of the dots in the stimulus.The relatively large responses we observed in V3A mightresult from the presence of neurons that are similar to disparity-responsive V1 neurons, but in greater numbers per unit volumeof cortex. Second is the explicit computation of relative dis-parity. The finest stereoacuity judgments are generated psycho-physically only by stimuli that contain relative disparity infor-mation (Kumar and Glaser 1992; Westheimer 1979). The two-plane stimuli in our experiments afforded the extraction ofrelative disparities. The relatively high sensitivity we observedin area V3A would be expected if neurons in this area representrelative disparity. Third is the spread of disparity informationto initiate depth filling-in. The dots in our stimuli appear to lieon surfaces, which suggests a process that “fills in” the depthfor the blank spaces between the dots. This process mightinvolve more neural processing for two surfaces than onesurface. A fourth neural process is segmentation based ondisparity (Parker and Yang 1989; Stevenson et al. 1989;Westheimer 1986). At intermediate interplane disparities(roughly 61 arcmin to61.5°) the two-plane stimulus segre-gates perceptually into two distinct surfaces at different depths.Fifth is calibration of disparity to estimate depth. For twoplanes, an additional computation is needed to determine thedepth between them, which depends on the visual system’sestimate of their distance from the observer (Howard andRogers 1995; Wallach and Zuckerman 1963). Sixth, somestimuli may, by virtue of the percept they create, compelattention-related or other top-down activity in early visualareas. Because we did not explicitly control each of theseneural processes related to stereoscopic vision, we cannotdistinguish between them as causes for the observed changes infMRI activity. Note, however, that the same interpretationalambiguities would apply in an electrophysiology experiment.
The fMRI signal effectively integrates activity within avolume of cortex containing millions of neurons. fMRI cannottherefore distinguish a high firing rate in each of a few neuronsfrom a low firing rate in many neurons. Nor can it reveal anincreased firing rate in a subpopulation of neurons when offsetby a decreased firing rate in other neurons nearby. The in-verted-U fMRI data of Fig. 8 might be predicted from adetailed description of the neural population (as we do for areaV1 in Comparison with V1 electrophysiology), but inference inthe other direction is impossible.
Despite these complications, the current results provide auseful platform for further imaging research on stereopsis, andconstrain models of the neural processing that support stereo-scopic vision in humans. For example, a straightforward im-plementation of the Lehky and Sejnowski (1990) neural modelof stereoacuity predicted greater average activity in corticalarea V1 for the one-plane stimulus than for the two-planestimulus, in disagreement with our results. We next considerthe relationship between the fMRI signal and single-unit phys-iology in the context of our data.
Comparison with V1 electrophysiology
The responses of individual macaque neurons to disparityare best characterized for area V1. Given the published litera-ture, it is plausible but not obvious that average V1 firing rateswould increase with interplane disparity above the stereoacuitythreshold, then decrease as interplane disparity approaches theupper depth limit. Prince et al. (2000) found significantchanges in the firing patterns of single V1 cortical neuronswhen single-plane random dot stimuli were altered in disparityby as little as 0.6–1.2 arcmin, corresponding well to the small-est interplane disparities of 0.5–1 (60.25 to60.5) arcmin inour two-plane stimuli. In V1 a large number of neurons aretuned for zero disparity (Poggio et al. 1988). These neuronswould fire maximally to the (single plane) zero-disparity stim-ulus, and less to (2 plane) stimuli with nonzero interplanedisparities. Other V1 neurons fire maximally to near disparitiesor far disparities. These neurons could respond best to two-plane stimuli with appropriate interplane disparities and less tothe (single plane) zero-disparity stimulus. The pooled activity,as measured with fMRI, depends on the relative sizes of thesetwo effects, i.e., the relative responsiveness and the relativenumber of neurons in V1 with different disparity tuning. ThatV1 responded more strongly to the two-plane stimulus than tothe one-plane stimulus (Figs. 4 and 5) therefore suggests thatthe mean activity of V1 neurons is a bimodal function ofabsolute retinal disparity. That the fMRI response falls off atlarge interplane disparities suggests that the local maxima are,60 arcmin apart. That small interplane disparities evokefMRI responses suggests that the central trough in the bimodalresponse function is narrow and centered at zero disparity.
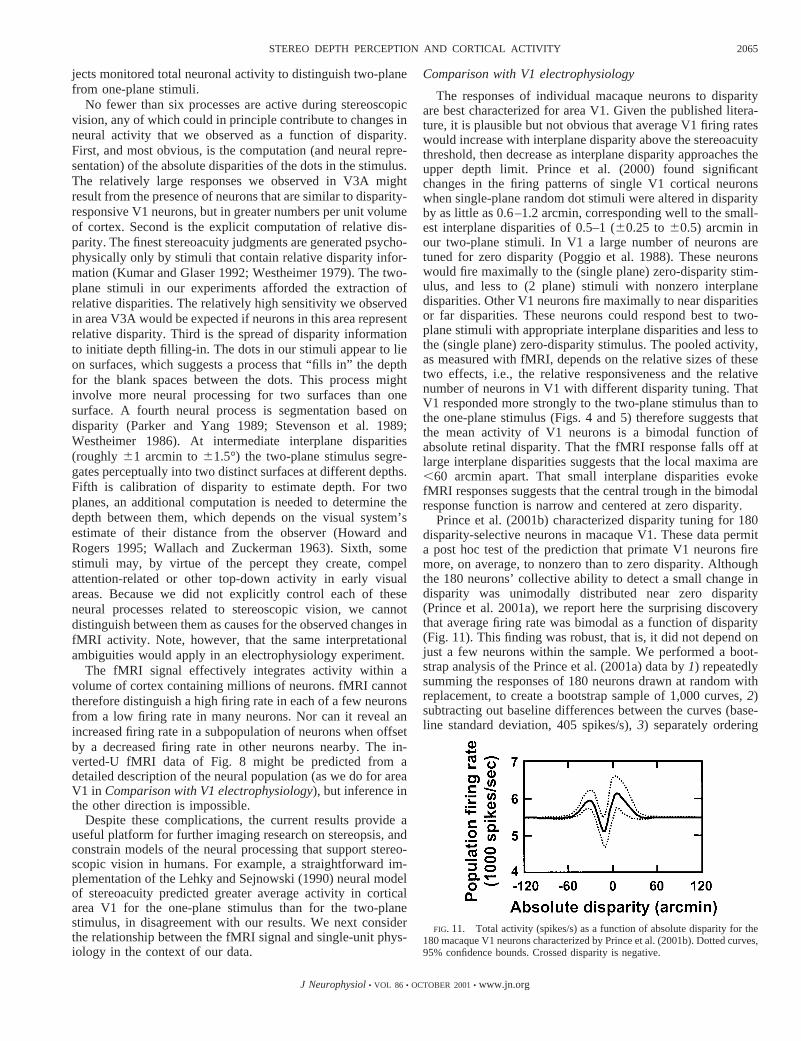
Prince et al. (2001b) characterized disparity tuning for 180disparity-selective neurons in macaque V1. These data permita post hoc test of the prediction that primate V1 neurons firemore, on average, to nonzero than to zero disparity. Althoughthe 180 neurons’ collective ability to detect a small change indisparity was unimodally distributed near zero disparity(Prince et al. 2001a), we report here the surprising discoverythat average firing rate was bimodal as a function of disparity(Fig. 11). This finding was robust, that is, it did not depend onjust a few neurons within the sample. We performed a boot-strap analysis of the Prince et al. (2001a) data by1) repeatedlysumming the responses of 180 neurons drawn at random withreplacement, to create a bootstrap sample of 1,000 curves,2)subtracting out baseline differences between the curves (base-line standard deviation, 405 spikes/s),3) separately ordering
FIG. 11. Total activity (spikes/s) as a function of absolute disparity for the180 macaque V1 neurons characterized by Prince et al. (2001b). Dotted curves,95% confidence bounds. Crossed disparity is negative.
2065STEREO DEPTH PERCEPTION AND CORTICAL ACTIVITY
J Neurophysiol• VOL 86 • OCTOBER 2001• www.jn.org
the 1,000 values from these curves at each disparity, and4)plotting the 2.5th and 97.5th percentile at each disparity (dottedcurves in Fig. 11). Of 1,000 bootstrap sample curves, only 8failed to show a central trough between 2 peaks. Figure 11 thusconfirms the prediction of bimodality and that the local max-ima are spaced,60 arcmin apart. There were a number ofdifferences between experimental protocols in the human fMRIand monkey single-unit experiments, including differences inthe stimulus parameters, but the sample of 180 neurons wasselected on the basis that they showed statistically significantchanges in firing when stimulus disparity was altered, so wesuspect that bimodality characterizes the population of V1disparity-selective neurons as a whole.
Figure 11 also shows that the prediction of a narrow troughat zero disparity was not confirmed. Instead, the trough wasrelatively broad and was centered at 10–15 arcmin crosseddisparity. Thus the response of these neurons to absolute dis-parity cannot fully explain the fMRI responses we observed inV1. One explanation for this failure is that the fMRI responseto small interplane disparities may have been due to neuronscoding central vision, where stereoacuity is highest (McKee1983; Rawlings and Shipley 1969), whereas neurons in themacaque sample coded a range of eccentricities. A secondexplanation is that some component of the fMRI response inV1 may be due to factors other than absolute disparity per se(seePossible interpretations). This view is supported by thefMRI responses we observed in V1 using off-horopter stimuli(Fig. 7, subject BTB) and the reduced response of V1 when atask was used to control attentional affects (Fig. 9).
As with disparity, it is plausible but not obvious that averageV1 firing rates would be larger for correlated stimuli than forbinocularly uncorrelated stimuli, due to binocular facilitation(Freeman and Ohzawa 1990). Complex cells in V1 act essen-tially as correlation detectors (Anzai et al. 1999; Fleet et al.1996; Ohzawa et al. 1990) and could therefore account for thegreater activity evoked by our correlated one- and two-planestimuli, as compared with our uncorrelated stimulus. On theother hand, the uncorrelated stimulus ought to impinge on thereceptive fields of more cortical neurons than do the correlatedstimuli. Thus the greater cortical activity observed for corre-lated stimuli probably reflects a decrease in the total number ofneurons activated, together with a more than compensatoryincrease in the response of those neurons. Average neuralactivity for an uncorrelated stimulus is predicted in Fig. 11 bythe asymptotes on either side of the wiggle, as these asymp-totes give the response to stimuli with very large disparities,which is expected to equal the uncorrelated response. Figure 8(rightmost data) shows that large-disparity and uncorrelatedfMRI responses were indeed the same.
Stereo pathway beyond V1
Neurophysiological studies have shown that there is a gen-erally widespread distribution of disparity-selective neuronsthroughout the striate and extrastriate cortex of nonhumanprimates (Burkhalter and Van Essen 1986; Maunsell and VanEssen 1983; Poggio 1995). Little has been done to divide theseneurons into classes that can be more specifically associatedwith identified visual areas. Nonetheless, it is known that thereis a columnar organization for disparity in macaque areas V2(Hubel and Livingstone 1987; Hubel and Wiesel 1970; Peter-
hans and von der Heydt 1993; Roe and Ts’o 1995) and MT(DeAngelis and Newsome 1999), and also that binocular fa-cilitation of neuronal responses may vary from area to areawhen tested with zero-disparity stimuli (Zeki 1978, 1979).These observations are clearly relevant to understanding theneural processing that supports stereoscopic depth perception,although they do not nearly provide an account of the process.
Poggio et al. (1988) examined the disparity selectivity ofneurons in macaque visual cortex in some detail. Two of theirfindings may be particularly relevant to the interpretation ofour own data. First, they found that the ratio of disparity-responsive to disparity-unresponsive neurons was 1:1 for V1,2:1 for V2, and 4:1 in a region that probably was V3-V3A. Thisis qualitatively consistent with differences in responses weobserved across these visual areas: we also observed signifi-cantly larger responses to stereoscopic stimuli in areas beyondV1 than in V1 itself. However, the V3-V3A neurons theyencountered had receptive fields centered more peripherallythan their V1 neurons, so while perhaps suggestive, we cannotdraw an ironclad connection between those data and ours.Second, they found that in V1 many neurons were tuned tonear-zero disparities, but that in V3-V3A almost all neuronswere tuned near or far. This finding is also consistent with ourdata, but again the difference in eccentricities in those samplesmakes it logically difficult to predict our responses from theirdata. In addition, there are known differences between visualprocessing in monkey and human V3A (Tootell et al. 1997).
Since areas V3 and V3A have been associated with stereo-scopic depth signals in earlier single-unit recording experi-ments (Poggio et al. 1988), a consistent interpretation of thespecific fMRI signal observed in V3A is that it could arise froma concentration of neurons sensitive to relative disparity; if theneurons carry signals about relative disparity, then they wouldrespond specifically to the presence of the interplane disparityin our two-plane stimulus. Further experiments in the extra-striate cortex will be necessary for testing this particular inter-pretation. Regardless of whether this speculation is correct, thepresent results add considerably to the case that V3A may berelatively specialized for stereoscopic processing.
We thank H. Baseler, R. Dougherty, A. Huk, R. Khan, C. Tyler, and A.Wade for serving as subjects; G. H. Glover (and the Richard M. Lucas Centerfor Magnetic Resonance Spectroscopy and Imaging, supported by a NationalCenter for Research Resources grant) for technical support; and S. Prince andB. Cumming for providing single unit data.
This research was supported by National Eye Institute Grant R01-EY-12741to D. J. Heeger, an Alfred P. Sloan Research Fellowship to D. J. Fleet, a grantfrom the Wellcome Trust (UK) to A. J. Parker, and National Research ServiceAward Postdoctoral Fellowship F32-EY-06899 to B. T. Backus.
REFERENCES
AGUIRREGK, ZARAHN E, AND D’ESPOSITOM. The variability of human, BOLDhemodynamic responses.Neuroimage8: 360–369, 1998.
ANZAI A, OHZAWA I, AND FREEMAN RD. Neural mechanisms for processingbinocular information. II. Complex cells.J Neurophysiol82: 909–924,1999.
BARLOW HB, BLAKEMORE C, AND PETTIGREW JD. The neural mechanism ofbinocular depth discrimination.J Physiol (Lond)193: 327–342, 1967.
BISWAL BB AND ULMER JL. Blind source separation of multiple signal sourcesof fMRI data sets using independent component analysis.J Comput AssistTomogr23: 265–271, 1999.
BISWAL BB, VAN KYLEN J,AND HYDE JS. Simultaneous assessment of flow andBOLD signals in resting-state functional connectivity maps.NMR Biomed10: 165–170, 1997.
2066 BACKUS, FLEET, PARKER, AND HEEGER
J Neurophysiol• VOL 86 • OCTOBER 2001• www.jn.org
BLAKEMORE C. The range and scope of binocular depth discrimination in man.J Physiol (Lond)211: 599–622, 1970.
BOYNTON GM, DEMB JB, GLOVER GH, AND HEEGER DJ. Neuronal basis ofcontrast discrimination.Vision Res39: 257–269, 1999.
BOYNTON GM, ENGEL SA, GLOVER GH, AND HEEGER DJ. Linear systemsanalysis of functional magnetic resonance imaging in human V1.J Neurosci16: 4207–4221, 1996.
BRADDICK OJ AND ATKINSON J. Some recent findings on the development ofhuman binocularity: a review.Behav Brain Res10: 141–150, 1983.
BREFCZYNSKI JA AND DEYOE EA. A physiological correlate of the ‘spotlight’of visual attention.Nature Neurosci2: 370–374, 1999.
BURKHALTER A AND VAN ESSEN DC. Processing of color, form and disparityinformation in visual areas VP and V2 of ventral extrastriate cortex in themacaque monkey.J Neurosci6: 2327–2351, 1986.
CUMMING BG AND PARKER AJ. Responses of primary visual cortical neurons tobinocular disparity without depth perception.Nature389: 280–283, 1997.
CUMMING BG AND PARKER AJ. Binocular neurons in V1 of awake monkeys areselective for absolute, not relative, disparity.J Neurosci19: 5602–5618,1999.
CUMMING BG AND PARKER AJ. Local disparity not perceived depth is signaledby binocular neurons in cortical area V1 of the macaque.J Neurosci20:4758–4767, 2000.
DEANGELIS GC AND NEWSOME WT. Organization of disparity-selective neu-rons in macaque area MT.J Neurosci19: 1398–1415, 1999.
DEMB JB, BOYNTON GM, AND HEEGER DJ. Functional magnetic resonanceimaging of early visual pathways in dyslexia.J Neurosci18: 6939–6951,1998.
DEYOE EA, CARMAN GJ, BANDETTINI P, GLICKMAN S, WIESER J, COX R,MILLER D, AND NEITZ J. Mapping striate and extrastriate visual areas inhuman cerebral cortex.Proc Natl Acad Sci USA93: 2382–2386, 1996.
EFRON B AND TIBSHIRANI RJ. An Introduction to the Bootstrap. New York:Chapman and Hall, 1993.
ENGEL SA, GLOVER GH, AND WANDELL BA. Retinotopic organization inhuman visual cortex and the spatial precision of functional MRI.CerebCortex7: 181–192, 1997.
ENGEL SA, RUMELHART DE, WANDELL BA, LEE AT, GLOVER GH, CHICHILNI -SKY EJ,AND SHADLEN MN. fMRI of human visual cortex.Nature369: 525,1994.
FIORENTINI A AND MAFFEI L. Electrophysiological evidence for binoculardisparity detectors in human visual system.Science169: 208–209, 1970.
FLEET DJ, WAGNER H, AND HEEGERDJ. Neural encoding of binocular dispar-ity: energy models, position shifts and phase shifts.Vision Res36: 1839–1857, 1996.
FREEMAN RD AND OHZAWA I. On the neurophysiological organization ofbinocular vision.Vision Res30: 1661–1676, 1990.
GANDHI SP, HEEGER DJ, AND BOYNTON GM. Spatial attention affects brainactivity in human primary visual cortex.Proc Natl Acad Sci USA96:3314–3319, 1999.
GLOVER GH. Simple analytic spiral K-space algorithm.Magn Reson Med42:412–415, 1999.
GLOVER GH AND LAI S. Self-navigated spiral fMRI: interleaved versus single-shot.Magn Reson Med39: 361–368, 1998.
GONZALEZ F AND PEREZR. Neural mechanisms underlying stereoscopic vision.Prog Neurobiol55: 191–224, 1998.
GOODYEAR BG AND MENON RS. Effect of luminance contrast on BOLD fMRIresponse in human primary visual areas.J Neurophysiol79: 2204–2207,1998.
GREEN DM AND SWETS JA. Signal Detection Theory and Psychophysics. NewYork: Krieger, 1966.
GULYAS B AND ROLAND PE. Binocular disparity discrimination in humancerebral cortex: functional anatomy by positron emission tomography.ProcNatl Acad Sci USA91: 1239–1243, 1994.
HADJIKHANI N, LIU AK, DALE AM, CAVANAGH P, AND TOOTELL RB. Reti-notopy and color sensitivity in human visual cortical area V8.NatureNeurosci1: 235–241, 1998.
HEEGERDJ. Normalization of cell responses in cat striate cortex.Vis Neurosci9: 181–197, 1992.
HEEGER DJ, BOYNTON GM, DEMB JB, SEIDEMANN E, AND NEWSOME WT.Motion opponency in visual cortex.J Neurosci19: 7162–7174, 1999.
HEEGERDJ, HUK AC, GEISLER WS, AND ALBRECHT DG. Spikes versus BOLD:what does neuroimaging tell us about neuronal activity?Nature Neurosci3:631–633, 2000.
HILLYARD SA, VOGEL EK, AND LUCK SJ. Sensory gain control (amplification)as a mechanism of selective attention: electrophysiological and neuroimag-ing evidence.Philos Trans R Soc Lond B Biol Sci353: 1257–1270, 1998.
HINKLE DA AND CONNER CE. Disparity tuning in macaque area V4.Neurore-port 12: 356–369, 2001.
HOWARD IP AND ROGERS BJ. Binocular Vision and Stereopsis. New York:Oxford, 1995, p. 149–602, 456–459.
HUBEL DH AND LIVINGSTONE MS. Segregation of form, color, and stereopsis inprimate area 18.J Neurosci7: 3378–3415, 1987.
HUBEL DH AND WIESEL TN. Stereoscopic vision in macaque monkey. Cellssensitive to binocular depth in area 18 of the macaque monkey cortex.Nature225: 41–42, 1970.
HUK AC AND HEEGERDJ. Task-related modulation of visual cortex.J Neuro-physiol83: 3525–3536, 2000.
KASTNER S, PINSK MA, DE WEERD P, DESIMONE R, AND UNGERLEIDER LG.Increased activity in human visual cortex during directed attention in theabsence of visual stimulation.Neuron22: 751–761, 1999.
KHAN RM, BOYNTON GM, FLEET DJ, AND HEEGERDJ. Neural basis of stereodepth perception measured with fMRI.Invest Ophthalmol Vis Sci AbstrBook38: S625, 1997.
KUMAR T AND GLASER DA. Depth discrimination of a line is improved byadding other nearby lines.Vision Res32: 1667–1676, 1992.
LEHKY SR AND SEJNOWSKI TJ. Neural model of stereoacuity and depth inter-polation based on a distributed representation of stereo disparity.J Neurosci10: 2281–2299, 1990.
LOGOTHETIS NK, PAULS J, AUGATH M, TRINATH T, AND OELTERMANN A.Neurophysiological investigation of the basis of the fMRI signal.Nature412: 150–157, 2001.
MALLOT HA, ROLL A, AND ARNDT PA. Disparity-evoked vergence is driven byinterocular correlation.Vision Res36: 2925–2937, 1996.
MAUNSELL JH AND VAN ESSENDC. Functional properties of neurons in middletemporal visual area of the macaque monkey. II. Binocular interactions andsensitivity to binocular disparity.J Neurophysiol49: 1148–1167, 1983.
MCADAMS CJ AND MAUNSELL JHR. Effects of attention on orientation-tuningfunctions of single neurons in macaque cortical area V4.J Neurosci19:431–441, 1999.
MCKEE SP. The spatial requirements for fine stereoacuity.Vision Res23:191–198, 1983.
MENDOLA JD, DALE AM, FISCHL B, LIU AK, AND TOOTELL RB. The represen-tation of illusory and real contours in human cortical visual areas revealedby functional magnetic resonance imaging.J Neurosci19: 8560–8572,1999.
MITRA PP, OGAWA S, HU X, AND UGURBIL K. The nature of spatiotemporalchanges in cerebral hemodynamics as manifested in functional magneticresonance imaging.Magn Reson Med37: 511–518, 1997.
NAKADOMARI S, KITAHARA K, KAMADA Y, YOSHIDA K, SAITO M, AND MIYAU -CHI S. The cuneus plays an important role in stereoscopic vision: a neuro-psychological and fMRI study.Invest Ophthalmol Vis Sci Abstr Book40:S819, 1999.
NESTARESO AND HEEGERDJ. Robust multiresolution alignment of MRI brainvolumes.Magn Reson Med43: 705–715, 2000.
NIKARA T, BISHOPPO,AND PETTIGREW JD. Analysis of retinal correspondenceby studying receptive fields of binocular single units in cat striate cortex.Exp Brain Res6: 353–372, 1968.
NOLL DC, COHEN JD, MEYER CH, AND SCHNEIDER W. Spiral K-space MRimaging of cortical activation.J Magn Reson Imaging5: 49–56, 1995.
NORCIA AM, SUTTER EE, AND TYLER CW. Electrophysiological evidence forthe existence of coarse and fine disparity mechanisms in human.Vision Res25: 1603–1611, 1985.
NORCIA AM AND TYLER CW. Temporal frequency limits for stereoscopicapparent motion processes.Vision Res24: 395–401, 1984.
OGLE KN. Precision and validity of stereoscopic depth perception from doubleimages.J Opt Soc Am43: 906–913, 1953.
OHZAWA I, DEANGELIS GC, AND FREEMAN RD. Stereoscopic depth discrimi-nation in the visual cortex: neurons ideally suited as disparity detectors.Science249: 1037–1041, 1990.
OHZAWA I, SCLAR G, AND FREEMAN RD. Contrast gain control in the cat’svisual system.J Neurophysiol54: 651–667, 1985.
PARKER AJ, CUMMING BG, AND DODD JV. Binocular neurons and the percep-tion of depth. In:The New Cognitive Neurosciences,edited by Blakemore Cand Movshon JA. Cambridge, MA: MIT Press, 2000.
PARKER AJ AND YANG Y. Spatial properties of disparity pooling in humanstereo vision.Vision Res29: 1525–1538, 1989.
2067STEREO DEPTH PERCEPTION AND CORTICAL ACTIVITY
J Neurophysiol• VOL 86 • OCTOBER 2001• www.jn.org
PETERHANSE AND VON DER HEYDT R. Functional organization of area V2 in thealert macaque.Eur J Neurosci5: 509–524, 1993.
PETTIGREW JD, NIKARA T, AND BISHOP PO. Binocular interaction on singleunits in cat striate cortex: simultaneous stimulation by single moving slitwith receptive fields in correspondence.Exp Brain Res6: 391–410, 1968.
POGGIO GF. Mechanisms of stereopsis in monkey visual cortex.Cereb Cortex5: 193–204, 1995.
POGGIOGF, GONZALEZ F, AND KRAUSEF. Stereoscopic mechanisms in monkeyvisual cortex: binocular correlation and disparity selectivity.J Neurosci8:4531–4550, 1988.
PRINCE SJ, CUMMING BG, AND PARKER AJ. Range and mechanism of encodingof horizontal disparity in macaque V1.J Neurophysiol. In press, 2001a.
PRINCE SJ, POINTON AD, CUMMING BG, AND PARKER AJ. The precision ofsingle neuron responses in cortical area V1 during stereoscopic depthjudgments.J Neurosci20: 3387–3400, 2000.
PRINCE SJ, POINTON AD, CUMMING BG, AND PARKER AJ. Quantitative analysisof the responses of V1 neurons to horizontal disparity in dynamic randomdot stereograms.J Neurophysiol. In press, 2001b.
PTITO A, ZATORRE RJ, PETRIDES M, FREY S, ALIVISATOS B, AND EVANS AC.Localization and lateralization of stereoscopic processing in the humanbrain.Neuroreport4: 1155–1158, 1993.
RAWLINGS SC AND SHIPLEY T. Stereoscopic acuity and horizontal angulardistance from fixation.J Opt Soc Am59: 991–993, 1969.
REES G, FRISTON K, AND KOCH C. A direct quantitative relationship betweenthe functional properties of human and macaque V5.Nature Neurosci3:716–723, 2000a.
REES G, FRISTON K, AND KOCH C. A direct quantitative relationship betweenthe functional properties of human and macaque V5.Nature Neurosci3:716–723, 2000b.
RESS D, BACKUS BT, AND HEEGER DJ. Activity in primary visual cortexpredicts performance in a visual detection task.Nature Neurosci3: 940–945, 2000.
ROE AW AND TS’O DY. Visual topography in primate V2: multiple represen-tation across functional stripes.J Neurosci15: 3689–3715, 1995.
RUTSCHMANN R AND GREENLEE M. Human cortical areas responding to dis-parity: an fMRI study.Perception28 (Abstract Suppl.): 134, 1999.
SAWYER-GLOVER A AND GLOVER G. fMRI of the motor cortex: comparison ofEPI and spiral pulse sequences.Proc SMRT Seventh Annu Meet, Sydney,Australia,1998, p. 69.
SEIDEMANN E, POIRSON AB, WANDELL BA, AND NEWSOME WT. Color signalsin area MT of the macaque monkey.Neuron24: 911–917, 1999.
SERENO MI, DALE AM, REPPASJB, KWONG KK, BELLIVEAU JW, BRADY TJ,ROSEN BR, AND TOOTELL RB. Borders of multiple visual areas in humansrevealed by functional magnetic resonance imaging.Science268: 889–893,1995.
SHEEDY JE. Actual measurement of fixation disparity and its use in diagnosisand treatment.J Am Opt Assoc51: 1079–1084, 1980.
SMITH AM, L EWIS BK, RUTTIMANN UE, YE FQ, SINNWELL TM, YANG Y, DUYN
JH, AND FRANK JA. Investigation of low frequency drift in fMRI signal.Neuroimage9: 526–533, 1999.
SMITH AT, GREENLEE MW, SINGH KD, KRAEMER FM, AND HENNIG J. Theprocessing of first- and second-order motion in human visual cortex assessedby functional magnetic resonance imaging (fMRI).J Neurosci18: 3816–3830, 1998.
SOMERS DC, DALE AM, SEIFFERT AE, AND TOOTELL RB. Functional MRIreveals spatially specific attentional modulation in human primary visualcortex.Proc Natl Acad Sci USA96: 1663–1668, 1999.
STEVENSON SB, CORMACK LK, AND SCHOR CM. Hyperacuity, superresolutionand gap resolution in human stereopsis.Vision Res29: 1597–1605, 1989.
STILLMAN AE, HU X, AND JEROSCH-HEROLD M. Functional MRI of brain duringbreath holding at 4 T.Magn Reson Imaging13: 893–897, 1995.
TEO PC, SAPIRO G, AND WANDELL BA. Creating connected representations ofcortical gray matter for functional MRI visualization.IEEE Trans MedImaging16: 852–863, 1997.
TOOTELL RB, HADJIKHANI N, HALL EK, MARRETT S, VANDUFFEL W, VAUGHAN
JT, AND DALE AM. The retinotopy of visual spatial attention.Neuron21:1409–1422, 1998a.
TOOTELL RB, HADJIKHANI N, MENDOLA JD, MARRETT S, AND DALE AM. Fromretinotopy to recognition: fMRI in human visual cortex.Trends Cogn Sci2:174–183, 1998b.
TOOTELL RB, MENDOLA JD, HADJIKHANI NK, LEDDEN PJ, LIU AK, REPPASJB,SERENOMI, AND DALE AM. Functional analysis of V3A and related areas inhuman visual cortex.J Neurosci17: 7060–7078, 1997.
TOOTELL RB, REPPAS JB, KWONG KK, M ALACH R, BORN RT, BRADY TJ,ROSEN BR, AND BELLIVEAU JW. Functional analysis of human MT andrelated visual cortical areas using magnetic resonance imaging.J Neurosci15: 3215–3230, 1995.
TREUE S AND MARTINEZ TRUJILLO JC. Feature-based attention influences mo-tion processing gain in macaque visual cortex.Nature399: 575–579, 1999.
WALLACH H AND ZUCKERMAN C. The constancy of stereoscopic depth.Am JPsychol76: 404–412, 1963.
WANDELL BA, CHIAL S, AND BACKUS BT. Visualization and measurement ofthe cortical surface.J Cogn Neurosci12: 739–752, 2000.
WANDELL BA, POIRSONAB, NEWSOMEWT, BASELERHA, BOYNTON GM, HUK
A, GANDHI S, AND SHARPE LT. Color signals in human motion-selectivecortex.Neuron24: 901–909, 1999.
WATANABE T, SASAKI Y, MITAUCHI S, PUTZ B, FULIMAKI N, NIELSEN M,TAKINO R, AND MIYAKAWA S. Attention-regulated activity in human primaryvisual cortex.J Neurophysiol79: 2218–2221, 1998.
WATSON JD, MYERS R, FRACKOWIAK RS, HAJNAL JV, WOODSRP, MAZZIOTTA
JC, SHIPP S, AND ZEKI S. Area V5 of the human brain: evidence from acombined study using positron emission tomography and magnetic reso-nance imaging.Cereb Cortex3: 79–94, 1993.
WESTHEIMERG. Cooperative neural processes involved in stereoscopic acuity.Exp Brain Res36: 585–597, 1979.
WESTHEIMERG. Spatial interaction in the domain of disparity signals in humanstereoscopic vision.J Physiol (Lond)370: 619–629, 1986.
WHEATSTONE C. Contributions to the physiology of vision: part the first. Onsome remarkable, and hitherto unobserved, phenomena of binocular vision.Philos Trans R Soc Lond128: 371–394, 1838.
ZEKI SM. Uniformity and diversity of structure and function in rhesus monkeyprestriate visual cortex.J Physiol (Lond)277: 273–290, 1978.
ZEKI SM. Functional specialization and binocular interaction in the visual areasof rhesus monkey prestriate cortex.Proc R Soc Lond B Biol Sci204:379–397, 1979.
ZEKI SM, WATSON JD, LUECK CJ, FRISTON KJ, KENNARD C, AND FRACKOWIAK
RS. A direct demonstration of functional specialization in human visualcortex.J Neurosci11: 641–649, 1991.
2068 BACKUS, FLEET, PARKER, AND HEEGER
J Neurophysiol• VOL 86 • OCTOBER 2001• www.jn.org