Nutrient Concentrations in Wastewater Treatment Plant ... · Nutrient Concentrations in Wastewater...
34
Nutrient Concentrations in Wastewater Treatment Plant Effluents in Alabama AWPCA CONFERENCE HUNTSVILLE, ALABAMA AUGUST 4, 2015
Transcript of Nutrient Concentrations in Wastewater Treatment Plant ... · Nutrient Concentrations in Wastewater...

Nutrient Concentrations in Wastewater Treatment Plant
Effluents in AlabamaAWPCA CONFERENCE
HUNTSVILLE, ALABAMAAUGUST 4, 2015

Presentation Outline• Explanatory Background
• Compelling Data and Necessary Assumptions
• Riveting Data Analyses
• Intriguing Case Studies
• Shocking Conclusion
Welcome to the TK Inn!

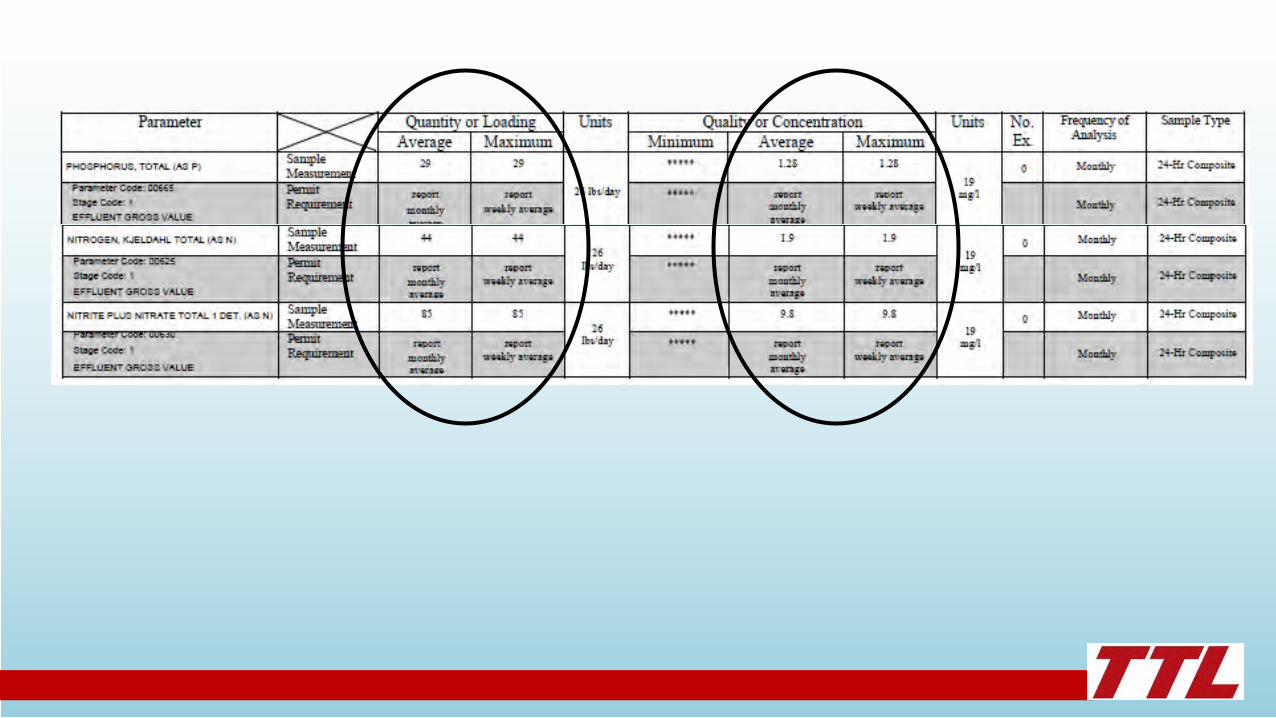

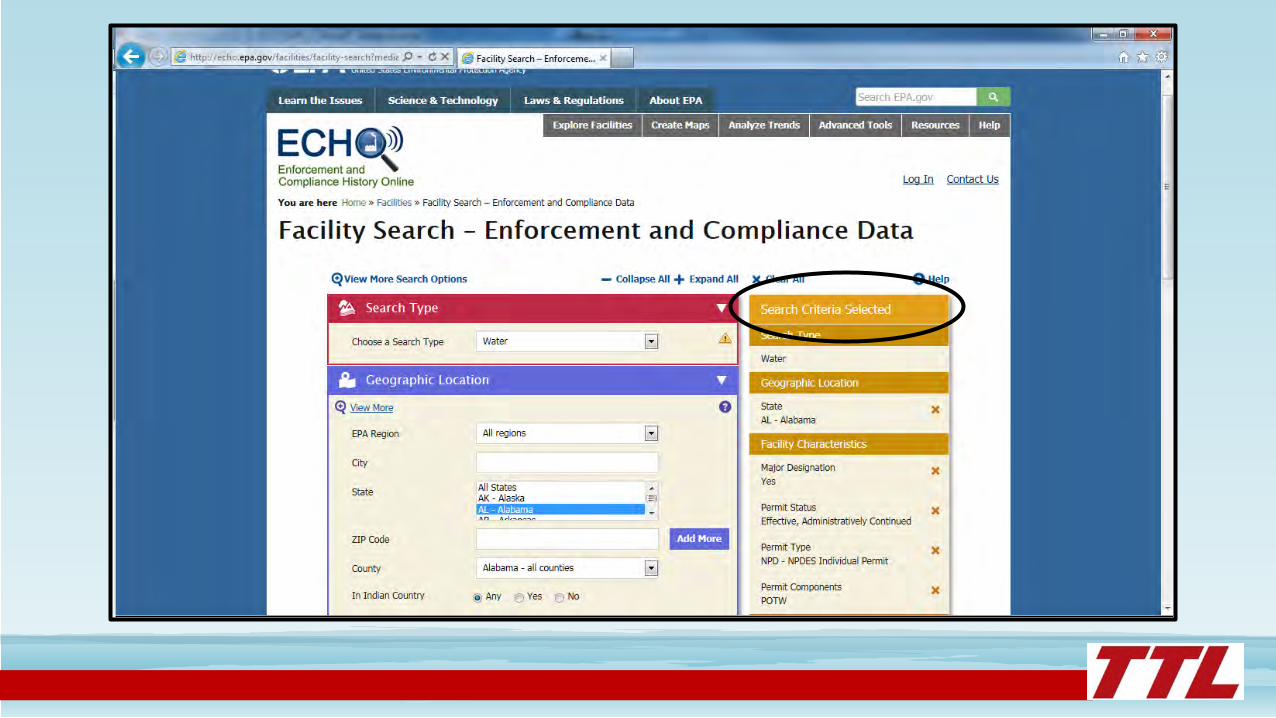
ECHO Facilities Search Criteria
Search Returns Data for 114 Facilities
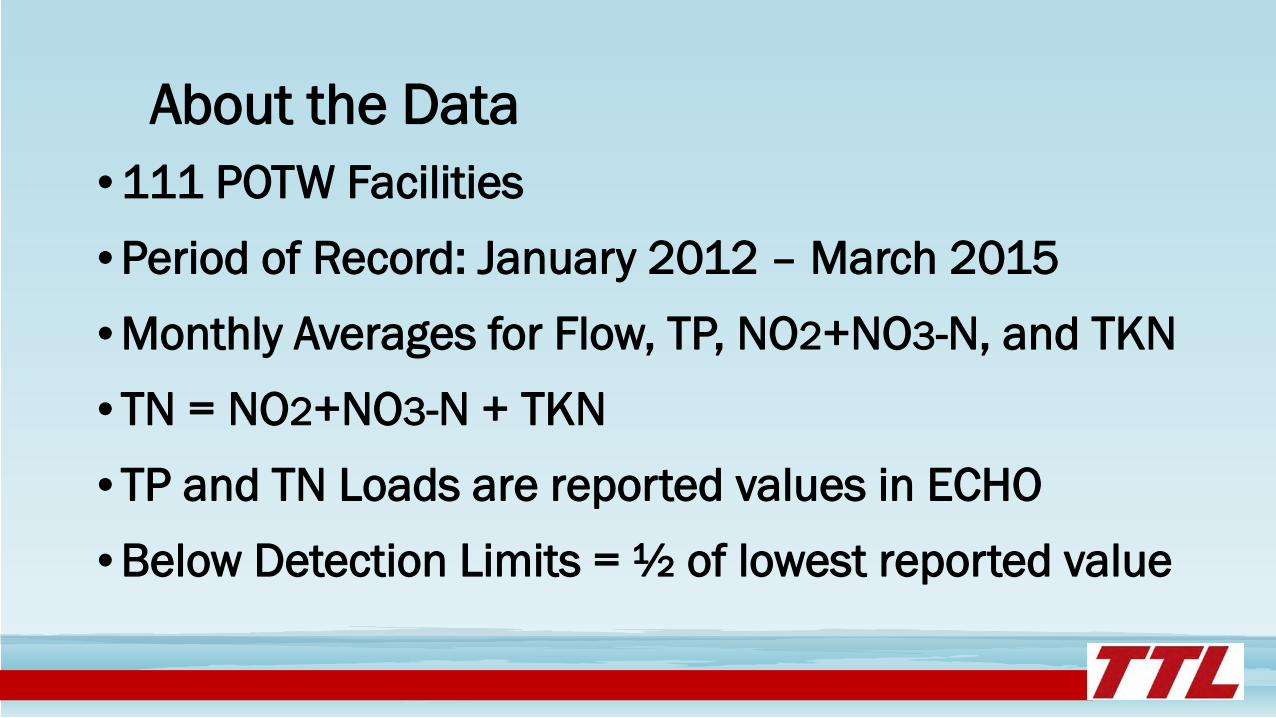
About the Data• 111 POTW Facilities• Period of Record: January 2012 – March 2015• Monthly Averages for Flow, TP, NO2+NO3-N, and TKN• TN = NO2+NO3-N + TKN• TP and TN Loads are reported values in ECHO• Below Detection Limits = ½ of lowest reported value

About the Facilities• Average Monthly Average Flow = 3.96 MGD• Monthly Average Flow Range: 0.08 – 47.51 MGD• Median Average Monthly Flow = 1.72 MGD• 10 Stabilization Lagoons• 3 Hydrograph Controlled Release Systems

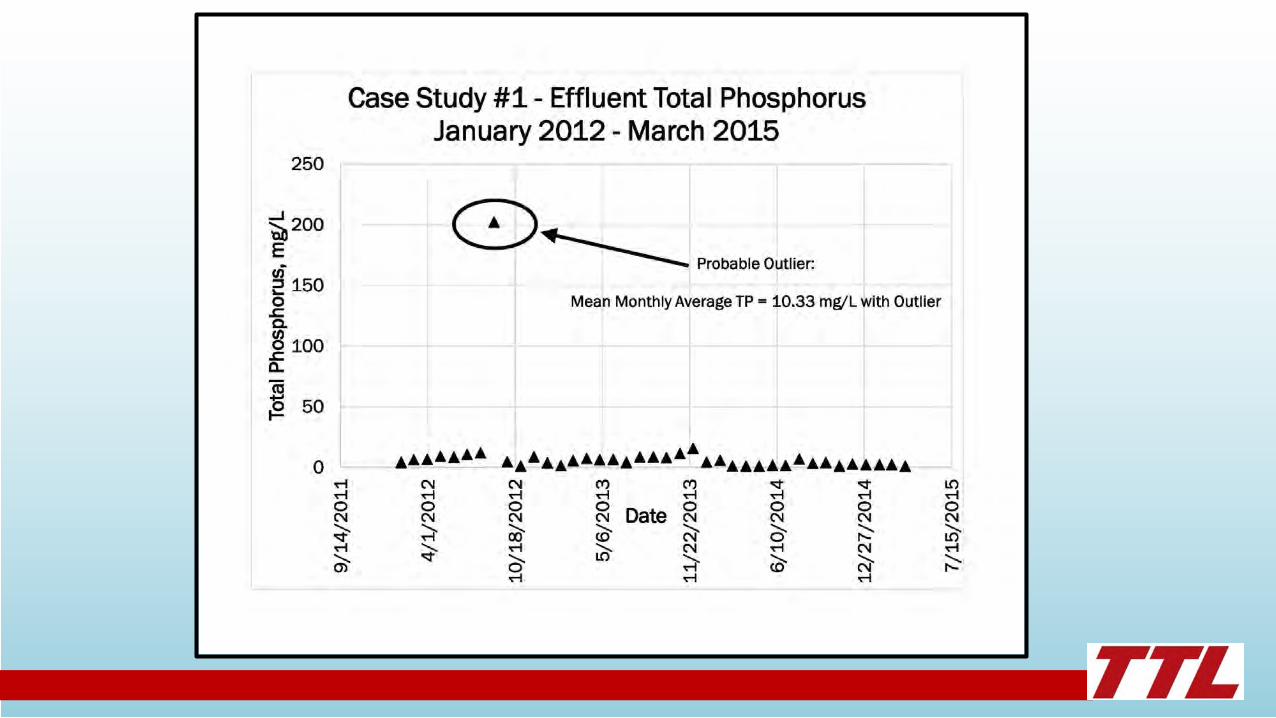
Total Phosphorus - TP• Effluent Concentration Range: 0.04 – 10.33 mg/L• Average Monthly Average Concentration: 2.07 mg/L• Monthly Average Loading Range: 0.31 – 526.78 lbs/day• Median Monthly Average Concentration: 1.76 mg/L• 10th Percentile Monthly Average Concentration: 0.57 mg/L• 90th Percentile Monthly Average Concentration: 3.76 mg/L


Total Phosphorus – A Different Perspective• TP in Pounds per Million Gallons of Effluent• Direct “Apples to Apples” Comparison• Indicator of phosphorus availability• Lbs/MG Range: 0.36 – 68.57 • Monthly Average Lbs/MG: 16.57 • Median Monthly Average Lbs/MG: 13.96

Phosphorus Recovery Potential• Global demand for phosphorus is increasing while available supply is declining
• Phosphorus in wastewater is an untapped resource
• “Mass Balance Model for Sustainable Phosphorus Recovery in a US Wastewater Treatment Plant”, Venkatesan, Hamdan, Chavez, Brown, Halden – Arizona State Univ.

TP in Mechanical and Non-mechanical Treatment Systems
• Of the 111 facilities, 10 were “non-mechanical” stabilization lagoons
StabilizationLagoons
Mechanical Treatment
Average TP Conc., mg/L 1.91 2.09
Average TP,Lbs/MG 15.09 16.75

WWTP Effluent vs. Natural Streams - TPSource Average TP, mg/L
Major WWTP 2.074Hatchet Creek (Coosa County) 0.024Terrapin Creek (Calhoun County) 0.031Sipsey Fork (Winston County) 0.021Paint Rock River (Jackson County) 0.026Cahaba River (Bibb County) 0.053

“Ha ha ha, Biff. Guess what? After we go to the drugstore and the post office, I’m going to the vet’s to get tutored.”

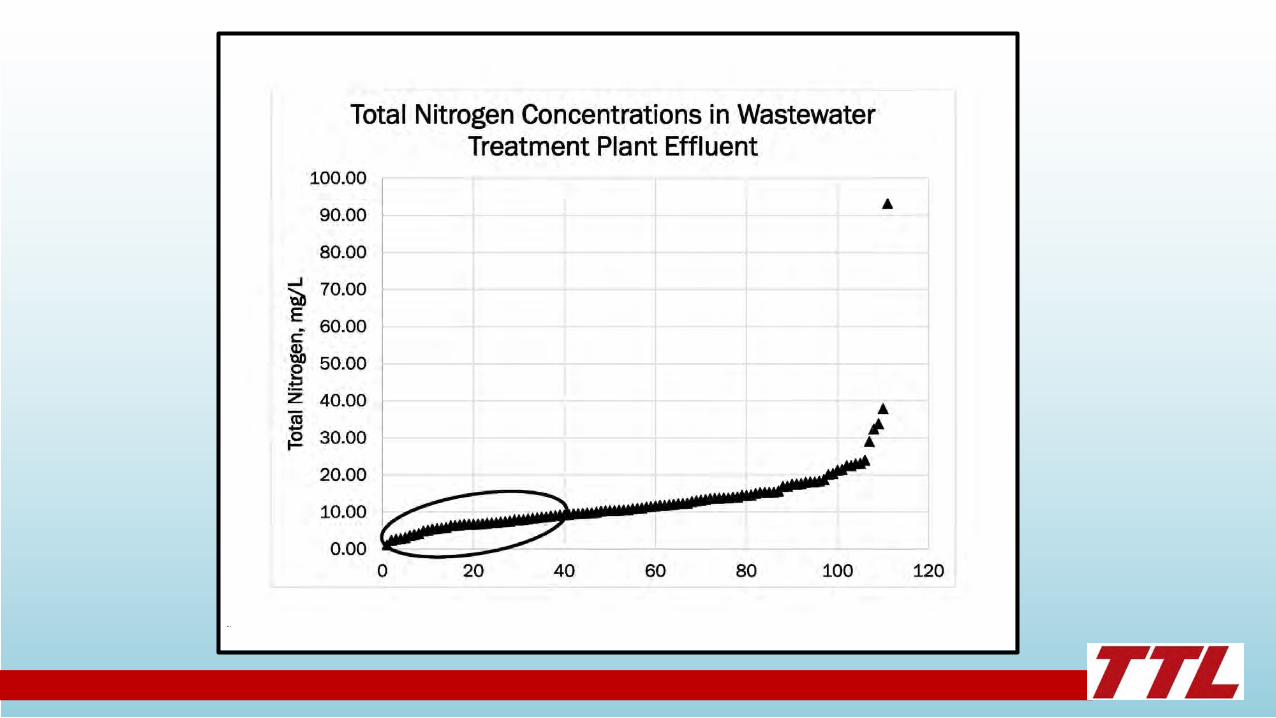
Total Nitrogen• Effluent Concentration Range: 1.12 – 93.14 mg/L• Average Monthly Average Concentration: 12.91 mg/L• Monthly Average Loading Range: 15.04 – 4635 lbs/day• Median Monthly Average Concentration: 10.99 mg/L• 10th Percentile Monthly Average Concentration: 5.52 mg/L• 90th Percentile Monthly Average Concentration: 21.24 mg/L


TN in Mechanical and Non-mechanical Treatment Systems
• Of the 111 facilities, 10 were “non-mechanical” stabilization lagoons
StabilizationLagoons
Mechanical Treatment
Average TN Conc., mg/L 11.70 13.06
Average TN,Lbs/MG 96.78 111.42
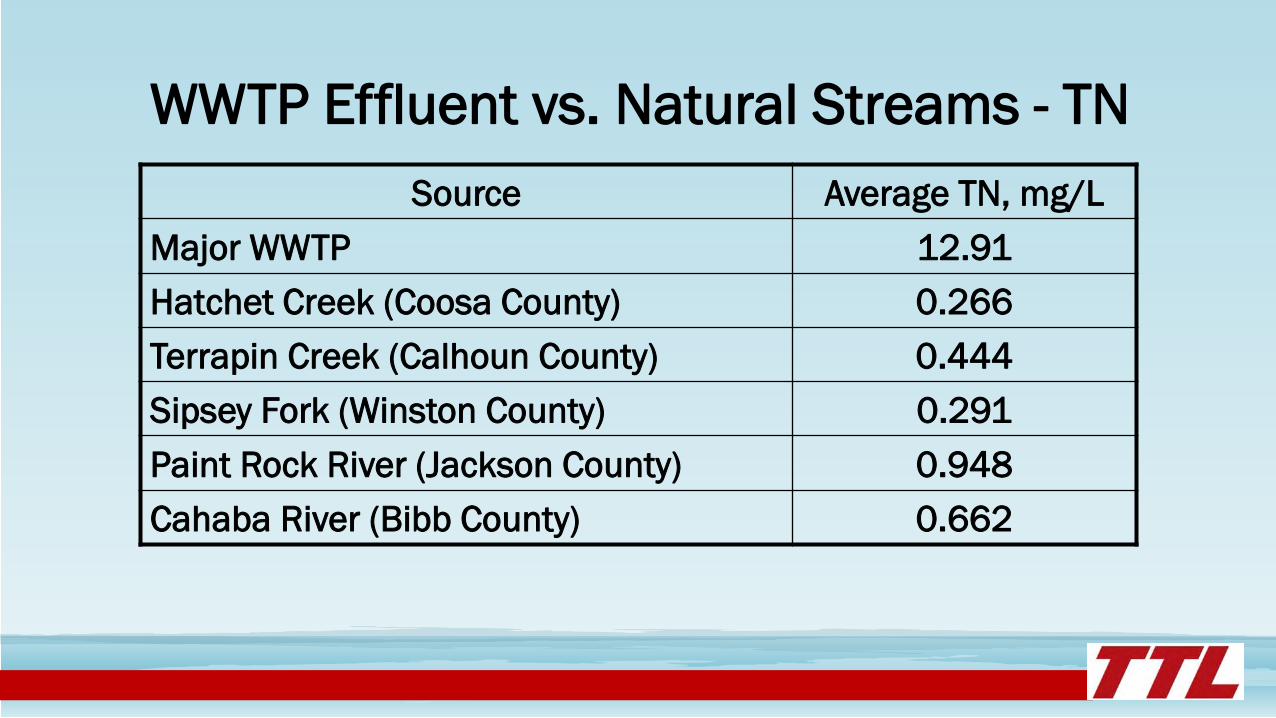
WWTP Effluent vs. Natural Streams - TNSource Average TN, mg/L
Major WWTP 12.91Hatchet Creek (Coosa County) 0.266Terrapin Creek (Calhoun County) 0.444Sipsey Fork (Winston County) 0.291Paint Rock River (Jackson County) 0.948Cahaba River (Bibb County) 0.662


Conclusion
•Levels of total phosphorus and total nitrogen in wastewater treatment plant effluents vary widely and are influenced primarily by treatment processes and influent wastewater concentrations

QUESTIONS????• Contact Information –
Lynn SiskTTL, Inc. – Montgomery, ALPhone: 334 – 387 – 1586email: [email protected]

“Notice all the computations, theoretical scribblings, and lab equipment, Norm ….Yes, curiosity killed these cats.”