NURSING HOME SURVEYS by Maria Tyszkiewicz …number of licensed nursing personnel on staff for three...
27
NURSING HOME SURVEYS by Maria Tyszkiewicz Fiscal Analyst September 2000
Transcript of NURSING HOME SURVEYS by Maria Tyszkiewicz …number of licensed nursing personnel on staff for three...
NURSING HOME SURVEYS
by
Maria TyszkiewiczFiscal Analyst
September 2000

THE SENATE FISCAL AGENCY
The Senate Fiscal Agency is governed by a board of five members, including the majority andminority leaders of the Senate, the Chairperson of the Appropriations Committee of the Senate,and two other members of the Appropriations Committee of the Senate appointed by theChairperson of the Appropriations Committee with the concurrence of the Majority Leader ofthe Senate, one from the minority party.
The purpose of the Agency, as defined by statute, is to be of service to the SenateAppropriations Committee and other members of the Senate. In accordance with this chargethe Agency strives to achieve the following objectives:
1. To provide technical, analytical, and preparatory support for all appropriations bills.
2. To provide written analyses of all Senate bills, House bills and Administrative Rulesconsidered by the Senate.
3. To review and evaluate proposed and existing State programs and services.
4. To provide economic and revenue analysis and forecasting.
5. To review and evaluate the impact of Federal budget decisions on the State.
6. To review and evaluate State issuance of long-term and short-term debt.
7. To review and evaluate the State's compliance with constitutional and statutoryfiscal requirements.
8. To prepare special reports on fiscal issues as they arise and at the request ofmembers of the Senate.
The Agency is located on the 8th floor of the Victor Office Center. The Agency is an equalopportunity employer and is subject to the Americans with Disabilities Act.
Gary S. Olson, DirectorSenate Fiscal Agency
P.O. Box 30036Lansing, Michigan 48909-7536
Telephone (517) 373-2767TDD (517) 373-0543
Internet Home Page http://www.senate.state.mi.us/sfa/

ACKNOWLEDGMENTS
This issue paper was prepared and written by Maria Tyszkiewicz, Fiscal Analyst of the SenateFiscal Agency. Pat Stinton-Harper prepared the tables and coordinated the production of thereport. The Senate Fiscal Agency wishes to acknowledge the assistance of the Departmentof Consumer and Industry Services in providing data and information included in this report.

TABLE OF CONTENTS
Page
INTRODUCTION . . . . . . . . . . . . . . . . . . . . . . . . . . . . . . . . . . . . . . . . . . . . . . . . . . . . 1
NURSING HOMES . . . . . . . . . . . . . . . . . . . . . . . . . . . . . . . . . . . . . . . . . . . . . . . . . . 2
NURSING HOME RESIDENTS . . . . . . . . . . . . . . . . . . . . . . . . . . . . . . . . . . . . . . . . . . . 2
STAFFING . . . . . . . . . . . . . . . . . . . . . . . . . . . . . . . . . . . . . . . . . . . . . . . . . . . . . . . . 3
THE SURVEY PROCESS . . . . . . . . . . . . . . . . . . . . . . . . . . . . . . . . . . . . . . . . . . . . . . 5
SURVEY CITATIONS . . . . . . . . . . . . . . . . . . . . . . . . . . . . . . . . . . . . . . . . . . . . . . . . 7
SURVEY RESULTS . . . . . . . . . . . . . . . . . . . . . . . . . . . . . . . . . . . . . . . . . . . . . . . . . . 8
RECENTLY IMPLEMENTED PROGRAM CHANGES IN MICHIGAN . . . . . . . . . . . . . . . . . . . 9
CONCLUSION . . . . . . . . . . . . . . . . . . . . . . . . . . . . . . . . . . . . . . . . . . . . . . . . . . . . 10
APPENDIX . . . . . . . . . . . . . . . . . . . . . . . . . . . . . . . . . . . . . . . . . . . . . . . . . . . . . . . 11

1
INTRODUCTION
In fiscal year (FY) 1995-96 Governor Engler issued an executive order that transferred theHealth Facility Licensing and Certification program from the former Department of Public Health(now the Department of Community Health) to what is now known as the Department ofConsumer and Industry Services. The Division of Nursing Home Monitoring in the Bureau ofHealth Systems is currently responsible for conducting standard (annual) surveys of nursinghomes in Michigan.
The issue of long-term care in the State is often debated in the Michigan Legislature. Issuesregarding oversight of the level of care received in the State-licensed nursing homes andresponse time to complaints have led the discussions. In the spring of 1999, the FederalGovernment Accounting Office released a study that reviewed Michigan’s complaint process,providing some negative feedback on the State’s program and the lack of Federal oversight.This report intensified the discussions between the Department and the Legislature.
In response to these criticisms, the Department conducted its own review and identified as partof the problem, a loss of qualified survey staff (inspectors) following the early retirement planfor State employees instituted during 1997. The early retirement plan resulted in a loss of 10experienced staff people, which in addition to the natural attrition rate within the Divisiondepleted the number of filled inspector positions to 73 by the end of FY 1997-98 (comparedwith the 94 that were allocated). The process of replacing inspectors involves extensivetraining and certification which can take several months. As a result, the Department hadaccumulated a backlog of complaints that had reached as many as 400. In response, theLegislature appropriated 24 additional inspector positions over two consecutive fiscal years. ForFY 1999-2000 and FY 2000-2001 there are a total of 118 FTE positions that have beenappropriated for State inspectors. As of August 2000, 114 of these positions were filled. This paper looks at Michigan’s nursing homes from 1994 through 1998, with a primary focuson the Federally certified homes which make up 86% of all nursing homes in Michigan and aredesignated Medicare only, Medicaid only, or dually certified for both Medicare/Medicaid. Thesehomes submit reports to the Federal Health Care Financing Administration and it is from thesereports that the majority of the data for this paper were derived. Compilation of the self-reported data for all states is provided in a publication distributed by the University of California(UC). The UC report was funded by the Health Care Financing Administration. The paper alsocompares the characteristics of Michigan’s homes including resident acuity, staffing levels, andresident payment types, with the characteristics of other states' nursing homes as well as thenational average.

1Harrington, Carrillo, Thollaug, Summers, Wellin, Nursing Facilities, Staffing,Residents, and Facility Deficiencies, 1992 Through 1998. ; Department of Socialand Behavioral Science, University of California, January 2000. pp. 17 and 18.
2
NURSING HOMES
In 1998, Michigan had 460 licensed nursing homes of which 446 were Federally certified and13 are State-licensed only (private pay homes). The nursing homes housed approximately52,000 residents in Michigan, with 38,000 residing in Federally certified homes and 14,000residing in the private pay homes. Table 1 below shows the distribution for home ownership inMichigan as compared with the national average and Table 2 shows the distribution for residentpayment type as compared with the national average1. Michigan’s distribution for these twocategories is fairly consistent with the national averages.
Table 1
Percentage Distribution of Ownership Typeof Federally Certified Nursing Homes
For Profit Nonprofit Government Total
Michigan 61.9 27.9 10.2 100.0
National Average 65.0 28.5 6.5 100.0Source: Nursing Facilities, Staffing, Residents, and Facility Deficiencies, 1992 Through 1998. Harrington,Carrillo, Thollaug, Summers, Wellin; Department of Social and Behavioral Science, University of California,January 2000.
Table 2
Percentage Distribution of Payment Type for Residents of Federally Certified Nursing Homes
Medicare MedicaidPrivate
Pay/Other Total
Michigan 12.1 66.5 21.4 100.0
National Average 9.3 67.4 23.3 100.0
Source: Nursing Facilities, Staffing, Residents, and Facility Deficiencies, 1992 Through 1998. Harrington,Carrillo, Thollaug, Summers, Wellin; Department of Social and Behavioral Science, University of California,January 2000.
NURSING HOME RESIDENTS
The measurement of the abilities of the residents in Michigan’s Federally certified nursing homesin 1998, conducted by UC, provides insight into the type and amount of care that should beprovided in Michigan’s homes. The University of California study includes two different indicesused to identify the characteristics of the resident populations in nursing homes. The first indexscores three activities of daily living (ADL) by rating the amount of assistance needed witheating, toileting, and being transferred (e.g., from a bed to a chair). Nursing homes were askedto rate residents based on a scale of 1 to 3 with 1 being none or a small amount of assistance

2Ibid. pp. 33.
3Ibid. pp. 35.
3
for each category and 3 being a lot of assistance or total dependence in each category. Eachfacility was given a case mix summary score and the data were further summarized to providean average summary score for all facilities located in the State. The average summary scoreranged anywhere from 3 to 9. For 1998, Michigan’s average summary score was 5.7, whichis identical to the national average. Thus, Michigan’s resident population is consistent with thenational average for level of care required to tend to the residents. The highest score wasVirginia at 6.6 and the lowest was a tie among Iowa, Illinois, and Wyoming at 5.22.
The second index used is a management minute index that weights the number of residentswith various ADL problems by the estimated number of minutes to care for someone with aspecific problem. The index used various categories of assistance that ranged from anindividual's being completely bedfast to having an inserted catheter or requiring eatingassistance. The estimated time was then multiplied by the percentage of patients in a certifiedhome with the specific need. These data were then summarized to provide an average residentacuity for the State. In Michigan, the average resident acuity for 1998 was 98.5 whichcompared with the national average of 99.2. The highest level was in Virginia at 124.2 and thelowest was in Nebraska at 72.43.
STAFFING
Certified homes are required to maintain a certain level of nursing care, which is monitored bythe Federal government through biweekly work reports. Each home must maintain a sufficientnumber of licensed nursing personnel on staff for three shifts. Sufficient staff is defined in theState statute, MCL 333.21720a, as a licensed Registered Nurse on staff for at least one eight-hour shift, seven days a week, and sufficient nursing staff to provide not less than 2.25 hoursof nursing care per patient per day. Federally certified nursing homes are required to report totalhours worked in a 14-day period. The UC study analyzed the data by reviewing the number ofresidents and then dividing the number of reported payroll nursing hours over the two-weekperiod prior to a survey. Staff time included both full- and part-time nursing staff, as well asthose performing administrative duties.4 A 24-hour period, or three shifts, is considered to bea resident day. The study differentiated between the different types of nursing staff and brokestaff down into registered nurses (RNs), licensed practical /vocational nurses (LPN/LVNs), andnurses aides (NAs). The study further broke the homes down by payment type: Medicare only,Medicaid only, and Medicaid/Medicare dual certification, and grouped together into all Federallycertified homes (Medicaid only, Medicare only, and the dually certified).
As shown in Tables 3-5, for 1998 the average number of RN hours per resident day forMedicare only homes in Michigan was 1.2 hours or 72 minutes, which was below the nationalaverage of 2.2 hours or 132 minutes. However, the staffing averages for both the Medicaid onlyand dually certified homes in Michigan are consistent with the national average during the sameyear. As a result, for all types of Federally funded nursing homes, registered nursing hours perresident day in Michigan were slightly below the national average.

4
The average number of LPN/LVN staffed hours per resident day in Medicare only homes inMichigan for the same year was .9 or 54 minutes compared to a national average of 1.3 hoursor 78 minutes, and .6 in Medicaid only and dually certified homes, consistent with the nationalaverage. For the total Federally funded homes, LPN/LVN nursing hours per resident day inMichigan were just below the national average of .7 hour, with an average of .6 hour perresident day.
For NAs, the averages were consistently above the national average. For the Medicare onlyhomes, Michigan averaged 2.6 hours compared with the national average of 2.2 hours perresident day. In the Medicaid only and dually certified homes, Michigan averaged 2.2 hourscompared with the national average of 2.0 hours. This resulted in Michigan’s average NA hoursfor all Federally certified nursing homes being slightly above the national average of 2.1 hours,at 2.2 hours per resident day.
Table 3Average Nursing Hours per Resident Day - Medicare Only Facilities
1994 1995 1996 1997 1998Registered Nurses
Wyoming* 3.1 3.1 4.9 4.7 4.4Michigan 0.4 0.5 0.7 1.3 1.2National Average 1.9 1.9 1.9 2.1 2.2
Licensed Practical/Vocational NursesNorth Dakota* 3.1 2.5 1.7 1.8 2.7Michigan 1.0 0.9 0.8 0.8 0.9National Average 1.6 1.4 1.3 1.3 1.3
Nurses Assistants/Orderlies/AidesNew Hampshire* 2.6 2.5 2.2 2.8 4.0Michigan 2.7 2.5 2.4 3.1 2.6National Average 2.9 2.6 2.5 2.5 2.5
*State(s) with highest average in 1998Source: Nursing Facilities, Staffing, Residents, and Facility Deficiencies, 1992 Through 1998. Harrington,Carrillo, Thollaug, Summers, Wellin; Department of Social and Behavioral Science, University of California,January 2000.
Table 4Average Nursing Hours per Resident Day - Medicaid and Medicare/Medicaid Facilities
1994 1995 1996 1997 1998Registered Nurses
Arkansas* 0.9 0.9 1.1 1.1 1.2Michigan 0.4 0.4 0.5 0.6 0.6National Average 0.4 0.4 0.5 0.5 0.6
Licensed Practical/Vocational NursesAlabama* 0.9 0.9 0.9 0.9 0.9DC* 0.8 0.7 0.7 0.8 0.9Michigan 0.6 0.6 0.6 0.6 0.6National Average 0.6 0.6 0.6 0.6 0.6
Nurse Assistants/Orderlies/AidesArkansas* 2.9 3.0 3.0 2.8 2.8Michigan 2.2 2.2 2.2 2.2 2.2National Average 2.0 2.0 2.0 2.0 2.0
*State(s) with highest average in 1998Source: Nursing Facilities, Staffing, Residents, and Facility Deficiencies, 1992 Through 1998. Harrington,

5
Carrillo, Thollaug, Summers, Wellin; Department of Social and Behavioral Science, University of California,January 2000.

6
Table 5Average Nursing Hours per Resident Day
Total Federally Certified Facilities - Medicaid Only, Medicare Only, Medicaid/Medicaid1994 1995 1996 1997 1998
Registered NurseArkansas* 0.9 0.9 1.1 1.1 1.2Michigan 0.4 0.4 0.5 0.6 0.6National Average 0.6 0.6 0.6 0.7 0.8
Licensed Practical/Vocational NurseAlabama* 0.9 0.9 0.9 0.9 1.0Mississippi* 0.9 1.0 0.9 0.9 1.0Michigan 0.6 0.6 0.6 0.6 0.6National Average 0.7 0.7 0.7 0.7 0.7
Nurse Assistants/Orderlies/AidesMaine* 2.6 2.7 2.8 2.8 2.9Michigan 2.2 2.2 2.2 2.3 2.2National Average 2.1 2.0 2.1 2.1 2.1
*State(s) with highest average in 1998Source: Nursing Facilities, Staffing, Residents, and Facility Deficiencies, 1992 Through 1998. Harrington,Carrillo, Thollaug, Summers, Wellin; Department of Social and Behavioral Science, University of California,January 2000.
THE SURVEY PROCESS
All states have a contract with the Federal Health Care Financing Administration (HCFA) tomonitor nursing homes providing services to Medicare and Medicaid beneficiaries. The Divisionof Nursing Home Monitoring enforces the Federal licensing standards established for Medicaidand Medicare purposes as provided in the Social Security Act (42 U.S.C. 1396r, Titles 18 and19) for those homes as well as the State statute (MCL 333.21701 to 333.21799e). A homeundergoes an inspection about every nine to 15 months.
There are four types of surveys that a Federally certified home could undergo. The first is astandard (annual) survey conducted every nine to 15 months. Surveyors review the quality ofcare, written plans of care, and compliance with residents' rights. Residents' rights includesuch things as privacy, confidentiality, freedom from restraints, and participation in resident andfamily groups. If the sampled group reveals that a facility may not provide adequate servicesor substandard care during the annual survey, the facility could be subject to an extendedsurvey. An extended survey, the second type of survey, usually takes place immediatelyfollowing the standard survey and involves an increase in the sample size as well as a reviewof the procedures practiced in the home to determine why a deficient rating has resulted. Afacility may also undergo an abbreviated standard survey which is a focused survey followinga complaint. Finally, there is a validation survey which is done by Federal investigators on asample of the homes that received an annual survey. Validation surveys are required to beconducted within two months of an annual survey and are performed using the same protocolsas the annual survey. Any facility found to be in noncompliance with a Federal validationsurvey, even if it was found to be compliant under the State survey, will be subject to citationsand remedial action resulting from the Federal validation survey.

7
The makeup of the State survey team must be multidisciplinary and usually includes registerednurses, dieticians, sanitarians, and social workers. Other professions including engineers maybe consulted if necessary. Surveyors are assigned to one of six regional area teams. All annualand follow-up surveys are performed by these teams in the respective regions. There is onecomplaint team in both Lansing and Detroit, and the northern survey team, Team F, respondsto complaints within its region. A diagram outlining these regions is shown in Figure 1. Avalidation survey may include a Federal team of surveyors doing a separate survey or a singleFederal surveyor accompanying a State survey team.
Ingham
Wayne
Saginaw
Chippewa
Oakland
Bay
Cass
Clinton
Dickinson
Eaton
Genesee
GrandTraverse
Houghton
Huron
Kent Lapeer
Manistee
Marquette
Missaukee
Monroe
NewaygoOceana
Ottawa
St. Joseph
Washtenaw
Ontonagon
Gogebic
Baraga
Iron Alger
Kalamazoo
Delta
Schoolcraft
Luce
Mackinac
Emmet
Antrim OtsegoAlpena
Benzie
Kalkaska Crawford Oscoda Alcona
Wexford Ogemaw Iosco
Mason Lake OsceolaClare Gladwin Arenac
Mecosta Isabella Midland
Montcalm Gratiot
Tuscola Sanilac
St. ClairIonia
Allegan Barry Livingston
Van Buren
Berrien
Calhoun Jackson
Branch Hillsdale Lenawee
Team F
Team B (East)
Team D(North)
Team C (West) Team B
(East)
TeamsA & E
NOTE:Kent, Genesee, Inghamand Oakland counties areshared between teams. These lines do notrepresent geographicboundaries.
Bureau of Health Systems Nursing Home Survey Team Regions
Figure 1

8
SURVEY CITATIONS
Citations for deficiencies are classified into a grid based on the scope and severity. The scopeof a deficiency is defined as the number of residents who are or may be affected by a specificdeficiency. Severity is defined as the seriousness of the deficiency on residents based on theimpact of the care provided in a facility. Figure 2 below shows the grid surveyors use toclassify levels of severity and scope of deficiencies.
Figure 2
Nursing Home Citation Grid
Immediate Jeopardy To ResidentHealth or Safety
J K L
Actual Harm that is notImmediate Jeopardy
G H I
No Actual Harm with potential forMore than Minimal Harm that isnot Immediate Jeopardy
D E F
No Actual Harm with Potential forMinimal Harm
A B C
Isolated Pattern WidespreadSource: Department of Consumer and Industry Services.
Substantial Compliance
Substandard Quality of Care
Homes with citations in box A, B, or C are considered to be in substantial compliance. Homeswith citations in any other box are considered noncompliant. Homes found to have one or moredeficiencies in squares F and H to L are found to meet the Federal definition for substandardquality of care. The number and severity of the deficiency(ies) determine the remedial actionthat will be taken by the State in attempting to bring a facility back into compliance withlicensing standards. Any home found to be noncompliant may be subject to either Federal orState authorized remedial actions. Federal actions can include one or more of the following:
1) A denial of payment for new admissions 2) State monitoring 3) A temporary manager 4) An administrative advisor or clinical advisor, or both 5) A directed plan of correction 6) Directed in-service training 7) Civil monetary penalties 8) Closure of a home or the transfer of patients or both 9) Termination of a provider agreement10) Denial of payment for all individuals (imposed directly by the HCFA)11) Public notice that is required under state licensure authority.

4Ibid. pp. 59.
9
12) Assignment of an administrative or clinical advisor to monitor or mentor the facilityadministrative or clinical staff until corrective action is complete
State actions, provided under the State licensure authority also may include one or more of thefollowing:
1) A correction notice or order requiring a temporary administrative or clinical advisor 2) An emergency order limiting, suspending, or revoking a license
3) A notice of intent to revoke licensure 4) A correction notice or order to transfer selected patients, reduce licensed capacity,
or comply with specific requirements 5) A correction notice or order requiring a temporary manager
6) State patient rights penalties
Remedial action depends not only on the number of deficiencies, and the scope and severity ofthe deficiencies, but the past performance by the home is considered as well. Facilities maybe given 90 days to achieve substantial compliance unless a citation is considered serious andcould put residents in immediate jeopardy. Facilities that do not abate an immediate jeopardywithin 23 days are terminated from the program and if a facility remains noncompliant at 90days a denial of payment for new Medicaid/Medicare admissions is imposed. If by 180 daysthe deficiency is not corrected, then the facility will be terminated from receiving allMedicaid/Medicare reimbursement. If a facility is cited with deficiencies in the “G” box of thegrid for two surveys (annual or intervening survey including a complaint investigation), then nograce period is given to correct the deficiency and the licensure authority may immediatelyimpose remedies, including a denial of reimbursements for new admissions. All immediatejeopardy citations in a Federally certified facility are referred to the HCFA and considered to bein violation of the Federal standards.
Homes also are given the opportunity to appeal a citation to the State Medicaid Agency within30 days of receiving notice of the right to appeal or 60 days to HCFA in the case of Medicareonly or dually certified homes. Any appeal delays the imposition of remedial action applied bythe State unless the facility, as stated above, received a deficiency rating of “G” or above andduring the appeals process is surveyed again and is cited for a deficiency rating “G” or above.This result allows the State immediately to take remedial action, including termination ofreimbursement from Medicaid or Medicare. Additionally, an informal appeal process is available,as required in the Federal rules. In Michigan a nursing home can request a review of contestedcitations, which is called the Informal Deficiency Dispute Resolution process. The review isprovided by the Michigan Peer Review Organization who have a contract with the State toperform this service. The organization assigns cases to a standing panel who review thecontested claims.
SURVEY RESULTS
For the past five years Michigan has placed nationally in the top five states with the highestaverage number of deficiencies per certified nursing facility4. Tables 1-7 located in the Appendixshow how Michigan rates compared with other states in the nation regarding citation levels.6

5Each citation category is given a number preceded by the letter F, and is thereforereferred to as an F-Tag. The definition of the citation categories and the F-Tag number areprovided in the Appendix.
10
The national average for citations per certified home in 1994 was 7.2 and it decreased to 5.2for 1998. Comparatively, Michigan had an average citation rate of 13.3 in 1994 and decreasedto 9.3 in 1998. This is almost twice the national average for the number of citations. Inaddition, Michigan is one of the bottom four states having the lowest percentage of facilitiesfound to have no deficiencies. The national average in 1994 was 12.6% facilities with nodeficiencies and it increased to 18.9% in 1998. Michigan, however, had only 0.4% in 1994,and increased to 3.1% in 1998, well below the national average.
When considering the 10 most frequently cited deficiencies5, from 1995 through 1998, Michiganappears as one of the top citing states in at least six out of 10 citation categories. The topdeficiencies have changed slightly over the four years but the most common citations are foodsanitation, comprehensive assessments, comprehensive care plans, accidents, and pressuresores. Michigan ranks in the top citing states in three of these categories: food sanitation,accidents, and pressure sores.
As stated previously, just a citation for a deficiency is not solely indicative of the type of carethat is provided in an institution. A citable incident could be isolated and involve very few oreven one resident of a facility. A breakout of the 1998 citations show that 80.64% of thecitations fall in the categories which are below the Federal Standard for quality of care, or boxesA through E and G. The remaining 19.36% fall under the Federal definition of substandardquality of care. Of the total citations, 87.53% fall in the lowest two severity rows or boxes Athrough F.
RECENTLY IMPLEMENTED PROGRAM CHANGES IN MICHIGAN
Michigan has implemented an early review process as a deterrent against substandardperformance and repeated violations. The main feature of this process is a computer-drivenscoring program that takes into consideration the results of the most recent survey, the numberof complaints filed and substantiated against the home, and the level of difficulty required forthe home to remedy any cited deficiencies. Homes that score one standard deviation from theStatewide average are subject to early intervention usually resulting in remedial action againstthe facility prior to the first revisit.
Michigan also has entered into a contract with the Michigan Public Health Institute (MPHI), aprivate not-for-profit organization specializing in public health issues, for it to act as a consultantfor those homes that are found to be noncompliant, referred to as the Resident ProtectionInitiative. Following a survey, the State may order a facility to work with the MPHI and requirethat the cost of the services be paid by the facility. The MPHI is most often used in homes thatare found to be in noncompliance and are restricted by the Federal requirements from beingprovided with a grace period to rectify any citations. The MPHI provides directed servicetraining and placement of temporary managers or clinical advisors in the facility. Consultationand oversight by the MPHI continue for up to six months after the facility achieves substantial

11
compliance. Homes are not prohibited from entering into agreements with the MPHI or otherentities independently to prevent a negative survey result. Another change recently implemented by the Department includes the creation of a QualityImprovement Nurse program. This program is based on a model used in the State ofWashington in which nurses go out to facilities that are considered borderline or average basedon recent survey results, or at the request of a facility. The nurses provide managementsupport and training programs in order to prevent the home from becoming substantiallynoncompliant. Support efforts include Continuous Quality Improvement training, staff retraining,and technical assistance. These nurses operate solely as consultants and do not have theability to cite a facility for violations of Federal and state standards.
Finally, in FY 2000, the former Continuous Quality Improvement Program, a Federal matchinggrant program, was transferred from the Department of Community Health to the Departmentof Consumer and Industry Services. This program, which has been appropriated $10 millionannually, provides competitive grants to nursing homes for quality improvement programs. Thegrant program funds programs in three different categories. The first, the Quality LeadershipAward, is awarded for quality improvement initiatives based on the Baldridge Award Process.The second are awards for innovative projects that improve the level of care. Finally, the thirdfunds Eden Alternative Projects which improve the nursing home environment by making it lessinstitutional and more habitable. Three additional nursing staff were appropriated for FY 2001to administer the grant program and provide information on best practices. Applications forgrant awards for FY 2000 were approved for 347 applicants.
CONCLUSION
As one can see from the above data, Michigan's certified nursing homes are on average withthose nationally in terms of resident population and characteristics. Staffing levels are notbelow average, acuity levels of residents are not high, and the distributions for payment typeare consistent. A comparison of survey results has revealed that Michigan places in the top tierof citations for the most frequently cited violations and has the lowest percentage of homesreceiving no citations. The data was only available through 1998, which was prior to theincreased staffing authorization. A follow-up analysis of FY 2000 and FY 2001 citation resultswould need to be conducted to determine if more inspectors will result in measurable changesin the citation levels in these homes.
12
APPENDIX
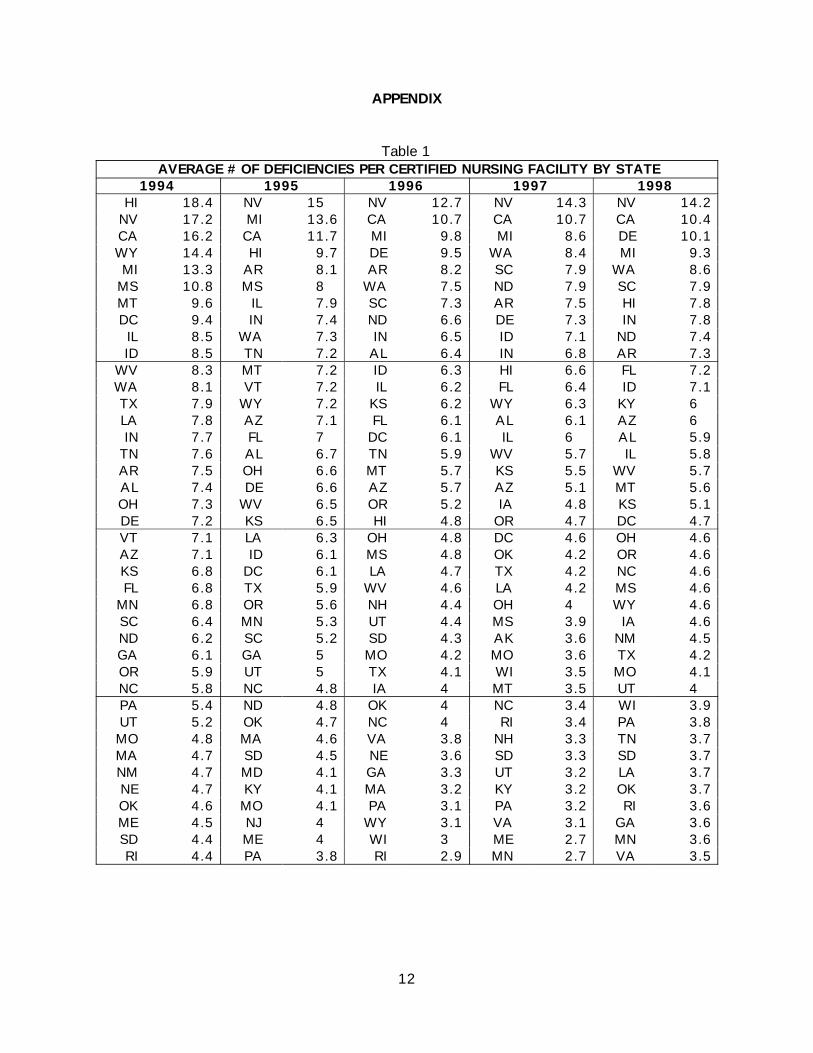
Table 1 AVERAGE # OF DEFICIENCIES PER CERTIFIED NURSING FACILITY BY STATE
1994 1995 1996 1997 1998 HI 18.4 NV 15 NV 12.7 NV 14.3 NV 14.2
NV 17.2 MI 13.6 CA 10.7 CA 10.7 CA 10.4 CA 16.2 CA 11.7 MI 9.8 MI 8.6 DE 10.1 WY 14.4 HI 9.7 DE 9.5 WA 8.4 MI 9.3
MI 13.3 AR 8.1 AR 8.2 SC 7.9 WA 8.6 MS 10.8 MS 8 WA 7.5 ND 7.9 SC 7.9 MT 9.6 IL 7.9 SC 7.3 AR 7.5 HI 7.8 DC 9.4 IN 7.4 ND 6.6 DE 7.3 IN 7.8 IL 8.5 WA 7.3 IN 6.5 ID 7.1 ND 7.4 ID 8.5 TN 7.2 AL 6.4 IN 6.8 AR 7.3
WV 8.3 MT 7.2 ID 6.3 HI 6.6 FL 7.2 WA 8.1 VT 7.2 IL 6.2 FL 6.4 ID 7.1 TX 7.9 WY 7.2 KS 6.2 WY 6.3 KY 6 LA 7.8 AZ 7.1 FL 6.1 AL 6.1 AZ 6 IN 7.7 FL 7 DC 6.1 IL 6 AL 5.9
TN 7.6 AL 6.7 TN 5.9 WV 5.7 IL 5.8 AR 7.5 OH 6.6 MT 5.7 KS 5.5 WV 5.7 AL 7.4 DE 6.6 AZ 5.7 AZ 5.1 MT 5.6 OH 7.3 WV 6.5 OR 5.2 IA 4.8 KS 5.1 DE 7.2 KS 6.5 HI 4.8 OR 4.7 DC 4.7 VT 7.1 LA 6.3 OH 4.8 DC 4.6 OH 4.6 AZ 7.1 ID 6.1 MS 4.8 OK 4.2 OR 4.6 KS 6.8 DC 6.1 LA 4.7 TX 4.2 NC 4.6 FL 6.8 TX 5.9 WV 4.6 LA 4.2 MS 4.6
MN 6.8 OR 5.6 NH 4.4 OH 4 WY 4.6 SC 6.4 MN 5.3 UT 4.4 MS 3.9 IA 4.6 ND 6.2 SC 5.2 SD 4.3 AK 3.6 NM 4.5 GA 6.1 GA 5 MO 4.2 MO 3.6 TX 4.2 OR 5.9 UT 5 TX 4.1 WI 3.5 MO 4.1 NC 5.8 NC 4.8 IA 4 MT 3.5 UT 4 PA 5.4 ND 4.8 OK 4 NC 3.4 WI 3.9 UT 5.2 OK 4.7 NC 4 RI 3.4 PA 3.8 MO 4.8 MA 4.6 VA 3.8 NH 3.3 TN 3.7 MA 4.7 SD 4.5 NE 3.6 SD 3.3 SD 3.7 NM 4.7 MD 4.1 GA 3.3 UT 3.2 LA 3.7 NE 4.7 KY 4.1 MA 3.2 KY 3.2 OK 3.7 OK 4.6 MO 4.1 PA 3.1 PA 3.2 RI 3.6 ME 4.5 NJ 4 WY 3.1 VA 3.1 GA 3.6 SD 4.4 ME 4 WI 3 ME 2.7 MN 3.6 RI 4.4 PA 3.8 RI 2.9 MN 2.7 VA 3.5

Table 1 AVERAGE # OF DEFICIENCIES PER CERTIFIED NURSING FACILITY BY STATE
1994 1995 1996 1997 1998
13
AK 4.3 IA 3.8 MN 2.9 MA 2.6 ME 3.3 IA 4 NM 3.7 NY 2.7 NE 2.6 AK 3.2
MD 4 RI 3.6 CO 2.6 GA 2.6 NE 3 NJ 3.8 NE 3.5 MD 2.6 TN 2.6 MA 2.8 CT 3.7 WI 3.4 NJ 2.6 NJ 2.4 NH 2.7 WI 3.6 VA 3.4 ME 2.4 CO 2.3 CT 2.7 VA 3.6 AK 3.2 KY 2.3 NY 2.2 MD 2.4 KY 3.1 NY 3.1 AK 2.2 MD 2.2 CO 2.2 NH 2.7 CO 2.4 VT 2.1 CT 2.1 NY 2 CO 2.5 CT 2.3 NM 1.7 NM 1.8 VT 2 NY 2.5 NH 2 CT 1.5 VT 1.8 NJ 1.9 US 7.2 6.1 5.1 4.9 5.2
Source: Nursing Facilities, Staffing, Residents, and Facility Deficiencies, 1992 Through 1998. Harrington,Carrillo, Thollaug, Summers, Wellin; Department of Social and Behavioral Science, University of California,January 2000.
Table 2 PERCENT OF FACILITIES WITH NO CITATIONS
1994 1995 1996 1997 1998 WY 0 MT 0 NV 0 NV 0 DC 0
HI 0 NV 0 HI 2.5 MI 2.7 CA 1.8MI 0.7 DC 0 DE 2.7 WY 2.8 HI 2.3
CA 1.2 MI 1.4 MI 3.7 CA 3 MI 3.1 MT 3.1 AZ 2.7 CA 4 AR 3.9 WA 4.4 WV 3.1 CA 3.3 AZ 4.9 ND 4 AR 4.7 ND 3.7 HI 4.8 AR 6.6 WA 4.7 SC 4.9 IL 4 VT 5 SC 6.7 AZ 5.9 AZ 6.2
AR 4.1 WY 5.3 ND 8.1 SC 6.3 ID 6.3 DC 5.6 KS 5.4 IL 9 IL 6.9 ND 6.8 VT 5.6 IL 5.5 WA 9.4 AL 7.1 WV 7.3 SC 6 AR 5.8 TN 9.9 ID 7.8 NV 7.3 UT 6.7 SC 7.1 ID 10.8 DC 9.1 IN 7.4 DE 7 AL 7.1 DC 11.1 HI 9.5 DE 7.4 OH 7.1 TN 7.3 KS 11.3 IN 9.5 AL 7.4 WA 7.4 IN 7.5 IN 11.9 WV 10.3 IL 7.9 NV 7.5 ID 7.5 AL 12 FL 11 FL 10.5 MN 7.6 WA 8.9 UT 13.9 KS 11.4 MT 10.9 ID 7.7 WV 9 MT 14 DE 11.9 SD 11.6 AL 7.9 UT 9.2 WV 14.5 IA 17.9 WY 12.5 TN 8.1 MN 9.7 FL 15.2 WI 20.8 ME 13.6 IN 8.2 ME 10.4 OH 17.2 AK 21.4 KY 13.8
SD 8.5 FL 10.5 SD 19 SD 21.8 IA 15.8 KS 8.6 OH 10.6 LA 20.3 MT 22.1 MS 16 TX 9.5 DE 12.1 VT 21.6 OH 22.2 PA 19.5 NC 10.6 MS 12.6 NC 22.7 RI 22.8 KS 19.5 FL 10.9 TX 14.2 NH 22.9 TX 23.2 TX 20.1
MS 11.1 AK 15.4 TX 23.2 LA 23.2 WI 20.5 PA 11.6 LA 15.6 OR 24 UT 24.2 AK 21.4 AZ 11.9 OR 16 MS 24.7 PA 25 RI 21.4

Table 2 PERCENT OF FACILITIES WITH NO CITATIONS
1994 1995 1996 1997 1998
14
ME 13 ND 16.9 OK 24.8 OK 25.3 TN 21.8 NE 13.1 GA 17.3 IA 24.9 OR 26.3 OR 21.9 LA 14.1 NC 17.9 RI 26.7 MS 27.9 NM 22.7 GA 14.8 RI 19.5 MN 27.4 MN 28.6 OH 22.9 RI 15.2 SD 19.8 WI 27.5 NH 29.3 MO 23
OR 15.3 OK 20.4 PA 27.8 MO 29.6 GA 23.4 NM 15.6 PA 21.4 MO 28.2 TN 29.9 UT 23.6 MA 16.7 WI 22 WY 29.7 GA 32.1 CT 23.6 CT 18 MA 22.9 NE 29.7 ME 32.8 MN 25.2 WI 18.6 NE 24.8 AK 31.3 CT 33.6 NC 25.7 OK 19.1 IA 25.7 NY 31.4 NC 34.8 OK 28.3 AK 21.4 MO 25.8 ME 32 NY 35.3 LA 30.4 MD 21.5 VA 27.3 CO 33.7 VA 36.3 VA 32 IA 23.9 NY 27.6 GA 34.3 MD 36.7 VT 32.4
VA 24.7 NJ 27.7 MD 34.8 VT 37.8 NE 34.4 MO 27.4 NM 29.9 MA 36 NJ 42.5 CO 34.9 CO 28.4 MD 30.1 VA 36.7 CO 42.8 MD 37.4 NJ 28.9 CO 31 NJ 36.9 NE 42.9 NH 38.7 NY 31.5 CT 37.1 CT 46.5 MA 47.8 NY 39.6 KY 37.8 NH 38.9 NM 48.1 KY 49.2 MA 41.3 NH 43.3 KY 44.9 KY 56.4 NM 57.1 NJ 47.7 US 12.6 15.2 20.8 21.6 18.9
Source: Nursing Facilities, Staffing, Residents, and Facility Deficiencies, 1992 Through 1998. Harrington,Carrillo, Thollaug, Summers, Wellin; Department of Social and Behavioral Science, University of California,January 2000.

Table 3 TOP TEN MOST FREQUENTLY CITED DEFICIENCIES BY STATE FOR CERTIFIED FACILITIES
CALENDAR YEAR 1995
Food Sanitation
Comprehensive Assessments
Comprehensive Care Plans Accidents
Pressure Sores Dignity
Physical Restraints Housekeeping
Accommodate Needs
Incontinence Care
DC 61.5 ME 64.3 HI 64.3 IL 36.9 NV 41.7 DC 46.2 NV 72.2 DC 76.9 HI 52.4 WY 47.4 NV 61.1 VT 57.5 CA 53.4 MI 34.7 MI 37.4 CA 44.1 HI 38.1 MI 43.2 CA 40.7 AL 35.4 AZ 49.1 MI 55.7 WY 50 MS 34.2 WY 34.2 WY 42.1 SC 35.1 KS 38.2 NV 38.9 MI 32MI 47.8 TN 52.7 ME 47 OH 32.9 WA 27.1 NV 41.7 AL 32.8 NV 33.3 MI 28.4 NV 27.8
CA 42 AL 51.5 MI 43.4 WV 31.3 IA 25.5 HI 40.5 MI 27.3 AR 31.9 UT 22.4 SC 24.7 TN 41 OR 50.7 AL 42.4 AR 30 AR 25 AZ 28.8 MT 25 WV 28.4 TN 22 FL 20.7
WY 39.5 NV 50 NV 41.7 WA 27.9 MT 25 UT 27.6 CA 24.8 MS 28.1 WA 20.8 NC 19.9 IL 38 AZ 48.2 AZ 41.1 DE 27.3 MS 24.1 VT 27.5 SD 24.3 TX 27.9 IL 18.6 AR 18.8
OH 32.6 HI 47.6 KS 37.4 UT 26.3 OH 23.5 WA 24.5 DE 24.2 IL 27.8 WV 17.9 WA 18.6 UT 31.6 IN 47.08 TN 37.3 SD 26.1 AL 22.7 MI 24.3 UT 23.7 WA 25.3 ID 17.5 MT 18 TX 30.8 MN 44.5 ID 36.3 CA 26 CT 21.5 IL 23.8 KS 23.6 CA 23.6 NJ 17.5 MN 16.8
WA 30.5 MA 44.2 FL 33.6 AZ 24.1 ID 21.3 TN 23.3 OK 23 OH 23 OH 17.1 IL 16.8 MS 30.2 RI 42.7 DE 33.3 IN 24.1 KS 20.3 NJ 20.8 TN 22.7 WY 21.1 ND 16.9 MA 16.3 SC 29.9 SD 42.3 NJ 32 AK 23.1 CA 19.1 MS 20.6 OH 21.8 LA 20.5 FL 16.3 IA 16.3 GA 29.5 IL 41.6 AK 30.8 DC 23.1 MD 18.8 OH 19.9 FL 21.3 ID 18.8 TX 15.4 KS 15.1 KS 28.7 MS 41.2 MS 30.7 KS 21.5 MO 18.3 FL 19.7 VA 20.6 TN 18.3 AL 14.1 CA 14.5 HI 28.6 KS 41 IL 29.3 TN 20.7 NM 16.9 ID 18.8 AZ 20.5 AZ 17.9 OR 14 UT 14.5 RI 28 WY 39.5 NC 29 TX 20.4 NE 16.8 GA 18.4 PA 19.7 IN 17 MS 13.1 TN 14
DE 27.3 WA 38.7 OH 27.6 NV 19.4 ND 15.7 SC 18.2 AR 19.6 GA 16.7 ME 13 OH 13.9 AR 26.9 AK 38.5 IN 27.5 GA 19.3 AK 15.4 IN 18 NM 19.5 WI 13.3 PA 12.5 KY 13.7 NM 26 NC 37.3 SD 26.1 AL 19.2 DC 15.4 MN 16.6 ID 18.8 MO 12.5 MA 12.4 DE 12.1
IN 25.4 CA 36.6 MO 23.9 CO 17.7 OR 15.3 WV 16.4 MN 17.9 UT 11.8 VA 12.2 MO 11.3 ME 24.3 FL 35.3 NH 22.2 WI 16.5 VT 15 KS 16.4 VT 17.5 FL 11.8 MT 12 GA 11 FL 23 OH 34 AR 21.2 WY 15.8 LA 14.7 MD 16.1 IL 17.2 NJ 11.2 NE 11.9 MS 10.6 VT 22.5 ID 33.8 LA 21.1 ME 15.7 TX 14.6 NY 15.9 MA 17.1 MT 11 AR 11.9 VT 10 LA 22.3 MT 33 WA 20.8 MN 15 SC 14.3 NC 15.3 NC 17.1 ND 10.8 WY 10.5 ND 9.6 NC 22.3 WI 32 KY 20.1 OR 14 CO 14.3 OR 15.3 NY 17 KY 10.7 VT 10 IN 8.4 MO 20.3 NH 27.8 OR 20 SC 13.6 HI 14.3 ME 14.8 NE 16.8 ME 10.4 NM 9.1 TX 8
ID 20 IA 25.7 MT 20 PA 12.7 NY 13.7 ND 14.5 IN 14.1 PA 10.2 MN 8.7 WI 8 SD 19.8 MO 25.2 SC 19.5 VT 12.5 IL 12.7 AL 14.1 MS 13.6 OR 10 SC 8.4 DC 7.7 ND 19.3 AR 21.5 VT 17.5 NY 11.9 SD 12.6 LA 14.1 RI 13.4 OK 9.7 NH 8.3 HI 7.1 WV 17.9 DE 21.2 WI 16.3 VA 11.8 TN 12.3 PA 13.4 WV 13.4 NC 9.6 IA 8 LA 7 MN 17.9 GA 21 TX 16 NM 11.7 MN 11.8 MO 13.1 LA 13.1 RI 8.5 IN 7.8 OR 6.7 VA 17.6 KY 20.9 PA 15.9 OK 10.7 IN 11.7 AR 12.7 MO 13.1 NY 8.4 DC 7.7 NE 6.6 OK 17 CO 19.2 NE 15 MT 10 OK 11.2 VA 12.6 KY 12.8 NH 8.3 AK 7.7 NM 6.5

Table 3 TOP TEN MOST FREQUENTLY CITED DEFICIENCIES BY STATE FOR CERTIFIED FACILITIES
CALENDAR YEAR 1995
Food Sanitation
Comprehensive Assessments
Comprehensive Care Plans Accidents
Pressure Sores Dignity
Physical Restraints Housekeeping
Accommodate Needs
Incontinence Care
IA 16 SC 18.8 NM 14.3 MD 9.7 NJ 10.9 SD 11.7 IA 12.4 MN 8.2 KS 7.7 ID 6.3 MT 15 WV 16.4 NY 13.2 LA 9.5 FL 10.5 TX 11.4 OR 12 AK 7.7 GA 6.8 NH 5.6 NY 14.8 CT 15.9 MA 13 FL 8.8 KY 10.3 MT 11 WA 11.9 VA 7.6 NC 6.7 ME 5.2 KY 14.5 ND 15.7 MN 12.4 NE 8.4 PA 10.2 NM 10.4 ND 10.8 VT 7.5 MD 6.5 PA 4.8 AL 13.6 LA 15 OK 12 MO 8.3 NC 9.8 KY 9.4 TX 10.2 DE 6.1 LA 6.4 MD 4.8 NE 12.4 NJ 12.9 RI 11 MA 8.1 MA 9.7 DE 9.1 MD 9.7 NE 5.8 SD 6.3 CO 4.4 PA 12.3 TX 12.3 VA 10.5 IA 6.8 ME 9.6 MA 8.7 ME 9.6 MD 5.4 WI 5.3 RI 3.7 OR 11.3 NE 10.6 MD 10.2 ID 6.3 GA 9.1 NE 8 WI 8.8 MA 5.2 KY 4.7 CT 3.6 MD 10.8 NM 10.4 IA 9 RI 6.1 DE 9.1 AK 7.7 GA 8.8 AL 5.1 CO 4.4 OK 3.1 MA 10.1 PA 9.5 GA 7.9 NC 6 RI 8.5 WI 6.3 NJ 8.6 CO 4.9 MO 3.8 NJ 3 CO 9.9 DC 7.7 CO 7.9 CT 6 NH 6.9 OK 6 NH 8.3 IA 4.4 NY 3.7 NY 1.8 WI 8.8 OK 4.7 DC 7.7 NH 5.6 WV 6 RI 4.9 AK 7.7 SD 2.7 OK 3.4 VA 1.3 NJ 8.6 NY 4.4 WV 6 HI 4.8 VA 5.5 CO 4.9 CT 6 SC 1.9 DE 3 SD 0.9 CT 5.6 MD 3.8 UT 5.3 KY 4.3 UT 5.3 IA 4.9 WY 5.3 NM 0 AZ 2.7 AZ 0.9 NH 1.4 UT 2.6 ND 4.8 NJ 4 WI 4.3 CT 4 CO 3 HI 0 CT 2.4 WV 0 AK 0 VA 1.7 CT 4 ND 2.4 AZ 2.7 NH 0 DC 0 CT 0 RI 0 AK 0
29 24.8 24.6 18.3 17.7 17.3 16.9 15.6 14.2 12.1Source: Nursing Facilities, Staffing, Residents, and Facility Deficiencies, 1992 Through 1998. Harrington, Carrillo, Thollaug, Summers, Wellin; Department of Socialand Behavioral Science, University of California, January 2000.

Table 4 TOP TEN MOST FREQUENTLY CITED DEFICIENCIES BY STATE FOR CERTIFIED FACILITIES
CALENDAR YEAR 1996
FoodSanitation
ComprehensiveAssessments
ComprehensiveCare Plans Accidents Pressure Sores
Quality ofCare
PhysicalRestraints Housekeeping Dignity
UnnecessaryDrugs
DC 66.7 HI 57.5 CA 47.3 DE 45.9 MI 35.8 NV 43.6 NV 59 DC 61.1 CA 40.9 SD 36 NV 59 SD 54 DE 45.9 AZ 44.4 KS 30.5 OR 36.4 CA 25.9 AR 39.5 NV 38.5 MI 32.6 AZ 51.4 AK 50 AL 45.2 AR 35.9 AR 29.3 WA 32.6 SC 25.5 AZ 33.1 HI 25 SC 27.3 DE 43.2 TN 44.1 NH 41.4 MI 30.9 WA 28.8 ID 32.4 MI 23.8 KS 30.2 SC 24.8 CA 26.6MI 42.3 AL 39.4 NV 41 UT 30.4 SC 26.1 DE 32.4 ND 23 MI 30.2 DE 24.3 NV 23.1
CA 41.9 IN 38.3 HI 37.5 IL 30.1 ND 24.1 AR 28.5 MA 22.6 IL 26.1 ND 24.1 ID 21.6 AR 39.5 IL 37.8 SD 35 IN 29.6 AL 22.6 MD 27.5 AL 22.1 CA 26 NC 20.8 TN 21.6 IL 34.8 OR 37.7 AR 32.8 CA 27.8 DC 22.2 CA 22 SD 22 WA 25.8 FL 19.8 AR 20.3 ID 33.8 MS 36.3 SC 32.7 KS 27.7 OR 22.1 SC 21.8 DE 21.6 NV 25.6 AZ 19.7 NH 18.6 HI 32.5 NV 35.9 TN 29.6 WA 27 IA 21.2 KS 21.2 MT 19.4 IN 25.3 WA 19.5 AL 16.8
WA 31.5 CA 32.5 FL 28.8 MS 26.3 SD 21 MI 21.2 WA 19.1 ID 24.3 IL 18.6 NC 15.8 SC 31.5 NH 31.4 KS 28 OH 25.8 CA 20.5 CO 18.4 VT 18.9 TX 24 UT 17.7 KS 15.3 KS 29.7 WA 30 ME 28 ID 25.7 NH 20 MT 18.3 PA 18.6 MS 23.7 DC 16.7 IA 13.5 TN 28.7 FL 29.4 DC 27.8 NV 25.6 NE 19.7 WV 18.2 OK 17.9 ND 23 OR 14.9 AZ 13.4 IN 28.6 AR 28.9 IN 26.6 SC 21.2 CO 18.9 GA 18.1 FL 17.1 TN 18.5 TN 14.8 IN 12.6 LA 26.1 SC 28.5 IL 25.8 MT 18.3 OH 18 NE 17.5 AZ 16.9 GA 17.6 MI 14.4 FL 12.1 UT 25.3 KS 28.5 VA 22.6 CO 17.9 IN 18 CT 15.4 VA 16.7 NC 14.8 MN 14.2 MT 11.8 OH 24.5 MA 28.4 MS 22.1 AL 15.9 NV 17.9 TX 14.6 TN 16.4 OH 14.1 AL 13.9 MS 11.6 AL 24.5 WI 28.3 MO 21.5 SD 15 MT 17.2 NC 13.4 OH 16.1 WI 12.6 MO 13.2 ND 11.5 GA 24.4 AZ 28.2 WA 21 WY 13.5 FL 14.5 WI 13.1 IL 15.3 OK 11.6 IN 13 VT 10.8 WY 24.3 RI 27.9 OH 20 TX 13.3 MS 14.2 UT 12.7 ID 14.9 MO 10.7 NY 12.2 DE 10.8 TX 23.9 MN 25.4 ID 18.9 GA 13 IL 14 AK 12.5 KS 14.1 UT 10.1 OH 12.1 LA 10.6 ND 23 OH 24.6 AK 18.8 PA 12.3 TN 13.9 TN 12.3 MN 13.7 NH 10 NJ 12 CO 10 FL 21.7 CO 24.2 AZ 18.3 TN 12 VA 13.5 VA 11.5 WI 13.4 NY 8.4 VA 10.3 WA 9.7
MS 21.1 ND 24.1 LA 17.9 DC 11.1 DE 13.5 PA 11.4 OR 13 FL 8 KS 9.9 PA 9.3 WV 20.9 ID 23 PA 16.8 IA 11 MO 13.2 LA 10.9 AR 11.7 VA 7.9 LA 9.7 RI 8.1 OK 20.3 ME 20.8 WY 16.2 VA 10.7 CT 12.3 IL 10.6 IN 11.7 IA 7.7 ID 9.5 HI 7.5 ME 20.2 MO 20.5 NE 15.7 NY 10 NY 12.2 NH 10 WV 10.9 SC 7.3 AR 9.4 NE 7.4 MO 20.1 MT 19.4 MT 15.1 WI 9.8 OK 11.9 OH 10 MO 10.7 LA 6.7 GA 9.3 NJ 7.3
IA 18.6 IA 19.1 WI 14.1 RI 9.3 MN 11.5 IA 9.1 MS 10 ME 6.4 WV 9.1 ME 7.2 NC 18.6 VT 18.9 NJ 14 ME 8.8 PA 11.5 MN 8.9 HI 10 NJ 6.3 MS 8.9 OR 7.1 RI 16.3 WY 16.2 ND 13.8 MO 8.7 VT 10.8 NJ 8.6 KY 10 RI 5.8 NM 8.9 WI 6.9
CO 15.8 MI 15.6 MI 13.4 NH 8.6 TX 10.3 VT 8.1 NY 9.7 MD 5.8 NE 8.7 IL 6.8 SD 13 NC 15.3 KY 12.5 NC 8.5 GA 9.6 WY 8.1 ME 9.6 PA 5.4 WY 8.1 MO 6.7 VA 11.9 DE 13.5 NY 12.2 OR 8.4 NC 9 ND 8 NC 9.6 WY 5.4 PA 7.5 OH 6.4

Table 4 TOP TEN MOST FREQUENTLY CITED DEFICIENCIES BY STATE FOR CERTIFIED FACILITIES
CALENDAR YEAR 1996
FoodSanitation
ComprehensiveAssessments
ComprehensiveCare Plans Accidents Pressure Sores
Quality ofCare
PhysicalRestraints Housekeeping Dignity
UnnecessaryDrugs
OR 10.4 KY 12.1 WV 11.8 FL 8.4 UT 8.9 FL 8 NE 9.6 AL 5.3 CO 7.4 MA 5.6 MD 10.1 DC 11.1 OR 11.7 NE 7 MD 8.2 MS 7.9 NM 8.9 OR 5.2 MD 7.2 DC 5.6 NY 10 OK 10.6 NC 10.7 NM 6.3 LA 8.2 NY 7.7 IA 8.6 CO 4.7 ME 7.2 WV 5.5 PA 9.6 NJ 10.3 OK 10.3 OK 5.8 WY 8.1 AZ 6.3 RI 8.1 MT 4.3 IA 7 UT 5.1 NH 8.6 CT 9.6 TX 9.8 VT 5.4 WI 7.7 DC 5.6 UT 7.6 SD 4 SD 7 KY 5 MN 8.1 LA 9.1 IA 9.1 MN 5.3 HI 7.5 MO 5.1 TX 6.9 NE 3.9 MT 6.5 MN 4.7 MT 7.5 WV 8.2 CO 8.9 LA 4.8 RI 7 AL 4.3 CO 6.8 KY 3.2 OK 6.3 TX 4.7 KY 7.5 GA 7.9 MA 6.4 MD 4.8 MA 6.6 IN 3.7 MD 6.3 MA 2.7 CT 6.1 NY 4.1 NJ 7 TX 6.3 UT 6.3 WV 4.5 NM 6.3 KY 3.2 NJ 5.6 CT 2.6 VT 5.4 VA 2.8 NE 6.6 NE 6.1 NM 6.3 NJ 3 ME 5.6 SD 3 LA 4.8 HI 2.5 WI 5.1 OK 2.1
NM 5.1 VA 5.2 CT 6.1 MA 2.9 ID 5.4 MA 2.7 NH 4.3 MN 1.4 KY 5 MD 1.9 WI 5.1 UT 5.1 RI 5.8 CT 2.6 NJ 4.7 NM 2.5 GA 2.5 NM 1.3 MA 4.6 GA 1.7 CT 3.5 PA 5 MD 5.3 KY 2.5 WV 4.5 ME 2.4 CT 1.8 WV 0.9 TX 4.1 NM 1.3
MA 3.5 NY 4.1 VT 2.7 ND 1.1 AZ 4.2 RI 2.3 AK 0 VT 0 NH 1.4 CT 0.9 VT 0 NM 3.8 MN 2.5 HI 0 KY 3.9 HI 0 DC 0 DE 0 RI 1.2 AK 0 AK 0 MD 2.9 GA 0.6 AK 0 AK 0 OK 0 WY 0 AK 0 AK 0 WY 0 US 22.4 21.5 19.9 16.2 15.1 15 14.2 13.7 12.8 11
Source: Nursing Facilities, Staffing, Residents, and Facility Deficiencies, 1992 Through 1998. Harrington, Carrillo, Thollaug, Summers, Wellin; Department of Socialand Behavioral Science, University of California, January 2000.

Table 5 TOP TEN MOST FREQUENTLY CITED DEFICIENCIES BY STATE FOR CERTIFIED FACILITIES
CALENDAR YEAR 1997Food Sanitation Comprehensive
Assessments Comprehensive
Care Plans Accidents Pressure Sores Quality of Care PhysicalRestraints Housekeeping Dignity
AccidentPrevention
NV 55.3 NV 60.5 HI 57.1 AZ 43.2 AL 52 OR 38.2 NV 50.0 WI 705 WY 41.7 NV 28.9 DC 54.5 HI 59.5 NV 55.3 IN 37.6 DE 45.2 WA 37 ID 27.3 DC 50 CA 38.9 DE 26.2 AZ 53.4 WI 42.1 NH 45.3 IL 33.9 MI 35.5 KS 33.2 CA 25.3 AR 40 NV 34.2 CT 25.7
WY 47.2 ID 32.5 CA 41.1 MI 33.7 WA 31.9 ID 31.2 IN 25.2 AZ 34.7 SC 32 ID 23.4 AR 46.3 NH 32 AL 39.8 DE 31 ND 30.7 NV 28.9 MN 24.5 NV 31.6 WA 29 WA 23.2 SC 44.6 IL 31.9 SC 36.6 UT 30.8 AR 28.6 AK 28.6 AK 21.4 MI 30.3 ND 26.7 OR 23 CA 41.1 OR 30.3 DE 33.3 SD 30.7 NV 23.7 SC 28 SD 20.8 IL 25.7 HI 26.2 MI 22.4 MI 40.9 MN 29.1 WY 33.3 CA 28.8 SC 23.4 MD 26.5 WV 20.5 WA 25.7 NC 24.5 AK 21.4
WA 38.4 AK 28.6 AR 29.8 WA 27.9 KS 23.4 MI 26.4 OK 20.4 CA 25.1 FL 22.7 CA 19.3 ID 36.4 MS 28.4 ME 28.8 AR 24.7 CA 22.6 WV 25.6 AZ 19.5 ID 23.4 MI 18.5 IA 18.7 IL 32 ME 28 AK 28.6 MS 24.4 OH 22.2 CA 24.3 MI 19 TX 22.8 OR 16.4 KS 18.2
AL 31.6 CA 27.7 ID 27.3 KS 23.9 IL 21.5 VA 24.1 VT 18.9 KS 16.8 IN 16.4 PA 17.3 IN 30.7 IN 25 KS 27.2 SC 23.4 ID 19.5 AR 23.5 SC 17.7 GA 16.1 AZ 16.1 OH 15.8 FL 28.5 KY 23.5 FL 24.7 OH 22.7 CT 19.4 DC 22.7 WY 16.7 ND 16 IL 16 MA 14.4
WV 28.2 IA 22.4 IL 24.4 WY 22.2 OR 19.1 CT 22.5 IL 16.5 CO 15.4 UT 14.3 NC 14.2 ND 26.7 WA 21.7 KY 22.3 CO 18.8 MT 18.9 DE 21.4 WI 16.5 MS 13.9 DE 14.3 IL 13.7 UT 26.4 OH 21.6 CT 19 ME 17.6 MS 18.9 IA 19.2 AL 16.3 FL 13.9 AR 12.9 WI 13.5 KS 25.3 AL 21.4 IN 18.8 IA 17.4 NH 17.3 MT 17.9 ND 16 TN 12.6 AL 12.8 NH 13.3 SD 24.8 RI 20.7 VA 18.6 ID 16.9 IA 17 UT 17.6 KS 15.5 RI 12 ID 11.7 IN 12.2 TX 23.9 SC 20 LA 18.4 WI 16.3 HI 16.7 NC 17.4 RI 15.2 SC 11.4 WV 11.5 ND 12 HI 23.8 MA 20 PA 18.3 OR 14.5 FL 15.6 GA 16.7 PA 14.5 OK 11 NY 10 RI 12 LA 21.7 FL 20 ND 17.3 AK 14.3 VA 15.6 ME 16 NM 14.3 NC 10.8 NM 9.5 VA 11.8 GA 21.7 WY 19.4 IA 16.5 AL 13.8 TN 14.4 TX 14.7 AR 14.1 IN 10.6 MN 9.5 AL 11.7 DE 21.4 KS 19 OK 15.7 TX 13.3 WY 13.9 WI 13.8 WA 14.1 MO 10.4 OH 9.3 FL 10.3 OK 20.4 SD 18.8 MO 15 PA 12.3 DC 13.6 PA 13.2 MA 13.2 IA 9.8 KS 9.2 MT 9.5 TN 20.2 OK 18.3 MS 14.4 RI 12 VT 13.5 IL 12.2 FL 12.7 ME 9.6 LA 9.2 SC 9.1 IA 18.7 AR 18 WV 14.1 TN 11.1 TX 12.9 ND 12 OR 12.5 OR 8.6 DC 9.1 NY 9
ME 18.4 WV 16.7 OH 13.2 GA 10.4 MO 12.8 NH 12 OH 12.5 WY 8.3 MO 8.8 TX 8.8 NC 17.4 MO 14.8 WI 13 FL 9.5 IN 12.8 FL 11.6 HI 11.9 NY 8.1 NJ 8.6 VT 8.1 MS 17.4 ND 14.7 AZ 12.7 WV 9 NY 12.6 NE 11.6 KY 11.9 UT 7.7 GA 7.7 SD 7.9 OH 16.4 NJ 14 WA 12.7 NC 8.7 OK 12 IN 11.1 DE 11.9 LA 7.4 MT 7.4 MO 7.8 RI 16.3 MT 13.7 TN 11.7 NE 8.2 NE 11.2 MN 10.1 CO 10.6 AK 7.1 AK 7.1 NJ 7.2
MO 16.1 DC 13.6 OR 11.2 VA 8 CO 11.1 CO 9.6 NY 9.4 KY 6.9 PA 7 GA 7 CO 15.4 TN 13.2 NJ 9.9 NV 7.9 MD 10.7 WY 8.3 IA 9.1 OH 6.2 VA 6.8 MD 6.5 AK 14.3 CO 13 NM 9.5 KY 7.7 PA 10.7 VT 8.1 TX 8.4 MD 6 TX 6.8 KY 6.5 MD 13 CT 11.5 TX 9.4 MO 7.3 RI 9.8 NY 7.7 NJ 7.5 SD 5.9 WI 6.5 NE 5.6

Table 5 TOP TEN MOST FREQUENTLY CITED DEFICIENCIES BY STATE FOR CERTIFIED FACILITIES
CALENDAR YEAR 1997Food Sanitation Comprehensive
Assessments Comprehensive
Care Plans Accidents Pressure Sores Quality of Care PhysicalRestraints Housekeeping Dignity
AccidentPrevention
OR 11.8 NC 11.3 DC 9.1 HI 7.1 LA 8.9 OH 7.3 MO 7.5 NH 5.3 IA 6.4 WV 5.1 PA 11.2 AZ 10.2 SD 8.9 NY 6.6 WI 8.8 TN 7.3 ME 7.2 PA 4.3 CO 6.3 AR 5.1 KY 10.4 LA 8 NE 7.3 OK 6.5 GA 8.7 MO 7.1 NC 6.9 NJ 3.8 KY 6.2 DC 4.5 VA 9.3 NM 6.3 MA 6.6 LA 5.9 KY 7.7 AL 7.1 NE 6.4 MT 3.2 MS 5.5 MS 4 NH 8 VT 5.4 NY 5.6 MD 5.1 MA 7.6 MS 7 VA 5.5 WV 2.6 NH 5.3 NM 3.2 NE 8.6 GA 5.7 CO 5.8 MT 5.3 WV 7.7 HI 7.1 MT 6.3 NM 3.2 VT 5.4 ME 4 WI 7.5 DE 4.8 MD 5.6 DC 4.5 MN 7.2 NJ 6.5 MS 5 MN 2.6 TN 5.3 LA 3 NY 6.8 TX 4.6 MI 4.2 MN 3.9 SD 6.9 AZ 5.9 TN 5 CT 2.4 ME 4.8 CO 2.9 MT 6.3 MI 4.2 NC 4.2 ND 2.7 UT 6.6 RI 5.4 DC 4.5 HI 2.4 OK 4.7 WY 2.8 NJ 5.5 NE 3.4 RI 3.3 NH 2.7 NC 5.8 SD 5 CT 4.3 VA 2.1 NE 4.3 MN 2.8 VT 5.4 NY 2.4 VT 2.7 VT 2.7 ME 5.6 LA 4.7 NH 4 MA 1.7 MD 4.2 TN 1.8
NM 4.8 PA 2.3 MT 2.1 MA 2.5 NJ 5.1 KY 4.6 LA 3 NE 1.3 CT 4 AZ 1.7 MA 3.4 MD 1.4 UT 1.1 NJ 2.1 NM 4.8 MA 1.1 GA 2.7 AL 0.5 SD 3 OK 0.3 MN 3.1 UT 1.1 GA 1 NM 1.6 AZ 3.4 OK 0.8 MD 2.3 DE 0 MA 2.6 UT 0 CT 2.4 VA 0.8 MN 0.8 CT 1.2 AK 0 NM 0 UT 1.1 VT 0 RI 2.2 HI 0 US 21.8 17.3 17.1 16.6 16.1 14.4 13.5 13.3 13.2 11.9
Source: Nursing Facilities, Staffing, Residents, and Facility Deficiencies, 1992 Through 1998. Harrington, Carrillo, Thollaug, Summers, Wellin; Department of Socialand Behavioral Science, University of California, January 2000.
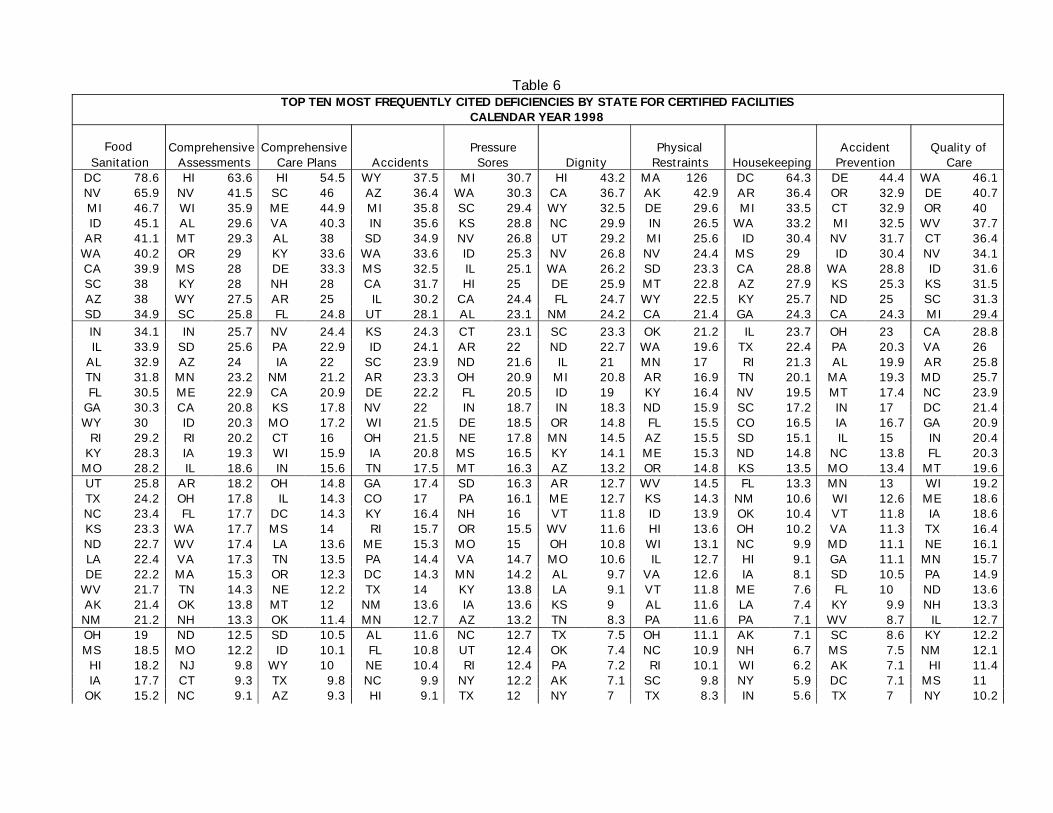
Table 6TOP TEN MOST FREQUENTLY CITED DEFICIENCIES BY STATE FOR CERTIFIED FACILITIES
CALENDAR YEAR 1998
Food Sanitation
Comprehensive Assessments
Comprehensive Care Plans Accidents
Pressure Sores Dignity
Physical Restraints Housekeeping
Accident Prevention
Quality of Care
DC 78.6 HI 63.6 HI 54.5 WY 37.5 MI 30.7 HI 43.2 MA 126 DC 64.3 DE 44.4 WA 46.1 NV 65.9 NV 41.5 SC 46 AZ 36.4 WA 30.3 CA 36.7 AK 42.9 AR 36.4 OR 32.9 DE 40.7MI 46.7 WI 35.9 ME 44.9 MI 35.8 SC 29.4 WY 32.5 DE 29.6 MI 33.5 CT 32.9 OR 40 ID 45.1 AL 29.6 VA 40.3 IN 35.6 KS 28.8 NC 29.9 IN 26.5 WA 33.2 MI 32.5 WV 37.7
AR 41.1 MT 29.3 AL 38 SD 34.9 NV 26.8 UT 29.2 MI 25.6 ID 30.4 NV 31.7 CT 36.4 WA 40.2 OR 29 KY 33.6 WA 33.6 ID 25.3 NV 26.8 NV 24.4 MS 29 ID 30.4 NV 34.1 CA 39.9 MS 28 DE 33.3 MS 32.5 IL 25.1 WA 26.2 SD 23.3 CA 28.8 WA 28.8 ID 31.6 SC 38 KY 28 NH 28 CA 31.7 HI 25 DE 25.9 MT 22.8 AZ 27.9 KS 25.3 KS 31.5 AZ 38 WY 27.5 AR 25 IL 30.2 CA 24.4 FL 24.7 WY 22.5 KY 25.7 ND 25 SC 31.3 SD 34.9 SC 25.8 FL 24.8 UT 28.1 AL 23.1 NM 24.2 CA 21.4 GA 24.3 CA 24.3 MI 29.4 IN 34.1 IN 25.7 NV 24.4 KS 24.3 CT 23.1 SC 23.3 OK 21.2 IL 23.7 OH 23 CA 28.8 IL 33.9 SD 25.6 PA 22.9 ID 24.1 AR 22 ND 22.7 WA 19.6 TX 22.4 PA 20.3 VA 26
AL 32.9 AZ 24 IA 22 SC 23.9 ND 21.6 IL 21 MN 17 RI 21.3 AL 19.9 AR 25.8 TN 31.8 MN 23.2 NM 21.2 AR 23.3 OH 20.9 MI 20.8 AR 16.9 TN 20.1 MA 19.3 MD 25.7 FL 30.5 ME 22.9 CA 20.9 DE 22.2 FL 20.5 ID 19 KY 16.4 NV 19.5 MT 17.4 NC 23.9
GA 30.3 CA 20.8 KS 17.8 NV 22 IN 18.7 IN 18.3 ND 15.9 SC 17.2 IN 17 DC 21.4 WY 30 ID 20.3 MO 17.2 WI 21.5 DE 18.5 OR 14.8 FL 15.5 CO 16.5 IA 16.7 GA 20.9
RI 29.2 RI 20.2 CT 16 OH 21.5 NE 17.8 MN 14.5 AZ 15.5 SD 15.1 IL 15 IN 20.4 KY 28.3 IA 19.3 WI 15.9 IA 20.8 MS 16.5 KY 14.1 ME 15.3 ND 14.8 NC 13.8 FL 20.3
MO 28.2 IL 18.6 IN 15.6 TN 17.5 MT 16.3 AZ 13.2 OR 14.8 KS 13.5 MO 13.4 MT 19.6 UT 25.8 AR 18.2 OH 14.8 GA 17.4 SD 16.3 AR 12.7 WV 14.5 FL 13.3 MN 13 WI 19.2 TX 24.2 OH 17.8 IL 14.3 CO 17 PA 16.1 ME 12.7 KS 14.3 NM 10.6 WI 12.6 ME 18.6 NC 23.4 FL 17.7 DC 14.3 KY 16.4 NH 16 VT 11.8 ID 13.9 OK 10.4 VT 11.8 IA 18.6 KS 23.3 WA 17.7 MS 14 RI 15.7 OR 15.5 WV 11.6 HI 13.6 OH 10.2 VA 11.3 TX 16.4 ND 22.7 WV 17.4 LA 13.6 ME 15.3 MO 15 OH 10.8 WI 13.1 NC 9.9 MD 11.1 NE 16.1 LA 22.4 VA 17.3 TN 13.5 PA 14.4 VA 14.7 MO 10.6 IL 12.7 HI 9.1 GA 11.1 MN 15.7 DE 22.2 MA 15.3 OR 12.3 DC 14.3 MN 14.2 AL 9.7 VA 12.6 IA 8.1 SD 10.5 PA 14.9
WV 21.7 TN 14.3 NE 12.2 TX 14 KY 13.8 LA 9.1 VT 11.8 ME 7.6 FL 10 ND 13.6 AK 21.4 OK 13.8 MT 12 NM 13.6 IA 13.6 KS 9 AL 11.6 LA 7.4 KY 9.9 NH 13.3 NM 21.2 NH 13.3 OK 11.4 MN 12.7 AZ 13.2 TN 8.3 PA 11.6 PA 7.1 WV 8.7 IL 12.7 OH 19 ND 12.5 SD 10.5 AL 11.6 NC 12.7 TX 7.5 OH 11.1 AK 7.1 SC 8.6 KY 12.2 MS 18.5 MO 12.2 ID 10.1 FL 10.8 UT 12.4 OK 7.4 NC 10.9 NH 6.7 MS 7.5 NM 12.1 HI 18.2 NJ 9.8 WY 10 NE 10.4 RI 12.4 PA 7.2 RI 10.1 WI 6.2 AK 7.1 HI 11.4 IA 17.7 CT 9.3 TX 9.8 NC 9.9 NY 12.2 AK 7.1 SC 9.8 NY 5.9 DC 7.1 MS 11
OK 15.2 NC 9.1 AZ 9.3 HI 9.1 TX 12 NY 7 TX 8.3 IN 5.6 TX 7 NY 10.2

Table 6TOP TEN MOST FREQUENTLY CITED DEFICIENCIES BY STATE FOR CERTIFIED FACILITIES
CALENDAR YEAR 1998
Food Sanitation
Comprehensive Assessments
Comprehensive Care Plans Accidents
Pressure Sores Dignity
Physical Restraints Housekeeping
Accident Prevention
Quality of Care
PA 13.5 CO 9 UT 9 MD 8.8 VT 11.8 SD 7 NY 8 MO 5.4 NE 7 UT 10.1 NE 13.5 VT 8.8 WA 8.5 MT 8.7 TN 11.5 MD 7 IA 7.9 WY 5 NH 6.7 AL 9.7 WI 12.1 DE 7.4 NJ 8.2 MO 8.4 LA 10.9 GA 6.9 NM 7.6 MN 4.7 AR 6.4 TN 9.5 CO 11.3 AK 7.1 AK 7.1 OR 8.4 OK 10.8 NJ 6.9 CO 7.5 MT 4.3 NY 6.3 RI 9 ME 9.3 DC 7.1 MI 6.6 AK 7.1 NM 10.6 WI 6.4 DC 7.1 CT 4 AZ 6.2 NJ 7.2 MT 8.7 KS 6.8 NC 6 ND 6.8 CO 10.4 CO 6.1 NE 6.5 AL 3.7 WY 5 OH 6.5 NY 8.1 NE 6.5 VT 5.9 LA 6.5 MA 10.3 MS 6 MO 5.8 MD 3.5 NJ 4.9 MO 6.4 NH 8 LA 6.2 MD 5.8 OK 6.4 MD 9.9 VA 5.6 MS 5 OR 3.2 NM 4.5 CO 6.1 NJ 7.2 NM 6.1 ND 4.5 NY 5.9 GA 9.7 MT 5.4 NJ 4.6 NE 3 RI 4.5 AZ 5.4 OR 7.1 MI 5.6 WV 4.3 NH 5.3 WI 8.5 NE 5.2 TN 4 VT 2.9 TN 3.7 LA 3.5 MN 6.7 GA 5.1 CO 4.2 CT 4.4 WY 7.5 RI 4.5 UT 3.4 WV 2.9 CO 3.3 VT 2.9 VA 6.5 PA 4.3 MA 2.9 NJ 4.2 DC 7.1 IA 4.3 LA 3.2 NJ 2.9 OK 2.4 MA 2.7 VT 5.9 TX 3.9 NY 2 VT 2.9 NJ 5.9 CT 4 CT 3.1 UT 2.2 HI 2.3 OK 2.4
MD 5.8 MD 2.3 MN 1.2 WV 2.9 ME 4.2 MA 4 GA 3.1 VA 0.9 LA 2.1 SD 2.3 MA 5.2 UT 2.2 GA 1.1 MA 2.3 WV 2.9 NH 1.3 NH 2.7 MA 0.2 ME 1.7 AK 0 CT 3.6 NY 1.3 RI 1.1 VA 2.2 AK 0 DC 0 MD 1.2 DE 0 UT 1.1 WY 0
23.7 15.1 15.2 18 17.1 14.1 12.7 14.4 14.7 17.2Source: Nursing Facilities, Staffing, Residents, and Facility Deficiencies, 1992 Through 1998. Harrington, Carrillo, Thollaug, Summers, Wellin; Department of Socialand Behavioral Science, University of California, January 2000.

Table 7
Citation Definitions
Citation F-Tag Definition
Accidents F323 Providers must ensure the facility is free from hazards that would cause anaccident.
Accident Prevention F324 Residents receive adequate supervision and assistive devices to prevent accidents.
Comprehensive Assessments F272 Assessment of a resident’s needs such as routine, cognitive patterns,communication, vision, mood and behavior patterns, phsychosocial well being,physical functioning and structural problems, continence, disease diagnosis, dentaland nutritional status, medications, special treatments, discharge potential.
Comprehensive Care Plans F279 Development of a comprehensive care plan for each resident that includesmeasurable objectives and timetables to meet a resident's medical, nursing andmental psychosocial needs that are identified in the assessment.
Dignity F241 Assistance is to be provided to residents for grooming, dressing appropriately anddining. Staff should act and speak respectfully.
Food Sanitation F371 Storing, preparing, and serving food must be done in a sanitary way to preventfood- borne illnesses.
Housekeeping F253 Providers must maintain a sanitary, orderly and comfortable setting.
Physical Restraints F221 Mechanical devices, materials, or equipment that restricts freedom of movement ornormal access to one’s body. Restrains are not to be used for discipline orconvenience or to treat medical symptoms.
Pressure Sores F314 Providers must try to prevent residents without pressure sores from developingthem.
Quality of Care F312 Residents who are not capable must be provided assistance with grooming andpersonal hygiene.
Unnecessary Drugs F329 Drugs used in excessive doses, for excessive duration, without monitoring, or usedin the presence of adverse consequences.
Source: Code of Federal Regulations. Government Printing Office Web Page: www.access.gpo.gov