Nursing Education Programs - California Community...
38
A P R I L 2 0 1 0 Nursing Education Programs California Community Colleges Chancellor’s Office Jack Scott, Chancellor Prepared by the Economic Development and Workforce Preparation Division and the Office of Communications
-
Upload
trinhthien -
Category
Documents
-
view
221 -
download
0
Transcript of Nursing Education Programs - California Community...
A P R I L 2 0 1 0
Nursing EducationPrograms
California Community Colleges Chancellor’s Office
Jack Scott, Chancellor
Prepared by the Economic Development and Workforce Preparation Division and the Office of Communications


STATE OF CALIFORNIA JACK SCOTT, CHANCELLOR
CALIFORNIA COMMUNITY COLLEGES CHANCELLOR’S OFFICE 1102 Q STREET SACRAMENTO, CA 95811-6549 (916) 445-8752 http://www.cccco.edu
April 28, 2010
The Honorable Arnold Schwarzenegger
Governor of California
State Capitol
Sacramento, California 95814
Dear Governor Schwarzenegger:
I am pleased to present to you the California Community Colleges legislative report
on nursing education programs.
This report includes information about the allocation of funds, the additional
number of students served over the course of several years, completion rates, funds
used to purchase equipment, and the number of new and existing faculty receiving
annual stipend awards. The report highlights the number of students taking
assessment tests prior to enrolling in the nursing programs, the results of the tests,
and various demographic and enrollment information. Finally, the report includes
information about federal funding that was recently received through the Workforce
Investment Act (WIA).
If you have questions or comments, please contact Morgan Lynn, executive vice
chancellor, for programs, at (916) 445-1774 or [email protected].
Again, it is my pleasure to provide you with this report.
Sincerely,
Jack Scott, Ph.D.
Chancellor
cc: Members of the California State Legislature
Mike Genest, Director, Department of Finance
Mac Taylor, Legislative Analyst
José Millan, Vice Chancellor

Nursing Education Programs 2 0 0 9 | 1
Nursing Education Programs Executive Summary The California Community Colleges serve more than 2.9 million students each year and is the largest system of higher education in the nation. The state’s 112 community colleges are charged with providing workforce training, basic skills education, and preparing students to transfer to four-year universities.
Seventy-five California community colleges operate registered nursing programs, enrolling a statewide total of 13,057 full-time-equivalent students (FTES)1. Enrollments have increased by about 44.7 percent over the last four to five years due to the development of new programs, expansion of enrollment capacity through partnerships with the healthcare industry, and federal and state funded programs and grants. This report presents information on supplemental funding provided to the community colleges for nursing and allied health programs in 2009-10. It also includes a summary report on Nursing Program Support provided in the Budget Act of 2009 to expand community college nursing enrollments and to improve student retention (required by Provision (23) of Item 6870-101-0001 of the Budget Act of 2009).
1 Board of Registered Nursing Annual School Report 2008-09 and Chancellor’s Office enrollment data.
Table of Contents
Executive Summary Page 1
Reporting Requirements Page 3 Overview of Funding Page 5
Key Findings Page 7
Tables Page 12

2 | California Community Colleges Chancellor’s Office
Nursing Education Programs 2 0 0 9 | 3
Reporting Requirements Education Code Section 78261, Subdivisions (g) says: “As a condition of receiving grant funds pursuant to paragraph (2) of subdivision (d), each recipient district shall report to the Chancellor's Office the following data for the academic year on or before a date determined by the Chancellor's Office:
(1) The number of students enrolled in the nursing program. (2) The number of students taking diagnostic assessments. (3) The number of students failing to meet proficiency levels as determined by diagnostic assessment tools. (4) The number of students failing to meet proficiency levels that undertake preentry preparation classes. (5) The number of students who successfully complete pre-entry preparation coursework. (6) The average number of months between initial diagnostic assessment, demonstration of readiness, and enrollment in the nursing program for students failing to meet proficiency standards on the initial diagnostic assessment. (7) The average number of months between diagnostic assessment and program enrollment for students meeting proficiency standards on the initial diagnostic assessment. (8) The number of students who completed the associate degree nursing program and the number of students who pass the National Council Licensure Examination.
In subdivision (h) of Education Code Section 78261, the reporting requirements continue:
(1) Data reported to the chancellor under this article shall be disaggregated by age, gender, ethnicity, and language spoken at home. (2) The Chancellor's Office shall compile and provide this information to the Legislature and the governor by March 1 of each year.”

4 | California Community Colleges Chancellor’s Office
Nursing Education Programs 2 0 0 9 | 5
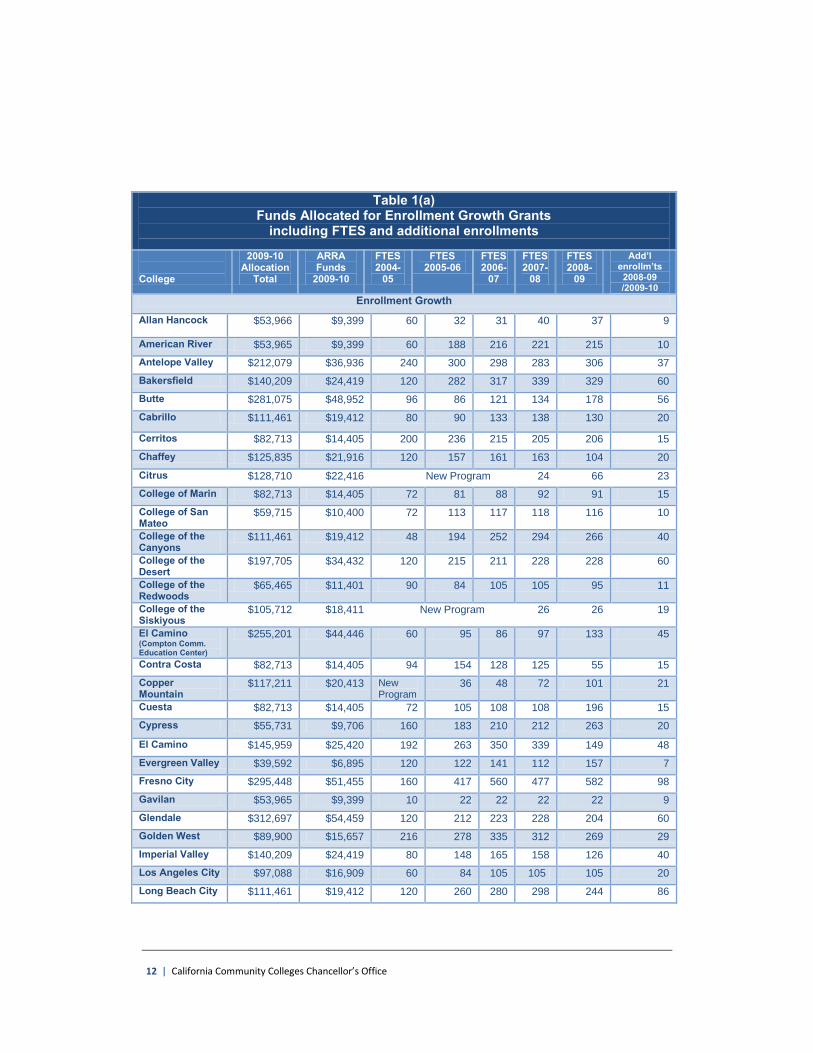
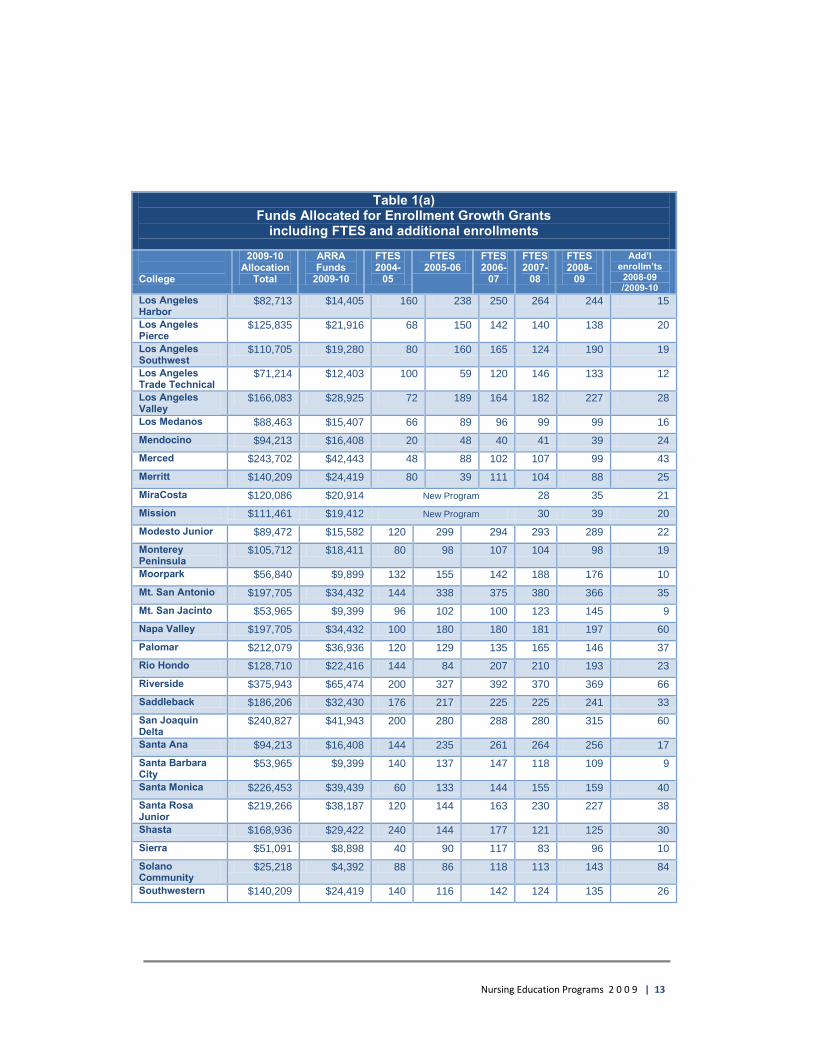
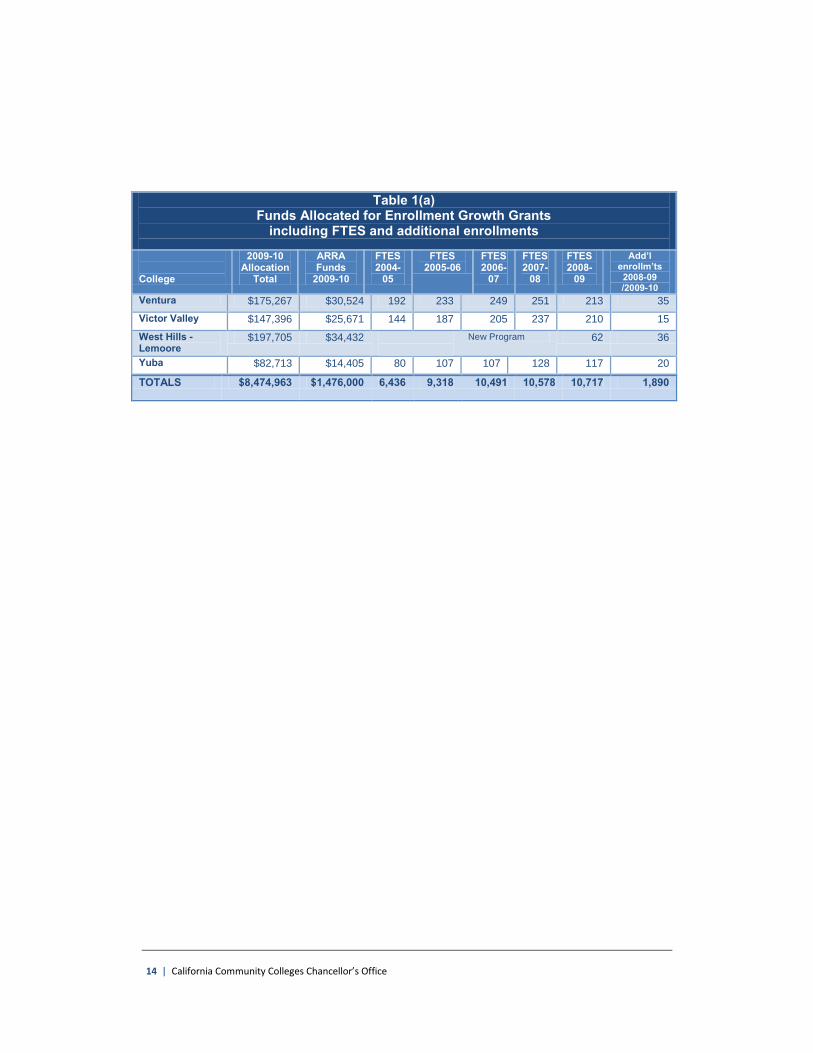
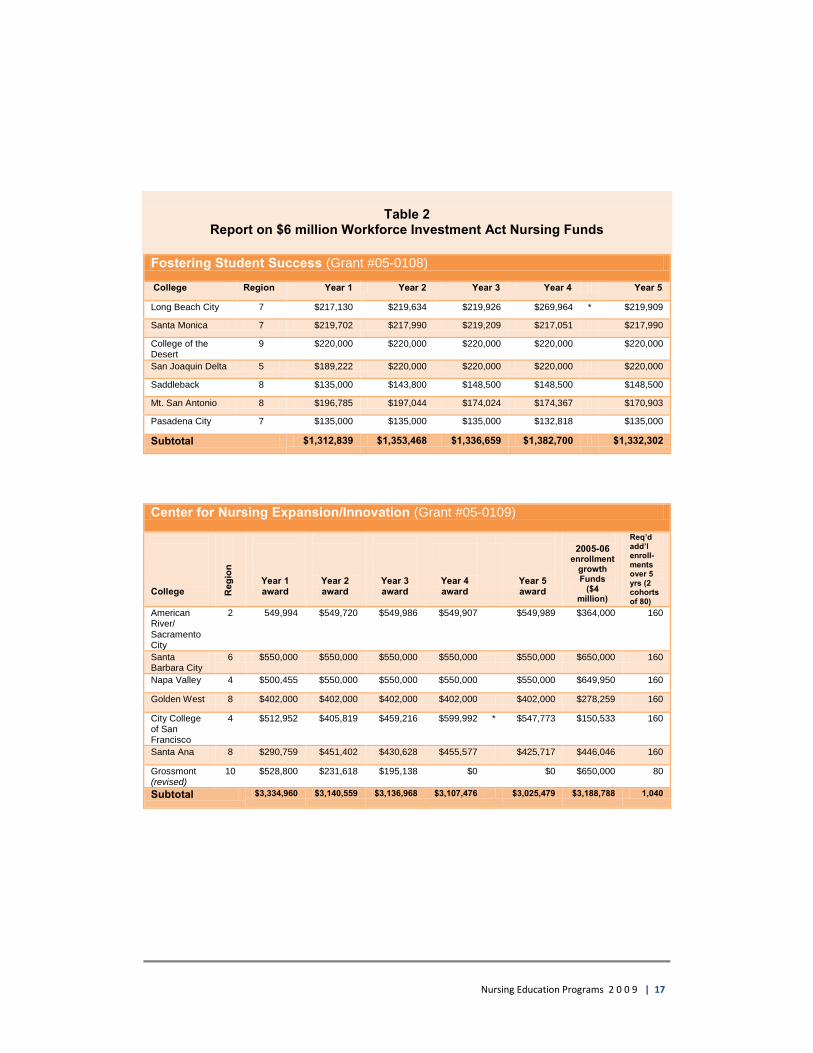
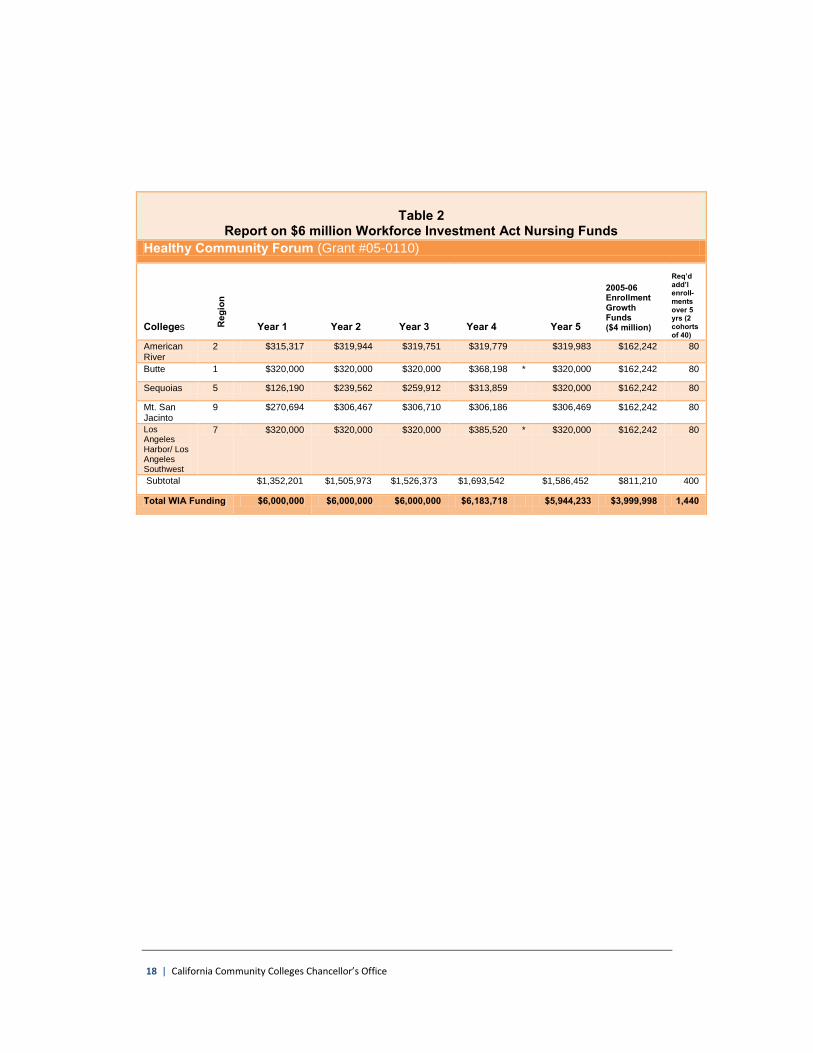
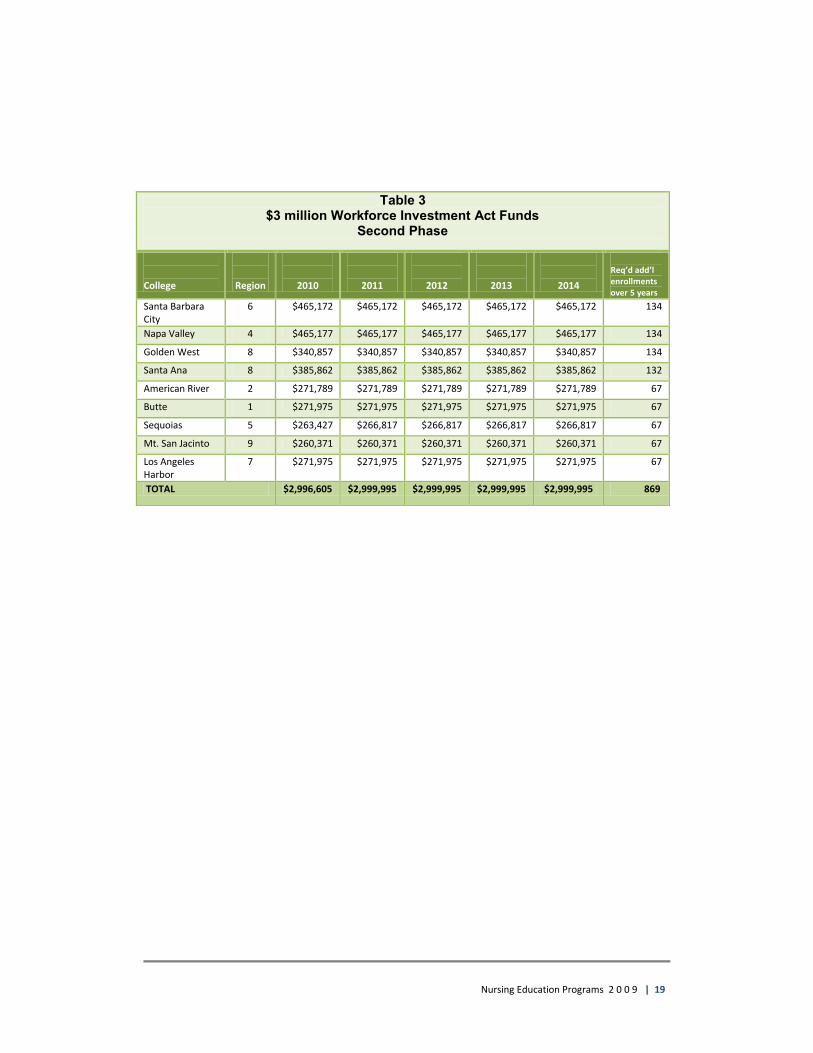
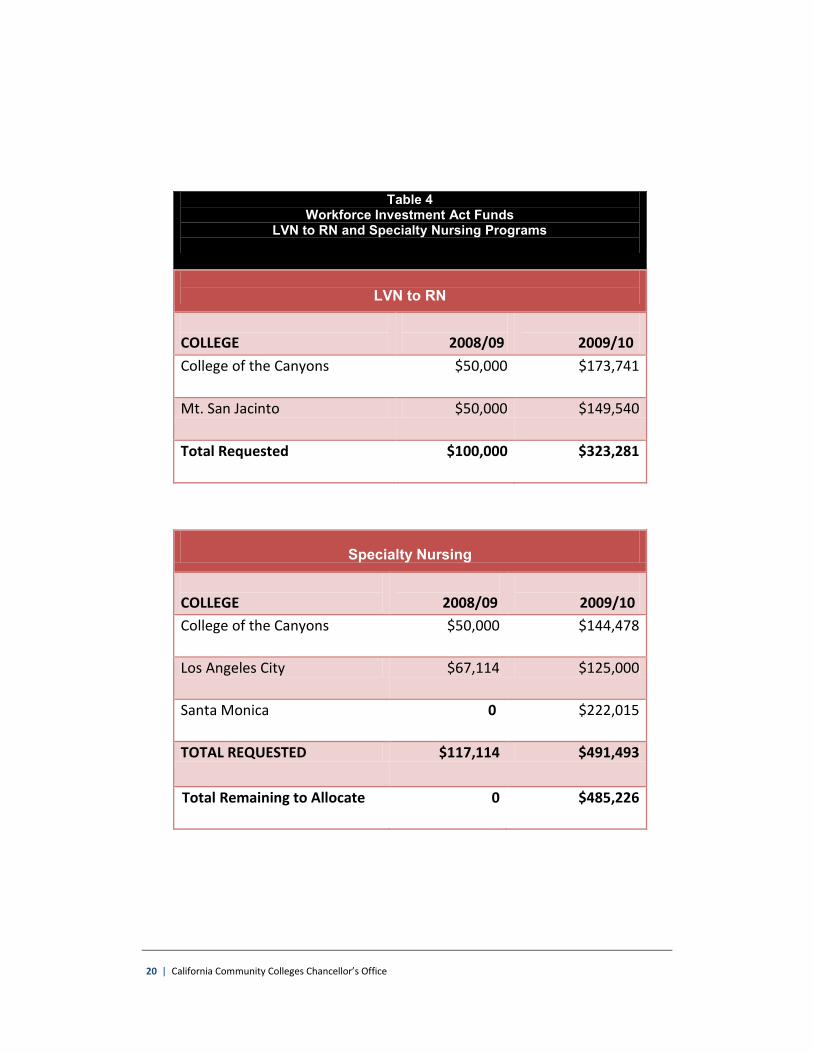
Overview of Funding Nursing The overview of funding is detailed on tables beginning on page 12. A list of the colleges that received funding for the 2009-10 fiscal year, the amount received, and the number of full-time equivalent students served in the 2004-05, 2005-06, 2006-07, 2007-08, and 2008-09 academic years is provided on Table 1a. The reduced funding for the 2009-10 fiscal year will primarily be used to enable those additional students enrolled in the two year program beginning in 2008-09 until the students complete the program in 2009-10. The 2008-09 additional enrollment numbers are provided. The Budget Act of 2009 provided approximately $13.4 million of Proposition 98 funds to be allocated as follows: $8.5 million to further expand community college nursing slots, and $4.9 million to provide diagnostic and support services to reduce student attrition. These funds are described further in Tables 1a -1b. Six million dollars a year ($30 million over five years) in federal Workforce Investment Act (WIA) funds were provided for the Governor's Nurse Education Initiative (NEI). Grants were awarded to 18 colleges in order to lower nursing attrition rates, increase nursing faculty, expand public/private partnerships to develop additional nursing education capabilities, and to expand nursing slots (by 1,440 FTES). Table 2 lists the colleges receiving these funds along with dollar amounts and slots created. These projects were funded for a five-year period and are in the fifth year of funding. In January 2010, the Chancellor's Office received an additional $3 million in Workforce Investment Act funds to continue nine of the original NEI grants to maintain 869 of the original expansion slots. Table 3 lists colleges receiving these funds along with the dollar amounts and number of additional slots maintained. In addition, the Chancellor's Office received a total of $1.5 million in WIA to fund an increase in enrollment slots in licensed vocational nursing to registered nursing and to add specialty nursing programs. Specialty nursing programs enhance the nursing skills that new graduates and current registered nurses
6 | California Community Colleges Chancellor’s Office
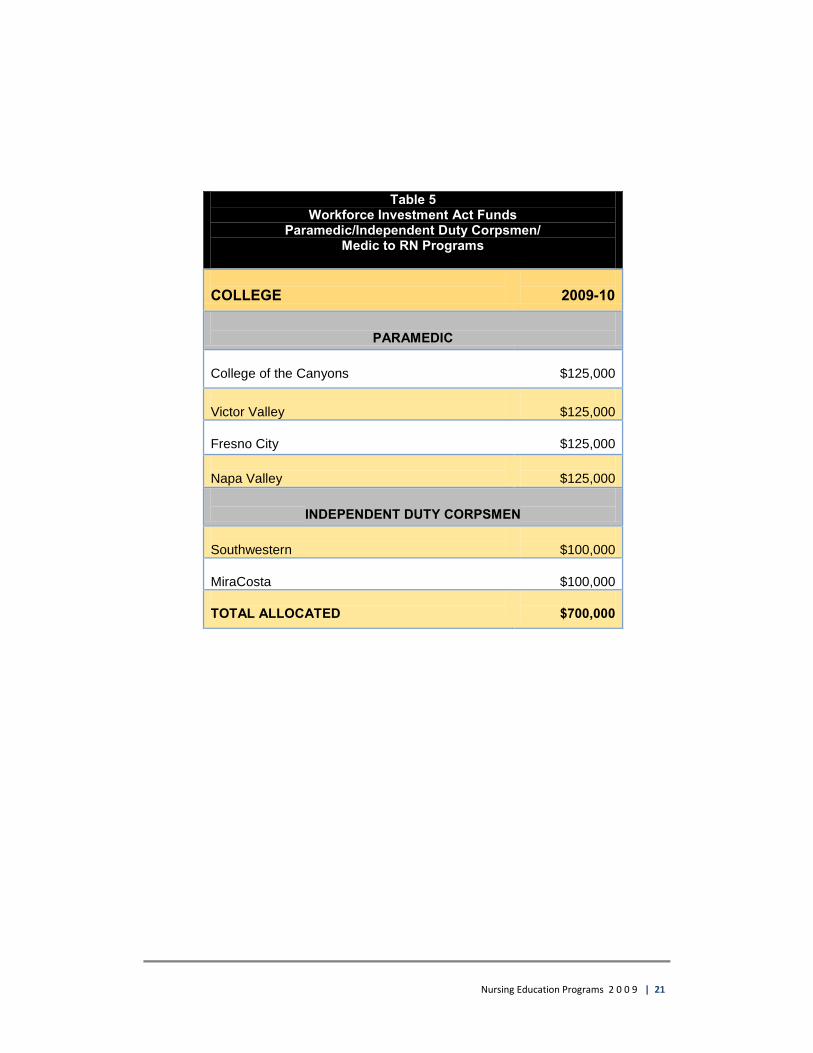
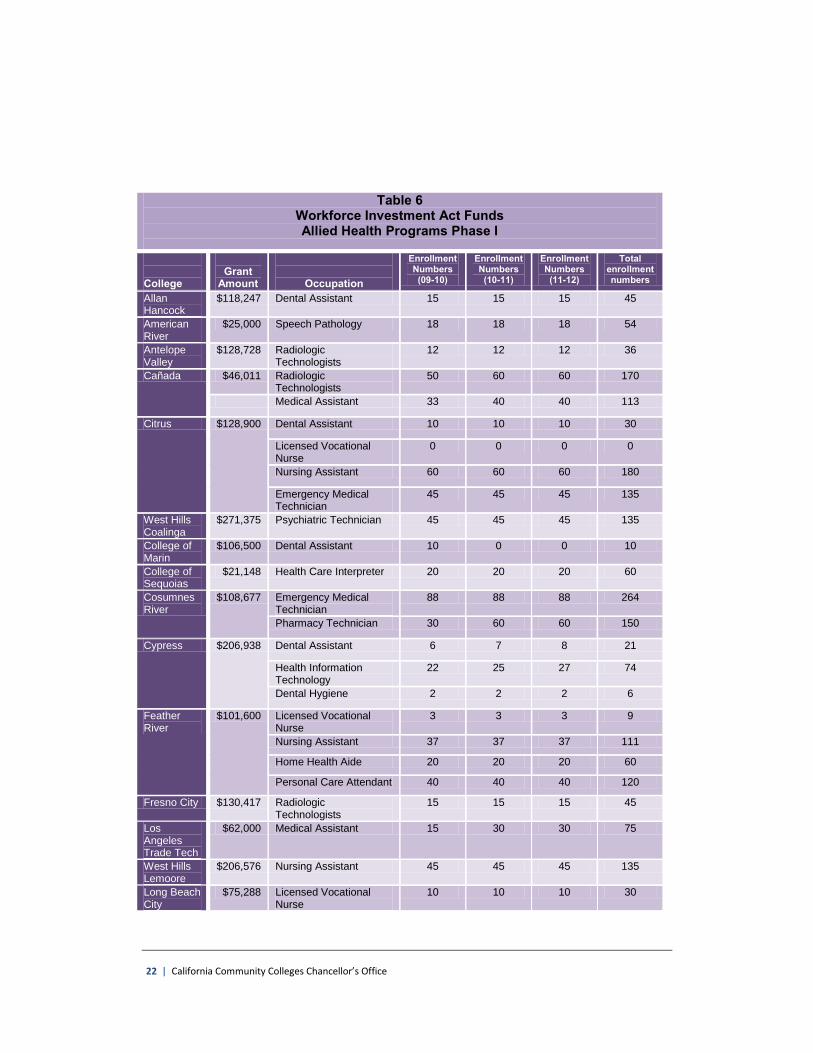
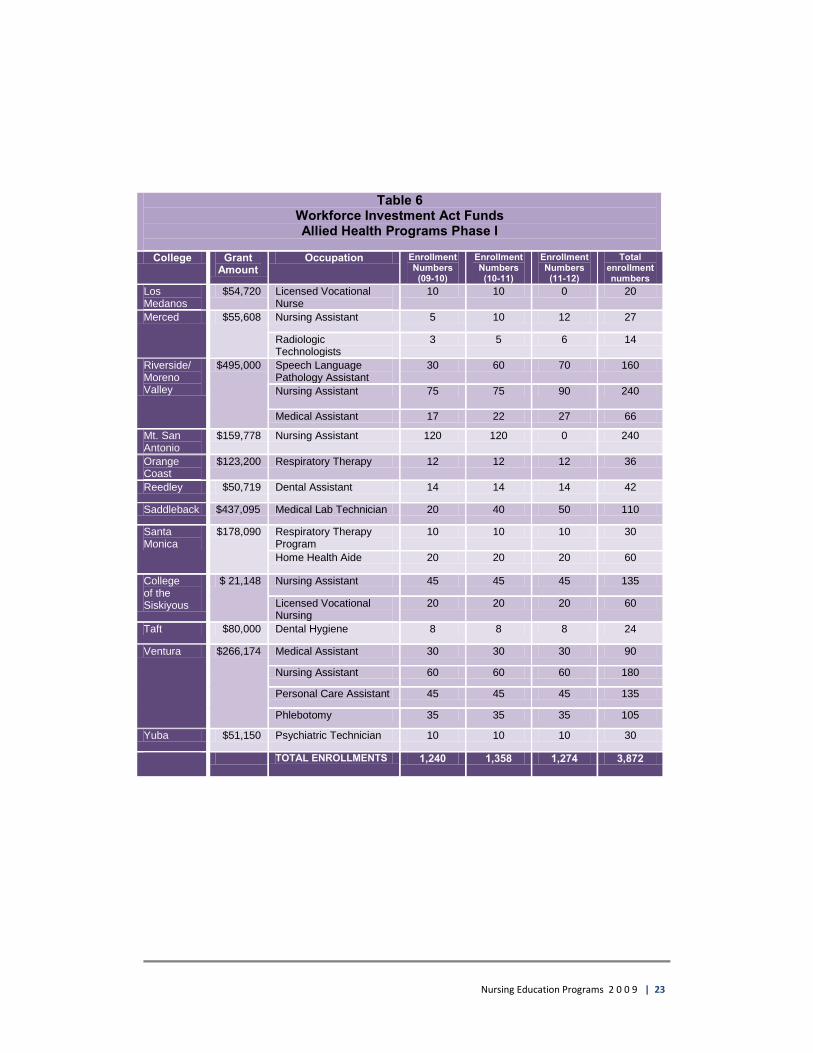
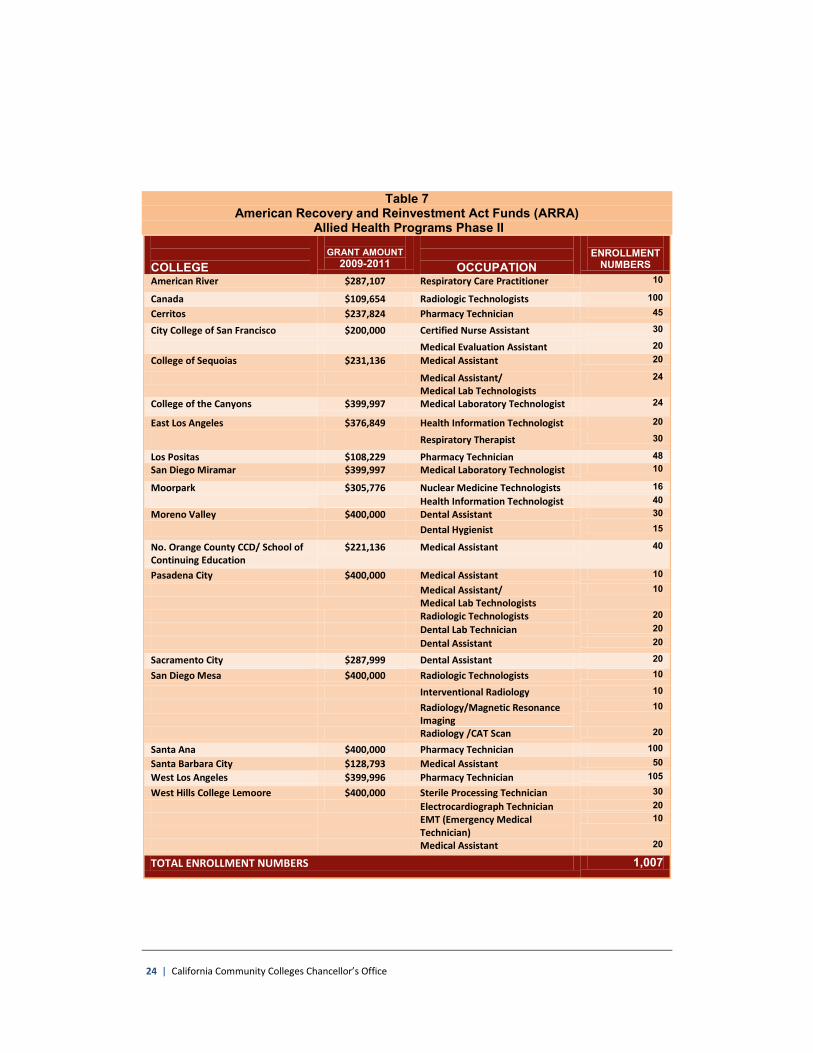
have in the areas of critical care, emergency department, and maternal-child nursing, medical-surgical, as well as in other areas. A competitive grant process in underway to complete the awarding of these funds. Table 4 provides a current list of the colleges who received these funds and the award amount. A feasibility study has been completed through the Chancellor’s Office examining the academic criteria of a bridge program for paramedics to enter into com-munity college RN programs with academic credit for training and experience. The Chancellor’s Office received $800,000 in Workforce Investment Act funds to implement paramedic to RN programs in California. Table 5 provides the colleges that received grants in the fall of the 2009 to implement these programs. Allied Health In the spring of 2009, the Chancellor's Office received $8 million in federal Workforce Investment Act Funds, to be distributed over three fiscal years, for expansion of allied health programs. Twenty-six colleges were funded for a total increase in enrollments of 3,872 students. Table 6 displays the colleges, funding amounts for the first year and the number of additional students to be enrolled over the course of the grants. During the summer of 2009, $6 million of American Recovery and Reinvestment Act Funds (ARRA) were received for expansion of allied health programs. Nine-teen colleges were funded for a total of 1,007 additional students over the next two years. Table 7 displays the colleges and programs funded with ARRA funds. It is important to note the length of time it takes to complete an allied health programs can be different than registered nursing programs, which are two years or four semesters in length. Licensed vocational nursing to RN programs are in general two to three semesters in length. Allied health programs can be short term certificate programs (nurse assistant or home health aide), lasting eight weeks, to associate degree programs (radiology or respiratory technology) lasting two years and anywhere in between. Some specialty upgrade programs can be much shorter, lasting only a matter of days. Consequently, some programs will have the ability to enroll more than one cohort of students in a semester or given period of time and thus have greater output during the timeframe of the grant.
Nursing Education Programs 2 0 0 9 | 7
Key Findings The Budget Act of 2009 directed the Chancellor’s Office to report on the award of grants funded by the $13.4 million provided in the act. These funds were awarded to colleges who participated in a competitive process in the spring of 2008 for a two year cycle of enrollment expansion which began in the fall of 2008, and will complete in June 2010. Below is summary information that addresses the specific areas (numbered) required by the Budget Act of 2009. In addition, Table 1 provides data by college on the funds that have been awarded.
1. Amount of Funding Received Funds were awarded based on a competitive process that was conducted in the spring of 2008 for projects to be conducted during 2008-09 and 2009-10. The Chancellor’s Office awarded funds to all colleges that applied. The following is a description of the grants that were awarded:
Enrollment Growth for Nursing: Sixty-three colleges received grants to expand enrollments. Please note that $4 million of the funds for these grants comes from the funds first provided by the Statutes of 2001, Chapter 514 (AB 87, Jackson). The numbers displayed in the table reflect potential reduced enrollments based on the reduction in funds. In addition, some colleges requested additional funds to expand enrollments in the second year of the two year cycle, however, that was not possible this year because of the reduction.
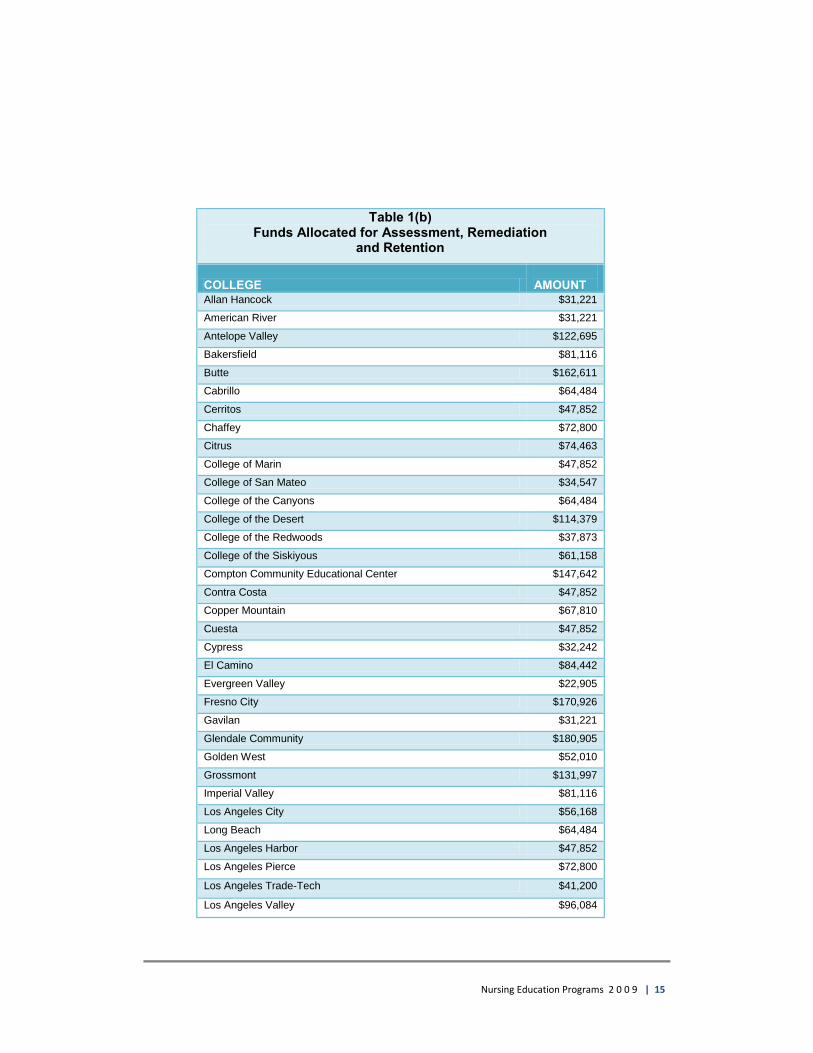
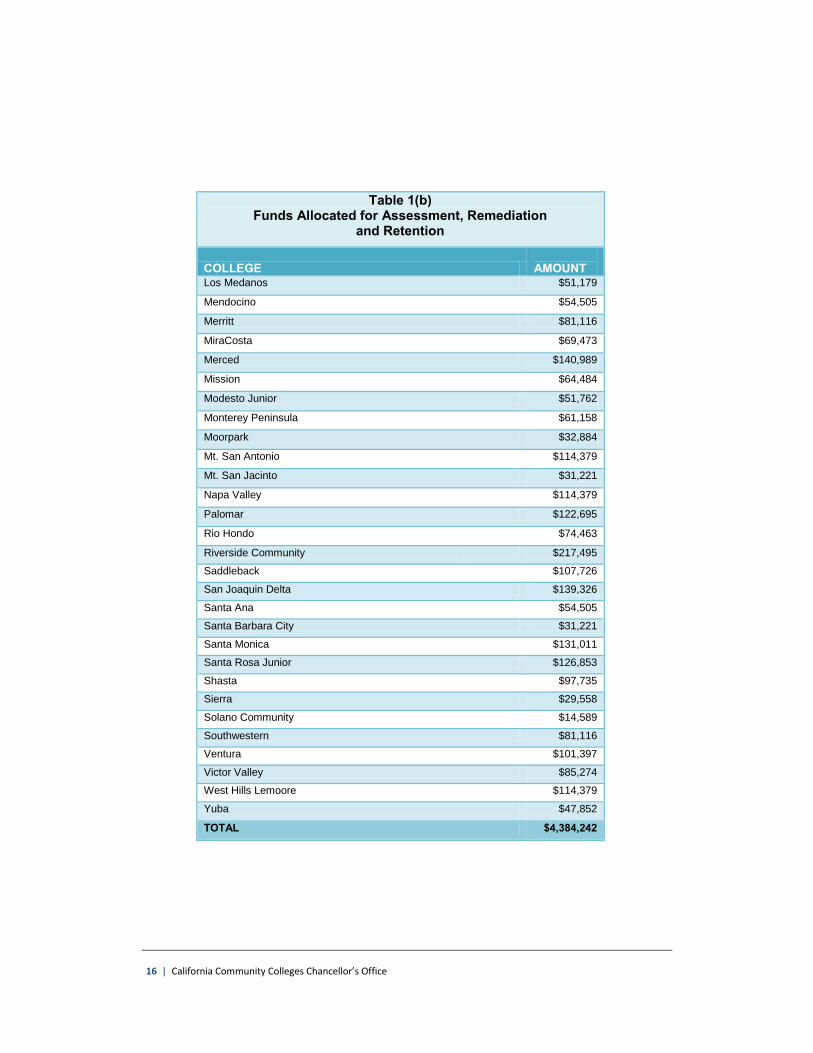
Assessment, Remediation and Retention Funds: During 2009-10, 63 colleges received grants for diagnostic and support services, pre-entry coursework, and other services to reduce attrition. Table 1 provides a list of the colleges receiving funds for this purpose. Table 8 provides a list of all community college nursing programs and their respective attrition rates as reported to the Board of Registered Nursing for the 2008-09 Annual School Report. This item is also discussed in number 3.
8 | California Community Colleges Chancellor’s Office
2. Number of nursing FTES before and after grants awarded Fify-seven of the 63 colleges receiving nursing grants for enrollment growth had 6,436 nursing FTES in 2004-05. Six colleges have new programs that have started since 2004-05. As a condition of receiving grant funds, the 63 colleges will maintain nearly 2,000 nursing slots (FTES) statewide this year. Colleges normally receive $5,700 for each additional student they enroll. $8.4 million will maintain an additional enrollment growth of about 1,474 slots. Fourteen million dollars will maintain an enrollment growth of about 2,450 slots.
Two college nursing programs under development with 2007-08 funds will add about 50 additional slots in one year, provided their schools will continue to support the program.
3. District Attrition and Completion Rates The Chancellor’s Office used data reported by the colleges to the Board of Registered Nursing to determine the attrition rate for each college program. Data was collected on students who were scheduled, on admission, to complete the program between August 1, 2008, and July 31, 2009. These students have benefitted from the specific retention activities that were funded with grant funds beginning in spring 2007. The attrition data is presented in Table 8. Attrition rates were calculated by using the following data reported by the colleges:
Total number of students scheduled, on admission, to complete the program between August 1, 2008, and July 31, 2009.
The number of students who dropped out of the program or were disqualified are subtracted from this number.
The number of students who completed the program on time, or who are still enrolled in the program remain.
Attrition = the total number of students enrolled in a cohort less those that dropped out. Table 8 shows the percentage of those that completed on time, the percentage of those still enrolled, and the percentage of those that dropped out.
Nursing Education Programs 2 0 0 9 | 9
4. Equipment/Infrastructure Purchases For the 2008-09 fiscal year funds colleges reported expenditures of $715,190 for capital outlay (equipment and related costs). Funding in 2009-10 is intended to cover the costs of instruction and the development of assessment, remediation and retention programs. During the first two quarters of the 2009-10 fiscal year, colleges did not report any expenditures for capital outlay (equipment and related costs).
5. Number of New and Existing Faculty Receiving Annual Stipend Awards In 2006-07 the Chancellor’s Office conducted a competitive grant process to award the funds designated for annual stipend awards. Eighteen colleges are participating in these grants.In 2009-10, 17 new full-time faculty have been hired. Ninety-one full-time faculty within their first five years of teaching nursing will receive stipend awards this year. Fifty-eight existing faculty and twenty-two new faculty will receive annual stipend awards for teaching evening and weekend clinical assignments.
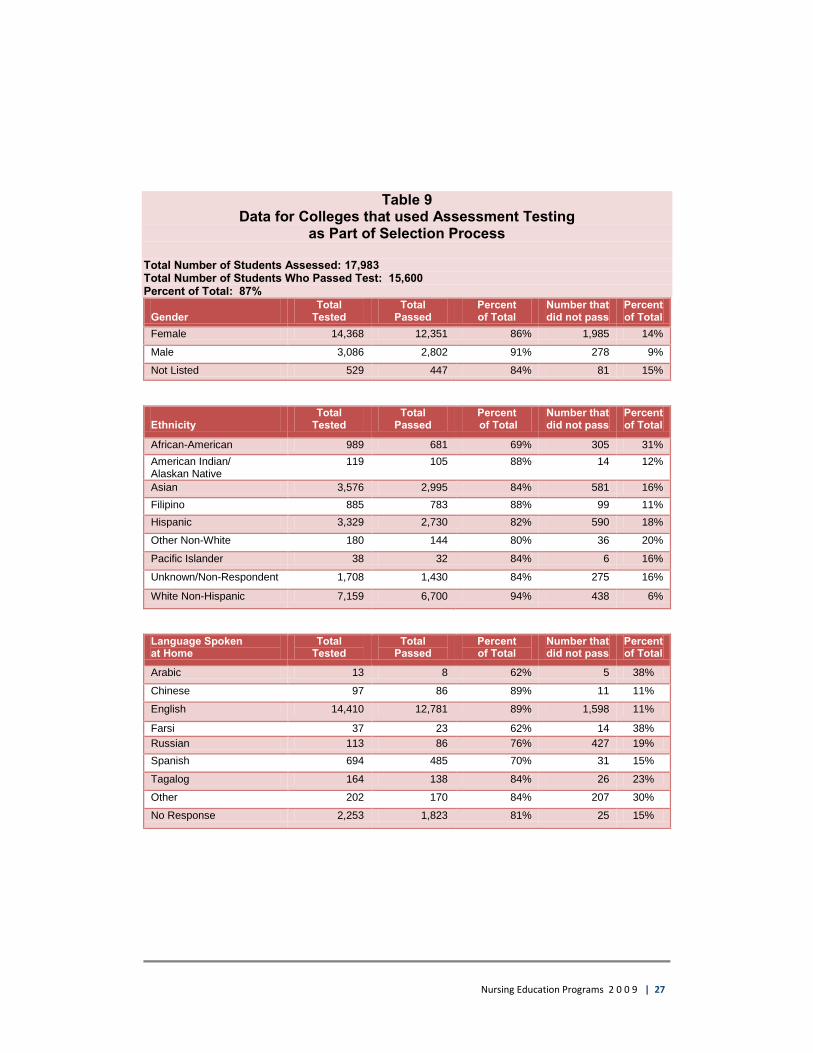
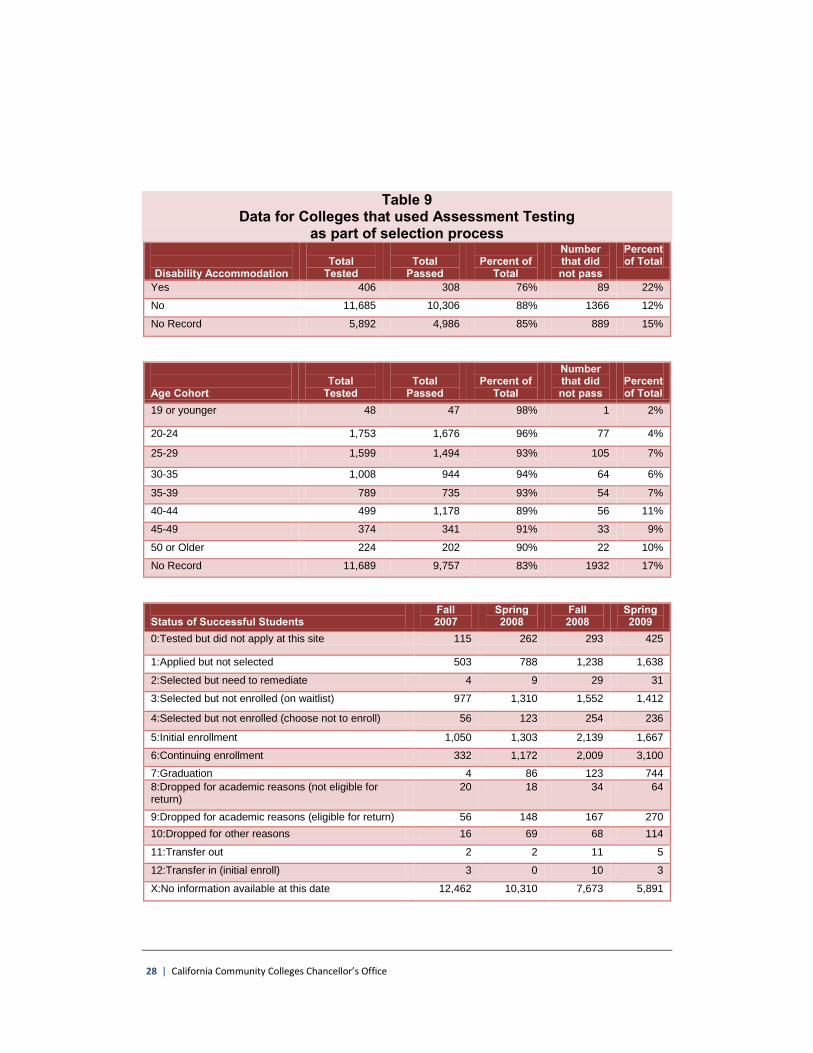
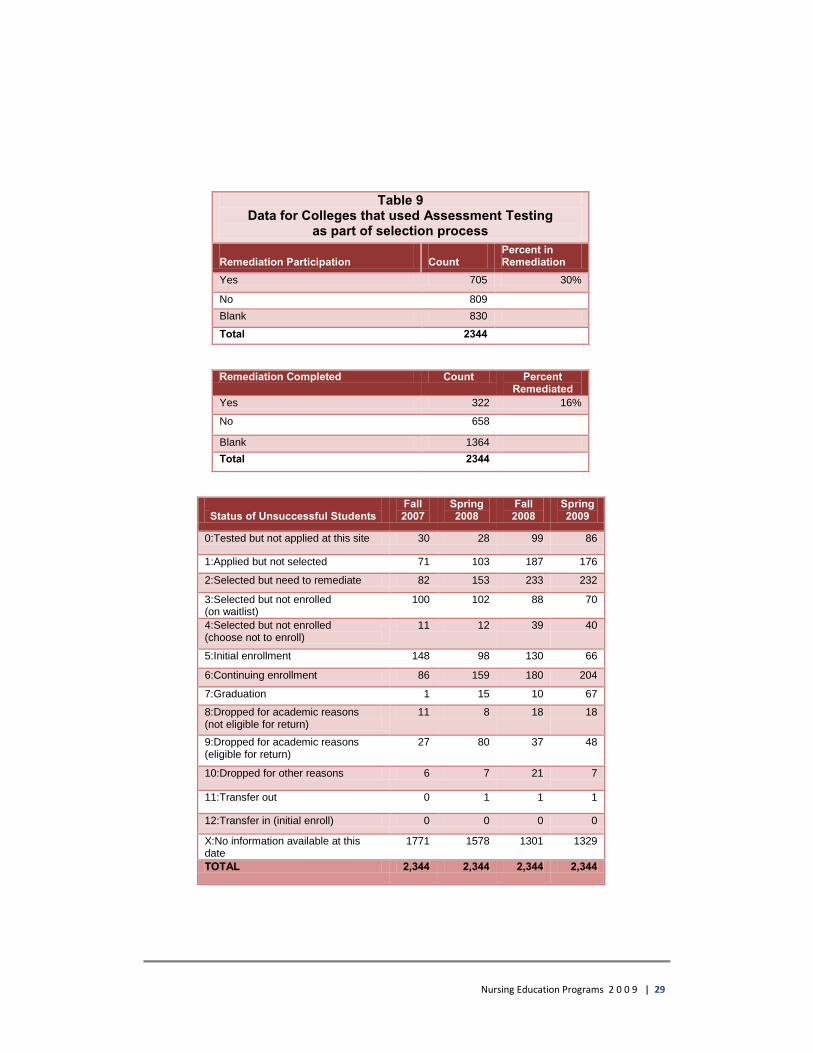
6. Data Required by SB 1309, Statutes of 2006 SB 1309 (Stats. 2006, Chap. 837) requires the Chancellor’s Office to collect and report data from colleges receiving grants on the results of assessment testing for students as a condition of enrollment. Colleges were required to provide remediation to those students who did not achieve a statewide score. The Chancellor’s Office worked with assessment vendors and colleges to collect the data in subsection (g). The vendors provided information on exam results, gender, ethnicity, and age for students from 59 colleges. The colleges were to provide information on remediation and enrollment. Table 9 provides the collated data that answers those questions that are not reported in other areas of this document. The effort at collecting this data suggests that it is a difficult process for the colleges to provide the data requested.
10 | California Community Colleges Chancellor’s Office
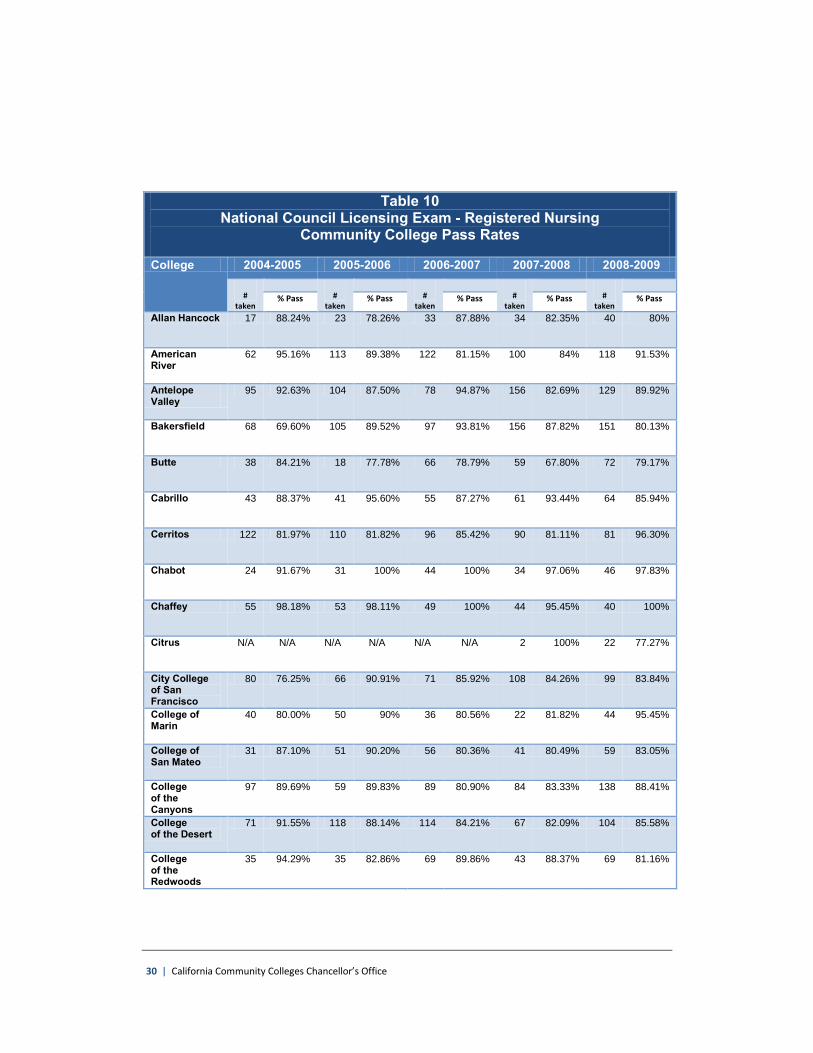
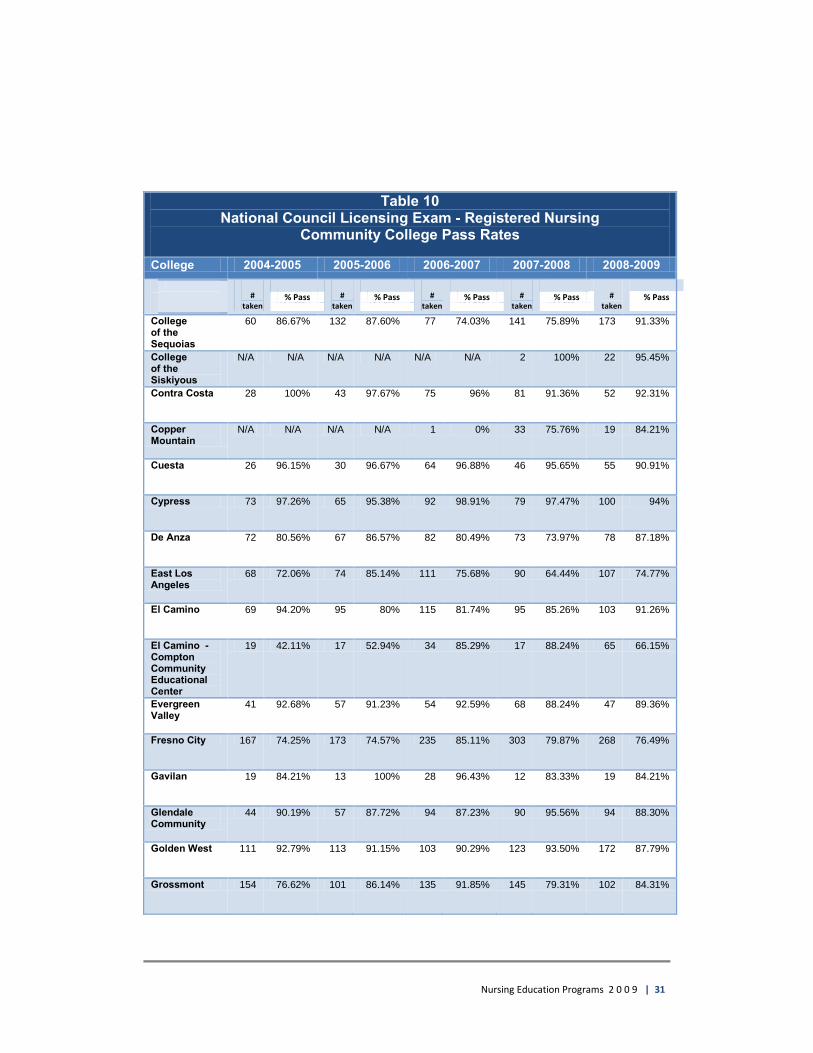
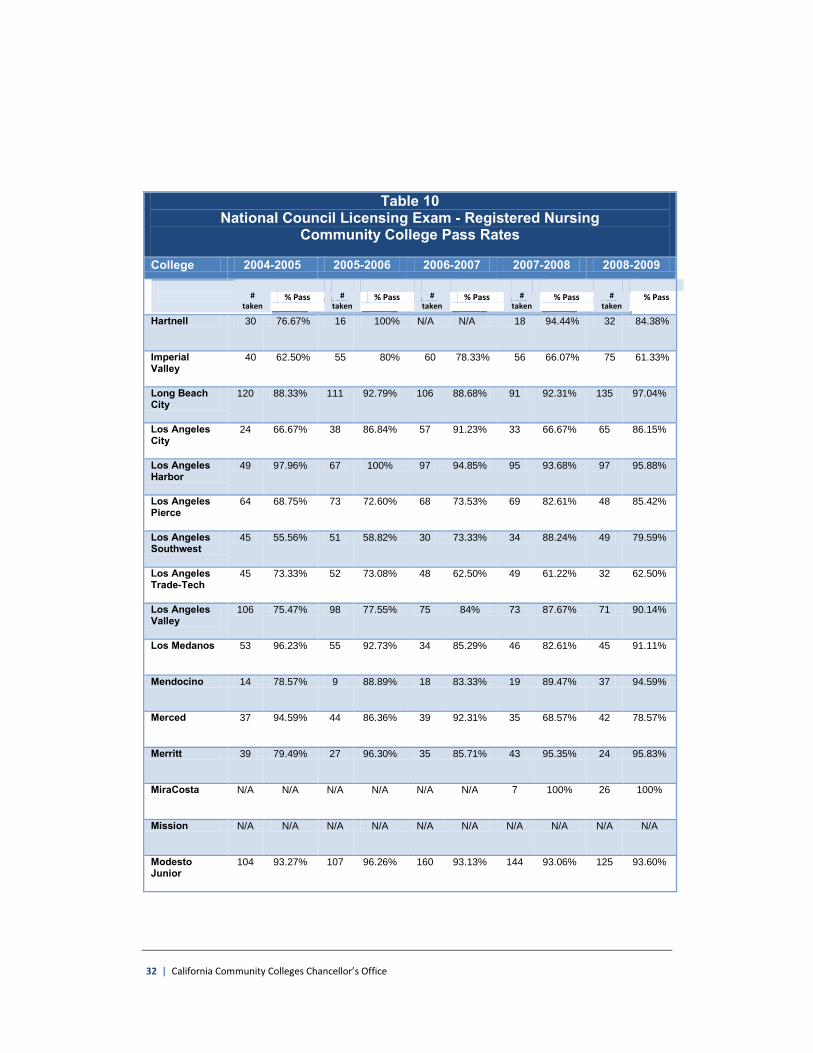
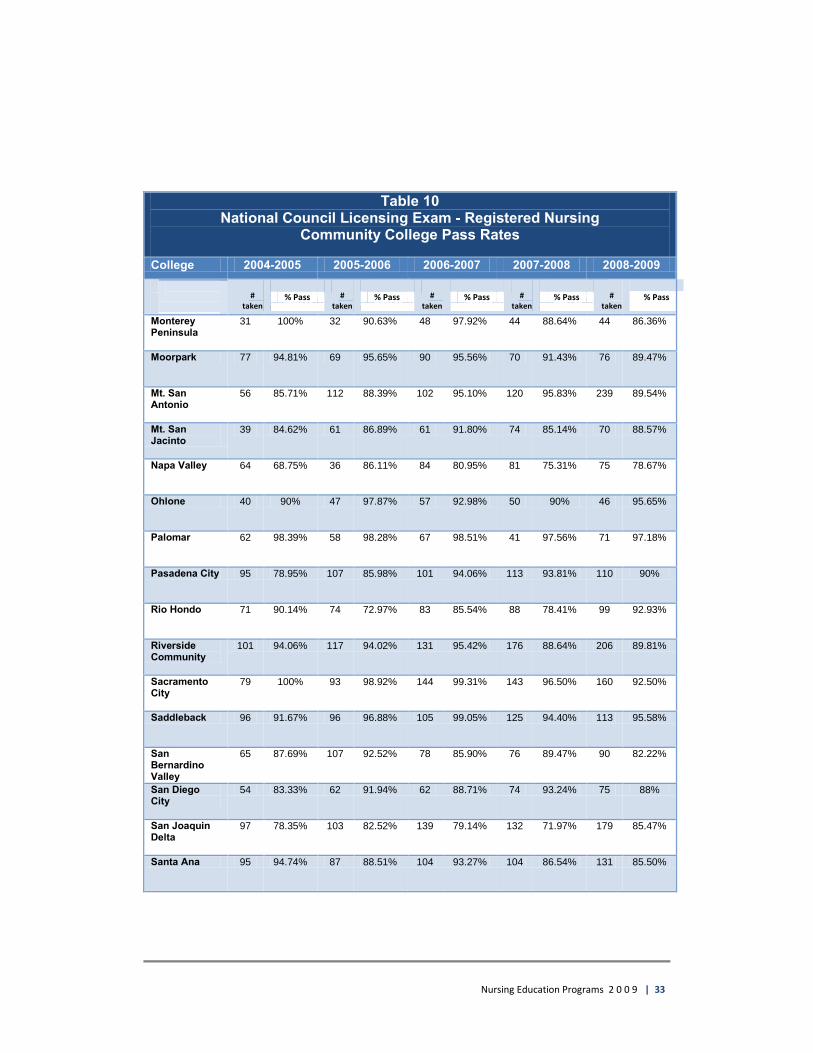
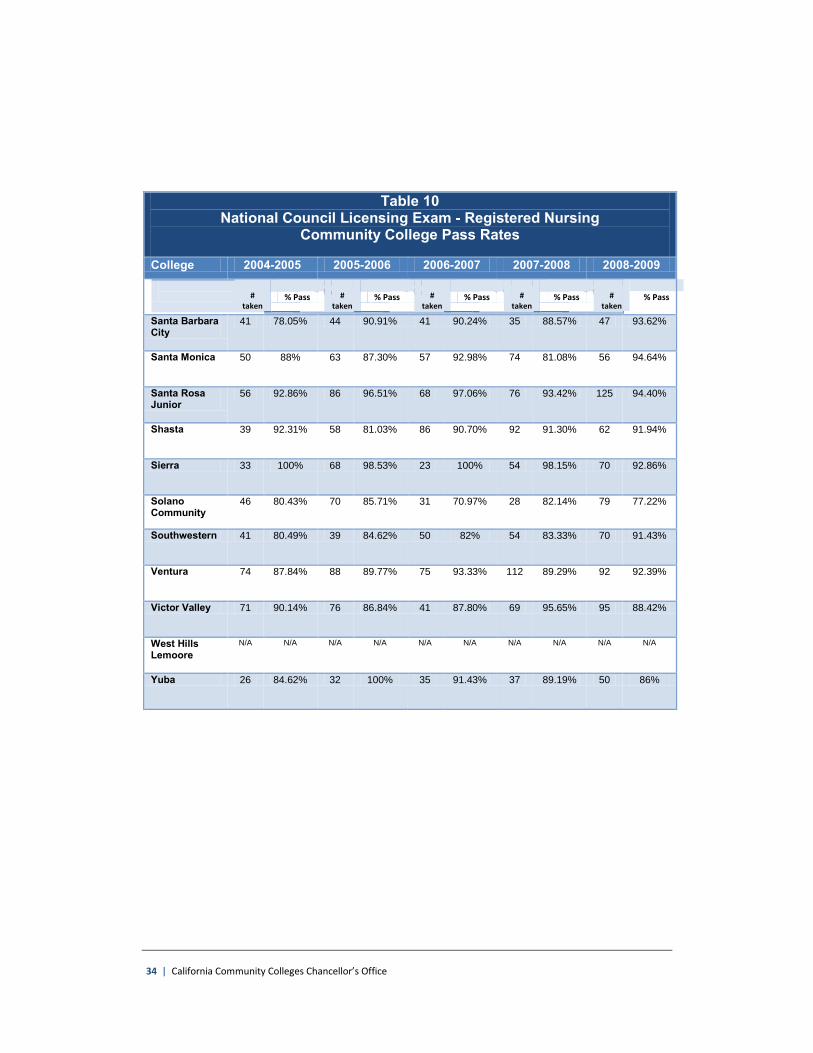
In addition, this data reflects students who received assessment testing beginning January 2007, or later through June 2009, thus insufficient time has passed to collect data on some of the variables. Also, subsections (g)(6) and (7) are difficult to assess given the magnitude of the data to be collected over time. In response to subsection (g)(8) below, Table 10 lists the colleges, the number of students from the college that took the licensure exam, and the pass rate from 2004-05 through 2008-09.

Nursing Education Programs 2 0 0 9 | 11
12 | California Community Colleges Chancellor’s Office
Table 1(a) Funds Allocated for Enrollment Growth Grants
including FTES and additional enrollments
College
2009-10 Allocation
Total
ARRA Funds
2009-10
FTES 2004-
05
FTES 2005-06
FTES 2006-
07
FTES 2007-
08
FTES 2008-
09
Add’l enrollm’ts 2008-09 /2009-10
Enrollment Growth
Allan Hancock $53,966 $9,399 60 32 31 40 37 9
American River $53,965 $9,399 60 188 216 221 215 10
Antelope Valley $212,079 $36,936 240 300 298 283 306 37
Bakersfield $140,209 $24,419 120 282 317 339 329 60
Butte $281,075 $48,952 96 86 121 134 178 56
Cabrillo $111,461 $19,412 80 90 133 138 130 20
Cerritos $82,713 $14,405 200 236 215 205 206 15
Chaffey $125,835 $21,916 120 157 161 163 104 20
Citrus $128,710 $22,416 New Program 24 66 23
College of Marin $82,713 $14,405 72 81 88 92 91 15
College of San Mateo
$59,715 $10,400 72 113 117 118 116 10
College of the Canyons
$111,461 $19,412 48 194 252 294 266 40
College of the Desert
$197,705 $34,432 120 215 211 228 228 60
College of the Redwoods
$65,465 $11,401 90 84 105 105 95 11
College of the Siskiyous
$105,712 $18,411 New Program 26 26 19
El Camino (Compton Comm. Education Center)
$255,201 $44,446 60 95 86 97 133 45
Contra Costa $82,713 $14,405 94 154 128 125 55 15
Copper Mountain
$117,211 $20,413 New Program
36 48 72 101 21
Cuesta $82,713 $14,405 72 105 108 108 196 15
Cypress $55,731 $9,706 160 183 210 212 263 20
El Camino $145,959 $25,420 192 263 350 339 149 48
Evergreen Valley $39,592 $6,895 120 122 141 112 157 7
Fresno City $295,448 $51,455 160 417 560 477 582 98
Gavilan $53,965 $9,399 10 22 22 22 22 9
Glendale $312,697 $54,459 120 212 223 228 204 60
Golden West $89,900 $15,657 216 278 335 312 269 29
Imperial Valley $140,209 $24,419 80 148 165 158 126 40
Los Angeles City $97,088 $16,909 60 84 105 105 105 20
Long Beach City $111,461 $19,412 120 260 280 298 244 86
Nursing Education Programs 2 0 0 9 | 13
Table 1(a) Funds Allocated for Enrollment Growth Grants
including FTES and additional enrollments
College
2009-10 Allocation
Total
ARRA Funds
2009-10
FTES 2004-
05
FTES 2005-06
FTES 2006-
07
FTES 2007-
08
FTES 2008-
09
Add’l enrollm’ts 2008-09 /2009-10
Los Angeles Harbor
$82,713 $14,405 160 238 250 264 244 15
Los Angeles Pierce
$125,835 $21,916 68 150 142 140 138 20
Los Angeles Southwest
$110,705 $19,280 80 160 165 124 190 19
Los Angeles Trade Technical
$71,214 $12,403 100 59 120 146 133 12
Los Angeles Valley
$166,083 $28,925 72 189 164 182 227 28
Los Medanos $88,463 $15,407 66 89 96 99 99 16
Mendocino $94,213 $16,408 20 48 40 41 39 24
Merced $243,702 $42,443 48 88 102 107 99 43
Merritt $140,209 $24,419 80 39 111 104 88 25
MiraCosta $120,086 $20,914 New Program 28 35 21
Mission $111,461 $19,412 New Program 30 39 20
Modesto Junior $89,472 $15,582 120 299 294 293 289 22
Monterey Peninsula
$105,712 $18,411 80 98 107 104 98 19
Moorpark $56,840 $9,899 132 155 142 188 176 10
Mt. San Antonio $197,705 $34,432 144 338 375 380 366 35
Mt. San Jacinto $53,965 $9,399 96 102 100 123 145 9
Napa Valley $197,705 $34,432 100 180 180 181 197 60
Palomar $212,079 $36,936 120 129 135 165 146 37
Rio Hondo $128,710 $22,416 144 84 207 210 193 23
Riverside $375,943 $65,474 200 327 392 370 369 66
Saddleback $186,206 $32,430 176 217 225 225 241 33
San Joaquin Delta
$240,827 $41,943 200 280 288 280 315 60
Santa Ana $94,213 $16,408 144 235 261 264 256 17
Santa Barbara City
$53,965 $9,399 140 137 147 118 109 9
Santa Monica $226,453 $39,439 60 133 144 155 159 40
Santa Rosa Junior
$219,266 $38,187 120 144 163 230 227 38
Shasta $168,936 $29,422 240 144 177 121 125 30
Sierra $51,091 $8,898 40 90 117 83 96 10
Solano Community
$25,218 $4,392 88 86 118 113 143 84
Southwestern $140,209 $24,419 140 116 142 124 135 26
14 | California Community Colleges Chancellor’s Office
Table 1(a) Funds Allocated for Enrollment Growth Grants
including FTES and additional enrollments
College
2009-10 Allocation
Total
ARRA Funds
2009-10
FTES 2004-
05
FTES 2005-06
FTES 2006-
07
FTES 2007-
08
FTES 2008-
09
Add’l enrollm’ts 2008-09 /2009-10
Ventura $175,267 $30,524 192 233 249 251 213 35
Victor Valley $147,396 $25,671 144 187 205 237 210 15
West Hills - Lemoore
$197,705 $34,432
New Program 62 36
Yuba $82,713 $14,405 80 107 107 128 117 20
TOTALS $8,474,963 $1,476,000 6,436 9,318 10,491 10,578 10,717 1,890
Nursing Education Programs 2 0 0 9 | 15
Table 1(b)
Funds Allocated for Assessment, Remediation and Retention
COLLEGE AMOUNT
Allan Hancock $31,221
American River $31,221
Antelope Valley $122,695
Bakersfield $81,116
Butte $162,611
Cabrillo $64,484
Cerritos $47,852
Chaffey $72,800
Citrus $74,463
College of Marin $47,852
College of San Mateo $34,547
College of the Canyons $64,484
College of the Desert $114,379
College of the Redwoods $37,873
College of the Siskiyous $61,158
Compton Community Educational Center $147,642
Contra Costa $47,852
Copper Mountain $67,810
Cuesta $47,852
Cypress $32,242
El Camino $84,442
Evergreen Valley $22,905
Fresno City $170,926
Gavilan $31,221
Glendale Community $180,905
Golden West $52,010
Grossmont $131,997
Imperial Valley $81,116
Los Angeles City $56,168
Long Beach $64,484
Los Angeles Harbor $47,852
Los Angeles Pierce $72,800
Los Angeles Trade-Tech $41,200
Los Angeles Valley $96,084
16 | California Community Colleges Chancellor’s Office
Table 1(b) Funds Allocated for Assessment, Remediation
and Retention
COLLEGE AMOUNT
Los Medanos $51,179
Mendocino $54,505
Merritt $81,116
MiraCosta $69,473
Merced $140,989
Mission $64,484
Modesto Junior $51,762
Monterey Peninsula $61,158
Moorpark $32,884
Mt. San Antonio $114,379
Mt. San Jacinto $31,221
Napa Valley $114,379
Palomar $122,695
Rio Hondo $74,463
Riverside Community $217,495
Saddleback $107,726
San Joaquin Delta $139,326
Santa Ana $54,505
Santa Barbara City $31,221
Santa Monica $131,011
Santa Rosa Junior $126,853
Shasta $97,735
Sierra $29,558
Solano Community $14,589
Southwestern $81,116
Ventura $101,397
Victor Valley $85,274
West Hills Lemoore $114,379
Yuba $47,852
TOTAL $4,384,242
Nursing Education Programs 2 0 0 9 | 17
Table 2
Report on $6 million Workforce Investment Act Nursing Funds Fostering Student Success (Grant #05-0108)
College Region Year 1 Year 2 Year 3 Year 4 Year 5
Long Beach City 7 $217,130 $219,634 $219,926 $269,964 * $219,909
Santa Monica 7 $219,702 $217,990 $219,209 $217,051 $217,990
College of the Desert
9 $220,000 $220,000 $220,000 $220,000 $220,000
San Joaquin Delta 5 $189,222 $220,000 $220,000 $220,000 $220,000
Saddleback 8 $135,000 $143,800 $148,500 $148,500 $148,500
Mt. San Antonio 8 $196,785 $197,044 $174,024 $174,367 $170,903
Pasadena City 7 $135,000 $135,000 $135,000 $132,818 $135,000
Subtotal $1,312,839 $1,353,468 $1,336,659 $1,382,700 $1,332,302
Center for Nursing Expansion/Innovation (Grant #05-0109)
College R
egio
n
Year 1 award
Year 2 award
Year 3 award
Year 4 award
Year 5 award
2005-06
enrollment growth Funds
($4 million)
Req’d add’l enroll-ments over 5 yrs (2 cohorts of 80)
American River/ Sacramento City
2 549,994 $549,720 $549,986 $549,907 $549,989 $364,000 160
Santa Barbara City
6 $550,000 $550,000 $550,000 $550,000 $550,000 $650,000 160
Napa Valley 4 $500,455 $550,000 $550,000 $550,000 $550,000 $649,950 160
Golden West 8 $402,000 $402,000 $402,000 $402,000 $402,000 $278,259 160
City College of San Francisco
4 $512,952 $405,819 $459,216 $599,992 * $547,773 $150,533 160
Santa Ana 8 $290,759 $451,402 $430,628 $455,577 $425,717 $446,046 160
Grossmont (revised)
10 $528,800 $231,618 $195,138 $0 $0 $650,000 80
Subtotal $3,334,960 $3,140,559 $3,136,968 $3,107,476 $3,025,479 $3,188,788 1,040
18 | California Community Colleges Chancellor’s Office
Table 2
Report on $6 million Workforce Investment Act Nursing Funds
Healthy Community Forum (Grant #05-0110)
Colleges
R
egio
n
Year 1
Year 2
Year 3
Year 4
Year 5
2005-06 Enrollment Growth Funds ($4 million)
Req’d add’l enroll-ments over 5 yrs (2 cohorts of 40)
American River
2 $315,317 $319,944 $319,751 $319,779 $319,983 $162,242 80
Butte 1 $320,000 $320,000 $320,000 $368,198 * $320,000 $162,242 80
Sequoias 5 $126,190 $239,562 $259,912 $313,859 $320,000 $162,242 80
Mt. San Jacinto
9 $270,694 $306,467 $306,710 $306,186 $306,469 $162,242 80
Los Angeles Harbor/ Los Angeles Southwest
7 $320,000 $320,000 $320,000 $385,520 * $320,000 $162,242 80
Subtotal $1,352,201 $1,505,973 $1,526,373 $1,693,542 $1,586,452 $811,210 400
Total WIA Funding $6,000,000 $6,000,000 $6,000,000 $6,183,718 $5,944,233 $3,999,998 1,440
Nursing Education Programs 2 0 0 9 | 19
Table 3 $3 million Workforce Investment Act Funds
Second Phase
College
Region
2010
2011
2012
2013
2014
Req’d add’l enrollments over 5 years
Santa Barbara City
6 $465,172 $465,172 $465,172 $465,172 $465,172 134
Napa Valley 4 $465,177 $465,177 $465,177 $465,177 $465,177 134
Golden West 8 $340,857 $340,857 $340,857 $340,857 $340,857 134
Santa Ana 8 $385,862 $385,862 $385,862 $385,862 $385,862 132
American River 2 $271,789 $271,789 $271,789 $271,789 $271,789 67
Butte 1 $271,975 $271,975 $271,975 $271,975 $271,975 67
Sequoias 5 $263,427 $266,817 $266,817 $266,817 $266,817 67
Mt. San Jacinto 9 $260,371 $260,371 $260,371 $260,371 $260,371 67
Los Angeles Harbor
7 $271,975 $271,975 $271,975 $271,975 $271,975 67
TOTAL $2,996,605 $2,999,995 $2,999,995 $2,999,995 $2,999,995 869
20 | California Community Colleges Chancellor’s Office
Table 4 Workforce Investment Act Funds
LVN to RN and Specialty Nursing Programs
LVN to RN
COLLEGE
2008/09
2009/10
College of the Canyons $50,000 $173,741
Mt. San Jacinto $50,000 $149,540
Total Requested $100,000 $323,281
Specialty Nursing
COLLEGE
2008/09
2009/10
College of the Canyons $50,000 $144,478
Los Angeles City $67,114 $125,000
Santa Monica 0 $222,015
TOTAL REQUESTED $117,114 $491,493
Total Remaining to Allocate
0 $485,226
Nursing Education Programs 2 0 0 9 | 21
Table 5 Workforce Investment Act Funds
Paramedic/Independent Duty Corpsmen/ Medic to RN Programs
COLLEGE
2009-10
PARAMEDIC
College of the Canyons
$125,000
Victor Valley
$125,000
Fresno City
$125,000
Napa Valley
$125,000
INDEPENDENT DUTY CORPSMEN
Southwestern
$100,000
MiraCosta
$100,000
TOTAL ALLOCATED
$700,000
22 | California Community Colleges Chancellor’s Office
Table 6 Workforce Investment Act Funds Allied Health Programs Phase I
College
Grant
Amount
Occupation
Enrollment Numbers (09-10)
Enrollment Numbers (10-11)
Enrollment Numbers (11-12)
Total enrollment numbers
Allan Hancock
$118,247 Dental Assistant 15 15 15 45
American River
$25,000 Speech Pathology 18 18 18 54
Antelope Valley
$128,728 Radiologic Technologists
12 12 12 36
Cañada $46,011 Radiologic Technologists
50 60 60 170
Medical Assistant 33 40 40 113
Citrus $128,900 Dental Assistant 10 10 10 30
Licensed Vocational Nurse
0 0 0 0
Nursing Assistant 60 60 60 180
Emergency Medical Technician
45 45 45 135
West Hills Coalinga
$271,375 Psychiatric Technician 45 45 45 135
College of Marin
$106,500 Dental Assistant 10 0 0 10
College of Sequoias
$21,148 Health Care Interpreter 20 20 20 60
Cosumnes River
$108,677 Emergency Medical Technician
88 88 88 264
Pharmacy Technician 30 60 60 150
Cypress $206,938 Dental Assistant 6 7 8 21
Health Information Technology
22 25 27 74
Dental Hygiene 2 2 2 6
Feather River
$101,600 Licensed Vocational Nurse
3 3 3 9
Nursing Assistant 37 37 37 111
Home Health Aide 20 20 20 60
Personal Care Attendant 40 40 40 120
Fresno City $130,417 Radiologic Technologists
15 15 15 45
Los Angeles Trade Tech
$62,000 Medical Assistant 15 30 30 75
West Hills Lemoore
$206,576 Nursing Assistant 45 45 45 135
Long Beach City
$75,288 Licensed Vocational Nurse
10 10 10 30
Nursing Education Programs 2 0 0 9 | 23
Table 6 Workforce Investment Act Funds Allied Health Programs Phase I
College Grant
Amount Occupation Enrollment
Numbers (09-10)
Enrollment Numbers (10-11)
Enrollment Numbers (11-12)
Total enrollment numbers
Los Medanos
$54,720 Licensed Vocational Nurse
10 10 0 20
Merced $55,608 Nursing Assistant 5 10 12 27
Radiologic Technologists
3 5 6 14
Riverside/ Moreno Valley
$495,000 Speech Language Pathology Assistant
30 60 70 160
Nursing Assistant 75 75 90 240
Medical Assistant 17 22 27 66
Mt. San Antonio
$159,778 Nursing Assistant 120 120 0 240
Orange Coast
$123,200 Respiratory Therapy 12 12 12 36
Reedley $50,719 Dental Assistant 14 14 14 42
Saddleback $437,095 Medical Lab Technician 20 40 50 110
Santa Monica
$178,090 Respiratory Therapy Program
10 10 10 30
Home Health Aide 20 20 20 60
College of the Siskiyous
$ 21,148 Nursing Assistant 45 45 45 135
Licensed Vocational Nursing
20 20 20 60
Taft $80,000 Dental Hygiene 8 8 8 24
Ventura $266,174 Medical Assistant 30 30 30 90
Nursing Assistant 60 60 60 180
Personal Care Assistant 45 45 45 135
Phlebotomy 35 35 35 105
Yuba $51,150 Psychiatric Technician 10 10 10 30
TOTAL ENROLLMENTS 1,240 1,358 1,274 3,872
24 | California Community Colleges Chancellor’s Office
Table 7 American Recovery and Reinvestment Act Funds (ARRA)
Allied Health Programs Phase II COLLEGE
GRANT AMOUNT
2009-2011
OCCUPATION
ENROLLMENT
NUMBERS American River $287,107 Respiratory Care Practitioner 10
Canada $109,654 Radiologic Technologists 100
Cerritos $237,824 Pharmacy Technician 45
City College of San Francisco $200,000 Certified Nurse Assistant 30
Medical Evaluation Assistant 20 College of Sequoias $231,136 Medical Assistant 20
Medical Assistant/ Medical Lab Technologists
24
College of the Canyons $399,997 Medical Laboratory Technologist 24
East Los Angeles $376,849 Health Information Technologist 20
Respiratory Therapist 30
Los Positas $108,229 Pharmacy Technician 48 San Diego Miramar $399,997 Medical Laboratory Technologist 10
Moorpark $305,776 Nuclear Medicine Technologists 16 Health Information Technologist 40 Moreno Valley $400,000 Dental Assistant 30
Dental Hygienist 15
No. Orange County CCD/ School of Continuing Education
$221,136 Medical Assistant 40
Pasadena City $400,000 Medical Assistant 10
Medical Assistant/ Medical Lab Technologists
10
Radiologic Technologists 20 Dental Lab Technician 20 Dental Assistant 20
Sacramento City $287,999 Dental Assistant 20
San Diego Mesa $400,000 Radiologic Technologists 10
Interventional Radiology 10
Radiology/Magnetic Resonance Imaging
10
Radiology /CAT Scan 20
Santa Ana $400,000 Pharmacy Technician 100 Santa Barbara City $128,793 Medical Assistant 50 West Los Angeles $399,996 Pharmacy Technician 105
West Hills College Lemoore $400,000 Sterile Processing Technician 30 Electrocardiograph Technician 20 EMT (Emergency Medical
Technician)
10
Medical Assistant 20
TOTAL ENROLLMENT NUMBERS 1,007

Nursing Education Programs 2 0 0 9 | 25
Table 8 Community College Associate Degree Nursing (RN)
2007-08 Retention/Completion Data
COLLEGE
PROGRAM
PERCENT COMPLETED
ON TIME
PERCENT STILL
ENROLLED
ATTRITION
RATE
Allan Hancock LVN to RN 0% 90% 10%
American River GADN 64% 19% 17%
Antelope Valley GADN 50% 9% 42%
Bakersfield GADN 58% 23% 19%
Butte Community GADN 89% 0% 11%
Cabrillo GADN 92% 0% 8%
Cerritos GADN 45% 25% 29%
Chabot GADN 48% 7% 45%
Citrus GADN No Data Reported
College of Marin GADN 98% 0% 2%
College of San Mateo GADN 81% 9% 11%
College of the Canyons GADN 59% 10% 31%
College of the Desert GADN 62% 18% 19%
College of the Redwoods GADN 87% 0% 13%
College of the Siskiyous LVN to RN 95% 0% 5%
Contra Costa GADN 60% 31% 10%
Copper Mountain GADN 77% 0% 23%
Cuesta GADN 89% 6% 6%
Cypress GADN 75% 15% 11%
El Camino GADN 19% 53% 28%
El Camino - Compton Comm. Educational Center
GADN 36% 18% 46%
Evergreen Valley GADN 60% 8% 33%
Fresno City GADN 82% 9% 9%
Gavilan LVN to RN 91% 0% 9%
Glendale Community GADN 82% 2% 16%
Golden West GADN 85% 1% 14%
Imperial Valley GADN 82% 18% 0%
Los Angeles City GADN 76% 0% 24%
Long Beach City GADN 60% 18% 22%
Los Angeles Harbor GADN 48% 16% 36%
Los Angeles Pierce GADN 65% 18% 17%
Los Angeles Southwest GADN 70% 30% 0%
Los Angeles Trade-Tech GADN 78% 4% 19%

26 | California Community Colleges Chancellor’s Office
Table 8 Community College Associate Degree Nursing (RN)
2007-08 Retention/Completion Data
COLLEGE
PROGRAM
PERCENT COMPLETED
ON TIME
PERCENT STILL
ENROLLED
ATTRITION
RATE
Los Angeles Valley GADN* 81% 6% 13%
Los Medanos GADN 82% 0% 18%
Mendocino GADN 94% 0% 6%
Merced GADN 67% 7% 26%
Merritt GADN 43% 6% 51%
MiraCosta LVN to RN 70% 3% 27%
Mission LVN to RN 97% 0% 3%
Modesto Junior GADN 97% 0% 3%
Monterey Peninsula GADN 71% 6% 24%
Moorpark GADN 51% 4% 44%
Mt. San Antonio GADN 78% 8% 14%
Mt. San Jacinto GADN 94% 0% 6%
Napa Valley GADN 68% 9% 22%
Palomar GADN 45% 21% 35%
Rio Hondo GADN 74% 10% 16%
Riverside Community GADN 76% 14% 10%
Saddleback GADN 68% 7% 25%
San Joaquin Delta GADN 86% 9% 4%
Santa Ana GADN 60% 26% 14%
Santa Barbara City GADN 71% 14% 14%
Santa Monica GADN 62% 7% 31%
Santa Rosa Junior GADN 91% 5% 5%
Shasta GADN 81% 2% 17%
Sierra GADN 98% 0% 2%
Solano Community GADN 62% 15% 23%
Southwestern GADN 80% 8% 12%
Ventura GADN 52% 2% 46%
Victor Valley GADN 68% 16% 15%
West Hills Lemoore GADN 0% 100% 0%
Yuba GADN 78% 15% 7%
Average for all California Community Colleges 69% 12% 19%
*GADN: Generic Associate Degree Nursing
Nursing Education Programs 2 0 0 9 | 27
Table 9 Data for Colleges that used Assessment Testing
as Part of Selection Process
Total Number of Students Assessed: 17,983 Total Number of Students Who Passed Test: 15,600 Percent of Total: 87%
Gender
Total Tested
Total Passed
Percent of Total
Number that did not pass
Percent of Total
Female 14,368 12,351 86% 1,985 14%
Male 3,086 2,802 91% 278 9%
Not Listed 529 447 84% 81 15%
Ethnicity
Total Tested
Total Passed
Percent of Total
Number that did not pass
Percent of Total
African-American 989 681 69% 305 31%
American Indian/ Alaskan Native
119 105 88% 14 12%
Asian 3,576 2,995 84% 581 16%
Filipino 885 783 88% 99 11%
Hispanic 3,329 2,730 82% 590 18%
Other Non-White 180 144 80% 36 20%
Pacific Islander 38 32 84% 6 16%
Unknown/Non-Respondent 1,708 1,430 84% 275 16%
White Non-Hispanic 7,159 6,700 94% 438 6%
Language Spoken at Home
Total Tested
Total Passed
Percent of Total
Number that did not pass
Percent of Total
Arabic 13 8 62% 5 38%
Chinese 97 86 89% 11 11%
English 14,410 12,781 89% 1,598 11%
Farsi 37 23 62% 14 38%
Russian 113 86 76% 427 19%
Spanish 694 485 70% 31 15%
Tagalog 164 138 84% 26 23%
Other 202 170 84% 207 30%
No Response 2,253 1,823 81% 25 15%
28 | California Community Colleges Chancellor’s Office
Table 9 Data for Colleges that used Assessment Testing
as part of selection process
Disability Accommodation
Total
Tested
Total
Passed
Percent of
Total
Number that did not pass
Percent of Total
Yes 406 308 76% 89 22%
No 11,685 10,306 88% 1366 12%
No Record 5,892 4,986 85% 889 15%
Age Cohort
Total
Tested
Total
Passed
Percent of
Total
Number that did not pass
Percent of Total
19 or younger 48 47 98% 1 2%
20-24 1,753 1,676 96% 77 4%
25-29 1,599 1,494 93% 105 7%
30-35 1,008 944 94% 64 6%
35-39 789 735 93% 54 7%
40-44 499 1,178 89% 56 11%
45-49 374 341 91% 33 9%
50 or Older 224 202 90% 22 10%
No Record 11,689 9,757 83% 1932 17%
Status of Successful Students
Fall 2007
Spring 2008
Fall 2008
Spring 2009
0:Tested but did not apply at this site 115 262 293 425
1:Applied but not selected 503 788 1,238 1,638
2:Selected but need to remediate 4 9 29 31
3:Selected but not enrolled (on waitlist) 977 1,310 1,552 1,412
4:Selected but not enrolled (choose not to enroll) 56 123 254 236
5:Initial enrollment 1,050 1,303 2,139 1,667
6:Continuing enrollment 332 1,172 2,009 3,100
7:Graduation 4 86 123 744
8:Dropped for academic reasons (not eligible for return)
20 18 34 64
9:Dropped for academic reasons (eligible for return) 56 148 167 270
10:Dropped for other reasons 16 69 68 114
11:Transfer out 2 2 11 5
12:Transfer in (initial enroll) 3 0 10 3
X:No information available at this date 12,462 10,310 7,673 5,891
Nursing Education Programs 2 0 0 9 | 29
Table 9 Data for Colleges that used Assessment Testing
as part of selection process Remediation Participation
Count
Percent in Remediation
Yes 705 30%
No 809
Blank 830
Total 2344
Remediation Completed Count Percent Remediated
Yes 322 16%
No 658
Blank 1364
Total 2344
Status of Unsuccessful Students
Fall 2007
Spring 2008
Fall 2008
Spring 2009
0:Tested but not applied at this site 30 28 99 86
1:Applied but not selected 71 103 187 176
2:Selected but need to remediate 82 153 233 232
3:Selected but not enrolled (on waitlist)
100 102 88 70
4:Selected but not enrolled (choose not to enroll)
11 12 39 40
5:Initial enrollment 148 98 130 66
6:Continuing enrollment 86 159 180 204
7:Graduation 1 15 10 67
8:Dropped for academic reasons (not eligible for return)
11 8 18 18
9:Dropped for academic reasons (eligible for return)
27 80 37 48
10:Dropped for other reasons 6 7 21 7
11:Transfer out 0 1 1 1
12:Transfer in (initial enroll) 0 0 0 0
X:No information available at this date
1771 1578 1301 1329
TOTAL 2,344 2,344 2,344 2,344
30 | California Community Colleges Chancellor’s Office
Table 10 National Council Licensing Exam - Registered Nursing
Community College Pass Rates
College 2004-2005 2005-2006 2006-2007 2007-2008 2008-2009
# taken
#
taken
#
taken
#
taken
#
taken
% Pass % Pass % Pass % Pass % Pass
Allan Hancock 17 88.24% 23 78.26% 33 87.88% 34 82.35% 40 80%
American River
62 95.16% 113 89.38% 122 81.15% 100 84% 118 91.53%
Antelope Valley
95 92.63% 104 87.50% 78 94.87% 156 82.69% 129 89.92%
Bakersfield 68 69.60% 105 89.52% 97 93.81% 156 87.82% 151 80.13%
Butte 38 84.21% 18 77.78% 66 78.79% 59 67.80% 72 79.17%
Cabrillo 43 88.37% 41 95.60% 55 87.27% 61 93.44% 64 85.94%
Cerritos 122 81.97% 110 81.82% 96 85.42% 90 81.11% 81 96.30%
Chabot 24 91.67% 31 100% 44 100% 34 97.06% 46 97.83%
Chaffey 55 98.18% 53 98.11% 49 100% 44 95.45% 40 100%
Citrus N/A N/A N/A N/A N/A N/A 2 100% 22 77.27%
City College of San Francisco
80 76.25% 66 90.91% 71 85.92% 108 84.26% 99 83.84%
College of Marin
40 80.00% 50 90% 36 80.56% 22 81.82% 44 95.45%
College of San Mateo
31 87.10% 51 90.20% 56 80.36% 41 80.49% 59 83.05%
College of the Canyons
97 89.69% 59 89.83% 89 80.90% 84 83.33% 138 88.41%
College of the Desert
71 91.55% 118 88.14% 114 84.21% 67 82.09% 104 85.58%
College of the Redwoods
35 94.29% 35 82.86% 69 89.86% 43 88.37% 69 81.16%
Nursing Education Programs 2 0 0 9 | 31
Table 10 National Council Licensing Exam - Registered Nursing
Community College Pass Rates
College 2004-2005 2005-2006 2006-2007 2007-2008 2008-2009
# taken
#
taken
#
taken
#
taken
% Pass % Pass % Pass % Pass
#
taken
#
taken
#
taken
#
taken
#
taken
% Pass % Pass % Pass % Pass % Pass
College of the Sequoias
60 86.67% 132 87.60% 77 74.03% 141 75.89% 173 91.33%
College of the Siskiyous
N/A N/A N/A N/A N/A N/A 2 100% 22 95.45%
Contra Costa 28 100% 43 97.67% 75 96% 81 91.36% 52 92.31%
Copper Mountain
N/A N/A N/A N/A 1 0% 33 75.76% 19 84.21%
Cuesta 26 96.15% 30 96.67% 64 96.88% 46 95.65% 55 90.91%
Cypress 73 97.26% 65 95.38% 92 98.91% 79 97.47% 100 94%
De Anza 72 80.56% 67 86.57% 82 80.49% 73 73.97% 78 87.18%
East Los Angeles
68 72.06% 74 85.14% 111 75.68% 90 64.44% 107 74.77%
El Camino 69 94.20% 95 80% 115 81.74% 95 85.26% 103 91.26%
El Camino - Compton Community Educational Center
19 42.11% 17 52.94% 34 85.29% 17 88.24% 65 66.15%
Evergreen Valley
41 92.68% 57 91.23% 54 92.59% 68 88.24% 47 89.36%
Fresno City 167 74.25% 173 74.57% 235 85.11% 303 79.87% 268 76.49%
Gavilan 19 84.21% 13 100% 28 96.43% 12 83.33% 19 84.21%
Glendale Community
44 90.19% 57 87.72% 94 87.23% 90 95.56% 94 88.30%
Golden West 111 92.79% 113 91.15% 103 90.29% 123 93.50% 172 87.79%
Grossmont 154 76.62% 101 86.14% 135 91.85% 145 79.31% 102 84.31%
32 | California Community Colleges Chancellor’s Office
Table 10 National Council Licensing Exam - Registered Nursing
Community College Pass Rates
College 2004-2005 2005-2006 2006-2007 2007-2008 2008-2009
#
taken
#
taken
#
taken
#
taken
% Pass % Pass % Pass % Pass
#
taken
#
taken
#
taken
#
taken
#
taken
% Pass % Pass % Pass % Pass % Pass
Hartnell 30 76.67% 16 100% N/A N/A 18 94.44% 32 84.38%
Imperial Valley
40 62.50% 55 80% 60 78.33% 56 66.07% 75 61.33%
Long Beach City
120 88.33% 111 92.79% 106 88.68% 91 92.31% 135 97.04%
Los Angeles City
24 66.67% 38 86.84% 57 91.23% 33 66.67% 65 86.15%
Los Angeles Harbor
49 97.96% 67 100% 97 94.85% 95 93.68% 97 95.88%
Los Angeles Pierce
64 68.75% 73 72.60% 68 73.53% 69 82.61% 48 85.42%
Los Angeles Southwest
45 55.56% 51 58.82% 30 73.33% 34 88.24% 49 79.59%
Los Angeles Trade-Tech
45 73.33% 52 73.08% 48 62.50% 49 61.22% 32 62.50%
Los Angeles Valley
106 75.47% 98 77.55% 75 84% 73 87.67% 71 90.14%
Los Medanos 53 96.23% 55 92.73% 34 85.29% 46 82.61% 45 91.11%
Mendocino 14 78.57% 9 88.89% 18 83.33% 19 89.47% 37 94.59%
Merced 37 94.59% 44 86.36% 39 92.31% 35 68.57% 42 78.57%
Merritt 39 79.49% 27 96.30% 35 85.71% 43 95.35% 24 95.83%
MiraCosta N/A N/A N/A N/A N/A N/A 7 100% 26 100%
Mission N/A N/A N/A N/A N/A N/A N/A N/A N/A N/A
Modesto Junior
104 93.27% 107 96.26% 160 93.13% 144 93.06% 125 93.60%
Nursing Education Programs 2 0 0 9 | 33
Table 10 National Council Licensing Exam - Registered Nursing
Community College Pass Rates
College 2004-2005 2005-2006 2006-2007 2007-2008 2008-2009
#
taken
#
taken
#
taken
#
taken
% Pass % Pass % Pass % Pass
#
taken
#
taken
#
taken
#
taken
#
taken
% Pass % Pass % Pass % Pass % Pass
Monterey Peninsula
31 100% 32 90.63% 48 97.92% 44 88.64% 44 86.36%
Moorpark 77 94.81% 69 95.65% 90 95.56% 70 91.43% 76 89.47%
Mt. San Antonio
56 85.71% 112 88.39% 102 95.10% 120 95.83% 239 89.54%
Mt. San Jacinto
39 84.62% 61 86.89% 61 91.80% 74 85.14% 70 88.57%
Napa Valley 64 68.75% 36 86.11% 84 80.95% 81 75.31% 75 78.67%
Ohlone 40 90% 47 97.87% 57 92.98% 50 90% 46 95.65%
Palomar 62 98.39% 58 98.28% 67 98.51% 41 97.56% 71 97.18%
Pasadena City 95 78.95% 107 85.98% 101 94.06% 113 93.81% 110 90%
Rio Hondo 71 90.14% 74 72.97% 83 85.54% 88 78.41% 99 92.93%
Riverside Community
101 94.06% 117 94.02% 131 95.42% 176 88.64% 206 89.81%
Sacramento City
79 100% 93 98.92% 144 99.31% 143 96.50% 160 92.50%
Saddleback 96 91.67% 96 96.88% 105 99.05% 125 94.40% 113 95.58%
San Bernardino Valley
65 87.69% 107 92.52% 78 85.90% 76 89.47% 90 82.22%
San Diego City
54 83.33% 62 91.94% 62 88.71% 74 93.24% 75 88%
San Joaquin Delta
97 78.35% 103 82.52% 139 79.14% 132 71.97% 179 85.47%
Santa Ana 95 94.74% 87 88.51% 104 93.27% 104 86.54% 131 85.50%
34 | California Community Colleges Chancellor’s Office
Table 10 National Council Licensing Exam - Registered Nursing
Community College Pass Rates
College 2004-2005 2005-2006 2006-2007 2007-2008 2008-2009
#
taken
#
taken
#
taken
#
taken
% Pass % Pass % Pass % Pass
#
taken
#
taken
#
taken
#
taken
#
taken
% Pass % Pass % Pass % Pass % Pass
Santa Barbara City
41 78.05% 44 90.91% 41 90.24% 35 88.57% 47 93.62%
Santa Monica 50 88% 63 87.30% 57 92.98% 74 81.08% 56 94.64%
Santa Rosa Junior
56 92.86% 86 96.51% 68 97.06% 76 93.42% 125 94.40%
Shasta 39 92.31% 58 81.03% 86 90.70% 92 91.30% 62 91.94%
Sierra 33 100% 68 98.53% 23 100% 54 98.15% 70 92.86%
Solano Community
46 80.43% 70 85.71% 31 70.97% 28 82.14% 79 77.22%
Southwestern 41 80.49% 39 84.62% 50 82% 54 83.33% 70 91.43%
Ventura 74 87.84% 88 89.77% 75 93.33% 112 89.29% 92 92.39%
Victor Valley 71 90.14% 76 86.84% 41 87.80% 69 95.65% 95 88.42%
West Hills Lemoore
N/A N/A N/A N/A N/A N/A N/A N/A N/A N/A
Yuba 26 84.62% 32 100% 35 91.43% 37 89.19% 50 86%