A Profile of Virginia Nursing Education Programs€¦ · A Profile of Virginia Nursing Education...
96
A Profile of Virginia Nursing Education Programs Results of the 2009 Survey of Virginia Nursing Education Programs July, 2010 Prepared for the Virginia Department of Health Professions Healthcare Workforce Data Center
Transcript of A Profile of Virginia Nursing Education Programs€¦ · A Profile of Virginia Nursing Education...

A Profile of Virginia Nursing Education Programs
Results of the 2009 Survey of Virginia Nursing Education Programs
July, 2010
Prepared for the Virginia Department of Health Professions Healthcare Workforce Data Center

Virginia Dept. of Health Professions Page 1 Profile of Nursing Education Programs 2008-09
A Profile of Virginia Nursing Education Programs
Results of the 2009 Survey of Virginia Nursing Education Programs This DHP Healthcare Workforce Data Center report is a compilation of results from the annual survey of Virginia’s practical nursing and registered nurse education programs conducted in October 2009 and covering the 2008-09 academic years (August 1 – July 31). The 2009 survey incorporated revisions to the 2008 survey recommended by the Center’s Advisory Council and Nursing Workforce Committee to enhance Virginia’s knowledge of health workforce issues relating to nursing education programs. Information about program structures, faculty size and characteristics, and student enrollment and graduation patterns are highlighted.

Virginia Dept. of Health Professions Page 2 Profile of Nursing Education Programs 2008-09
Table of Contents A Profile of Virginia Nursing Education Programs.................................................................. 1 Results of the 2009 Survey of Virginia Nursing Education Programs .......................................... 1 Practical Nursing Education Programs................................................................................ 7 Types of Programs ........................................................................................................ 7 Accreditation Status ...................................................................................................... 8 Program Characteristics ................................................................................................. 9 Clinical Experience ......................................................................................................12 Program Changes.........................................................................................................15 PNE Student Information ...............................................................................................17 PNE Student Attrition ...................................................................................................25 PNE Graduates ............................................................................................................27 Disruptions in Full-Time Nursing Faculty ...........................................................................38 Registered Nurse Education Programs...............................................................................39 Types of Programs .......................................................................................................39 Accreditation Status .....................................................................................................41 Clinical Experience ......................................................................................................48 Program Changes.........................................................................................................51 RN Student Information.................................................................................................54 RN Student Attrition.....................................................................................................63 RN Graduates..............................................................................................................64 Full Time Faculty in RN Programs ....................................................................................69 Disruptions in Part-Time Nursing Faculty...........................................................................86 RN to BSN PROGRAM.....................................................................................................86 RN to BSN Applications and New Enrollments .....................................................................86 RN to BSN Student Attrition............................................................................................90 RN to BSN Program Graduates.........................................................................................91 Trends Over Time........................................................................................................94 Nursing Programs Admission and Graduates Trend...............................................................94

Virginia Dept. of Health Professions Page 3 Profile of Nursing Education Programs 2008-09
List of Tables Table 1. Practical Nursing Education Program Types in Virginia.................................................. 7 Table 2. Number of programs accredited by other accrediting institutions. ................................... 9 Table 3. Structure of PN Education Programs by Program Type .................................................. 10 Table 4. Number of Admission Cohort in the PN Academic Year by Program Type........................... 12 Table 5. Number of Hours Assigned to Direct Client Care Experience by PNE Program Type............... 13 Table 6. Number of Hours Assigned to Clinical Simulation Experience by PNE Program Type.............. 14 Table 7. Number of Hours Assigned to Clinical Observation by PNE Program Type........................... 14 Table 8. Summary of Program Changes implemented during 2008-09 Academic Year....................... 15 Table 9. PNE Student Admissions, Enrollments and Capacity in the 2008-09 Academic Year............... 17 Table 10. Reasons for Turning Away Qualified Applicants to PN Programs .................................... 19 Table 11. Reasons for Unfilled Spaces in PN Programs by Type.................................................. 20 Table 12. Minimum and Average GPA requirement for admission by Program Type ......................... 22 Table 13. Number of Male Students and CNAs enrolled by Program Type ..................................... 24 Table 14. Student Attrition in PNE program Types in Virginia..................................................... 25 Table 15. Student Attrition among PN Students Admitted for 2008-09.......................................... 26 Table 16. Graduates Racial/Ethnic categories in PNE programs by Program Type ............................ 27 Table 17. Number of Male Students and CNA Graduates by Program Type ..................................... 28 Table 18. Graduates having a degree in a discipline other than nursing ........................................ 29 Table 19. Full Time Faculty New Appointments/ Resignations and Distributions.............................. 30 Table 20. Full Time Faculty Racial/Ethnic categories by Program Type ........................................ 30 Table 21. Faculty in PN by Age Range ................................................................................. 31 Table 22. Full Time Faculty in PNE programs by Gender........................................................... 32 Table 23. The Number of full-time positions budgeted for program adequate to meet needs.............. 33 Table 24. Reasons why full-time positions were not adequate to meet needs................................. 34 Table 25. Part Time Faculty in PN program, vacant, and actively recruited ................................... 35 Table 26. Part Time Faculty Racial/Ethnic categories by Program Type........................................ 35 Table 27. Part Time Faculty in PNE by Age Range .................................................................. 36 Table 28. Part Time Faculty in PNE programs by Gender .......................................................... 37 Table 29. Highest Degree Held by PN Program Directors by Program Type..................................... 38 Table 30. Expected Disruption within full-time nursing faculty .................................................. 38 Table 31 Registered Nurse (RN) Education Program Types in Virginia ........................................... 39 Table 32. Number of RN to Baccalaureate Degree Programs...................................................... 40 Table 33. Programs Accredited by NLNAC ............................................................................ 41 Table 34. RN Programs Accreditation Dates by Program Type .................................................... 42 Table 35. Number of programs accredited by other accrediting institutions................................... 43 Table 36. Structure of RN Education Programs by Program Type ................................................ 43 Table 37. Number of semesters, quarters or trimesters in programs curriculum by Program Type ....... 44 Table 38. Types of curriculum schedule options offered to RN students........................................ 45 Table 39. Number of months it takes for a full time student to complete the program ..................... 46 Table 40. Number of Admission Cohort in the RN Academic Year by Program Type .......................... 47 Table 41. Number of Hours assigned to Clinical experiences ..................................................... 48 Table 42. Number of Hours assigned to Direct Client Care Clinical experiences .............................. 49 Table 43. Average Number of Hours Assigned to Direct Clinical Care Experience Located in Virginia..... 50 Table 44. Number of Hours assigned to Clinical Simulation Experiences........................................ 50 Table 45. Number of Hours Assigned to Clinical Observation by RN Program Type ........................... 51 Table 46. Summary of Program Changes implemented during 2008-09 Academic Year by RN ............. 52 Table 47. RN Student Admissions, Enrollments, and Capacity .................................................... 54 Table 48. Reasons for Turning Away Qualified Applicants to Pre license RN Programs....................... 56 Table 49. Why programs had unfilled spaces for new students in the 2008 - 2009............................ 58 Table 50. Minimum and Average GPA requirement for admission by Program Type .......................... 60 Table 51. Number of Male Students and LPNs enrolled by Program Type ..................................... 62 Table 52. Average Age of students admitted to a program........................................................ 63 Table 53. RN Student Attrition Rate in the 2008-2009 academic year by Program Type..................... 63

Virginia Dept. of Health Professions Page 4 Profile of Nursing Education Programs 2008-09
Table 54. Number of Male Students and LPNs Graduated by Program Type.................................... 65 Table 55. Number of Students Graduated from RN Programs by Ethnic Group and Program Type ......... 66 Table 56. Number of graduates having a degree in a discipline other than nursing........................... 67 Table 57. Total # of full-time(FT) faculty positions employed, vacant, and actively recruited by program type........................................................................................................... 70 Table 58. number of full-time nursing positions budgeted for a program that was adequate to meet current needs by Program Type ........................................................................................ 70 Table 59. Reasons why full-time nursing positions budgeted for a program was not adequate to meet current needs .............................................................................................................. 71 Table 60. Highest degree held by Full-Time nursing faculty employed by Program Type (Percent) ....... 72 Table 61. Number of Full Time Faculty on Oct. 15, 2009 by Ethnic Group ..................................... 73 Table 62. Number of Full Time RN Programs by Age Group and Program Type ................................ 74 Table 63. Number of Full Time RN Programs by Gender and Program Type.................................... 76 Table 64. Part-time(PT) faculty positions employed, vacant, and actively recruited ........................ 77 Table 65. Number of part-time nursing positions budgeted for a program that was adequate to meet current needs by Program Type ........................................................................................ 78 Table 66. Reasons why part-time nursing positions budgeted for a program were not adequate to meet current needs....................................................................................................... 79 Table 67. Degree held by Part-Time nursing faculty employed by Program Type ............................. 80 Table 68. Number of Part Time Faculty by Ethnic Group and Program Type................................... 81 Table 69. Number of Part Time faculty by Age Group and Program Type ...................................... 82 Table 70. Number of Part Time RN Programs by Gender and Program Type ................................... 83 Table 71. Highest Academic Degree Held by Program Directors by Program type ............................ 84 Table 72. Disruptions in the Full-Time Nursing Faculty ............................................................ 86 Table 73. RN to BSN student Applications and New Enrollments ................................................. 87 Table 74. Reasons for Turning Away Qualified Applicants in RN to BSN Programs............................. 88 Table 75. Why programs had unfilled spaces for new students in the 2008 - 2009............................ 89 Table 76. Minimum and Average Grade Point Average (GPA) requirement for admission to RN to BSN program..................................................................................................................... 89 Table 77. RN to BSN program Student Attrition Rate in the 2008-2009 academic year ...................... 90 Table 78. Number of Students Graduated from RN to BSN Programs by Ethnic Group ....................... 92 Table 79. Number of graduates having a degree in a discipline other than nursing........................... 92 Table 80. RN to BSN Number of Male Graduates .................................................................... 93

Virginia Dept. of Health Professions Page 5 Profile of Nursing Education Programs 2008-09
List of Graphs Map 1. Practical Nurse Education Programs in Virginia............................................................. 7 Map 2. Registered Nurse Education programs in Virginia ......................................................... 40 Figure 1. Practical Nursing Education Program Types in Virginia ................................................. 8 Figure 2. Programs Accredited by NLNAC ............................................................................. 8 Figure 3. Percentage of programs Accredited by NLNAC or any other agency by Program Type............ 9 Figure 4. Structures of PN Education Programs...................................................................... 10 Figure 5. Number of PNE programs and program length ........................................................... 11 Figure 6. PNE program Length in months by Program Type ....................................................... 11 Figure 7. Number of Admission Cohort for PNE programs by Program Type .................................... 12 Figure 8. Number of Hours Assigned to Direct Client Care Experience by PNE Program Types.............. 13 Figure 9. Number of PNE Program changes........................................................................... 15 Figure 10 PNE Student Admissions, Enrollments and unfilled spaces in the 2008-09 Academic Year ...... 18 Figure 11. PNE Student Admissions, Enrollments and unfilled spaces in the 2008-09 Academic Year ..... 18 Figure 12. Number of Male Students and CNAs enrolled by Program Type...................................... 25 Figure 13. Student Attrition in PNE programs by Program Type .................................................. 26 Figure 14. Student Attrition in PNE programs by Program Type .................................................. 27 Figure 15. Graduates Racial/Ethnic categories in PNE programs by Program Type ........................... 28 Figure 16. Number of Male Students and CNA Graduates by Program Type .................................... 29 Figure 17. Full Time Faculty Racial/Ethnic categories by Program Type........................................ 31 Figure 18. Full Time Faculty Age Range............................................................................... 32 Figure 19. Full Time Faculty in PNE programs by Gender ......................................................... 33 Figure 20. Part Time Faculty Racial/Ethnic categories by Program Type ....................................... 36 Figure 21. Part Time Faculty in PNE by Age Range.................................................................. 37 Figure 22. Part Time Faculty in PNE programs by Gender ......................................................... 37 Figure 23. Registered Nurse (RN) Education Program Types in Virginia ......................................... 39 Figure 24. RN Programs Accredited by NLNAC and CCNE .......................................................... 41 Figure 25. Structure of RN Education Programs by Program Type................................................ 44 Figure 26. Program Length in months for a full time student to complete a program........................ 47 Figure 27. Number of Admission Points in the academic year by Program Type ............................ 48 Figure 28. Number of Hours assigned to Direct Client Care Clinical experiences.............................. 49 Figure 29. Number of Program Changes by Program Type ......................................................... 52 Figure 30. RN Student capacity in Virginia in the 2008-09 Academic Year...................................... 55 Figure 31. RN Student Admissions, Enrollments and unfilled spaces in the 2008-09 Academic Year....... 55 Figure 32. Average Age of students admitted to a program....................................................... 62 Figure 33. Student Attrition Rate in the 2008-2009 academic year by Program Type ...................... 64 Figure 34. Number of Students Graduated by Program Type...................................................... 64 Figure 35. Number of Male Students and LPNs Graduated by Program Type ................................... 65 Figure 36. Number of Male Students and LPNs Graduated by Program Type .................................. 67 Figure 37. Number of graduates having a degree in a discipline other than nursing.......................... 68 Figure 38. Total number of FT faculty positions employed, vacany, and actively recruited ................ 69 Figure 39. Highest Degree held by Full-Time nursing faculty employed......................................... 73 Figure 40. Number of Full Time Faculty by Ethnic Group and Program Type................................... 74 Figure 41. Full Time Faculty Age Range in RN Programs ........................................................... 75 Figure 42. Number of Full Time RN Programs by Age Group and Program Type ............................... 75 Figure 43. Number of Full Time RN Programs by Gender .......................................................... 76 Figure 44. Part-time (PT) faculty positions employed, vacant, and actively recruited on Oct. 15, 2009 by program type........................................................................................................... 78 Figure 45. Degree held by Part-Time nursing faculty by Program Type ......................................... 80 Figure 46. Number of Part Time Faculty by Ethnic Group ......................................................... 81 Figure 47. Number of Part Time faculty by Age Group ............................................................. 82 Figure 48. Number of Part Time faculty by Age Group and program type ...................................... 83 Figure 49. Number of Part Time RN Programs by Gender and Program Type .................................. 84 Figure 50. Highest Academic Degree Held by Program Directors ................................................. 85

Virginia Dept. of Health Professions Page 6 Profile of Nursing Education Programs 2008-09
Figure 51. RN to BSN student Applications and New Enrollments ................................................ 87 Figure 52. Students Graduated From RN to BSN Programs by Ethnic Group .................................... 91 Figure 53. PNE Program Admissions and Graduation Trends....................................................... 94 Figure 54. RN Program Admissions and Graduation Trends ........................................................ 94

Virginia Dept. of Health Professions Page 7 Profile of Nursing Education Programs 2008-09
Practical Nursing Education Programs Types of Programs In October, 2009, there were 73 Practical Nursing Education Programs (PNE) in operation in Virginia. One new PNE program had no data for the 2008-2009 academic year at the time of the survey. Table 1 illustrates the different types of PNE programs. Approximately 63% of the PNE programs were located in community colleges and in public high schools and about 28% of PNE programs were private. The remaining were public adult school or hospital based programs as shown in Figure 1.
Table 1. PNE Program Types in Virginia
PN Program Types # of Programs % of Total
Community College 20 27.8%
Hospital Based 3 4.2%
Private 20 27.8%
Public Adult School 4 5.6%
Public High School 25 34.7%
Total 72 100.00%
Map 1. Practical Nurse Education Programs in Virginia

Virginia Dept. of Health Professions Page 8 Profile of Nursing Education Programs 2008-09
Figure 1. PNE Program Types in Virginia
Public High School34%
Community College28%
Hospital Based4%
Private28%
Public Adult School6%
Community College
Hospital Based
Private
Public Adult School
Public High School
Accreditation Status
Figure 2 illustrates the percentage of programs accredited by the National League for Nursing Accrediting Commission NLNAC. Only seven programs that represent 9.7% of the PNE programs were accredited by NLNAC.
Figure 2. Virginia PNE Programs Accredited by NLNAC
Not accredited by the NLNAC90.3%
Programs accredited by the NLNAC
9.7%
Programs accredited by the NLNAC
Not accredited by the NLNAC
Approximately 47% of all the PNE programs were not accredited by any institution. Figure 3 shows the percentage of PNE programs accredited by NLNAC and the percentage of programs

Virginia Dept. of Health Professions Page 9 Profile of Nursing Education Programs 2008-09
accredited by other agencies in each program type. Table 2 shows the number of programs accredited by other accrediting agencies
Figure 3. Percentage of PNE programs Accredited by NLNAC or other agency
by Program Type
13.9%
13.9%
.0%
1.4%
2.8%
9.7%
16.7%
1.4%
2.8%
1.4%
1.4%
19.4%
11.1%
4.2%
47.2%
43.1%
9.7%
0%
10%
20%
30%
40%
50%
60%
70%
80%
90%
100%
CommunityCollege
Hospital Based Private Public AdultSchool
Public HighSchool
Total
Type of program
Accredited byNLNAC. Notaccredited by anyother agency
Not accredited byNLNAC. Accreditedby another agency
Not accredited byNLNAC. Notaccredited by anyother agency
Table 2. Number of PNE programs accredited by other accrediting institutions.
Accrediting agencies # %
The Accrediting Commission of Career Schools and Colleges (ACCSC) 1 1.4
ACCSC and State Council of Higher Education for Virginia (SCHEV) 3 4.2
The Accrediting Council for Independent Colleges and Schools (ACICS) 1 1.4
Commission of the Council on Occupational Education (COE) 2 2.8 Commission on Colleges of the Southern Association of Colleges and Schools (SACS) 16 22.2 Southern Regional Education Board (SCREB) 1 1.4
State Board of Community Colleges (SBCC) 1 1.4
Virginia Board of Education (VBOE)* 2 2.8
Virginia Board of Nursing (VBON)* 1 1.4
Virginia Board of Nursing (VBON), and Southern association of schools (SACS)* 1 1.4 Virginia Board of Nursing(VBON) and the State council for Higher Education (SCHEV)* 1 1.4
Virginia Department of Education (VDOE), and The Southern Association of Colleges and Schools(SACS)* 1 1.4
Total 31 43.1 * VDOE, SCHEV, VBON were not accrediting bodies; however, they provide program approval.
Program Characteristics:
In Virginia, most PNE programs run on a semester schedule as shown in Figure 4, although three programs use a trimester, and six programs use a quarterly schedule. Table 3 shows the number of programs using semesters, quarters, and trimesters by program type.

Virginia Dept. of Health Professions Page 10 Profile of Nursing Education Programs 2008-09
Table 3. Structure of PNE Programs by Program Type
Program Structure
Quarters Semesters Trimesters Total PNE Program Type # of
Programs % of Total
# of Programs
% of Total
# of Programs
% of Total
# of Programs
% of Total
Community College 0 .0% 20 27.8% 0 .0% 20 27.8%
Hospital Based 0 .0% 2 2.8% 1 1.4% 3 4.2%
Private 5 6.9% 13 18.1% 2 2.8% 20 27.8%
Public Adult School 0 .0% 4 5.6% 0 .0% 4 5.6%
Public High School 1 1.4% 24 33.3% 0 .0% 25 34.7%
Total 6 8.3% 63 87.5% 3 4.2% 72 100.0%
Figure 4. Structures of PNE Programs
Semesters88%
Quarters8%
Trimesters4%
QuartersSemestersTrimesters
The number of months it takes for a student to complete a PNE program ranges between 12
and 24 months. Figure 5 illustrates the number of PNE programs and the program length. Twenty-five (approximately 35%) PNE programs take 12 months to complete, and about 25% of the programs take 18 months to complete. The remaining programs require either 13 to 17 months or 20 to 24 months.

Virginia Dept. of Health Professions Page 11 Profile of Nursing Education Programs 2008-09
Figure 5. Number of PNE programs and program length
25
1
8
6
1
19
3
6
210
5
10
15
20
25#
PN
E p
rog
ram
s
12 13 14 15 17 18 20 21 23 24
Number of Month
Figure 6 shows the minimum and maximum number of months it takes to complete a program.
Hospital based programs take 12 months, private programs between 12-15 months, public adult school programs between 12-18 months, community college programs between 12-21 months, and public high school programs between 18-24 months.
Figure 6. PNE program Length in months by Program Type
21
12
18
24
15
12
12
12
18
12
0 5 10 15 20 25 30
# of Month
Max # Month
Min # Month
Community College
Hospital Based
Private
Public Adult School
Public High School

Virginia Dept. of Health Professions Page 12 Profile of Nursing Education Programs 2008-09
Most of the PNE programs located in community colleges, high schools, and public adult schools admit students only once per year as shown in Figure 7. However, most of the private programs offer multiple admission cohort points for students throughout the year. Table 4 shows the number of admission points by type of program.
Table 4. Number of Admission Cohorts in the PNE Academic Year by Program Type
Figure 7. Number of Admission Cohorts for PNE programs by Program Type
47
47
14
2 15
1223
0 0 216
3 1 04
0 0 0
2 0 1 00
5
10
15
20
25
30
35
40
45
50
# o
f PN
Pro
gra
ms
1 2 3 4 or more
Hospital Based
Public Adult School
Community College
Public High School
Private
Totals
Hospital Based
Public Adult School
Community College
Public High School
Private
Totals
Clinical Experience
There were three basic types of clinical experience for student nurses: clinical observation in which the students observe the ways in which a licensed, experienced nurse interacts with patients and
Community College
Hospital Based
Private Public Adult School
Public High School
Totals # of
Admission
Points: # % # % # % # % # % # %
one 16 22.2% 2 2.8% 2 2.8% 4 5.6% 23 31.9% 47 65.3%
two 3 4.2% 0 .0% 1 1.4% 0 .0% 0 .0% 4 5.6%
three 1 1.4% 1 1.4% 5 6.9% 0 .0% 0 .0% 7 9.7%
four or more 0 .0% 0 .0% 12 16.7% 0 .0% 2 2.8% 14 19.4%
Totals 20 27.8% 3 4.2% 20 27.8% 4 5.6% 25 34.7% 72 100.0%

Virginia Dept. of Health Professions Page 13 Profile of Nursing Education Programs 2008-09
other healthcare professionals and staff; clinical simulation in which students make use of simulators to practice common nursing procedures such as injections or taking vital signs in a safe environment; and direct patient care in which student nurses interact directly with patients or clients while under the guidance of an experienced nurse. Tables 5 through 7 summarize the amount of time PNE programs in Virginia devote to each of these types of clinical experiences by program type. Clinical experience opportunities were also offered outside of Virginia, in the District of Columbia, Maryland, Kentucky, North Carolina, Tennessee and West Virginia.
Table 5. Number of Hours Assigned to Direct Client Care Experience by PNE Program Type
# of Hours Community College
Hospital Based
Private Public Adult School
Public High School
Totals
# % # % # % # % # % # %
0 to 325 2 10.0% 0 .0% 0 .0% 1 25.0% 0 .0% 3 4.2%
326 to 350 1 5.0% 0 .0% 0 .0% 0 .0% 1 4.2% 2 2.8%
351 to 375 2 10.0% 0 .0% 0 .0% 0 .0% 0 .0% 2 2.8%
376 to 400 4 20.0% 1 33.3% 4 20.0% 2 50.0% 3 12.5% 14 19.7% More than 400
11 55.0% 2 66.7% 16 80.0% 1 25.0% 20 83.3% 50 70.4%
Totals 20 100.0% 3 100.0% 20 100.0% 4 100.0% 24 100.0% 71 100.0%
In most PNE programs the majority of a student’s clinical experience comes from direct
patient care under the tutelage of an experienced nurse. Figure 8 shows that the majority (90%) of PNE programs report assigning more than 375 hours to direct patient care.
Figure 8. Number of Hours Assigned to Direct Client Care Experience by PNE Program Types
3 2 214
50
0 0 0 416
0 1 0 3
20
2 1 2 411
1 0 0 2 1
0 0 0 1 20
10
20
30
40
50
# o
f PN
Pro
gra
ms
0 to 325 326 to 350 351 to 375 376 to 400 More than400
Hospital Based
Public Adult School
Community College
Public High School
Private
Totals
Hospital Based
Public Adult School
Community College
Public High School
Private
Totals

Virginia Dept. of Health Professions Page 14 Profile of Nursing Education Programs 2008-09
The amount of time PNE programs devote to clinical simulation ranges from 0 to more than 200 hours. Table 6 shows that 70% of PNE programs assigned less than 26 hrs to Clinical Simulation Experience.
Table 6. Number of Hours Assigned to Clinical Simulation Experience by PNE Program Type
# of Hours Community College
Hospital Based
Private Public Adult School
Public High School
Total
# % # % # % # % # % # %
0 to 25 14 70.0% 2 66.7% 16 80.0% 3 75.0% 15 62.5% 50 70.4% 26 to 50 2 10.0% 0 .0% 0 .0% 0 .0% 3 12.5% 5 7.0% 51 to 75 3 15.0% 0 .0% 1 5.0% 0 .0% 3 12.5% 7 9.9%
76 to 100 1 5.0% 0 .0% 3 15.0% 1 25.0% 1 4.2% 6 8.5%
126 to 150 0 .0% 0 .0% 0 .0% 0 .0% 1 4.2% 1 1.4%
176 to 200 0 .0% 0 .0% 0 .0% 0 .0% 1 4.2% 1 1.4% More than 200
0 .0% 1 33.3% 0 .0% 0 .0% 0 .0% 1 1.4%
Totals 20 100.0% 3 100.0% 20 100.0% 4 100.0% 24 100.0% 71 100.0%
The amount of time PNE programs devote to clinical observation ranges from 0 to more than 200 hours. Approximately 77% of PNE programs assign 0 to 75 hours to clinical observation (see Table 7). Almost half of all PNE programs (50.7%) assign less than 26 hours of a student’s time to clinical observation.
Table 7. Number of Hours Assigned to Clinical Observation by PNE Program Type
Community College
Hospital Based
Private Public Adult School
Public High School
Totals # of Hours:
# % # % # % # % # % # %
0 to 25 12 60.0% 1 33.3% 13 65.0% 0 .0% 10 41.7% 36 50.7%
26 to 50 1 5.0% 1 33.3% 2 10.0% 1 25.0% 0 .0% 5 7.0%
51 to 75 0 .0% 1 33.3% 0 .0% 1 25.0% 0 .0% 2 2.8%
76 to 100 0 .0% 0 .0% 0 .0% 0 .0% 2 8.3% 2 2.8%
101 to 125 3 15.0% 0 .0% 4 20.0% 0 .0% 7 29.2% 14 19.7%
126 to 150 2 10.0% 0 .0% 0 .0% 0 .0% 3 12.5% 5 7.0%
176 to 200 2 10.0% 0 .0% 1 5.0% 2 50.0% 2 8.3% 7 9.9%
Totals 20 100.0% 3 100.0% 20 100.0% 4 100.0% 24 100.0% 71 100.0%

Virginia Dept. of Health Professions Page 15 Profile of Nursing Education Programs 2008-09
Program Changes
There were 20 PNE programs out of 72 that had implemented changes in their program during the 2008-09 academic year. Figure 9 illustrates the number of changes in different types of programs. Table 8 provides a summary of the implemented changes in each program type.
Figure 9. Number of PNE Program changes
Table 8. Summary of Program Changes Implemented during 2008-09 Academic Year by PNE Program Type
Program Type Implemented Changes
Community College # of programs that implemented changes: 6
Addition of NUR 135 Drug Calculation 1 credit class Addition of PNE 116 Normal Nutrition 1 credit class instead of HLT 130
Nutrition and Diet Therapy Increased the minimum passing score to 80%
implementation of web-based offered courses via a Title III Grant: PNE
173 Pharmacology; PNE 152 Mental Health & Psychiatric Nursing; ENG 101 offered additionally web-based
Math prerequisite requirement increased, from Math 02 to Math 03, in an attempt to address math skill(s) deficit of entering PN students
Math prerequisite requirement increased, from Math 02 to Math 03, in an attempt to address math skill(s) deficit of entering PN students.
Medical Surgical curriculum changed to reflect a two semester course.
Changed from PNE 195 (Topics in Practical Nursing) to PNE 110 & PNE 111 (Practical Nursing in Health & Disease I-II).
Passing standard raised to 80% and grading scale adjusted.
Community College, 6
Hospital Based, 1
Private, 6
Public Adult School, 0
Public High School, 7
No Program Changes, 52

Virginia Dept. of Health Professions Page 16 Profile of Nursing Education Programs 2008-09
The college froze admissions for the 2008-2009 academic year.
This was a new program. The first class will be admitted January 2010.
Hospital Based # of programs that implemented changes: 1
Decreased total program hours and approval letter dated 11/19/08 from VBON was source verification of approval.
Private # of programs that implemented changes: 6
8/09-Preceptorship Program implemented. The program includes faculty, student, and facility orientation. Objectives and evaluations. 10/09 NCLEX review class. This class was not part of the curriculum. It was designed for graduates who have not sat for boards the 1st time and for those who failed and needed a refresher prior to retesting.
As of December 10, 2008, Centura College changed their practical nursing curriculum from quarter hours to semester hours.
Centura College changed the practical nursing curriculum from quarter credit hours to semester credit hours in December 2008.
Curriculum has been revised. Program Hours changed from 1730 to 1470.
Transitioned from Quarter to Semester system with Virginia Board of nursing approval.
Virginia School of Nursing and Medical Institute, practical nursing program
had implemented a new change to its PN curriculum, academic policies and admission criteria.
Public High School # of programs that implemented changes: 7
Curriculum plan changes
Increased the passing grade to 80% in all academic courses in level 1 and
level 2. Students must achieve a "Pass" on the NCLEX practice exam (pass/fail course grade) to be eligible for graduation.
Mental Health Nursing was moved from year 2 to the end of year 1.
PNII clinical instructor and Director were reduced from 11 month employees to 10 month employees. Dosage calculation was taught during PNI. It was split between PNI and PNII. PVR will be taught in PNII this year.
The addition of Introduction to Health and Medical Sciences course through LCPS as a prerequisite for High school students.
Implemented mandatory drug testing.
Total Changes 20

Virginia Dept. of Health Professions Page 17 Profile of Nursing Education Programs 2008-09
PNE Student Information
Most PNE programs in Virginia were operating at over 90% of their current capacity. Table 9 presents the number of students qualified, admitted and enrolled in the 2008-09 academic year, as well as the number of unfilled student spaces, students on wait lists and total spaces available for new students. Using these figures, total student capacity has been calculated as the total of student enrollments and unfilled slots. Overall, 92.2% of the total capacity for PNE students was utilized in the 2008-09 academic year.
Table 9. PNE Student Admissions, Enrollments and Capacity in the 2008-09 Academic Year
During Academic Year 2008-2009: Community College
Hospital Based
Private Public Adult School
Public High School
Totals
# of Programs 20 3 20 4 25 72
# of applications received 1132 360 4562 365 1693 8112
# of applications qualified 741 213 3416 163 966 5499
# of qualified applicants admitted 687 171 2414 191 895 4358
# of applicants admitted who enrolled 599 142 2352 175 805 4073
Total Enrollments 671 93 2487 192 1034 4477
# of qualified applicants on 'wait list' 57 25 40 4 70 196
# of unfilled spaces 48 4 254 17 54 377
Total spaces available for new students 633 150 2567 150 777 4277
Capacity for PNE students a 719 97 2741 209 1088 4854
% of Capacity filled in 2008-09 b 93.3% 95.9% 90.7% 91.9% 95.0% 92.2%
a Capacity = # Total enrollment + unfilled slots b Percentage = Total enrollment /capacity
Figure 10 illustrates the total student body of PNE students distributed across the various
program types. More than half of the PNE student capacity in Virginia was currently held by 20 private programs. Public high school programs accounted for 22% of the state’s total capacity, followed by community colleges (15%). Public adult school programs and hospital-based PNE programs both accounted for only 6% of the total PNE capacity in Virginia in 2008-09.

Virginia Dept. of Health Professions Page 18 Profile of Nursing Education Programs 2008-09
Figure 10. PNE Student Capacity in Virginia in the 2008-09 Academic Year
Public High School, 1088, 22%
Hospital Based, 97, 2%
Community College, 719, 15%
Private, 2741, 57%
Public Adult School, 209, 4%
Community College
Hospital Based
Private
Public Adult School
Public High School
Figure 11. PNE Student Admissions, Enrollments and Unfilled Spaces in the 2008-09 Academic Year
8112
5499
4358 4073 4477
196 377
42774854
4562
3416
2414 2352 2487
40 254
2567 2741
1693 966895 805 1034
70 54777 1088
1132 741 687 599 67157 48
633 719
365 163 191 175 192 4 17 150 209
360213 171 142 93 25 4 150 97
0
1000
2000
3000
4000
5000
6000
7000
8000
9000
# ofapplications
received
# ofapplications
qualified
# of qualifiedapplicantsadmitted
# of applicantsadmitted who
enrolled
TotalEnrollments
# of qualifiedapplicants on
'wait list'
# of unfilledspaces
Total spacesavailable fornew students
Capacity forPNE students
Hospital Based
Public Adult School
Community College
Public High School
Private
Totals
Hospital Based
Public Adult School
Community College
Public High School
Private
Totals
Table 10 reports the reasons given by PNE programs for turning away qualified students
during the 2008-09 academic year. Most programs cite a lack of qualified faculty, classroom space and limited clinical sites as the primary factors.
Table 11 reports the reasons given by PNE programs for having some student spaces unfilled, the reasons offered most often were lack of qualified applicants, last minute drops from the program that could not be filled in a short time, and students who were admitted who could not attend for financial reasons. See Table 10 for the specifics.

Virginia Dept. of Health Professions Page 19 Profile of Nursing Education Programs 2008-09
Table 10. Reasons for Turning Away Qualified Applicants to PNE Programs
PNE Program Type Reasons for Turning Away Qualified Applicants # of Programs
Community College
Effective program capacity reached 2
Lack of classroom space, Effective program capacity reached 1
Lack of classroom space, Lack of clinical space 1
Lack of qualified faculty 1
Lack of qualified faculty, Lack of classroom space, Lack of clinical space, Effective program capacity reached, Other
1
Lack of qualified faculty, Lack of clinical space, Effective program capacity reached
2
Other 2
Unknown 2
Demand for LPN in region has drastically decreased and we have limited our numbers to accept
1
Did not meet academic/program requirements 1
Financial Issues, Personal Issues 1
Incomplete course work 1
Lack of perquisites courses 1
We did not admit students for the 2008-2009 academic year.
The College placed the program "on hold" and froze admissions for financial reasons.
1
Hospital Based
Effective program capacity reached 1
Lack of qualified faculty, Lack of classroom space 1
Lack of qualified faculty, Lack of classroom space, Lack of clinical space
1
Private
Effective program capacity reached 3
Other 6
Unknown 1
Unknown, Other 1
Did not pass criminal background check 1
financial 1
Financial Aid Issues 1
Lack of financial aid 1
Varied 1
Withdrew application 1 Public Adult School

Virginia Dept. of Health Professions Page 20 Profile of Nursing Education Programs 2008-09
Table 11. Reasons for Unfilled Spaces in PN Programs by Type
PNE Program Type
Reasons for Unfilled Space #
unfilled space
# of Program
s Community College
Lack of qualified applicants. Two withdrew prior to first
day; one withdrew after orientation but had not registered. One withdrew due to surgery after classes began.
8 1
Not enough qualified PN applicants to fill all 20 spaces. 5 1
Number of applicants decreased significantly. Targeted decreased enrollment with increased visibility of PN program in advertisements in region and improved advising for prospective students by enhancing all advising by counselors, A.D.N. nursing faculty & PN faculty to explore PN as an option - consistency in advisement & program promotion.
7 1
Positions unfilled due to financial reasons 2 1
Students did not meet prerequisites or students decided to enroll in an RN program.
19 1
Two of our high schools had slots, but did not have high school students to fill all slots
5 1
Two students who were admitted could not attend for financial reasons or personal issues. There were no more
2 1
Lack of classroom space 1
Lack of qualified faculty, Effective program capacity reached 1
Unknown 1
Public High School
Effective program capacity reached 6
Lack of classroom space 1
Lack of classroom space, Lack of clinical space 1
Lack of classroom space, Lack of clinical space, Effective program capacity reached
2
Lack of classroom space, Lack of clinical space, Other 1
Lack of qualified faculty 1
Lack of qualified faculty, Effective program capacity reached 1
Lack of qualified faculty, Lack of classroom space, Lack of clinical space, Effective program capacity reached
1
Lack of qualified faculty, Lack of clinical space 1
Lack of qualified faculty, Lack of clinical space, Effective program capacity reached
1
Other 1
Repeating students 1
They were accepted, but did not come 1

Virginia Dept. of Health Professions Page 21 Profile of Nursing Education Programs 2008-09
qualified applicants to fill these spaces.
Total 48 7
Hospital Based
There were last minute drops from the program and could not fill in short time spam
4 1
Total 4 1
Private
Based on the 134 students that were admitted we prepared spaces and maintained faculty for 85% of those students to begin their education. This left us with a total of 5 open spaces for the 2008-09 academic year.
5 1
Financial reasons. 10 1
Lack of qualified applicants. 36 1
Medical learning Center does not offer financial aid at this
time. Most of the qualified applicants required financial aid to become enrolled into the program.
75 1
Some applicants did not achieve an acceptable score on the TEAS Entrance Exam
46 1
Students dropped from program due to financial reasons and relocation
15 1
They withdrew their applications due to acceptance into an RN program, relocation or finances.
7 1
Unfilled spaces were due to student cancellations, no shows and drops.
18 1
We did not have enough applicants. In addition, students
making application could not pass the admission TEAS Test or they could not pass the criminal background check.
30 1
Total 242 9
Public Adult School
Adult students could not acquire funding for tuition. 7 1
No-shows 5 1
Once these students were accepted to the program, they
withdrew their application and it was too late to obtain additional students.
5 1
Total 17 3
Public High School
All students were admitted, one declined admission, 3
students were no call/no show's on the first day of class, 3 declined due to financial reasons
6 1
Usually admit 23 to 24 students, however due to budget constraints was instructed to only admit the number of students I felt I could advance to PNII even if a reduction in faculty occurred.
0 1
Lack of qualified applicants. 5 1

Virginia Dept. of Health Professions Page 22 Profile of Nursing Education Programs 2008-09
No more applicants 5 1
Our program has both adult and high school applicants. We generally take all qualified high school and adult applicants up to 60 applicant’s total. This year we had less than 60 qualified applicants and several of our accepted applicants did not actually enroll in classes.
6 1
Some of the high school students changed their mind at the
last minute and decided to pursue other course/program options.
14 1
Students were accepted into the program; however last minute circumstances caused the student to withdraw.
5 1
The high school class was filled at 25 students (the 2 wait
listed were high school students). We did not have 25 qualified adult students apply, thus leaving empty seats.
7 1
The program was allowed to enroll 40. We accept about 5 more than what we were allowed to cover what we know will be NO SHOWS. But when we enroll less than 40, it was too late to try to increase the roll by the deficit. For the past 3 years, we have accepted everyone who qualifies and do not have a "wait list".
0 1
The two students were offered admission but did not show up for the first day of class. When contacted, the students could not attend due to personal reasons. Due to time restraints, there was no way to admit other students.
2 1
We did not have 25 qualified applicants. 4 1
Total 54 11
The minimum grade point average (GPA) requirement for admission to PNE programs varies
from one program to another. 26 PNE programs reported a 2.0 minimum GPA required for admission, while 14 PNE programs required at least a 2.5 GPA, and seven PNE programs required a 3.0 GPA or better. There were nine PNE programs that did not require a minimum GPA for admission. Table 12 reports the minimum GPA requirements for admission and average GPA for students admitted for each program type. Table 12. Minimum and Average GPA Requirement for Admission by Program Type
PNE Program Type GPA # of Programs
Community College Minimum GPA requirement for admission .0 2
2.00 9
2.3 1
2.5 8
Total 20 Average GPA of admitted students 0.00 2
2.00 1
2.30 1
2.35 1
2.48 1

Virginia Dept. of Health Professions Page 23 Profile of Nursing Education Programs 2008-09
2.50 2
2.60 1
2.75 1
2.80 2
3.00 2
3.20 1
3.30 1
Total 16 Hospital Based Minimum GPA requirement for admission 2.0 2
Total 2 Average GPA of admitted students 2.60 1
2.68 1
Total 2 Private Minimum GPA requirement for admission .0 5
2.0 3
2.50 1
3.0 4
200.0 1
Total 14 Average GPA of admitted students 0.00 4
2.00 1
2.19 1
2.30 1
3.00 5
3.08 1
3.20 1
Total 14 Public Adult School Minimum GPA requirement for admission .0 1
2.0 1
80.00 1
Total 3 Average GPA of admitted students 2.30 1
2.34 1
80.00 1
Total 3 Public High School Minimum GPA requirement for admission .00 1
2.0 11
2.2 1
2.25 1
2.5 5
2.8 1
3.0 3

Virginia Dept. of Health Professions Page 24 Profile of Nursing Education Programs 2008-09
85.0 1
Total 24 Average GPA of admitted students 2.00 1
2.30 1
2.38 1
2.50 1
2.60 3
2.67 1
2.73 1
2.80 3
2.85 1
2.90 2
3.00 2
3.12 1
3.20 1
3.21 1
77.00 1
95.00 1
Total 22
The majority of students enrolled in PNE programs during the 2008-09 academic year were
female. Only 8% of the total PNE students enrolled were male. Private programs enrolled 69% of the total males enrolled in PNE programs and 54.5% of total CNAs enrolled in PNE programs, while Public high school programs enrolled 16.5% of the total males and 22.9% of total CNAs enrolled in PNE programs. Table 13 summarizes the number of PNE students that enrolled during the 2008-09 academic year, the number of men that enrolled in class, and the number that were CNAs.
Figure 12 illustrates PNE students that enrolled during the 2008-09 academic year. More than
half (55.5%) of total PN student enrollments were in Private programs; 25.3% enrolled in Public High School programs, 14.9% enrolled in Community College programs, 4.3% enrolled in Public Adult School programs, and 2.1% enrolled in Hospital Based programs.
Table 13. Number of Male Students and CNAs Enrolled by Program Type
During Academic Year 2008-09:
Community College
Hospital Based
Private Public Adult School
Public High
School Total
# of Programs 20 3 20 4 25 72
Total PNE student Enrolled 671 93 2487 192 1034 4477
# who were Male 38 2 264 13 63 380
% who were Male 6% 2% 11% 7% 6% 8%
# who were CNAs 168 21 592 55 249 1085
% who were CNAs 25% 23% 24% 29% 24% 24%

Virginia Dept. of Health Professions Page 25 Profile of Nursing Education Programs 2008-09
Figure 12. Number of Male Students and CNAs Enrolled by Program Type
1034
4477
2487
671
19293
38 2 13 63
380
16821
592
55249
1085
264
0
500
1000
1500
2000
2500
3000
3500
4000
4500
5000
CommunityCollege
Hospital Based Private Public AdultSchool
Public HighSchool
Total
# o
f s
tud
en
ts
Total PNstudentsEnrolled
# of thosewho wereCNAs
# of thosewho wereMale
PNE Student Attrition
Almost half (49%) of PNE students scheduled to graduate during the 2008-2009 academic
year (August 1 - July 31), according to the curriculum schedule they enrolled in when they first came into the program actually completed the program on time, while 31% of students scheduled to graduate left the program and were not expected to return. Table 14 reports the number of students who were scheduled to graduate, number of students who completed the program on time, and the students who left the program and were not expected to return.
Table 14. Student Attrition in PNE Program Types in Virginia
# Students Community College
Hospital Based
Private Public Adult School
Public High
School Total
# of students who were scheduled to graduate
586 150 1719 111 950 3516
# of students who completed the program on time
340 115 888 61 317 1721
% students who completed the program on time 58% 77% 52% 55% 33% 49%
# of students who left the program and not expected to return
120 27 591 46 302 1086
% students who left the program and were not expected to return 20% 18% 34% 41% 32% 31%

Virginia Dept. of Health Professions Page 26 Profile of Nursing Education Programs 2008-09
Although hospital based programs have the lowest number of total students scheduled to graduate (4.3%), 77% of those students graduated from hospital based programs completed the program on time compared to those students in public high school programs (33%). Eighteen percent of students scheduled to graduate left the program and were not expected to return in hospital based programs, compared to 41% in public adult school programs. Figure 13 compares the number of students who left the program by program type. Table 15 reports the number of students who left the program by semester/trimester and program type. The majority of students left the program during the 1st semester and 2nd semester as shown in Figure 14.
Figure 13. Student Attrition in PNE Programs by Program Type
586
340
120 150 11527
1719
888
591
111 61 46
950
317 302
3516
1721
1086
0
500
1000
1500
2000
2500
3000
3500
4000
Community College Hospital Based Private Public Adult School Public High School Total
# of studentswere scheduledto graduate
# of studentscompleted theprogram on time
# of students leftthe program andnot expected toreturn
Table 15. Students Attrition among PNE Students Admitted for 2008-09
For those students admitted for 2008-09, how many left the program
Community College
Hospital Based
Private Public Adult School
Public High
School Totals
# of Programs 20 3 20 4 25 72
in the 1st semester 79 4 285 7 110 485
in the 2nd semester 71 . 180 31 114 396
in the 3rd semester 24 2 83 1 70 180
in the 4th semester 15 . 13 1 23 52
in the 5th semester 25 . 1 0 2 28
Or
in the 1st trimester 35 16 7 6 20 84
in the 2nd trimester 24 9 20 1 4 58
in the 3rd trimester 3 4 26 0 0 33
Totals 276 35 615 47 368 1316

Virginia Dept. of Health Professions Page 27 Profile of Nursing Education Programs 2008-09
Figure 14. Students Attrition in PNE Programs by Program Type
7
31
1 1 04 0 2 0 0
7971
2415
25
285
180
83
131
110 114
70
23
20
50
100
150
200
250
300
First Semester/Quarter SecondSemester/Quarter
Third Semester/Quarter FourthSemester/Quarter
Fifth Semester/Quarter
Public Adult School
Hospital Based
Community College
Private
Public High School
PNE Graduates:
Table 16 reports PNE students who graduated during the 2008-09 academic year. More than
half (55%) of total PNE students who graduated were in private programs; 18% graduated from public high school programs, 17% graduated from community college programs, 6% graduated from hospital based programs and 3% graduated from public adult school programs.
Table 16. Graduates Racial/Ethnic categories in PNE programs by Program Type Type of program
Community College
Hospital Based
Private Public Adult School
Public High School
Total # of Graduates
# % # % # % # % # % # %
White, non-Hispanic 265 13.9 79 4.2 348 18.3 32 1.7 261 13.7 985 51.8
Black, non-Hispanic 60 3.2 38 2.0 597 31.4 28 1.5 68 3.6 791 41.6
Hispanic of any race 7 .4 4 .2 48 2.5 4 .2 15 .8 78 4.1
Asian 5 .3 3 .2 37 1.9 0 .0 8 .4 53 2.8 American Indian / Alaskan Native
0 .0 0 .0 3 .2 0 .0 0 .0 3 .2
Native Hawaiian / Pacific Islander
1 .1 0 .0 2 .1 0 .0 0 .0 3 .2
More than one race 2 .1 0 .0 32 1.7 0 .0 5 .3 39 2.1
Race unknown 2 .1 0 .0 21 1.1 0 .0 5 .3 28 1.5
Total students graduated
342 17 124 6 1088 55 64 3 362 18 1900 100
Note: When asked directly how many students, total, graduated, the answer received was 1900, not 1980 as reported. It is possible that some schools were not able to determine when some students graduated and those were left out of the counts in this Table.

Virginia Dept. of Health Professions Page 28 Profile of Nursing Education Programs 2008-09
The racial characteristics of Virginia’s PNE graduates are illustrated in Figure 15. More than half (51.8%) of PNE Graduates were White, 41.6% Black, and 4.1% Hispanic. Table 16 reports the number of graduates in each ethnic category. Approximately 75.5% of the Black graduates in Virginia in the 2008-09 academic year graduated from private programs. More than half (54.8%) of private program graduates were Black while the majority of community college graduates (77.5%) and public high school programs graduates (72%) were White.
Figure 15. Graduates Racial/Ethnic categories in PNE programs by Program Type
985
791
78 533 3 39 28
348
597
48 37 3 2 32 21261
6815 8 0 0 5 5
265
607 5 0 1 2 2
32 28 4 0 0 0 0 079 38 4 3 0 0 0 00
100
200
300
400
500
600
700
800
900
1000
# o
f PN
Pro
gra
ms
White, non-Hispanic
Black, non-Hispanic
Hispanic ofany race
Asian AmericanIndian /AlaskanNative
NativeHawaiian /
PacificIslander
More thanone race
Raceunknown
Hospital Based
Public Adult School
Community College
Public High School
Private
Total
Hospital Based
Public Adult School
Community College
Public High School
Private
Total
The majority of students graduated in PNE programs during the academic year 2008-09 were
female. Eight percent of the total PNE students who graduated were male. Private programs graduated 67.1% of the total males graduating from PNE programs, and graduated 56.7% of total CNAs who graduated from PNE programs. Public high school programs graduated 14.8% of the total males and 19.1% of total CNAs who graduated from PNE programs. Table 17 summarizes the number of PNE students who graduated during the 2008-09 academic year, the number of men that graduated, and the number of graduates that were CNAs.
Table 17. Number of Male Students and CNA Graduates by Program Type
Community College
Hospital Based
Private Public Adult School
Public High
School Total
# of Programs 20 3 20 4 25 72
Total PNE students Enrolled 342 118 1045 62 333 1900
# who were Male 16 6 104 6 23 155
% who were Male 5% 5% 10% 10% 7% 8%
# who were CNAs 112 24 370 22 125 653
% who were CNAs 33% 20% 35% 35% 38% 34%

Virginia Dept. of Health Professions Page 29 Profile of Nursing Education Programs 2008-09
Figure 16. Number of Male Students and CNA Graduates by Program Type
118 62
342
1045
1900
333
16 6 6 23
15511224
370
22125
653
104
0
200
400
600
800
1000
1200
1400
1600
1800
2000
CommunityCollege
HospitalBased
Private Public AdultSchool
Public HighSchool
Total
# o
f st
ud
ents
Total PNstudentEnrolled
# those whowere CNAs
# those whowere Male
Only 3.4% of the students (65) graduating from PNE programs during the academic year 2008-09 also had a degree in a discipline other than nursing. Thirty-one students graduated from private programs, 21 from community colleges, six from public high schools, five from hospital based programs, and two students from public adult school programs.
Table 18. Graduates having a degree in a discipline other than nursing
Community College
Hospital Based
Private Public Adult School
Public High
School Total
PNE Program Type
# % # % # % # % # % # %
# of Programs 20 27.8% 3 4.2% 20 27.8% 4 5.6% 25 34.7% 72 100.0%
Total PN student Graduates 342 18.0% 118 6.2% 1045 55.0% 62 3.3% 333 17.5% 1900 100.0%
# of graduates also having a degree in a discipline other than nursing
21 32.3% 5 7.7% 31 47.7% 2 3.1% 6 9.2% 65 100.0%

Virginia Dept. of Health Professions Page 30 Profile of Nursing Education Programs 2008-09
Full Time (FT) Faculty in PN Programs
Among the PNE programs in the state responding to the survey, a total of 287 full-time faculty members including those in administration were employed on Oct. 15, 2009. Twenty-one positions were vacant, and 13 positions were being actively recruited. Programs also reported a total of 55 new faculty appointments during the year. Resignations during the year totaled 37 for full-time faculty.
Table 19. Full Time Faculty: New Appointments/ Resignations and Distributions
Community College
Hospital Based
Private Public Adult School
Public High
School Totals For Academic Year
2008-09:
# # # # # #
Total number of full-time nursing faculty
59 14 114 12 88 287
Total number of full-time nursing faculty positions
7 0 9 1 4 21
Total number of vacant full-time positions being actively recruited
2 0 7 1 3 13
# of new full-time nursing faculty appointments
1 2 43 1 8 55
# of full-time nursing faculty resigned 2 2 19 2 12 37
Figure 17 illustrates that the majority (78.9%) of full time faculty were White, and 17.4% were
Black. Almost half (45.7%) of White full time faculty were employed by public high schools, 13.9% of White full time faculty were employed by community colleges, and 13.9% were employed by private programs.(See Table 20 for details.)
Table 20. Full Time Faculty Racial/Ethnic categories by Program Type
# FT Faculty Community College
Hospital Based
Private Public Adult School
Public High School
Total
# % # % # % # % # % # %
White, non-Hispanic 52 13.9% 11 2.9% 52 13.9% 9 2.4% 171 45.7% 295 78.9%
Black, non-Hispanic 6 1.6% 1 .3% 42 11.2% 3 .8% 13 3.5% 65 17.4%
Hispanic of any race 0 .0% 0 .0% 2 .5% 0 .0% 2 .5% 4 1.1%
Asian 1 .3% 0 .0% 3 .8% 0 .0% 0 .0% 4 1.1% American Indian / Alaskan Native
0 .0% 0 .0% 2 .5% 0 .0% 0 .0% 2 .5%
Native Hawaiian / Pacific Islander
0 .0% 0 .0% 0 .0% 0 .0% 0 .0% 0 .0%
More than one race 0 .0% 0 .0% 2 .5% 0 .0% 1 .3% 3 .8%
Race unknown 0 .0% 0 .0% 1 .3% 0 .0% 0 .0% 1 .3%
Total 59 16% 12 3% 104 28% 12 3% 187 50% 374 100%

Virginia Dept. of Health Professions Page 31 Profile of Nursing Education Programs 2008-09
Figure 17. Full Time Faculty Racial/Ethnic categories by Program Type
295
65
4 4 2 0 3 152 42
2 3 2 0 2 1
171
13 2 0 0 0 1 052
6 0 1 0 0 0 09 3 0 0 0 0 0 0
11 1 0 0 0 0 0 00
50
100
150
200
250
300
White,non-
Hispanic
Black, non-Hispanic
Hispanicof any race
Asian AmericanIndian /AlaskanNative
NativeHawaiian /
PacificIslander
More thanone race
Raceunknown
Hospital Based
Public Adult School
Community College
Public High School
Private
Total
Hospital Based
Public Adult School
Community College
Public High School
Private
Total
Table 21 reports the age characteristics of full time faculty in PNE programs. The majority
(88%) of total full time faculty were between 34-65 years as shown in Figure 18. Well over a third of full time faculty in PNE programs (39%) were employed by private programs, while 32% were employed by public high schools, and 21% were employed by community college programs.
Table 21. Faculty in PNE Programs by Age
Community College Hospital Based
Private Public Adult School
Public High
School Total
# FT Faculty
# % # % # % # % # % # %
Less than 25 1 .4% 0 .0% 0 .0% 0 .0% 1 .4% 2 .7%
26 - 34 2 .7% 1 .4% 13 4.6% 0 .0% 7 2.5% 23 8.1%
35 - 44 20 7.0% 3 1.1% 24 8.5% 2 .7% 22 7.7% 71 25.0%
45 - 54 19 6.7% 3 1.1% 42 14.8% 3 1.1% 29 10.2% 96 33.8%
55 - 64 13 4.6% 4 1.4% 29 10.2% 7 2.5% 30 10.6% 83 29.2%
65 - 74 4 1.4% 1 .4% 2 .7% 0 .0% 2 .7% 9 3.2%
75 and over 0 .0% 0 .0% 0 .0% 0 .0% 0 .0% 0 .0%
Age unknown
0 .0% 0 .0% 0 .0% 0 .0% 0 .0% 0 .0%
Total 59 21% 12 4% 110 39% 12 4% 91 32% 284 100%

Virginia Dept. of Health Professions Page 32 Profile of Nursing Education Programs 2008-09
Figure 18. Full Time Faculty Age Range
.7%
8.1%
33.8%
29.2%
3.2%
.0%
25.0%
.0%
5.0%
10.0%
15.0%
20.0%
25.0%
30.0%
35.0%
40.0%
Less than 25 26 - 34 35 - 44 45 - 54 55 - 64 65 - 74 75 and over
Total Full Time Faculty
Both Figure 19 and Table 22 show that almost all (94.8%) full time faculty in PNE programs were female and only 15 (5.2%) were male. Thirteen out of 15 (86.7%) male full time faculty were employed by private programs, and two (13.3%) were employed by community college programs. All full time faculties employed in hospital based, public high, and public adult school programs were female.
Table 22. Full Time Faculty in PNE programs by Gender
Community College
Hospital Based
Private Public Adult School
Public High
School Total
# FT Faculty
# % # % # % # % # % # %
Female 57 19.9% 12 4.2% 100 35.0% 12 4.2% 90 31.5% 271 94.8%
Male 2 .7% 0 .0% 13 4.5% 0 .0% 0 .0% 15 5.2%
Gender unknown 0 .0% 0 .0% 0 .0% 0 .0% 0 .0% 0 .0%
Total 59 21% 12 4% 113 40% 12 4% 90 31% 286 100%

Virginia Dept. of Health Professions Page 33 Profile of Nursing Education Programs 2008-09
Figure 19. Full Time Faculty in PNE programs by Gender
271
15 0100
13 090
0 057
2 0
12 0 0
12 0 00
50
100
150
200
250
300
Female Male Genderunknown
Hospital Based
Public Adult School
Community College
Public High School
Private
Total
Hospital Based
Public Adult School
Community College
Public High School
Private
Total
Most (86.1%) of PNE programs reported that the number of full-time positions budgeted for
programs was adequate to meet their current needs, while 8 (11.1%) programs reported that the number of full-time positions budgeted was not adequate to meet their current needs. (See Table 23.)
Table 23. Was the Number of Full-time Positions Budgeted for the Program Adequate to Meet Needs?
Community College
Hospital Based
Private Public Adult School
Public High School
Total # FT Faculty replied: # % # % # % # % # % # %
No 2 2.8% 0 .0% 1 1.4% 1 1.4% 4 5.6% 8 11.1%
None 2 2.8% 0 .0% 0 .0% 0 .0% 0 .0% 2 2.8%
Yes 16 22.2% 3 4.2% 19 26.4% 3 4.2% 21 29.2% 62 86.1%
Total 20 27.8% 3 4.2% 20 27.8% 4 5.6% 25 34.7% 72 100.0%

Virginia Dept. of Health Professions Page 34 Profile of Nursing Education Programs 2008-09
Table 24 reports the reasons why full time faculty positions were not adequate to meet the programs needs. Five out of eight PNE programs reported that budget was the reason for their shortage in full time faculty.
Table 24. Reasons Why Full-time Positions were not Adequate to Meet PNE Needs
Program Type Reasons # programs
Community College
Budget 1
Fulltime vacancy filled during faculty search with adjunct faculty personnel
1
There were 2 fulltime faculty, of the 2 faculty, 1 faculty member was on long term leave for a medical condition and her position was still paid, but vacant in that no one was filling her position and do not have an expected return date. This has left the program short handed. Part time faculty have taken courses, but program director was responsible for all full time work (advisement, course coordination, etc.)
1
Public Adult School
Budget 1
No back-up in case of illness, etc. 1
Public High School
Budget 3
A reduction in faculty was proposed last year, stimulus money prevented the reduction from being implemented, however I expect the same reduction will be proposed this year.
1
As of November 1st we have employed the third faculty member 1

Virginia Dept. of Health Professions Page 35 Profile of Nursing Education Programs 2008-09
Part Time Faculty in PNE Programs
Table 25 reports that the total number of part time and adjunct nursing faculty employed on October 15th, 2009 was 283, 10 vacant positions, and 15 positions being actively recruited. Most (71%) part time and adjunct nursing faculty were employed by private programs, 22% by community colleges, 2.8% by public adult schools, 2.1% by public high schools, and 1.4% by hospital based programs.
Table 25. Part Time Faculty in PNE Programs, Vacant and Actively Recruited
Community College
Hospital Based
Private Public Adult School
Public High
School Totals
For 2008-2009 Academic Year
# # # # # #
Total # of part-time and adjunct nursing faculty employed on Oct. 15, 2009.
64 4 201 8 6 283
Total # of part-time nursing faculty positions vacant on Oct. 15, 2009.
2 2 6 0 0 10
Total number of vacant part-time positions being actively recruited on Oct. 15, 2009
6 2 7 0 0 15
Figure 20 and Table 26 both illustrate that 63.4% of part time faculty was White, 32.5% were
Black and 2.7% were Asian. More than half (61.1%) of White part time faculty were employed by private programs, and 31.9% of White part time faculty were employed by community college programs. Most Black part time faculty members (89.5%) were employed by private programs. All three Hispanic, eight Asian, and one Native Hawaiian part time faculty members were employed by private programs.
Table 26. Part Time Faculty Racial/Ethnic Categories by Program Type
# PT Faculty Community College
Hospital Based
Private Public Adult School
Public High School
Total
# % # % # % # % # % # %
White, non-Hispanic 59 20.2% 4 1.4% 113 38.7% 4 1.4% 5 1.7% 185 63.4%
Black, non-Hispanic 5 1.7% 0 .0% 85 29.1% 4 1.4% 1 .3% 95 32.5%
Hispanic of any race 0 .0% 0 .0% 3 1.0% 0 .0% 0 .0% 3 1.0%
Asian 0 .0% 0 .0% 8 2.7% 0 .0% 0 .0% 8 2.7%
American Indian / Alaskan Native
0 .0% 0 .0% 0 .0% 0 .0% 0 .0% 0 .0%
Native Hawaiian / Pacific Islander
0 .0% 0 .0% 1 .3% 0 .0% 0 .0% 1 .3%
More than one race 0 .0% 0 .0% 0 .0% 0 .0% 0 .0% 0 .0%
Race unknown 0 0 0 0 0 0 0 0 0 0 0 0
Total 64 22% 4 1% 210 72% 8 3% 6 2% 292 100%

Virginia Dept. of Health Professions Page 36 Profile of Nursing Education Programs 2008-09
Figure 20. Part Time Faculty Racial/Ethnic Categories by Program Type
185
95
3 8 0 1 0 0
113
85
3 8 0 1 0 05 1 0 0 0 0 0 0
59
5 0 0 0 0 0 04 4 0 0 0 0 0 0
4 0 0 0 0 0 0 00
20
40
60
80
100
120
140
160
180
200
White, non-Hispanic
Black, non-Hispanic
Hispanic ofany race
Asian AmericanIndian /AlaskanNative
NativeHaw aiian /
Pacif icIslander
More thanone race
Raceunknow n
Hospital Based
Public Adult School
Community College
Public High School
Private
Total
Hospital Based
Public Adult School
Community College
Public High School
Private
Total
Table 27 reports the age characteristics of part time faculty in PNE programs. Sixty-seven
percent of total full time faculty was between 34 and 55 years as shown in Figure 21, and 17.7% between 54 and 64.
Table 27. Part Time Faculty in PNE by Age Range Community
College Hospital Based
Private Public Adult School
Public High School
Total Part Time Faculty # PT Faculty
# % # % # % # % # % # %
Less than 25 2 .7% 0 .0% 3 1.0% 0 .0% 0 .0% 5 1.7%
26-34 2 .7% 0 .0% 25 8.5% 1 .3% 0 .0% 28 9.5%
35-44 28 9.5% 4 1.4% 67 22.8% 0 .0% 3 1.0% 102 34.7%
45-54 22 7.5% 1 .3% 66 22.4% 6 2.0% 0 .0% 95 32.3%
55-64 10 3.4% 0 .0% 39 13.3% 1 .3% 2 .7% 52 17.7%
65-74 0 .0% 0 .0% 8 2.7% 0 .0% 1 .3% 9 3.1%
75 and over 0 .0% 0 .0% 2 .7% 0 .0% 0 .0% 2 .7%
Age unknown 0 .0% 0 .0% 0 .0% 0 .0% 1 .3% 1 .3%
Total 64 22% 5 2% 210 71% 8 3% 7 2% 294 100%

Virginia Dept. of Health Professions Page 37 Profile of Nursing Education Programs 2008-09
Figure 21. Part Time Faculty in PNE by Age Range
1.7%
9.5%
32.3%
17.7%
3.1%.7%
34.7%
.0%
5.0%
10.0%
15.0%
20.0%
25.0%
30.0%
35.0%
40.0%
Less than25
26 - 34 35 - 44 45 - 54 55 - 64 65 - 74 75 andover
Total Part Time Faculty
Table 28 reports that most (90.1%) part time faculty in PNE programs were female and only
28 (9.9%) were male. The vast majority (89.3%) of male part time faculty were employed by private programs, and three (10.7%) were employed by community college programs. All part time faculties employed in hospital based programs, public high school programs, and public adult school programs were female.
Table 28. Part Time Faculty in PNE programs by Gender
Community College
Hospital Based
Private Public Adult School
Public High
School Total
# PT Faculty
# % # % # % # % # % # % Female 60 21.2% 4 1.4% 177 62.5% 8 2.8% 6 2.1% 255 90.1% Male 3 1.1% 0 .0% 25 8.8% 0 .0% 0 .0% 28 9.9% Gender unknown 0 .0% 0 .0% 0 .0% 0 .0% 0 .0% 0 .0%
Total 63 22% 4 1% 202 71% 8 3% 6 2% 283 100%
Figure 22. Part Time Faculty in PNE Programs by Gender
255
280
177
250
6 0 060
3 0
8 0 0
4 0 00
50
100
150
200
250
300
Female Male Genderunknown
Hospital Based
Public Adult School
Community College
Public High School
Private
Total
Hospital Based
Public Adult School
Community College
Public High School
Private
Total

Virginia Dept. of Health Professions Page 38 Profile of Nursing Education Programs 2008-09
Table 29 report the highest degrees held by PNE directors. Only one (1.4%) PNE director had a doctorate degree, 30.5% of PNE program directors had masters in nursing degrees (22 programs), 18.1% of program directors had non-nursing master’s degree (13 programs), 31.9% of program directors had nursing baccalaureate (23 programs). One program director was reported as having a non-nursing bachelors degree, one as having a doctorate in education, and two as having ADN. Other degrees reported were “Masters of Science Comm. Health / Health Care Management, MBA, MSN, FNP-C,” and one program director reported working on a master’s project.
Table 29. Highest Degree Held by PN Program Directors by Program Type Community
College Hospital Based
Private Public Adult School
Public High School
Totals Directors Degree
# # # # # #
ADN 0 0 1 0 1 2
BSN 5 0 7 1 10 23
EdD 0 0 0 0 1 1
MSN 8 1 6 2 5 22
Non-nursing BA/BS 0 0 0 0 1 1
Non-nursing Masters 3 1 4 1 4 13
None 2 1 1 0 2 6
Other 2 0 1 0 0 3
PhD 0 0 0 0 1 1
Totals 20 3 20 4 25 72
Disruptions in the Full-Time Nursing Faculty
Thirty-four out of 72 (47.2%) PNE programs reported that they expect the same level of
disruption in full time nursing faculty again this year. Twenty-four programs (33.3%) reported that they expect less disruption, and five programs (6.9%) reported that they expect more. Table 30 provides the anticipated level of disruption in PNE programs by program type.
Table 30. Expected Disruption within Full-time Nursing Faculty
Level of Disruption Community
College Hospital Based
Private Public Adult School
Public High
School Total
# # # # # #
Expect about the same
10 2 10 1 11 34
Expect less 3 1 9 2 9 24
Expect more 2 0 0 1 2 5
None 5 0 1 0 3 9

Virginia Dept. of Health Professions Page 39 Profile of Nursing Education Programs 2008-09
Registered Nurse Education Programs Types of Programs
In October, 2009, there were 68 Registered Nurse (RN) Education Programs in operation in
Virginia. Table 31 illustrates the different types of RN Programs. Associate Degree, Baccalaureate Degree, and Diploma represent 88.2% of RN Programs, while online programs (Associate Degree Online and Diploma Online) and accelerated programs (Accelerated Baccalaureate Degree and Accelerated Masters Degree) represent the remaining 11.8% as shown in figure 23. Students graduating from any of these program types were eligible to take the National Council Licensure Examination for Registered Nurses.
Table 31. Registered Nurse (RN) Education Program Types in Virginia
RN Program Type # of programs % of Total
Associate Degree 37 54.4%
Baccalaureate Degree 17 25.0%
Diploma 6 8.8%
Accelerated Baccalaureate Degree 3 4.4%
Accelerated Masters Degree 2 2.9%
Associate Degree Online 2 2.9%
Diploma Online 1 1.5%
Total 68 100.0%
Figure 23. Registered Nurse (RN) Education Program Types in Virginia
Associate Degree54.4%
Accelerated Baccalaureate Degree
4.4%
Diploma8.8%
Baccalaureate Degree25.0%
Diploma On-line1.5%
Accelerated Masters Degree2.9%
Associate Degree On-line2.9%
Associate Degree
Baccalaureate Degree
Diploma
AcceleratedBaccalaureate Degree
Accelerated MastersDegree
Associate Degree On-line
Diploma On-line

Virginia Dept. of Health Professions Page 40 Profile of Nursing Education Programs 2008-09
Table 32. Number of RN to Baccalaureate Degree Programs RN to Baccalaureate Degree Program Type of Program # %
Associate Degree 1 5.0%
Baccalaureate Degree 14 70.0%
Diploma 0 .0%
Accelerated Baccalaureate Degree 3 15.0%
Accelerated Masters Degree 2 10.0%
Associate Degree Online 0 .0%
Diploma Online 0 .0%
Total 20 100.0%
Twenty out of 68 (29%) RN programs have a RN to baccalaureate degree program. Table 32 summarizes the number of such programs by program type.
Map 2. Registered Nurse Education Programs in Virginia

Virginia Dept. of Health Professions Page 41 Profile of Nursing Education Programs 2008-09
Accreditation Status RN programs accredited by the national accrediting agencies differ by program type.
Figure 24 illustrates how the different types of accreditation were distributed in the different program types. Approximately 66% of RN programs were accredited, 14 (21%) programs were accredited by the Commission on Collegiate Nursing Education (CCNE), 29 (43%) programs were accredited by the National League for Nursing Accrediting Commission (NLNAC), and two (3%) programs were accredited by both agencies. Tables 33 and 34 report the number of programs accredited by CCNE and NLNAC and accreditation dates by program type. More than half (37 out of 68 or 54.4%) RN programs were accredited by other accrediting organizations, 30 (approx. 44%) of them by Commission on Colleges of the Southern Association of Colleges and Schools (SACS). (See Table 35 for details.)
Figure 24. RN Programs Accredited by NLNAC and CCNE
Table 33. Programs Accredited by NLNAC
Accelerated
Baccalaureate Accelerated
Masters Associate
Associate Online
Baccalaureate Diploma Diploma Online
Total %
Not Accredited 0 0 19 1 2 0 1 23 34%
CCNE 1 1 0 0 12 0 0 14 21%
NLNAC. 2 1 18 1 1 6 0 29 43%
Both 0 0 0 0 2 0 0 2 3%
Total 3 2 37 2 17 6 1 68 100%
Accelerated Baccalaureate Degree
CCNE, 1, 33%
NLNAC., 2, 67%
Accelerated Masters Degree
CCNE, 1, 50%
NLNAC., 1, 50%
Associate Degree
Not accredited,
19, 51%
NLNAC., 18, 49%
Associate Degree On-line
NLNAC., 1, 50%
Not accredited,
1, 50%
Baccalaureate Degree
NLNAC., 1, 6%Both, 2,
12%
Not accredited,
2, 12%
CCNE, 12, 70%
Diploma
NLNAC., 6,
100%
Diploma On-line
Not
accredit ed,
1, 100%
Total
Not accredited, 23, 34%
CCNE, 14, 21%
Both, 2, 3%
NLNAC., 29, 42%
Not accredited
CCNE
NLNAC.
Both

Virginia Dept. of Health Professions Page 42 Profile of Nursing Education Programs 2008-09
Table 34. RN Programs Accreditation Dates by Program Type Type of Program Accrediting Agency Date of most recent Accreditation #
07-Jul-2002 1 12-Oct-2004 1 NLNAC
Total 2 30-Jun-2009 1
Accelerated Baccalaureate Degree
CCNE Total 1
07-Jul-2002 1 NLNAC Total 1
24-Apr-2004 1 Accelerated Masters Degree
CCNE Total 1
23-Jan-2001 1 17-Jul-2002 3 16-Jul-2003 1 30-Mar-2004 1 13-Jul-2005 1 05-Oct-2006 1 06-Oct-2006 2 15-Oct-2006 3 21-Mar-2007 1 30-Jul-2007 1 30-Oct-2007 1 20-Feb-2008 1 05-Feb-2009 1
NLNAC
Total 18 23-Jan-2001 1
Associate Degree
CCNE Total 1
20-Feb-2008 1 Associate Degree Online NLNAC Total 1
07-Jul-2002 1 09-Feb-2009 2 NLNAC
Total 3 29-Sep-2001 3 30-Jun-2003 1 03-Oct-2003 1 21-Apr-2004 1 24-Apr-2004 1 09-Oct-2004 2 25-Oct-2004 1 12-Apr-2008 1 13-Apr-2009 1 01-Oct-2009 1 23-Oct-2009 1
Baccalaureate Degree
CCNE
Total 14 01-Mar-2002 1 16-Jul-2003 1 01-Mar-2004 1 03-Aug-2005 1 01-Oct-2006 1 07-May-2007 1
Diploma NLNAC
Total 6

Virginia Dept. of Health Professions Page 43 Profile of Nursing Education Programs 2008-09
Table 35. Number of programs accredited by other accrediting institutions.
Accrediting agencies # of programs
% of total RN
programs
Commission on Colleges of the Southern Association of Colleges and Schools (SACS) 30 44%
The Accrediting Council for Independent Colleges and Schools (ACICS) 4 6%
Accrediting Bureau of Health Education Schools (ABHES ) 1 1% Commission of the Council on Occupational Education (COE) 1 1% Middle States and State Council of Higher Education for Virginia (SCHEV)* 1 1%
Total 37 54% * SCHEV was not an accrediting body; however, it provides program approval.
Program Characteristics:
Most RN education programs in Virginia run on a semester schedule as shown in Figure 25,
although three diploma programs use a trimester, and 2 programs (one associate degree program and one baccalaureate degree program) use a quarter schedules. Table 36 shows the number of programs using semesters, quarters, and trimesters for each program type.
Table 36. Structure of RN Education Programs by Program Type Program Structure
Program Type Quarters Semesters Trimesters Total
# 0 3 0 3 Accelerated Baccalaureate Degree % .0% 4.4% .0% 4.4%
# 0 2 0 2 Accelerated Masters Degree
% .0% 2.9% .0% 2.9%
# 1 36 0 37 Associate Degree
% 1.5% 52.9% .0% 54.4%
# 0 2 0 2 Associate Degree Online
% .0% 2.9% .0% 2.9%
# 1 16 0 17 Baccalaureate Degree
% 1.5% 23.5% .0% 25.0%
# 0 3 3 6 Diploma
% .0% 4.4% 4.4% 8.8%
# 0 1 0 1 Diploma Online
% .0% 1.5% .0% 1.5%
# 2 63 3 68 Total
% 2.9% 92.6% 4.4% 100.0%

Virginia Dept. of Health Professions Page 44 Profile of Nursing Education Programs 2008-09
Figure 25. Structure of RN Education Programs by Program Type
Trimesters4.4%Quarters
2.9%
Semesters92.6%
QuartersSemestersTrimesters
The number of semesters, quarters or trimesters in program curricula range from two to 12 or more. The majority (73.5%) of RN programs have four or five semesters, quarters or trimesters in their curriculum. (See Table 37 for more details.)
Table 37. Number of Semesters, Quarters or Trimesters in Program Curricula by Program Type
Number of semesters, quarters or trimesters in a program Type of Program
2 3 4 5 6 8 12 or more
Total
# 0 0 2 1 0 0 0 3 Accelerated Baccalaureate
% .0% .0% 2.9% 1.5% .0% .0% .0% 4.4%
# 0 0 0 1 1 0 0 2 Accelerated Masters
% .0% .0% .0% 1.5% 1.5% .0% .0% 2.9%
# 0 2 18 17 0 0 0 37 Associate
% .0% 2.9% 26.5% 25.0% .0% .0% .0% 54.4%
# 0 0 0 2 0 0 0 2 Associate Online
% .0% .0% .0% 2.9% .0% .0% .0% 2.9%
# 1 1 4 2 2 6 1 17 Baccalaureate
% 1.5% 1.5% 5.9% 2.9% 2.9% 8.8% 1.5% 25.0%
# 0 0 0 2 2 2 0 6 Diploma
% .0% .0% .0% 2.9% 2.9% 2.9% .0% 8.8%
# 0 0 0 1 0 0 0 1 Diploma Online
% .0% .0% .0% 1.5% .0% .0% .0% 1.5%
# 1 3 24 26 5 8 1 68 Total
% 1.5% 4.4% 35.3% 38.2% 7.4% 11.8% 1.5% 100.0%
The types of curriculum schedule options offered to RN students varied from one program to
another. RN students have the following schedule options: daytime courses, evening courses, evening/weekend courses, weekend courses, accelerated courses, or online courses. All RN programs

Virginia Dept. of Health Professions Page 45 Profile of Nursing Education Programs 2008-09
except one offer daytime courses and most of them offer evening courses. Table 38 shows the curriculum schedule options reported by RN programs by program type.
Table 38. Types of curriculum schedule options offered to RN students
Type of Program Curriculum Schedule Options # programs
% of
Total
Daytime courses, Accelerated courses 1 1.5%
Daytime courses, Evening courses 1 1.5%
Daytime courses, Evening courses, Evening/weekend courses, Weekend courses, Accelerated courses, Online courses
1 1.5%
Accelerated Baccalaureate
Total 3 4.4%
Daytime courses, Accelerated courses 2 2.9% Accelerated Masters
Total 2 2.9%
Accelerated courses, Online courses 1 1.5%
Daytime courses 20 29.4%
Daytime courses, Accelerated courses 1 1.5%
Daytime courses, Evening courses 4 5.9%
Daytime courses, Evening courses, Evening/weekend courses, Online courses
1 1.5%
Daytime courses, Evening courses, Evening/weekend courses, Weekend courses, Accelerated courses
1 1.5%
Daytime courses, Evening courses, Online courses 2 2.9%
Daytime courses, Evening/weekend courses 3 4.4%
Daytime courses, Evening/weekend courses, Accelerated courses, Online courses
1 1.5%
Daytime courses, Online courses 2 2.9%
Weekend courses, Accelerated courses 1 1.5%
Associate
Total 37 54.4%
Daytime courses, Evening courses, Evening/weekend courses, Weekend courses, Accelerated courses, Online courses
1 1.5%
Evening courses, Weekend courses, Online courses 1 1.5% Associate Online
Total 2 2.9%
Daytime courses 4 5.9%
Daytime courses, Accelerated courses 3 4.4%
Daytime courses, Accelerated courses, Online courses 1 1.5%
Daytime courses, Evening courses 5 7.4%
Daytime courses, Evening courses, Accelerated courses, Online courses
1 1.5%
Daytime courses, Evening courses, Evening/weekend courses, Online courses
1 1.5%
Daytime courses, Online courses 2 2.9%
Baccalaureate
Total 17 25.0%

Virginia Dept. of Health Professions Page 46 Profile of Nursing Education Programs 2008-09
Daytime courses 3 4.4%
Daytime courses, Evening/weekend courses 2 2.9%
Daytime courses, Online courses 1 1.5% Diploma
Total 6 8.8%
Daytime courses, Evening courses, Evening/weekend courses, Online courses
1 1.5% Diploma Online
Total 1 1.5%
Total RN Programs 68 100.0%
Figure 26 shows the minimum and maximum number of months required for a full time student
to complete a program. Accelerated baccalaureate degree programs require 15 to 20 months to complete, accelerated masters degree programs take between 20 to 24 months, associate degree programs 15 to 30 months, associate degree online programs 21 to 30 months, baccalaureate degree programs 16 to 36 months, diploma programs 20 to 33 months, and diploma online programs require approximately 20 months to complete.
Table 39. Approximate Number of Months for a Full Time Student to Complete the Program
# of months Type of Program
15 16 20 21 23 24 25 28 30 31 33 34 36 + Total
# 1 1 1 0 0 0 0 0 0 0 0 0 0 3 Accelerated Baccalaureate % 1.5% 1.5% 1.5% .0% .0% .0% .0% .0% .0% .0% .0% .0% .0% 4.4%
# 0 0 1 0 0 1 0 0 0 0 0 0 0 2 Accelerated Masters % .0% .0% 1.5% .0% .0% 1.5% .0% .0% .0% .0% .0% .0% .0% 2.9%
# 9 1 2 14 1 7 2 0 1 0 0 0 0 37 Associate
% 13.2% 1.5% 2.9% 20.6% 1.5% 10.3% 2.9% .0% 1.5% .0% .0% .0% .0% 54.4%
# 0 0 0 1 0 0 0 0 1 0 0 0 0 2 Associate Online % .0% .0% .0% 1.5% .0% .0% .0% .0% 1.5% .0% .0% .0% .0% 2.9%
# 0 1 0 1 1 1 0 1 1 1 0 1 9 17 Baccalaureate
% .0% 1.5% .0% 1.5% 1.5% 1.5% .0% 1.5% 1.5% 1.5% .0% 1.5% 13.2% 25.0%
# 0 0 1 2 0 1 0 0 1 0 1 0 0 6 Diploma
% .0% .0% 1.5% 2.9% .0% 1.5% .0% .0% 1.5% .0% 1.5% .0% .0% 8.8%
# 0 0 1 0 0 0 0 0 0 0 0 0 0 1 Diploma Online % .0% .0% 1.5% .0% .0% .0% .0% .0% .0% .0% .0% .0% .0% 1.5%
# 10 3 6 18 2 10 2 1 4 1 1 1 9 68 Total
% 14.7% 4.4% 8.8% 26.5% 2.9% 14.7% 2.9% 1.5% 5.9% 1.5% 1.5% 1.5% 13.2% 100.0%

Virginia Dept. of Health Professions Page 47 Profile of Nursing Education Programs 2008-09
Figure 26. Months Required for a Full Time Student to Complete the Program
30
36
33
20
20
24
30
15
20
15
21
16
20
20
0 5 10 15 20 25 30 35
# of Month
Max # Month
Min # MonthAccelerated Baccalaureate
Accelerated Masters
Associate
Associate On-line
Baccalaureate
Diploma
Diploma On-line
Table 40. Number of Admission Points in the RN Academic Year by Program Type
Number of Admission Points in the academic year # of Admission Points:
1 2 3 4 or more Total
# 1 2 0 0 3 Accelerated Baccalaureate
% 1.5% 2.9% .0% .0% 4.4%
# 2 0 0 0 2 Accelerated Masters
% 2.9% .0% .0% .0% 2.9%
# 22 6 6 3 37 Associate
% 32.4% 8.8% 8.8% 4.4% 54.4%
# 0 2 0 0 2 Associate Online
% .0% 2.9% .0% .0% 2.9%
# 7 9 0 1 17 Baccalaureate
% 10.3% 13.2% .0% 1.5% 25.0%
# 1 4 1 0 6 Diploma
% 1.5% 5.9% 1.5% .0% 8.8%
# 0 1 0 0 1 Diploma Online
% .0% 1.5% .0% .0% 1.5%
# 33 24 7 4 68 Total
% 48.5% 35.3% 10.3% 5.9% 100.0%
Most (83.8%) of the RN programs admit students once or twice per year as shown in Figure 27.
The remaining 16.8% admit students three, four or more times per year, most were associate degree programs. Table 40 shows the number of admission points in different types of programs.

Virginia Dept. of Health Professions Page 48 Profile of Nursing Education Programs 2008-09
Figure 27. Number of Admission Points in the academic year by Program Type
22
6 637
9
0 1
14
1 01 2
0 02
0 0 00
20 0
0 1 0 00
5
10
15
20
25
1 2 3 4 or more
Diploma On-line
Associate On-line
Accelerated Masters
Accelerated Baccalaureate
Diploma
Baccalaureate
Associate
Diploma On-line
Associate On-line
AcceleratedMastersAcceleratedBaccalaureateDiploma
Baccalaureate
Associate
Clinical Experience
Tables 41 through 43 summarize the amount of time RN programs in Virginia devote to clinical experiences, and of those total clinical hours how many were assigned to direct client care clinical experiences, and to clinical simulation experiences.
Table 41. Number of Hours assigned to Clinical experiences Number of Hours Assigned to Clinical Experiences
# of Hours Below 500
500 to 525
526 to 550
551 to 575
576 to 600
More than 600
Total
# 0 0 0 0 2 1 3 Accelerated Baccalaureate % .0% .0% .0% .0% 2.9% 1.5% 4.4%
# 0 0 0 0 0 2 2 Accelerated Masters % .0% .0% .0% .0% .0% 2.9% 2.9%
# 1 13 12 2 3 6 37 Associate
% 1.5% 19.1% 17.6% 2.9% 4.4% 8.8% 54.4%
# 0 0 0 0 0 2 2 Associate Online
% .0% .0% .0% .0% .0% 2.9% 2.9%
# 0 1 2 0 1 13 17 Baccalaureate
% .0% 1.5% 2.9% .0% 1.5% 19.1% 25.0%
# 0 0 0 0 0 6 6 Diploma
% .0% .0% .0% .0% .0% 8.8% 8.8%
# 0 0 0 0 0 1 1 Diploma Online
% .0% .0% .0% .0% .0% 1.5% 1.5%
# 1 14 14 2 6 31 68 Total
% 1.5% 20.6% 20.6% 2.9% 8.8% 45.6% 100.0%

Virginia Dept. of Health Professions Page 49 Profile of Nursing Education Programs 2008-09
In most RN programs, the majority of a student’s clinical experience comes from direct client care. Figure 28 shows that the majority (85.3%) of RN programs report assigning more than 475 hours to direct patient care.
Table 42. Number of Hours assigned to Direct Client Care Clinical experiences Number of Hours Assigned to Direct Client Care Clinical Experiences
# of Hours 0 to 400 401 to
425 426 to
450 451 to
475 476 to
500 More than
500 Total
# 0 0 1 0 1 1 3 Accelerated Baccalaureate % .0% .0% 1.5% .0% 1.5% 1.5% 4.4%
# 0 0 0 0 1 1 2 Accelerated Masters % .0% .0% .0% .0% 1.5% 1.5% 2.9%
# 2 0 3 3 7 22 37 Associate
% 2.9% .0% 4.4% 4.4% 10.3% 32.4% 54.4%
# 0 0 0 0 0 2 2 Associate Online
% .0% .0% .0% .0% .0% 2.9% 2.9%
# 0 1 0 0 3 13 17 Baccalaureate
% .0% 1.5% .0% .0% 4.4% 19.1% 25.0%
# 0 0 0 0 1 5 6 Diploma
% .0% .0% .0% .0% 1.5% 7.4% 8.8%
# 0 0 0 0 0 1 1 Diploma Online
% .0% .0% .0% .0% .0% 1.5% 1.5%
# 2 1 4 3 13 45 68 Total
% 2.9% 1.5% 5.9% 4.4% 19.1% 66.2% 100.0%
Figure 28. Number of Hours Assigned to Direct Client Care Clinical Experiences
2 1
4 3
13
45
2 03 3
7
22
0 1 0 03
13
0 0 0 0 15
0 0 1 0 1 1
0 0 0 0 1 1
0 0 0 0 0 2
0 0 0 0 0 10
5
10
15
20
25
30
35
40
45
0 to 400 401 to425
426 to450
451 to475
476 to500
Morethan 500
Diploma On-line
Associate On-line
Accelerated Masters
Accelerated Baccalaureate
Diploma
Baccalaureate
Associate
Total
Diploma On-line
Associate On-line
Accelerated Masters
AcceleratedBaccalaureateDiploma
Baccalaureate
Associate
Total

Virginia Dept. of Health Professions Page 50 Profile of Nursing Education Programs 2008-09
Table 43 summarizes the average number of hours assigned to direct clinical experience located in Virginia by program type. Two programs reported over 1000 hours of direct clinical experience in state. Clinical experiences were also offered in the District of Columbia, Kentucky, Maryland, North Carolina, Pennsylvania, Tennessee, West Virginia and internationally.
Table 43. Average Number of Hours Assigned to Direct Clinical Care Experience
Located in Virginia by Program Type
Program type: Average Number of Hours
Accelerated Baccalaureate 567
Accelerated Masters 825
Associate 527
Associate Online 600
Baccalaureate 606
Diploma 690
Diploma Online 600
The amount of time RN programs devote to clinical simulation ranges from 0 to over 200
hours. Table 44 shows that 51 (75%) of RN programs report assigning less than 51 hours to clinical simulation experience, ten (14.7%) between 50 and 100 hours, and seven (10.3%) over 100 hours.
Table 44. Number of Hours assigned to Clinical Simulation Experiences
Number of Hours Assigned to Clinical Simulation experiences # of hours 0 to
25 26 to
50 51 to
75 76 to 100
101 to 125
126 to 150
More than 200
None Total
# 1 0 1 1 0 0 0 0 3 Accelerated Baccalaureate % 1.5% .0% 1.5% 1.5% .0% .0% .0% .0% 4.4%
# 0 1 0 1 0 0 0 0 2 Accelerated Masters % .0% 1.5% .0% 1.5% .0% .0% .0% .0% 2.9%
# 23 9 2 2 0 1 0 0 37 Associate
% 33.8% 13.2% 2.9% 2.9% .0% 1.5% .0% .0% 54.4%
# 2 0 0 0 0 0 0 0 2 Associate Online
% 2.9% .0% .0% .0% .0% .0% .0% .0% 2.9%
# 7 4 2 1 1 1 1 0 17 Baccalaureate
% 10.3% 5.9% 2.9% 1.5% 1.5% 1.5% 1.5% .0% 25.0%
# 3 0 0 0 0 1 1 1 6 Diploma
% 4.4% .0% .0% .0% .0% 1.5% 1.5% 1.5% 8.8%
# 1 0 0 0 0 0 0 0 1 Diploma Online
% 1.5% .0% .0% .0% .0% .0% .0% .0% 1.5%
# 37 14 5 5 1 3 2 1 68 Total
% 54.4% 20.6% 7.4% 7.4% 1.5% 4.4% 2.9% 1.5% 100.0%

Virginia Dept. of Health Professions Page 51 Profile of Nursing Education Programs 2008-09
Table 45 details the number of hours students were reported assigned to clinical observation
by program type. The amount of time RN programs devote to clinical observation ranges from 0 to more than 200 hours. Approximately 76.5% of RN programs reported assigning less than 51 hours to clinical observation, while approximately 55.9% reported assigning less than 26 hours of a student’s time to clinical observation.
Table 45. Number of Hours Assigned to Clinical Observation by RN Program Type Number of Hours Assigned to Clinical Observation Experiences
# of hours 0 to 25 26 to
50 51 to
75 76 to 100
101 to 125
More than 200
None Total
# 1 1 0 0 1 0 0 3 Accelerated Baccalaureate % 1.5% 1.5% .0% .0% 1.5% .0% .0% 4.4%
# 1 0 0 0 1 0 0 2 Accelerated Masters % 1.5% .0% .0% .0% 1.5% .0% .0% 2.9%
# 28 7 1 0 1 0 0 37 Associate
% 41.2% 10.3% 1.5% .0% 1.5% .0% .0% 54.4%
# 0 1 1 0 0 0 0 2 Associate Online
% .0% 1.5% 1.5% .0% .0% .0% .0% 2.9%
# 7 4 3 1 1 0 1 17 Baccalaureate
% 10.3% 5.9% 4.4% 1.5% 1.5% .0% 1.5% 25.0%
# 1 1 0 2 0 2 0 6 Diploma
% 1.5% 1.5% .0% 2.9% .0% 2.9% .0% 8.8%
# 0 0 1 0 0 0 0 1 Diploma Online
% .0% .0% 1.5% .0% .0% .0% .0% 1.5%
# 38 14 6 3 4 2 1 68 Total
% 55.9% 20.6% 8.8% 4.4% 5.9% 2.9% 1.5% 100.0%
Program Changes
Approximately 33.8% or 23 out of 68 RN programs reported program changes implemented during 2008-09 academic year. Eleven of those were associate degree programs, seven were baccalaureate degree, two were associate degree online, two were diploma, and one was a diploma online program. Figure 29 illustrates the percentage and number of changes in each program type. Table 46 lists the program changes implemented during 2008-09 academic year that were reported by RN programs during the survey.

Virginia Dept. of Health Professions Page 52 Profile of Nursing Education Programs 2008-09
Figure 29. Number of Program Changes by Program Type
Diploma, 2, 3%
Diploma On-line, 1, 1%
Associate Degree, 11, 16%
Associate Degree On-line, 2, 3%
Baccalaureate Degree, 7, 10%
No program changes, 45, 67%
Table 46. Summary of Program Changes implemented during the 2008-09 Academic Year by RN Program Type
Program Type Implemented Changes
Associate # of programs that implemented changes: 11
As a result of the systematic self evaluation of the program based on (a) quarterly NCLEX
reports (b)the cohort of students in various stages of the program (c)feedback from recent graduates; GHNTS determined it would be best to stop transfers of Pharmacol.
A revised Program of Study (POS) was implemented in 2008 for the Spring 2010 graduating class. NSG 160/160C Older Adult Nursing, NSG 284 Professional Seminar I, and NSG 285 Professional Seminar II were removed from the POS. The 4 theory credit hours were combined into NSG 286 Professional Seminar and Leadership. In order to keep the same number of clinical hours in the POS the following changes were made: One credit hour of clinical was added to NSG 101/101C Introduction to Nursing for traditional AD students, one credit hour of clinical was added to NSG 202/202C Fundamentals of Nursing for the Accelerated Track Paramedic and Respiratory Therapy students, and LPN Mobility students in the Accelerated Track will have to take the 2 credit NSG 260C Practicum in Nursing instead of the former NSG 261 C Practicum in Nursing which was only 1 credit. The total number of credit hours in the POS did not change. Also, the AD Nursing Program was closing with the 2010 graduating class.
HLT 141 Introduction to Medical Terminology (1 credit hour) was added at the recommendation of the B.O.N. (2006 visit) and was made a required course the fall of 2008. NUR 135 Drug Dosage Calculation (2 credit hours) was changed from an option (with challenge exam) to a required course for all programmatic students. Full approval by the nursing faculty, the college curriculum committee, college administration and meets VCCS requirements (including total credits of 69).
Replace social science elective with NUR 236 (Principles of Pharmacology I); replace HLT 115 (Personal and Community Health) with NUR 237 (Principles of Pharmacology II); move NUR 221 (2nd Level Principles and Concepts I) to third semester; move NUR 222 (2nd Level Principles and Concepts II) to fourth semester; Move NUR 180 (Essentials of Maternal/Newborn Nursing) and NUR 201 (Psychiatric Nursing) to second semester.
LPN to RN hybrid delivery format terminated 8/2009 until BON approval received.
New program begun May 2009 year.

Virginia Dept. of Health Professions Page 53 Profile of Nursing Education Programs 2008-09
Preceptorship program was started in the Spring 2009 semester. A new joint application form and process were also implemented in the Spring of 2009 for the RN and LPN programs.
Semester 1 Modify NUR 200 as follows: Increase lecture hours from 45 to 75 to include Physical Assessment theory/lecture in support of existing Physical Assessment content in lab. This was accomplished by relocating 30 hours from credit for previous learning hours. Increase lab hours from 30 to 60 by relocating 30 hours from LPN Fundamentals previous learning credits into lab for Fundamentals skills competence. Semester 2 Modify NUR 201 as follows: Convert 30 clinical contact hours into 30 skills lab contact hours. Pre-req/Credits for prior Learning Modify previous learning by reassigning 75 hours of clinical clock hours as designated above. This was in keeping with July 2009 Board of Nursing guidance document regarding previous learning credits for LPN to ADN programs
The articulation course was increased to 7 credits to include OB content. The campus was moving in January to 120 Campus Drive, Portsmouth, VA 23701
The Hybrid Distance Education track was approved by the BON and NLNAC to admit students in fall of 2009. All materials were presented and approved by the BON prior to the track admitting students. The Oct 2009 headcount of students reflects the total number of students minus the hybrid cohort. The Hybrid cohort numbers were under the separate code supplied by the BON.
The LPN to AD program was modified requiring that LPNs take NUR 153, Pharmacology prior
to admission and that they start the program during the 2nd semester, thus having 500 direct Care clinical hours and experience in all specialty area.
Associate Online
# of programs that implemented changes: 2
The CNP has undergone attrition of participating schools. As such, the last graduating class will occur May, 2010. The two cohorts graduating in May, 2010 were JTCC and VWCC. The previously admitted CNP students from admissions in Spring of 09 and Fall of 09 have been transferred into the JTCC nursing program. They were included in the head count data for Oct 15, but the other data were reported here.
This Hybrid Distance Education Track was approved by the BON and NLNAC to begin in Aug of
2009. The first students were admitted then. Thus, there were no data on this group as yet. All materials were supplied to the BON prior to approval and admission of the first cohort.
Baccalaureate # of programs that implemented changes: 7
Board of Nursing voted to accept undergraduate curriculum changes on November 18, 2008.
EMU Nursing Program reorganized our level 2 blocks to equalize the student work load. The
total course credit hour load and the courses themselves were changed. We also added a new standardized testing program.
In Fall 2008 the program of study leading to a Bachelor of Science Degree in Nursing was revised for Generic and Transfer students. The program revision involved a re-allocation of the required credit hours. The previous program of study required students to take the following courses in the initial semester of the major: NU230 – Foundations of Nursing (3 theory credits) NU231 – Nursing Technologies (3 theory credits & 1 lab credit) Under this plan, the generic or transfer student was not exposed to the major until the junior year, and placed a heavy credit load in the initial semester of the major for students who have not yet earned a baccalaureate degree. The program revision moved one credit to the second semester of freshman year; four credits to the spring of the sophomore year; and two credits to the fall of the junior year. The re-distribution of core content introduced the student to the nursing major earlier and allows for a more successful transition to the core nursing content. Generic students in the nursing major will now take the following course sequence: Spring Semester: Freshman year, NU226 - Introduction to Professional Nursing, Spring Semester: Sophomore year, NU236 - Fundamentals of Nursing, Fall Semester: Junior year, NU246 - Clinical Nursing Concepts & Skills
Longwood University was a new BSN program. We admitted our first nursing class of 37 students in fall 2009. We were seeking CCNE accreditation in spring 2013.
New geriatrics course was required in BSN curriculum (NUCO 4400: Nursing Care and the
Older Adult). Added one credit in genetics to 4th year course. Condensed introductory skills class to one semester and added simulation experience across last four semesters.
Program just started in October and all changes can be found in first quarter report. No changes since then.
Diploma # of programs that implemented changes: 2

Virginia Dept. of Health Professions Page 54 Profile of Nursing Education Programs 2008-09
Hospital moved to new location and mailing address. The Board was notified of the new address change for the School. The school did not change physical locations.
We will email the improvements we have made to our new curriculum and Articulation Program.
Diploma Online
# of programs that implemented changes: 1
Hospital moved to new location and mailing address. The Board was notified of the new
address change for the School. The school did not change physical locations.
RN Student Information
Most RN programs in Virginia were operating at over 89% of their current capacity. Table 47
and Figure 30 present the number and percentage of students qualified, admitted and enrolled in the 2008-09 academic year, as well as the number of unfilled student spaces, students on wait lists and total spaces available for new students. Using these figures, total student capacity has been calculated as the total of student enrollments and unfilled slots. Overall, 97.4% of the total capacity for RN students was utilized in 2008-09.
Table 47. RN Student Admissions, Enrollments, and Capacity During Academic Year 2008-2009:
Acc. Bacc.
Acc. Masters
Associate Associate Online
Bacc. Diploma Diploma Online
Total
# of Programs 20 3 20 4 25 72 # received 525 279 8148 73 5072 1523 62 15682 # qualified 482 251 4356 54 3354 693 29 9219
# admitted 349 106 2875 40 2475 654 27 6526
# enrolled 211 55 2703 36 1471 607 27 5110
Total Enrollments a 364 134 4089 28 3617 1105 10 9347
# on 'wait list' 0 10 296 0 474 15 2 797
# unfilled spaces 43 2 99 6 28 68 3 249
Total spaces available for new students
254 58 2725 40 1450 671 30 5228
Capacity b 407 136 4188 34 3645 1173 13 9596
% of Capacity c 89.4% 98.5% 97.6% 82.4% 99.2% 94.2% 76.9% 97.4% a Number of pre license students who were enrolled in a program b Capacity = # Total enrollment + unfilled slots c Percentage = Total enrollment /capacity

Virginia Dept. of Health Professions Page 55 Profile of Nursing Education Programs 2008-09
Figure 30. RN Student Capacity in Virginia in the 2008-09 Academic Year
Associate On-line, 34, 0.4%
Associate, 4188, 43.6%
Accelerated Baccalaureate, 407, 4.2%
Accelerated Masters, 136, 1.4%
Baccalaureate, 3645, 38.0%
Diploma On-line, 13, 0.1%Diploma, 1173, 12.2%
Accelerated Baccalaureate
Accelerated Masters
Associate
Associate On-line
Baccalaureate
Diploma
Diploma On-line
Figure 31 illustrates the total student body of RN students distributed across the various
program types.
Figure 31. RN Student Admissions, Enrollments and unfilled spaces in the 2008-09
Academic Year
8148
4356
28752703
4089
296 99
2725
4188
5072
33542475
1471
3617
474 281450
3645
1523693 654 607 1105
15 68 671 1173
279 251 106 55 134 10 2 58 136
525 482 349 211 364 0 43 254 407
73 54 40 36 28 0 6 40 34
62 29 27 27 10 2 3 30 130
1000
2000
3000
4000
5000
6000
7000
8000
9000
received qualif ied admitted enrolled Total Enroll. w ait list' unfilledspaces
spaces fornew
students
Capacityfor PNE
students
Diploma On-line
Associate On-line
Accelerated Baccalaureate
Accelerated Masters
Diploma
Baccalaureate
Associate
Diploma On-line
Associate On-line
AcceleratedBaccalaureate
Accelerated Masters
Diploma
Baccalaureate
Associate
Table 48 reports the reasons given by RN programs for turning away qualified students during
the 2008-09 academic year. Most programs cite that effective program capacity has been reached, lack of qualified faculty, lack of classroom space and limited clinical sites as the primary factors.

Virginia Dept. of Health Professions Page 56 Profile of Nursing Education Programs 2008-09
Table 48. Reasons for Turning Away Qualified Applicants to Pre-license RN Programs
Reasons prohibited programs from admitting students # of
programs
# of applications
qualified
# of qualified
applicants admitted
# of applicants on 'wait
list'
Lack of qualified faculty 1 216 83 0
None 2 266 266 0 Reasons prohibing admitting students
Total 3 482 349 0
3 482 349 0
Acc
eler
ated
Bac
cala
ure
ate
Other reasons Total 3 482 349 0
Lack of clinical space 2 251 106 10 Reasons prohibiting admitting students Total 2 251 106 10
1 137 67 0
Insufficient faculty 1 114 39 10
Acc
eler
ated
M
aste
rs
Other reasons
Total 2 251 106 10
Effective program capacity reached
11 1912 990 183
Lack of classroom space 2 175 147 20
Lack of clinical space 1 97 64 33
Lack of qualified faculty 6 777 674 54
None 14 1240 872 6
Unknown 3 155 128 0
Reasons prohibiting admitting students
Total 37 4356 2875 296
26 3274 2010 236
Board of Nursing Limit-new program
1 64 40 6
Financial Aid issues 1 55 30 0
Lack of classroom space 1 14 14 0
Lack of classroom space, effective program capacity reached
1 308 271 0
Lack of qualified clinical faculty
1 97 89 16
Lack off adequate classroom space
1 50 40 0
Limited class and clinical space
1 172 141 38
Space 1 136 119 0
Ass
ocia
te
Other reasons
Students wanted to complete other course work, or had personal issues
1 23 23 0

Virginia Dept. of Health Professions Page 57 Profile of Nursing Education Programs 2008-09
Two planning to enter in Jan 10
1 34 33 0
Unable to admit more qualified applicants’ r/t the need for classroom and clinical space, and the need for full time faculty.
1 129 65 0
Total 37 4356 2875 296
None 2 54 40 0 Reasons prohibiting admitting students Total 2 54 40 0
2 54 40 0
Ass
ocia
te
Online
Other reasons Total 2 54 40 0
Effective program capacity reached
5 966 754 93
Lack of classroom space 1 324 324 0
Lack of clinical space 4 836 475 356
Lack of qualified faculty 1 572 282 25
None 3 178 178 0
Unknown 3 478 462 0
Reasons prohibiting admitting students
Total 17 3354 2475 474
12 2067 1691 267
Applicant withdrew application
1 161 129 23
clinical site availability 1 572 282 25
Insufficient faculty, clinical preceptors, and budget cuts
1 264 143 121
Lack of classroom space 1 198 160 38
Not enough space or faculty 1 92 70 0
Bac
cala
ure
ate
Other reasons
Total 17 3354 2475 474
Effective program capacity reached
3 300 274 2
Lack of clinical space 1 108 95 13
None 2 285 285 0
Reasons prohibiting admitting students
Total 6 693 654 15
5 585 559 2
Limited classroom space 1 108 95 13
Dip
lom
a
Other reasons
Total 6 693 654 15
Lack of clinical space 1 29 27 2 Reasons prohibiting admitting students Total 1 29 27 2
1 29 27 2
Dip
lom
a O
nline
Other reasons Total 1 29 27 2
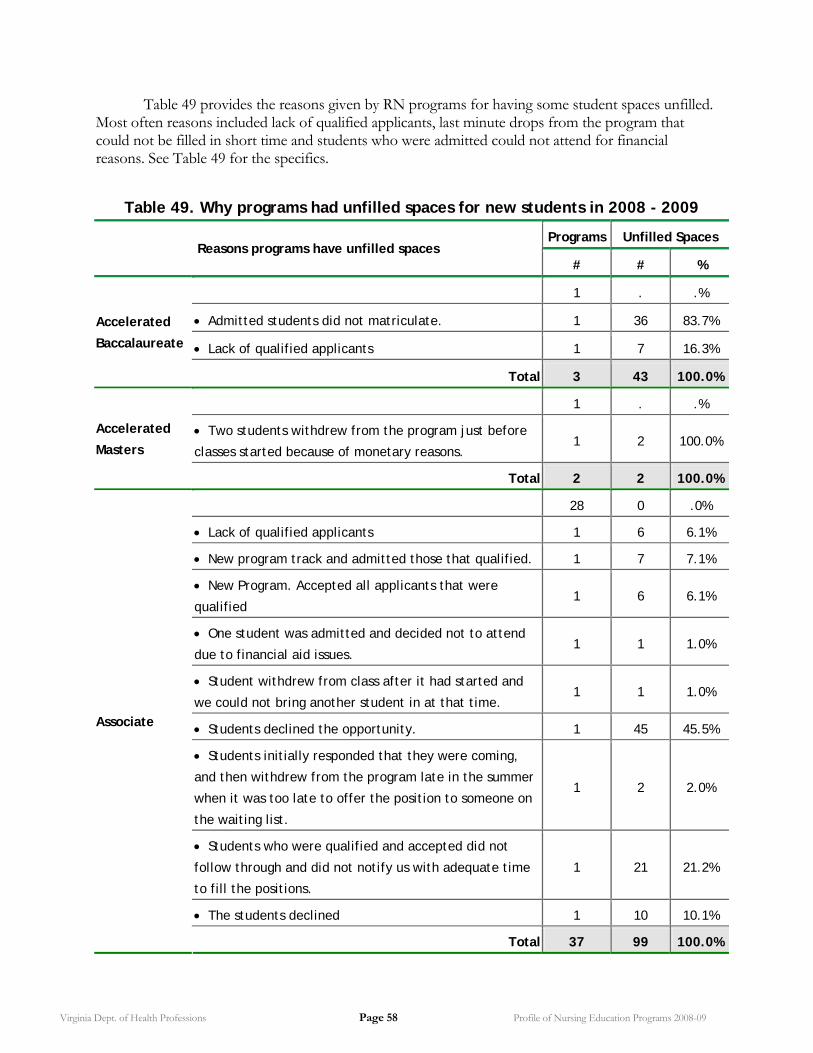
Virginia Dept. of Health Professions Page 58 Profile of Nursing Education Programs 2008-09
Table 49 provides the reasons given by RN programs for having some student spaces unfilled. Most often reasons included lack of qualified applicants, last minute drops from the program that could not be filled in short time and students who were admitted could not attend for financial reasons. See Table 49 for the specifics.
Table 49. Why programs had unfilled spaces for new students in 2008 - 2009
Programs Unfilled Spaces Reasons programs have unfilled spaces
# # %
1 . .%
Admitted students did not matriculate. 1 36 83.7%
Lack of qualified applicants 1 7 16.3%
Accelerated
Baccalaureate
Total 3 43 100.0%
1 . .%
Two students withdrew from the program just before
classes started because of monetary reasons. 1 2 100.0%
Accelerated
Masters
Total 2 2 100.0%
28 0 .0%
Lack of qualified applicants 1 6 6.1%
New program track and admitted those that qualified. 1 7 7.1%
New Program. Accepted all applicants that were
qualified 1 6 6.1%
One student was admitted and decided not to attend
due to financial aid issues. 1 1 1.0%
Student withdrew from class after it had started and
we could not bring another student in at that time. 1 1 1.0%
Students declined the opportunity. 1 45 45.5%
Students initially responded that they were coming,
and then withdrew from the program late in the summer
when it was too late to offer the position to someone on
the waiting list.
1 2 2.0%
Students who were qualified and accepted did not
follow through and did not notify us with adequate time
to fill the positions.
1 21 21.2%
The students declined 1 10 10.1%
Associate
Total 37 99 100.0%

Virginia Dept. of Health Professions Page 59 Profile of Nursing Education Programs 2008-09
1 . .%
Unknown. No data available. 1 6 100.0%
Associate
Degree Online
Total 2 6 100.0%
13 . .%
Accepted students did not matriculate. 1 4 14.3%
16 students did not show. Some deferred to 2009;
some went to other schools, some were called to military
duty, others had an unfinancial status.
1 10 35.7%
Our program did not receive permission to advertise
until August and our quarter started the beginning of
October. Not enough time for publicity and testing and
students who were interested could not pass entrance
exam.
1 12 42.9%
Student decisions not to attend that occurred late,
which prohibited us from back filling the seats. 1 2 7.1%
Baccalaureate
Total 17 28 100.0%
2 . .%
Lack of Applicants 1 57 83.8%
Lack of qualified applicants 1 4 5.9%
Positive drug screen on individuals accepted to enter,
individuals who did not show up on the first day of class 1 6 8.8%
Student declines as semester started 1 1 1.5%
Diploma
Total 6 68 100.0%
Clinical sites not filled in Pennsylvania 1 3 100.0% Diploma
Online Total 1 3 100.0%

Virginia Dept. of Health Professions Page 60 Profile of Nursing Education Programs 2008-09
The minimum grade point average (GPA) requirement for admission to RN programs varies from one program to another. Forty-five RN programs (66.2%) reported requiring a minimum GPA of 2.5 for admission, while 10 (14.7%) required a 2.0 GPA, and 4 (5.9%) required a GPA of 2.7 or better. Table 50 reports the minimum GPA requirements for admission and average GPA of admitted students by program type.
Table 50. Minimum and Average GPA requirement for admission by Program Type
Type of Program GPA # of programs Accelerated Baccalaureate Degree Minimum GPA required 2.5 3 Average GPA of admitted students 3 1
3.12 1
3.46 1 Accelerated Masters Degree Minimum GPA required 2.7 1
3 1 Average GPA of admitted students 3.45 1
3.48 1 Associate Degree Minimum GPA required 1
0 1
2 4
2.5 28
2.7 1
3 1
TEAS test 1 Average GPA of admitted students 6
0 1
2.5 4
2.57 1
2.65 1
2.7 1
2.8 3
2.9 2
3 3
3.1 1
3.13 1
3.15 1
3.18 1
3.21 1
3.25 3
3.45 1
3.48 1
3.6 1
3.75 1
N/A 1

Virginia Dept. of Health Professions Page 61 Profile of Nursing Education Programs 2008-09
TEAS test 1
unknown 1 Associate Degree Online Minimum GPA required 0 1
2.5 1 Average GPA of admitted students 0 1
3.5 1 Baccalaureate Degree Minimum GPA required 2 2
2.5 10
2.7 2
2.8 1
3 2 Average GPA of admitted students 0 1
2.79 1
2.9 1
3,18 1
3.029 1
3.09 1
3.1 1
3.125 1
3.184 1
3.196 1
3.2 2
3.4 1
3.5 2
3.73 1
Out of high school <4.0
and transfers <3,6
1
Diploma Minimum GPA required 2 4
2.5 2 Average GPA of admitted students 2.75 1
2.8 1
2.9477 1
3.1 1
3.22 1
3.26 1 Diploma Online Minimum GPA required 2.5 1 Average GPA of admitted students 3.12 1

Virginia Dept. of Health Professions Page 62 Profile of Nursing Education Programs 2008-09
The majority of students enrolled in RN programs during the academic year 2008-09 were female. Only 8.6% of the total RN students enrolled were male. Associate and baccalaureate degree programs enrolled approximately 83.5% of the total males who were enrolled in RN programs. Associate degree programs also enrolled 83.9% of the total LPNs who were enrolled in RN programs. Table 51 summarizes the number of RN students who enrolled during the 2008-09 academic year, the number of men enrolled in class, and the number of LPNs enrolled.
Table 51. Number of Male Students and LPNs enrolled by Program Type
# of enrolled students who
were LPNs
# of enrolled students who were males
Type of program # of
programs Total # of
Enrollments a # % # %
Accelerated Baccalaureate 3 364 12 3.3% 32 8.8%
Accelerated Masters 2 134 0 0.0% 16 11.9%
Associate 37 4089 640 15.7% 361 8.8%
Associate Online 2 28 1 3.6% 3 10.7%
Baccalaureate 17 3617 65 1.8% 311 8.6%
Diploma 6 1105 45 4.1% 82 7.4%
Diploma Online 1 10 0 0.0% 0 0.0%
Total 68 9347 763 8.2% 805 8.6% a Total number of pre- license students who were enrolled in a program as of October 15, 2009
The average age for students admitted to RN programs varies across program types. Figure 32
illustrates the median average age, minimum average age, and maximum average age of students admitted to programs as reported by RN programs by program type.
Figure 32. Average Age of students admitted to a program
28
30
23
28
28
28
28
36
36
31
28
28
28
21
19
24
28
27
0 5 10 15 20 25 30 35 40
Accelerated Baccalaureate
Accelerated Masters
Associate
Associate Online
Baccalaureate
Diploma
Diploma Online
Average age of students admitted
Average age of thestudents admitted toprograms Maximum
Average age of thestudents admitted toprograms Median
Average age of thestudents admitted toprograms Minimum

Virginia Dept. of Health Professions Page 63 Profile of Nursing Education Programs 2008-09
The age range for students admitted to associate degree programs was between 21 to 36 years old with a median of 30 years. For baccalaureate degree programs it was between 19 and 36 years with a median age of 23 years. For diploma programs the range narrowed to between 24 and 31 years. While diploma online, accelerated baccalaureate, and accelerated masters programs hovered around 28. No data was available from associate online programs.
Table 52. Average Age of students admitted to a program Average age of the students admitted to programs
Median Minimum Maximum
# of Programs
Accelerated Baccalaureate 28 27 28 3
Accelerated Masters 28 28 28 2
Associate 30 21 36 37
Associate Online a . . . 2
Baccalaureate 23 19 36 17
Diploma 28 24 31 6
Diploma Online 28 28 28 1 Note: The two associate degree online did not report average age of students. There might not be data available for average student age at the time of the survey taking. RN Student Attrition
The overall attrition rate (percentage of students who left the program) was found to be the highest in diploma online programs (27%) followed by associate degree programs (26%) and diploma programs (19%). Accelerated master’s degree had the lowest attrition rate (2%), followed by accelerated baccalaureate degree (5%) and baccalaureate degree programs (6%). The attrition rate for the first year, second year, third year (if applicable) and overall student attrition rate during 2008-09 academic year is summarized in Table 53 and Figure 33.
Table 53. RN Student Attrition Rate in the 2008-2009 Academic Year by Program Type
Average Attrition Rate in: First Year Second Year Third Year Overall attrition
rate
Accelerated Baccalaureate 5 7 1.6 5
Accelerated Masters 2 13 9.0 2
Associate 23 14 .0 26
Associate Online 5 5 .0 10
Baccalaureate 8 4 2.9 6
Diploma 14 17 21.2 19
Diploma Online 19 8 .0 27

Virginia Dept. of Health Professions Page 64 Profile of Nursing Education Programs 2008-09
Figure 33. Student Attrition Rate in the 2008-2009 Academic Year
by Program Type
5
7
1.6
5
2
13
9.0
2
23
14
.0
26
5 5
.0
108
42.9
6
14
17
21.219 19
8
.0
27
0
5
10
15
20
25
30
Attrition rat
e
AcceleratedBaccalaureate
AcceleratedMasters
Associate Associate Online
Baccalaureate Diploma DiplomaOnline
First Year
Second Year
Third Year
Overallattrition rate
RN Graduates:
The total number of students graduated from 68 RN programs during the 2008-09 academic
year (August 1st – July 31st) was 3536 students. Approximately half of those graduates (1774 students) graduated from associate degree programs, 1042 student (29%) graduated from baccalaureate degree programs, 422 students (12%) graduated from diploma programs, and 199 students (6%) graduated from accelerated baccalaureate programs. The remaining 3% graduated from diploma online, associate online and accelerated master’s degree programs (see Figure 34).
Figure 34. Number of Students Graduated by Program Type
Associate, 1774, 50%
Accelerated Baccalaureate, 199, 6%
Diploma, 422, 12%
Baccalaureate, 1042, 29%
Diploma Online, 23, 1%
Accelerated Masters, 44, 1%
Associate Online, 32, 1%
Associate
Baccalaureate
Diploma
AcceleratedBaccalaureate
AcceleratedMasters
Associate Online
Diploma Online

Virginia Dept. of Health Professions Page 65 Profile of Nursing Education Programs 2008-09
The majority (91.5%) of students graduating from RN programs during the academic year 2008-09 was female (3237). 8.5% of the total RN students graduated were male (299), and 12.2% of the total RN students graduated were LPNs (430). Table 54 summarizes the number of RN students that graduated during the 2008-09 academic year, the number of male students graduated, and the number of graduates that were LPNs.
Table 54. Number of Male Students and LPNs Graduated by Program Type
# of students graduated-male
# of students graduated- LPNs
Type of program # of programs
Total # of students
graduated # % of total
# % of total
Accelerated Baccalaureate 3 199 22 11.1% 7 3.5%
Accelerated Masters 2 44 5 11.4% 0 .0%
Associate 37 1774 143 8.1% 369 20.8%
Associate Online 2 32 1 3.1% 0 .0%
Baccalaureate 17 1042 94 9.0% 36 3.5%
Diploma 6 422 31 7.3% 17 4.0%
Diploma Online 1 23 3 13.0% 1 4.3%
Total 68 3536 299 8.5% 430 12.2%
Figure 35 compares male and LPN graduates among the programs. Associate degree programs graduated 47.8% of the total males and 85.8% of the total LPNs who graduated from RN programs. Baccalaureate degree programs accounted for 23.6% of the total male and 8.4% of the total LPN graduates from RN programs.
Figure 35. Number of Male Students and LPNs Graduated by Program Type
44 32199
1774
422
1042
2317 0 319422
143
35 1736 10
369
0
200
400
600
800
1000
1200
1400
1600
1800
2000
AcceleratedBaccalaureate
AcceleratedMasters
Associate AssociateOnline
Baccalaureate Diploma DiplomaOnline
# o
f st
ud
ents
# of graduates
# of LPNs
# of male

Virginia Dept. of Health Professions Page 66 Profile of Nursing Education Programs 2008-09
The racial characteristics of Virginia’s RN Graduates are illustrated in Figure 36. Approximately 66.9% of RN Graduates were White, 17.6% Black, 3.8% Asian, and 2.3% Hispanic. Table 55 reports the number of graduates in each ethnic category in detail. Associate degree programs graduated about half of the White, Black, Hispanic and Native Hawaiian/ Pacific Islander while approximately half of Asian and American Indian/Alaskan Native Students graduated from Baccalaureate degree programs.
Table 55. Number of Students Graduated from RN Programs by Ethnic Group and Program Type
# students Total# of students
graduated
White, non-
Hispanic
Black, non-
Hispanic
Hispanic of any race
Asian
American Indian / Alaskan Native
Native Hawaiian / Pacific Islander
More than one race
Race unknown
# 199 106 54 5 11 1 1 0 21 Accelerated Baccalaureate
% 5.6% 4.5% 8.7% 6.1% 8.1% 7.1% 7.1% .0% 5.1%
# 44 34 4 3 3 0 0 0 0 Accelerated Masters
% 1.2% 1.4% .6% 3.7% 2.2% .0% .0% .0% .0%
# 1774 1215 325 40 40 4 6 4 218 Associate
% 50.2% 51.3% 52.3% 48.8% 29.4% 28.6% 42.9% 50.0% 52.5%
# 32 29 1 1 1 0 0 0 0 Associate Online
% .9% 1.2% .2% 1.2% .7% .0% .0% .0% .0%
# 1042 630 197 26 61 8 0 1 163 Baccalaureate
% 29.5% 26.6% 31.7% 31.7% 44.9% 57.1% .0% 12.5% 39.3%
# 422 333 41 5 20 1 7 3 12 Diploma
% 11.9% 14.1% 6.6% 6.1% 14.7% 7.1% 50.0% 37.5% 2.9%
# 23 20 0 2 0 0 0 0 1 Diploma Online
% .7% .8% .0% 2.4% .0% .0% .0% .0% .2%
# 3536 2367 622 82 136 14 14 8 415 Total
% 100.0% 100.0% 100.0% 100.0% 100.0% 100.0% 100.0% 100.0% 100.0%
Note: The total number of students graduated was the number reported by the programs (3536). This number does not equal the calculated sum of students graduated in all races (3658). It is possible that some schools did not know the graduation dates of some students.
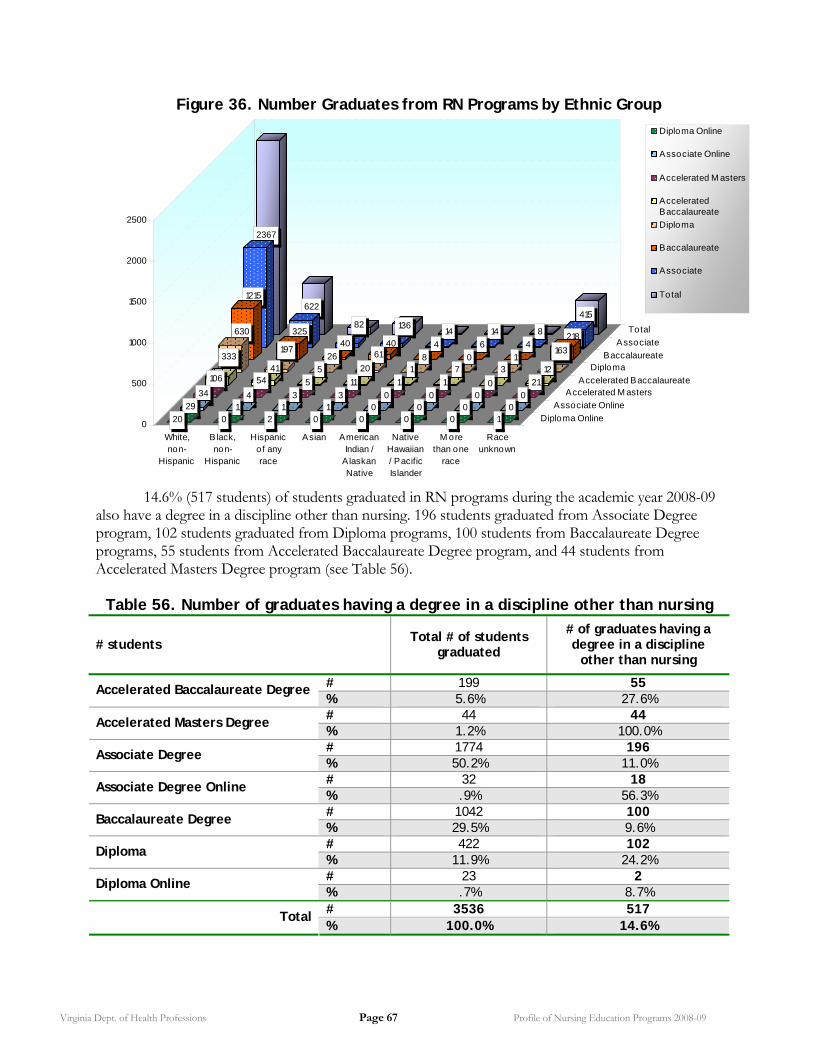
Virginia Dept. of Health Professions Page 67 Profile of Nursing Education Programs 2008-09
Figure 36. Number Graduates from RN Programs by Ethnic Group
2367
622
82 13614 14 8
415
1215
32540 40 4 6 4
218630
19726 61 8 0 1
163333
41 5 20 1 7 3 12106 54 5 11 1 1 0 21
34 4 3 3 0 0 0 029 1 1 1 0 0 0 0
20 0 2 0 0 0 0 10
500
1000
1500
2000
2500
White,non-
Hispanic
Black,non-
Hispanic
Hispanicof anyrace
Asian AmericanIndian /
A laskanNative
NativeHawaiian/ PacificIslander
M orethan one
race
Raceunknown
Diploma Online
Associate Online
Accelerated M astersAccelerated Baccalaureate
DiplomaBaccalaureate
Associate
Total
Diploma Online
Associate Online
Accelerated M asters
AcceleratedBaccalaureate
Diploma
Baccalaureate
Associate
Total
14.6% (517 students) of students graduated in RN programs during the academic year 2008-09
also have a degree in a discipline other than nursing. 196 students graduated from Associate Degree program, 102 students graduated from Diploma programs, 100 students from Baccalaureate Degree programs, 55 students from Accelerated Baccalaureate Degree program, and 44 students from Accelerated Masters Degree program (see Table 56).
Table 56. Number of graduates having a degree in a discipline other than nursing
# students Total # of students
graduated
# of graduates having a degree in a discipline
other than nursing
# 199 55 Accelerated Baccalaureate Degree % 5.6% 27.6% # 44 44 Accelerated Masters Degree % 1.2% 100.0% # 1774 196 Associate Degree % 50.2% 11.0% # 32 18 Associate Degree Online % .9% 56.3% # 1042 100 Baccalaureate Degree % 29.5% 9.6% # 422 102 Diploma % 11.9% 24.2% # 23 2 Diploma Online % .7% 8.7% # 3536 517 Total % 100.0% 14.6%

Virginia Dept. of Health Professions Page 68 Profile of Nursing Education Programs 2008-09
The percentage of graduates having a degree in a discipline other than nursing varies by the type of program. Figure 37 illustrates that all 44 (100%) students graduated from Accelerated Masters degree programs had a degree in a discipline other than nursing, compared to 18 (56%) graduated from Associated degree programs, 55 (28%) graduated from Accelerated Baccalaureate, 102 (24%) graduated from Diploma programs, 196 (11%) graduated from Associated degree programs, 100 (10%) graduated from Baccalaureate degree programs, and 2 (9%) graduated from Diploma Online Programs. Figure 37. Number of graduates having a degree in a discipline other than nursing
Baccalaureate
10010%
94290%
Diploma
10224%
32076%
Accelerated Baccalaureate
5528%
14472%
Diploma Online
29%
2191%
Total
51715%
301985%
# of graduates havig adegree in a discipline otherthan nursing
# of graduates havig onlynursing degree
Associate
157889%
19611%
Associate Online
1444%
1856%
Accelerated Masters
00%
44100%

Virginia Dept. of Health Professions Page 69 Profile of Nursing Education Programs 2008-09
Full Time Faculty in RN Programs
The total number of full-time faculty positions employed by RN programs on October 15, 2009 was 778 full-time faculty including administrative members, 62 full-time vacant positions, and 38 full-time nursing positions being actively recruited. Table 57 and Figure 38 illustrate the number of full-time positions employed, vacant, and actively recruited by each program type.
Figure 38. Total number of full-time (FT) faculty positions employed, vacant, and actively recruited on Oct. 15, 2009 by program type
13 130 0 0 0
290
20 190 0 0
358
2619
114
0 0 3 3 0
778
6238
0
100
200
300
400
500
600
700
800
AcceleratedBaccalaureate
AcceleratedMasters
Associate AssociateOnline
Baccalaureate Diploma Diploma Online Total
Total # of full-time faculty employed
Total # of full-time faculty vacant
Total # of vacant full-time(FT) positions being actively recruited
Baccalaureate Degree programs employed 46% of the total full-time (FT) positions in Virginia, Associate Degree programs employed 37.3% of the total number of full-time (FT) positions, and Diploma programs employed 14.7% the total number of full-time(FT) positions (see Table 57 for details). 41.9% of the total number of full-time (FT) vacant positions, and 50% of the total number of vacant full-time (FT) actively recruited were in Baccalaureate Degree programs compared to 32.3% of the total number of full-time (FT) vacant, and 50% of the total number of vacant full-time (FT) actively recruited were in Associate Degree programs
44 out of 68 (64.7%) RN programs reported that the number of full-time positions budgeted programs were adequate to meet their current needs, while 14 (20.6%) programs reported that the number of full-time positions budgeted programs were not adequate to meet their current needs, and 10 RN programs did not provide an answer to the question at the time of survey taking. (See Table

Virginia Dept. of Health Professions Page 70 Profile of Nursing Education Programs 2008-09
58). Reasons why full-time nursing positions budgeted for a program were not adequate to meet current needs is listed in Table 59.
Table 57. Total # of full-time(FT) faculty positions employed, vacant, and actively recruited on Oct. 15, 2009 by program type
# students Total # of full-
time(FT) employed Total # of full-time
(FT) vacant
Total # of vacant full-time(FT)
actively recruited
# 13 13 0 Accelerated Baccalaureate Degree % 1.7% 21.0% .0%
# . . . Accelerated Masters Degree
% .% .% .%
# 290 20 19 Associate Degree
% 37.3% 32.3% 50.0%
# 0 0 0 Associate Degree Online
% .0% .0% .0%
# 358 26 19 Baccalaureate Degree
% 46.0% 41.9% 50.0%
# 114 0 0 Diploma
% 14.7% .0% .0%
# 3 3 0 Diploma Online
% .4% 4.8% .0%
# 778 62 38 Total
% 100.0% 100.0% 100.0%
Table 58. number of full-time nursing positions budgeted for a program that was adequate to meet current needs by Program Type
Type of pre-licensure program
Accelerated Baccalaureate
Accelerated Masters
Associate Associate
Online Baccalaureate Diploma
Diploma Online
Total # was budget adequate?
# # # # # # # #
No 1 0 7 0 6 0 0 14
None 2 2 3 1 2 0 0 10
Yes 0 0 27 1 9 6 1 44
Total 3 2 37 2 17 6 1 68

Virginia Dept. of Health Professions Page 71 Profile of Nursing Education Programs 2008-09
Table 59. Reasons why full-time nursing positions budgeted for a program were not adequate to meet current needs
Reasons # of
programs
Total # of full-time
employed
# of
programs answered ‘No’
None 2 . 0
Other 1 13 1 Reason why FT positions budgeted do not meet current need
Total 3 13 1
2 . 0
The department must use multiple adjunct faculty to meet course needs.
1 13 1 Acc
eler
ated
Bac
cala
ure
ate
Deg
ree
Other reasons
Total 3 13 1
Budget 6 38 6
None 31 252 1 Reason why FT positions budgeted do not meet current need
Total 37 290 7
35 282 6
As we expand the program into specialty areas, we will need more MSN-prepared instructors full-time. Although we were actively recruiting for next year, we have adequate staffing for present courses.
1 3 0
Concern for percent of full-time to part-time faculty
1 5 1
Ass
ocia
te D
egre
e
Other reasons
Total 37 290 7
None 2 0 0 Reason why FT positions budgeted do not meet current need Total 2 0 0
1 . 0
The CNP program head was the only full time faculty member employed by the VCCS. She has retired as of August 2009. All other faculty was culled from the ranks of other participating schools of nursing. The current Department Chair for JTCC Nursing was also the Department Chair for the CNP. The current JTCC Program Head was the acting Program Head for the remaining CNP.
1 0 0
Ass
ocia
te D
egre
e O
nline
Other reasons
Total 2 0 0
Budget 5 160 5
aur
eat
e
Reason why FT positions budgeted do not meet current need None 11 172 0

Virginia Dept. of Health Professions Page 72 Profile of Nursing Education Programs 2008-09
Other 1 26 1
Total 17 358 6
15 275 4
Addenda funds requested for two new faculty positions to meet the needs of the doctorate of nursing practice program were not provided. Existing faculty have absorbed the additional workload created by this program. The undergraduate program relies heavily upon adjunct faculty to teach the clinical sections of the didactic courses.
1 57 1
Graduate program understaffed 1 26 1
Other reasons
Total 17 358 6
Figure 39 illustrates the highest degrees held by Full-Time nursing faculty employed on October 15th, 2009. 19.2% of Full-Time nursing faculty employed by RN programs holds a Doctorate degree, 63.4% hold Masters in nursing degree, and 9.1% hold Nursing Baccalaureate degree, 6.4% hold Non-Nursing Masters degree, and 3.5% hold non nursing Doctorate.
Table 60. Highest degree held by Full-Time nursing faculty employed by Program
Type (Percent) Accelerated Baccalaurea
te
Accelerated
Masters Associate Associate
Online Baccalaure
ate Diploma Diploma
Online
Average of all
programs % holding:
% % % % % % % %
Doctorate 44.0 . 6.8 0.0 45.8 1.8 33.0 19.2
Masters in Nursing
56.0 . 68.7 0.0 50.3 84.8 33.0 63.4
Baccalaureate in Nursing
0.0 . 7.5 0.0 6.7 22.2 33.0 9.1
Associate in Nursing
0.0 . 2.0 0.0 0.0 0.0 0.0 1.0
RN Diploma 0.0 . 0.0 0.0 0.0 2.8 0.0 0.3
non-nursing Baccalaureate
0.0 . 0.0 0.0 0.0 0.0 0.0 0.0
non-nursing Masters
0.0 . 9.1 0.0 1.2 10.3 0.0 6.4
non-nursing Doctorate
0.0 . 2.0 0.0 7.1 2.0 0.0 3.5
Notes numbers were medians

Virginia Dept. of Health Professions Page 73 Profile of Nursing Education Programs 2008-09
Figure 39. Highest Degree held by Full-Time nursing faculty employed
Doctorate19%
Masters in Nursing63.4%
non-nursing Doctorate
3%
non-nursing Masters
6%
Baccalaureate in Nursing
9.1%Associate in
Nursing1%
Table 61. Number of Full Time Faculty on Oct. 15, 2009 by Ethnic Group
#FT faculty
Total# of FT
Faculty Employed
White, non-
Hispanic
Black, non-
Hispanic
Hispanic of any race
Asian
American Indian / Alaskan Native
Native Hawaiian / Pacific Islander
More than one race
Race unknown
# 13 3 10 0 0 0 0 0 0 Accelerated Baccalaureate % 1.7% .5% 10.8% .0% .0% .0% .0% .0% .0%
# . . . . . . . . . Accelerated Masters % .% .% .% .% .% .% .% .% .%
# 290 233 46 0 8 1 0 1 0 Associate
% 37.3% 35.2% 49.5% .0% 50.0% 100.0% .0% 100.0% .0%
# 0 0 0 0 0 0 0 0 0 Associate Online % .0% .0% .0% .0% .0% .0% .0% .0% .0%
# 358 319 30 1 7 0 0 0 1 Baccalaureate
% 46.0% 48.2% 32.3% 50.0% 43.8% .0% .0% .0% 100.0%
# 114 104 7 1 1 0 1 0 0 Diploma
% 14.7% 15.7% 7.5% 50.0% 6.3% .0% 100.0% .0% .0%
# 3 3 0 0 0 0 0 0 0 Diploma Online % .4% .5% .0% .0% .0% .0% .0% .0% .0%
# 778 662 93 2 16 1 1 1 1 Total
% 100.0% 100.0% 100.0% 100.0% 100.0% 100.0% 100.0% 100.0% 100.0%
The Majority (85.1%) of full time faculty was White as shown in Figure 40, 11.96% of full time
faculty was Black, and 2.05% of full time faculty was Hispanic. Almost half (48.2%) of White full time faculty were employed by Baccalaureate degree programs, 35.2% of White full time faculty were employed by Associate degree programs, and 15.7% employed by Diploma Programs.(see Table 61 for details)

Virginia Dept. of Health Professions Page 74 Profile of Nursing Education Programs 2008-09
Figure 40. Number of Full Time Faculty by Ethnic Group and Program Type
662
932 16 1 1 1 1
233
460 8 1 0 1 0
319
30 1 7 0 0 0 1104
7 1 1 0 1 0 03 10 0 0 0 0 0 0
0 0 0 0 0 0 0 00 0 0 0 0 0 0 0
3 0 0 0 0 0 0 00
100
200
300
400
500
600
700
White,non-
Hispanic
Black,non-
Hispanic
Hispanicof anyrace
Asian AmericanIndian /
AlaskanNative
NativeHawaiian/ PacificIslander
M orethan one
race
Raceunknown
Diploma OnlineAssociate Online
Accelerated M astersAccelerated Baccalaureate
Diploma
BaccalaureateAssociate
Total
Diploma Online
Associate Online
Accelerated M asters
AcceleratedBaccalaureate
Diploma
Baccalaureate
Associate
Total
Table 62. Number of Full Time RN Programs by Age Group and Program Type
#FT faculty
Total# of FT
Faculty Employed
Less than 25
26 - 34 35 - 44 45 - 54
55 - 64 65 - 74 75 and over
Age unknown
# 13 0 0 3 2 6 2 0 0 Accelerated Baccalaureate % 1.7% .% .0% 1.9% .8% 2.4% 5.4% .0% .0%
# . . . . . . . . . Accelerated Masters % .% .% .% .% .% .% .% .% .%
# 290 0 14 77 96 86 7 0 9 Associate
% 37.3% .% 43.8% 48.7% 36.6% 34.0% 18.9% .0% 29.0%
# 0 0 0 0 0 0 0 0 0 Associate Online % .0% .% .0% .0% .0% .0% .0% .0% .0%
# 358 0 8 55 122 128 23 0 22 Baccalaureate
% 46.0% .% 25.0% 34.8% 46.6% 50.6% 62.2% .0% 71.0%
# 114 0 10 22 41 32 5 1 0 Diploma
% 14.7% .% 31.3% 13.9% 15.6% 12.6% 13.5% 100.0% .0%
# 3 0 0 1 1 1 0 0 0 Diploma Online % .4% .% .0% .6% .4% .4% .0% .0% .0%
# 778 0 32 158 262 253 37 1 31 Total
% 100.0% .% 100.0% 100.0% 100.0% 100.0% 100.0% 100.0% 100.0%

Virginia Dept. of Health Professions Page 75 Profile of Nursing Education Programs 2008-09
Table 62 reports the age characteristics of full time faculty in RN programs. Majority (88%) of the total full time faculty were between 34-65 years, and most of them were employed by Baccalaureate and Associate degree programs as shown in Figure 41 and 42.
Figure 41. Full Time Faculty Age Range in RN Programs
0
32
262253
37
1
158
0
50
100
150
200
250
300
Less than 25 26 - 34 35 - 44 45 - 54 55 - 64 65 - 74 75 and over
Number of Full Time RN Programs by Age
Figure 42. Number of Full Time RN Programs by Age Group and Program Type
032
158
262 253
371
31
014
7796 86
7 0 9
0 8
55
122 128
230
22
0 10 2241 32
5 1 00 0 3 2 6 2 0 0
0 0 0 0 0 0 0 00 0 0 0 0 0 0 0
3 0 0 1 1 1 0 00
50
100
150
200
250
300
Less than25
26 - 34 35 - 44 45 - 54 55 - 64 65 - 74 75 andover
Ageunknown
Diploma On-line
Associate Degree On-line
Accelerated M asters Degree
Accelerated Baccalaureate Degree
Diploma
Baccalaureate DegreeAssociate Degree
Total
Diploma On-line
Associate Degree On-line
Accelerated M astersDegreeAcceleratedBaccalaureate Degree
Diploma
Baccalaureate Degree
Associate Degree
Total
Both Figure 43 and Table 63 shows that almost all (95.5%) full time faculty in RN programs
were Female and only 33 (4.24%) were Male. 16 out of 33 (48.5%) Male full time faculty were

Virginia Dept. of Health Professions Page 76 Profile of Nursing Education Programs 2008-09
employed by Baccalaureate degree programs, and 12 (36.4%) employed by Associate degree programs, and 4 (12.1%) employed by Diploma programs.
Table 63. Number of Full Time RN Programs by Gender and Program Type
#FT faculty Total# of FT Faculty Employed
Female Male Gender unknown
# 13 12 1 0 Accelerated Baccalaureate % 1.7% 1.6% 3.0% .%
# . . . . Accelerated Masters
% .% .% .% .%
# 290 276 12 0 Associate
% 37.3% 37.1% 36.4% .%
# 0 0 0 0 Associate Online
% .0% .0% .0% .%
# 358 342 16 0 Baccalaureate
% 46.0% 46.0% 48.5% .%
# 114 110 4 0 Diploma
% 14.7% 14.8% 12.1% .%
# 3 3 0 0 Diploma Online
% .4% .4% .0% .%
# 778 743 33 0 Total
% 100.0% 100.0% 100.0% .%
Figure 43. Number of Full Time RN Programs by Gender
743
33 0
342
16 0276
12 01104 0
12 1 0
0 0 0
0 0 0
3 0 00
100
200
300
400
500
600
700
800
Female Male Genderunknow n
Diploma Online
Associate Online
Accelerated Masters
Accelerated Baccalaureate
Diploma
Associate
Baccalaureate
Total
Diploma Online
Associate Online
Accelerated Masters
AcceleratedBaccalaureateDiploma
Associate
Baccalaureate
Total

Virginia Dept. of Health Professions Page 77 Profile of Nursing Education Programs 2008-09
Part Time Faculty in RN Programs
The total number of part-time and adjunct faculty positions employed by RN programs on October 15, 2009 was 714 part-time faculty positions, 14 part-time vacant positions, and 21 part-time nursing positions being actively recruited. Table 64 and Figure 44 illustrate the number of part-time positions employed, vacant, and actively recruited by each program type. Table 64. Part-time(PT) faculty positions employed, vacant, and actively recruited
on Oct. 15, 2009 by program type
# students Total # of full-
time(PT) employed Total # of full-time
(PT) vacant
Total # of vacant full-time(PT)
actively recruited
# 8 0 0 Accelerated Baccalaureate Degree % 1.1% .0% .0%
# . . . Accelerated Masters Degree
% .% .% .%
# 320 9 13 Associate Degree
% 44.8% 64.3% 61.9%
# 4 0 0 Associate Degree Online
% .6% .0% .0%
# 344 3 8 Baccalaureate Degree
% 48.2% 21.4% 38.1%
# 36 0 0 Diploma
% 5.0% .0% .0%
# 2 2 0 Diploma Online
% .3% 14.3% .0%
# 714 14 21 Total
% 100.0% 100.0% 100.0%
Baccalaureate Degree programs employed 48.2% of the total part-time (PT) positions in VA,
Associate Degree programs employed 44.8% of the total number of part-time (PT) positions, and Diploma programs employed 5% of the total number of part-time(PT) positions (see Table 64).
21.4% of the total number of part-time (PT) vacant positions, and 38.1% of the total number
of vacant part-time (PT) actively recruited were in Baccalaureate Degree programs compared to 64.3% of the total number of part-time (PT) vacant, and 61.9% of the total number of vacant part-time (PT) actively recruited were in Associate Degree programs

Virginia Dept. of Health Professions Page 78 Profile of Nursing Education Programs 2008-09
Figure 44. Part-time (PT) faculty positions employed, vacant, and actively recruited on Oct. 15, 2009 by program type
8 0 0 0 0 0
320
9 13 4 0 0
344
3 836
0 0 2 2 0
714
14 21
0
100
200
300
400
500
600
700
800
AcceleratedBaccalaureate
AcceleratedM asters
Associate AssociateOnline
Baccalaureate Diploma DiplomaOnline
Total
Total # o f PT and adjunct faculty employed
Total # o f PT nursing faculty vacant
Total # o f vacant PT positions being actively recruited
51 out of 68 (75%) RN programs reported that the number of part-time positions budgeted for programs were adequate to meet their current needs, while 7 (10.3%) programs reported that the number of part-time positions budgeted for programs were not adequate to meet their current needs, and 10 RN programs did not answer the question at the time of survey taking. (See Table 65). Reasons why part-time nursing positions budgeted for a program was not adequate to meet current needs is listed in Table 66.
Table 65. Number of part-time nursing positions budgeted for a program that was adequate to meet current needs by Program Type
Type of pre-licensure program
Accelerated Baccalaureate
Accelerated Masters
Associate Associate Online
Baccalaureate Diploma Diploma Online
Total Was budget adequate?
# # # # # # # #
No 0 0 4 0 2 1 0 7
None 2 2 3 1 1 1 0 10
Yes 1 0 30 1 14 4 1 51
Total 3 2 37 2 17 6 1 68

Virginia Dept. of Health Professions Page 79 Profile of Nursing Education Programs 2008-09
Table 66. Reasons why part-time nursing positions budgeted for a program were not adequate to meet current needs
Reasons: # of
programs
Total # of part-time employed
# of programs answered
‘No’ *
Insufficient number of qualified faculty
3 15 3
None 33 283 0
Other 1 22 1
Reason why PT positions budgeted do not meet current need
Total 37 320 4
35 296 3
Current needs depend on clinical and lab needs; clinical needs vary by specialty and facility availability.
1 22 1
As a new program, we were currently staffed well. However, we were actively recruiting for part-time clinical instructors as we grow into more courses next term.
1 2 0
Ass
ocia
te
Other reasons
Total 37 320 4
None 16 335 1
Other 1 9 1 Reason why PT positions budgeted do not meet current need
Total 17 344 2
15 285 0
Part time pool was small and minimally meets needs. Would use more if they were available.
1 9 1
Will need more adjunct faculty as the student number increases in the spring semester.
1 50 1
Bac
cala
ure
ate
Other reasons
Total 17 344 2
Insufficient number of qualified faculty
1 3 1
None 5 33 0
Reason why PT positions budgeted do not meet current need
Total 6 36 1
6 36 1
Dip
lom
a
Other reasons Total 6 36 1
Note: Last column counts the number of programs who answered ‘No’ when asked in the survey if the number of part-time nursing positions budgeted for a program were adequate to meet current needs
Figure 46 illustrates the highest degrees held by Part-Time nursing faculty employed on
October 15th, 2009. 7% of part-time nursing faculty employed by RN programs holds a Doctorate degree, 56.7% hold Masters Degree in nursing, and 31.2% hold Nursing Baccalaureate degree, 5% hold Non-Nursing Masters degree, and 1% hold non nursing Doctorate.

Virginia Dept. of Health Professions Page 80 Profile of Nursing Education Programs 2008-09
Table 67. Degree held by Part-Time nursing faculty employed by Program Type Accelerated Baccalaureat
e
Accel. Masters Associate
Associate Online
Baccalaureate Diploma
Diploma Online Total*
% Holding:
% % % % % % % %
Doctorate 25 . 2 0 15 8 0 7
Masters in Nursing
75.0 . 47.3 100.0 68.4 57.5 100.0 56.7
Baccalaureate in Nursing
.0 . 48.8 .0 7.2 13.4 .0 31.2
Associate in Nursing
0 . 1 0 0 10 0 2
RN Diploma 0 . 5 0 0 10 0 4
non-nursing Baccalaureate
0 . 0 0 0 0 0 0
non-nursing Masters
0 . 8 0 1 8 0 5
non-nursing Doctorate
12 . 1 0 1 0 0 1
Note: * Numbers represent the mean of all numbers (percentage) given by programs during the survey. The sum of all rows (% holding a doctorate, % holding Masters, etc) might not add up to 100. There was a possibility that some PT faculty who have more than one degree were reported more than once, also some programs did not report all their PT faculty at the time of the survey.
Figure 45. Degree held by Part-Time nursing faculty by Program Type
Associate in Nursing
2%
RN Diploma4%
non-nursing Baccalaureate
0%
Baccalaureate in Nursing
31.2%
non-nursing Masters
5%
non-nursing Doctorate
1%
Masters in Nursing56.7%
Doctorate7%
The Majority (80.4%) of full time faculty was White as shown in Figure 46, 13.3% of part time faculty was Black, and 2.5% of full time faculty was Asian. More than half (52.1%) of White part time faculty were employed by Baccalaureate degree programs, 41.5% of White part time faculty were employed by Associate degree programs, and 5% employed by Diploma Programs.(see Table 68 for details)

Virginia Dept. of Health Professions Page 81 Profile of Nursing Education Programs 2008-09
Table 68. Number of Part Time Faculty by Ethnic Group and Program Type
#PT faculty:
Total# of PT
Faculty Employed
White, non-
Hispanic
Black, non-
Hispanic
Hispanic of any race
Asian
American Indian / Alaskan Native
Native Hawaiian / Pacific Islander
More than one race
Race unknown
# 8 0 8 0 0 0 0 0 0 Accelerated Baccalaureate % 1.1% .0% 8.4% .0% .0% .% .0% .0% .0%
# . . . . . . . . . Accelerated Masters % .% .% .% .% .% .% .% .% .%
# 320 238 57 2 15 0 3 1 1 Associate
% 44.8% 41.5% 60.0% 40.0% 83.3% .% 100.0% 100.0% 25.0%
# 4 4 0 0 0 0 0 0 0 Associate Online % .6% .7% .0% .0% .0% .% .0% .0% .0%
# 344 299 26 3 2 0 0 0 3 Baccalaureate
% 48.2% 52.1% 27.4% 60.0% 11.1% .% .0% .0% 75.0%
# 36 31 4 0 1 0 0 0 0 Diploma
% 5.0% 5.4% 4.2% .0% 5.6% .% .0% .0% .0%
# 2 2 0 0 0 0 0 0 0 Diploma Online % .3% .3% .0% .0% .0% .% .0% .0% .0%
# 714 574 95 5 18 0 3 1 4 Total
% 100.0% 100.0% 100.0% 100.0% 100.0% .% 100.0% 100.0% 100.0% Notes: Total# of PT Faculty Employed was slightly different than total of all races as 7 programs reported sum of columns less than the total PT employed given by programs. 3 programs answered with percentage not number count, those where changed to number of PT employed by multiplying percentage given by total PT faculty employed.
Figure 46. Number of Part Time Faculty by Ethnic Group
574
955 18 0 3 1 4
238
572 15 0 3 1 1
299
26 3 2 0 0 0 331 4 0 1 0 0 0 0
0 8 0 0 0 0 0 00 0 0 0 0 0 0 0
4 0 0 0 0 0 0 02 0 0 0 0 0 0 00
100
200
300
400
500
600
White,non-
Hispanic
Black,non-
Hispanic
Hispanicof anyrace
Asian AmericanIndian /
AlaskanNative
NativeHawaiian/ PacificIslander
M orethan one
race
Raceunknown
Diploma OnlineAssociate Online
Accelerated M asters
Accelerated BaccalaureateDiploma
Baccalaureate
AssociateTotal
Diploma Online
Associate Online
Accelerated M asters
AcceleratedBaccalaureate
Diploma
Baccalaureate
Associate
Total

Virginia Dept. of Health Professions Page 82 Profile of Nursing Education Programs 2008-09
Table 69 summarizes the age characteristics of part time faculty in RN programs. 62.9% of the total part time faculty was between 34-65 years, and most of them were employed by Baccalaureate and Associate degree programs as shown in Figure 47 and 48.
Table 69. Number of Part Time faculty by Age Group and Program Type
#PT faculty Total# of
PT Faculty Employed
Less than 25
26 - 34 35 - 44 45 - 54 55 - 64 65 - 74 75 and over
Age unknown
# 13 0 1 0 0 7 0 0 0 Accelerated Baccalaureate % 1.7% .0% 1.7% .0% .0% 4.7% .0% .0% .0%
# . . . . . . . . . Accelerated Masters % .% .% .% .% .% .% .% .% .%
# 290 1 25 67 71 46 2 1 105 Associate
% 37.3% 50.0% 42.4% 45.3% 37.0% 30.9% 8.7% 50.0% 82.7%
# 0 0 0 . 2 2 0 0 0 Associate Online % .0% .0% .0% .% 1.0% 1.3% .0% .0% .0%
# 358 1 31 73 110 79 18 1 22 Baccalaureate
% 46.0% 50.0% 52.5% 49.3% 57.3% 53.0% 78.3% 50.0% 17.3%
# 114 0 2 7 8 15 3 0 0 Diploma
% 14.7% .0% 3.4% 4.7% 4.2% 10.1% 13.0% .0% .0%
# 3 0 0 1 1 0 0 0 0 Diploma Online % .4% .0% .0% .7% .5% .0% .0% .0% .0%
# 778 2 59 148 192 149 23 2 127 Total
% 100.0% 100.0% 100.0% 100.0% 100.0% 100.0% 100.0% 100.0% 100.0% Note: Total# of PT Faculty Employed was slightly different than total of all age groups as reported numbers in each age group summed less than the total PT faculty employed they provided. It might be possible that these 8 programs did not have sufficient age data for their PT faculty.
Figure 47. Number of Part Time faculty by Age Group
2
59
192
149
232
148
0
50
100
150
200
250
Less than25
26 - 34 35 - 44 45 - 54 55 - 64 65 - 74 75 and over
Number of Part Time RN Programs by Age

Virginia Dept. of Health Professions Page 83 Profile of Nursing Education Programs 2008-09
Figure 48. Number of Part Time faculty by Age Group and program type
2
59
148
192
149
232
127
1
31
73
110
79
181
22
125
67 71
46
2 1
105
0 2 7 8 153 0 0
0 1 0 0 7 0 0 0
0 0 0 0 0 0 0 00 0 0 2 2 0 0 0
0 0 1 1 0 0 0 00
20
40
60
80
100
120
140
160
180
200
Less than25
26 - 34 35 - 44 45 - 54 55 - 64 65 - 74 75 andover
Ageunknown
Diploma Online
Associate Online
Accelerated M asters
Accelerated Baccalaureate
Diploma
Associate
Baccalaureate
Total
Diploma Online
Associate Online
Accelerated M asters
AcceleratedBaccalaureate
Diploma
Associate
Baccalaureate
Total
Both Figure 49 and Table 70 show that almost all (approx. 94%) part time faculty in RN programs were Female and only 30 (4.2%) were Male. 17 out of 30 (56.7%) Male part time faculty were employed by Baccalaureate degree programs, and 11 (36.7%) employed by Associate degree programs, and one (3.3%) employed by Accelerated Baccalaureate degree programs.
Table 70. Number of Part Time RN Programs by Gender and Program Type
Total # of part-time employed
Female Male Gender unknown
# 8 7 1 0 Accelerated Baccalaureate % 1.1% 1.0% 3.3% .% # . . . . Accelerated Masters % .% .% .% .% # 320 307 11 0 Associate % 44.8% 45.8% 36.7% .% # 4 3 1 0 Associate Online % .6% .4% 3.3% .% # 344 316 17 0 Baccalaureate % 48.2% 47.1% 56.7% .% # 36 36 0 0 Diploma % 5.0% 5.4% .0% .% # 2 2 0 0 Diploma Online % .3% .3% .0% .% # 714 671 30 0
Total % 100.0% 100.0% 100.0% .%

Virginia Dept. of Health Professions Page 84 Profile of Nursing Education Programs 2008-09
Figure 49. Number of Part Time RN Programs by Gender and Program Type
671
30 0
316
17 0
307
11 036 0 0
7 1 0
0 0 03 1 0
2 0 00
100
200
300
400
500
600
700
Female Male Genderunknow n
Diploma Online
Associate Online
Accelerated Masters
Accelerated Baccalaureate
Diploma
Associate
Baccalaureate
Total
Diploma Online
Associate Online
Accelerated Masters
AcceleratedBaccalaureateDiploma
Associate
Baccalaureate
Total
Figure 50 illustrates the highest degrees held by RN Director in each program type. 30.9% of
RN directors in 21 RN programs hold a Doctorate degree (PhD), 38.2% of RN program directors have Masters in Nursing degrees (26 programs), and the remainder hold DNP (2 programs), EdD (5 programs) and non-nursing Masters degrees (1 program). 9 RN programs did not report the highest degree held by their directors (see Table 71). Other academic Degrees held by Program Director in Associate degree programs were Doctor of Science in Nursing (DSN), MSN, FNP-C, and in Diploma programs there was one director holding an MBA degree.
Table 71. Highest Academic Degree Held by Program Directors by Program type
Highest academic degree held by the program Director
DNP EdD MSN
Non-nursing Masters
None Other PhD Total
# 0 1 0 0 2 0 0 3 Accelerated Baccalaureate
% .0% 33.3% .0% .0% 66.7% .0% .0% 100.0%
# 0 0 0 0 2 0 0 2 Accelerated Masters
% .0% .0% .0% .0% 100.0% .0% .0% 100.0%
# 1 1 21 1 3 4 6 37 Associate
% 2.7% 2.7% 56.8% 2.7% 8.1% 10.8% 16.2% 100.0%
Associate Online # 0 0 0 0 1 0 1 2
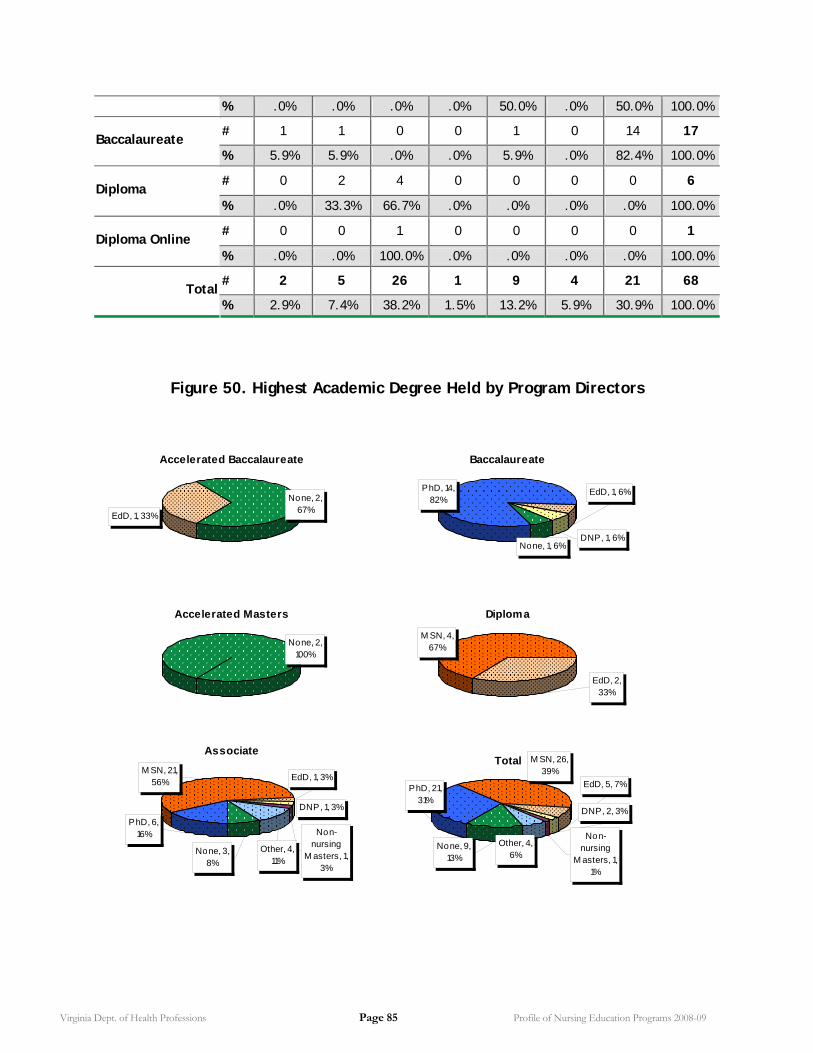
Virginia Dept. of Health Professions Page 85 Profile of Nursing Education Programs 2008-09
% .0% .0% .0% .0% 50.0% .0% 50.0% 100.0%
# 1 1 0 0 1 0 14 17 Baccalaureate
% 5.9% 5.9% .0% .0% 5.9% .0% 82.4% 100.0%
# 0 2 4 0 0 0 0 6 Diploma
% .0% 33.3% 66.7% .0% .0% .0% .0% 100.0%
# 0 0 1 0 0 0 0 1 Diploma Online
% .0% .0% 100.0% .0% .0% .0% .0% 100.0%
# 2 5 26 1 9 4 21 68 Total
% 2.9% 7.4% 38.2% 1.5% 13.2% 5.9% 30.9% 100.0%
Figure 50. Highest Academic Degree Held by Program Directors
Accelerated Baccalaureate
EdD, 1, 33%
None, 2, 67%
Baccalaureate
DNP, 1, 6%
EdD, 1, 6%
None, 1, 6%
PhD, 14, 82%
Accelerated Masters
None, 2, 100%
Diploma
EdD, 2, 33%
M SN, 4, 67%
Associate
Other, 4, 11%
None, 3, 8%
PhD, 6, 16%
M SN, 21, 56%
Non-nursing
M asters, 1, 3%
DNP, 1, 3%
EdD, 1, 3%
Total M SN, 26, 39%
DNP, 2, 3%
Non-nursing
M asters, 1, 1%
EdD, 5, 7%
Other, 4, 6%
None, 9, 13%
PhD, 21, 31%

Virginia Dept. of Health Professions Page 86 Profile of Nursing Education Programs 2008-09
Disruptions in the Part-Time Nursing Faculty
Last year,, during the 2008-09 academic year, the number of new full-time nursing faculty appointments were 132 in all RN programs. 62.1% of those new full-time faculty appointments were in Associate degree programs, and 34.8% were in Baccalaureate degree programs. The number of full-time faculty resigned during the same period was 56 in all RN programs, 42.9% of those resignations were Associate Degree programs, 42.9% were in Baccalaureate degree programs, and 14.3% where in Diploma programs. Table 72 shows the Disruptions in the Full-Time Nursing Faculty in each program type.
Table 72. Disruptions in the Full-Time Nursing Faculty
# of new FT faculty
appointments # of FT faculty resigned
# 1 0 Accelerated Baccalaureate
% .8% .0%
# . . Accelerated Masters
% .% .%
# 82 24 Associate
% 62.1% 42.9%
# 0 0 Associate Online
% .0% .0%
# 46 24 Baccalaureate
% 34.8% 42.9%
# 3 8 Diploma
% 2.3% 14.3%
# 0 0 Diploma Online
% .0% .0%
# 132 56 Total
% 100.0% 100.0%
RN to BSN PROGRAM RN to BSN Applications and New Enrollments
The number of RN to BSN Programs who admitted students during the last academic year were 20 programs, 17 Baccalaureate Programs and 3 Accelerated Baccalaureate programs. Table 73 and Figure 52 summarize and illustrate the number of applications received by programs, and the number of those applications that were qualified, the number of qualified applications that were admitted, and the number of applicants who actually enrolled in a program. Approximately 25% (165 unfilled spaces) of the programs capacity in Baccalaureate degree programs, and approximately 40% (40 unfilled spaces) of the programs capacity in Accelerated Baccalaureate degree were not filled.
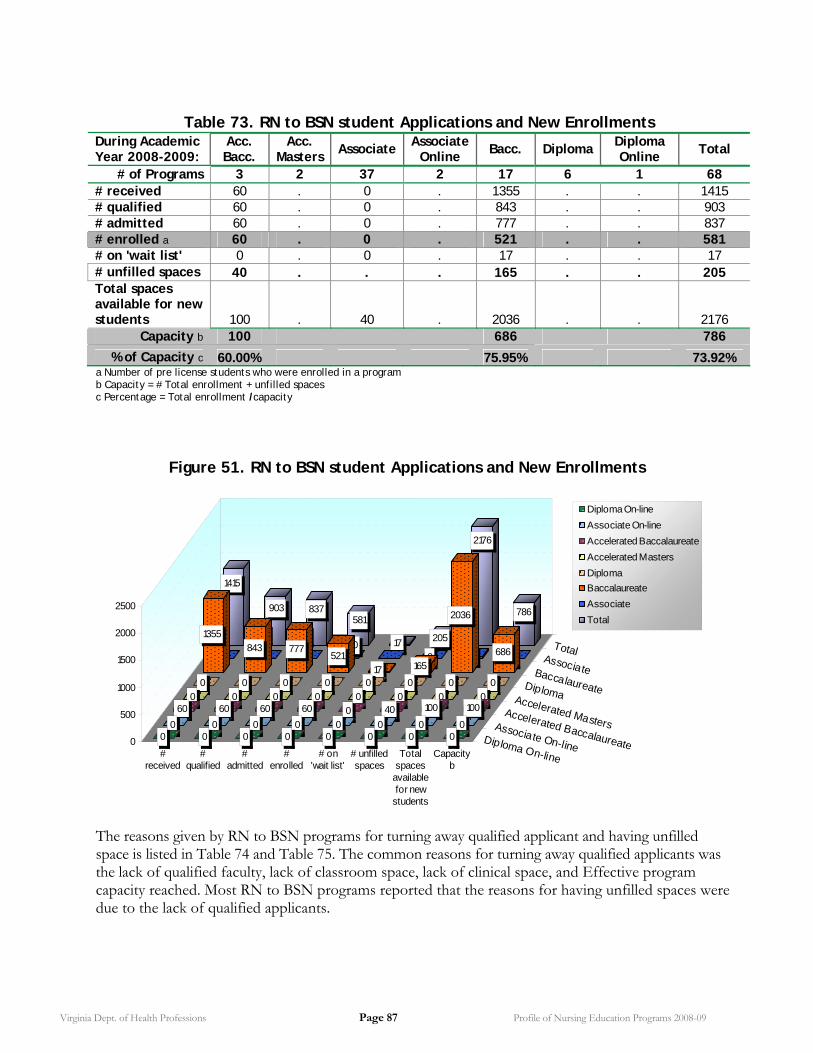
Virginia Dept. of Health Professions Page 87 Profile of Nursing Education Programs 2008-09
Table 73. RN to BSN student Applications and New Enrollments
During Academic Year 2008-2009:
Acc. Bacc.
Acc. Masters
Associate Associate Online
Bacc. Diploma Diploma Online
Total
# of Programs 3 2 37 2 17 6 1 68 # received 60 . 0 . 1355 . . 1415 # qualified 60 . 0 . 843 . . 903 # admitted 60 . 0 . 777 . . 837 # enrolled a 60 . 0 . 521 . . 581 # on 'wait list' 0 . 0 . 17 . . 17 # unfilled spaces 40 . . . 165 . . 205 Total spaces available for new students 100 . 40 . 2036 . . 2176
Capacity b 100 686 786
% of Capacity c 60.00% 75.95% 73.92% a Number of pre license students who were enrolled in a program b Capacity = # Total enrollment + unfilled spaces c Percentage = Total enrollment /capacity
Figure 51. RN to BSN student Applications and New Enrollments
1415
903 837581
17 205
2176
786
0 0 000
0 40 0
1355
843 777521
17 165
2036
686
0 0 0 0 0 0 0 0
0 0 0 0 0 0 0 060 60 60 60 0 40 100 100
0 0 0 0 0 0 0 00 0 0 0 0 0 0 00
500
1000
1500
2000
2500
#received
#qualified
#admitted
#enrolled
# on'wait list'
# unfilledspaces
Totalspaces
availablefor new
students
Capacityb
Diploma On-line
Associate On-line
Accelerated Baccalaureate
Accelerated Masters
Diploma
Baccalaureate
Associate
Total
Diploma On-line
Associate On-line
Accelerated Baccalaureate
Accelerated Masters
Diploma
Baccalaureate
Associate
Total
The reasons given by RN to BSN programs for turning away qualified applicant and having unfilled space is listed in Table 74 and Table 75. The common reasons for turning away qualified applicants was the lack of qualified faculty, lack of classroom space, lack of clinical space, and Effective program capacity reached. Most RN to BSN programs reported that the reasons for having unfilled spaces were due to the lack of qualified applicants.

Virginia Dept. of Health Professions Page 88 Profile of Nursing Education Programs 2008-09
Table 74. Reasons for Turning Away Qualified Applicants in RN to BSN Programs
Reasons # of
programs # of app. qualified
# of app. admitted
# of app. on 'wait
list'
34 0 0 0
Lack of qualified faculty, Lack of classroom space
1 . . .
Lack of qualified faculty, Lack of classroom space, Lack of clinical space, Effective program capacity reached
1 . . 0
Lack of qualified faculty, Lack of clinical space
1 . . .
Ass
ocia
te Factors
prohibiting programs from admitting students
Total 37 0 0 0
13 366 366 0 Effective program capacity
reached 1 197 148 0
Lack of classroom space, Effective program capacity reached
1 129 129 .
Lack of qualified faculty 1 107 107 0 Lack of qualified faculty,
Lack of classroom space, Lack of clinical space, Effective program capacity reached
1 44 27 17
Factors prohibiting programs from admitting students
Total 17 843 777 17
16 736 670 17 Students must have all
general education courses completed before being permitted to enroll in upper division RN>BSN courses. However, they can apply for admission before these courses were completed, which creates a gap between acceptance into the program and formal enrollment.
1 107 107 0
Bac
cala
ure
ate
Other factors
Total 17 843 777 17

Virginia Dept. of Health Professions Page 89 Profile of Nursing Education Programs 2008-09
Table 75. Why programs had unfilled spaces for new students in 2008 - 2009
programs # of unfilled
spaces for new students Reasons programs have unfilled spaces
# # %
2 . .% Lack of qualified applicants 1 40 100.0%
Acc
. Bac
c.
Total 3 40 100.0% 9 11 100.0% Accepted students did not matriculate. 1 10 100.0% Due to the requirement to have all general education
courses completed before enrollment was permitted in the upper division RN>BSN courses.
1 52 100.0%
Lack of applicants 1 7 100.0% Lack of applications 1 9 100.0% Not enough applicants. 1 8 100.0% Students did not shows up that were admitted. 1 7 100.0% We were working on increasing capacity for 2010. 1 44 100.0% We have admitted all who were qualified, so there was
either a lack of qualified applicants or those admitted were unable to enroll for financial or personal reasons.
1 17 100.0%
Bac
cala
ure
ate
Total 17 165 100.0%
The Minimum Grade Points Average (GPA) required for admission in RN to BSN programs
ranges between 2.0 and 3.0 grade points. Almost half of the programs require a GPA of 2.5 for admission. The average GPA for students admitted in those programs was between 2.5 GPA and 3.7 GPA. Table 76 reports the minimum GPA requirements by programs and average grade points for students who were admitted.
Table 76. Minimum and Average Grade Point Average (GPA) requirement for admission to RN to BSN program
Grade Point Average (GPA)
# of programs
Minimum GPA requirement for admission 2.50 1 Accelerated Baccalaureate Average GPA for students admitted 2.80 1
0.00 1 Minimum GPA requirement for admission
2.50 1
0.00 1 Associate
Average GPA for students admitted 2.50 1
2.00 3
2.20 1
2.50 7
2.80 1
Baccalaureate
Minimum GPA requirement for admission
3.00 1

Virginia Dept. of Health Professions Page 90 Profile of Nursing Education Programs 2008-09
2.50 1
2.70 1
2.80 2
2.86 1
2.99 1
3.00 1
3.05 1
3.08 1
3.10 1
3.12 1
3.27 1
Average GPA for students admitted
3.70 1
Average age for students who were admitted to RN to BSN program was 27 in Accelerated Baccalaureate Degree programs, and between 29 and 42 in Baccalaureate Degree programs. The Attrition Rate for students in RN to BSN programs in the 2008-09 academic year varies from one program to another. The overall Attrition Rate that was reported by RN to BSN programs was less than 10% while one program reported 20% and another program reported 52.2% as their overall attrition rate. (See Table 77) RN to BSN Student Attrition
Table 77. RN to BSN Program Student Attrition Rate in the 2008-2009 academic year by Program Type
Student attrition rate # of programs
First Year attrition rate 0% 1
Second Year attrition rate 0% 1 Accelerated Baccalaureate
Third Year attrition rate 0 1
First Year attrition rate 0% 1
Second Year attrition rate 0% 1
Third Year attrition rate 0% 1 Associate
Overall attrition rate for programs 0% 1
0% 6
1% 1
3% 2
4% 2
4.65% 1
40% 1
First Year attrition rate
42% 1
0% 8
Baccalaureate
Second Year attrition rate
1.8% 1

Virginia Dept. of Health Professions Page 91 Profile of Nursing Education Programs 2008-09
5% 1
8.3% 1
15% 2
50% 1
0% 9
16% 1 Third Year attrition rate
50% 1
0% 5
0.05% 1
2% 1
4% 1
6% 1
6.45% 1
8.30% 1
10% 1
20% 1
Overall attrition rate for programs
52.20% 1
RN to BSN Program Graduates
The total number of graduates from RN to BSN programs was 467 students. Figure 52 illustrates the percentage of graduates in each racial group. 70% of those graduates were White, 20.6% were Black, 2.1% were Hispanic, and 3.2% were Asian. Table 78 summarizes the number of students graduated by ethnic group in each program type. 6.9% of those graduates were Male students (32 student), and 1% of the graduates (5 students) reported having a degree in a discipline other than nursing (see Table 79 and Table 80).
Figure 52. Students Graduated from RN to BSN Programs by Ethnic Group
White, non-Hispanic70.4%
Black, non-Hispanic20.6%Hispanic of any race
2.1%Asian3.2%
Race unknow n2.8%
White, non-Hispanic
Black, non-Hispanic
Hispanic of any race
Asian
American Indian /Alaskan NativeNative Haw aiian /Pacif ic IslanderMore than one race
Race unknow n

Virginia Dept. of Health Professions Page 92 Profile of Nursing Education Programs 2008-09
Table 78. Number of Students Graduated from RN to BSN Programs by Ethnic Group
and Program Type
# students Total# of students
graduated
White, non-
Hispanic
Black, non-
Hispanic
Hispanic of any race
Asian
American Indian / Alaskan Native
Native Hawaiian / Pacific Islander
More than one race
Race unknown
# 47 5 39 0 1 0 2 0 0 Accelerated Baccalaureate % 10.1% 1.5% 40.6% .0% 6.7% .0% 100.0% .% .0%
# . . . . . . . . . Accelerated Masters % .% .% .% .% .% .% .% .% .%
# 0 0 0 0 0 0 0 0 0 Associate
% .0% .0% .0% .0% .0% .0% .0% .% .0%
# . . . . . . . . . Associate Online % .% .% .% .% .% .% .% .% .%
# 420 324 57 10 14 2 0 0 13 Baccalaureate
% 89.9% 98.5% 59.4% 100.0% 93.3% 100.0% .0% .% 100.0%
# . . . . . . . . . Diploma
% .% .% .% .% .% .% .% .% .%
# . . . . . . . . . Diploma Online % .% .% .% .% .% .% .% .% .%
# 467 329 96 10 15 2 2 0 13 Total
% 100.0% 100.0% 100.0% 100.0% 100.0% 100.0% 100.0% .% 100.0%
Table 79. Number of graduates having a degree in a discipline other than nursing
# students Total # of students
graduated
# of graduates having a degree in a
discipline other than nursing
# 47 0 Accelerated Baccalaureate Degree % 10.1% .0% # . . Accelerated Masters Degree % .% .% # 0 0 Associate Degree % .0% .0% # . . Associate Degree Online % .% .% # 420 5 Baccalaureate Degree % 89.9% 100.0% # . . Diploma % .% .% # . . Diploma Online % .% .% # 467 5 Total % 100.0% 100.0%

Virginia Dept. of Health Professions Page 93 Profile of Nursing Education Programs 2008-09
Table 80. RN to BSN Number of Male Graduates
# students Total # of students
graduated
# of graduates having a degree in a
discipline other than nursing
# 47 2 Accelerated Baccalaureate Degree % 10.1% 6.3% # . . Accelerated Masters Degree % .% .% # 0 0 Associate Degree % .0% .0% # . . Associate Degree Online % .% .% # 420 30 Baccalaureate Degree % 89.9% 93.8% # . . Diploma % .% .% # . . Diploma Online % .% .% # 467 32 Total % 100.0% 100.0%

Virginia Dept. of Health Professions Page 94 Profile of Nursing Education Programs 2008-09
Trends Over Time
Nursing Programs Admission and Graduates Trend
The Report of Statistics published each year by the Virginia Board of Nursing contains information on nursing education program admissions and graduations from previous years. Figure 53, and Figure 54 were created using information from those reports, dating back to the 2003-2004 academic year, and last years report.
Figure 53. PNE Program Admissions and Graduation Trends
2003 -2004
2004 -2005
2005 -2006
2006 -2007
2007 -2008
2008 -2009
PNE Graduates
3,008
3,759 3,847
2,411
4358
2,233
1,254
1,752 1,804
1,180
1900
1,225
0
1,000
2,000
3,000
4,000
5,000
PNE Graduates PNE Admissions
Figure 53 illustrates the number of students admitted to PNE programs and the number of students graduated in the last six academic years. The number of admissions during the 2008-09 academic year has jumped 95% from 2,233 students in 2007-08 to 4358 student in 2008-09. The Number of graduates during the same period jumped 55% from 1,225 graduate to 1900 graduate.
Figure 54. RN Program Admissions and Graduations Trends
2003 -2004
2004 -2005
2005 -2006
2006 -2007
2007 -2008
2008-09
RN Graduates
3,695
4,7244,528
4,671
6526
4,799
2,3282,912 2,909
3,2653536
3,228
0
1,000
2,000
3,000
4,000
5,000
6,000
7,000
RN Graduates RN Admissions

Virginia Dept. of Health Professions Page 95 Profile of Nursing Education Programs 2008-09
Figure 54 illustrates the number of students admitted to RN programs and the number of students graduated in the last six academic years. The number of admissions during the 2008-09 academic year has jumped 35% from 4,799 students in 2007-08 to 6526 student in 2008-09. The Number of graduates during the same period jumped 9% from 3,228 graduate to 3,536 graduate. With the continued collection of data responsive to the specific questions outlined in the 2009 Nursing Education Survey and detailed in this report, trending similar to that completed for admissions and graduations will be possible over time and can become a regular feature of future editions of this report.