Numerical and analytical studies of low cycle fatigue ...
48
Journal of Pressure Vessel Technology PVT-19-1189 1 Abarkan Numerical and analytical studies of low cycle fatigue behavior of 316 LN austenitic stainless steel Ikram Abarkan SCD Laboratory, Faculty of Sciences, Abdelmalek Essaadi University, 93002 Tetouan, Morocco [email protected] Rabee Shamass Division of Civil and Building Services Engineering, School of Build Environment and Architecture, London South Bank University, UK [email protected] Zineb Achegaf SCD Laboratory, ENSA Tetouan, Abdelmalek Essaadi University, 93030 Tetouan, Morocco [email protected] Abdellatif Khamlichi SCD Laboratory, ENSA Tetouan, Abdelmalek Essaadi University, 93030 Tetouan, Morocco [email protected] ABSTRACT Mechanical components are frequently subjected to severe cyclic pressure and/or temperature loadings. Therefore, numerical and analytical low cycle fatigue methods become widely used in the field of engineering to estimate the design fatigue lives. The primary aim of this work is to evaluate the accuracy of the most commonly used numerical and analytical low cycle fatigue life methods for specimens made of 316 LN austenitic stainless steel and subjected to fully reversed uniaxial tension-compression loading, in the room temperature condition. It was found that both Maximum shear strain and Brown-Miller criterions result in a very conservative estimation for uniaxially loaded specimens, however, Maximum shear strain criteria provides better results compared to the Brown-Miller criteria. The total strain energy density approach was also used, and both the Masing and non-Masing analysis were adopted in this study. It is found that the Masing model provides conservative fatigue lives, and non-Masing model results in a more realistic fatigue life prediction for 316 LN stainless steel for both low and high strain amplitude. The fatigue design curves obtained from the commonly used analytical low cycle fatigue equations were reexamined for 316 LN SS. The obtained design curves from Langer model and its modified versions are non-conservative for this type of material. Consequently, the authors suggest new optimized parameters to fit the given test data. The obtained curve using the currently suggested parameters is in better agreement with the experimental data for 316 LN SS. Keywords: Finite-element analysis; 316 LN stainless steel; Langer analytical model; multiaxial strain life criterions; total strain energy density. 1 Introduction The global demand for high-power in automotive, marine, electricity generation, and aerospace industries has radically increased over last decades. In fact, to meet ever-growing needs for energy in high-power-utilizing
Transcript of Numerical and analytical studies of low cycle fatigue ...

Journal of Pressure Vessel Technology
PVT-19-1189 1 Abarkan
Numerical and analytical studies of low cycle fatigue behavior of 316 LN
austenitic stainless steel
Ikram Abarkan
SCD Laboratory, Faculty of Sciences, Abdelmalek Essaadi University, 93002 Tetouan, Morocco
Rabee Shamass
Division of Civil and Building Services Engineering, School of Build Environment and Architecture, London
South Bank University, UK
Zineb Achegaf
SCD Laboratory, ENSA Tetouan, Abdelmalek Essaadi University, 93030 Tetouan, Morocco
Abdellatif Khamlichi
SCD Laboratory, ENSA Tetouan, Abdelmalek Essaadi University, 93030 Tetouan, Morocco
ABSTRACT
Mechanical components are frequently subjected to severe cyclic pressure and/or temperature loadings. Therefore,
numerical and analytical low cycle fatigue methods become widely used in the field of engineering to estimate the
design fatigue lives. The primary aim of this work is to evaluate the accuracy of the most commonly used numerical
and analytical low cycle fatigue life methods for specimens made of 316 LN austenitic stainless steel and subjected
to fully reversed uniaxial tension-compression loading, in the room temperature condition. It was found that both
Maximum shear strain and Brown-Miller criterions result in a very conservative estimation for uniaxially loaded
specimens, however, Maximum shear strain criteria provides better results compared to the Brown-Miller criteria.
The total strain energy density approach was also used, and both the Masing and non-Masing analysis were adopted
in this study. It is found that the Masing model provides conservative fatigue lives, and non-Masing model results
in a more realistic fatigue life prediction for 316 LN stainless steel for both low and high strain amplitude. The
fatigue design curves obtained from the commonly used analytical low cycle fatigue equations were reexamined
for 316 LN SS. The obtained design curves from Langer model and its modified versions are non-conservative for
this type of material. Consequently, the authors suggest new optimized parameters to fit the given test data. The
obtained curve using the currently suggested parameters is in better agreement with the experimental data for 316
LN SS.
Keywords: Finite-element analysis; 316 LN stainless steel; Langer analytical model; multiaxial strain life
criterions; total strain energy density.
1 Introduction
The global demand for high-power in automotive, marine, electricity generation, and aerospace industries has
radically increased over last decades. In fact, to meet ever-growing needs for energy in high-power-utilizing
Journal of Pressure Vessel Technology
PVT-19-1189 2 Abarkan
sectors, components such as exhaust manifold systems and cylinder heads in car engines, combustion turbines
used to power aircraft or to drive electrical power generators, and advanced gas cooled reactors (AGR) utilized in
nuclear power plants must operate at extreme cyclic pressure and temperature loading conditions [1-5], which
results in fatiguing of these components. Over years, many research studies have been conducted to provide an in-
depth understanding of fatigue issues and provide design guidance for engineers. Nevertheless, because of the
complex nature of fatigue problems due to the influence of many factors on fatigue life such as material properties,
surface features, operating temperature, residual stresses, environmental effects, and randomness of fatigue crack
growth, the fatigue failure mechanism still remains incomprehensible [6, 7]. Fatigue life of materials is considered
as an enormous problem in the field of engineering, due to the fact that 50 to 90 percent of all mechanical failures
are fatigue failure [8] and about 80 to 90 percent of failures in civil engineering metallic structures are occurring
due to fatigue [9-12], therefore, this topic always remains as an exclusive area of research.
When a structure undergoing cyclic loadings, it may collapse even if the applied forces are below the yield stress
of a material, due to cumulative fatigue damage that gradually occurs for applied stresses exceeding the endurance
limit of the material. While high number of cycles with low load amplitudes are needed to yield fatigue failure of
metallic structure, it may also fail under lower number of cycles with higher load amplitudes; this is known as low
cycle fatigue (number of cycles4
10 cycles ) that embraces a high coupling between plastic behavior and damage
mechanisms [13,14].
In many engineering applications, materials with excellent mechanical properties are required. It has been revealed
that austenitic stainless steel is an excellent material choice, due to its high fatigue strength, good impact toughness
and outstanding corrosion resistance compared to carbon steel and aluminum [15]. In particular, the 316 LN
austenitic stainless steel is widely utilized in machine components and engineering constructions owing to low
carbon and increased nitrogen contents compared to the conventional 316 austenitic stainless steel. Low carbon in
this material prevents stress corrosion cracking, while nitrogen addition results in improvements in mechanical
properties, particularly strength [16,17]. As a result of high strength, good fracture toughness, and excellent
oxidation/corrosion resistance, 316 LN stainless steel type becomes a suitable material for engineering purpose.
In superconducting magnet systems, the most commonly used material is 316 LN, due to its excellent mechanical
properties at cryogenic temperature [18,19]. For high-temperature applications such as nuclear reactors
components and piping in power plants, this material is mostly selected because of its high creep, tensile strength
and good low cycle fatigue properties[20]. Besides, due to its good mechanical properties at room temperature,
several low cycle fatigue studies have been carried out on this material under ambient temperature condition. It is
common knowledge that steel reinforcement in concrete elements is exceedingly vulnerable to chloride containing
environments such as seawater and deicing salt. Therefore, 316 LN stainless steel rebars can be effective,
sustainable and durable solution to enhance the durability of reinforced concrete structures in aggressive
environments such as highway bridges, tunnels, seawalls, and parking garages [21]. For stainless steel (SS)
reinforcements used in the concrete members subjected to seismic loading, many mechanical properties should be
investigated such as strength, ductility and low cycle fatigue.
An accurate prediction of fatigue life is important to the design and maintenance of fatigue-affected components.
However, the design guidelines as given in the various codes apply only to simple forms and the experimental
assessment of fatigue in the laboratory is expensive and time-consuming. As a result, computer-aided simulation-
Journal of Pressure Vessel Technology
PVT-19-1189 3 Abarkan
based software is becoming more suitable in the field of fatigue analysis. Many researchers proposed numerical
methods to estimate low cycle fatigue life of metals. For instance Coffin, Manson [22,23], and Basquin [24]
independently proposed a constitutive numerical model, in which both low and high cycle fatigue phenomena are
combined in one single equation. Later on, multiaxial Maximum shear strain, Principle strain [25] and Brown-
Miller [26,27] criterions were introduced into the literature to prevent crack nucleation phase. It was reported that
Brown-Miller and Maximum shear strain criterions are both recommended for ductile metals, where the first one
provides a good life estimation and the second gives conservative results. However the Principle strain criteria is
usually recommended for brittle metals and tends to give overestimated results for ductile ones [25]. Based on the
conventional Manson-Coffin-Basquin model, Bäumel and Seeger [28] introduced an alternative method which
includes two different expressions, one for unalloyed and low-alloy steels and another one for aluminum and
titanium alloys sheets. This method allows constructing the strain-life curve using only the material ultimate tensile
strength and the elastic modulus as input data. Roessle and Fatemi [29] proposed a new method called Hardness
method, to estimate the strain-life curve of steels using only Brinell hardness and elastic modulus of the material.
The accuracy of this method for a wide variety of steels and hardness levels has been proved by many
researchers[30]. Ricotta [31] studied the possibility of generalizing the Roessle and Fatemi’s method to ductile
cast irons using the same static properties. Maggiolaro-Castro [32] suggested the Medians method to estimate the
strain life curve for steel and aluminum materials. This method is convenient as it necessitates only the
experimental ultimate tensile strength and the elastic modulus of the material to calculate the fatigue life. It was
stated that the Medians method and Hardness method provide excellent fatigue life estimation for aluminum alloys
and steel, respectively [33]. Other more relevant uniaxial fatigue life methods were presented and discussed in
details in Lee and Song's paper [33]. To account for the effect of the maximum normal stress on multiaxial fatigue
life, a modification to critical plane Brown-Miller approach was proposed by Fatemi and Socie [34]. To allow
predicting multiaxial fatigue life using only Brinell hardness as an input parameter, a simple approximation for
steels was suggested by Shamsaei and Fatemi [35]. Other multiaxial fatigue life criteria have been well discussed
by Wang et al. [36].
In certain circumstances, due to the complexity of stress state in the material, the value of plastic strains is difficult
to obtain, such as in solder joints [37]. Thus, using the strain-life approach to prevent fatigue failure becomes quite
challenging. Since the calculation of the total energy released by specimens during fatigue seems to be a simple
process, relying on inelastic strain energy based fatigue life criterion is more convenient for predicting fatigue life.
Regarding this approach, the life to failure can be estimated in reliance on the absorbed plastic strain energy per
cycle and on the total strain energy dissipated during fatigue [38].
Langer [39] suggested an analytical low cycle fatigue equation, which allows predicting fatigue lives based upon
a limited amount of material data. This equation was incorporated in the ASME (American Society of Mechanical
Engineers) Boiler & Pressure Vessel Code and was first used to predict the fatigue life of pressure vessels
components in nuclear power plants and utilized to study the low cycle fatigue life of other structural elements and
machine components. Nonetheless, due to its inexactitude and inaccuracy, this method has been modified by many
authors. In particular, Diercks [40] suggested two adjustments for Langer's equation. He proposed variable
exponent instead of the fixed one, and the material constants in Langer’s equation were obtained by minimizing
the sum of the squares of the errors in the logarithmic scale. Another modification of Langer’s equation were
carried out by Tanaka [41] where the strain concentration factor was added into Langer’s equation to estimate
Journal of Pressure Vessel Technology
PVT-19-1189 4 Abarkan
fatigue life of bellows. More other modifications made by other researchers [42,43] are discussed in detail in
Section 4.
Numerical and analytical low cycle fatigue methods are frequently employed to analyze the integrity and the
behavior of materials under cyclic loads. The analytical prediction of fatigue endurance does not require any
background knowledge in software programming, thus it is more likely appreciated by designers. Furthermore,
fatigue failure is dangerous and occurs spontaneously without any prior warning [44], which may lead to the
problem of personal safety. Therefore, the reliability and the precision of the analytical equations that predict the
fatigue life play a critical role in fatigue. Hence, the overall aim of this work is to study the cyclic behavior of 316
LN SS and to predict the fatigue life of specimens subjected to different strain amplitude levels at room temperature
condition by way of multiple numerical methods, namely maximum shear strain[25] and Brown-Miller criteria
[26,27], total strain energy density approach [45-47], and analytical models, namely Langer analytical
equation[39] and its modified versions [40,42,43]. The accuracy of the numerical and analytical methods to predict
fatigue life for 316 LN SS is also included in this study. New fitting parameters have been suggested in this paper
to overcome the problem of the inaccuracy in some of the commonly used analytical equations.
2 Experimental conditions and specimen’s geometry
Roy et al. [48] conducted low cycle fatigue tests on six specimens at the room temperature made of 316 LN
stainless steel and subjected to fully reversed strain amplitude loading (i.e. 0m ) which varies from ±0.3% to
±1.0% at a constant strain rate. As seen in Fig.1, the gauge length and diameters of each specimen are 25 mm and
10 mm, respectively. The applied total axial strain control mode was symmetrical triangular strain–time waveform,
using DARTEC servo-hydraulic fatigue testing machine.
3 Finite element modeling
Specimens subjected to fully reversed tension-compression fatigue loads were modeled using finite element
analysis on ABAQUS/Standard software. One end of the model was clamped (i.e. all rotations and displacements
degrees of freedom are prevented) while all degrees of freedom are free at the other end except for the displacement
along the longitudinal axis of the model which used to load the system. The reversed tension-compression load
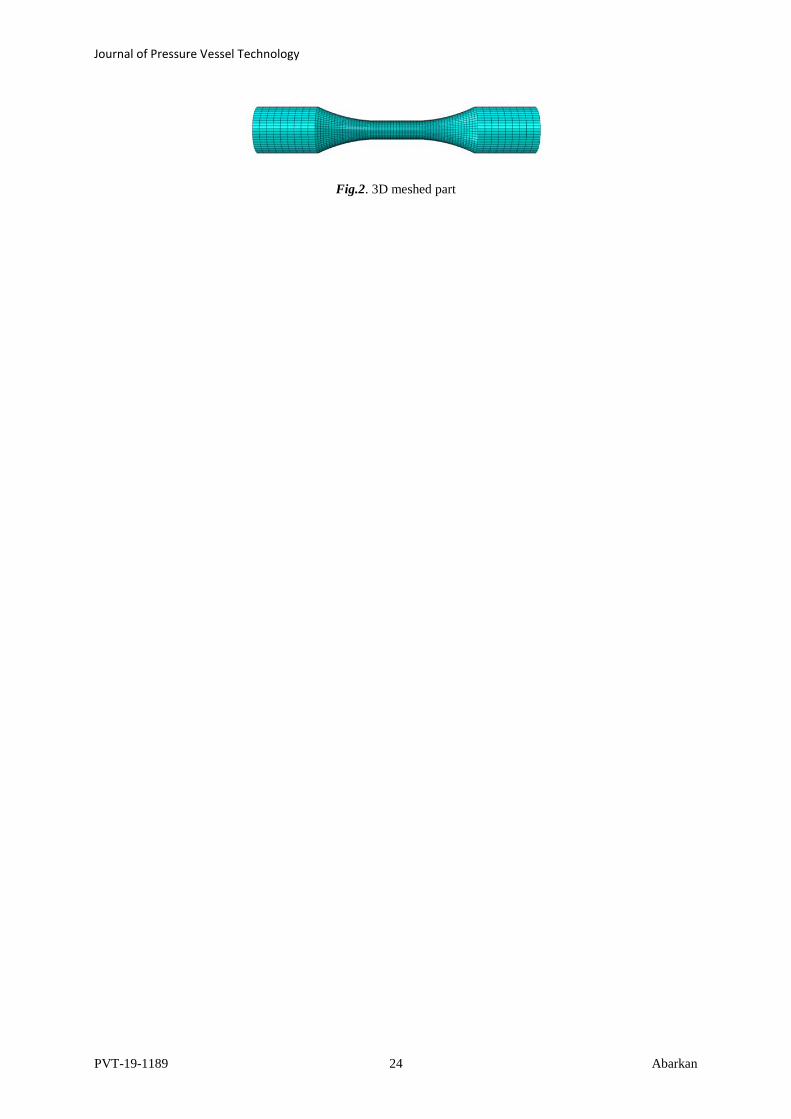
results from prescribed displacement amplitude in symmetrical triangular strain-time waveform. The 3-
dimensional part was meshed using hexahedral elements shape with the swept meshing technique; which allowed
generating mesh along the sweep path. The C3D8R element type, the linear 8-node brick element with reduced
integration point and default hourglass control, was used for this analysis. Moreover, this formulation is well
adapted for a nonlinear response of the material, particularly at large deformations level to avoid elements
distortion [49]. Mesh convergence study was conducted and it was decided that a refined mesh of 1.5 mm applied
to the middle region of the model, see Fig. 2, is suitable. This will be discussed further in the sub-section 4.2.1.
It must be mentioned herein that, due to the loading symmetry, 2D-axisymmetric analysis can be used for this
problem; however, only solid elements can be treated by Fe-Safe fatigue software [25]. Therefore, the FE
simulation was conducted using the 3D analysis.
Journal of Pressure Vessel Technology
PVT-19-1189 5 Abarkan
When a material is cyclically loaded, Bauschinger effect and cyclic hardening or/and cyclic softening may occur
due to large plastic deformations within the structure. Therefore, nonlinear isotropic and kinematic hardening
material model [50] was employed in ABAQUS FEA software to capture the cyclic stress-strain of the first
hysteresis loop as well as the tensile stress response to saturation. It is worth noting that the isotropic hardening
model represents the change in size of the yield surface whereas the translation of this surface in the stress space
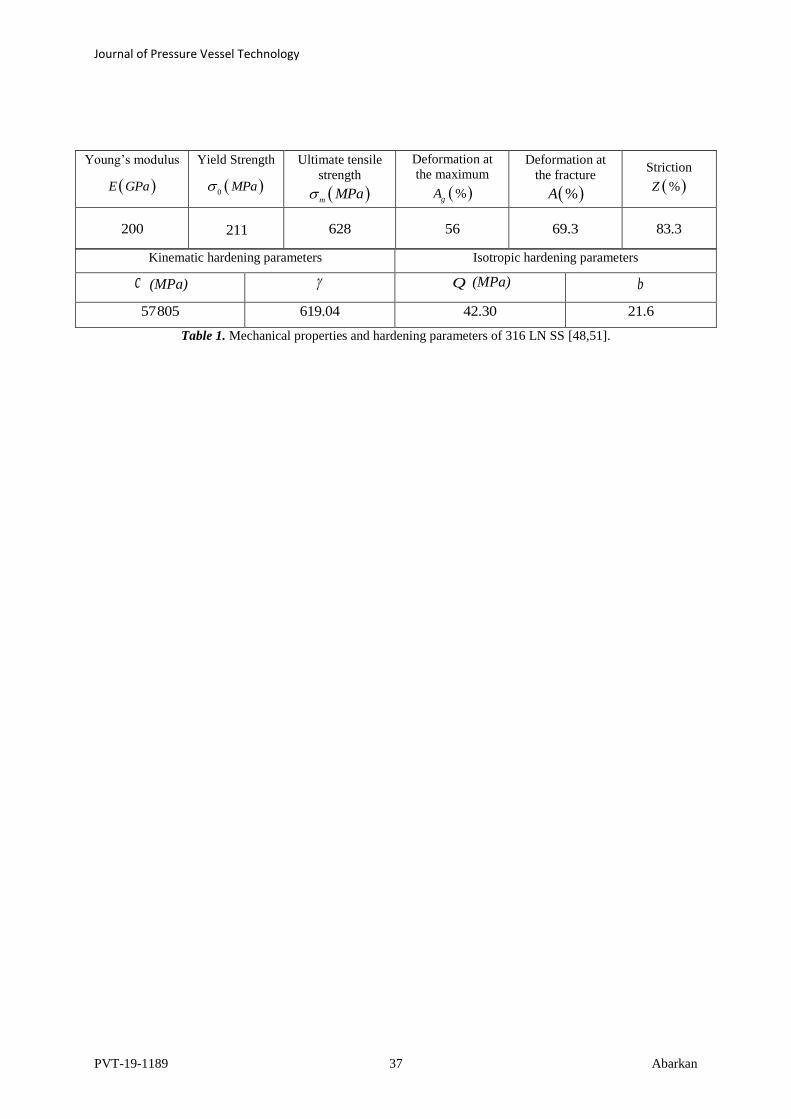
is described by the kinematic hardening model. The obtained hardening parameters from Roy et al.[48]
experimental hysteresis loops at ±0.5% strain amplitude are summarized in Table 1. Other mechanical properties
provided by other researchers [51] such as the ultimate tensile strength, the deformation at the maximum, the
deformation at the fracture and the striction, are also depicted in the same table.
4 Results and discussion
4.1 Cyclic stress-strain curve
The experimental and numerical first cycle hysteresis loops for ±0.4%, ±0.5% and±0.6% total strain amplitudes
are illustrated in Fig.3. It can be observed that the numerical stress-strain results are in good agreement with
experimental ones reported by Roy et al. [48]. Therefore, the proposed numerical model is reliable and accurate to
predict the cyclic behavior of 316 LN SS.
4.2 Numerical study of fatigue life
In order to prevent fatigue failure, numerous fatigue life approaches can be applied. This section presents numerical
fatigue life results for 316 LN SS using the strain life approach obtained by FE-safe and numerical fatigue life
results using the total strain energy density approach. The numerical results are compared with the experimental
results reported by Roy et al. [48] to ensure the suitability of these approaches in predicting fatigue life of 316 LN
SS.
4.2.1 Maximum shear strain and Brown-Miller multiaxial strain life criterions
To obtain numerically the fatigue life of 316 LN stainless steel specimens tested by Roy et al. [48] using the strain
life approach, two criterions will be employed in the FE-safe fatigue software, which are maximum shear strain
and Brown-Miller criterions. The cyclic stress-strain values for each strain amplitude level were imported from
ABAQUS FEA into the Fe-safe. Since fatigue cracks often nucleate on the surface, the nodal values of the
simulated model in Fe-safe have been chosen as they are on the surface. It is worthwhile to notice that using nodal
points is more suitable than the integration points (Gauss points) which are located at the center of the elements
[25]. To take into account the elastic-plastic behavior of the material, the elastic-plastic block was generated in Fe-
Safe; where both stress and strain were combined for each increment level. The static, and cyclic properties of 316
LN SS presented in Table 1 and 2 are imported to the material databases in Fe-safe.
Maximum shear strain criterion [25] states that fatigue crack nucleation often occurs on planes that subjected to
maximum shear strain amplitude. Therefore, the equation that correlates maximum shear strain amplitude to the
number of cycles is expressed as follows:

Journal of Pressure Vessel Technology
PVT-19-1189 6 Abarkan
Where max is the maximum shear strain range, 2
fN the number of reversals, b fatigue strength exponent,
f
fatigue strength coefficient, c fatigue ductility exponent,f fatigue ductility coefficient and E Young’s modulus.
Morrow [52] has introduced the mean stress correction into the elastic term of the strain-life equation, presuming
that the mean stress effect is negligible in the low cycle fatigue domain. However, strain life equation can be
modeled by the Morrow mean stress for its significant effect in the high cycle fatigue region, so that maximum
shear strain equation with Morrow mean stress correlation can be expressed as follows:
Where m
is the mean stress.
Brown and Miller [26,27] assumed that the maximum fatigue damage takes place on the plane, which is subjected
to the maximum cyclic shear strain, and that both the maximum shear strain amplitude and the normal strain
amplitude should be considered as damage parameters. Brown-Miller equation with Morrow mean stress effect is
therefore given by:
Where n is the strain range normal on the plane of the maximum shear strain amplitude.
In Fe-safe the Maximum shear strain and Brown-Miller both with Morrow mean-stress were separately selected
as algorithms for fatigue simulation.
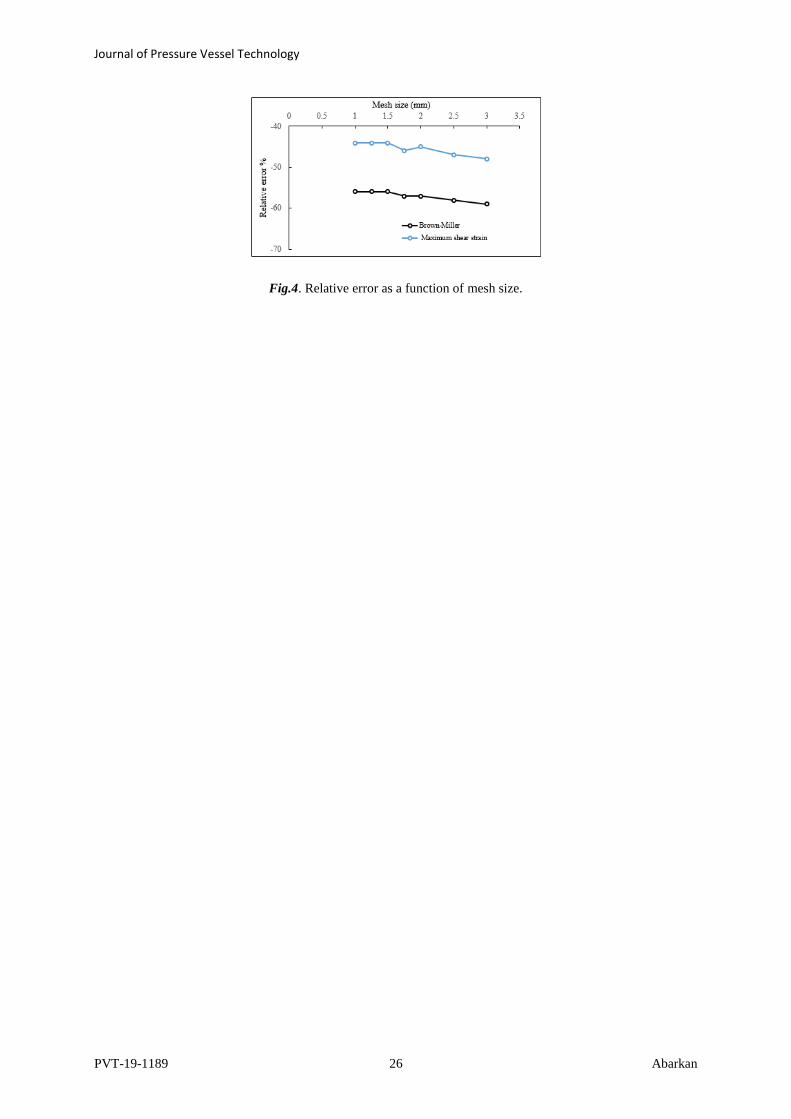
It has been found that the predicted fatigue lives are strongly dependent on the mesh size used in the numerical
model in ABAQUS FEA software, as authenticated in Fig. 4. Various mesh sizes were applied in ABAQUS and
the resulting fatigue lives in Fe-safe were observed until the convergence was reached. As depicted in Fig. 4, for
a specimen subjected to ±0.6% and for a fine-machined surface finish, the relative error between the predicted and
the experimental fatigue life attained its stable value at the mesh size 1.5mm.
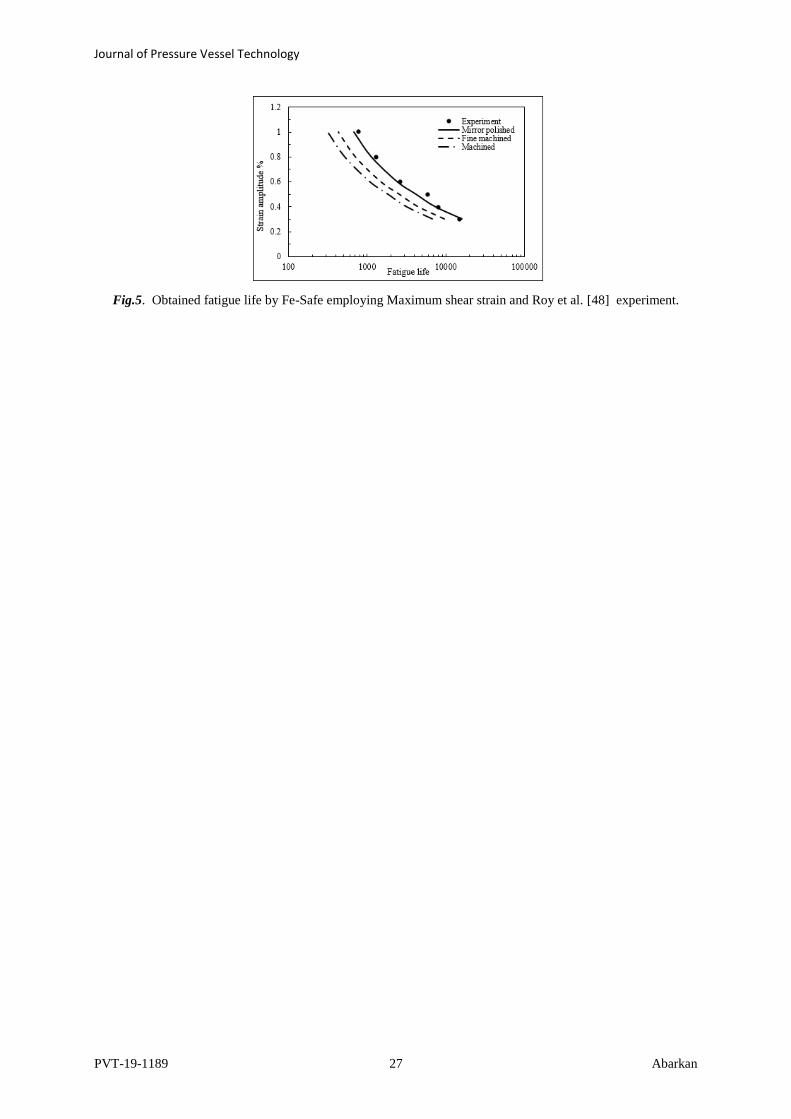
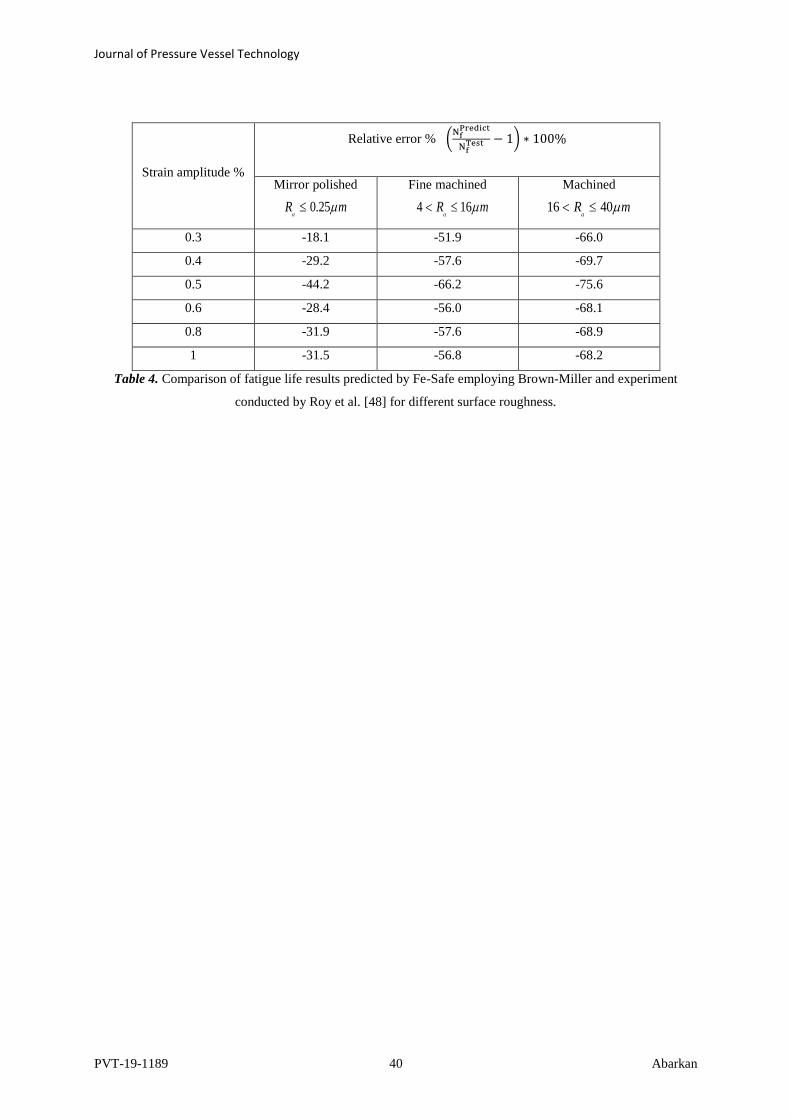
Comparison between fatigue life results obtained experimentally and by Fe-safe using maximum shear strain and
Brown-Miller criterions are shown in Table 3 and 4, respectively. Furthermore, the strain amplitude is plotted
against experimental and numerical fatigue lives for various surface roughness conditions as illustrated in Fig. 5
and Fig.6. Based on the data in these tables and figures, the following general observations are made:
- As observed from Fig. 5 and 6, both numerically and experimentally obtained fatigue lives increase as strain
amplitude decreases for all surface roughness conditions. Furthermore, fatigue lives reduce with the increase
in average surface roughness. This can be attributed to the fact that the rougher surfaces enhance fatigue crack
initiation. Non-smooth surfaces are considered as either small cracks or notches on the material surface [53].
max1.3 (2 ) 1.5 (2 )
2
f
f
b c
f fN N
E
1
max1.3 (2 ) 1.5 (2 )
2
f
f
b cm
f fN N
E
2
max
1.65 (2 ) 1.75 (2 )2 2
f
f
b cmn
f fN N
E
3

Journal of Pressure Vessel Technology
PVT-19-1189 7 Abarkan
As a result, small sized stress concentration takes place on this surface, which subsequently reduces the crack
initiation period.
- As observed from Table 3 and 4 that the discrepancies between the numerical and experimental results fatigue
life increase by increasing the average surface roughness. Since the surface polishing process was not
mentioned in Roy et al. [48], fine-machined or machined are the actual surface conditions in the original test.
For fine machined surface, the maximum shear strain criterion underestimates the fatigue life by 36% to 44%
when the applied strain amplitude varies from 0.3% to 1% while the Brown-Miller criterion underestimates
the fatigue life by 52% to 57% when the applied the strain amplitude varies from 0.3% to 1%. Therefore, the
Brown-Miller criterion provides more conservative fatigue life results than the Maximum shear strain
criterion for all type of surface roughness.
- Generally, both Maximum shear strain and Brown Miller criterions have resulted in underestimated fatigue
life, for all strain amplitude levels. As a result, these methods can be adopted to predict fatigue life for uniaxial
cyclic loading problems of 316 LN stainless steel.
.
4.2.2 Total strain energy density based fatigue life approaches
A fatigue failure criterion based on the total strain energy density has been introduced into the literature. The
advantage of this approach is that both crack initiation and propagation phases of fatigue life are incorporated into
one single expression. In this section, the total strain energy density based approach is used to evaluate fatigue life
of 316LN stainless steel.
An outstanding research study was undertaken with the aim of establishing an appropriate model that can allow
obtaining fatigue life based on the plastic work accumulated during a load cycle. Ellyin et al. [38,45-47] conducted
a practical survey that studies the hysteresis energy absorption and its correlation with fatigue life for both Masing
and non-Masing materials. The proposed equation form is given as:
Where k and are material constants.
Particular attention was paid to the plastic strain energy. Actually, as the value of the strain range decreases, the
plastic strain component tends to zero; 0p
, and consequently the plastic strain energy 0pW . In
such a case, the material exhibits elastic behavior, even, at the grain level, slight plastic deformation can be
revealed. As a result, another failure model has been determined , which takes into consideration both the plastic
strain energy per cycle pW and the elastic strain energy eW ; which is related to crack growth during cyclic
loads. The expression of the total strain energy density is given as:
p
fW k N
4
t p e
W W W 5

Journal of Pressure Vessel Technology
PVT-19-1189 8 Abarkan
The total strain energy density tW represents the sum of the absorbed plastic energy density per cycle, which
is the area inside the saturated loops, and recovered elastic strain energy per cycle [47]. In the present analysis, the
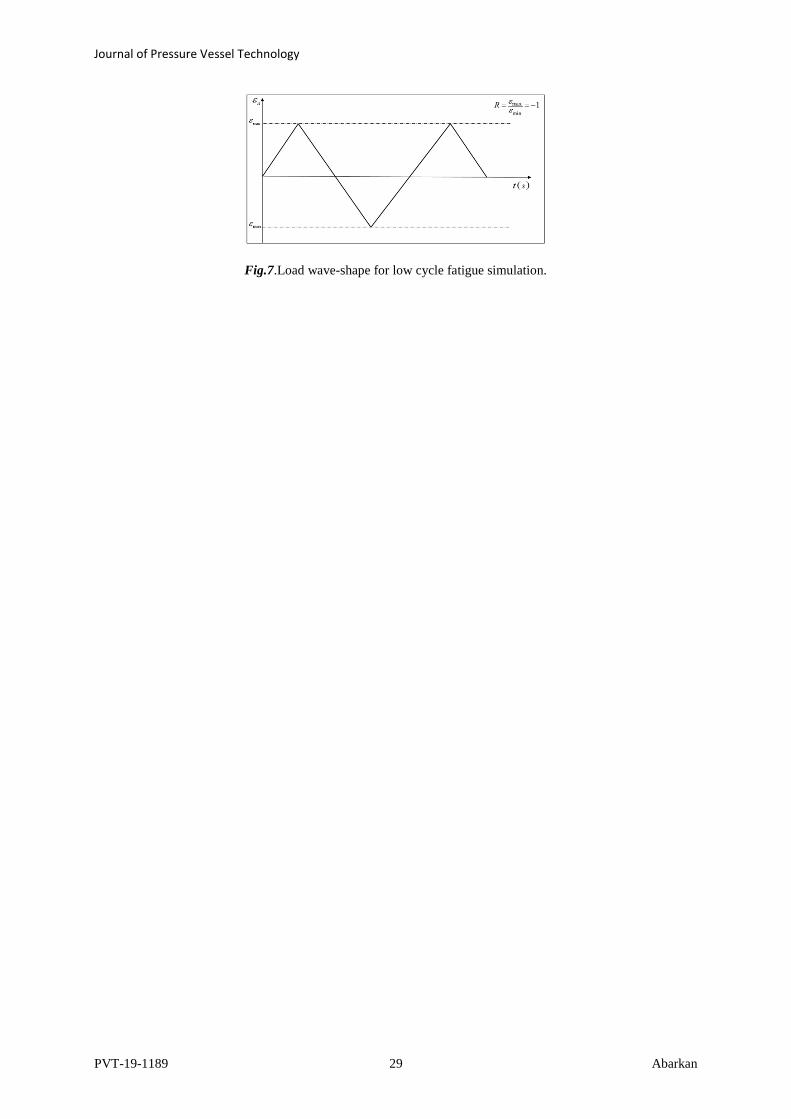
hysteresis loops for each applied strain amplitude are numerically obtained using ABAQUS by applying total axial
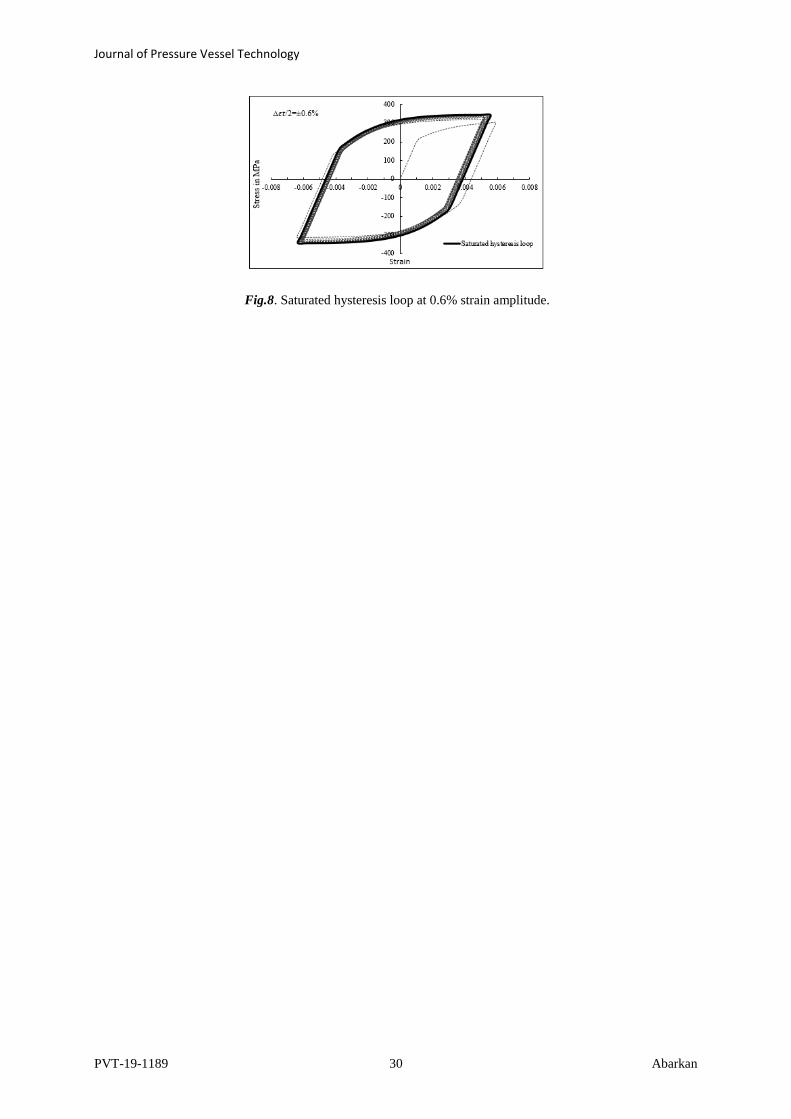
strain amplitude in symmetrical triangular strain–time waveform, as seen in Fig.7. Large number of reversed waves
are applied in a tubular form and the hysteresis loops are observed until a saturated hysterias loop is reached. Fig.8
presents the hysteresis loops and the saturated hysteresis loop obtained numerically for the 316 LN stainless steel
when the applied strain amplitude is 0.6%.
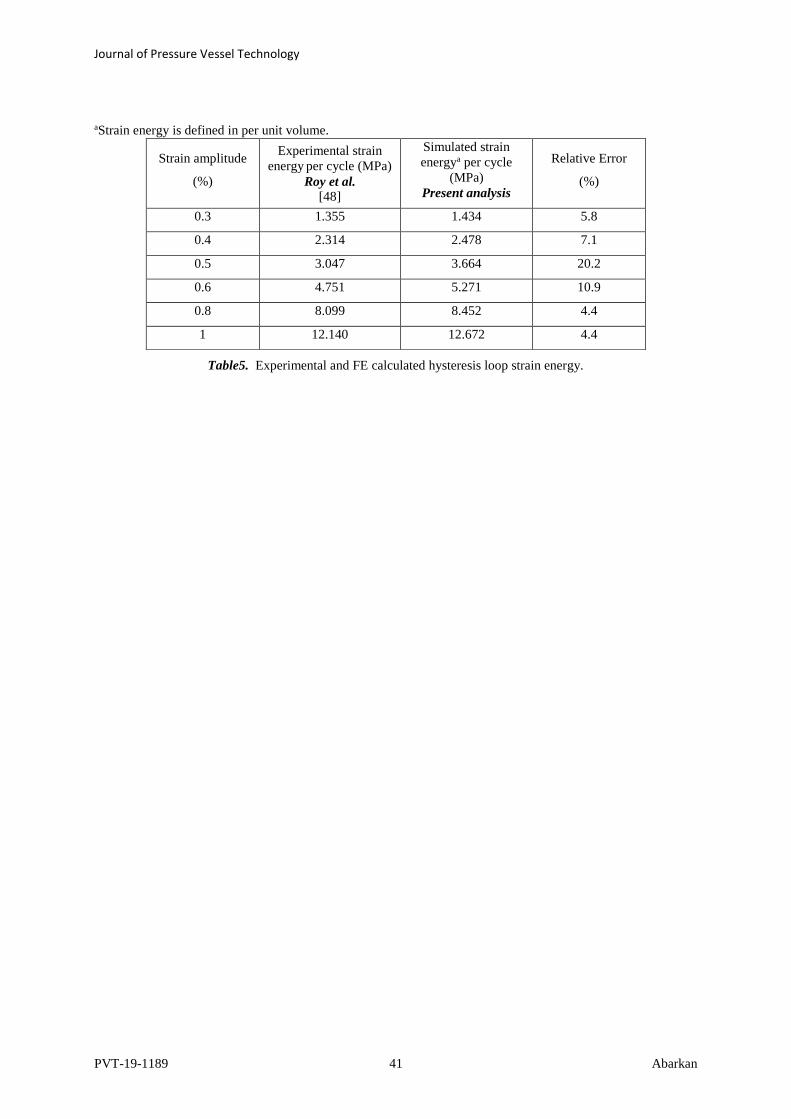
Experimentally as well as the numerically obtained strain energy per unit material volume are summarized in Table
5. It can be noted that the numerical strain energy per cycle are in good agreement with the experimental strain
energy per cycle. This enables to use the proposed numerical model in order to estimate the total strain energy per
cycle tW .
Roy et al. [48] calculated the fatigue lives at each strain amplitude by dividing the experimental total energy T
W
into the numerically obtained plastic strain energy density PW , i.e. using Eq. (6) and Eq. (15) for Masing and
non-Masing behavior respectively [38]. The present study has adopted a different approach to estimate the fatigue
lives for both Masing and non-Masing behavior. The advantage of the present approach is that the numerical
fatigue lives can be obtained without the requirement of the input parameterT
W . The approach is presented in
more detail in the following sections.
4.2.2.1 Masing analysis
Masing behavior’s assumption can be revealed by doing a translation of the experimental saturated loops for
different strain amplitudes in a way that they are superimposed and the lower (compressive) tips of the saturated
loops all coincide at the origin (0, 0) of the stress-strain axis, as seen in Fig. 9. For material showing Masing
phenomenon, all the ascending (tension) portion of the stable loops intersect and form a continuous curve. It should
be mentioned that the saturated loop refers to a phase in which the shape does not vary after a continuous hardening
and/or softening process exhibited by the material. In the case where the stable hysteresis loop is not reached due
to uninterrupted hardening and/or softening behavior, the hysteresis loop at the half-life is recommended for use
in this case. According to Roy et al. [48] experiment, the 316LN austenitic stainless steel exhibits Masing behavior
at low strain amplitudes (±0.3% to ±0.5%) and non-Masing behavior at high strain amplitudes (±0.6% to ±1.0%).
Similarly, Goyal et al. [54] found out that 316 LN SS follows Masing behavior at low strain amplitudes and non-
Masing behavior at high strain amplitudes under room temperature condition.
For Masing materials, the plastic strain energy density [47] can be defined by:
Where represents the stress range at a particular strain amplitude level and 'n is the cyclic hardening
parameter.
The elastic strain energy density [47] is given by:
1
1p
p nW
n
6
Journal of Pressure Vessel Technology
PVT-19-1189 9 Abarkan
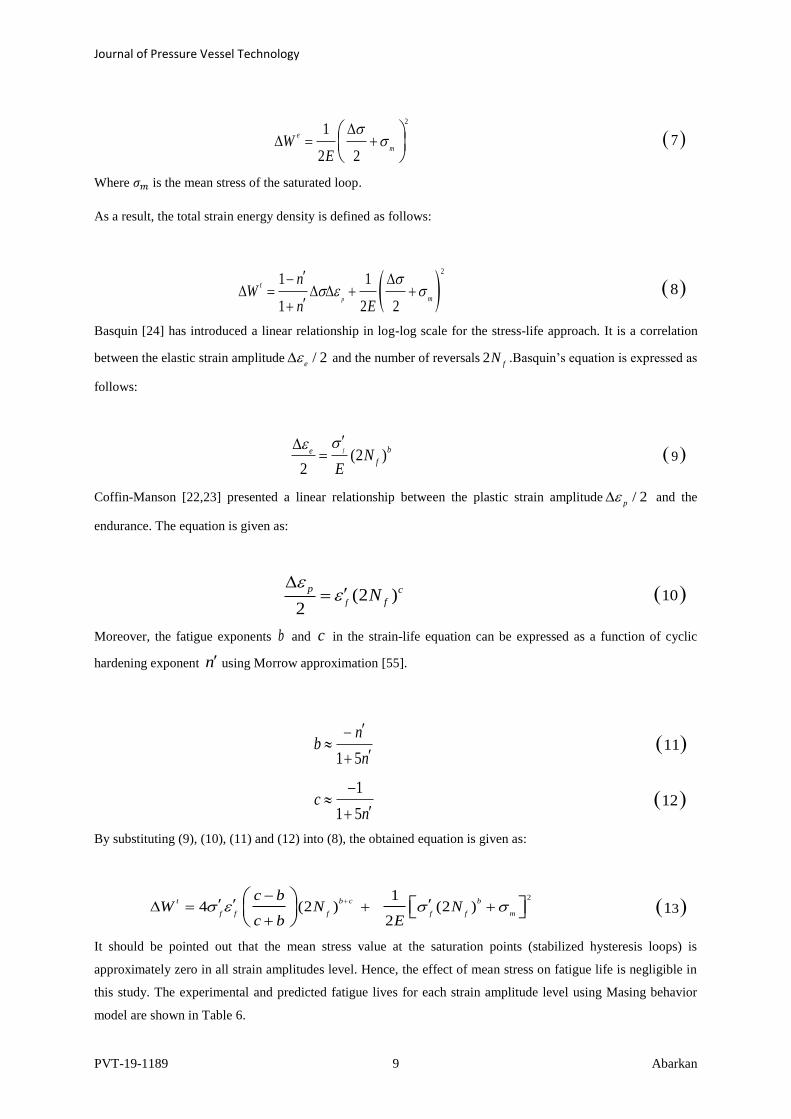
Where 𝜎𝑚 is the mean stress of the saturated loop.
As a result, the total strain energy density is defined as follows:
Basquin [24] has introduced a linear relationship in log-log scale for the stress-life approach. It is a correlation
between the elastic strain amplitude / 2e and the number of reversals 2
fN .Basquin’s equation is expressed as
follows:
Coffin-Manson [22,23] presented a linear relationship between the plastic strain amplitude / 2p
and the
endurance. The equation is given as:
Moreover, the fatigue exponents b and c in the strain-life equation can be expressed as a function of cyclic
hardening exponent n using Morrow approximation [55].
By substituting (9), (10), (11) and (12) into (8), the obtained equation is given as:
It should be pointed out that the mean stress value at the saturation points (stabilized hysteresis loops) is
approximately zero in all strain amplitudes level. Hence, the effect of mean stress on fatigue life is negligible in
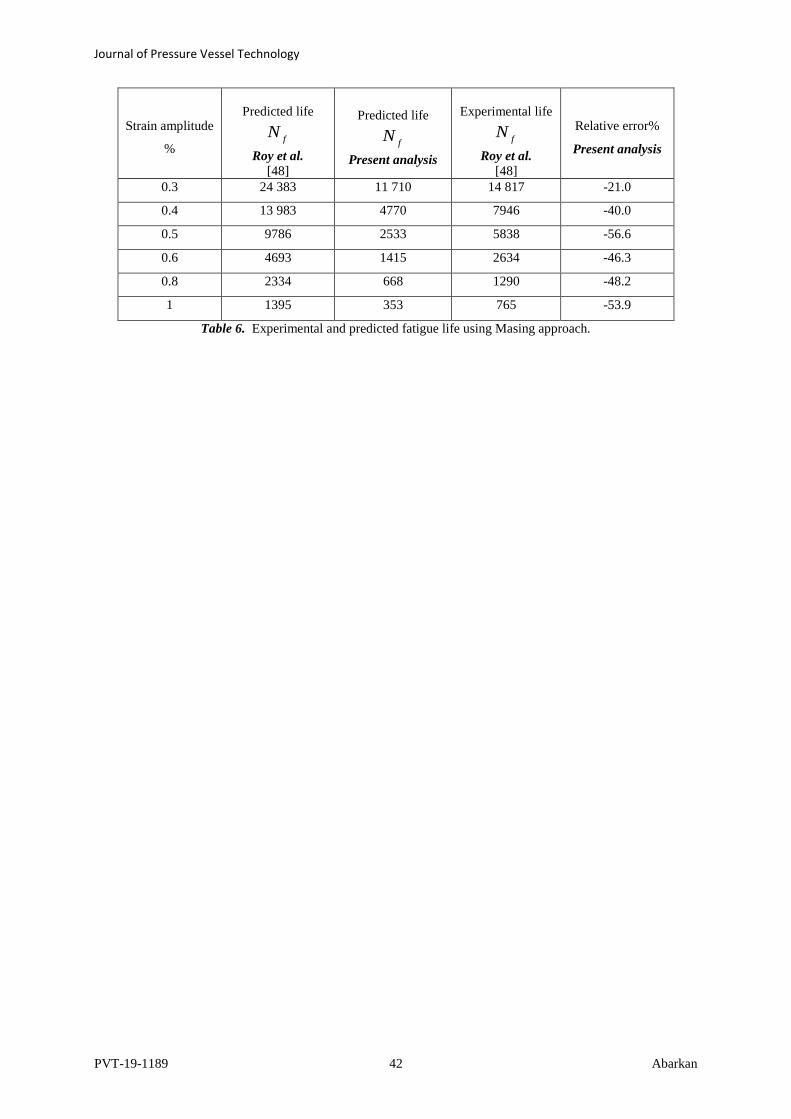
this study. The experimental and predicted fatigue lives for each strain amplitude level using Masing behavior
model are shown in Table 6.
2
1
2 2
e
mW
E
7
2
1 1
1 2 2p
t
m
nW
n E
8
(2 )2
f be
fN
E
9
(2 )2
f
p c
fN
10
1 5
nb
n
11
1
1 5c
n
12
214 (2 ) (2 )
2
t b c b
f f f f f m
c bW N N
c b E
31
Journal of Pressure Vessel Technology
PVT-19-1189 10 Abarkan
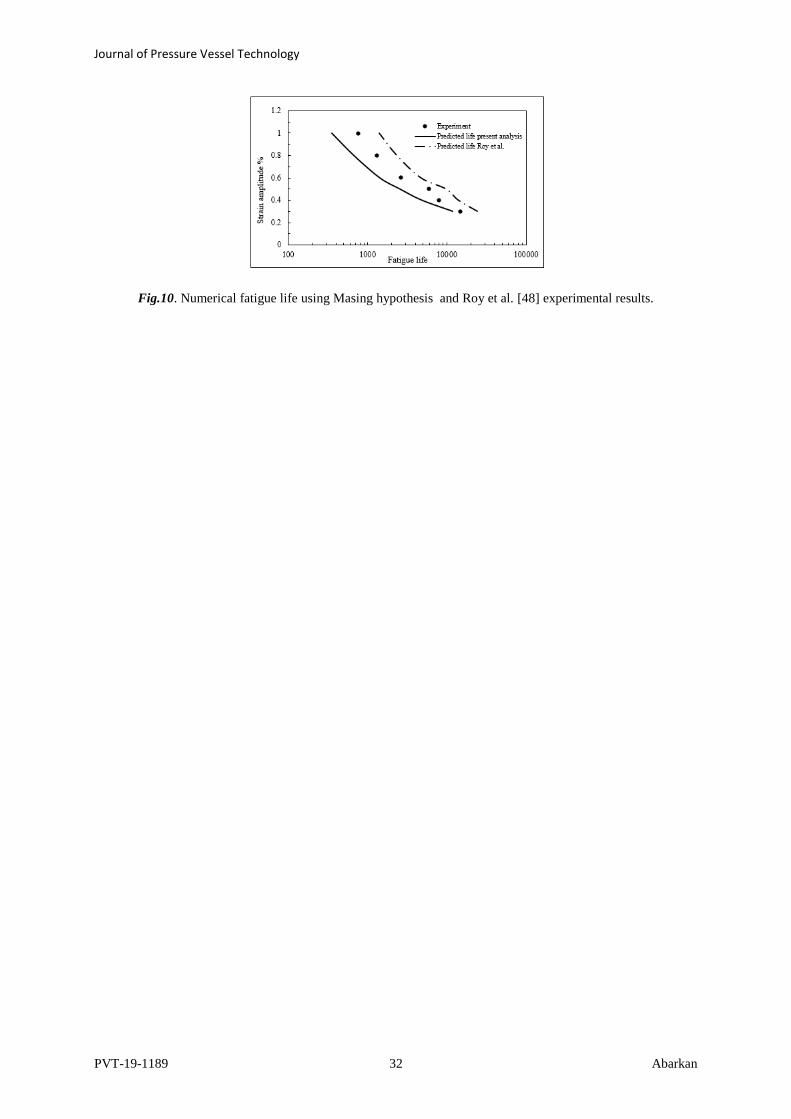
The results show that the proposed Masing model (i.e. Eq. (13)) underestimates fatigue lives for all strain amplitude
level. The relative error is more significant in high strain amplitudes than in low strain amplitudes. The
disagreement between the calculated and the tested fatigue lives can be attributed to the lower value of the fatigue
ductility exponent c due to the higher value of cyclic hardening exponent n obtained from cyclic stress-strain
curve. According to Roy et al. [48] the high value of n is a result of non-Masing behavior shown by the material
at high strain amplitudes.
The use of the cyclic hardening exponent by Roy et al. [48] in Masing equation resulted in unsafe fatigue life
predictions. However, the use of fatigue ductility exponent led to a conservative fatigue life estimation. The
predicted and the experimental results are represented in a strain-life diagram as shown in Fig.10.
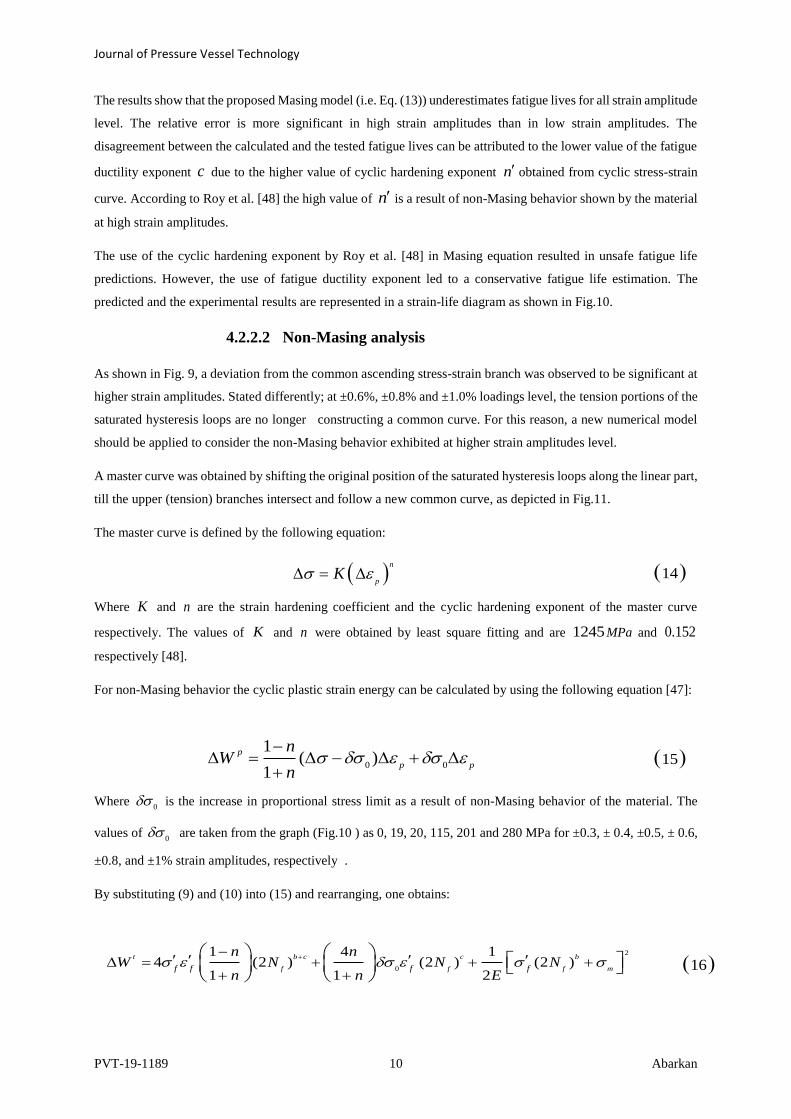
4.2.2.2 Non-Masing analysis
As shown in Fig. 9, a deviation from the common ascending stress-strain branch was observed to be significant at
higher strain amplitudes. Stated differently; at ±0.6%, ±0.8% and ±1.0% loadings level, the tension portions of the
saturated hysteresis loops are no longer constructing a common curve. For this reason, a new numerical model
should be applied to consider the non-Masing behavior exhibited at higher strain amplitudes level.
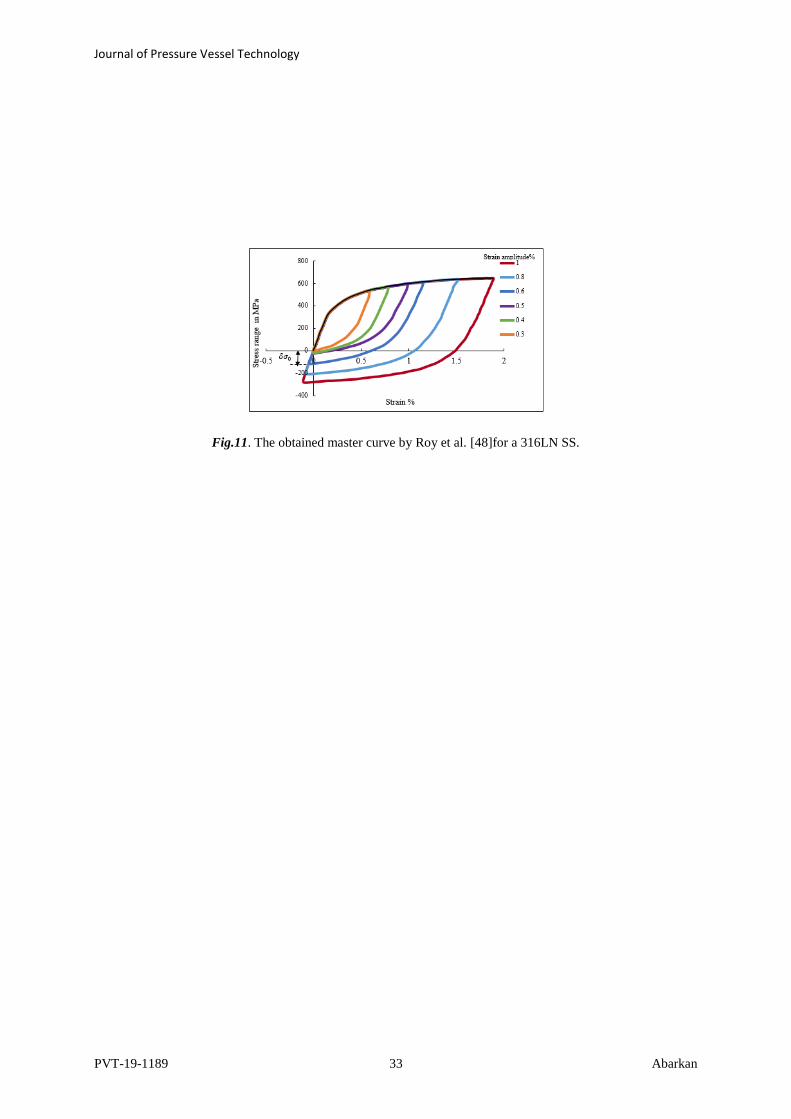
A master curve was obtained by shifting the original position of the saturated hysteresis loops along the linear part,
till the upper (tension) branches intersect and follow a new common curve, as depicted in Fig.11.
The master curve is defined by the following equation:
Where K and n are the strain hardening coefficient and the cyclic hardening exponent of the master curve
respectively. The values of K and n were obtained by least square fitting and are 1245MPa and 0.152
respectively [48].
For non-Masing behavior the cyclic plastic strain energy can be calculated by using the following equation [47]:
Where 0
is the increase in proportional stress limit as a result of non-Masing behavior of the material. The
values of 0
are taken from the graph (Fig.10 ) as 0, 19, 20, 115, 201 and 280 MPa for ±0.3, ± 0.4, ±0.5, ± 0.6,
±0.8, and ±1% strain amplitudes, respectively .
By substituting (9) and (10) into (15) and rearranging, one obtains:
n
pK 14
0 0
1( )
1
p
p p
nW
n
15
2
0
1 4 14 (2 ) (2 ) (2 )
1 1 2
t b c c b
f f f mf f f f
n nW N N N
n n E
16

Journal of Pressure Vessel Technology
PVT-19-1189 11 Abarkan
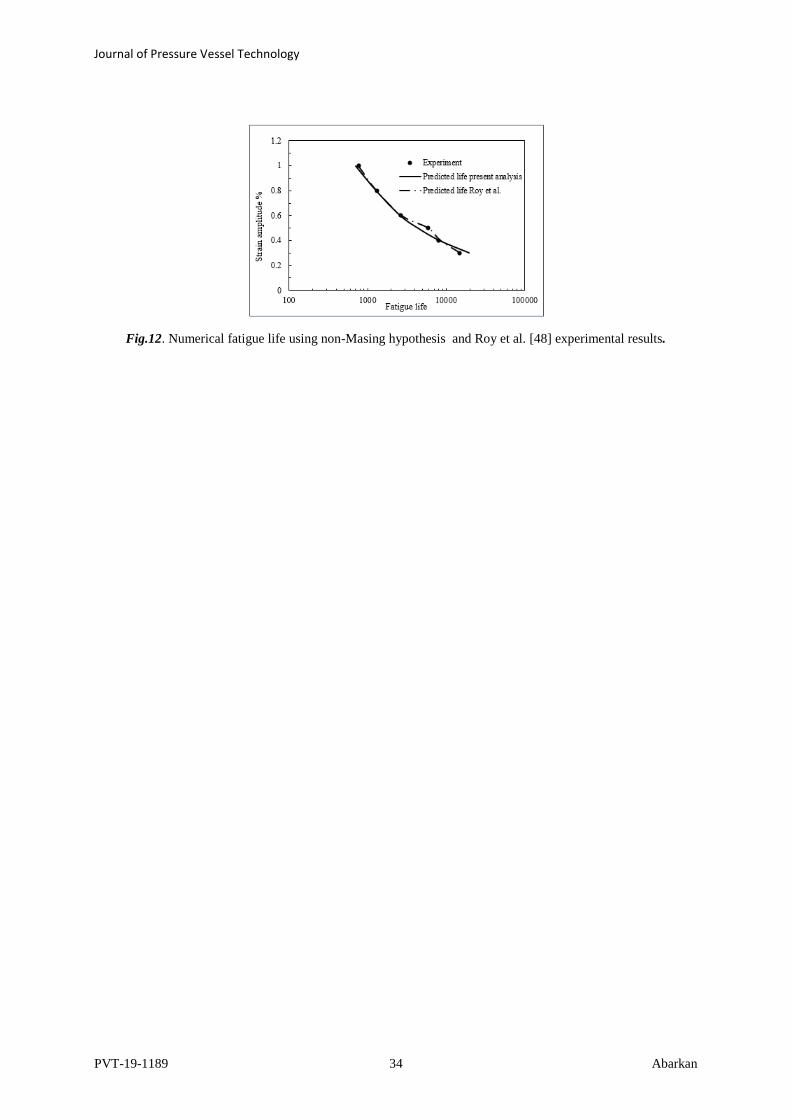
The fatigue life obtained by Eq. (16) as well as the experimental fatigue life for each strain amplitude are listed in
Table7. A comparative curve was made for the experimental and numerical fatigue lives as shown in Fig.12.
The comparison between the experimental and present numerical results shows a good agreement; conspicuously
at higher strain amplitudes, which indicates that, the present non-Masing behavior model provides a good
correlation with the experiment. The improvement in the prediction of fatigue life can be ascribed to the
incorporation of both, the cyclic hardening exponent n of the master curve and the proportional stress 0
into
the non-Masing behavior model (Eq. (16)). Good fatigue life results were also obtained by Roy et al. [48], due to
the use of these two parameters.
4.3 Analytical study of fatigue life
For many decades, analytical empirical low cycle fatigue approaches are extensively utilized by designers and
offer simple ways to study complex fatigue issues. However, some researchers [41,56] found out that certain
analytical methods do not always provide an accurate fatigue life solution and can lead to either underestimated or
overestimated of fatigue endurance. Therefore, the aim of this section is to investigate the applicability of Langer
analytical model [39] and its modified versions [40], [42] and [43] to predict the low cycle fatigue life of 316LN
stainless steel by comparing with the fatigue lives obtained experimentally by Roy et al. [48], Zhou et al. [57] and
Yuan et al. [58]. Subsequently, optimized values of the experimental parameters are given at the end of this section
to correct the inaccuracies of these models.
4.3.1 Langer model
For fully reversed low cycle fatigue loading, under uniaxial stress condition and at temperatures below the creep
range, the proposed Coffin [22] equation is expressed as follows.
Where p is the plastic strain range, f
N is the number of cycles, and C are material constants.
Coffin [22] found out that the value of is approximately equal to 1/ 2 for all material type, and the value of
constant C is the half of the fracture ductilityf , which is defined as:
Where RA is the percentage of Reduction in Area. Therefore C can be expressed as:
p
fN C 17
100ln
100f
RA
18
1 100ln
2 100C
RA
19
Journal of Pressure Vessel Technology
PVT-19-1189 12 Abarkan
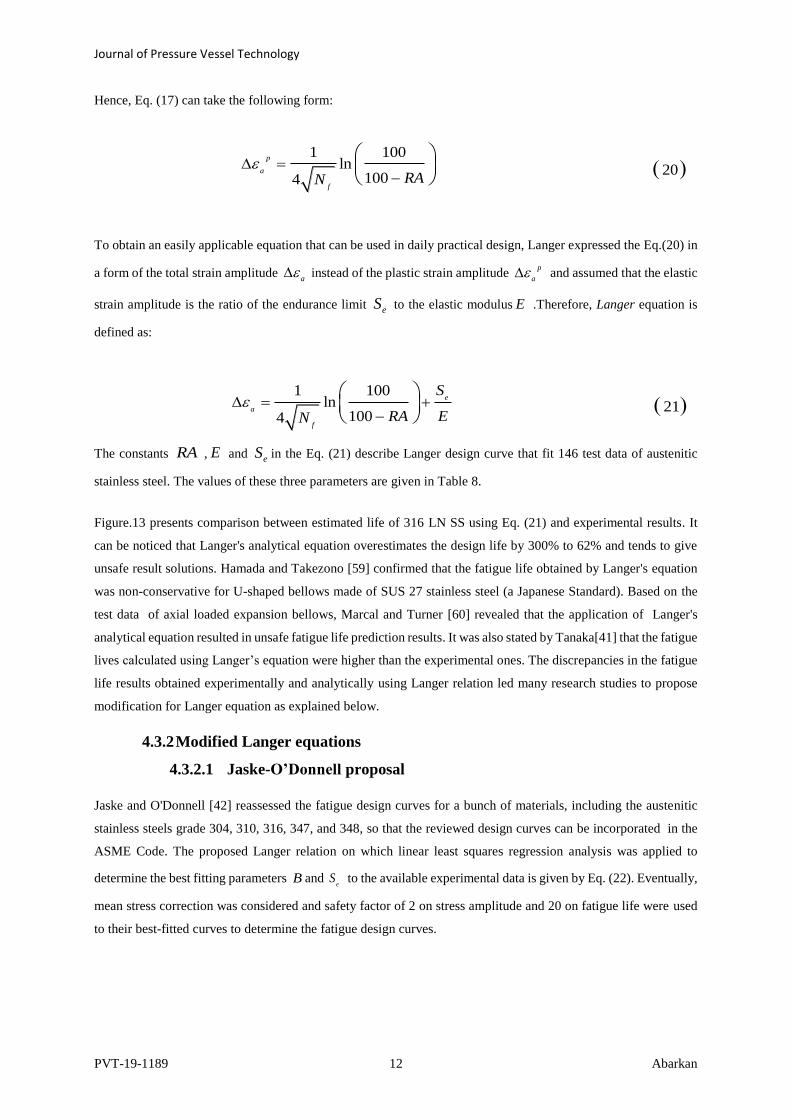
Hence, Eq. (17) can take the following form:
To obtain an easily applicable equation that can be used in daily practical design, Langer expressed the Eq.(20) in
a form of the total strain amplitude a instead of the plastic strain amplitude
p
a and assumed that the elastic
strain amplitude is the ratio of the endurance limit eS to the elastic modulus E .Therefore, Langer equation is
defined as:
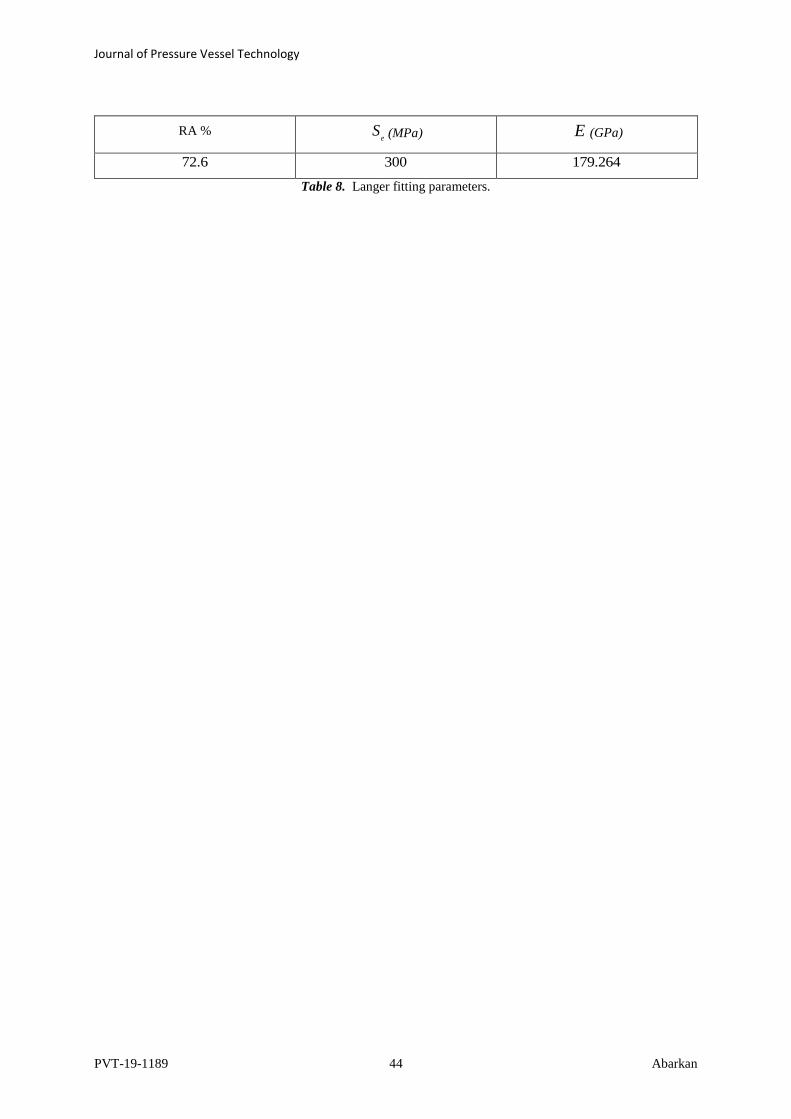
The constants RA , E and eS in the Eq. (21) describe Langer design curve that fit 146 test data of austenitic
stainless steel. The values of these three parameters are given in Table 8.
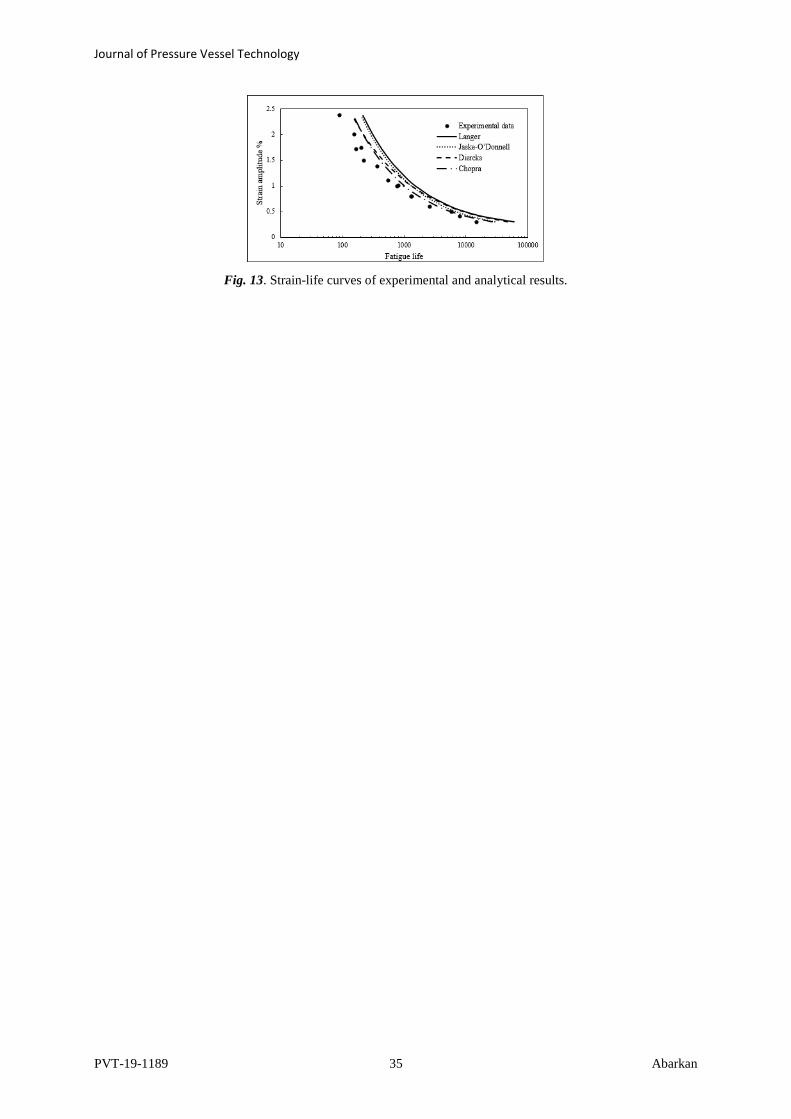
Figure.13 presents comparison between estimated life of 316 LN SS using Eq. (21) and experimental results. It
can be noticed that Langer's analytical equation overestimates the design life by 300% to 62% and tends to give
unsafe result solutions. Hamada and Takezono [59] confirmed that the fatigue life obtained by Langer's equation
was non-conservative for U-shaped bellows made of SUS 27 stainless steel (a Japanese Standard). Based on the
test data of axial loaded expansion bellows, Marcal and Turner [60] revealed that the application of Langer's
analytical equation resulted in unsafe fatigue life prediction results. It was also stated by Tanaka[41] that the fatigue
lives calculated using Langer’s equation were higher than the experimental ones. The discrepancies in the fatigue
life results obtained experimentally and analytically using Langer relation led many research studies to propose
modification for Langer equation as explained below.
4.3.2 Modified Langer equations
4.3.2.1 Jaske-O’Donnell proposal
Jaske and O'Donnell [42] reassessed the fatigue design curves for a bunch of materials, including the austenitic
stainless steels grade 304, 310, 316, 347, and 348, so that the reviewed design curves can be incorporated in the
ASME Code. The proposed Langer relation on which linear least squares regression analysis was applied to
determine the best fitting parameters B and e
S to the available experimental data is given by Eq. (22). Eventually,
mean stress correction was considered and safety factor of 2 on stress amplitude and 20 on fatigue life were used
to their best-fitted curves to determine the fatigue design curves.
1 100ln
1004
p
a
fRAN
20
1 100ln
1004
e
a
f
S
RA EN
21

Journal of Pressure Vessel Technology
PVT-19-1189 13 Abarkan
Where f
N is the number of cycles,a
S represents a fictitious value of stress amplitude, and is defined as:
In terms of total strain amplitude, the equation (22) takes the following form by dividing by E:
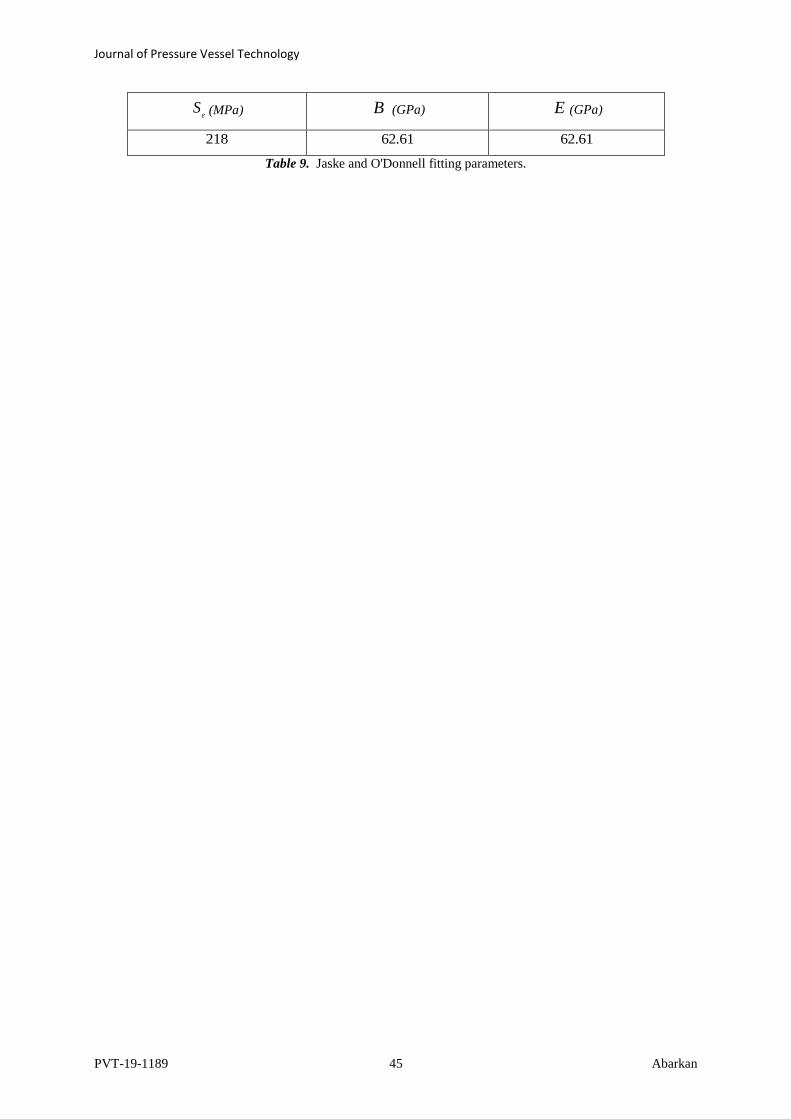
The values of B and e
S at temperatures between 21°C and 427°C, and for a root-mean-square error of 0.0929
are listed in Table 9.
The fatigue lives obtained using Langer relation with Jaske-O'Donnell [42] proposed parameters (i.e Eq. (24)) with
parameters in the Table 9 ) with their counterpart experimental ones are illustrated in Fig.13. Although the
estimated fatigue lives are in better agreement with the experimental results than those obtained by the
conventional Langer equation (i.e. Eq. (21)), Jaske and O'Donnell [42] proposal still overestimates the fatigue life
for 316LN stainless steel by 146% to 17%, particularly for high strain amplitude.
4.3.2.2 Diercks proposal
In order to remedy the problem of the imprecision in Langer fatigue design curve, Diercks [40] introduced a
different fitting technique from that suggested by Jaske and O’Donnell [42] for austenitic stainless steel, alloys
600, 800 and 718. Two significant modifications have been suggested. In the first instance, the value 1/ 2 of the
exponent on f
N in Langer equation (Eq.(21)) was observed to be not accurate for all alloys. Therefore, the fixed
exponent provides an overestimated fitting curve in the low cycle fatigue region and an excessively underestimated
curve in the intermediate cycle region. To rectify this issue, Diercks [40] has substituted the fixed exponent 1/ 2
in the Langer equation by a variable one, denoted b . Which, resulted in the following expression:
Where aS is a fictitious stress amplitude,f
N is the fatigue life, B and eS are the fitting parameters.
From the perspective of the strain amplitude, the Modified Langer equation is given as follows:
1
2
a f eS BN S
22
a aS E 23
0.5 e
a f
SBN
E E
24
b
a f eS BN S 25
b e
a f
SBN
E E
26

Journal of Pressure Vessel Technology
PVT-19-1189 14 Abarkan
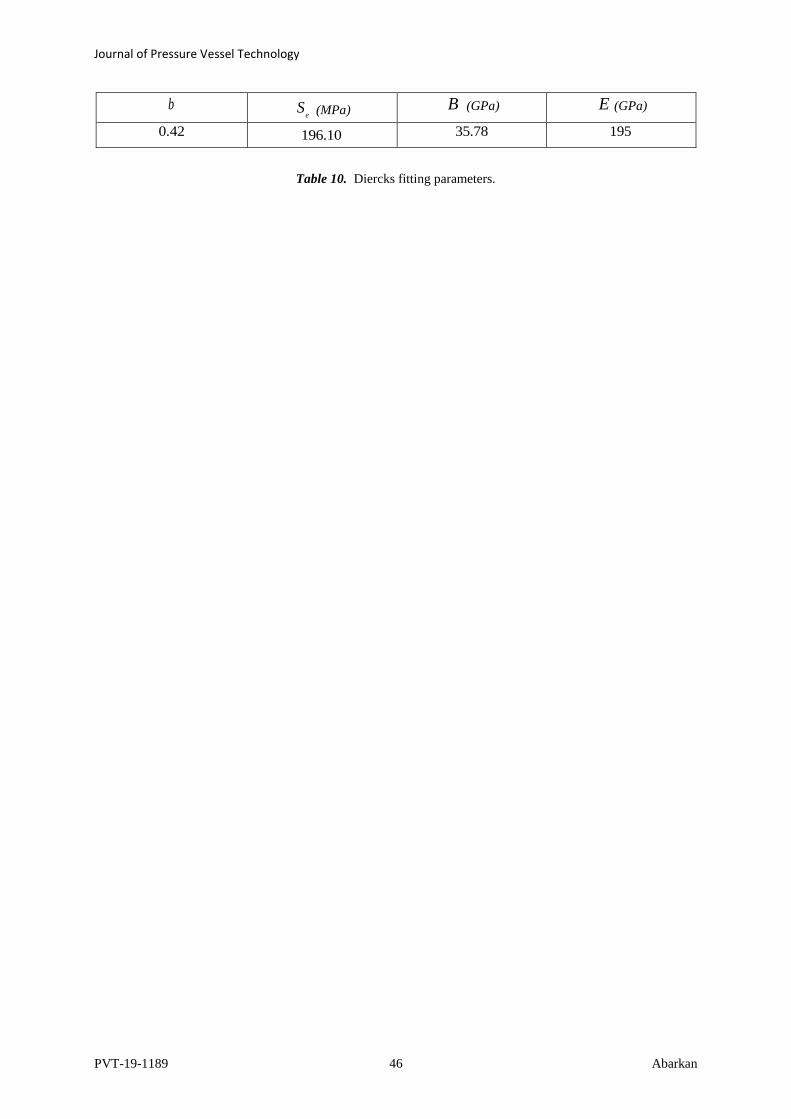
Secondly, the optimum values of B , b and e
S have been procured by minimizing the sum of the squares of the
errors in term of a
logS instead of a
S . In this regard, to identify the optimum values of B , b , and e
S in the Eq
(26), the nonlinear regression analysis was carried out. Hence, for a root-mean-square error of 0.0808 , the value
of the obtained fitting parameters for austenitic stainless steel are given in Table 10.
The estimated fatigue lives using modified Diercks [40] parameters and their counterpart experimental ones are
illustrated in Fig.13. The obtained design lives are in better agreement with the experimental results than those
obtained by the conventional Langer model, however, the proposed parameters by Diercks [40] still overestimate
the fatigue life for 316 LN SS by 220% to 38%, particularly for high strain amplitude..
4.3.2.3 Chopra proposal
The lack of discussion about the effects of light water reactor (LWR) coolant environments on fatigue life in the
ASME Boiler and Pressure Vessel Code has drawn Chopra’s attention [43]. As an initiative, he reexamined the
available design curves for austenitic stainless steels (316 SS, 304 SS, and 316NG) in both air and LWR coolant
environments.
Chopra [43] developed new fatigue design curves for nuclear facilities based on 500 available test data of austenitic
stainless steels with deferent shape; cylindrical gauge, hourglass, and rectangular cross-section specimens, under
different loading mode; fully reversed tension-compression and bending loads, and at different temperature
condition, among that 60% of test data are at room temperature.
The designated Modified Langer equation, which relates cyclic life N to the total strain amplitude, a is expressed
as:
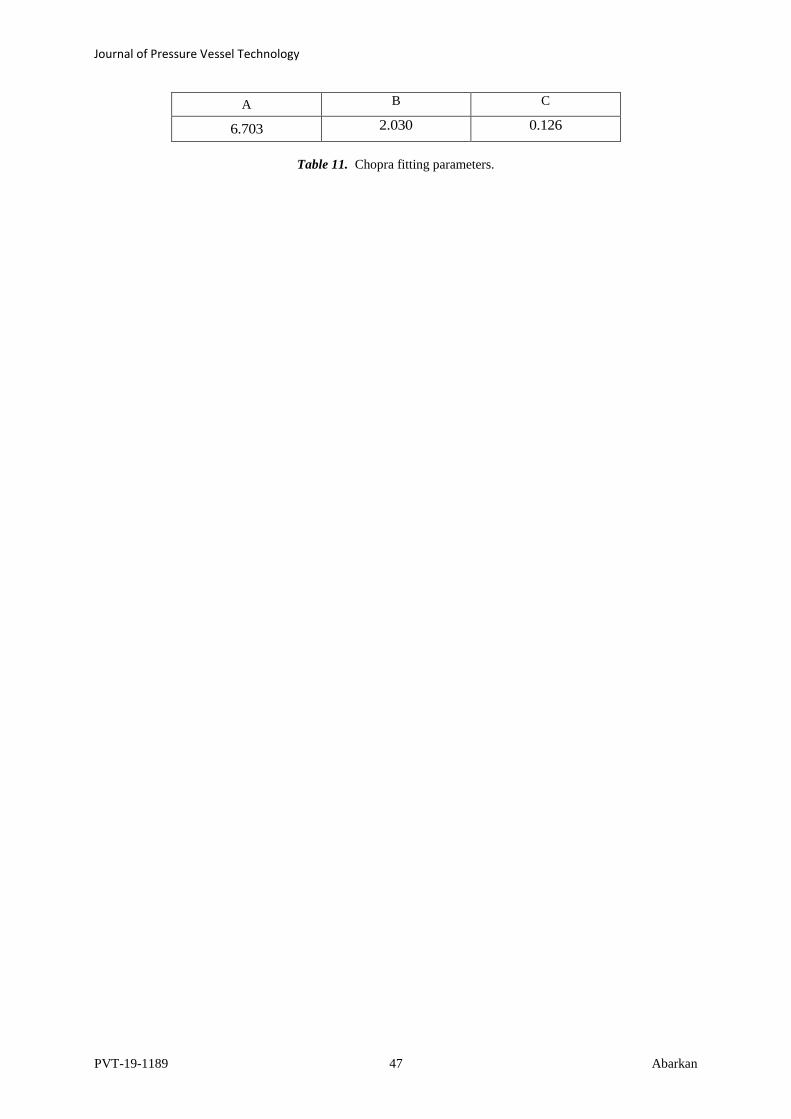
In air condition and temperature between ambient temperature and 400°C, the coefficients obtained by least square
analysis are given in Table 11.
The provided statistical model, which is recommended for fatigue lives below, 610 is resumed to the following
expression:
In his study, fatigue life N represents the number of cycles corresponding to 25% reduction in tensile stress
amplitude. The following equation was considered to obtain the fatigue lives to failure [43]:
ln(N) = A ln ( )a
B C 27
ln(N) = 6.703 2.030 ln ( 0.126)a 28
/ (0.947 + 0.00212 X)X
N N 29
Journal of Pressure Vessel Technology
PVT-19-1189 15 Abarkan
Where X symbolizes the failure criteria; 25, 50, or 100 percent decrease in tensile stress value.
The obtained failure lives using Chopra [43] proposal together with their counterpart experimental ones are
presented in Fig.13. The present results show better agreement with the experiment than Jack-O’Donnell [42],
Diercks [40] and Langer [39] proposals, as authenticated in Fig.13. However, Chopra [43] proposal overestimate
the fatigue live by 86.8% for 1.493% applied strain amplitude to 21.5% for 1.008% applied strain amplitude.
Hence, it can be confirmed that, for an austenitic stainless steel grade 316LN SS, the design curve obtained from
Chopra [43] proposed parameters is the best adjusted to the experimental fatigue curve among other suggested
parameters discussed above.
4.3.2.4 New proposal fitting parameters
As discussed earlier, all the above-suggested proposals provide unsafe results solutions for an austenitic stainless
steel grade 316LN at room temperature condition. Therefore, the present authors have established a new model to
address the issue of the discrepancies between the experimental and the analytical results.
To obtain the best-fitted curve to the given test data [48,56,57], the non-linear least square regression analysis was
carried. Eq. (26) can be rewritten as follows:
Where a represents the total strain amplitude percentage. 'A , 'B and k are the new fitting parameters.
For an experimental data point (ia ,
ifN ), the sum of the squared error SSE between the actual and the predicted
total strain values is given as:
Where n represents the number of the data points, and if
N is the predicted fatigue life, using Eq. (30). The fitness
function for the given problem is defined as:
' 'k kea f f
SBN A N B
E E 30
' /A B E 31
' /e
B S E 32
2
1
( ' ')i i
k
a f
n
i
A N BSSE
33
Journal of Pressure Vessel Technology
PVT-19-1189 16 Abarkan
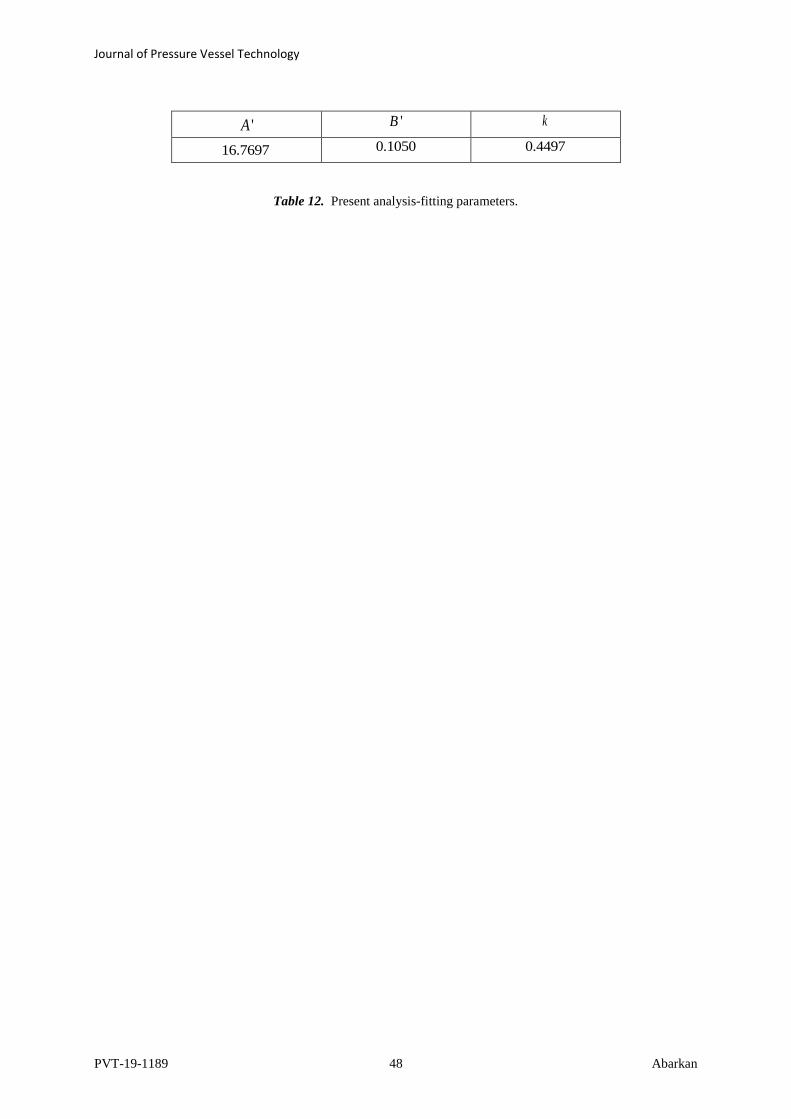
The obtained fitting parameters with a root mean square error of 0.0773 are listed in Table 12.
The best-fitted curve with a coefficient of determination of 98% ( 98%R squared ) is illustrated in Fig.14.
It can be concluded that the suggested model (i.e. Eq. (30)) along with the optimized values given in Table 12 is
able to estimate fatigue life with a minimum tolerable error, compared to all the above-cited analytical models, for
a 316LN SS under room temperature condition. The relative error between the experimental fatigue lives and the
ones obtained from the suggested model is in the range of -28% and 35%, which indicates that the present model
provides good result solutions.
Note that the size and the surface finish of the tested specimens [48,56,57] are different. To include the effects of
both the size and the surface finish on fatigue life, the authors recommend the use of a safety factor in a range of
1.3-1.35 on the cyclic life. The proposed factor is highly sufficient to cover the above-mentioned specimen features
as depicted in Fig.14.
5 Conclusion
Fatigue lives of 316LN SS at different strain amplitudes were estimated using different low cycle fatigue
numerical methods, specifically; Maximum shear strain as well as Brown-Miller multiaxial strain-life criteria.
Total strain energy density approach was applied in both Masing and non-Masing analysis. Various analytical
methods were used in this study, and the design curves were reexamined for this type of material. The
following conclusions are made:
- The numerically obtained first cycle hysteresis loops for different strain amplitudes using finite element
analysis software ABAQUS are in good agreement with the experimental ones.
- The obtained fatigue lives at different strain amplitudes using Fe-safe fatigue software revealed that,
although the fatigue lives obtained from the Maximum shear strain criterion are in better agreement with
experimental results than those predicted using Brown-Miller criterion, both criterions significantly
underestimate the fatigue life.
- The saturated hysteresis loops for each strain amplitude were numerically obtained using ABAQUS, and
were employed to estimate fatigue lives in Masing and non-Masing analysis. It was found that fatigue lives
of 316 LN SS obtained from non-Masing model were more in-line with experimental lives than those resulted
from Masing model for both high and low strain amplitudes.
- The fatigue design curves obtained from Langer equation and its modified versions (i.e. Jaske-O’Donnell,
Diercks, and Chopra proposed parameters) overestimate the fatigue lives obtained experimentally.
Subsequently, updated material parameters in the Langer equation are proposed that results in a best-fitted
design curve for a 316LN SS under room temperature condition.
2
1
( ' ')
', ', mini i
k
a f
n
i
A N B
f A B kn
34
Journal of Pressure Vessel Technology
PVT-19-1189 17 Abarkan
Acknowledgments
The first author would like to acknowledge the CNRST (Centre National pour la Recherche Scientifique et
Technique) in Rabat-Morocco for the PhD student funding.
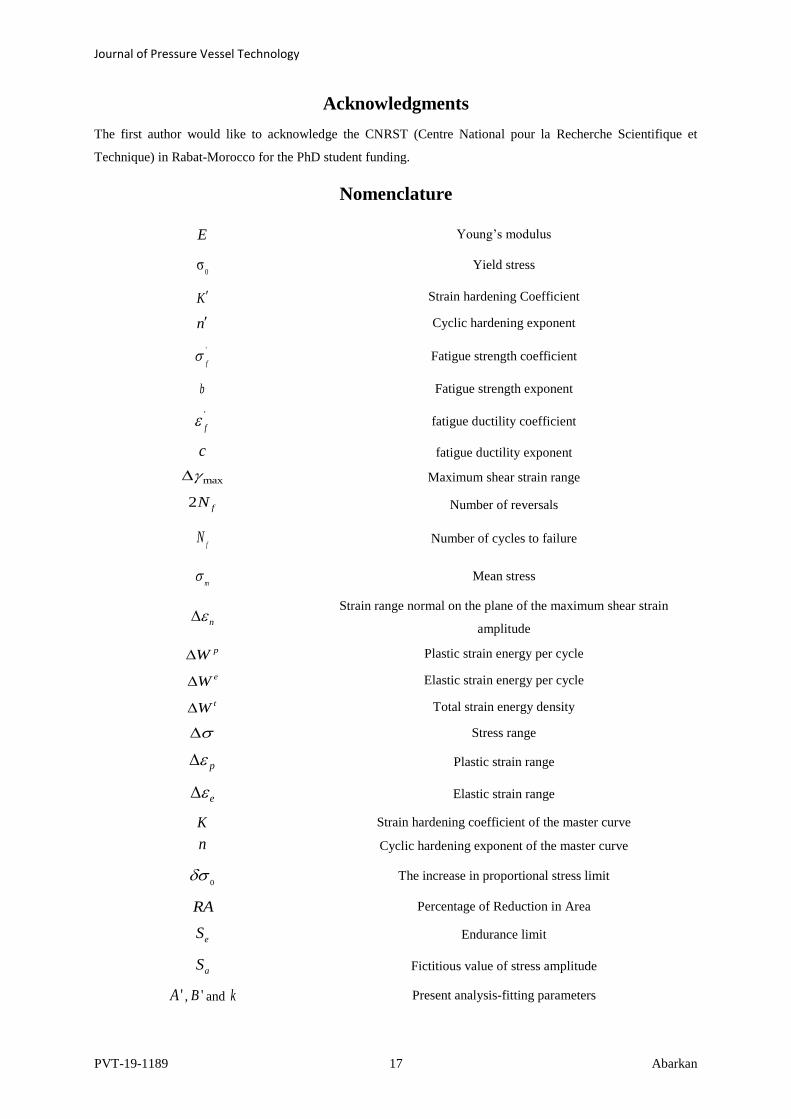
Nomenclature
E Young’s modulus
0σ Yield stress
K Strain hardening Coefficient
n Cyclic hardening exponent
'
f Fatigue strength coefficient
b Fatigue strength exponent
'
f fatigue ductility coefficient
c fatigue ductility exponent
max Maximum shear strain range
2 fN Number of reversals
fN Number of cycles to failure
m Mean stress
n Strain range normal on the plane of the maximum shear strain
amplitude
pW Plastic strain energy per cycle
eW Elastic strain energy per cycle tW Total strain energy density
Stress range
p Plastic strain range
e Elastic strain range
K Strain hardening coefficient of the master curve
n Cyclic hardening exponent of the master curve
0 The increase in proportional stress limit
RA Percentage of Reduction in Area
eS Endurance limit
aS Fictitious value of stress amplitude
'A , 'B and k Present analysis-fitting parameters

Journal of Pressure Vessel Technology
PVT-19-1189 18 Abarkan
References
[1] Sissa, S., Giacopini, M., & Rosi, R., 2014, "Low-cycle thermal fatigue and high-cycle vibration fatigue life estimation of a diesel engine exhaust manifold." Procedia Engineering 74, pp. 105-112. doi:10.1016/j.proeng.2014.06.233.
[2] Takahashia.T, Sasaki.K., 2010, "Low cycle thermal fatigue of aluminum alloy cylinder head in consideration of changing metrology microstructure." Procedia Engineering, 2(1), pp. 767-776. doi:10.1016/j.proeng.2010.03.083.
[3] Cowles, B. A., 1996, "High cycle fatigue in aircraft gas turbines—an industry perspective." International Journal of Fracture, 80 (2-3), pp.147-163. doi.org/10.1007/BF00012667
[4] Mazur, Z., Luna-Ramirez, A., Juárez-Islas, J. A., and Campos-Amezcua, A., 2005, "Failure analysis of a gas turbine blade made of Inconel 738LC alloy." Engineering failure analysis, 12(3), pp.474-486.doi.org/10.1016/j.engfailanal.2004.10.002
[5] Hormozi, R., 2014, "Experimental and numerical simulations of Type 316 stainless steel failure under LCF/TMF loading conditions." PhD diss., Doctoral Thesis, London: Imperial College.
[6] Weicheng.C, Huang.X, and Wang.F. , 2014, "Current Understanding of Fatigue Mechanisms of Metals." In Towards a Unified Fatigue Life Prediction Method for Marine Structures, pp. 31-68. Springer, Berlin, Heidelberg. doi.org/10.1007/978-3-642-41831-0_2
[7] Zhu, W. Q., Lin, Y. K., and Lei, Y., 1992,"On fatigue crack growth under random loading." Engineering Fracture Mechanics 43(1), pp.1-12. doi.org/10.1016/0013-7944(92)90307-Z
[8] Stephens, R. I., Fatemi, A., Stephens, R. R., and Fuchs, H. O. , 2000, Metal fatigue in engineering. John Wiley & Sons.
[9] ASCE Committee on Fatigue and Fracture Reliability of the Committee on Structural Safety and Reliability of the Structural Division., 1982,"Fatigue reliability: introduction." J. Struct. Div. ASCE, 108(1), pp. 3–23.
[10] ASCE Committee on Fatigue and Fracture Reliability of the Committee on Structural Safety and Reliability of the Structural Division. , 1982, “Fatigue reliability: quality assurance and maintainability." J. Struct. Div. ASCE, 108(1), pp.25–46.
[11] ASCE Committee on Fatigue and Fracture Reliability of the Committee on Structural Safety and Reliability of the Structural Division. , 1982, “Fatigue reliability: variable amplitude loading." J. Struct. Div. ASCE, 108(1), pp. 47–69.
[12] ASCE Committee on Fatigue and Fracture Reliability of the Committee on Structural Safety and Reliability of the Structural Division. , 1982, “Fatigue reliability: development of criteria for design." J. Struct. Div. ASCE, 108(1), pp.71–88.
[13] Newmark, N. M. , 1950," A review of cumulative damage in fatigue". University of Illinois Engineering Experiment Station. College of Engineering. University of Illinois at Urbana-Champaign.
[14] Boyer, H.E., 1986. Fatigue testing. Report of ASM International, USA.
[15] Kyröläinen, A., Vilpas, M., and Hänninen, H. ,2000, "Use of stainless steels in bus coach structures." Journal of materials engineering and performance, 9(6),pp.669-677.dio.org/10.1361/10599490077034555 48
[16] Prasad, Y. V. R. K., Rao, K. P., and Sasidhar, S. (Eds.). , 2015, “Hot working guide: a compendium of processing maps”. ASM international.
[17] Castro, H., Rodriguez, C., Belzunce, F. J., and Canteli, A. F., 2003, "Mechanical properties and corrosion behaviour of stainless steel reinforcing bars." Journal of materials processing technology 143, pp.134-137.doi.org/10.1016/S0924-0136(03)00393-5

Journal of Pressure Vessel Technology
PVT-19-1189 19 Abarkan
[18] McHenry, H. I., 1983, "The properties of austenitic stainless steel at cryogenic temperatures." In Austenitic Steels at Low Temperatures, pp. 1-27. Springer, Boston, MA. doi.org/10.1007/978-1-4613-3730-0_1
[19] Sas, J., Weiss, K. P., and Jung, A. , 2003, "The Mechanical and material properties of 316LN austenitic stainless steel for the fusion application in cryogenic temperatures." In IOP Conference Series: Materials Science and Engineering, 2(1), pp. 01. IOP Publishing, 2015.doi:10.1088/1757-899X/102/1/012003.
[20] Jayakumar, T., Mathew, M. D., and Laha, K., 2013, "High temperature materials for nuclear fast fission and fusion reactors and advanced fossil power plants." Procedia Engineering 55, pp. 259-270.doi.org/10.1016/j.proeng.2013.03.252
[21] Surahyo, A., 2019, "Corrosion of Embedded Metals in Concrete." In Concrete Construction, pp. 239-255. Springer, Cham.doi.org/10.1007/978-3-030-10510-5_10
[22] Coffin Jr, L. Fo., 1954, "A study of the effects of cyclic thermal stresses on a ductile metal." Transactions of the American Society of Mechanical Engineers, New York 76, pp. 931-950.
[23] Manson, S.S., 1954, "Behavior of materials under conditions of thermal stress.”
[24] Basquin, O. H., 1910, "The exponential law of endurance tests." In Proc Am Soc Test Mater, vol. 10, pp. 625-630.
[25] Dassault Systemes Simulia Corp., 2014, "Fatigue Theory Reference Manual" vol. 2.Safe Technology Limited.
[26] Brown, M. W., and Miller, K. J., 1973, "A theory for fatigue failure under multiaxial stress-strain conditions." Proceedings of the Institution of Mechanical engineers,187(1),pp. 745-755.doi.org/10.1243/PIME_PROC_1973_187_069_02
[27] Kandil, F. A., Brown, M. W., and Miller, K. J., 1982, "Biaxial low-cycle fatigue failure of 316 stainless steel at elevated temperatures." In Mechanical behaviour and nuclear applications of stainless steel at elevated temperatures.
[28] Baumel Jr, A., and Seeger, T., 1990, “Materials data for cyclic loading: Supplement 1”. Vol. 61. Elsevier Science Ltd. Elsevier Science Publishers, P. O. Box 211, 1000 AE Amsterdam, The Netherlands.
[29] Roessle, M. L., and Fatemi, A., 2000, "Strain-controlled fatigue properties of steels and some simple approximations." International journal of fatigue, 22(6), pp.495-511.doi.org/10.1016/S0142-1123(00)00026-8
[30] Fatemi, A, and Shamsaei,N. 2011, "Multiaxial fatigue: An overview and some approximation models for life estimation." International Journal of Fatigue, 33(8),pp. 948-958. doi.org/10.1016/j.ijfatigue.2011.01.003
[31] Ricotta, M., 2015. “Simple expressions to estimate the Manson–Coffin curves of ductile cast
irons”. International Journal of Fatigue, 78, pp.38-45.DOI: 10.1016/j.ijfatigue.2015.03.025
[32] Meggiolaro, M. A. and Castro, J. T. P., 2004, "Statistical evaluation of strain-life fatigue crack initiation predictions." International Journal of Fatigue, 26(5), pp.5:463-476.doi.org/10.1016/j.ijfatigue.2003.10.003
[33] Lee, K. S., and Song, J. H., 2006, "Estimation methods for strain-life fatigue properties fromhardness."InternationalJournalofFatigue,28(4),pp.386400.doi.org/10.1016/j.ijfatigue.2005.07.037
[34] Fatemi, A., and Socie, D. F.,1988, "A critical plane approach to multiaxial fatigue damage
including out‐of‐phase loading." Fatigue & Fracture of Engineering Materials & Structures, 11(3), pp. 149-165.doi.org/10.1111/j.1460-2695.1988.tb01169
[35] Shamsaei, N., and Fatemi,A., 2009, "Effect of hardness on multiaxial fatigue behaviour and some simple approximations for steels." Fatigue & Fracture of Engineering Materials &

Journal of Pressure Vessel Technology
PVT-19-1189 20 Abarkan
Structures, 32(8),pp. 631-646. doi.org/10.1111/j.1460-2695.2009.01369.x
[36] Wang, Y. Y., and Yao, W. X., 2004, "Evaluation and comparison of several multiaxial fatigue criteria." International Journal of Fatigue, 26()1,pp. 17-25.. doi.org/10.1016/S0142-1123(03)00110-5
[37] Shi, X. Q., Pang, H. L. J., Zhou, W., and Wang, Z. P., 1999, "A modified energy-based low cycle fatigue model for eutectic solder alloy." Scripta Materialia, 41(3), pp.289-296. DOI:10.1016/S1359-6462(99)00164-5
[38] Lefebvre, D., and Ellyin,F. , 1984, "Cyclic response and inelastic strain energy in low cycle fatigue." International Journal of Fatigue, 6(1),pp. 9-15.doi.org/10.1016/0142-1123(84)90003-3
[39] Langer, B. F., 1962, "Design of pressure vessels for low-cycle fatigue." Journal of Basic Engineering, 84(3), pp. 389-399. DOI:10.1115/1.3657332
[40] Diercks, D. R., 1979, "Development of Fatigue Design Curves for Pressure Vessel Alloys using a Modified Langer Equation." Journal of Pressure Vessel Technology, 101(4), pp. 292-297.dio:10.1115/1.3454636
[41] Tanaka, M., 1974,"Fatigue life estimation of bellows based on elastic-plastic
calculations." International Journal of Pressure Vessels and Piping, 2(1), pp.51-68.doi.org/10.1016/0308-0161(74)90015-5
[42] Jaske, C. E., and O’donnel, W. J. l., 1977,"Fatigue design criteria for pressure vessel alloys." Journal of Pressure Vessel Technology 99(4), pp. 584-592. DOI:10.1115/1.3454577
[43] Chopra, O.K. "Development of a Fatigue Design Curve for Austenitic Stainless Steels in LWR Environments: A Review." In ASME 2002 Pressure Vessels and Piping Conference, pp. 119-132. American Society of Mechanical Engineers Digital Collection, 2008. doi:10.1115/PVP2002-1229
[44] Li, U. M., Lee, B. S., Shih, C. T., Lan, W. H., and Lin, C. P. ,2002, "Cyclic fatigue of endodontic nickel titanium rotary instruments: static and dynamic tests." Journal of endodontics, 28( 6), pp. 448-451.DOI: 10.1097/00004770-200206000-00007
[45] Ellyin, F., and Kujawski,D. , 1984, "Plastic strain energy in fatigue failure." Journal of Pressure Vessel Technology, 106(4), pp. 342-347. DOI:10.1115/1.3264362
[46] Kujawski, D., and Ellyin,F., 1984, "A cumulative damage theory for fatigue crack initiation and propagation." International Journal of Fatigue, 6(2), pp.83-88.doi.org/10.1016/0142-1123(84)90017-3
[47] Golos, K., and Ellyin,F. 1989, "Total strain energy density as a fatigue damage parameter." In Advances in Fatigue Science and Technology, pp. 849-858. Springer, Dordrecht. doi.org/10.1007/978-94-009-2277-8_42
[48] Roy, S. C., Goyal, S., Sandhya, R., and Ray, S. K., 2012, "Low cycle fatigue life prediction of 316 L (N) stainless steel based on cyclic elasto-plastic response." Nuclear Engineering and Design 253, pp. 219-225. doi.org/10.1016/j.nucengdes.2012.08.024
[49] Abaqus 6.11.Dassault Systemes Simulia Corp Providence, RI, USA, 2011.
[50] Chaboche, J.L., 1986. “Time-independent constitutive theories for cyclic plasticity”. International Journal of plasticity, 2(2), pp.149-188.doi.org/10.1016/0749-6419(86)90010-0
[51] Sainte Catherine, C., Yuritzinn, T., Sirvent, A., Cariou, Y. and Martelet, B., 1997. “Mechanical properties of 316L (N) stainless steel for intermediate strain rates at 20° and 550° C”. http://www.lib.ncsu.edu/resolver/1840.20/32422
[52] Morrow,J., 1968. “Fatigue design handbook”. Advances in engineering. 4, pp.21-9.
[53] Taylor, D., and Clancy, O. M., 1991, "The fatigue performance of machined surfaces." Fatigue &
Fracture of Engineering Materials & Structures, 14(2‐3), pp. 329-336.dio.org/10.1111/j.1460-2695.1991.tb00 662.x

Journal of Pressure Vessel Technology
PVT-19-1189 21 Abarkan
[54] Goyal, S., Mandal, S., Parameswaran, P., Sandhya, R., Athreya, C. N., and Laha, K., 2017, "A comparative assessment of fatigue deformation behavior of 316 LN SS at ambient and high temperature." Materials Science and Engineering: A 696,pp. 407-415. doi.org/10.1016/j.msea.2017.04.102
[55] Morrow, J.,1965,"Cyclic plastic strain energy and fatigue of metals." In Internal friction, damping, and cyclic plasticity. ASTM International.
[56] Yimin, L., Jinrui, W., and Zhongxiao, S.,1990, "Application of low-cycle fatigue data to pressure vessel design fatigue curve." International Journal of Fatigue, 12(3),pp. 215-218. doi.org/10.1016/0142-1123(90)90098-Y
[57] Zhou, Y., Ou, Y. C., Lee, G. C., and O’Connor, J. S. ,2008, "A pilot experimental study on the low cycle fatigue behavior of stainless steel rebars for earthquake engineering applications." In Masters Abstracts International, 47(1).
[58] Yuan, X., Yu, W., Fu, S., Yu, D., and Chen, X., 2016, "Effect of mean stress and ratcheting strain on the low cycle fatigue behavior of a wrought 316LN stainless steel." Materials Science and Engineering: A 677,pp. 193-202. doi.org/10.1016/j.msea.2016.09.053
[59] Hamada, M, and Takezono,S., 1967, "Strength of U-Shaped Bellows: 5th Report, Fatigue Strength under Axial Loading." Bulletin of JSME ,10(40),pp.611-617.doi.org/10.1299/kikai1938.32.1640
[60] Marcal, P. V., and Turner, C. E.,1965, "Limited life of shells of revolution subjected to severe local bending." Journal of Mechanical Engineering Science ,7(4),pp.408-423. dio.org/10.1243/JMES_JOUR_1965_007_063_02
Figure Captions List
Fig. 1 Shape and dimension of Low cycle fatigue specimens.
Fig. 2 3D meshed part
Fig. 3 First cycle hysteresis loops at ±0.4% (A), ±0.5% (B) and ±0.6% (C) total strain amplitudes.
Fig. 4 Relative error as a function of mesh size.
Fig. 5 Obtained fatigue life by Fe-Safe employing Maximum shear strain and Roy et al. [48]
experiment.
Fig. 6 Obtained fatigue life by Fe-Safe employing Brown-Miller and Roy et al. [48] experiment.
Fig. 7 Load wave-shape for low cycle fatigue simulation.
Fig. 8 Saturated hysteresis loop at 0.6% strain amplitude.
Fig. 9 Experimental stress-strain curve of the saturated hysteresis loops after linking lower tips
at the origin [48].
Fig. 10 Numerical fatigue life using Masing hypothesis and Roy et al. [48] experimental results.
Journal of Pressure Vessel Technology
PVT-19-1189 22 Abarkan
Fig. 11 The obtained master curve by Roy et al. [48]for a 316LN SS.
Fig. 12 Numerical fatigue life using non-Masing hypothesis and Roy et al. [48] experimental
results.
Fig. 13 Strain-life curves of experimental and analytical results.
Fig. 14 Comparison between the experimental data and the fitted curve.
Table Caption List
Table 1 Elastic properties and hardening parameters of 316 LN SS [48].
Table 2 Cyclic properties of 316LN SS [48].
Table 3 Comparison of fatigue life results predicted by Fe-safe employing Maximum shear strain
criteria and experiment conducted by Roy et al. [48] for different surface roughness.
Table 4 Comparison of fatigue life results predicted by Fe-Safe employing Brown-Miller and
experiment conducted by Roy et al. [48] for different surface roughness.
Table 5 Experimental and FE calculated hysteresis loop strain energy.
Table 6 Experimental and predicted fatigue life using Masing approach.
Table 7 Experimental and predicted fatigue life using non-Masing approach.
Table 8 Langer fitting parameters.
Table 9 Jaske and O'Donnell fitting parameters.
Table 10 Diercks fitting parameters.
Table 11 Chopra fitting parameters.
Table 12 Present analysis-fitting parameters.

Journal of Pressure Vessel Technology
PVT-19-1189 23 Abarkan
Fig. 1. Shape and dimension of Low cycle fatigue specimens (all dimensions in mm).
Journal of Pressure Vessel Technology
PVT-19-1189 24 Abarkan
Fig.2. 3D meshed part

Journal of Pressure Vessel Technology
PVT-19-1189 25 Abarkan
Fig.3. First cycle hysteresis loops at ±0.4% (A), ±0.5% (B) and ±0.6% (C) total strain amplitudes.
Journal of Pressure Vessel Technology
PVT-19-1189 26 Abarkan
Fig.4. Relative error as a function of mesh size.
Journal of Pressure Vessel Technology
PVT-19-1189 27 Abarkan
Fig.5. Obtained fatigue life by Fe-Safe employing Maximum shear strain and Roy et al. [48] experiment.

Journal of Pressure Vessel Technology
PVT-19-1189 28 Abarkan
Fig.6. Obtained fatigue life by Fe-Safe employing Brown-Miller and Roy et al. [48] experiment.
Journal of Pressure Vessel Technology
PVT-19-1189 29 Abarkan
Fig.7.Load wave-shape for low cycle fatigue simulation.
Journal of Pressure Vessel Technology
PVT-19-1189 30 Abarkan
Fig.8. Saturated hysteresis loop at 0.6% strain amplitude.

Journal of Pressure Vessel Technology
PVT-19-1189 31 Abarkan
Fig.9. Experimental stress-strain curve of the saturated hysteresis loops after linking lower tips at the origin [48].
Journal of Pressure Vessel Technology
PVT-19-1189 32 Abarkan
Fig.10. Numerical fatigue life using Masing hypothesis and Roy et al. [48] experimental results.
Journal of Pressure Vessel Technology
PVT-19-1189 33 Abarkan
Fig.11. The obtained master curve by Roy et al. [48]for a 316LN SS.
Journal of Pressure Vessel Technology
PVT-19-1189 34 Abarkan
Fig.12. Numerical fatigue life using non-Masing hypothesis and Roy et al. [48] experimental results.
Journal of Pressure Vessel Technology
PVT-19-1189 35 Abarkan
Fig. 13. Strain-life curves of experimental and analytical results.

Journal of Pressure Vessel Technology
PVT-19-1189 36 Abarkan
Fig.14. Comparison between the experimental data and the fitted curve.
Journal of Pressure Vessel Technology
PVT-19-1189 37 Abarkan
Young’s modulus
E GPa
Yield Strength
0
MPa
Ultimate tensile
strength
mMPa
Deformation at
the maximum
%g
A
Deformation at
the fracture
%A
Striction
%Z
200 211 628 56 69.3 83.3
Kinematic hardening parameters Isotropic hardening parameters
c (MPa) Q (MPa) b
57 805 619.04 42.30 21.6
Table 1. Mechanical properties and hardening parameters of 316 LN SS [48,51].

Journal of Pressure Vessel Technology
PVT-19-1189 38 Abarkan
Cyclic stress-strain curve
parameters Basquin parameters Coffin–Manson parameters
'K MPa n
'
f MPa b f
c
2854 0.378 1444 0.159 0.294 0.494
Table 2. Cyclic properties of 316LN SS [48].

Journal of Pressure Vessel Technology
PVT-19-1189 39 Abarkan
Strain amplitude %
Relative error % (NfPredict
NfTest − 1) ∗ 100%
Mirror polished
0.25a
R m
Fine machined
4 16a
R m
Machined
16 40a
R m
0.3 9.2 -35.8 -54.6
0.4 -8.2 -45.0 -60.7
0.5 -28.6 -56.7 -68.8
0.6 -8.5 -44.0 -59.2
0.8 -12.6 -45.6 -60.1
1 -11.7 -44.3 -59.0
Table 3. Comparison of fatigue life results predicted by Fe-safe employing Maximum shear strain criteria and
experiment conducted by Roy et al. [48] for different surface roughness.
Journal of Pressure Vessel Technology
PVT-19-1189 40 Abarkan
Strain amplitude %
Relative error % (NfPredict
NfTest − 1) ∗ 100%
Mirror polished
0.25a
R m
Fine machined
4 16a
R m
Machined
16 40a
R m
0.3 -18.1 -51.9 -66.0
0.4 -29.2 -57.6 -69.7
0.5 -44.2 -66.2 -75.6
0.6 -28.4 -56.0 -68.1
0.8 -31.9 -57.6 -68.9
1 -31.5 -56.8 -68.2
Table 4. Comparison of fatigue life results predicted by Fe-Safe employing Brown-Miller and experiment
conducted by Roy et al. [48] for different surface roughness.
Journal of Pressure Vessel Technology
PVT-19-1189 41 Abarkan
aStrain energy is defined in per unit volume.
Table5. Experimental and FE calculated hysteresis loop strain energy.
Strain amplitude
(%)
Experimental strain
energy per cycle (MPa)
Roy et al.
[48]
Simulated strain
energya per cycle
(MPa)
Present analysis
Relative Error
(%)
0.3 1.355 1.434 5.8
0.4 2.314 2.478 7.1
0.5 3.047 3.664 20.2
0.6 4.751 5.271 10.9
0.8 8.099 8.452 4.4
1 12.140 12.672 4.4
Journal of Pressure Vessel Technology
PVT-19-1189 42 Abarkan
Table 6. Experimental and predicted fatigue life using Masing approach.
Strain amplitude
%
Predicted life
fN
Roy et al.
[48]
Predicted life
fN
Present analysis
Experimental life
fN
Roy et al.
[48]
Relative error%
Present analysis
0.3 24 383 11 710 14 817 -21.0
0.4 13 983 4770 7946 -40.0
0.5 9786 2533 5838 -56.6
0.6 4693 1415 2634 -46.3
0.8 2334 668 1290 -48.2
1 1395 353 765 -53.9

Journal of Pressure Vessel Technology
PVT-19-1189 43 Abarkan
Table 7. Experimental and predicted fatigue life using non-Masing approach.
Strain
amplitude%
Predicted life
fN
Roy et al.
[48]
Predicted life fN
Present analysis
Experimental life
fN
Roy et al.
[48]
Relative
error%
(for present
analysis)
0.3 14 941 19559 14817 32.0
0.4 8432 8176 7946 2.9
0.5 5905 4364 5838 -25.2
0.6 2728 2611 2634 -0.9
0.8 1311 1294 1290 0.3
1 772 708 765 -7.4
Journal of Pressure Vessel Technology
PVT-19-1189 44 Abarkan
Table 8. Langer fitting parameters.
RA % e
S (MPa) E (GPa)
72.6 300 179.264
Journal of Pressure Vessel Technology
PVT-19-1189 45 Abarkan
eS (MPa) B (GPa) E (GPa)
218 62.61 62.61
Table 9. Jaske and O'Donnell fitting parameters.
Journal of Pressure Vessel Technology
PVT-19-1189 46 Abarkan
b e
S (MPa) B (GPa) E (GPa)
0.42 196.10 35.78 195
Table 10. Diercks fitting parameters.
Journal of Pressure Vessel Technology
PVT-19-1189 47 Abarkan
Table 11. Chopra fitting parameters.
A B C
6.703 2.030 0.126
Journal of Pressure Vessel Technology
PVT-19-1189 48 Abarkan
Table 12. Present analysis-fitting parameters.
'A 'B k
16.7697 0.1050 0.4497