Re-analysis of tropospheric sulfate aerosol and ozone for the period ...
Atmos. Chem. Phys., 12, 189–206, 2012www.atmos-chem-phys.net/12/189/2012/doi:10.5194/acp-12-189-2012© Author(s) 2012. CC Attribution 3.0 License.
AtmosphericChemistry
and Physics
Nucleation and growth of sulfate aerosol in coal-fired power plantplumes: sensitivity to background aerosol and meteorology
R. G. Stevens1, J. R. Pierce1, C. A. Brock2, M. K. Reed3, J. H. Crawford 4, J. S. Holloway2, T. B. Ryerson2,L. G. Huey5, and J. B. Nowak2,6
1Department of Physics and Atmospheric Science, Dalhousie University, Halifax, NS, Canada2NOAA Earth System Research Laboratory, Boulder, CO, USA3Tennessee Technological University, Cookeville, TN, USA4NASA Langley Research Center, Hampton, VA, USA5Department of Earth and Atmospheric Science, Georgia Institute of Technology, Atlanta, GA, USA6Cooperative Institute for Research in Environmental Sciences, University of Colorado, Boulder, CO, USA
Correspondence to:R. G. Stevens ([email protected])
Received: 10 August 2011 – Published in Atmos. Chem. Phys. Discuss.: 5 September 2011Revised: 12 December 2011 – Accepted: 13 December 2011 – Published: 3 January 2012
Abstract. New-particle formation in the plumes of coal-fired power plants and other anthropogenic sulfur sourcesmay be an important source of particles in the atmosphere.It remains unclear, however, how best to reproduce this for-mation in global and regional aerosol models with grid-boxlengths that are 10s of kilometers and larger. The predic-tive power of these models is thus limited by the resultantuncertainties in aerosol size distributions. In this paper, wefocus on sub-grid sulfate aerosol processes within coal-firedpower plant plumes: the sub-grid oxidation of SO2 withcondensation of H2SO4 onto newly-formed and pre-existingparticles. We have developed a modeling framework withaerosol microphysics in the System for Atmospheric Mod-elling (SAM), a Large-Eddy Simulation/Cloud-ResolvingModel (LES/CRM). The model is evaluated against air-craft observations of new-particle formation in two differentpower-plant plumes and reproduces the major features of theobservations. We show how the downwind plume aerosolscan be greatly modified by both meteorological and back-ground aerosol conditions. In general, new-particle forma-tion and growth is greatly reduced during polluted conditionsdue to the large pre-existing aerosol surface area for H2SO4condensation and particle coagulation. The new-particle for-mation and growth rates are also a strong function of theamount of sunlight and NOx since both control OH concen-trations. The results of this study highlight the importance
for improved sub-grid particle formation schemes in regionaland global aerosol models.
1 Introduction
It has been established that aerosols have a cooling effect onclimate through the direct and indirect aerosol effects, but themagnitude of these effects is still very uncertain (Solomonet al., 2007). It has also been demonstrated that both thedirect (Charlson et al., 1992) and indirect (Twomey, 1974;Albrecht, 1989) effects strongly depend on the size of theparticles involved. The size distribution of particles also de-termines, in part, the effects on human health of the particles.Particles are known to have adverse effects on respiratoryhealth in humans (Dockery et al., 1993), and ultrafine parti-cles (with diameters less than 0.1 µm in diameter) may havestronger effects than larger particles (Peters et al., 1997).
Coal-fired power plants are major emitters of sulfur diox-ide “SO2” (Whitby, 1978; Hegg and Hobbs, 1980; Hegg etal., 1985). Concentrations of SO2 in the plumes of thesepower plants are generally much higher than in a typicalplanetary boundary layer. When SO2 is oxidized by thehydroxyl radical (OH) in the gas phase, it forms sulfuricacid (H2SO4), a low-volatility vapor. H2SO4 will condenseonto pre-existing particles, and if its concentration is high
Published by Copernicus Publications on behalf of the European Geosciences Union.

190 R. G. Stevens et al.: Sensitivity to background aerosol and meteorology
enough, it will cluster with itself and other condensible gasesto form new particles (i.e. aerosol nucleation; Kulmala andKerminen, 2008). Through new-particle formation in theirplumes, coal-fired power plants and other anthropogenic sul-fur sources can have a significant effect on particle concen-trations globally, particularly in the Northern Hemisphere(Adams and Seinfeld, 2003; Luo and Yu, 2011; Spracklenet al., 2005; Wang and Penner, 2009).
Unfortunately, the plume-scale chemistry and physics thatlead to particle formation are difficult to represent in regionaland global aerosol models. Concentrations of gases, aerosolsand relevant variables for particle formation such as tempera-ture and relative humidity are not homogeneous within theseplumes, let alone across the spatial scales of a typical globalchemical-transport model grid-box. H2SO4 vapor concentra-tions that drive new-particle formation within a given plumemay be sensitive to NOx (nitric oxide (NO) + nitrogen diox-ide (NO2)) concentrations, OH concentrations, and the con-densation sink (approximately proportional to aerosol sur-face area), which are also not homogeneous within a givenplume. Thus, nucleation and growth rates, which are a strongfunction of H2SO4 concentrations, will be location depen-dent in plumes. Coagulation rates of newly formed particleswill also vary with location in the plume. For all of these rea-sons, current global and regional models cannot accuratelyresolve particle formation and growth in power-plant plumesusing values averaged over the volume of a model grid box.
Regional and global models with online aerosol chemistryand physics have therefore made crude assumptions aboutthe sub-grid processes within power-plant plumes that do notdepend on the nature of the source or the ambient condi-tions. These assumptions result in two common simplifica-tions. The first common simplification is that a single sizedistribution of new particles is commonly used to representthe sub-grid nucleation and growth (“primary sulfate”) as-sociated with all SO2 emitted from anthropogenic sourcesunder all atmospheric conditions. For example, some mod-els (e.g. Makkonen et al., 2009) use the assumption recom-mended by the AeroCom emissions inventory (Dentener etal., 2006) that specifies that all aerosol formation in anthro-pogenic SO2 source plumes results in new particles havinga single accumulation lognormal mode with median radius500 nm and a standard deviation of 2.0. In other models(Adams and Seinfeld, 2002, 2003; Pierce and Adams, 2006,2009; Pierce et al., 2007; Spracklen et al., 2005), the aerosolformed in sub-grid plumes is assumed to have a bi-modallognormal distribution: a fraction of the particles are emittedas a nucleation mode with geometric number mean diame-ter 10 nm and standard deviation 1.6, and the rest are emittedas an Aitken mode with geometric number mean diameter70 nm standard deviation 2.0. The fraction of sulfate mass tobe emitted into the nucleation mode is also set as 5 % or 15 %depending on the study. Yu and Luo (2009) use yet anotherassumption; they emit 5 % of the sulfate mass into the nu-cleation mode described above, and condense the remaining
mass onto the existing accumulation mode particles. Thisapproach is more intuitive than the other approaches sincesome of the sulfate formed in the plume must condense ontopre-existing particles that have been entrained into the plume.A recent paper by Luo and Yu (2011) investigated the effectof varying the fraction of sulfate emitted into the nucleationmode, and found that varying the fraction of sulfate emittedinto the nucleation mode from 5 % to 15 % would increasecloud condensation nuclei concentrations at a supersatura-tion of 0.2 %, hereafter denoted as CCN (0.2 %), by as muchas 18 % over source regions. A major shortcoming of the as-sumption that the size distribution of new particles is constantis that it will not be representative of all power plants underall atmospheric conditions, as it has been shown that varia-tions in temperature and OH concentrations would cause thesize distribution of aerosol formed to vary seasonally and di-urnally (Yu, 2010a).
The second common simplification is that the fraction ofSO2 oxidized in the gas phase to form H2SO4 on the sub-grid scale and contributing to primary sulfate is constant forall power plants (and anthropogenic sulfate sources in gen-eral) under all atmospheric conditions. Adams and Sein-feld (2003) performed modeling studies to determine the im-pact on CCN (0.2 %) of primary sulfate. They found that ifthe fraction of anthropogenic SO2 emitted as primary sul-fate was changed from 0 % to 3 %, CCN (0.2 %) in pollutedareas would double. Thus in-plume nucleation increasesCCN (0.2 %) far more efficiently than does condensationonto pre-existing particles. However, this is likely a max-imum effect on CCN (0.2 %), as the model did not includeorganic compounds, dust, or black carbon, only sulfate andsea-salt aerosol. A similar study by Spracklen et al. (2005)also found that increasing the fraction of SO2 emitted as sul-fate from 0 % to 3 %, would more than double CCN (0.2 %)over polluted regions. Wang and Penner (2009) performedanother modeling study, where organic matter, black carbon,and dust were also included. They found that if the frac-tion of SO2 emitted as primary sulfate was increased from0 % to 2 %, CCN (0.2 %) would more than double over pol-luted areas and would increase by 23 % to 53 % averagedover the global boundary layer (depending on the nucleationscheme used for regional-scale nucleation in the boundarylayer). Furthermore, they estimated that the first aerosol indi-rect effect radiative forcing would increase by 11 % to 31 %.Luo and Yu (2011) found that varying the fraction of sul-fur effectively emitted as particles from 0 % to 5 % wouldincrease CCN (0.2 %) concentrations globally by 11 % in theboundary layer (Luo and Yu (2011) made a different assump-tion about the size of these particles than the aforementionedpapers, see the previous paragraph). Together, these mod-eling studies suggest a strong effect on CCN concentrationsand regional radiative forcing to modest changes in sulfurpartitioning and the size of particles formed in the plumes ofsulfur point sources.
Atmos. Chem. Phys., 12, 189–206, 2012 www.atmos-chem-phys.net/12/189/2012/

R. G. Stevens et al.: Sensitivity to background aerosol and meteorology 191
To better understand the number and size of particles thatshould be effectively emitted from anthropogenic sourcesin regional and global models, we explore the evolutionof the number and size of sulfate aerosol particles insidecoal-fired power-plant plumes using a 3-D fluid-dynamicsmodel of plume chemistry and physics: the System for At-mospheric Modelling (Kairoutdinov and Randall, 2003) withTwO Moment Aerosol Sectional (Adams and Seinfeld, 2002)microphysics (SAM-TOMAS). This model uses a sub-kmresolution to resolve the variation of chemistry and physicswithin the plumes. We test the ability of the model to pre-dict the median diameter and number of particles nucleatedwithin the plumes of two different power plants under differ-ent meteorological conditions. We test the sensitivity of themodel output to different possible ambient meteorologicalconditions and background aerosol conditions and show thatthe resultant size distribution of sulfate aerosol is stronglydependent on these conditions.
The goal of this paper is to test the ability of the SAM-TOMAS model to predict new-particle formation and growthin anthropogenic sulfur plumes, determine the number andsize of particles formed, and test the sensitivity of the pre-dicted particles to various parameters. Section 2 presents adescription of the SAM-TOMAS model. In Sect. 3 we de-scribe the case studies used to evaluate the model, presentthe results of these evaluations, and assess the performanceof the model. Section 4 explores the sensitivity of our mod-eled results to the nucleation parameterization used, to thebackground aerosol, and to high and low VOC conditions.Our discussion and conclusions are presented in Sect. 5.
2 Description of model
In order to study nucleation and growth in anthropogenicsulfur plumes, we have developed a model that incorpo-rates TwO Moment Aerosol Sectional (TOMAS) (Adamsand Seinfeld, 2002) microphysics into the System for At-mospheric Modelling (SAM; Kairoutdinov and Randall,2003), a Large-Eddy Simulation/Cloud-Resolving Model(LES/CRM). SAM is a flexible fluid dynamics model witha domain that can span tens or hundreds of kilometers, andthe individual grid cells can have dimensions between tens ofmeters to several kilometers. A full description is availablein Khairoutdinov and Randall (2003).
The TOMAS microphysics algorithm simulates theaerosol size distribution using fifteen size bins spanning drydiameters of 3 nm to 10 µm. In each size bin, TOMAS tracksthe number of particles as well as sulfate, ammonium, andwater mass. No organic aerosols are included in the modelat this time under the assumption that sulfate aerosol forma-tion will be the primary aerosol formation mechanism in theplume; however, we will discuss the uncertainties in this as-sumption later. TOMAS explicitly calculates coagulation,condensation and nucleation (Adams and Seinfeld, 2002;
Pierce and Adams, 2009). Aerosol growth and coagulationalloss below 3 nm is approximated by the parameterization ofKerminen and Kulmala (2002). This scheme predicts the in-stantaneous formation for 3 nm particles based on the nucle-ation rates (of clusters with diameters closer to 1 nm), localgrowth rates and condensation sinks. Because the growthrates and condensation sinks within the plume may changeon timescales faster than the growth time from 1 to 3 nm, theKerminen and Kulmala (2002) scheme introduces additionaluncertainties to our simulations. However, these uncertain-ties are generally much smaller than the relative uncertain-ties between the nucleation schemes themselves. Several nu-cleation schemes are tested and are described in the follow-ing paragraph. We simulate gaseous SO2, NOx, ammonia(NH3) and H2SO4. We do not explicitly simulate volatile or-ganic compounds (VOCs); however, we test the sensitivityof our results to the effect of high and low VOC concentra-tions on OH concentrations (described below). We assumethat there are no primary particles emitted directly from thestack, which is consistent with the airborne measurementswe use for model evaluation.
We have implemented several different nucleationschemes for use in the model: (1) the classical binaryhomogeneous nucleation scheme described by Vehkamakiet al. (2002), (2) the ternary H2O-H2SO4-NH3 nucleationschemes described by Merikanto et al. (2006) and (3) Na-pari et al. (2002) scaled by a factor of 10−4 (Westerveltet al., 2011), (4) activation-type nucleation as described byKulmala et al. (2006), and (5) the ion-mediated nucleationscheme of Yu (2010b). The resulting size distributions pre-dicted by the Merikanto and scaled Napari schemes did notdiffer significantly, so we only present the results of theMerikanto scheme in this work. In activation-type nucle-ation, the rate varies as a linear function of the sulfuric acidconcentration, according to the following equation (Kumalaet al., 2006):
J = A[H2SO4] (1)
whereJ is the nucleation rate, andA is an activation param-eter. Unless we specify otherwise (e.g. during the sensitivityanalysis), we useA = 10−7 s−1 (Sihto et al., 2006).
We use a parameterization to estimate the concentrationof OH in each model grid box based on the concentrationof NOx in ppbv and the downward shortwave radiative flux(dswrf) in W m−2. While the NOx concentration is used topredict the concentration of OH, we do not currently have achemical sink for NOx in the model, which will lead to anover-prediction of NOx later in the plume. The parameteri-zation is an empirical fit to the results of many simulationsfrom the detailed time-dependent photochemical box modeldescribed by Olson et al. (2006).
One process not accounted for in the OH parameterizationis the effect of the presence of large amounts of highly re-active VOCs on OH production. The additional peroxy rad-icals from isoprene oxidation induce a shift in the peak OH
www.atmos-chem-phys.net/12/189/2012/ Atmos. Chem. Phys., 12, 189–206, 2012

192 R. G. Stevens et al.: Sensitivity to background aerosol and meteorology
production to a higher NOx level. To understand the poten-tial effect of high VOC concentrations in our study, a secondparameterization, referred to as the “high-VOC” case, wasdeveloped based on an isoprene mixing ratio of 1.5 ppbv (the95th percentile value observed during INTEX-A). We referto the original parameterization as the “low-VOC” case. Thetwo parameterizations are outlined in detail in the Appendix.
Dry deposition is not included in the simulations presentedhere. We tested the sensitivity of the modeled aerosol sizedistributions to dry deposition by implementing a simple drydeposition scheme. However, even for high deposition ve-locities, dry deposition had a trivial influence on the size andconcentration of particles for the spatial scales we are simu-lating.
The model meteorology is driven by nudging and bound-ary conditions from assimilated meteorology from the Na-tional Center for Environmental Prediction (NCEP) NorthAmerican Regional Reanalysis (NARR) data (Mesinger etal., 2006). The reanalysis data were provided by the NationalOceanic and Atmospheric Administration (NOAA), Oceanand Atmospheric Research (OAR), Earth System ResearchLaboratory (ESRL) Physical Sciences Division (PSD), Boul-der, Colorado, USA, from their website at:http://www.esrl.noaa.gov/psd/. NCEP NARR three-hourly assimilation dataused in our studies included surface pressure, zonal andmeridional wind speed profiles, potential temperature pro-file, water vapor mixing ratio profile, downward shortwaveradiative flux (for OH calculation), surface sensible heat flux,surface latent heat flux, and surface momentum fluxes. Themodeled vertical profiles of temperature, water vapor mixingratio and horizontal wind speed are nudged to the assimila-tion profiles on a one-hour time scale. The surface fluxes areprescribed as model boundary conditions. The model turbu-lent motions (on spatial scales both larger than and smallerthan grid box sizes) are freely predicted by SAM and notprovided by the NCEP NARR data set.
We obtained the emissions of SO2 and NOx from eachpower plant from Clean Air Markets emissions inventory(Clean Air Markets – Data and Maps, 2010). Backgroundconcentrations of SO2 and NOx, as well as the backgroundsize distribution of aerosol, were determined from the in-flight measurements either upwind of the power plant or out-side of the power-plant plume. In the Parish case (the powerplant cases are described in the next paragraph), backgroundvalues of NH3 were also measured. No measurements ofNH3 were available for the Conesville case.
In order to determine the accuracy of our model, wehave evaluated the model with airborne data obtained in theplumes of two coal-fired power plants: the W. A. Parishpower generation facility near Houston, TX, obtained duringthe Texas Air Quality Study (TexAQS) 2006 field campaign(Parrish et al., 2009), and the Conesville power generationfacility near Conesville, OH during the International Con-sortium for Atmospheric Research on Transport and Trans-formation (ICARTT) campaign (Brown et al., 2007). The
observations were taken on board the NOAA WP-3D air-craft. These measured species and the instrumentation usedare summarized in Table 1.
The model grid contains 128 grid-boxes in the down-wind direction, 60 in the cross-wind direction, and 50in the vertical direction. We ran the model using400 m by 400 m horizontal resolution, and 800 m by800 m horizontal resolution (we will compare the re-sults of the 2 resolutions). The vertical resolutionwas always 40 m. Thus the total domain dimensionswere 51.2 km× 24 km× 2 km for the 400× 400× 40 mgrid-box cases, and 102.4 km× 48 km× 2 km for the800× 800× 40 m grid-box cases.
3 Case studies
3.1 Parish
The Parish power generation facility is located∼40 kmsouthwest of downtown Houston, Texas. The area furthersouth and west of the facility is used for farmland. Fiveunits of the Parish power generation facility were active on27 September 2006. One of these units had wet lime flue gasdesulfurization SO2 controls. Four of the units (includingthe unit with desulfurization) controlled NOx through selec-tive catalytic reduction, and the remaining unit used overfireair for NOx controls. Particulate matter was controlled for allunits through the use of baghouse filters.
Atmospheric conditions were sunny and clear. The bound-ary layer was initially stable, becoming unstable between18:00 GMT and 21:00 GMT, with a depth of 500 m grow-ing to 1000 m. The wind was blowing from the south at∼5 m s−1. The aerosol background was typical of a remotecontinental region, with three lognormal modes: a small nu-cleation mode with concentration 1.2 cm−3, median diam-eter 3.3 nm, and geometric standard deviation 1.3; a wideAitken mode with concentration 770 cm−3, median diameter89 nm, and geometric standard deviation 2.8; and an accumu-lation mode with concentration 640 cm−3, median diameter120 nm, and geometric standard deviation 1.3.
We show the predicted instantaneous nucleation rates asa function of height and distance from the source along thecenter of the plume in Fig. 1a, and as a function of cross-wind distance and distance from the source at an altitude of460 m in Fig. 1b. This figure can be considered a “snapshot”of the nucleation rates within the modeled plume at a singlepoint in time. (All other figures in this work present the con-centrations of aerosol or gas species time-averaged over a pe-riod of ∼2.2 h.) In the first 1–2 km, nucleation is suppressedbecause OH concentrations are very low due to high NOxconcentrations. As the initial high NOx concentrations be-come diluted, nucleation rates reach a maximum around 5 kmfrom the source. Nucleation rates decrease further downwindof the source as the condensation sink increases and SO2
Atmos. Chem. Phys., 12, 189–206, 2012 www.atmos-chem-phys.net/12/189/2012/

R. G. Stevens et al.: Sensitivity to background aerosol and meteorology 193
Table 1. Measurements and instrumentation for each investigated power plant.
Parish Conesville
NO O3-induced CL1 O3-induced CLNO2 UV2 photolysis-CL UV photolysis-CLSO2 Pulsed UV fluorescence Pulsed UV fluorescenceNH3 Protonated acetone dimer CIMS3 Not availableH2SO4 NO−
3 CIMS NO−
3 CIMS
Aerosol number, size and White and laser light in parallel Laser light scattering andvolume distributions scattering and five CPC4s five CPCs in parallel behind
behind a low turbulence inlet a low turbulence inlet
1 CL – chemiluminescence,2 UV – ultraviolet,3 CIMS – chemical ionization mass spectrometry,4 CPC – condensation particle counter.
concentrations decrease (primarily due to dilution), but areelevated where the polluted boundary-layer air mixes withthe clean air of the free troposphere due to the reduced con-densation sink in this region. In general, we see enhanced nu-cleation where high concentrations of H2SO4 formed withinthe plume and the lower condensation sink and NOx out-side of the plume coincide due to turbulent mixing. Theseturbulent eddies create regions within the plume with espe-cially high and low concentrations of NOx and SO2 that alterthe nucleation rate within the plume. This in turn causes thecontribution of nucleation to the condensation sink to be in-homogeneous within the plume. As seen in Fig. 1, these tur-bulent mixing effects can cause the nucleation rate to vary bya factor of two within the plume, even at the same distancefrom the source. These inhomogeneous regions of enhancednucleation, evident at the downwind plume edges, cannotbe resolved using a model that assumes a pre-defined Gaus-sian plume, which has motivated the choice of an LES/CRMmodel that represents turbulent motion for this study.
Figure 2 compares observed and modeled gas and parti-cle concentrations for an aircraft transect through the plume∼36 km from the power plant. Figure 2a shows the measuredand modeled gas concentrations as the aircraft flew acrossthe plume, and Fig. 2b and c shows the observed and mod-eled size distributions, respectively. We see that the widthof the modeled plume agrees with the width of the observedplume, but the predicted concentration of NOx is too largeat the center of the plume by∼4 ppb. Our predicted con-centrations of H2SO4 and SO2 agree with the observed con-centrations, within their respective variabilities. We note thatthere is a peak in the observed NOx concentrations∼2 kmfrom the plume center, and that this peak coincides withthe location of a major multilane highway, the Sam HoustonTollway. We therefore believe that this peak is due to vehi-cle emissions, which are not explicitly simulated within themodel. The model slightly under-predicts the peak diameterof the aerosol size distribution as∼30 nm, compared to theobserved peak diameter of∼50 nm. The number concentra-tion of aerosol at the peak within the plume is very close to
the observed value, but the number concentration of particlessmaller than 100 nm outside of the plume is under-predicted.We do not explicitly simulate any other sources of particlesor gases within the model domain aside from the power plant,and this may explain the discrepancy outside of the plume.
We show the observed and modeled trace-gas concentra-tions with distance from the power plant, averaged over theplume cross section, in Fig. 3a. We consider a point alonga transect to be within the plume if the concentration ofSO2 at that point is greater than 33 % of the maximum con-centration of SO2 found along that transect, after subtract-ing out the background concentration. NOx measurementswere unavailable inside the plume for the fourth transect,so no observed value for NOx is plotted for this transect.The results from the model using 800× 800× 40 m reso-lution are shown as a solid line, and the 400× 400× 40 mresolution results are shown as a dashed line. We note thatthe 800× 800× 40 m mixing ratios of NOx and SO2 are∼1 ppbv and∼5 ppbv lower than the 400× 400× 40 m mix-ing ratios, respectively, but the H2SO4 concentrations arequite similar between the two cases. Differences in thesevalues between the two resolutions are similar when appliedto the Conesville case (not shown). When the SO2 and NOxare initially emitted into the model domain, they are immedi-ately diluted to be uniformly mixed within a single grid-box.Concentrations of SO2 and NOx are consequently slightlylower in the 800× 800× 40 m than in the 400× 400× 40 mresolution model. These variations in the concentrations ofgaseous species due to altering the model resolution between400× 400× 40 m and 800× 800× 40 m are similar in mag-nitude to variations due to across-plume turbulence, and itdoes not appear that the accuracy of the model will be greatlyimproved by using resolutions finer than 800× 800× 40 m.In the following discussion, we will consider the results ofthe 800× 800× 40 m resolution model, as this allows forcomparison with the observations further than 50 km fromthe source.
At the first transect,∼5.4 km downwind from the powerplant, we overestimate the concentrations of NOx by
www.atmos-chem-phys.net/12/189/2012/ Atmos. Chem. Phys., 12, 189–206, 2012

194 R. G. Stevens et al.: Sensitivity to background aerosol and meteorology
0 10 20 30 40 50
500
1000
1500
Alti
tude
[m]
a
Instantaneous New Particle Formation Rate Along Center of Plume [cm−3s−1]
0 10 20 30 40 50
Distance from source [km]
−10
−5
0
5
10
Cro
ss-w
ind
dist
ance
[km
]
b
0.00
0.15
0.30
0.45
0.60
0.75
0.90
1.05
1.20
1.35
1.50
log 1
0(N
ewP
artic
leFo
rmat
ion
Rat
e[c
m−3
s−1])
Fig. 1. Instantaneous snapshot of new-particle formation rates of the modeled Parish plume(a) along the cross-wind center and(b) at analtitude of 460 m. Model resolution is 400× 400× 40 m.
−4 −2 0 2 4 60
2
4
6
8
10
SO
2[p
pb/1
0]or
NOx
[ppb
]
a
−4 −2 0 2 4 60.0
0.5
1.0
1.5
2.0
2.5
3.0
H2S
O4
[mol
eccm−3
]
×108Trace Gases
SO2
NOx
H2SO4
−4 −2 0 2 4 63
10
30
100
300
1000
Par
ticle
diam
eter
[nm
] b
Observed Size Distribution
−4 −2 0 2 4 6Crosswind distance from plume center [km]
3
10
30
100
300
1000
Par
ticle
diam
eter
[nm
] c
Modelled Size Distribution
0.0
0.6
1.2
1.8
2.4
3.0
3.6
4.2
4.8
5.4lo
g 10(d
N/d
log 1
0Dp)
Fig. 2. Trace gas and aerosol concentrations along the second transect north of Parish, about 36 km from the power-plant. X-axes show flighttrack through cross-wind slice of plume. Model resolution is 400× 400× 40 m. (a) Trace gas concentrations. Observed concentrations asdashed lines, model results as solid lines. Shaded area indicates one standard deviation of the model results, due to turbulent fluctuations.(b) Observed aerosol number size distribution.(c) Modeled aerosol number size distribution.
Atmos. Chem. Phys., 12, 189–206, 2012 www.atmos-chem-phys.net/12/189/2012/
R. G. Stevens et al.: Sensitivity to background aerosol and meteorology 195
0 20 40 60 80 1000
5
10
15
20
25
30
35
SO
2[p
pb/1
0]or
NOx
[ppb
]
Particles and trace gas concentrations inside the plume
0 20 40 60 80 1000.0
0.5
1.0
1.5
2.0
2.5
H2S
O4
[mol
eccm−3
]
×108
aa SO2
NOx
H2SO4
0 20 40 60 80 100Distance from source [km]
104
105
106
Num
ber[
cm−3
]
bbTotal numberParticles > 10nm diameterParticles > 30nm diameterParticles > 50nm diameter
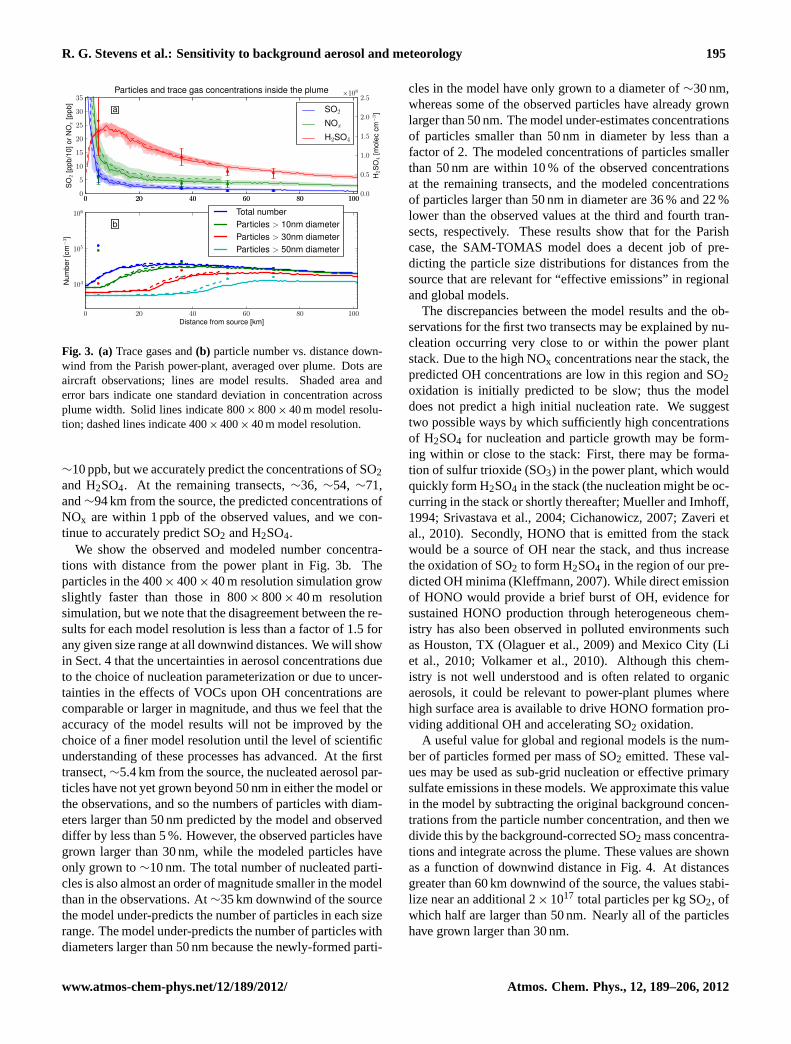
Fig. 3. (a)Trace gases and(b) particle number vs. distance down-wind from the Parish power-plant, averaged over plume. Dots areaircraft observations; lines are model results. Shaded area anderror bars indicate one standard deviation in concentration acrossplume width. Solid lines indicate 800× 800× 40 m model resolu-tion; dashed lines indicate 400× 400× 40 m model resolution.
∼10 ppb, but we accurately predict the concentrations of SO2and H2SO4. At the remaining transects,∼36, ∼54, ∼71,and∼94 km from the source, the predicted concentrations ofNOx are within 1 ppb of the observed values, and we con-tinue to accurately predict SO2 and H2SO4.
We show the observed and modeled number concentra-tions with distance from the power plant in Fig. 3b. Theparticles in the 400× 400× 40 m resolution simulation growslightly faster than those in 800× 800× 40 m resolutionsimulation, but we note that the disagreement between the re-sults for each model resolution is less than a factor of 1.5 forany given size range at all downwind distances. We will showin Sect. 4 that the uncertainties in aerosol concentrations dueto the choice of nucleation parameterization or due to uncer-tainties in the effects of VOCs upon OH concentrations arecomparable or larger in magnitude, and thus we feel that theaccuracy of the model results will not be improved by thechoice of a finer model resolution until the level of scientificunderstanding of these processes has advanced. At the firsttransect,∼5.4 km from the source, the nucleated aerosol par-ticles have not yet grown beyond 50 nm in either the model orthe observations, and so the numbers of particles with diam-eters larger than 50 nm predicted by the model and observeddiffer by less than 5 %. However, the observed particles havegrown larger than 30 nm, while the modeled particles haveonly grown to∼10 nm. The total number of nucleated parti-cles is also almost an order of magnitude smaller in the modelthan in the observations. At∼35 km downwind of the sourcethe model under-predicts the number of particles in each sizerange. The model under-predicts the number of particles withdiameters larger than 50 nm because the newly-formed parti-
cles in the model have only grown to a diameter of∼30 nm,whereas some of the observed particles have already grownlarger than 50 nm. The model under-estimates concentrationsof particles smaller than 50 nm in diameter by less than afactor of 2. The modeled concentrations of particles smallerthan 50 nm are within 10 % of the observed concentrationsat the remaining transects, and the modeled concentrationsof particles larger than 50 nm in diameter are 36 % and 22 %lower than the observed values at the third and fourth tran-sects, respectively. These results show that for the Parishcase, the SAM-TOMAS model does a decent job of pre-dicting the particle size distributions for distances from thesource that are relevant for “effective emissions” in regionaland global models.
The discrepancies between the model results and the ob-servations for the first two transects may be explained by nu-cleation occurring very close to or within the power plantstack. Due to the high NOx concentrations near the stack, thepredicted OH concentrations are low in this region and SO2oxidation is initially predicted to be slow; thus the modeldoes not predict a high initial nucleation rate. We suggesttwo possible ways by which sufficiently high concentrationsof H2SO4 for nucleation and particle growth may be form-ing within or close to the stack: First, there may be forma-tion of sulfur trioxide (SO3) in the power plant, which wouldquickly form H2SO4 in the stack (the nucleation might be oc-curring in the stack or shortly thereafter; Mueller and Imhoff,1994; Srivastava et al., 2004; Cichanowicz, 2007; Zaveri etal., 2010). Secondly, HONO that is emitted from the stackwould be a source of OH near the stack, and thus increasethe oxidation of SO2 to form H2SO4 in the region of our pre-dicted OH minima (Kleffmann, 2007). While direct emissionof HONO would provide a brief burst of OH, evidence forsustained HONO production through heterogeneous chem-istry has also been observed in polluted environments suchas Houston, TX (Olaguer et al., 2009) and Mexico City (Liet al., 2010; Volkamer et al., 2010). Although this chem-istry is not well understood and is often related to organicaerosols, it could be relevant to power-plant plumes wherehigh surface area is available to drive HONO formation pro-viding additional OH and accelerating SO2 oxidation.
A useful value for global and regional models is the num-ber of particles formed per mass of SO2 emitted. These val-ues may be used as sub-grid nucleation or effective primarysulfate emissions in these models. We approximate this valuein the model by subtracting the original background concen-trations from the particle number concentration, and then wedivide this by the background-corrected SO2 mass concentra-tions and integrate across the plume. These values are shownas a function of downwind distance in Fig. 4. At distancesgreater than 60 km downwind of the source, the values stabi-lize near an additional 2× 10¹⁷ total particles per kg SO2, ofwhich half are larger than 50 nm. Nearly all of the particleshave grown larger than 30 nm.
www.atmos-chem-phys.net/12/189/2012/ Atmos. Chem. Phys., 12, 189–206, 2012

196 R. G. Stevens et al.: Sensitivity to background aerosol and meteorology
20 40 60 80 100Distance from source [km]
1012
1013
1014
1015
1016
1017
1018
1019
1020
New
part
icle
spe
rSO
2em
itted
[#/k
g]
Normalised aerosol number
Total numberParticles > 10nm diameterParticles > 30nm diameterParticles > 50nm diameter
Fig. 4. Additional predicted particles per kg SO2 versus distancefrom the Parish power plant, summed over the plume. Model res-olution is 800× 800× 40 m. Dots indicate aircraft observations,solid lines indicate model results, dashed lines indicate the val-ues used by Dentener et al. (2006), and dashed-dotted lines indi-cate the values used by Adams and Seinfeld (2003). Coloring indi-cates size range of particles. Essentially all particles in the Denteneret al. (2006) distribution are larger than 50 nm, so all dashed linesoverlap one another.
For comparison, we also plot number of particles perkg SO2 that would result from the primary sulfate sizedistributions used in the AeroCom data set (Dentener etal., 2006) and in Adams and Seinfeld (2003). We notethat the stable values reached by our model are several or-ders of magnitude greater than the value from Dentener etal. (2006). This is because the model predicts that most newparticles nucleated within the plume will grow to sizes lessthan 50 nm, while Dentener et al. (2006) select a median di-ameter of 1 µm, yielding a much smaller number of muchlarger particles. The stable value for total particles reachedby the model is less than a third of that from Adams andSeinfeld (2003), but we predict an order of magnitude moreparticles larger than 30 nm and almost two orders of mag-nitude more particles larger than 50 nm. This indicates thatAdams and Seinfeld use a size distribution that includes amuch larger fraction of particle number at sizes smaller than30 nm than our model predicts for the specific case of theParish power plant.
As noted in Sect. 1, regional and global models commonlyassume that a constant fraction of SO2 emitted from thepower plant will oxidize to form H2SO4 and that a constantfraction of this H2SO4 condenses to new particles rather thanpre-existing particles. In Table 2, we show the fraction of theemitted SO2 that has oxidized to form H2SO4 within 50 km
of the source for each case and the fraction of the sulfateformed that has gone into the nucleation or growth of newparticles within 50 km of the source for each case. For thebase Parish case, we find that 9 % of the emitted SO2 is con-verted into sulfate within 50 km of the source, climbing to26 % within 100 km. We note that these numbers are greaterthan the fraction of SO2 that is emitted as “primary sulfate”from power plants in global models, which is generally 5 %or less (Adams and Seinfeld, 2003; Spracklen et al., 2005;Wang and Penner, 2009; Luo and Yu, 2011), and that the hor-izontal resolution in such models would generally be 100 sof km. However, this Parish case is a sunny summer daytimecase, which should favor the highest amount of sub-grid oxi-dation, whereas the global models chose a representative av-erage value. Furthermore, the emitted SO2 in global modelsthat is not oxidized immediately will continue to oxidize insubsequent time steps, so this low bias on sunny days may bepartially corrected for in the global models. Our model alsopredicts that 21 % of the sulfate mass will form or condenseonto new particles within 50 km from the source. This is atthe upper range of assumptions used for the fraction of sul-fate mass that condenses onto new particles in global models(Luo and Yu, 2011). However, both the fraction of SO2 thatoxidizes and the fraction of sulfate mass that forms new par-ticles are dependent on the conditions of each power-plantcase. We will explore the effects of changing some of theseconditions in Sect. 4.
3.2 Conesville
The Conesville power generation facility is located in a val-ley along the Muskingham river in Ohio, in a heavily forestedregion in the North-Eastern United States. Of the four unitsin operation on 6 August 2004, two had wet lime flue gasdesulfurization SO2 controls and low NOx burner technol-ogy with separated overfire air, and one had only low NOxburner technology (dry bottom only). All units had electro-static precipitators.
During the time of the measurement there was an un-stable boundary layer that was∼1300 m deep and wascapped by broken clouds. The wind was from the north at∼5 m s−1. The aerosol background was typical of a ruralcontinental area with an Aitken peak withdN/d log10Dp ∼
2 × 104 cm−3 at 20 nm anddN/d log10Dp ∼ 5 × 103 cm−3
at particle diameters away from this peak up to 200 nm.Above 200 nm the aerosol concentrations decreased. The to-tal number concentration was 1.7× 104 cm−3. The averagebackground mixing ratios of SO2 and NOx measured were∼0.6 ppbv and∼1.6 ppbv, respectively.
The measurements and model predictions of gas-phaseSO2, NOx, and H2SO4 along the first transect,∼24 km fromthe source, are shown in Fig. 5a. The modeled values areshown as solid lines, and the measured concentrations ofNOx and SO2 are shown as dashed lines. The measuredvalues of H2SO4 are shown as dots in this figure in order
Atmos. Chem. Phys., 12, 189–206, 2012 www.atmos-chem-phys.net/12/189/2012/

R. G. Stevens et al.: Sensitivity to background aerosol and meteorology 197
Table 2. Fraction of SO2 oxidized and fraction of produced H2SO4 that condenses onto new particles rather than pre-existing particleswithin 50 km for each model simulation. The labels 400× 400× 40 m and 800× 800× 40 m refer to the two model resolutions used in thisstudy. TheA-6, Vehk, Meri, and Yu10 nucleation schemes are discussed in Sect. 4.1. The REM, MAR, and URB aerosol backgrounds arediscussed in Sect. 4.2. The sunny and cloudy cases and the high-VOC and low-VOC cases are discussed in Sect. 4.3.
Fraction of SO2 oxidized Fraction of produced H2SO4 thatcondenses onto new particles
rather than pre-existing particles
Parish base case 9 % 21 %(400× 400× 40 m, REM-sunny,A-7, high-VOC)Parish (800× 800× 40 m) 11 % 18 %Parish A-6 9 % 33 %Parish Vehk 9 % �1 %Parish Meri 9 % 42 %Parish Yu10 9 % 13 %Parish REM-cloudy 0.8 % �1 %Parish MAR-sunny 9 % 90 %Parish MAR-cloudy 0.8 % 75 %Parish URB-sunny 9 % �1 %Parish URB-cloudy 0.8 % �1 %Parish low-VOC 6 % 9 %Conesville (400× 400× 40 m) 4 % 13 %Conesville (800× 800× 40 m) 4 % 12 %
to indicate the lower time resolution of those measurements.The observations show two separate plumes along this tran-sect, which cannot be predicted by the current version ofthe model. The two plumes are also visible in the observedsize distribution, shown in Fig. 5b. The SO2-NOx ratiosfor the two plumes are similar, and neither plume was ob-served upwind of the power plant, which leads us to be-lieve that both plumes originate from the Conesville powerplant. Since the power-plant stacks are much closer thanthe distance between the center of the plumes (∼3 km), theplume must have bifurcated either due to complex flows atthe stack (Fanaki, 1975) or due to topographic effects fromhills in the region. The boundary layer at the Conesvillepower generation facility was very stable until sunrise,∼5 hbefore the observations were made, which may favor bifur-cation of the plume at the stack. We note that the plumewidth and the mixing ratios of NOx and SO2 predicted bythe model do agree well with those observed in either of thetwo plumes, although the model predictions of H2SO4 wereabout double those of the measurements. If both plumes aredue to the Conesville power plant, then it would seem thatroughly half the mass of SO2 and NOx are missing from themodel predictions. This may be due to an inaccuracy in theemissions that we use in the model or an incorrect predic-tion of the boundary-layer height in the model. If the pre-dicted boundary-layer height was too large, the actual emis-sions from the power plant would be vertically diluted to agreater extent in the model, which would yield lower mix-
ing ratios along the transect. Integrating the mixing ratiosof NOx and SO2 across the second and third (farther) tran-sects yields much smaller discrepancies than those observedat the first transect. The separation of the two plumes is lessdistinct at the second transect,∼40 km from the source, inboth the trace gas observations and the aerosol size distribu-tion (not shown). Under unstable conditions, vertical shearin wind direction and turbulent diffusion is likely to mix twoadjacent plumes together.
The modeled number distribution for the first transectsouth of Conesville is shown in Fig. 5c. The peak at∼20 nmmatches the peak in the observed number distribution. How-ever, there is an observed increase within the plume inthe number of particles with diameters between 40 nm and200 nm that is not predicted by the model. In Fig. 6b, weshow the total number concentration, and the number con-centration of particles larger than 10, 30, and 50 nm in diam-eter. The unpredicted increase in 40 nm to 200 nm particlesis responsible for the under-prediction of particles larger than30 and 50 nm at the first and second transects. By the thirdtransect, a significant fraction of the particles from the initialnucleation burst have grown larger than 30 nm, and as theseparticles from the nucleation burst now dominate the numberconcentration in this size range, the model predictions arewithin 1 % of the observed number concentration of particleslarger than 30 nm. As in the Parish case, the model predic-tions for number concentrations of all but the largest parti-cles agree well (within 10 %) with the observations beyond
www.atmos-chem-phys.net/12/189/2012/ Atmos. Chem. Phys., 12, 189–206, 2012

198 R. G. Stevens et al.: Sensitivity to background aerosol and meteorology
−4 −2 0 2 40
2
4
6
8
10
SO
2[p
pb/1
0]or
NOx
[ppb
]
a
−4 −2 0 2 40.0
0.5
1.0
1.5
2.0
2.5
3.0
H2S
O4
[mol
eccm−3
]
×108
SO2
NOx
H2SO4
−4 −2 0 2 43
10
30
100
300
1000
Par
ticle
diam
eter
[nm
] b
Observed Size Distribution
−4 −2 0 2 4Crosswind distance from plume center [km]
3
10
30
100
300
1000
Par
ticle
diam
eter
[nm
] c
Modelled Size Distribution
0.0
0.6
1.2
1.8
2.4
3.0
3.6
4.2
4.8
5.4
log 1
0(d
N/d
log 1
0Dp)
Fig. 5. Trace gas and aerosol concentrations along the first transect south of Conesville, about 24 km from the power-plant. X-axes showflight track through cross-wind slice of plume. Model resolution is 400× 400× 40m. (a) Trace gas concentrations. Observed concentrationsas dashed lines (SO2 and NOx) and dots (H2SO4), model results as a solid line. Shaded area indicates one standard deviation of the modelresults, due to turbulent fluctuations.(b) Observed aerosol number size distribution.(c) Modeled aerosol number size distribution.
0 20 40 60 80 1000
2
4
6
8
10
12
14
SO
2[p
pb/1
0]or
NOx
[ppb
]
Particles and trace gas concentrations inside the plume
0 20 40 60 80 1000.0
0.5
1.0
1.5
2.0
2.5
3.0
3.5
4.0
4.5
H2S
O4
[mol
eccm−3
]
×108
a SO2
NOx
H2SO4
0 20 40 60 80 100Distance from source [km]
104
105
106
Num
ber[
cm−3
]
bTotal numberParticles > 10nm diameterParticles > 30nm diameterParticles > 50nm diameter
Fig. 6. (a) Trace gases and(b) particle number versus dis-tance downwind from the Conesville power-plant, averaged overthe plume. Dots are aircraft observations; lines are model re-sults. Shaded area and error bars indicate one standard devia-tion in concentration across plume width. Model resolution is800× 800× 40 m.
50 km from the power plant, although the concentrations ofparticles larger than 50 nm are under-predicted by 27 %.
The concentrations of trace gases with distance from thepower plant are shown in Fig. 6a. The concentrations ofSO2 and NOx for the first two transects are well predicted bythe model. At the third transect,∼68 km from the source,the observed plume is much wider and more dilute thanthe modeled plume, and as a consequence, the model over-predicts the NOx concentrations within the plume. We seethe opposite trend in H2SO4 concentrations: the model over-predicted the concentrations of H2SO4 for the first two tran-sects, but the observed concentration of H2SO4 increasesat the third transect, and the modeled concentration agreeswell with this observed value. An over-prediction of H2SO4would yield larger nucleation and growth rates of aerosolparticles, and thus should increase particle number concen-trations. However, as discussed above, the predicted parti-cle number concentrations at the first two transects are lessthan those observed in each size range. There are severalpossible explanations for these seemingly contradictory fea-tures. During the measurement campaign, there were brokenclouds present, which would make the penetration of UV ra-diation into the boundary layer highly variable in space andtime. Consequently, OH production rates, and thus H2SO4
Atmos. Chem. Phys., 12, 189–206, 2012 www.atmos-chem-phys.net/12/189/2012/
R. G. Stevens et al.: Sensitivity to background aerosol and meteorology 199
production rates would be highly variable in space and time.It is possible that at the time of measurement of the first twotransects, cloudy conditions had lowered the OH productionrate, and the H2SO4 concentration had been depleted belowthe mean concentration at those locations. We will discussfurther the effects of cloudy conditions upon sulfate produc-tion in Sect. 4.3. It is also possible that the effect of the over-prediction of H2SO4 upon aerosol concentrations has beencompensated by an under-prediction of the nucleation rate.We will show in Sect. 4.1 that the predicted aerosol num-ber concentrations could increase if a different nucleationparameterization was used.
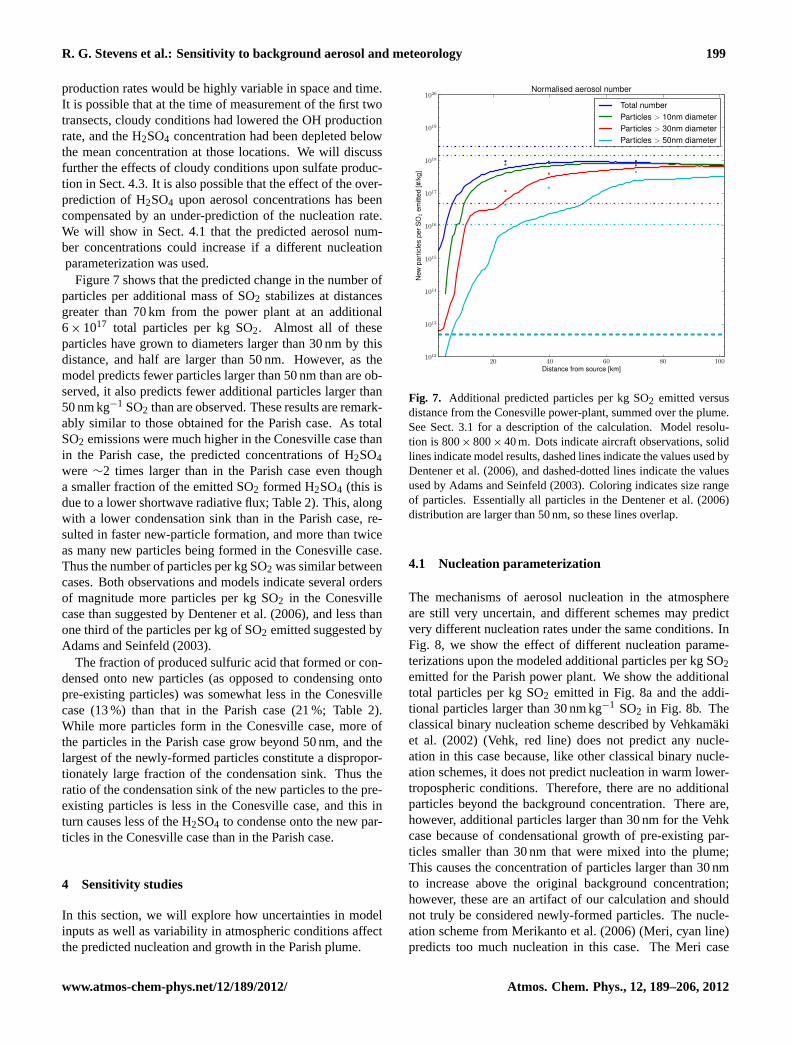
Figure 7 shows that the predicted change in the number ofparticles per additional mass of SO2 stabilizes at distancesgreater than 70 km from the power plant at an additional6× 1017 total particles per kg SO2. Almost all of theseparticles have grown to diameters larger than 30 nm by thisdistance, and half are larger than 50 nm. However, as themodel predicts fewer particles larger than 50 nm than are ob-served, it also predicts fewer additional particles larger than50 nm kg−1 SO2 than are observed. These results are remark-ably similar to those obtained for the Parish case. As totalSO2 emissions were much higher in the Conesville case thanin the Parish case, the predicted concentrations of H2SO4were ∼2 times larger than in the Parish case even thougha smaller fraction of the emitted SO2 formed H2SO4 (this isdue to a lower shortwave radiative flux; Table 2). This, alongwith a lower condensation sink than in the Parish case, re-sulted in faster new-particle formation, and more than twiceas many new particles being formed in the Conesville case.Thus the number of particles per kg SO2 was similar betweencases. Both observations and models indicate several ordersof magnitude more particles per kg SO2 in the Conesvillecase than suggested by Dentener et al. (2006), and less thanone third of the particles per kg of SO2 emitted suggested byAdams and Seinfeld (2003).
The fraction of produced sulfuric acid that formed or con-densed onto new particles (as opposed to condensing ontopre-existing particles) was somewhat less in the Conesvillecase (13 %) than that in the Parish case (21 %; Table 2).While more particles form in the Conesville case, more ofthe particles in the Parish case grow beyond 50 nm, and thelargest of the newly-formed particles constitute a dispropor-tionately large fraction of the condensation sink. Thus theratio of the condensation sink of the new particles to the pre-existing particles is less in the Conesville case, and this inturn causes less of the H2SO4 to condense onto the new par-ticles in the Conesville case than in the Parish case.
4 Sensitivity studies
In this section, we will explore how uncertainties in modelinputs as well as variability in atmospheric conditions affectthe predicted nucleation and growth in the Parish plume.
20 40 60 80 100Distance from source [km]
1012
1013
1014
1015
1016
1017
1018
1019
1020
New
part
icle
spe
rSO
2em
itted
[#/k
g]
Normalised aerosol number
Total numberParticles > 10nm diameterParticles > 30nm diameterParticles > 50nm diameter
Fig. 7. Additional predicted particles per kg SO2 emitted versusdistance from the Conesville power-plant, summed over the plume.See Sect. 3.1 for a description of the calculation. Model resolu-tion is 800× 800× 40 m. Dots indicate aircraft observations, solidlines indicate model results, dashed lines indicate the values used byDentener et al. (2006), and dashed-dotted lines indicate the valuesused by Adams and Seinfeld (2003). Coloring indicates size rangeof particles. Essentially all particles in the Dentener et al. (2006)distribution are larger than 50 nm, so these lines overlap.
4.1 Nucleation parameterization
The mechanisms of aerosol nucleation in the atmosphereare still very uncertain, and different schemes may predictvery different nucleation rates under the same conditions. InFig. 8, we show the effect of different nucleation parame-terizations upon the modeled additional particles per kg SO2emitted for the Parish power plant. We show the additionaltotal particles per kg SO2 emitted in Fig. 8a and the addi-tional particles larger than 30 nm kg−1 SO2 in Fig. 8b. Theclassical binary nucleation scheme described by Vehkamakiet al. (2002) (Vehk, red line) does not predict any nucle-ation in this case because, like other classical binary nucle-ation schemes, it does not predict nucleation in warm lower-tropospheric conditions. Therefore, there are no additionalparticles beyond the background concentration. There are,however, additional particles larger than 30 nm for the Vehkcase because of condensational growth of pre-existing par-ticles smaller than 30 nm that were mixed into the plume;This causes the concentration of particles larger than 30 nmto increase above the original background concentration;however, these are an artifact of our calculation and shouldnot truly be considered newly-formed particles. The nucle-ation scheme from Merikanto et al. (2006) (Meri, cyan line)predicts too much nucleation in this case. The Meri case
www.atmos-chem-phys.net/12/189/2012/ Atmos. Chem. Phys., 12, 189–206, 2012

200 R. G. Stevens et al.: Sensitivity to background aerosol and meteorology
10 20 30 40 501012
1013
1014
1015
1016
1017
1018
1019
1020
New
part
icle
spe
rSO
2em
itted
[#/k
g]
aaaaa
Normalised aerosol number
A-6A-7VehkMeriYu10
10 20 30 40 50Distance from source [km]
1012
1013
1014
1015
1016
1017
1018
1019
1020
New
part
icle
s>
30nm
perS
O2
emitt
ed[#
/kg]
bbbbb
Adams & Seinfeld (2003)Dentener et al. (2006)
Fig. 8. (a) Total additional predicted particles and(b) additionalparticles larger than 30 nm kg−1 SO2 versus distance from theParish power-plant, using several nucleation schemes. See Sect. 3.1for a description of the calculation. Values are averaged over theplume. Model resolution is 400× 400× 40 m. Black dots indi-cate aircraft observations, solid colored lines indicate model re-sults, black dashed lines indicate the values used by Dentener etal. (2006), and black dashed-dotted lines indicate the values usedby Adams and Seinfeld (2003).
has a large number of particles close to the source that de-creases away from the source due to coagulation. The nu-cleation rate predicted by activation-type nucleation is sen-sitive to the fitting parameterA (Eq. 1). However, for val-ues ofA (A = 10−7 s−1: denoted byA-7, green line, andA = 10−6 s−1: denoted byA-6, blue line) that typically de-scribe nucleation in continental boundary-layer conditions(Spracklen et al., 2008; Sihto et al., 2006), the mediandiameter of the nucleated particles and the total number ofparticles agree within a factor of 2 with the observations de-scribed here, excepting the first transect. We have no mea-surements of the rate of ion-pair production for any of ourcases, and therefore we have tested the ion-mediated nucle-ation scheme described by Yu (2010b) while prescribing 5,10, and 15 ion pairs cm−3 s−1, which we believe to be a rea-sonable range (Harrison and Carslaw, 2003). We found thatthe resultant size distribution differed, but not greatly overthis range. The 10 ion pairs cm−1 s−1 case is shown in Fig. 8as Yu (2010), the purple line. The Yu scheme somewhatunder-predicts the number of new particles for the Parishcase.
When excluding the Vehk case that did not predict any nu-cleation, the choice of nucleation scheme results in an uncer-tainty of about one order of magnitude in the total number
particles 40 km downwind and onward. There is a slightlysmaller uncertainty in the number of particles larger than30 nm at 30 km downwind and onward. This highlights theimportance of the nucleation scheme in predicting nucleationin the plumes. The activation nucleation scheme with anA-factor of 10−7 s−1 generally performed the best againstobservations for the Parish and Conesville cases and thus itwas used throughout the case studies presented earlier. Thisshows that for these two case studies, the nucleation in theplume had a similar dependence on sulfuric acid as has beenobserved in both continental field observations and lab stud-ies (Sipila et al., 2010). However, given that the conditionsare very different in the plume nucleation cases relative toregional-scale nucleation events, we stress that this similar-ity in sulfuric-acid dependence does not imply that the nu-cleation mechanisms are necessarily the same.
There is also an uncertainty of more than a factor of 3 inthe fraction of produced sulfate that condenses onto the newparticles rather than pre-existing particles (Table 2). How-ever, only the Yu10 case predicted fractions within the rangetested by Luo and Yu (2011). We note that the values chosenby Luo and Yu were intended to apply to all point sources ofSO2 globally under all atmospheric conditions, and that thefraction of sulfate in new particles in this particular case mayfar exceed that of an average case for reasons independent ofthe nucleation mechanism (e.g. large amounts of solar radia-tion and moderate amounts of pre-existing aerosol).
4.2 Background aerosol
In order to test the sensitivity of the model to the pre-existingaerosol size distribution, we performed additional modelsimulations of the Parish case with background aerosol typi-cal of a clean marine environment (MAR), and with back-ground aerosol typical of a polluted urban environment(URB; (The original simulations are abbreviated REM for re-mote continental). We described the pre-existing backgroundaerosol using three lognormal modes, with the number con-centrations, median diameters, and geometric standard de-viations as listed in Seinfeld and Pandis (2006), and repro-duced in Table 3 of this work. The model resolution was400× 400× 40 m, and activation-type nucleation with an ac-tivation constant ofA = 10−7 s−1 was used for these simula-tions.
The resultant additional particles per kg SO2 emitted areshown in Fig. 9 (“sunny” cases, the “cloudy” cases will bedescribed later). The MAR-sunny case has larger increases inparticle number than the base case (REM-sunny) throughoutthe life of the plume. The low concentration of backgroundaerosol in the MAR-sunny case implies a low condensationsink, and hence more nucleation, but nucleation-mode self-coagulation tends to dampen this increase in number. Thelow background condensation sink also leads to only a smallfraction of the H2SO4 condensing onto the existing particles,and 90 % condenses onto the new particles (Table 2). The
Atmos. Chem. Phys., 12, 189–206, 2012 www.atmos-chem-phys.net/12/189/2012/

R. G. Stevens et al.: Sensitivity to background aerosol and meteorology 201
10 20 30 40 501012
1013
1014
1015
1016
1017
1018
1019
1020
New
part
icle
spe
rSO
2em
itted
[#/k
g]
aaaaaa
Normalised aerosol number
REM-sunnyREM-cloudy
MAR-sunnyMAR-cloudy
URB-sunnyURB-cloudy
10 20 30 40 50Distance from source [km]
1012
1013
1014
1015
1016
1017
1018
1019
1020
New
part
icle
s>
30nm
perS
O2
emitt
ed[#
/kg]
bbbbbb
Adams & Seinfeld (2003)Dentener et al. (2006)
Fig. 9. (a) Total additional predicted particles and(b) additionalparticles larger than 30 nm kg−1 SO2 versus distance from theParish power-plant, for different background aerosol size distribu-tions and differing rates of OH production. See Sect. 3.1 for a de-scription of the calculation. Values are averaged over the plume.Model resolution is 400× 400× 40 m. Black dots indicate air-craft observations, solid colored lines indicate model results, blackdashed lines indicate the values used by Dentener et al. (2006), andblack dashed-dotted lines indicate the values used by Adams andSeinfeld (2003). Particle numbers decreased for the REM-cloudy,URB-sunny, and URB-cloudy cases, so these lines are not visible.
newly-formed particles grow to larger sizes than in the baseREM-sunny case, reaching 40 nm at 36 km from the source,at which point the particles in the base case had only reached30 nm.
When the model is run with an urban background (URB-sunny), particle number concentrations actually decrease be-low their initial values, and therefore the line for the ur-ban background case is not visible in Fig. 9. The pollutedbackground provides a large condensation sink, and nearlyall the H2SO4 that is formed condenses onto these particles.There is thus a low concentration of H2SO4 in the plumeand a low nucleation rate. The large number of small parti-cles in the urban background also yield fast coagulation ratesboth inside and outside of the plume. The increase in par-ticle number due to nucleation within the plume (which ismuch lower than in the REM-sunny and MAR-sunny cases)is therefore less than the decrease in particle number due tocoagulation.
These results show that the number of new particlesformed in plumes depends greatly on the pre-existingaerosols. Next-generation parameterizations of plume sub-grid particle formation must account for the amount of pre-existing aerosol.
4.3 Concentration of OH
As discussed in Sect. 2, we use a parameterization to predictthe concentration of OH based on the downward shortwaveradiative flux and the concentration of NOx in the model. Totest the sensitivity of the model to changes in radiation, wehave performed model simulations with the downward short-wave radiative flux scaled to one third of its value in the baseParish case. In these cases, we simulate the effect of cloudyovercast conditions upon OH production. These results arealso shown in Fig. 9 (compare the “cloudy” cases to the“sunny” cases for each background aerosol concentration).H2SO4 production is suppressed under these cloudy condi-tions (0.8 % of the SO2 has oxidized at 50 km compared to9 % for the sunny cases; Table 2), and therefore new-particleformation and growth is also suppressed. Regardless of theaerosol background, there are fewer particles formed withinthe plume. For the base case remote-continental aerosolbackground (REM-cloudy), very little nucleation occurs un-der these cloudy conditions, and the nucleated particles donot grow beyond 6 nm. Like the URB-sunny case describedabove, more particles are lost to coagulation than are formedby nucleation, and thus the line for the REM-cloudy case isnot visible in Fig. 9. The URB-cloudy case is also not vis-ible for the same reason. Under clean marine aerosol back-ground conditions (MAR-cloudy), similar numbers of par-ticles form, but the particles grow more slowly and do notreach the same size as in the MAR-sunny case. In the MAR-cloudy case the particles grow beyond 30 nm in diameter fur-ther downwind of the plume’s source and a smaller fractionof the particles grow larger than 30 nm in diameter. Theseresults show that we would expect very little particle forma-tion and growth at night in the plumes except for cases whereSO3 is emitted from the plant (e.g. Zaveri et al., 2010).
We do not yet explicitly account for the effect of VOCsupon OH concentrations within the model. In order to de-termine the sensitivity of our results to this uncertainty, weran our model under low-VOC conditions (as described inSect. 2). The concentrations of trace gases and particle num-ber concentrations are shown in Fig. 10. For a constantshortwave radiation flux, maximum steady-state concentra-tions of OH occur at a NOx concentration that depends onthe concentrations of VOCs. Under high-VOC conditions,this NOx concentration that yields the maximum concentra-tion of OH will be larger than under low-VOC conditions.The parameterization we use to estimate concentrations ofOH yields a maximum concentration of OH for NOx mixingratios of 1.2 ppbv under low-VOC conditions, and 2.0 ppbvunder high-VOC conditions. Since the area inside the plumehas very high mixing ratios of NOx, larger than 5 ppbv in theParish case (even far from the source), the mixing ratios ofNOx will be closer to those that yield the maximum possibleconcentrations of OH under high-VOC conditions than underlow-VOC conditions (all other parameters are held constant).Because of these high NOx mixing ratios, more H2SO4 is
www.atmos-chem-phys.net/12/189/2012/ Atmos. Chem. Phys., 12, 189–206, 2012

202 R. G. Stevens et al.: Sensitivity to background aerosol and meteorology
Table 3. Background aerosol size distributions used for sensitivity studies. From Seinfeld and Pandis (2006).
Marine UrbanMode 1 Mode 2 Mode 3 Mode 1 Mode 2 Mode 3
Number concentration [cm−3] 133 66.6 3.1 9.93× 10⁴ 1.11× 10³ 3.64× 10⁴
Median diameter [µm] 0.01 0.27 0.58 0.01 0.01 0.05Geometric standard deviation 4.54 1.62 2.49 1.76 4.63 2.17
0 10 20 30 40 500
5
10
15
20
25
30
35
SO
2[p
pb/1
0]or
NOx
[ppb
]
Particles and trace gas concentrations inside the plume
0 10 20 30 40 500.0
0.5
1.0
1.5
2.0
2.5
H2S
O4
[mol
eccm−3
]
×108
aa SO2
NOx
H2SO4
0 10 20 30 40 50Distance from source [km]
104
105
106
Num
ber[
cm−3
]
bbTotal numberParticles > 10nm diameterParticles > 30nm diameterParticles > 50nm diameter
Fig. 10. (a)Trace gases and(b) particle number vs. distance down-wind from the Parish power plant averaged over the plume for dif-fering rates of OH production due to different assumptions of VOCconcentrations. Dots are aircraft observations; lines are model re-sults. Shaded area and error bars indicate one standard deviationin concentration across plume width. The results of the high-VOCcase are shown as a solid line, and the results of the low- VOC caseare shown as a dashed line. Model resolution is 400× 400× 40 m.
produced under the high-VOC conditions than under the low-VOC conditions. Under the high-VOC conditions, 9 % of theSO2 has oxidized at 50 km from the source, while 6 % of theSO2 oxidized under low-VOC conditions (Table 2). Note thatthe predicted concentration of NOx is unchanged betweencases and SO2 is only slightly changed. The higher concen-trations of H2SO4 in the high-VOC case result in more nucle-ation and growth, and thus higher concentrations of aerosolsat all sizes. In the low-VOC case, few particles grow to di-ameters larger than 30 nm within 50 km of the source, andalmost no particles grow beyond 50 nm.
Although these effects of VOCs on the size distributionare not as strong as the effects of changes in the back-ground aerosol concentrations or switching between sunnyand cloudy conditions as shown above, they too are impor-tant for predicting the formation and growth of particles inplumes. An additional potentially important effect of at-mospheric organics that was not tested here is the effect of
secondary organic aerosol (SOA) formation in the plumes.Condensing SOA will help grow the ultrafine mode to CCN-relevant sizes (Riipinen et al., 2011 and Pierce et al., 2011).The lack of SOA in our model may be part of the reason thatour model predictions of the concentration of particles largerthan 50 nm were biased low compared with the observations.Early in the plume, H2SO4 formation should dominate con-densational growth; however, as the plume is diluted withbackground air, SOA may dominate the growth of particlesin some cases. Thus, it will be important in future work to ex-plore the effect of SOA in power-plant plume microphysics.
5 Conclusions
We have implemented online aerosol microphysics into anLES/CRM model. We have shown, through two case stud-ies, that the model provides reasonable predictions of new-particle formation and growth within the plume at distancesfurther than 10–20 km from the source. For both cases, wepredicted about one order of magnitude fewer total particlesproduced for each kg SO2 emitted than the assumptions usedby Adams and Seinfeld (2003) and related studies, but sev-eral orders of magnitude more particles per kg SO2 than indi-cated in Dentener et al. (2006). This result was robust acrossall of the nucleation parameterizations we tested (except forclassical binary nucleation, which predicted no new-particleformation in these warm conditions).
We have run the model using two horizontal resolutions,400 m× 400 m and 800 m× 800 m. The discrepancy in thenumber of particles predicted was less than a factor of 1.5.This was less than the uncertainty in the number of parti-cles produced due to uncertainties in VOCs or different nu-cleation parameterizations. We therefore expect that using amodel resolution finer than 800 m× 800 m horizontal resolu-tion would not enhance the accuracy of the model predictionsat this time.
The two case studies shown here are certainly not repre-sentative of all cases, and we have included a small numberof sensitivity studies to show how our results would differunder alternative aerosol background conditions and lowerOH production rates. We find that for polluted backgroundconditions, new-particle formation can be negligible. Witha clean marine background, total particle numbers are about
Atmos. Chem. Phys., 12, 189–206, 2012 www.atmos-chem-phys.net/12/189/2012/

R. G. Stevens et al.: Sensitivity to background aerosol and meteorology 203
a factor of 2 larger than the remote-continental base case,and the newly-formed particles grow to larger sizes. If wereduce the production rate of OH, as it would be reducedunder cloudy overcast conditions, we see less new-particleformation and slower growth of all particles. In the sim-ulated cloudy conditions, nucleation was negligible in boththe moderately polluted remote continental background caseand the very polluted urban background case.
We found that 9 % and 4 % of the emitted SO2 oxidizedto form H2SO4 within 50 km of the source in the Parish andConesville cases, respectively. If the production rate of OHis decreased in the Parish case according to cloudy or low-VOC conditions, the fraction of SO2 oxidized decreases from9 % to 0.8 % or 6 %, respectively. The base Parish case andthe low-VOC Parish case values are larger than those cho-sen in many studies (Adams and Seinfeld, 2003; Spracklenet al., 2005; Wang and Penner, 2009; Luo and Yu, 2011).However, this is implicitly accounted for to some degree bythe oxidation of the emitted SO2 in subsequent time steps inthese models, and the cases here were for daytime conditionswhich would have above-average oxidation rates.
The work in this paper highlights how new-particle forma-tion and growth in power-plant plumes (and anthropogenicsulfur plumes in general) depend greatly on meteorologi-cal conditions and the pre-existing particle concentrations.A power plant with constant emissions may have efficientnucleation and growth in its plume on one day, but negligi-ble nucleation and growth on another. These results showthe need for a new generation of schemes for accountingfor particle formation in sub-grid sulfur plumes. Other fac-tors that were not tested here that may be important in theplume microphysics are SO2 and NOx emissions rates, pri-mary particle emissions (either as ash or H2SO4 formed inthe plant/stack), SOA formation in the plume, wind speedsand atmospheric stability. These should also be addressed infuture work.
Using the model described here, it is our intent to developa computationally efficient, but physically based, coal-firedpower plant emissions parameterization that depends on theemissions from the stack, the mean meteorological condi-tions and the mean background aerosol and gas concentra-tions that can be resolved by regional and global models.This parameterization will allow for more accurate predic-tions of aerosol size distributions and a greater confidence inthe effects of aerosols in climate and health studies.
Until this parameterization is available, it may be wise toconsider separately conditions under which it is likely therewill rarely be significant aerosol nucleation within the plume.Based on our sensitivity studies, when OH concentrations arevery low (for instance, at night) or when the background con-densation sink is very high, it seems prudent to assume thatall H2SO4 formed within the plume will condense onto theexisting background aerosol, and that therefore aerosol massshould be increased without increasing number. Under otherconditions, it may be preferable to assume the size distribu-
tion used by Adams and Seinfeld (2003) to the size distribu-tion assumed by Dentener et al. (2006), as the former wascloser to the results we obtained for every case where par-ticle number concentration increased inside the plume. Wewish to stress that this does not imply that it will be the bet-ter assumption under all conditions, but our results suggestthat it may be the better assumption under conditions whennucleation does occur.
Appendix A
OH Parameterization Details
As mentioned in Sect. 2, the OH parameterization used inthe SAM-TOMAS model is an empirical fit to the results ofmany simulations from the detailed time-dependent photo-chemical box model described by Olson et al. (2006). Thesesimulations span conditions observed below 1 km over theeastern United States as sampled from the NASA DC-8during the Intercontinental Chemical Transport Experiment–North America (INTEX-A) field campaign (Singh et al.,2006). The OH parameterization fits the detailed model cal-culations well for all simulations except those with high lev-els of isoprene. Thus, the initial parameterization was de-rived based on calculations for conditions where the observedisoprene mixing ratio was 150 pptv or less. This base OH pa-rameterization is referred to as the “low-VOC” case. The OHparameterization works as follows. First, we set variablesx
andy:
x = log([NOx])−0.195 (A1)
y =dswrf
S0 ·T(A2)
where [NOx] is the mixing ratio of NOx in ppbv, dswrfis the downward shortwave radiative flux at the surface inW m−2, S0 is the solar constant at the top of the atmosphere,1370 W m−2, andT is an assumed transmittance of the clearatmosphere, 0.76. The first polynomial (P1) estimates theshape of the OH versus NOx relationship:
P1= −0.014x6+0.0027x5
+0.1713x4−0.0466x3 (A3)
−0.7893x2−0.1739x +6.9414
The second polynomial scales the curve based on dswrf:
P2= (−1345y3+4002y2
−471.8y +42.72)×104 (A4)
Finally, we calculate the concentration of OH in moleculescm−3:
[OH] = 0.82·10P1×log(P2)/6.8 (A5)
www.atmos-chem-phys.net/12/189/2012/ Atmos. Chem. Phys., 12, 189–206, 2012

204 R. G. Stevens et al.: Sensitivity to background aerosol and meteorology
One process not accounted for in the OH parameterizationis the effect of the presence of large amounts of highly reac-tive VOCs on OH production. This was revealed by the dif-ficulty in devising a parameterization that could encompassthe OH calculations associated with high isoprene mixing ra-tios during INTEX-A. The additional peroxy radicals fromisoprene oxidation induce a shift in the peak OH productionto a higher NOx level. To understand the potential effect ofhigh VOC concentrations in our study, a second parameter-ization, referred to as the “high-VOC” case, was developedbased on an isoprene mixing ratio of 1.5 ppbv (the 95th per-centile value observed during INTEX-A). This parameteriza-tion uses the the following equation forx (all other equationsthe same):
x = log([NOx]×0.6)−0.195 (A6)
In this way, we shift the concentration of NOx that corre-sponds to the peak concentration of OH from∼1.2 ppbv inthe low-VOC case to∼2.0 ppbv in the high-VOC case. Dueto the proximity of our test cases to known biogenic and an-thropogenic sources of VOCs, we assume high-VOC condi-tions for purposes of calculating OH in all the model runsdescribed below, except where explicitly stated otherwise.In the Parish case, the plume passes over major roadwaysand urban sprawl surrounding Houston; In the Conesvillecase, the plume passes over a heavily forested region dur-ing late summer when biogenic emissions would be high.We perform sensitivity simulations to test this high-VOCassumption.
As a final note regarding the calculation of OH, it is impor-tant to point out that field observations suggest that currentchemical mechanisms tend to underestimate OH levels in en-vironments of high NOx (Shen et al., 2009 and referencestherein) and high isoprene (Lelieveld et al., 2008; Hofzuma-haus et al., 2009; Stone et al., 2011). While adequate chem-ical mechanisms to represent these field observations do notexist, it is reasonable to expect that true peak OH concentra-tions are shifted to higher NOx than these calculations wouldsuggest.
Acknowledgements.This research was funded by the Elec-tric Power Research Institute (EPRI). We would like to thankMarat Khairoutdinov of the School of Marine and AtmosphericSciences, Stony Brook University, for access to and help withthe System for Atmospheric Modeling. NCEP Reanalysis dataprovided by the NOAA/OAR/ESRL PSD, Boulder, Colorado,USA, from their Web site athttp://www.esrl.noaa.gov/psd/.
Edited by: V.-M. Kerminen
References
Adams, P. J. and Seinfeld, J. H.: Predicting global aerosol size dis-tributions in general circulation models, J. Geophys. Res., 107,4370,doi:10.1029/2001JD001010, 2002.
Adams, P. J. and Seinfeld, J. H.: Disproportionate im-pact of particulate emissions on global cloud condensa-tion nuclei concentrations, Geophys. Res. Lett., 30, 1239,doi:10.1029/2002GL016303, 2003.
Albrecht, B.: Aerosols, Cloud Microphysics, and FractionalCloudiness, Science, 245, 1227–1230, 1989.
Brock, C. A., Washenfelder, R. A., Trainer, M., Ryerson, T. B.,Wilson, J. C., Reeves, J. M., Huey, L. G., Holloway, J. S., Parrish,D. D., Hubler, G., and Fehsenfeld, F. C.: Particle growth in theplumes of coal-fired power plants, J. Geophys. Res., 107, 4155,doi:10.1029/2001JD001062, 2002.
Brown, S. S., Dube, W. P., Osthoff, H. D., Stutz, J., Ryerson, T. B.,Wollny, A. G., Brock, C. A., Warneke, C., De Gouw, J. A., At-las, E., Neuman, J. A., Holloway, J. S., Lerner, B. M., Williams,E. J., Kuster, W. C., Goldan, P. D., Angevine, W. M., Trainer,M., Fehsenfeld, F. C., and Ravishankara, A. R.: Vertical pro-files in NO3 and N2O5 measured from an aircraft: Results fromthe NOAA P-3 and surface platforms during the new englandair quality study 2004, J. Geophys. Res.-Atmos., 112, D22304,doi:10.1029/2007JD008883, 2007.
Charlson, R. J., Schwartz, S. E., Hales, J. M., Cess, R. D., Coakley,J. A., Hansen, J. E., and Hofmann, D. J.: Climate Forcing byAnthropogenic Aerosols, Science, 255, 423–430, 1992.
Cichanowicz, J. E.: Estimating total sulfuric acid emissions fromstationary power plants, Rep. 1016384, Electr. Power Res. Inst.,Palo Alto, Calif, 2008.
Clean Air Markets – Data and Maps:http://camddataandmaps.epa.gov/gdm/, last access: December 2010.
Dentener, F., Kinne, S., Bond, T., Boucher, O., Cofala, J., Generoso,S., Ginoux, P., Gong, S., Hoelzemann, J. J., Ito, A., Marelli, L.,Penner, J. E., Putaud, J.-P., Textor, C., Schulz, M., van der Werf,G. R., and Wilson, J.: Emissions of primary aerosol and pre-cursor gases in the years 2000 and 1750 prescribed data-sets forAeroCom, Atmos. Chem. Phys., 6, 4321–4344,doi:10.5194/acp-6-4321-2006, 2006.
Dockery, D. W., Pope, C. A., Xu, X. P., Spengler, J. D., Ware, J. H.,Fay, M. E., Ferris, B. G., and Speizer, F. E.: An association be-tween air-pollution and mortality in 6 United-States cities, NewEngl. J. Med., 329, 1753–1759, 1993.
Fanaki, F. H.: Experimental observations of a bifurcated buoyantplume, Bound.-Layer Meteorol., 9, 479–495, 1975.
Fountoukis, C., Nenes, A., Meskhidze, N., Bahreini, R., Conant, W.C., Jonsson, H., Murphy, S., Sorooshian, A., Varutbangkul, V.,Brechtel, F., Flagan, R. C., and Seinfeld, J. H.: Aerosol-clouddrop concentration closure for clouds sampled during the Inter-national Consortium for Atmospheric Research on Transport andTransformation 2004 campaign, J. Geophys. Res., 112, D10S30,doi:10.1029/2006JD007272, 2007.
Harrison, R. G. and Carslaw, K. S.: Ion-aerosol-cloud pro-cesses in the lower atmosphere, Rev. Geophys., 41, 1012,doi:10.1029/2002RG000114, 2003.
Hegg, D. A. and Hobbs, P. V.: Measurements of gas-to-particle con-version in the plumes from 5 coal-fired electric-power plants, At-mos. Environ., 14, 99–116, 1980.
Hegg, D. A., Hobbs, P. V., and Lyons, J. H.: Field studies of apower-plant plume in the arid southwestern united-states, Atmos.Environ., 19, 1147–1167, 1985.
Hofzumahaus, A., Rohrer, F., Lu, K., Bohn, B., Brauers, T., Chang,C. C., Fuchs, H., Holland, F., Kita, K., Kondo, Y., Li, X., Lou, S.,
Atmos. Chem. Phys., 12, 189–206, 2012 www.atmos-chem-phys.net/12/189/2012/

R. G. Stevens et al.: Sensitivity to background aerosol and meteorology 205
Shao, M., Zeng, L., Wahner, A., and Zhang, Y.: Amplified tracegas removal in the troposphere, Science, 324, 1702–1704, 2009.
Kerminen, V-M. and Wexler, A. S.: The Interdependence of AerosolProcesses and Mixing in Point Source Plumes, Atmos. Environ.29, 361–375, 1995.
Kerminen, V.-M. and Kulmala, M.: Analytical formulae connectingthe “real” and the “apparent” nucleation rate and the nuclei num-ber concentration for atmospheric nucleation events, J. AerosolSci., 33, 609–622, 2002.
Khairoutdinov, M. F. and Randall, D. A.: Cloud Resolving Mod-eling of the ARM Summer 1997 IOP: Model Formulation, Re-sults, Uncertainties, and Sensitivities, J. Atmos. Sci., 60, 607–625, 2003.
Kleffmann, J.: Daytime sources of nitrous acid (HONO) in theatmospheric boundary layer, ChemPhysChem, 8, 1137–1144,doi:10.1002/cphc.200700016, 2007.
Kulmala, M. and Kerminen, V.: On the formation and growthof atmospheric nanoparticles, Atmos. Res., 90, 132–150,doi:10.1016/j.atmosres.2008.01.005, 2008.
Kulmala, M., Lehtinen, K. E. J., and Laaksonen, A.: Cluster activa-tion theory as an explanation of the linear dependence betweenformation rate of 3 nm particles and sulphuric acid concentration,Atmos. Chem. Phys., 6, 787–793,doi:10.5194/acp-6-787-2006,2006.
Lelieveld, J., Butler, T. M., Crowley, J. N., Dillon, T. J., Fischer,H., Ganzeveld, L., Harder, H., Lawrence, M. G., Martinez, M.,Taraborrelli, D., and Williams, J.: Atmospheric oxidation capac-ity sustained by a tropical forest, Nature, 452, 737–740, 2008.
Li, G., Lei, W., Zavala, M., Volkamer, R., Dusanter, S., Stevens, P.,and Molina, L. T.: Impacts of HONO sources on the photochem-istry in Mexico City during the MCMA-2006/MILAGO Cam-paign, Atmos. Chem. Phys., 10, 6551–6567,doi:10.5194/acp-10-6551-2010, 2010.
Luo, G. and Yu, F.: Sensitivity of global cloud condensation nu-clei concentrations to primary sulfate emission parameteriza-tions, Atmos. Chem. Phys., 11, 1949–1959,doi:10.5194/acp-11-1949-2011, 2011.
Makkonen, R., Asmi, A., Korhonen, H., Kokkola, H., JArvenoja,S., Raisanen, P., Lehtinen, K. E. J., Laaksonen, A., Kerminen,V.-M., Jarvinen, H., Lohmann, U., Bennartz, R., Feichter, J., andKulmala, M.: Sensitivity of aerosol concentrations and cloudproperties to nucleation and secondary organic distribution inECHAM5-HAM global circulation model, Atmos. Chem. Phys.,9, 1747-1766,doi:10.5194/acp-9-1747-2009, 2009.
Merikanto, J., Napari, I., Vehkamaki, H., Anttila, T., and Kul-mala, M.: New parameterization of sulfuric acid-ammonia-waterternary nucleation rates at tropospheric conditions, J. Geophys.Res., 112, D15207,doi:10.1029/2006JD007977, 2006.
Mesinger, F., Dimego, G., Kalnay, E., Mitchell, K., Shafran, P.C., Ebisuzaki, W., Joviæ, D., Woollen, J., Rogers, E., Berbery,E. H., Ek, M. B., Fan, Y., Grumbine, R., Higgins, W., Li, H.,Lin, Y., Manikin, G., Parrish, D., and Shi, W.: North AmericanRegional Reanalysis: A long-term, consistent, high-resolutionclimate dataset for the North American domain, as a major im-provement upon the earlier global reanalysis datasets in both res-olution and accuracy, B. Am. Meteorol. Soc., 87, 343–360, 2006.
Mueller, S. F. and Imhoff, R. E.: Estimates of particle formation andgrowth in coal-fired boiler exhaust Part 1: Observations, Atmos.Environ., 28, 595–602, 1994.
Napari, I., Noppel, M., Vehkamaki, H., and Kulmala M.:Parametrization of Ternary Nucleation Rates for H2SO4-NH3-H2O Vapors, J. Geophys. Res.-Atmos. 107, 4381,doi:10.1029/2002JD002132, 2002.
Olaguer, E. P., Rappengluck, B., Lefer, B., Stutz, J., Dibb, J., Grif-fin, R., Brune, W. H., Shauck, M., Buhr, M., Jeffries, H., Vizuete,W., and Pinto, J. P.: Deciphering the role of radical precursorsduring the Second Texas Air Quality Study, J. Air Waste Ma.,59, 1258–1277, 2009.
Olson, J. R., Crawford, J. H., Chen, G., Brune, W. H., Faloona,I. C., Tan, D., Harder, H., and Martinez, M.: A reevaluation ofairborne HOx observations from NASA field campaigns, J. Geo-phys. Res., 111, D10301,doi:10.1029/2005JD006617, 2006.
Parrish, D. D., Allen, D. T., Bates, T. S., Estes, M., Fehsenfeld, F.C., Feingold, G., Ferrare, R., Hardesty, R. M., Meagher, J. F.,Nielsen-Gammon, J. W., Pierce, R. B., Ryerson, T. B., Seinfeld,J. H. and Williams, E. J.: Overview of the Second Texas AirQuality Study (TexAQS II) and the Gulf of Mexico AtmosphericComposition and Climate Study (GoMACCS), J. Geophys. Res.,114, D00F13,doi:10.1029/2009JD011842, 2009.
Peters, A., Wichmann, H. E., Tuch, T., Heinrich, J., and Heyder, J.:Respiratory effects are associated with the number of ultrafineparticles, Am. J. Resp. Crit. Care, 155, 1376–1383, 1997.
Pierce, J. R. and Adams, P. J.: Global evaluation of CCNformation by direct emission of sea salt and growth of ul-trafine sea salt, J. Geophys. Res.-Atmos., 111, D06203,doi:10.1029/2005JD006186, 2006.
Pierce, J. R. and Adams, P. J.: Uncertainty in global CCN concen-trations from uncertain aerosol nucleation and primary emissionrates, Atmos. Chem. Phys., 9, 1339–1356,doi:10.5194/acp-9-1339-2009, 2009.
Pierce, J. R., Chen, K., and Adams, P. J.: Contribution of primarycarbonaceous aerosol to cloud condensation nuclei: processesand uncertainties evaluated with a global aerosol microphysicsmodel, Atmos. Chem. Phys., 7, 5447–5466,doi:10.5194/acp-7-5447-2007, 2007.
Pierce, J. R., Riipinen, I., Kulmala, M., Ehn, M., Petaja, T., Junni-nen, H., Worsnop, D. R., and Donahue, N. M.: Quantification ofthe volatility of secondary organic compounds in ultrafine par-ticles during nucleation events, Atmos. Chem. Phys., 11, 9019–9036,doi:10.5194/acp-11-9019-2011, 2011.
Riipinen, I., Pierce, J. R., Yli-Juuti, T., Nieminen, T., Hakkinen,S., Ehn, M., Junninen, H., Lehtipalo, K., Petaja, T., Slowik, J.,Chang, R., Shantz, N. C., Abbatt, J., Leaitch, W. R., Kerminen,V.-M., Worsnop, D. R., Pandis, S. N., Donahue, N. M., and Kul-mala, M.: Organic condensation: a vital link connecting aerosolformation to cloud condensation nuclei (CCN) concentrations,Atmos. Chem. Phys., 11, 3865–3878,doi:10.5194/acp-11-3865-2011, 2011.
Sihto, S.-L., Kulmala, M., Kerminen, V.-M., Dal Maso, M., Petaja,T., Riipinen, I., Korhonen, H., Arnold, F., Janson, R., Boy, M.,Laaksonen, A., and Lehtinen, K. E. J.: Atmospheric sulphuricacid and aerosol formation: implications from atmospheric mea-surements for nucleation and early growth mechanisms, At-mos. Chem. Phys., 6, 4079–4091,doi:10.5194/acp-6-4079-2006,2006.
Singh, H. B., Brune, W. H., Crawford, J. H., Jacob, D. J., and Rus-sell, P. B.: Overview of the summer 2004 Intercontinental Chem-ical Transport Experiment–North America (INTEX-A), J. Geo-
www.atmos-chem-phys.net/12/189/2012/ Atmos. Chem. Phys., 12, 189–206, 2012

206 R. G. Stevens et al.: Sensitivity to background aerosol and meteorology
phys. Res., 111, D24S01,doi:10.1029/2006JD007905, 2006.Sipila, M., Berndt, T., Petaja, T., Brus, D., Vanhanen, J., Strat-
mann, F., Patokoski, J., Mauldin, Roy L. III, Hyvarinen,A., Lihavainen, H., and Kulmala, M.: The role of sulfu-ric acid in atmospheric nucleation, Science, 327, 1243–1246,doi:10.1126/science.1180315, 2010.
Solomon, S., Qin, D., Manning, M., Chen, Z., Marquis, M., Av-eryt, K. B., Tignor, M., and Miller, H. L.: Climate change 2007:The Physical Science Basis, Contribution of Working Group 1to the Fourth Assessment Report of the Intergovernmental Panelon Climate Change, IPCC, Cambridge University Press, Cam-bridge, UK, and New York, USA, 2007.
Srivastava, R. K., Miller, C. A., Erickson C., and Jambhekar, R.:Emissions of sulfur trioxide from coal-fired power plants, J. AirWaste Ma., 54, 750–762, 2004.
Seinfeld, J. H. and Pandis, S. N.: Atmospheric Chemistry andPhysics: From Air Pollution to Climate Change, Part 2, JohnWiley and Sons, Inc., Hoboken, New Jersey, 2006.
Spracklen, D. V., Pringle, K. J., Carslaw, K. S., Chipperfield, M.P., and Mann, G. W.: A global off-line model of size-resolvedaerosol microphysics: II. Identification of key uncertainties, At-mos. Chem. Phys., 5, 3233–3250,doi:10.5194/acp-5-3233-2005,2005.
Spracklen, D. V., Carslaw, K. S., Kulmala, M., Kerminen, V.,Sihto, S., Riipinen, I., Merikanto, J., Mann, G. W., Chipper-field, M. P., Wiedensohler, A., Birmili, W., and Lihavainen,H.: Contribution of particle formation to global cloud conden-sation nuclei concentrations, Geophys. Res. Lett., 35, L06808,doi:10.1029/2007GL033038, 2008.
Slinn, W. G. N., Hasse, L., Hicks, B. B., Hogan, A. W., Lai, D.,Liss, P. S., Munnich, K. O., Sehmel, G. A., and Vittori, O.: Someaspects of the transfer of atmospheric trace constituents past theair-sea interface, Atmos. Environ. 12, 2055–2087, 1978.
Stone, D., Evans, M. J., Edwards, P. M., Commane, R., Ingham, T.,Rickard, A. R., Brookes, D. M., Hopkins, J., Leigh, R. J., Lewis,A. C., Monks, P. S., Oram, D., Reeves, C. E., Stewart, D., andHeard, D. E.: Isoprene oxidation mechanisms: measurementsand modelling of OH and HO2 over a South-East Asian tropicalrainforest during the OP3 field campaign, Atmos. Chem. Phys.,11, 6749–6771,doi:10.5194/acp-11-6749-2011, 2011.
Twomey, S.: Pollution and planetary albedo, Atmos. Environ., 8,1251–1256, 1974.
Vehkamaki, H., Kulmala, M., Napari, I., Lehtinen, K. E. J., Timm-reck, C., Noppel, M., and Laaksonen. A.: An Improved Param-eterization for Sulfuric Acid-Water Nucleation Rates for Tropo-spheric and Stratospheric Conditions, J. Geophys. Res.-Atmos.,107, 4622,doi:10.1029/2002JD002184, 2002.
Volkamer, R., Sheehy, P., Molina, L. T., and Molina, M. J.: Oxida-tive capacity of the Mexico City atmosphere - Part 1: A rad-ical source perspective, Atmos. Chem. Phys., 10, 6969–6991,doi:10.5194/acp-10-6969-2010, 2010.
Wang, M. and Penner, J. E.: Aerosol indirect forcing in a globalmodel with particle nucleation, Atmos. Chem. Phys., 9, 239–260,doi:10.5194/acp-9-239-2009, 2009.
Westervelt, D. M., Riipinen, I., Pierce, J. R., Trivitayanurak, W., andAdams, P. J.: Formation and Growth of Nucleated Particles intoCloud Condensation Nuclei: Comparison of a Global AerosolModel with Observations, in preparation for Atmos. Chem. Phys.Diss., 2011.
Whitby, K. T.: Physical characteristics of sulfur aerosols, Atmos.Environ., 12, 135–159, 1978.
Yu, F. and Luo, G.: Simulation of particle size distribution witha global aerosol model: contribution of nucleation to aerosoland CCN number concentrations, Atmos. Chem. Phys., 9, 7691–7710,doi:10.5194/acp-9-7691-2009, 2009.
Yu, F.: Diurnal and Seasonal Variations of Ultrafine Particle Forma-tion in Anthropogenic SO2 Plumes, Environ. Sci. Technol., 44,2011–2015, 2010a.
Yu, F.: Ion-mediated nucleation in the atmosphere: Key controllingparameters, implications, and look-up table, J. Geophys. Res.,115, D03206,doi:10.1029/2009JD012630, 2010b.
Zaveri, R. A., Berkowitz, C. M., Brechtel, F. J., Gilles, M.K., Hubbe, J. M., Jayne, J. T., Kleinman, L. I., Laskin, A.,Madronich, S., Onasch, T. B., Pekour, M. S., Springston, S. R.,Thornton, J. A., Tivanski, A. V., and Worsnop, D. R.: Nighttimechemical evolution of aerosol and trace gases in a power plantplume: Implications for secondary organic nitrate and organosul-fate aerosol formation, NO3 radical chemistry, and N2O5 het-erogeneous hydrolysis, J. Geophys. Res.-Atmos., 115, D12304,doi:10.1029/2009JD013250, 2010.
Atmos. Chem. Phys., 12, 189–206, 2012 www.atmos-chem-phys.net/12/189/2012/


![Data Validation Charts for Aerosol Sulfate Definitions: Sulfate concentration: SO4fVal = [SO4]](https://static.fdocuments.in/doc/165x107/5681474d550346895db491a6/data-validation-charts-for-aerosol-sulfate-definitions-sulfate-concentration-5697209c43453.jpg)


![Data Validation Charts for Aerosol Sulfate Definitions: Sulfate concentration: SO4fVal = [SO 4 ]](https://static.fdocuments.in/doc/165x107/5681474d550346895db4919b/data-validation-charts-for-aerosol-sulfate-definitions-sulfate-concentration.jpg)