Co-Evolution of Capabilities and Industry the Evolution of Mutual Fund Processing
Upload
duongkhanhCategory
view
215download
2
Atmos. Chem. Phys., 11, 12737–12750, 2011www.atmos-chem-phys.net/11/12737/2011/doi:10.5194/acp-11-12737-2011© Author(s) 2011. CC Attribution 3.0 License.
AtmosphericChemistry
and Physics
A case study of aerosol processing and evolution in summer in NewYork City
Y. L. Sun1, Q. Zhang2, J. J. Schwab3, W. N. Chen4, M. S. Bae5, Y. C. Lin 4, H. M. Hung6, and K. L. Demerjian3
1State Key Laboratory of Atmospheric Boundary Layer Physics and Atmospheric Chemistry,Institute of Atmospheric Physics, Chinese Academy of Sciences, Beijing, China2Department of Environmental Toxicology, University of California, Davis, California, USA3Atmospheric Sciences Research Center, State University of New York, Albany, New York, USA4Research Center for Environmental Changes, Academia Sinica, Taipei, Taiwan5Environmental Engineering Department, Mokpo National University, South of Korea6Department of Atmospheric Sciences, National Taiwan University, Taipei, Taiwan
Received: 2 September 2011 – Published in Atmos. Chem. Phys. Discuss.: 15 September 2011Revised: 21 November 2011 – Accepted: 7 December 2011 – Published: 16 December 2011
Abstract. We have investigated an aerosol processing andevolution event from 21–22 July during the summer 2009Field Intensive Study at Queens College in New York City(NYC). The evolution processes are characterized by threeconsecutive stages: (1) aerosol wet scavenging, (2) night-time nitrate formation, and (3) photochemical productionand evolution of secondary aerosol species. Our resultssuggest that wet scavenging of aerosol species tends to bestrongly related to their hygroscopicities and also mixingstates. The scavenging leads to a significant change in bulkaerosol composition and average carbon oxidation state be-cause of scavenging efficiencies in the following order: sul-fate> low-volatility oxygenated organic aerosol (LV-OOA)> semi-volatile OOA (SV-OOA)> hydrocarbon-like OA(HOA). The second stage involves a quick formation of ni-trate from heterogeneous reactions at nighttime. During thethird stage, simultaneous increases of sulfate and SV-OOAwere observed shortly after sunrise, indicating secondaryaerosol formation. Organic aerosols become highly oxidizedin ∼ half day as the result of photochemical processing, con-sistent with previously reported results from the CO-tracermethod (OA/1CO). The photochemical reactions appear toprogress gradually associated with a transformation of SV-OOA to low-volatility species based on the evolution trends
Correspondence to:Q. Zhang([email protected])
of oxygen-to-carbon (O/C) ratio, relationship between f44(fraction ofm/z44 in OA) and f43 (fraction ofm/z43 in OA),and size evolution of OOA and HOA. Aerosols appear to be-come more internally mixed during the processing. Our re-sults suggest that functionalization by incorporation of bothC and O plays a major role in the early period of OA oxida-tion (O/C< 0.5). Our results also show that photochemicalproduction of LV-OOA during this event is approximately 2–3 h behind of sulfate production, which might explain, some-times, the lack of correlations between LV-OOA and sulfate,two secondary aerosol species which often exist in internalmixtures over regional scales.
1 Introduction
Atmospheric aerosols, consisting of liquid and solid parti-cles suspended in the air, are important components of atmo-sphere. Aerosols play a significant role in visibility reduction(Watson, 2002), regional air pollution (Molina and Molina,2004), and climate change (IPCC, 2007). Aerosols and theirassociated direct and indirect effects on radiative forcing arehighly uncertain (Forster et al., 2007) due to a lack of knowl-edge on their sources, composition, evolution processes anddeposition (Poschl, 2005; Hallquist et al., 2009). Particu-larly, organic aerosols (OA), accounting for a large fractionof submicron aerosol mass (Kanakidou et al., 2005; Zhang et
Published by Copernicus Publications on behalf of the European Geosciences Union.
12738 Y. L. Sun et al.: A case study of aerosol processing and evolution in summer in New York City
al., 2007a; Jimenez et al., 2009), are most poorly understoodbecause of their complex and diverse volatilities, function-alities, and solubilities. Aerosols also exert a serious impacton human health by increasing the damage of respiratory andcardiovascular systems and reducing life expectancy (Pope etal., 2002, 2009).
Atmospheric aerosols are formed from various emissionsources and transformation processes. Aerosol particles canbe primary from the direct emissions (e.g. combustion of fos-sil fuels, biomass burning, mineral dust and sea salt) or sec-ondary from gas-to-particle transformation processes suchas nucleation and heterogeneous reactions. Although pri-mary emissions of aerosols and secondary formation of in-organic species (e.g. sulfate and nitrate) are fairly well un-derstood, there is considerable uncertainty on the formationof secondary organic aerosol (SOA) (Hallquist et al., 2009).For example, traditional SOA models only considering SOAformation from volatile organic compounds (VOCs) oftengreatly underestimate the observed SOA (Heald et al., 2005;Volkamer et al., 2006; Dzepina et al., 2009; Wood et al.,2010). In addition to source emissions and secondary for-mation, other dominant processes affecting ambient aerosolconcentrations include cloud processing, additional OA ag-ing, wet deposition by precipitation, and dry depositionby convective transport and diffusion (Poschl, 2005). Thechemical and physical properties of aerosol particles such aschemical composition, size distribution, and oxidation statemay change significantly because of these evolution pro-cesses. Thus a comprehensive characterization and under-standing of aerosol evolution processes is required for miti-gating aerosol effects on climate and public health.
In summer 2009, we returned to Queens College (QC) inNew York City (NYC), previously an EPA supersite duringPMTACS-NY, with an Aerodyne High-Resolution Time-of-Flight AMS (HR-AMS; DeCarlo et al., 2006), to study sub-micron aerosol chemistry and processes (Sun et al., 2011a).In comparison to the Quadrupole AMS (Q-AMS) system de-ployed in 2001 and 2004 (Drewnick et al., 2004a, b; Weimeret al., 2006), HR-AMS has significantly improved chemi-cal resolution and sensitivity, allowing greater details to begained about the chemical composition and atmospheric pro-cessing of OA. The real-time, highly time-resolved (5 minresolution) concentrations and size distributions of non-refractory submicron aerosol (NR-PM1) species (i.e. organ-ics, sulfate, nitrate, ammonium, and chloride) were mea-sured in-situ from 13 July through 3 August to investigatethe sources and evolution processes of submicron aerosolsin NYC. The mass concentrations, size distributions, chemi-cal composition, and temporal and diurnal variations of NRspecies, elemental composition of OA, and investigations ofsources and processes of OA components have been detailedin Sun et al. (2011a).
In this study, we analyzed a 2-day aerosol processingand evolution event from 21–22 July which we interpret asa progression of three typical atmospheric processes. The
whole process started with a quick wet scavenging of inor-ganic species and secondary OA, followed by a nighttime ni-trate formation process, and then photochemical productionand aging after sunrise. Here we present a detailed investi-gation of these processes focusing on (1) the relationship be-tween scavenging rates and properties of aerosol species, (2)the impacts of wet scavenging on aerosol composition, mix-ing states, and oxidative properties, (3) the formation mech-anisms of nitrate, and (4) the photochemical production andaging of secondary inorganic and organic species.
2 Methods
2.1 Aerosol sampling
Submicron aerosol particles were measured in-situ from13 July through 3 August 2009 on the campus of QueensCollege (40.74◦ N, 73.82◦ W) by an Aerodyne HR-AMS.The HR-AMS was deployed inside the state-of-the-art At-mospheric Sciences Research Center-Mobile Laboratory(ASRC-ML) (Lin et al., 2011) along with various fast-response aerosol and gas instruments. During the 3-weekcontinuous measurements, the ASRC-ML was parked at Lot6, which is approximately 500 m south of the Long IslandExpressway (LIE, I-495) and 1.2 km east of the Van WyckExpressway (I-678), two high-traffic highways in the NYCmetropolitan area.
The HR-AMS was operated under the sensitive V-modeand the high mass resolution (∼6000) W-mode alternativelyevery 5 min. Under V-mode operation, the AMS cycledthrough the mass spectrum (MS) mode and the particle time-of-flight (PToF) mode every 30 s. No PToF data were sam-pled in W-mode due to limited signal-to-noise (S/N) ratio.The HR-AMS was calibrated for ionization efficiency (IE)and particle sizing at the beginning and in the middle of thisstudy following the standard protocols (Jayne et al., 2000;Jimenez et al., 2003; Drewnick et al., 2005). Detailed de-scriptions of the sampling site and instrument operations aregiven in Sun et al. (2011a).
2.2 Collocated measurements
The synchronous measurements in ASRC-ML include ab-sorption coefficient (Babs) by a DMT single-wavelengthPhotoacoustic Soot Spectrometer (PASS-1), formaldehyde(HCHO) and NO2 by an Aerodyne Quantum Cascade Laser(QCL) Spectrometer, CO2 and H2O by a Li-COR CO2 ana-lyzer, trace gases of O3, NO, and NO2 by 2B technologies an-alyzers, VOCs by a BTEX (benzene, toluene, ethylbenzene,and xylene) analyzer, and size-resolved number concentra-tions by a TSI Fast Mobility Particle Sizer (FMPS, Model3091, 5.6–560 nm) spectrometer. In addition to measure-ments from the ASRC-ML, aerosol and gas species were alsomeasured inside the New York State Department of Environ-mental Conservation (NYS DEC) Air Monitoring Building,
Atmos. Chem. Phys., 11, 12737–12750, 2011 www.atmos-chem-phys.net/11/12737/2011/
Y. L. Sun et al.: A case study of aerosol processing and evolution in summer in New York City 12739
∼140 m north of Lot 6. Detailed descriptions of this site aregiven in Drewnick et al. (2004a) and Weimer et al. (2006).The key measurements at this site included water-solubleions by a Particle-into-Liquid Sampler (PILS) coupled withtwo Ion Chromatographs (IC), chemical composition andmass concentrations of NR-species by an Aerodyne AerosolChemical Speciation Monitor (ACSM), Organic carbon (OC)and elemental carbon (EC) by a Sunset Labs OC/EC Ana-lyzer, sulfate by a Thermo Electron 5020 Sulfate ParticulateAnalyzer, and PM2.5 mass by a Tapered Element Oscillat-ing Microbalance (TEOM). Other collocated measurementssuch as trace gases and number concentrations are detailedelsewhere (Sun et al., 2011a).
2.3 AMS data analysis
The aerosol mass spectrometry data were analyzed to deter-mine the mass concentrations and size distributions of NR-PM1 species with the standard AMS data analysis software(SQUIRREL v1.46, Sueper, 2011) and the ion-speciatedcomposition and elemental composition, i.e., oxygen-to-carbon (O/C), hydrogen-to-carbon (H/C), nitrogen-to-carbon(N/C), and organic mass-to-organic carbon (OM/OC) ratioswith the high resolution data analysis software (PIKA, v1.06)and APES (v1.04A). The PMF2 algorithm (v4.2) (Paateroand Tapper, 1994) is used in robust mode to unravel AMShigh resolution mass spectra (HRMS) into distinct OA com-ponents, performed with an Igor Pro-based PMF EvaluationTool (PET, v2.04) (Ulbrich et al. 2009). PMF2 solutionswere thoroughly evaluated using the procedures given byUlbrich et al. (2009) and summarized in Table 1 in Zhanget al. (2011). Five OA components, i.e. hydrocarbon-likeOA (HOA), cooking-related OA (COA), regional, highlyaged low-volatility oxygenated OA (LV-OOA), less photo-chemically aged semi-volatile oxygenated OA (SV-OOA),and a unique nitrogen-enriched OA (NOA) were identified(Sun et al., 2011a). Each component demonstrates distincttemporary variation and mass spectral patterns that are in-dicative of their associations with unique sources and pro-cesses. More details on AMS data analysis can be found inSun et al. (2011a).
A tracerm/z-based method was used to derive the size dis-tributions of HOA and OOA in Pittsburgh based on those ofm/z44 andm/z57 after subtracting OOA contribution (2 %of m/z44, mainly C3H5O+) from the measuredm/z57 sizedistribution data (Zhang et al., 2005c). This method wasused because only eight organicm/z’s were acquired usinga Q-AMS (Zhang et al., 2005b). In this study, the size dis-tributions ofm/z’s up to 300 were obtained with a time-of-flight mass spectrometer, allowing us to apply the customprincipal component analysis (CPCA) technique (Zhang etal., 2005a) to the 3-dimentional size-resolved mass spectra(dimensions: date/time, size, andm/z) to determine the sizedistributions of OA components. To improve the S/N, we av-eraged the 102 size bins acquired between 30–1500 nm (Dva)
into 20 bins before performing CPCA analysis to the size-resolved mass spectra for 21–24 July. The tracerm/z-basedmethod was performed as a comparison. Figure S1 shows themass spectra of HOA and OOA determined for different sizebins, and their correlations with those identified from PMFanalysis of OA spectra acquired under the MS mode (i.e. notsize resolved). The HOA between∼60–800 nm and OOAbetween∼150–800 nm show overall similar spectral patternsto the reference spectra of HOA and OOA, respectively. Theweak correlations below 60 nm and above 800 nm for HOAand below 150 nm and above 800 nm for OOA are likely dueto poor S/N, partly due to limited AMS transmission efficien-cies for these particles (Liu et al., 2007) and gas phase CO2interferences in the ultrafine mode of them/z44 size distri-bution data. A comparison between CPCA and the tracerm/z-based indicates that both report very similar size distri-bution patterns but the tracerm/z-based approach seems toreport lower HOA during OOA dominant periods, and lowerOOA during HOA dominant periods (Fig. S2). Detailed anal-ysis and interpretation of size-resolved mass spectra will bepresented elsewhere.
All the data in this study are reported for ambient tempera-ture and pressure conditions in Eastern Standard Time (EST),which equals Coordinated Universal Time (UTC) minus 5 hor local Time (i.e. East Daylight Time – EDT) minus 1 h.
3 Results and discussions
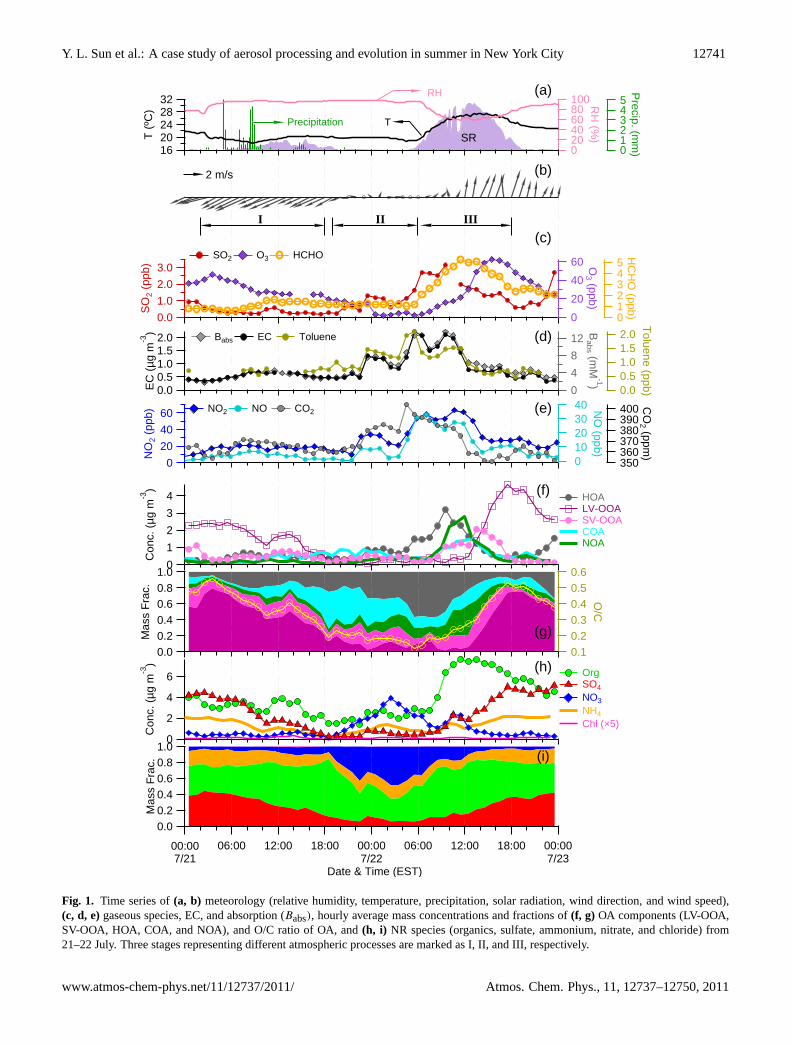
Figure 1 shows the time series of meteorological variables,mixing ratios of gaseous species, mass concentrations andfractions of NR-PM1 species and OA components, and O/Cratio of OA from 21–22 July. Overall, the aerosol processingduring these two days can be classified into three stages: (I)aerosol wet scavenging, (II) night time nitrate formation,and (III) photochemical production and aging of secondaryaerosol species. In the following sections, we describe thethree stages in detail, each of which represents an importantprocess of aerosol particles in the atmosphere.
3.1 Aerosol wet scavenging
This stage started with a light rain at∼03:00 in the morningof 21 July. The rain lasted till∼19:00 at night. During the16-h period, air temperature remained mild at∼20◦C, rel-ative humidity was close to 100 %, solar radiation was low,and the wind was consistently from the northeast with speedof <∼2 m s−1 (Fig. 1). The ammonium sulfate and LV-OOAconcentrations decreased slowly at the beginning, followedby rapid scavenging due to the intense precipitation between05:00–09:00. Other aerosol species (e.g. HOA, nitrate, andchloride), however, showed little changes in concentrationand even slight increases (Fig. 1f, h), for which the relativelyshallow planetary boundary layer height (due to cool temper-ature and overcast conditions) might have played some roles.
www.atmos-chem-phys.net/11/12737/2011/ Atmos. Chem. Phys., 11, 12737–12750, 2011
12740 Y. L. Sun et al.: A case study of aerosol processing and evolution in summer in New York City
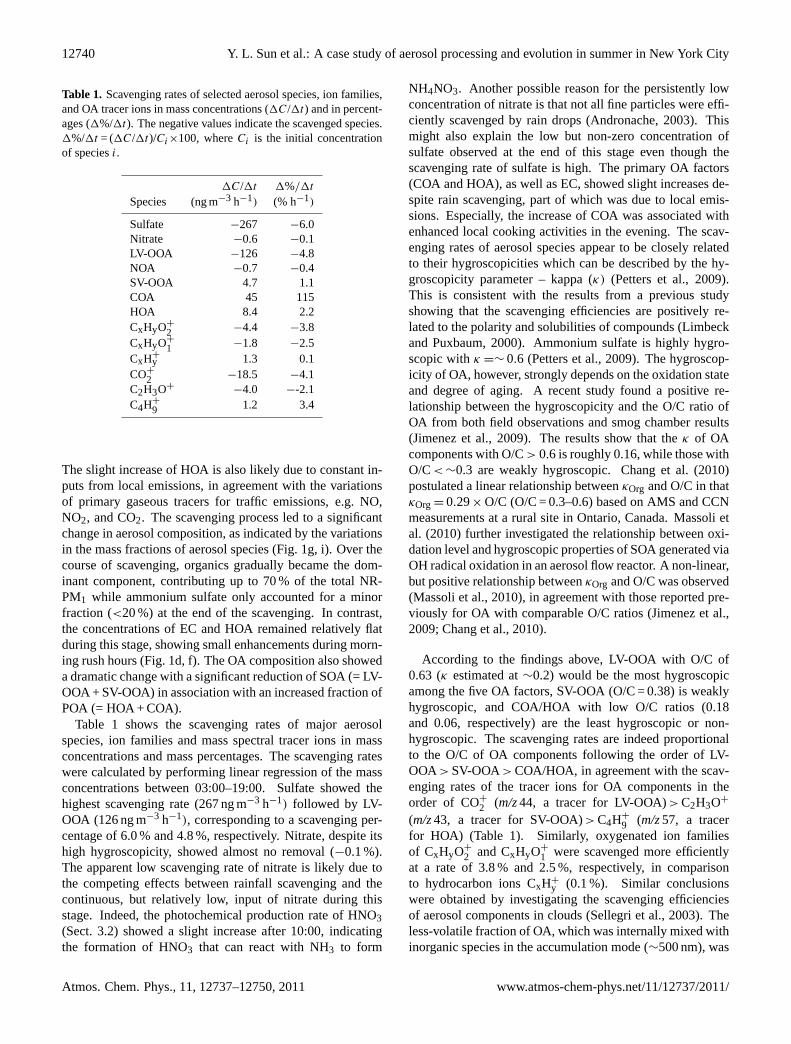
Table 1. Scavenging rates of selected aerosol species, ion families,and OA tracer ions in mass concentrations (1C/1t) and in percent-ages (1%/1t). The negative values indicate the scavenged species.1%/1t = (1C/1t)/Ci×100, whereCi is the initial concentrationof speciesi.
1C/1t 1%/1t
Species (ng m−3 h−1) (% h−1)
Sulfate −267 −6.0Nitrate −0.6 −0.1LV-OOA −126 −4.8NOA −0.7 −0.4SV-OOA 4.7 1.1COA 45 115HOA 8.4 2.2CxHyO+
2 −4.4 −3.8CxHyO+
1 −1.8 −2.5CxH+
y 1.3 0.1CO+
2 −18.5 −4.1C2H3O+
−4.0 −-2.1C4H+
9 1.2 3.4
The slight increase of HOA is also likely due to constant in-puts from local emissions, in agreement with the variationsof primary gaseous tracers for traffic emissions, e.g. NO,NO2, and CO2. The scavenging process led to a significantchange in aerosol composition, as indicated by the variationsin the mass fractions of aerosol species (Fig. 1g, i). Over thecourse of scavenging, organics gradually became the dom-inant component, contributing up to 70 % of the total NR-PM1 while ammonium sulfate only accounted for a minorfraction (<20 %) at the end of the scavenging. In contrast,the concentrations of EC and HOA remained relatively flatduring this stage, showing small enhancements during morn-ing rush hours (Fig. 1d, f). The OA composition also showeda dramatic change with a significant reduction of SOA (= LV-OOA + SV-OOA) in association with an increased fraction ofPOA (= HOA + COA).
Table 1 shows the scavenging rates of major aerosolspecies, ion families and mass spectral tracer ions in massconcentrations and mass percentages. The scavenging rateswere calculated by performing linear regression of the massconcentrations between 03:00–19:00. Sulfate showed thehighest scavenging rate (267 ng m−3 h−1) followed by LV-OOA (126 ng m−3 h−1), corresponding to a scavenging per-centage of 6.0 % and 4.8 %, respectively. Nitrate, despite itshigh hygroscopicity, showed almost no removal (−0.1 %).The apparent low scavenging rate of nitrate is likely due tothe competing effects between rainfall scavenging and thecontinuous, but relatively low, input of nitrate during thisstage. Indeed, the photochemical production rate of HNO3(Sect. 3.2) showed a slight increase after 10:00, indicatingthe formation of HNO3 that can react with NH3 to form
NH4NO3. Another possible reason for the persistently lowconcentration of nitrate is that not all fine particles were effi-ciently scavenged by rain drops (Andronache, 2003). Thismight also explain the low but non-zero concentration ofsulfate observed at the end of this stage even though thescavenging rate of sulfate is high. The primary OA factors(COA and HOA), as well as EC, showed slight increases de-spite rain scavenging, part of which was due to local emis-sions. Especially, the increase of COA was associated withenhanced local cooking activities in the evening. The scav-enging rates of aerosol species appear to be closely relatedto their hygroscopicities which can be described by the hy-groscopicity parameter – kappa (κ) (Petters et al., 2009).This is consistent with the results from a previous studyshowing that the scavenging efficiencies are positively re-lated to the polarity and solubilities of compounds (Limbeckand Puxbaum, 2000). Ammonium sulfate is highly hygro-scopic withκ =∼ 0.6 (Petters et al., 2009). The hygroscop-icity of OA, however, strongly depends on the oxidation stateand degree of aging. A recent study found a positive re-lationship between the hygroscopicity and the O/C ratio ofOA from both field observations and smog chamber results(Jimenez et al., 2009). The results show that theκ of OAcomponents with O/C> 0.6 is roughly 0.16, while those withO/C< ∼0.3 are weakly hygroscopic. Chang et al. (2010)postulated a linear relationship betweenκOrg and O/C in thatκOrg = 0.29× O/C (O/C = 0.3–0.6) based on AMS and CCNmeasurements at a rural site in Ontario, Canada. Massoli etal. (2010) further investigated the relationship between oxi-dation level and hygroscopic properties of SOA generated viaOH radical oxidation in an aerosol flow reactor. A non-linear,but positive relationship betweenκOrg and O/C was observed(Massoli et al., 2010), in agreement with those reported pre-viously for OA with comparable O/C ratios (Jimenez et al.,2009; Chang et al., 2010).
According to the findings above, LV-OOA with O/C of0.63 (κ estimated at∼0.2) would be the most hygroscopicamong the five OA factors, SV-OOA (O/C = 0.38) is weaklyhygroscopic, and COA/HOA with low O/C ratios (0.18and 0.06, respectively) are the least hygroscopic or non-hygroscopic. The scavenging rates are indeed proportionalto the O/C of OA components following the order of LV-OOA> SV-OOA> COA/HOA, in agreement with the scav-enging rates of the tracer ions for OA components in theorder of CO+
2 (m/z44, a tracer for LV-OOA)> C2H3O+
(m/z43, a tracer for SV-OOA)> C4H+
9 (m/z57, a tracerfor HOA) (Table 1). Similarly, oxygenated ion familiesof CxHyO+
2 and CxHyO+
1 were scavenged more efficientlyat a rate of 3.8 % and 2.5 %, respectively, in comparisonto hydrocarbon ions CxH+
y (0.1 %). Similar conclusionswere obtained by investigating the scavenging efficienciesof aerosol components in clouds (Sellegri et al., 2003). Theless-volatile fraction of OA, which was internally mixed withinorganic species in the accumulation mode (∼500 nm), was
Atmos. Chem. Phys., 11, 12737–12750, 2011 www.atmos-chem-phys.net/11/12737/2011/
Y. L. Sun et al.: A case study of aerosol processing and evolution in summer in New York City 12741
Fig. 1
6
4
2
0
Con
c. (
µg
m-3
)
4
3
2
1
0
Con
c. (
µg
m-3
)
3228242016
T (
ºC)
100806040200
RH
(%)
0.00
1.0
0.8
0.6
0.4
0.2
0.0
Ma
ss F
rac.
0.6
0.5
0.4
0.3
0.2
0.1
O/C
60
40
20
0
NO
2 (p
pb)
12
8
4
0
Babs (m
M-1)
3.0
2.0
1.0
0.0
SO
2 (p
pb)
2.01.51.00.50.0E
C (
µg
m-3
)
60
40
20
0
O3 (ppb)
403020100
NO
(ppb
)
543210
HC
HO
(pp
b)
400390380370360350
CO
2 (pp
m)
2.01.51.00.50.0
Tolu
ene
(ppb
)
1.0
0.8
0.6
0.4
0.2
0.0
Ma
ss F
rac.
543210
Precip. (m
m)
00:007/21
06:00 12:00 18:00 00:007/22
06:00 12:00 18:00 00:007/23
Date & Time (EST)
2 m/s
RH
TPrecipitation
I II III
NO2 NO CO2
Org SO4 NO3
NH4
Chl (×5)
SO2 O3 HCHO
Babs EC Toluene
HOA LV-OOA SV-OOA COA NOA
SR
(i)
(g)
(h)
(f)
(e)
(d)
(b)
(c)
(a)
Fig. 1. Time series of(a, b) meteorology (relative humidity, temperature, precipitation, solar radiation, wind direction, and wind speed),(c, d, e)gaseous species, EC, and absorption (Babs), hourly average mass concentrations and fractions of(f, g) OA components (LV-OOA,SV-OOA, HOA, COA, and NOA), and O/C ratio of OA, and(h, i) NR species (organics, sulfate, ammonium, nitrate, and chloride) from21–22 July. Three stages representing different atmospheric processes are marked as I, II, and III, respectively.
www.atmos-chem-phys.net/11/12737/2011/ Atmos. Chem. Phys., 11, 12737–12750, 2011
12742 Y. L. Sun et al.: A case study of aerosol processing and evolution in summer in New York City
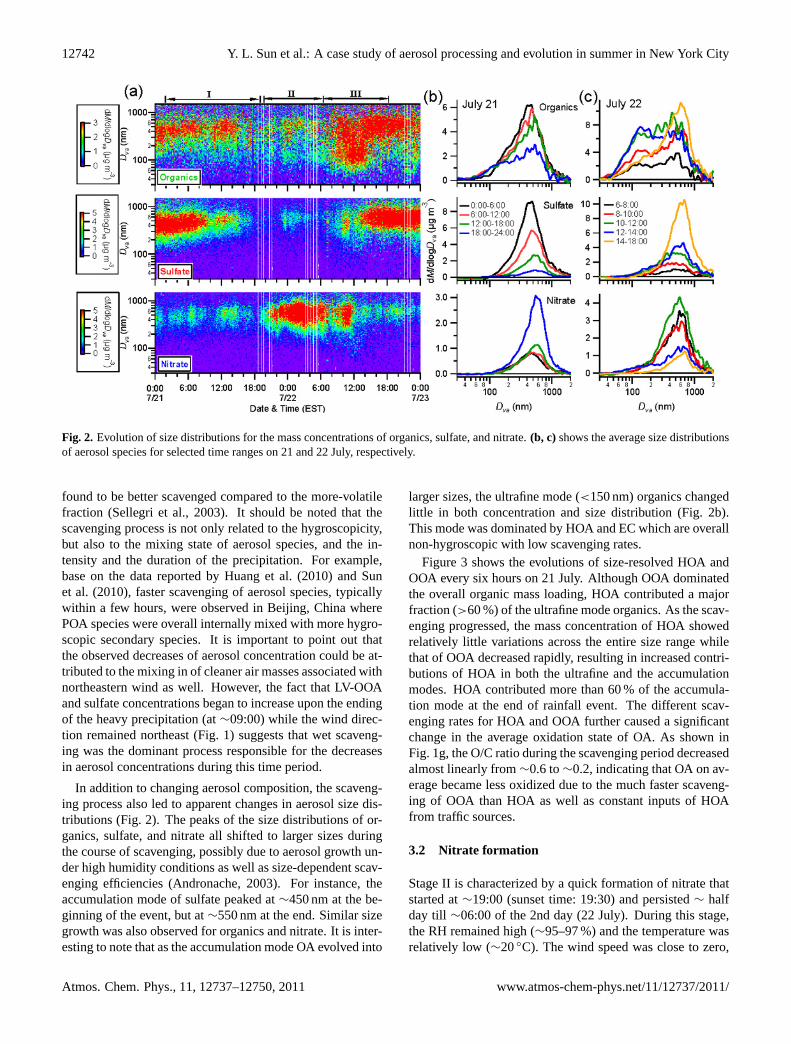
Fig. 2. Evolution of size distributions for the mass concentrations of organics, sulfate, and nitrate.(b, c) shows the average size distributionsof aerosol species for selected time ranges on 21 and 22 July, respectively.
found to be better scavenged compared to the more-volatilefraction (Sellegri et al., 2003). It should be noted that thescavenging process is not only related to the hygroscopicity,but also to the mixing state of aerosol species, and the in-tensity and the duration of the precipitation. For example,base on the data reported by Huang et al. (2010) and Sunet al. (2010), faster scavenging of aerosol species, typicallywithin a few hours, were observed in Beijing, China wherePOA species were overall internally mixed with more hygro-scopic secondary species. It is important to point out thatthe observed decreases of aerosol concentration could be at-tributed to the mixing in of cleaner air masses associated withnortheastern wind as well. However, the fact that LV-OOAand sulfate concentrations began to increase upon the endingof the heavy precipitation (at∼09:00) while the wind direc-tion remained northeast (Fig. 1) suggests that wet scaveng-ing was the dominant process responsible for the decreasesin aerosol concentrations during this time period.
In addition to changing aerosol composition, the scaveng-ing process also led to apparent changes in aerosol size dis-tributions (Fig. 2). The peaks of the size distributions of or-ganics, sulfate, and nitrate all shifted to larger sizes duringthe course of scavenging, possibly due to aerosol growth un-der high humidity conditions as well as size-dependent scav-enging efficiencies (Andronache, 2003). For instance, theaccumulation mode of sulfate peaked at∼450 nm at the be-ginning of the event, but at∼550 nm at the end. Similar sizegrowth was also observed for organics and nitrate. It is inter-esting to note that as the accumulation mode OA evolved into
larger sizes, the ultrafine mode (<150 nm) organics changedlittle in both concentration and size distribution (Fig. 2b).This mode was dominated by HOA and EC which are overallnon-hygroscopic with low scavenging rates.
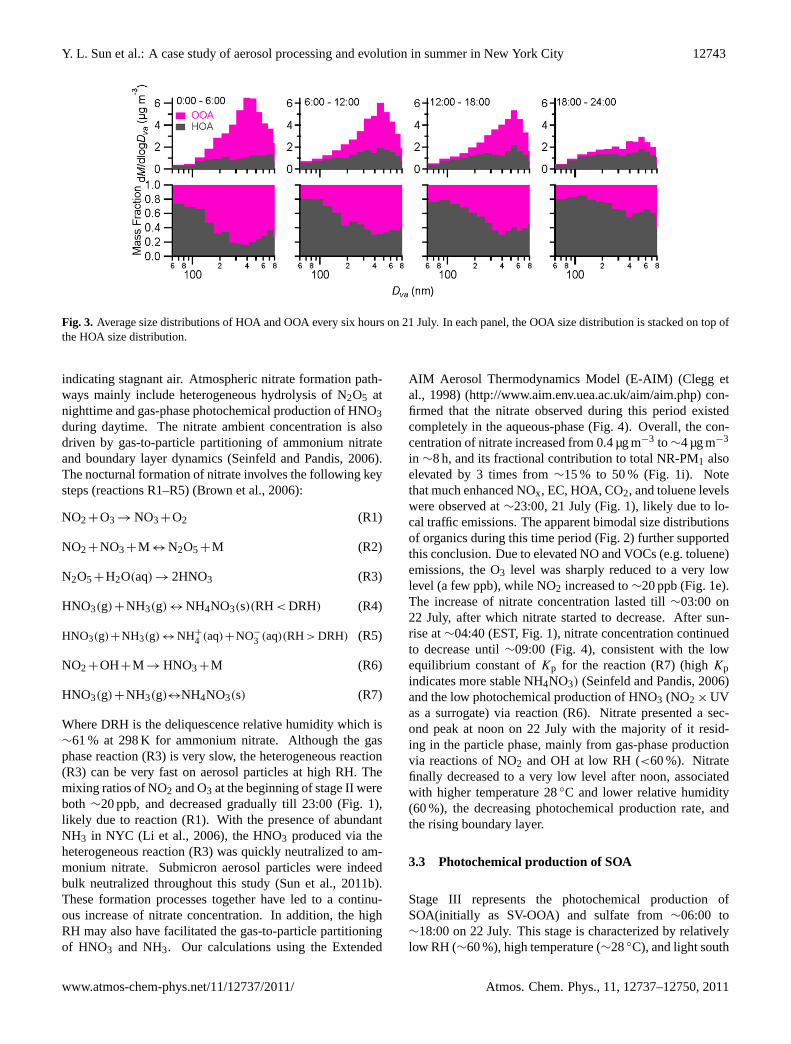
Figure 3 shows the evolutions of size-resolved HOA andOOA every six hours on 21 July. Although OOA dominatedthe overall organic mass loading, HOA contributed a majorfraction (>60 %) of the ultrafine mode organics. As the scav-enging progressed, the mass concentration of HOA showedrelatively little variations across the entire size range whilethat of OOA decreased rapidly, resulting in increased contri-butions of HOA in both the ultrafine and the accumulationmodes. HOA contributed more than 60 % of the accumula-tion mode at the end of rainfall event. The different scav-enging rates for HOA and OOA further caused a significantchange in the average oxidation state of OA. As shown inFig. 1g, the O/C ratio during the scavenging period decreasedalmost linearly from∼0.6 to∼0.2, indicating that OA on av-erage became less oxidized due to the much faster scaveng-ing of OOA than HOA as well as constant inputs of HOAfrom traffic sources.
3.2 Nitrate formation
Stage II is characterized by a quick formation of nitrate thatstarted at∼19:00 (sunset time: 19:30) and persisted∼ halfday till ∼06:00 of the 2nd day (22 July). During this stage,the RH remained high (∼95–97 %) and the temperature wasrelatively low (∼20◦C). The wind speed was close to zero,
Atmos. Chem. Phys., 11, 12737–12750, 2011 www.atmos-chem-phys.net/11/12737/2011/
Y. L. Sun et al.: A case study of aerosol processing and evolution in summer in New York City 12743
Fig. 3. Average size distributions of HOA and OOA every six hours on 21 July. In each panel, the OOA size distribution is stacked on top ofthe HOA size distribution.
indicating stagnant air. Atmospheric nitrate formation path-ways mainly include heterogeneous hydrolysis of N2O5 atnighttime and gas-phase photochemical production of HNO3during daytime. The nitrate ambient concentration is alsodriven by gas-to-particle partitioning of ammonium nitrateand boundary layer dynamics (Seinfeld and Pandis, 2006).The nocturnal formation of nitrate involves the following keysteps (reactions R1–R5) (Brown et al., 2006):
NO2+O3 → NO3+O2 (R1)
NO2+NO3+M ↔ N2O5+M (R2)
N2O5+H2O(aq) → 2HNO3 (R3)
HNO3(g)+NH3(g) ↔ NH4NO3(s)(RH< DRH) (R4)
HNO3(g)+NH3(g) ↔ NH+
4 (aq)+NO−
3 (aq)(RH> DRH) (R5)
NO2+OH+M → HNO3+M (R6)
HNO3(g)+NH3(g)↔NH4NO3(s) (R7)
Where DRH is the deliquescence relative humidity which is∼61 % at 298 K for ammonium nitrate. Although the gasphase reaction (R3) is very slow, the heterogeneous reaction(R3) can be very fast on aerosol particles at high RH. Themixing ratios of NO2 and O3 at the beginning of stage II wereboth ∼20 ppb, and decreased gradually till 23:00 (Fig. 1),likely due to reaction (R1). With the presence of abundantNH3 in NYC (Li et al., 2006), the HNO3 produced via theheterogeneous reaction (R3) was quickly neutralized to am-monium nitrate. Submicron aerosol particles were indeedbulk neutralized throughout this study (Sun et al., 2011b).These formation processes together have led to a continu-ous increase of nitrate concentration. In addition, the highRH may also have facilitated the gas-to-particle partitioningof HNO3 and NH3. Our calculations using the Extended
AIM Aerosol Thermodynamics Model (E-AIM) (Clegg etal., 1998) (http://www.aim.env.uea.ac.uk/aim/aim.php) con-firmed that the nitrate observed during this period existedcompletely in the aqueous-phase (Fig. 4). Overall, the con-centration of nitrate increased from 0.4 µg m−3 to ∼4 µg m−3
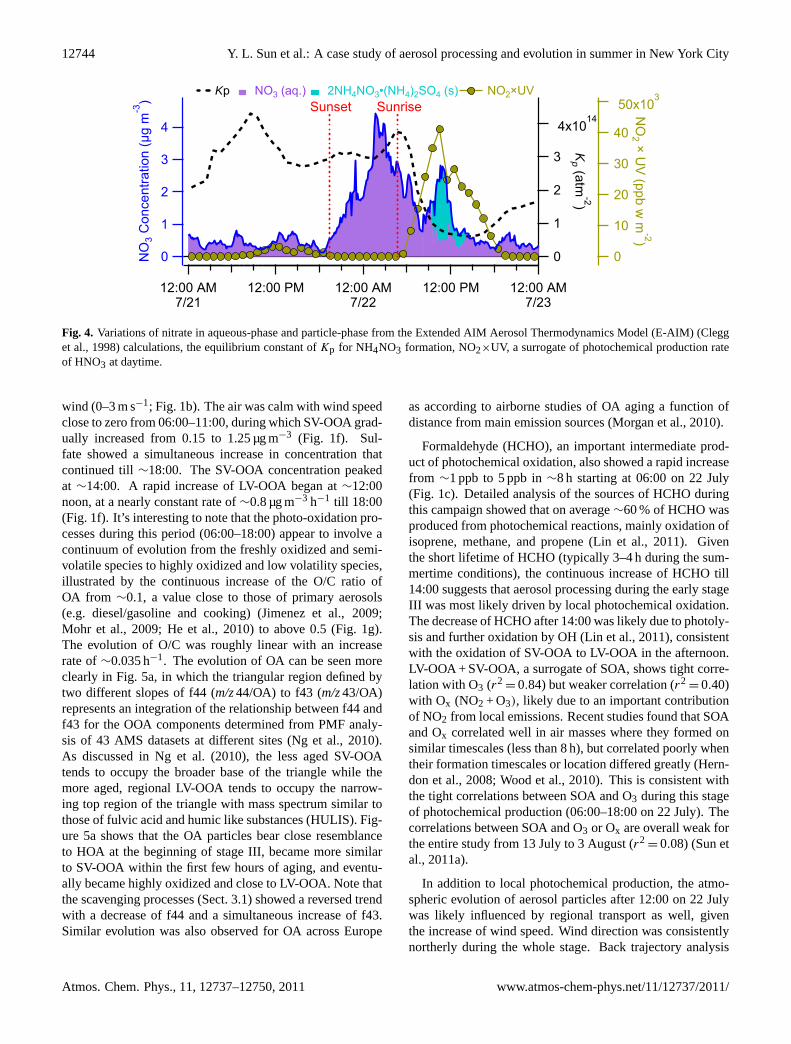
in ∼8 h, and its fractional contribution to total NR-PM1 alsoelevated by 3 times from∼15 % to 50 % (Fig. 1i). Notethat much enhanced NOx, EC, HOA, CO2, and toluene levelswere observed at∼23:00, 21 July (Fig. 1), likely due to lo-cal traffic emissions. The apparent bimodal size distributionsof organics during this time period (Fig. 2) further supportedthis conclusion. Due to elevated NO and VOCs (e.g. toluene)emissions, the O3 level was sharply reduced to a very lowlevel (a few ppb), while NO2 increased to∼20 ppb (Fig. 1e).The increase of nitrate concentration lasted till∼03:00 on22 July, after which nitrate started to decrease. After sun-rise at∼04:40 (EST, Fig. 1), nitrate concentration continuedto decrease until∼09:00 (Fig. 4), consistent with the lowequilibrium constant ofKp for the reaction (R7) (highKpindicates more stable NH4NO3) (Seinfeld and Pandis, 2006)and the low photochemical production of HNO3 (NO2 × UVas a surrogate) via reaction (R6). Nitrate presented a sec-ond peak at noon on 22 July with the majority of it resid-ing in the particle phase, mainly from gas-phase productionvia reactions of NO2 and OH at low RH (<60 %). Nitratefinally decreased to a very low level after noon, associatedwith higher temperature 28◦C and lower relative humidity(60 %), the decreasing photochemical production rate, andthe rising boundary layer.
3.3 Photochemical production of SOA
Stage III represents the photochemical production ofSOA(initially as SV-OOA) and sulfate from∼06:00 to∼18:00 on 22 July. This stage is characterized by relativelylow RH (∼60 %), high temperature (∼28◦C), and light south
www.atmos-chem-phys.net/11/12737/2011/ Atmos. Chem. Phys., 11, 12737–12750, 2011
12744 Y. L. Sun et al.: A case study of aerosol processing and evolution in summer in New York City
734
Fig. 4. Variations of nitrate in aqueous-phase and particle-phase from the Extended AIM Aerosol 735
Thermodynamics Model (E-AIM) (Clegg et al., 1998) calculations, the equilibrium constant of 736
Kp for NH4NO3 formation, NO2×UV, a surrogate of photochemical production rate of HNO3 at 737
daytime. 738
739
Fig. 5. (a) Relationship between f44 (fraction of m/z 44 in the total organic signal) and f43 740
(fraction of m/z 43 in the total organic signal) during 21 – 22 July. The f44 vs. f43 relationships 741
for five OA factors identified during this study are also shown. The dash lines in (a) refer to a 742
triangular region that encompasses ambient OOA factors determined from PMF analyses of 43 743
AMS datasets (Ng et al., 2010). More details are discussed in the main text. (b) Van Krevelen 744
diagram for OA from 21-22 July and five OA components identified from PMF analyses. The 745
dash lines in (b) indicate the changes of H/C against O/C due to adding specific functional 746
groups to an aliphatic carbon (Heald et al., 2010). 747
4
3
2
1
0NO
3 C
once
ntra
tion
(µ
g m
-3)
4x10¹⁴
3
2
1
0
Kp (atm
-2)
50x103
40
30
20
10
0
NO
2 × U
V (pp
b w m
-2)
0.00
12:00 AM7/21
12:00 PM 12:00 AM7/22
12:00 PM 12:00 AM7/23
Kp NO3 (aq.) 2NH4NO3•(NH4)2SO4 (s) NO2×UVSunriseSunset
2.0
1.8
1.6
1.4
1.2
1.0
H/C
1.00.80.60.40.20.0
O/C
LV-OOA
SV-OOA
NOA
COA
HOA 24
20
16
12
8
Tim
e, 22 July
ketone/aldehyde(slope = -2)
carboxylic acid(slope = -1)
alcohol/peroxides(slope = 0)
(slope = -0.5)
0.30
0.25
0.20
0.15
0.10
0.05
0.00
f44
0.200.150.100.050.00
f43
7/21/2009 12:00 AM
12:00 PM
7/22/2009 12:00 AM
12:00 PM
7/23/2009 12:00 AM
LV-OOA
SV-OOA
NOA
COA
HOA
(a) (b)
Fig. 4. Variations of nitrate in aqueous-phase and particle-phase from the Extended AIM Aerosol Thermodynamics Model (E-AIM) (Clegget al., 1998) calculations, the equilibrium constant ofKp for NH4NO3 formation, NO2×UV, a surrogate of photochemical production rateof HNO3 at daytime.
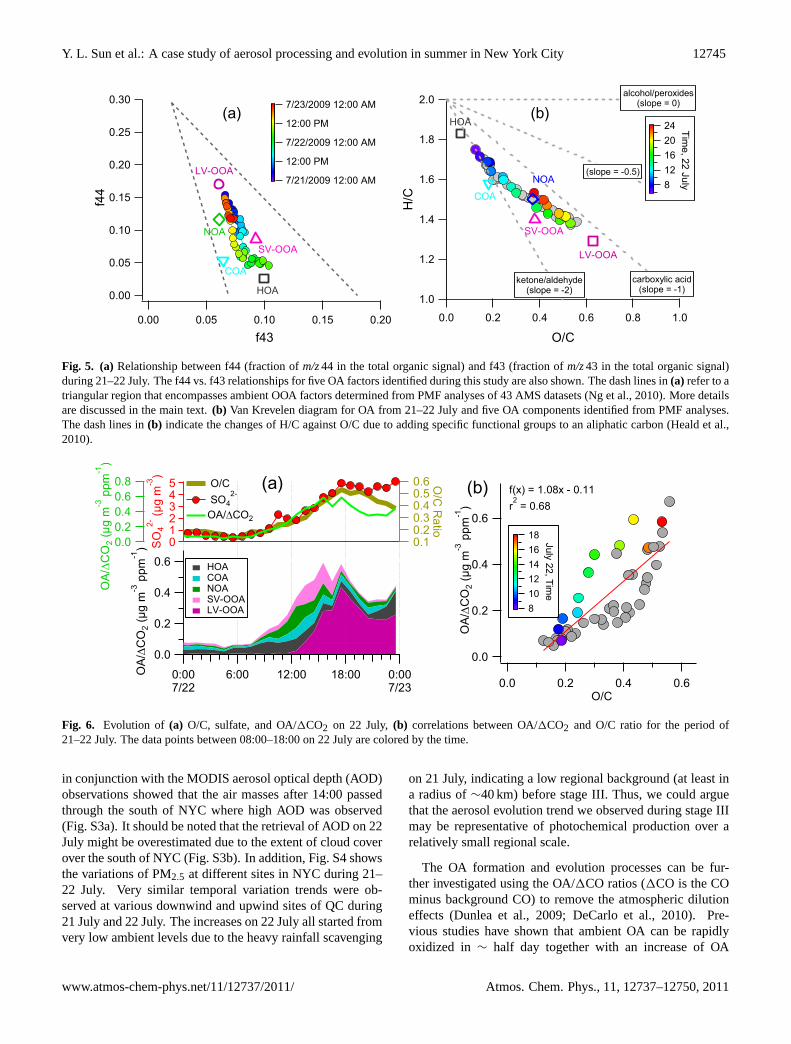
wind (0–3 m s−1; Fig. 1b). The air was calm with wind speedclose to zero from 06:00–11:00, during which SV-OOA grad-ually increased from 0.15 to 1.25 µg m−3 (Fig. 1f). Sul-fate showed a simultaneous increase in concentration thatcontinued till∼18:00. The SV-OOA concentration peakedat ∼14:00. A rapid increase of LV-OOA began at∼12:00noon, at a nearly constant rate of∼0.8 µg m−3 h−1 till 18:00(Fig. 1f). It’s interesting to note that the photo-oxidation pro-cesses during this period (06:00–18:00) appear to involve acontinuum of evolution from the freshly oxidized and semi-volatile species to highly oxidized and low volatility species,illustrated by the continuous increase of the O/C ratio ofOA from ∼0.1, a value close to those of primary aerosols(e.g. diesel/gasoline and cooking) (Jimenez et al., 2009;Mohr et al., 2009; He et al., 2010) to above 0.5 (Fig. 1g).The evolution of O/C was roughly linear with an increaserate of∼0.035 h−1. The evolution of OA can be seen moreclearly in Fig. 5a, in which the triangular region defined bytwo different slopes of f44 (m/z44/OA) to f43 (m/z43/OA)represents an integration of the relationship between f44 andf43 for the OOA components determined from PMF analy-sis of 43 AMS datasets at different sites (Ng et al., 2010).As discussed in Ng et al. (2010), the less aged SV-OOAtends to occupy the broader base of the triangle while themore aged, regional LV-OOA tends to occupy the narrow-ing top region of the triangle with mass spectrum similar tothose of fulvic acid and humic like substances (HULIS). Fig-ure 5a shows that the OA particles bear close resemblanceto HOA at the beginning of stage III, became more similarto SV-OOA within the first few hours of aging, and eventu-ally became highly oxidized and close to LV-OOA. Note thatthe scavenging processes (Sect. 3.1) showed a reversed trendwith a decrease of f44 and a simultaneous increase of f43.Similar evolution was also observed for OA across Europe
as according to airborne studies of OA aging a function ofdistance from main emission sources (Morgan et al., 2010).
Formaldehyde (HCHO), an important intermediate prod-uct of photochemical oxidation, also showed a rapid increasefrom ∼1 ppb to 5 ppb in∼8 h starting at 06:00 on 22 July(Fig. 1c). Detailed analysis of the sources of HCHO duringthis campaign showed that on average∼60 % of HCHO wasproduced from photochemical reactions, mainly oxidation ofisoprene, methane, and propene (Lin et al., 2011). Giventhe short lifetime of HCHO (typically 3–4 h during the sum-mertime conditions), the continuous increase of HCHO till14:00 suggests that aerosol processing during the early stageIII was most likely driven by local photochemical oxidation.The decrease of HCHO after 14:00 was likely due to photoly-sis and further oxidation by OH (Lin et al., 2011), consistentwith the oxidation of SV-OOA to LV-OOA in the afternoon.LV-OOA + SV-OOA, a surrogate of SOA, shows tight corre-lation with O3 (r2
= 0.84) but weaker correlation (r2= 0.40)
with Ox (NO2 + O3), likely due to an important contributionof NO2 from local emissions. Recent studies found that SOAand Ox correlated well in air masses where they formed onsimilar timescales (less than 8 h), but correlated poorly whentheir formation timescales or location differed greatly (Hern-don et al., 2008; Wood et al., 2010). This is consistent withthe tight correlations between SOA and O3 during this stageof photochemical production (06:00–18:00 on 22 July). Thecorrelations between SOA and O3 or Ox are overall weak forthe entire study from 13 July to 3 August (r2
= 0.08) (Sun etal., 2011a).
In addition to local photochemical production, the atmo-spheric evolution of aerosol particles after 12:00 on 22 Julywas likely influenced by regional transport as well, giventhe increase of wind speed. Wind direction was consistentlynortherly during the whole stage. Back trajectory analysis
Atmos. Chem. Phys., 11, 12737–12750, 2011 www.atmos-chem-phys.net/11/12737/2011/
Y. L. Sun et al.: A case study of aerosol processing and evolution in summer in New York City 12745
734
Fig. 4. Variations of nitrate in aqueous-phase and particle-phase from the Extended AIM Aerosol 735
Thermodynamics Model (E-AIM) (Clegg et al., 1998) calculations, the equilibrium constant of 736
Kp for NH4NO3 formation, NO2×UV, a surrogate of photochemical production rate of HNO3 at 737
daytime. 738
739
Fig. 5. (a) Relationship between f44 (fraction of m/z 44 in the total organic signal) and f43 740
(fraction of m/z 43 in the total organic signal) during 21 – 22 July. The f44 vs. f43 relationships 741
for five OA factors identified during this study are also shown. The dash lines in (a) refer to a 742
triangular region that encompasses ambient OOA factors determined from PMF analyses of 43 743
AMS datasets (Ng et al., 2010). More details are discussed in the main text. (b) Van Krevelen 744
diagram for OA from 21-22 July and five OA components identified from PMF analyses. The 745
dash lines in (b) indicate the changes of H/C against O/C due to adding specific functional 746
groups to an aliphatic carbon (Heald et al., 2010). 747
4
3
2
1
0NO
3 C
once
ntra
tion
(µ
g m
-3)
4x10¹⁴
3
2
1
0
Kp (atm
-2)
50x103
40
30
20
10
0
NO
2 × U
V (pp
b w m
-2)
0.00
12:00 AM7/21
12:00 PM 12:00 AM7/22
12:00 PM 12:00 AM7/23
Kp NO3 (aq.) 2NH4NO3•(NH4)2SO4 (s) NO2×UVSunriseSunset
2.0
1.8
1.6
1.4
1.2
1.0
H/C
1.00.80.60.40.20.0
O/C
LV-OOA
SV-OOA
NOA
COA
HOA 24
20
16
12
8
Tim
e, 22 July
ketone/aldehyde(slope = -2)
carboxylic acid(slope = -1)
alcohol/peroxides(slope = 0)
(slope = -0.5)
0.30
0.25
0.20
0.15
0.10
0.05
0.00
f44
0.200.150.100.050.00
f43
7/21/2009 12:00 AM
12:00 PM
7/22/2009 12:00 AM
12:00 PM
7/23/2009 12:00 AM
LV-OOA
SV-OOA
NOA
COA
HOA
(a) (b)
Fig. 5. (a) Relationship between f44 (fraction ofm/z44 in the total organic signal) and f43 (fraction ofm/z43 in the total organic signal)during 21–22 July. The f44 vs. f43 relationships for five OA factors identified during this study are also shown. The dash lines in(a) refer to atriangular region that encompasses ambient OOA factors determined from PMF analyses of 43 AMS datasets (Ng et al., 2010). More detailsare discussed in the main text.(b) Van Krevelen diagram for OA from 21–22 July and five OA components identified from PMF analyses.The dash lines in(b) indicate the changes of H/C against O/C due to adding specific functional groups to an aliphatic carbon (Heald et al.,2010).
748
Fig. 6. Evolution of (a) O/C, sulfate, and OA/ΔCO2 on 22 July, (b) correlations between 749
OA/ΔCO2 and O/C ratio for the period of 21-22 July. The data points between 8:00-18:00 on 22 750
July are colored by the time. 751
752
Fig. 7. Average size distributions of HOA and OOA for selected time ranges on 22 July. 753
0.6
0.4
0.2
0.0
OA
/C
O2
(µg
m-3
pp
m-1
)
0.60.40.20.0O/C
f(x) = 1.08x - 0.11
r2 = 0.68
18
16
14
12
10
8
July 22, Tim
e
(a) (b)
0.6
0.4
0.2
0.0
OA
/C
O2 (
µg
m-3
ppm
-1)
0.60.50.40.30.20.1
O/C
Ra
tio
0.00
0:007/22
6:00 12:00 18:00 0:007/23
543210S
O42
- (µ
g m
-3)
0.80.60.40.20.0
OA
/C
O2 (
µg
m-3
ppm
-1)
HOA COA NOA SV-OOA LV-OOA
O/C
SO42-
OA/CO2
12
8
4
0
dM/d
logD
va (
µg
m-3
)
12
8
4
0
12
8
4
0
12
8
4
0
12
8
4
0
6 8100
2 4 6 8
1.00.80.60.40.20.0M
ass
Fra
ctio
n
6 8100
2 4 6 8 6 8100
2 4 6 8 6 8100
2 4 6 8 6 8100
2 4 6 8
OOAHOA
6:00 - 8:00 8:00 - 10:00 10:00 - 12:00 12:00 - 14:00
Dva (nm)
14:00 - 18:00
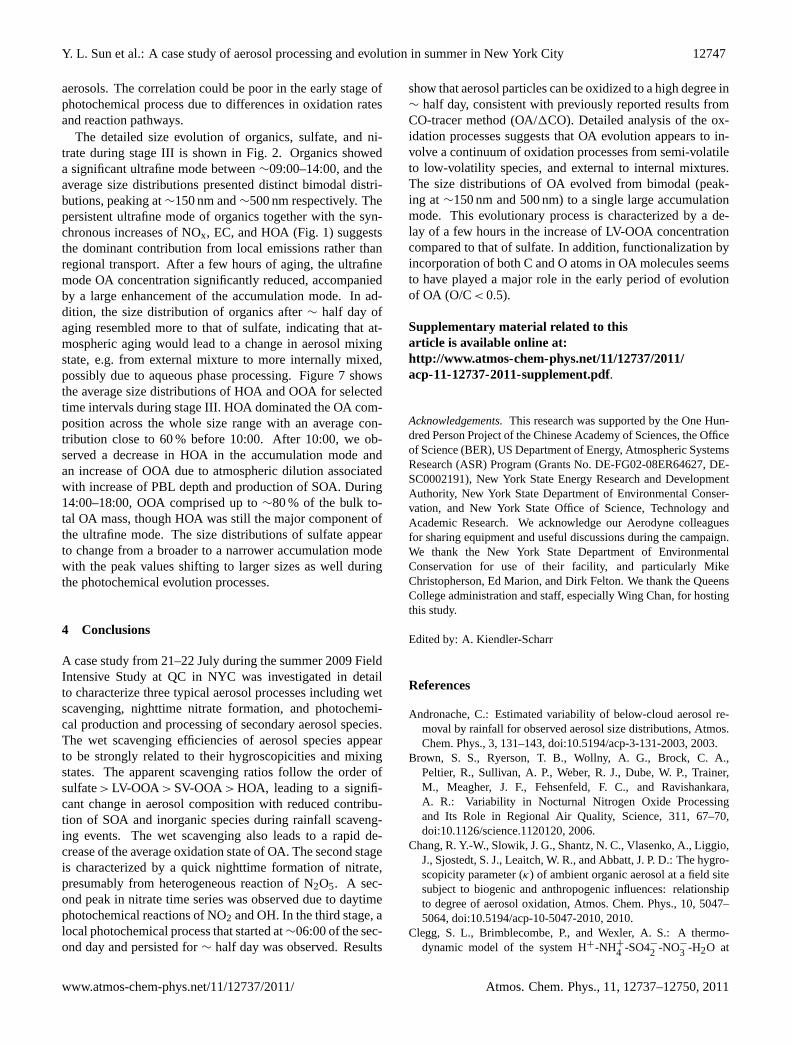
Fig. 6. Evolution of (a) O/C, sulfate, and OA/1CO2 on 22 July,(b) correlations between OA/1CO2 and O/C ratio for the period of21–22 July. The data points between 08:00–18:00 on 22 July are colored by the time.
in conjunction with the MODIS aerosol optical depth (AOD)observations showed that the air masses after 14:00 passedthrough the south of NYC where high AOD was observed(Fig. S3a). It should be noted that the retrieval of AOD on 22July might be overestimated due to the extent of cloud coverover the south of NYC (Fig. S3b). In addition, Fig. S4 showsthe variations of PM2.5 at different sites in NYC during 21–22 July. Very similar temporal variation trends were ob-served at various downwind and upwind sites of QC during21 July and 22 July. The increases on 22 July all started fromvery low ambient levels due to the heavy rainfall scavenging
on 21 July, indicating a low regional background (at least ina radius of∼40 km) before stage III. Thus, we could arguethat the aerosol evolution trend we observed during stage IIImay be representative of photochemical production over arelatively small regional scale.
The OA formation and evolution processes can be fur-ther investigated using the OA/1CO ratios (1CO is the COminus background CO) to remove the atmospheric dilutioneffects (Dunlea et al., 2009; DeCarlo et al., 2010). Pre-vious studies have shown that ambient OA can be rapidlyoxidized in ∼ half day together with an increase of OA
www.atmos-chem-phys.net/11/12737/2011/ Atmos. Chem. Phys., 11, 12737–12750, 2011
12746 Y. L. Sun et al.: A case study of aerosol processing and evolution in summer in New York City
748
Fig. 6. Evolution of (a) O/C, sulfate, and OA/ΔCO2 on 22 July, (b) correlations between 749
OA/ΔCO2 and O/C ratio for the period of 21-22 July. The data points between 8:00-18:00 on 22 750
July are colored by the time. 751
752
Fig. 7. Average size distributions of HOA and OOA for selected time ranges on 22 July. 753
0.6
0.4
0.2
0.0
OA
/C
O2
(µg
m-3
pp
m-1
)
0.60.40.20.0O/C
f(x) = 1.08x - 0.11
r2 = 0.68
18
16
14
12
10
8
July 22, Tim
e
(a) (b)
0.6
0.4
0.2
0.0
OA
/C
O2 (
µg
m-3
ppm
-1)
0.60.50.40.30.20.1
O/C
Ra
tio
0.00
0:007/22
6:00 12:00 18:00 0:007/23
543210S
O42
- (µ
g m
-3)
0.80.60.40.20.0
OA
/C
O2 (
µg
m-3
ppm
-1)
HOA COA NOA SV-OOA LV-OOA
O/C
SO42-
OA/CO2
12
8
4
0
dM/d
logD
va (
µg
m-3
)
12
8
4
0
12
8
4
0
12
8
4
0
12
8
4
0
6 8100
2 4 6 8
1.00.80.60.40.20.0M
ass
Fra
ctio
n
6 8100
2 4 6 8 6 8100
2 4 6 8 6 8100
2 4 6 8 6 8100
2 4 6 8
OOAHOA
6:00 - 8:00 8:00 - 10:00 10:00 - 12:00 12:00 - 14:00
Dva (nm)
14:00 - 18:00
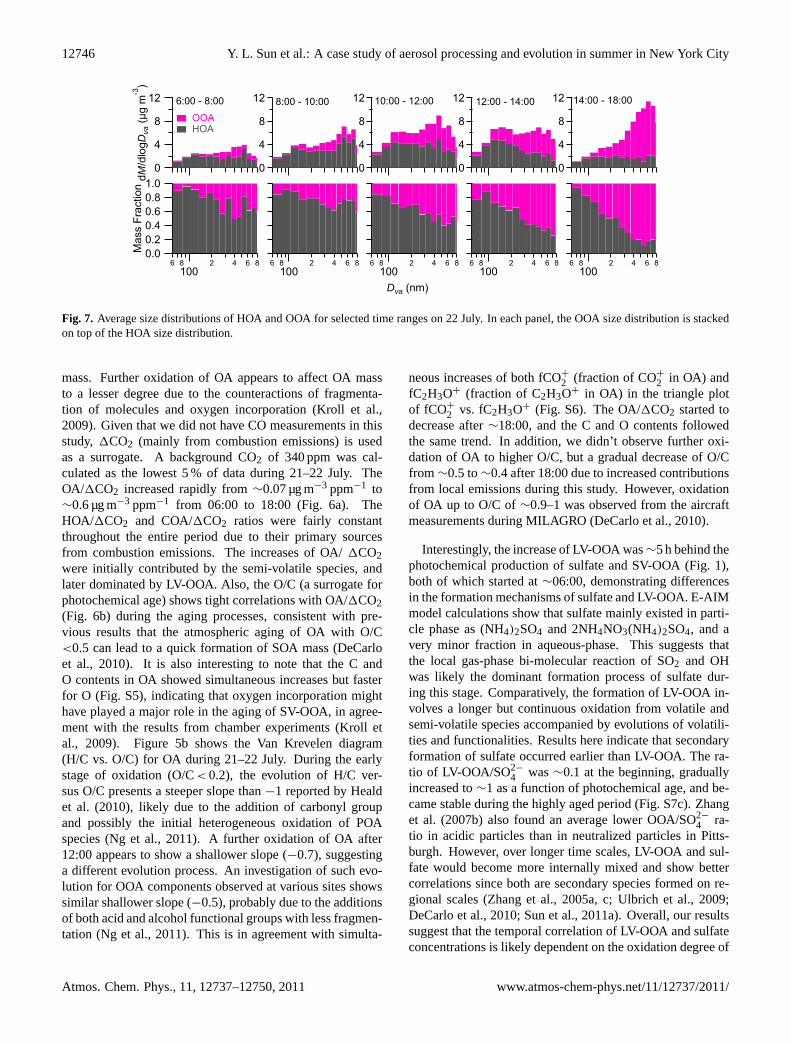
Fig. 7. Average size distributions of HOA and OOA for selected time ranges on 22 July. In each panel, the OOA size distribution is stackedon top of the HOA size distribution.
mass. Further oxidation of OA appears to affect OA massto a lesser degree due to the counteractions of fragmenta-tion of molecules and oxygen incorporation (Kroll et al.,2009). Given that we did not have CO measurements in thisstudy, 1CO2 (mainly from combustion emissions) is usedas a surrogate. A background CO2 of 340 ppm was cal-culated as the lowest 5 % of data during 21–22 July. TheOA/1CO2 increased rapidly from∼0.07 µg m−3 ppm−1 to∼0.6 µg m−3 ppm−1 from 06:00 to 18:00 (Fig. 6a). TheHOA/1CO2 and COA/1CO2 ratios were fairly constantthroughout the entire period due to their primary sourcesfrom combustion emissions. The increases of OA/1CO2were initially contributed by the semi-volatile species, andlater dominated by LV-OOA. Also, the O/C (a surrogate forphotochemical age) shows tight correlations with OA/1CO2(Fig. 6b) during the aging processes, consistent with pre-vious results that the atmospheric aging of OA with O/C<0.5 can lead to a quick formation of SOA mass (DeCarloet al., 2010). It is also interesting to note that the C andO contents in OA showed simultaneous increases but fasterfor O (Fig. S5), indicating that oxygen incorporation mighthave played a major role in the aging of SV-OOA, in agree-ment with the results from chamber experiments (Kroll etal., 2009). Figure 5b shows the Van Krevelen diagram(H/C vs. O/C) for OA during 21–22 July. During the earlystage of oxidation (O/C< 0.2), the evolution of H/C ver-sus O/C presents a steeper slope than−1 reported by Healdet al. (2010), likely due to the addition of carbonyl groupand possibly the initial heterogeneous oxidation of POAspecies (Ng et al., 2011). A further oxidation of OA after12:00 appears to show a shallower slope (−0.7), suggestinga different evolution process. An investigation of such evo-lution for OOA components observed at various sites showssimilar shallower slope (−0.5), probably due to the additionsof both acid and alcohol functional groups with less fragmen-tation (Ng et al., 2011). This is in agreement with simulta-
neous increases of both fCO+
2 (fraction of CO+
2 in OA) andfC2H3O+ (fraction of C2H3O+ in OA) in the triangle plotof fCO+
2 vs. fC2H3O+ (Fig. S6). The OA/1CO2 started todecrease after∼18:00, and the C and O contents followedthe same trend. In addition, we didn’t observe further oxi-dation of OA to higher O/C, but a gradual decrease of O/Cfrom ∼0.5 to∼0.4 after 18:00 due to increased contributionsfrom local emissions during this study. However, oxidationof OA up to O/C of∼0.9–1 was observed from the aircraftmeasurements during MILAGRO (DeCarlo et al., 2010).
Interestingly, the increase of LV-OOA was∼5 h behind thephotochemical production of sulfate and SV-OOA (Fig. 1),both of which started at∼06:00, demonstrating differencesin the formation mechanisms of sulfate and LV-OOA. E-AIMmodel calculations show that sulfate mainly existed in parti-cle phase as (NH4)2SO4 and 2NH4NO3(NH4)2SO4, and avery minor fraction in aqueous-phase. This suggests thatthe local gas-phase bi-molecular reaction of SO2 and OHwas likely the dominant formation process of sulfate dur-ing this stage. Comparatively, the formation of LV-OOA in-volves a longer but continuous oxidation from volatile andsemi-volatile species accompanied by evolutions of volatili-ties and functionalities. Results here indicate that secondaryformation of sulfate occurred earlier than LV-OOA. The ra-tio of LV-OOA/SO2−
4 was∼0.1 at the beginning, graduallyincreased to∼1 as a function of photochemical age, and be-came stable during the highly aged period (Fig. S7c). Zhanget al. (2007b) also found an average lower OOA/SO2−
4 ra-tio in acidic particles than in neutralized particles in Pitts-burgh. However, over longer time scales, LV-OOA and sul-fate would become more internally mixed and show bettercorrelations since both are secondary species formed on re-gional scales (Zhang et al., 2005a, c; Ulbrich et al., 2009;DeCarlo et al., 2010; Sun et al., 2011a). Overall, our resultssuggest that the temporal correlation of LV-OOA and sulfateconcentrations is likely dependent on the oxidation degree of
Atmos. Chem. Phys., 11, 12737–12750, 2011 www.atmos-chem-phys.net/11/12737/2011/
Y. L. Sun et al.: A case study of aerosol processing and evolution in summer in New York City 12747
aerosols. The correlation could be poor in the early stage ofphotochemical process due to differences in oxidation ratesand reaction pathways.
The detailed size evolution of organics, sulfate, and ni-trate during stage III is shown in Fig. 2. Organics showeda significant ultrafine mode between∼09:00–14:00, and theaverage size distributions presented distinct bimodal distri-butions, peaking at∼150 nm and∼500 nm respectively. Thepersistent ultrafine mode of organics together with the syn-chronous increases of NOx, EC, and HOA (Fig. 1) suggeststhe dominant contribution from local emissions rather thanregional transport. After a few hours of aging, the ultrafinemode OA concentration significantly reduced, accompaniedby a large enhancement of the accumulation mode. In ad-dition, the size distribution of organics after∼ half day ofaging resembled more to that of sulfate, indicating that at-mospheric aging would lead to a change in aerosol mixingstate, e.g. from external mixture to more internally mixed,possibly due to aqueous phase processing. Figure 7 showsthe average size distributions of HOA and OOA for selectedtime intervals during stage III. HOA dominated the OA com-position across the whole size range with an average con-tribution close to 60 % before 10:00. After 10:00, we ob-served a decrease in HOA in the accumulation mode andan increase of OOA due to atmospheric dilution associatedwith increase of PBL depth and production of SOA. During14:00–18:00, OOA comprised up to∼80 % of the bulk to-tal OA mass, though HOA was still the major component ofthe ultrafine mode. The size distributions of sulfate appearto change from a broader to a narrower accumulation modewith the peak values shifting to larger sizes as well duringthe photochemical evolution processes.
4 Conclusions
A case study from 21–22 July during the summer 2009 FieldIntensive Study at QC in NYC was investigated in detailto characterize three typical aerosol processes including wetscavenging, nighttime nitrate formation, and photochemi-cal production and processing of secondary aerosol species.The wet scavenging efficiencies of aerosol species appearto be strongly related to their hygroscopicities and mixingstates. The apparent scavenging ratios follow the order ofsulfate> LV-OOA > SV-OOA> HOA, leading to a signifi-cant change in aerosol composition with reduced contribu-tion of SOA and inorganic species during rainfall scaveng-ing events. The wet scavenging also leads to a rapid de-crease of the average oxidation state of OA. The second stageis characterized by a quick nighttime formation of nitrate,presumably from heterogeneous reaction of N2O5. A sec-ond peak in nitrate time series was observed due to daytimephotochemical reactions of NO2 and OH. In the third stage, alocal photochemical process that started at∼06:00 of the sec-ond day and persisted for∼ half day was observed. Results
show that aerosol particles can be oxidized to a high degree in∼ half day, consistent with previously reported results fromCO-tracer method (OA/1CO). Detailed analysis of the ox-idation processes suggests that OA evolution appears to in-volve a continuum of oxidation processes from semi-volatileto low-volatility species, and external to internal mixtures.The size distributions of OA evolved from bimodal (peak-ing at∼150 nm and 500 nm) to a single large accumulationmode. This evolutionary process is characterized by a de-lay of a few hours in the increase of LV-OOA concentrationcompared to that of sulfate. In addition, functionalization byincorporation of both C and O atoms in OA molecules seemsto have played a major role in the early period of evolutionof OA (O/C< 0.5).
Supplementary material related to thisarticle is available online at:http://www.atmos-chem-phys.net/11/12737/2011/acp-11-12737-2011-supplement.pdf.
Acknowledgements.This research was supported by the One Hun-dred Person Project of the Chinese Academy of Sciences, the Officeof Science (BER), US Department of Energy, Atmospheric SystemsResearch (ASR) Program (Grants No. DE-FG02-08ER64627, DE-SC0002191), New York State Energy Research and DevelopmentAuthority, New York State Department of Environmental Conser-vation, and New York State Office of Science, Technology andAcademic Research. We acknowledge our Aerodyne colleaguesfor sharing equipment and useful discussions during the campaign.We thank the New York State Department of EnvironmentalConservation for use of their facility, and particularly MikeChristopherson, Ed Marion, and Dirk Felton. We thank the QueensCollege administration and staff, especially Wing Chan, for hostingthis study.
Edited by: A. Kiendler-Scharr
References
Andronache, C.: Estimated variability of below-cloud aerosol re-moval by rainfall for observed aerosol size distributions, Atmos.Chem. Phys., 3, 131–143,doi:10.5194/acp-3-131-2003, 2003.
Brown, S. S., Ryerson, T. B., Wollny, A. G., Brock, C. A.,Peltier, R., Sullivan, A. P., Weber, R. J., Dube, W. P., Trainer,M., Meagher, J. F., Fehsenfeld, F. C., and Ravishankara,A. R.: Variability in Nocturnal Nitrogen Oxide Processingand Its Role in Regional Air Quality, Science, 311, 67–70,doi:10.1126/science.1120120, 2006.
Chang, R. Y.-W., Slowik, J. G., Shantz, N. C., Vlasenko, A., Liggio,J., Sjostedt, S. J., Leaitch, W. R., and Abbatt, J. P. D.: The hygro-scopicity parameter (κ) of ambient organic aerosol at a field sitesubject to biogenic and anthropogenic influences: relationshipto degree of aerosol oxidation, Atmos. Chem. Phys., 10, 5047–5064,doi:10.5194/acp-10-5047-2010, 2010.
Clegg, S. L., Brimblecombe, P., and Wexler, A. S.: A thermo-dynamic model of the system H+-NH+
4 -SO4−2 -NO−
3 -H2O at
www.atmos-chem-phys.net/11/12737/2011/ Atmos. Chem. Phys., 11, 12737–12750, 2011
12748 Y. L. Sun et al.: A case study of aerosol processing and evolution in summer in New York City
tropospheric temperatures, J. Phys. Chem. A, 102, 2137–2154,1998.
DeCarlo, P. F., Kimmel, J. R., Trimborn, A., Northway, M. J., Jayne,J. T., Aiken, A. C., Gonin, M., Fuhrer, K., Horvath, T., Docherty,K. S., Worsnop, D. R., and Jimenez, J. L.: Field-Deployable,High-Resolution, Time-of-Flight Aerosol Mass Spectrometer,Anal. Chem., 78, 8281–8289, 2006.
DeCarlo, P. F., Ulbrich, I. M., Crounse, J., de Foy, B., Dunlea,E. J., Aiken, A. C., Knapp, D., Weinheimer, A. J., Campos,T., Wennberg, P. O., and Jimenez, J. L.: Investigation of thesources and processing of organic aerosol over the Central Mex-ican Plateau from aircraft measurements during MILAGRO, At-mos. Chem. Phys., 10, 5257–5280,doi:10.5194/acp-10-5257-2010, 2010.
Drewnick, F., Schwab, J. J., Jayne, J. T., Canagaratna, M., Worsnop,D. R., and Demerjian, K. L.: Measurement of ambient aerosolcomposition during the PMTACS-NY 2001 using an AerosolMass Spectrometer. Part I: Mass concentrations, Aerosol Sci.Tech., 38, 92–103, 2004a.
Drewnick, F., Schwab, J. J., Jayne, J. T., Canagaratna, M., Worsnop,D. R., and Demerjian, K. L.: Measurement of ambient aerosolcomposition during the PMTACS-NY 2001 using an AerosolMass Spectrometer. Part II: Chemically speciated mass distribu-tions, Aerosol Sci. Tech., 38, 104–117, 2004b.
Drewnick, F., Hings, S. S., DeCarlo, P. F., Jayne, J. T., Gonin, M.,Fuhrer, K., Weimer, S., Jimenez, J. L., Demerjian, K. L., Bor-rmann, S., and Worsnop, D. R.: A new Time-of-Flight AerosolMass Spectrometer (ToF-AMS) – Instrument description andfirst field deployment., Aerosol Sci. Tech., 39, 637–658, 2005.
Dunlea, E. J., DeCarlo, P. F., Aiken, A. C., Kimmel, J. R., Peltier,R. E., Weber, R. J., Tomlinson, J., Collins, D. R., Shinozuka,Y., McNaughton, C. S., Howell, S. G., Clarke, A. D., Emmons,L. K., Apel, E. C., Pfister, G. G., van Donkelaar, A., Martin, R.V., Millet, D. B., Heald, C. L., and Jimenez, J. L.: Evolutionof Asian aerosols during transpacific transport in INTEX-B, At-mos. Chem. Phys., 9, 7257–7287,doi:10.5194/acp-9-7257-2009,2009.
Dzepina, K., Volkamer, R. M., Madronich, S., Tulet, P., Ulbrich,I. M., Zhang, Q., Cappa, C. D., Ziemann, P. J., and Jimenez, J.L.: Evaluation of recently-proposed secondary organic aerosolmodels for a case study in Mexico City, Atmos. Chem. Phys., 9,5681–5709,doi:10.5194/acp-9-5681-2009, 2009.
Forster, P., Ramaswamy, V., Artaxo, P., Berntsen, T., Betts, R.,Fahey, D. W., Haywood, J., Lean, J., Lowe, D. C., Myhre, G.,Nganga, J., Prinn, R., Raga, G., Schulz, M., and Dorland, R. V.:Changes in Atmospheric Constituents and in Radiative Forcing.,in: Climate Change 2007: The Physical Science Basis. Con-tribution of Working Group I to the Fourth Assessment Reportof the Intergovernmental Panel on Climate Change, edited by:Solomon, S., Qin, D., Manning, M., Chen, Z., Marquis, M., Av-eryt, K. B., Tignor, M., and Miller, H. L., Cambridge UniversityPress, Cambridge, United Kingdom and New York, NY, USA.,2007.
Hallquist, M., Wenger, J. C., Baltensperger, U., Rudich, Y., Simp-son, D., Claeys, M., Dommen, J., Donahue, N. M., George,C., Goldstein, A. H., Hamilton, J. F., Herrmann, H., Hoff-mann, T., Iinuma, Y., Jang, M., Jenkin, M. E., Jimenez, J. L.,Kiendler-Scharr, A., Maenhaut, W., McFiggans, G., Mentel, Th.F., Monod, A., Prevot, A. S. H., Seinfeld, J. H., Surratt, J. D.,
Szmigielski, R., and Wildt, J.: The formation, properties andimpact of secondary organic aerosol: current and emerging is-sues, Atmos. Chem. Phys., 9, 5155–5236,doi:10.5194/acp-9-5155-2009, 2009.
He, L. Y., Lin, Y., Huang, X. F., Guo, S., Xue, L., Su, Q., Hu, M.,Luan, S. J., and Zhang, Y. H.: Characterization of high-resolutionaerosol mass spectra of primary organic aerosol emissions fromChinese cooking and biomass burning, Atmos. Chem. Phys., 10,11535–11543,doi:10.5194/acp-10-11535-2010, 2010.
Heald, C. L., Jacob, D. J., Park, R. J., Russell, L. M., Hue-bert, B. J., Seinfeld, J. H., Liao, H., and Weber, R. J.:A large organic aerosol source in the free troposphere miss-ing from current models, Geophys. Res. Lett., 32, L18809,doi:10.1029/2005GL023831, 2005.
Heald, C. L., Kroll, J. H., Jimenez, J. L., Docherty, K. S., DeCarlo,P. F., Aiken, A. C., Chen, Q., Martin, S. T., Farmer, D. K., andArtaxo, P.: A simplified description of the evolution of organicaerosol composition in the atmosphere, Geophys. Res. Lett., 37,L08803,doi:10.1029/2010gl042737, 2010.
Herndon, S. C., Onasch, T. B., Wood, E. C., Kroll, J. H., Cana-garatna, M. R., Jayne, J. T., Zavala, M. A., Knighton, W. B.,Mazzoleni, C., Dubey, M. K., Ulbrich, I. M., Jimenez, J. L.,Seila, R., de Gouw, J. A., de Foy, B., Fast, J., Molina, L. T.,Kolb, C. E., and Worsnop, D. R.: Correlation of secondary or-ganic aerosol with odd oxygen in Mexico City, Geophys. Res.Lett., 35, L15804,doi:10.1029/2008gl034058, 2008.
Huang, X. F., He, L. Y., Hu, M., Canagaratna, M. R., Sun, Y.,Zhang, Q., Zhu, T., Xue, L., Zeng, L. W., Liu, X. G., Zhang,Y. H., Jayne, J. T., Ng, N. L., and Worsnop, D. R.: Highlytime-resolved chemical characterization of atmospheric submi-cron particles during 2008 Beijing Olympic Games using anAerodyne High-Resolution Aerosol Mass Spectrometer, Atmos.Chem. Phys., 10, 8933–8945,doi:10.5194/acp-10-8933-2010,2010.
IPCC: Summary for Policymakers., In: Climate Change 2007: ThePhysical Science Basis. Contribution of Working Group I to theFourth Assessment Report of the Intergovernmental Panel onClimate Change, edited by: Solomon, S., Qin, D., Manning, M.,Chen, Z., Marquis, M., Averyt, K. B., Tignor, M., and Miller, H.L., Cambridge University Press, Cambridge, United Kingdomand New York, NY, USA., 2007.
Jayne, J. T., Leard, D. C., Zhang, X., Davidovits, P., Smith, K. A.,Kolb, C. E., and Worsnop, D. R.: Development of an aerosolmass spectrometer for size and composition analysis of submi-cron particles, Aerosol Sci. Tech., 33, 49–70, 2000.
Jimenez, J. L., Jayne, J. T., Shi, Q., Kolb, C. E., Worsnop, D. R.,Yourshaw, I., Seinfeld, J. H., Flagan, R. C., Zhang, X., Smith, K.A., Morris, J. W., and Davidovits, P.: Ambient aerosol samplingwith an Aerosol Mass Spectrometer, J. Geophys. Res.-Atmos.,108, 8425,doi:10:1029/2001JD001213, 2003.
Jimenez, J. L., Canagaratna, M. R., Donahue, N. M., Prevot, A. S.H., Zhang, Q., Kroll, J. H., DeCarlo, P. F., Allan, J. D., Coe,H., Ng, N. L., Aiken, A. C., Docherty, K. S., Ulbrich, I. M.,Grieshop, A. P., Robinson, A. L., Duplissy, J., Smith, J. D., Wil-son, K. R., Lanz, V. A., Hueglin, C., Sun, Y. L., Tian, J., Laak-sonen, A., Raatikainen, T., Rautiainen, J., Vaattovaara, P., Ehn,M., Kulmala, M., Tomlinson, J. M., Collins, D. R., Cubison, M.J., E, Dunlea, J., Huffman, J. A., Onasch, T. B., Alfarra, M. R.,Williams, P. I., Bower, K., Kondo, Y., Schneider, J., Drewnick,
Atmos. Chem. Phys., 11, 12737–12750, 2011 www.atmos-chem-phys.net/11/12737/2011/
Y. L. Sun et al.: A case study of aerosol processing and evolution in summer in New York City 12749
F., Borrmann, S., Weimer, S., Demerjian, K., Salcedo, D., Cot-trell, L., Griffin, R., Takami, A., Miyoshi, T., Hatakeyama, S.,Shimono, A., Sun, J. Y., Zhang, Y. M., Dzepina, K., Kimmel,J. R., Sueper, D., Jayne, J. T., Herndon, S. C., Trimborn, A.M., Williams, L. R., Wood, E. C., Middlebrook, A. M., Kolb,C. E., Baltensperger, U., and Worsnop, D. R.: Evolution oforganic aerosols in the atmosphere, Science, 326, 1525–1529,doi:10.1126/science.1180353, 2009.
Kanakidou, M., Seinfeld, J. H., Pandis, S. N., Barnes, I., Dentener,F. J., Facchini, M. C., Van Dingenen, R., Ervens, B., Nenes, A.,Nielsen, C. J., Swietlicki, E., Putaud, J. P., Balkanski, Y., Fuzzi,S., Horth, J., Moortgat, G. K., Winterhalter, R., Myhre, C. E.L., Tsigaridis, K., Vignati, E., Stephanou, E. G., and Wilson,J.: Organic aerosol and global climate modelling: a review, At-mos. Chem. Phys., 5, 1053–1123,doi:10.5194/acp-5-1053-2005,2005.
Kroll, J. H., Smith, J. D., Che, D. L., Kessler, S. H., Worsnop, D. R.,and Wilson, K. R.: Measurement of fragmentation and function-alization pathways in the heterogeneous oxidation of oxidized or-ganic aerosol, Phys. Chem. Chem. Phys., 11, 8005–8014, 2009.
Li, Y., Schwab, J. J., and Demerjian, K. L.: Measurements ofambient ammonia using a tunable diode laser absorption spec-trometer: Characteristics of ambient ammonia emissions in anurban area of New York City, J. Geophys. Res., 111, D10S02,doi:10.1029/2005jd006275, 2006.
Limbeck, A. and Puxbaum, H.: Dependence of in-cloud scavengingof polar organic aerosol compounds on the water solubility, J.Geophys. Res., 105, 19857–19867,doi:10.1029/2000JD900123,2000.
Lin, Y. C., Schwab, J. J., Demerjian, K. L., Bae, M.-S., Chen, W.-N., Sun, Y., Zhang, Q., Hung, H.-M., and Perry, J.: SummertimeFormaldehyde Observations in New York City: Ambient levels,Sources and Its Contribution to HOx Radicals, J. Geophys. Res.,submitted, 2011.
Liu, P. S. K., Deng, R., Smith, K. A., Williams, L. R., Jayne, J. T.,Canagaratna, M. R., Moore, K., Onasch, T. B., Worsnop, D. R.,and Deshler, T.: Transmission efficiency of an aerodynamic fo-cusing lens system: Comparison of model calculations and labo-ratory measurements for the Aerodyne Aerosol Mass Spectrom-eter, Aerosol Sci. Tech., 41, 721–733, 2007.
Massoli, P., Lambe, A. T., Ahern, A. T., Williams, L. R., Ehn, M.,Mikkil a, J., Canagaratna, M. R., Brune, W. H., Onasch, T. B.,Jayne, J. T., Petaja, T., Kulmala, M., Laaksonen, A., Kolb, C.E., Davidovits, P., and Worsnop, D. R.: Relationship betweenaerosol oxidation level and hygroscopic properties of laboratorygenerated secondary organic aerosol (SOA) particles, Geophys.Res. Lett., 37, L24801,doi:10.1029/2010gl045258, 2010.
Mohr, C., Huffman, J. A., Cubison, M. J., Aiken, A. C., Docherty,K. S., Kimmel, J. R., Ulbrich, I. M., Hannigan, M., and Jimenez,J. L.: Characterization of primary organic aerosol emissions frommeat cooking, trash burning, and motor vehicles with High-Resolution Aerosol Mass Spectrometry and comparison withambient and chamber observations, Environ. Sci. Technol., 43,2443–2449,doi:10.1021/es8011518, 2009.
Molina, M. J. and Molina, L. T.: Megacities and atmospheric pol-lution, J. Air Waste Manage. Assoc., 54, 644–680, 2004.
Morgan, W. T., Allan, J. D., Bower, K. N., Highwood, E. J., Liu,D., McMeeking, G. R., Northway, M. J., Williams, P. I., Krejci,R., and Coe, H.: Airborne measurements of the spatial distribu-
tion of aerosol chemical composition across Europe and evolu-tion of the organic fraction, Atmos. Chem. Phys., 10, 4065–4083,doi:10.5194/acp-10-4065-2010, 2010.
Ng, N. L., Canagaratna, M. R., Zhang, Q., Jimenez, J. L., Tian,J., Ulbrich, I. M., Kroll, J. H., Docherty, K. S., Chhabra, P. S.,Bahreini, R., Murphy, S. M., Seinfeld, J. H., Hildebrandt, L.,Donahue, N. M., DeCarlo, P. F., Lanz, V. A., Prevot, A. S. H.,Dinar, E., Rudich, Y., and Worsnop, D. R.: Organic aerosolcomponents observed in Northern Hemispheric datasets fromAerosol Mass Spectrometry, Atmos. Chem. Phys., 10, 4625–4641,doi:10.5194/acp-10-4625-2010, 2010.
Ng, N. L., Canagaratna, M. R., Jimenez, J. L., Chhabra, P. S., Se-infeld, J. H., and Worsnop, D. R.: Changes in organic aerosolcomposition with aging inferred from aerosol mass spectra, At-mos. Chem. Phys., 11, 6465–6474,doi:10.5194/acp-11-6465-2011, 2011.
Paatero, P. and Tapper, U.: Positive matrix factorization: A non-negative factor model with optimal utilization of error estimatesof data values, Environmetrics, 5, 111–126, 1994.
Petters, M. D., Carrico, C. M., Kreidenweis, S. M., Prenni, A. J.,DeMott, P. J., Collett, J. L., Jr., and Moosmuller, H.: Cloud con-densation nucleation activity of biomass burning aerosol, J. Geo-phys. Res., 114, D22205,doi:10.1029/2009jd012353, 2009.
Pope, C. A. III, Burnett, R. T., Thun, M. J., Calle, E. E., Krewski,D., Ito, K., and Thurston, G. D.: Lung cancer, cardiopulmonarymortality, and long-term exposure to fine particulate air pollu-tion, JAMA-J. Am. Med. Assoc., 287, 1132–1141, 2002.
Pope, C. A. III, Ezzati, M., and Dockery, D. W.: Fine-particulateair pollution and life expectancy in the United States, N. Engl. J.Med., 360, 376–386,doi:10.1056/NEJMsa0805646, 2009.
Poschl, U.: Atmospheric aerosols: Composition, transformation,climate and health effects, Angewandte Chemie-InternationalEdition, 44, 7520–7540, 2005.
Seinfeld, J. H. and Pandis, S. N.: Atmospheric chemistry andphysics: from air pollution to climate change, Wiley, John &Sons, Incorporated, New York, 1203 pp., 2006.
Sellegri, K., Laj, P., Dupuy, R., Legrand, M., Preunkert, S., andPutaud, J. P.: Size-dependent scavenging efficiencies of mul-ticomponent atmospheric aerosols in clouds, J. Geophys. Res.,108, 4334, doi:4310.1029/2002JD002749, 2003.
Sueper, D.: ToF-AMS Analysis Software, availableat: http://cires.colorado.edu/jimenez-group/ToFAMSResources/ToFSoftware/index.html, last access: 2 June 2011, 2011.
Sun, J., Zhang, Q., Canagaratna, M. R., Zhang, Y., Ng, N. L.,Sun, Y., Jayne, J. T., Zhang, X., Zhang, X., and Worsnop,D. R.: Highly time- and size-resolved characterization ofsubmicron aerosol particles in Beijing using an AerodyneAerosol Mass Spectrometer, Atmos. Environ., 44, 131–140,doi:10.1016/j.atmosenv.2009.03.020, 2010.
Sun, Y. L., Zhang, Q., Schwab, J. J., Demerjian, K. L., Chen, W.N., Bae, M. S., Hung, H. M., Hogrefe, O., Frank, B., Ratti-gan, O. V., and Lin, Y. C.: Characterization of the sources andprocesses of organic and inorganic aerosols in New York citywith a high-resolution time-of-flight aerosol mass apectrometer,Atmos. Chem. Phys., 11, 1581–1602,doi:10.5194/acp-11-1581-2011, 2011a.
Sun, Y. L., Zhang, Q., Zheng, M., Ding, X., Edgerton, E. S., andWang, X.: Characterization and source apportionment of water-soluble organic matter in atmospheric fine particles (PM2.5) with
www.atmos-chem-phys.net/11/12737/2011/ Atmos. Chem. Phys., 11, 12737–12750, 2011
12750 Y. L. Sun et al.: A case study of aerosol processing and evolution in summer in New York City
High-Resolution Aerosol Mass Spectrometry and GC–MS, En-viron. Sci. Technol., 45, 4854–4861,doi:10.1021/es200162h,2011b.
Ulbrich, I. M., Canagaratna, M. R., Zhang, Q., Worsnop, D. R., andJimenez, J. L.: Interpretation of organic components from Posi-tive Matrix Factorization of aerosol mass spectrometric data, At-mos. Chem. Phys., 9, 2891–2918,doi:10.5194/acp-9-2891-2009,2009.
Volkamer, R., Jimenez, J. L., Martini, F. S., Dzepina, K., Zhang,Q., Salcedo, D., Molina, L. T., Molina, M. J., and Worsnop,D. R.: Secondary organic aerosol formation from anthropogenicVOCs: Rapid and higher than expected, Geophys. Res. Lett., 33,L17811,doi:10.1029/2006GL026899, 2006.
Watson, J. G.: Visibility: Science and regulation, J. Air Waste Man-age. Assoc., 52, 628–713, 2002.
Weimer, S., Drewnick, F., Hogrefe, O., Schwab, J. J., Rhoads,K., Orsini, D., Canagaratna, M., Worsnop, D. R., and De-merjian, K. L.: Size-selective nonrefractory ambient aerosolmeasurements during the Particulate Matter Technology Assess-ment and Characterization Study – New York 2004 Winter In-tensive in New York City, J. Geophys. Res., 111, D18305,doi:10.1029/2006JD007215, 2006.
Wood, E. C., Canagaratna, M. R., Herndon, S. C., Onasch, T. B.,Kolb, C. E., Worsnop, D. R., Kroll, J. H., Knighton, W. B.,Seila, R., Zavala, M., Molina, L. T., DeCarlo, P. F., Jimenez,J. L., Weinheimer, A. J., Knapp, D. J., Jobson, B. T., Stutz,J., Kuster, W. C., and Williams, E. J.: Investigation of the cor-relation between odd oxygen and secondary organic aerosol inMexico City and Houston, Atmos. Chem. Phys., 10, 8947–8968,doi:10.5194/acp-10-8947-2010, 2010.
Zhang, Q., Alfarra, M. R., Worsnop, D. R., Allan, J. D., Coe, H.,Canagaratna, M. R., and Jimenez, J. L.: Deconvolution and quan-tification of hydrocarbon-like and oxygenated organic aerosolsbased on aerosol mass spectrometry, Environ. Sci. Technol., 39,4938–4952,doi:10.1021/es048568l, 2005a.
Zhang, Q., Canagaratna, M. C., Jayne, J. T., Worsnop, D. R.,and Jimenez, J. L.: Time and size-resolved chemical compo-sition of submicron particles in Pittsburgh – Implications foraerosol sources and processes, J. Geophys. Res., 110, D07S09,doi:10.1029/2004JD004649, 2005b.
Zhang, Q., Worsnop, D. R., Canagaratna, M. R., and Jimenez, J.L.: Hydrocarbon-like and oxygenated organic aerosols in Pitts-burgh: insights into sources and processes of organic aerosols,Atmos. Chem. Phys., 5, 3289–3311,doi:10.5194/acp-5-3289-2005, 2005c.
Zhang, Q., Jimenez, J. L., Canagaratna, M. R., Allan, J. D., Coe,H., Ulbrich, I., Alfarra, M. R., Takami, A., Middlebrook, A. M.,Sun, Y. L., Dzepina, K., Dunlea, E., Docherty, K., DeCarlo, P.F., Salcedo, D., Onasch, T., Jayne, J. T., Miyoshi, T., Shimono,A., Hatakeyama, S., Takegawa, N., Kondo, Y., Schneider, J.,Drewnick, F., Weimer, S., Demerjian, K., Williams, P., Bower,K., Bahreini, R., Cottrell, L., R.J.Griffin, Rautiainen, J., Sun, J.Y., Zhang, Y. M., and Worsnop, D. R.: Ubiquity and dominanceof oxygenated species in organic aerosols in anthropogenically-influenced northern hemisphere mid-latitudes, Geophys. Res.Lett., 34, L13801,doi:10.1029/2007GL029979, 2007a.
Zhang, Q., Jimenez, J. L., Worsnop, D. R., and Canagaratna, M.:A case study of urban particle acidity and its effect on sec-ondary organic aerosol, Environ. Sci. Technol., 41, 3213–3219,doi:10.1021/es061812j, 2007b.
Zhang, Q., Jimenez, J., Canagaratna, M., Ulbrich, I., Ng,N., Worsnop, D., and Sun, Y.: Understanding atmosphericorganic aerosols via factor analysis of aerosol mass spec-trometry: a review, Anal. Bioanal. Chem., 401, 3045–3067,doi:10.1007/s00216-011-5355-y, 2011.
Atmos. Chem. Phys., 11, 12737–12750, 2011 www.atmos-chem-phys.net/11/12737/2011/