
Nuclear methods in the inspection of macroscopical samples ...€¦ · Nuclear methods in the...
28
Nuclear methods in the inspection of macroscopical samples of material Angel Humberto Cruz Martha Liliana Cort´ es Nancy Forero Wilson Javier Blanco Zandra Omaira Silva Liliana Maritza Melo Mar´ ıa Fernanda Nader Edana Merch´ an Fernando Cristancho Universidad Nacional de Colombia Eduardo Fajardo Jos´ e Enrique Garc´ ıa Centro Internacional de F´ ısica J¨ urgen Gerl Fr´ ed´ eric Ameil Gesellschaft f¨ ur Schwerionenforschung Darmstadt, Alemania November 12, 2009
Transcript of Nuclear methods in the inspection of macroscopical samples ...€¦ · Nuclear methods in the...
Nuclear methods in the inspection of macroscopical samplesof material
Angel Humberto CruzMartha Liliana CortesNancy ForeroWilson Javier BlancoZandra Omaira SilvaLiliana Maritza MeloMarıa Fernanda NaderEdana MerchanFernando CristanchoUniversidad Nacional de Colombia
Eduardo FajardoJose Enrique GarcıaCentro Internacional de Fısica
Jurgen GerlFrederic AmeilGesellschaft furSchwerionenforschungDarmstadt, Alemania
November 12, 2009
The problem
Explosives with high content of organic material and low content in metal→ does not work the metal detector.
Alternative: methods that
• “see” the organic material , and...
• distinguish it from the soil.
1
The methods
1. Compton γ-ray Backscattering
2. Thermal Neutron Backscatering
The colombian case:
A. Wide range of humidity valuesB. Non-standard antipersonnel mines
2
The method
d
s
252Cfdetector A detector B
suelo
mina
neutrones
coordenate x0 of the mine
A(x)−B(x)
x0
0
B(x)A(x)signal
D(x) = D0
[
exp
(
x− x0 − s√2σ0
)2
− exp
(
x− x0 + s√2σ0
)2]
F. D. Brooks, M. Drosg, The HYDAD-D antipersonnel landmine detector.Appl. Rad. Isot. 63, 565 (2005).
3
Experimental set-up
Electronics + spectra
4
The dummy landmine (DLM2)
Acrylic→[H:C:N:O]=[4:2:0:1]
3.4
3.5
2.2
4 cm
TNT Simulant→[H:C:N:O]=[5:7:3:6]
simulates 100 g explosive
5
Simulation (Geant4) and experimental results
Soil = dry sand
6
7
8
9
10
11
B(x)(Counts×10
3) (a)
d = 0 cm
Sim
Exp
-2
-1
0
1
2
-30 -20 -10 0 10 20 30
D(x)(Counts×10
3)
x (cm)
(b)
6
The dependence on depth
-4
-2
0
2
4
-30 -20 -10 0 10 20 30
D(x)(Counts×10
3)
x(cm)
d(cm)
θ = 0%
051015
humidity = θ = 0%
7
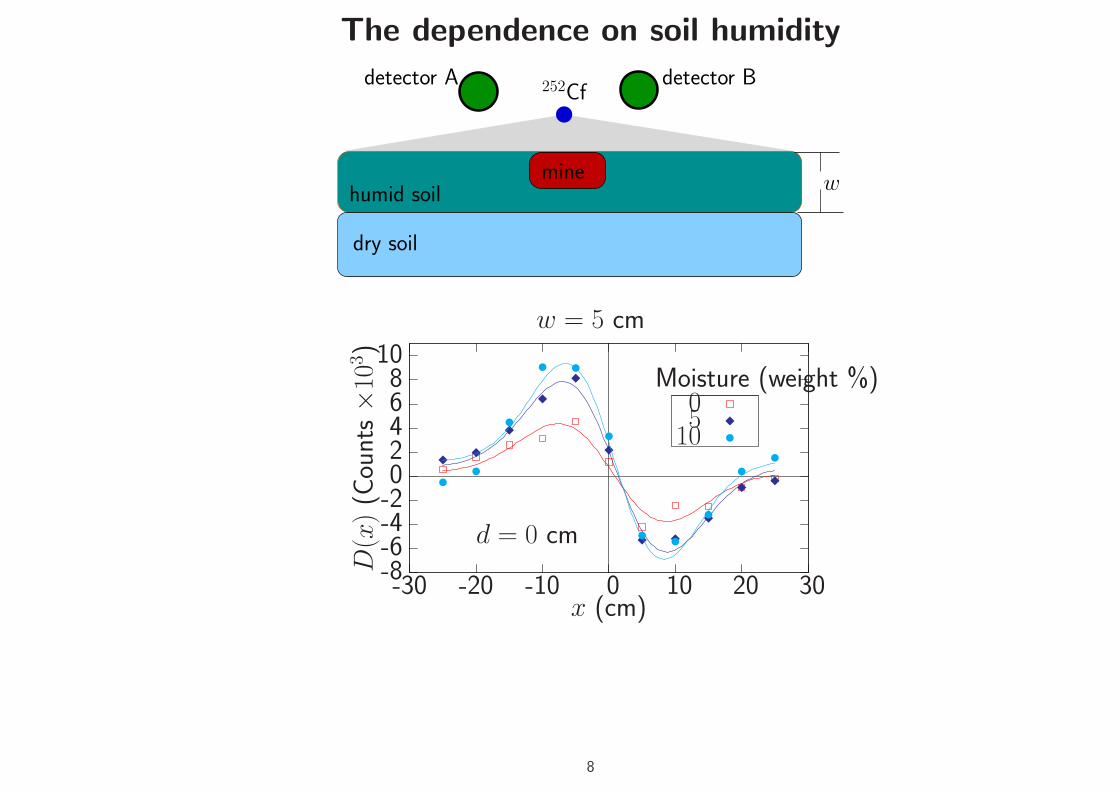
The dependence on soil humidity
252Cfdetector A detector B
wminehumid soil
dry soil
w = 5 cm
-8-6-4-20246810
-30 -20 -10 0 10 20 30
D(x)(Counts×10
3)
x (cm)
d = 0 cm
Moisture (weight %)0510
8

7.55.02.5
θ(%) = 0w = 18 cm
depth (cm)
D0(103
counts)
1614121086420
15
10
5
0
d = 0 cm
D0/D
0(θ
=0%)
2
1.5
1
0.5
0
-0.5
-1
-1.5
-2
-2.5
Sim.
Exp
0 10 20 40 50 60
θ(%)
30
9
Conclusions neutrons
1. A mine of around 100 g can be located with certainty up to a depth of 10 cm in drysand.
2. Humidity has an amplyfying effect → pre-thermalization.
3. Swamp-humidity produces negative signals, i.e., mines are detectable.
4. It is important to characterize the humidity region around D0 ≈ 0.
10
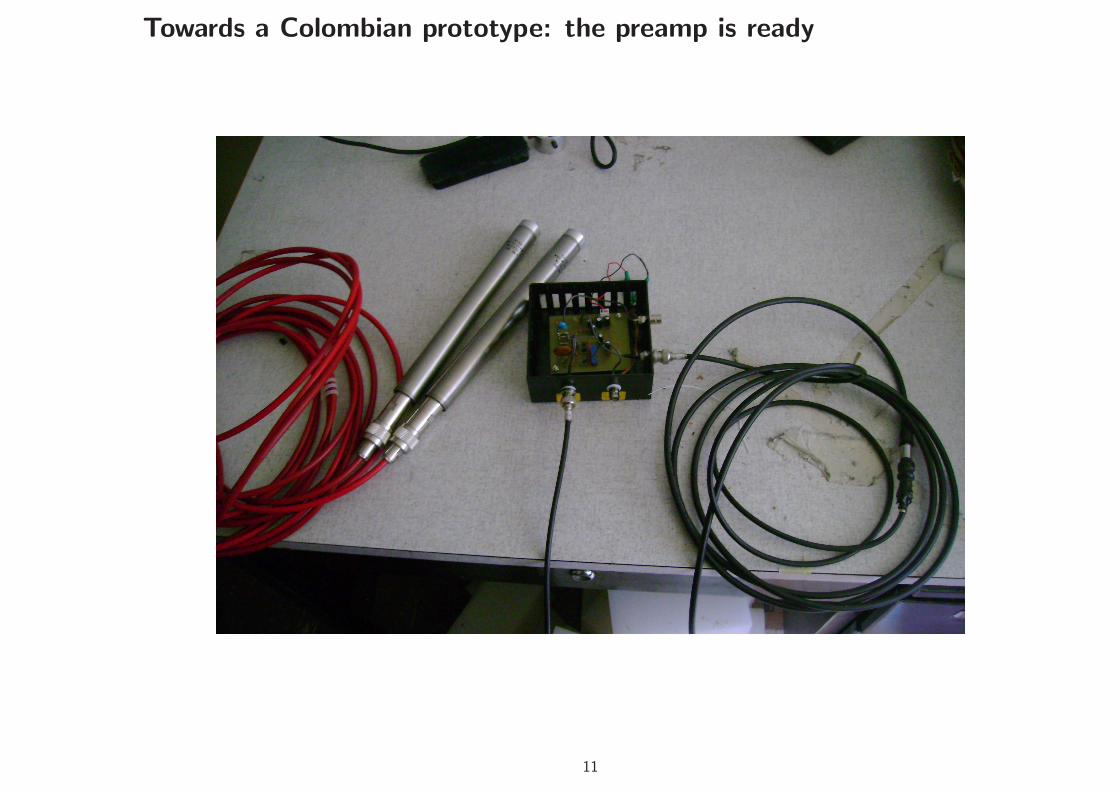
Towards a Colombian prototype: the preamp is ready
11
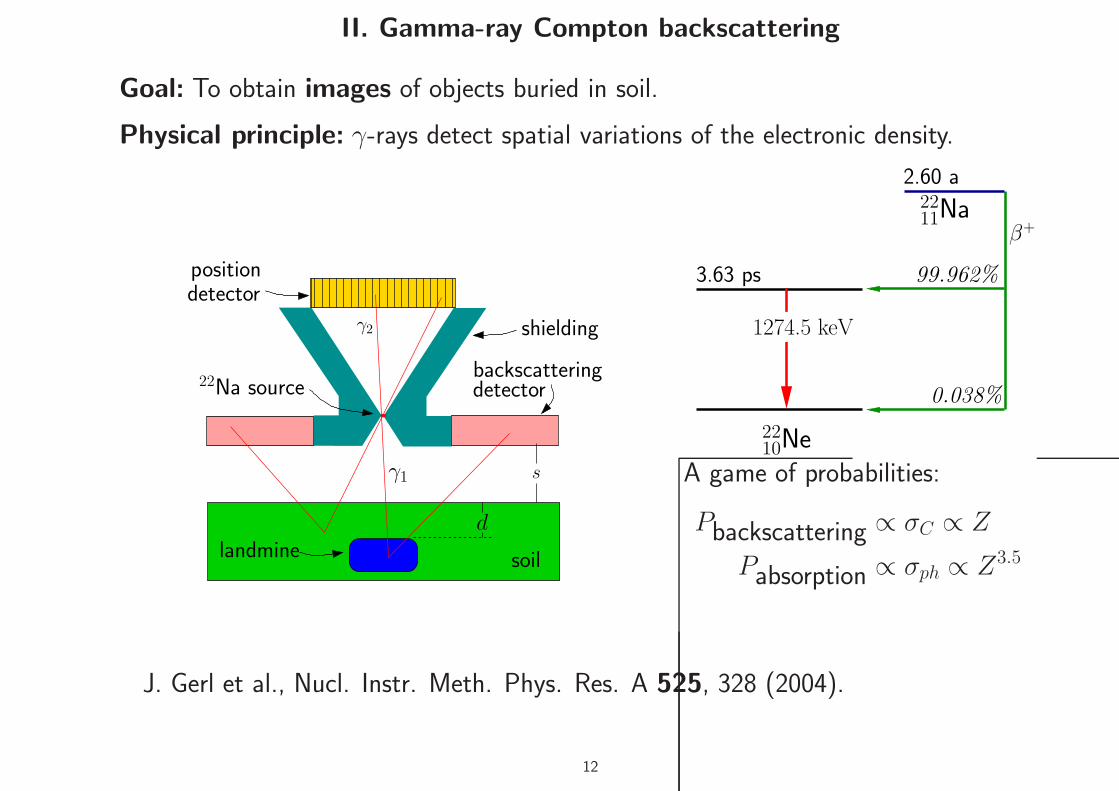
II. Gamma-ray Compton backscattering
Goal: To obtain images of objects buried in soil.
Physical principle: γ-rays detect spatial variations of the electronic density.
backscatteringdetector
shielding
detectorposition
22Na source
landmine soil
γ2
γ1 s
d
99.962%
0.038%
2211Na
2.60 a
β+
3.63 ps
2210Ne
1274.5 keV
A game of probabilities:
Pbackscattering ∝ σC ∝ Z
Pabsorption ∝ σph ∝ Z3.5
J. Gerl et al., Nucl. Instr. Meth. Phys. Res. A 525, 328 (2004).
12
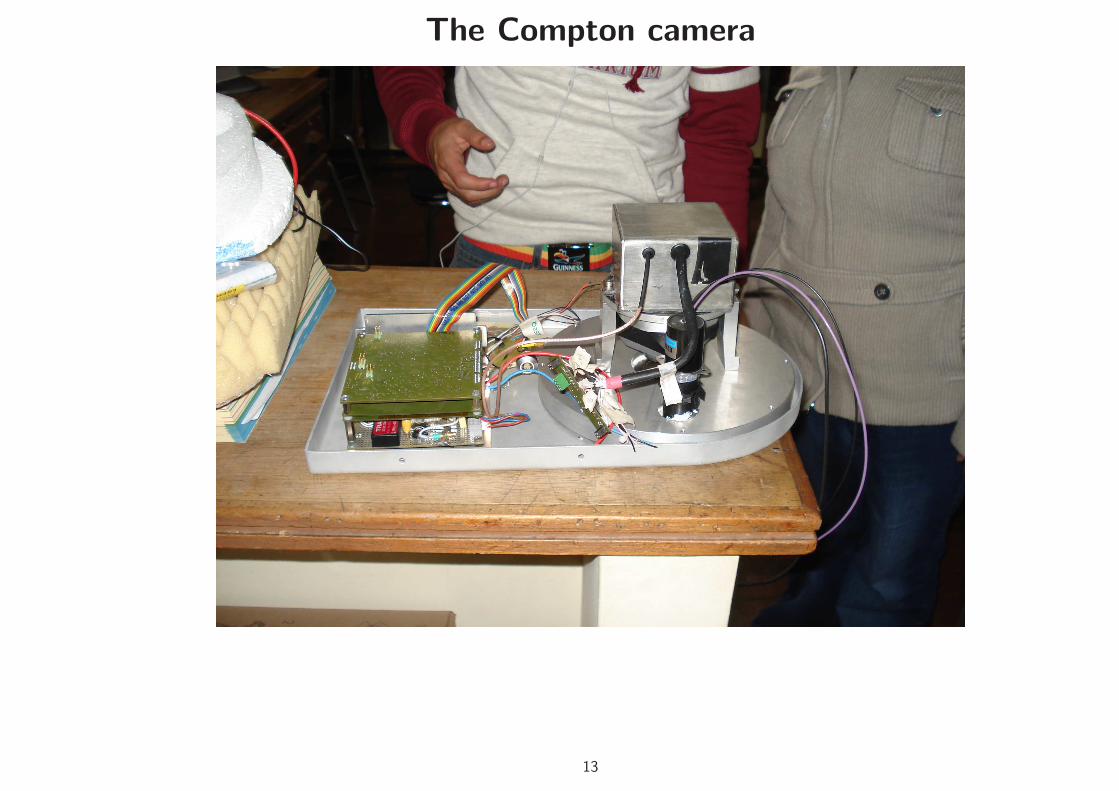
The Compton camera
13
R&D program
1. Independent research of γ-soil.
• Problem: existing data and theory describe just one event...
• ... whereas γ-soil:
(a) multiple colisions
(b) target: multielemental
2. Imaging: DAQ, pattern recognition, ...
3. Characterize the prototype
(a) Geometry: view of field, relative sizes, ...
(b) Operation values
(c) ...
4. Geant4 wherever it may seem to help.
14
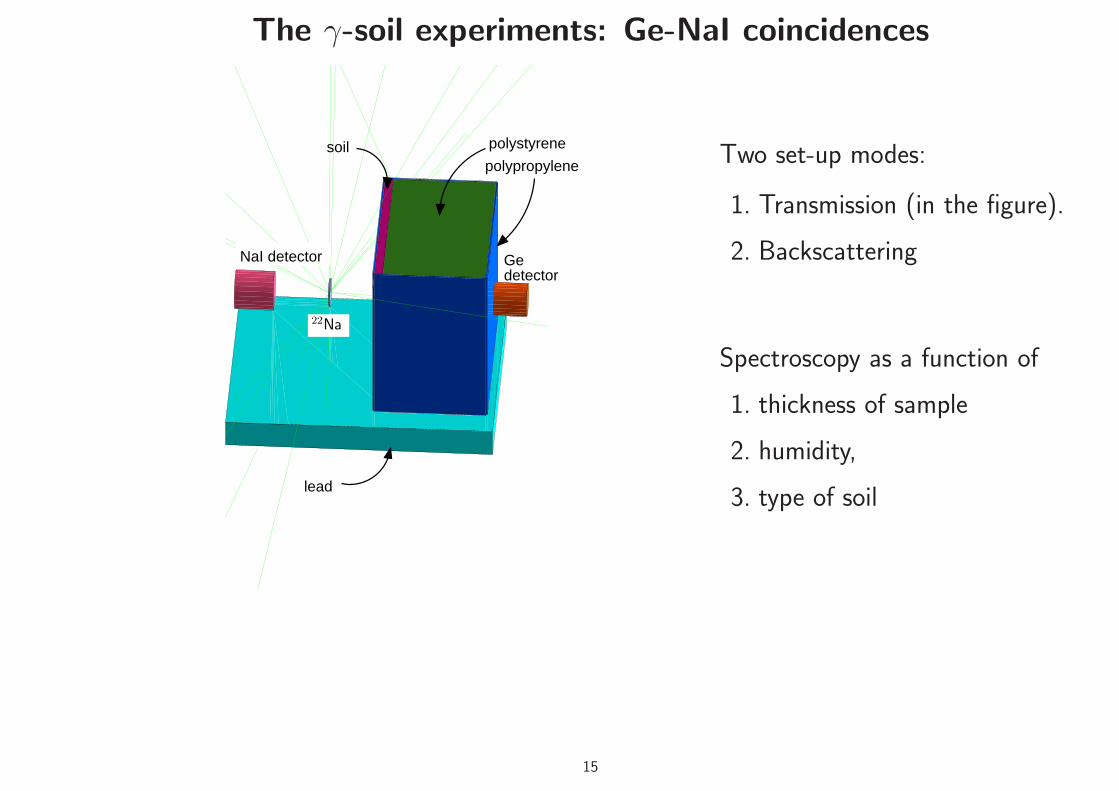
The γ-soil experiments: Ge-NaI coincidences
polystyrene
polypropylenesoil
lead
NaI detector Gedetector
22Na
Two set-up modes:
1. Transmission (in the figure).
2. Backscattering
Spectroscopy as a function of
1. thickness of sample
2. humidity,
3. type of soil
15
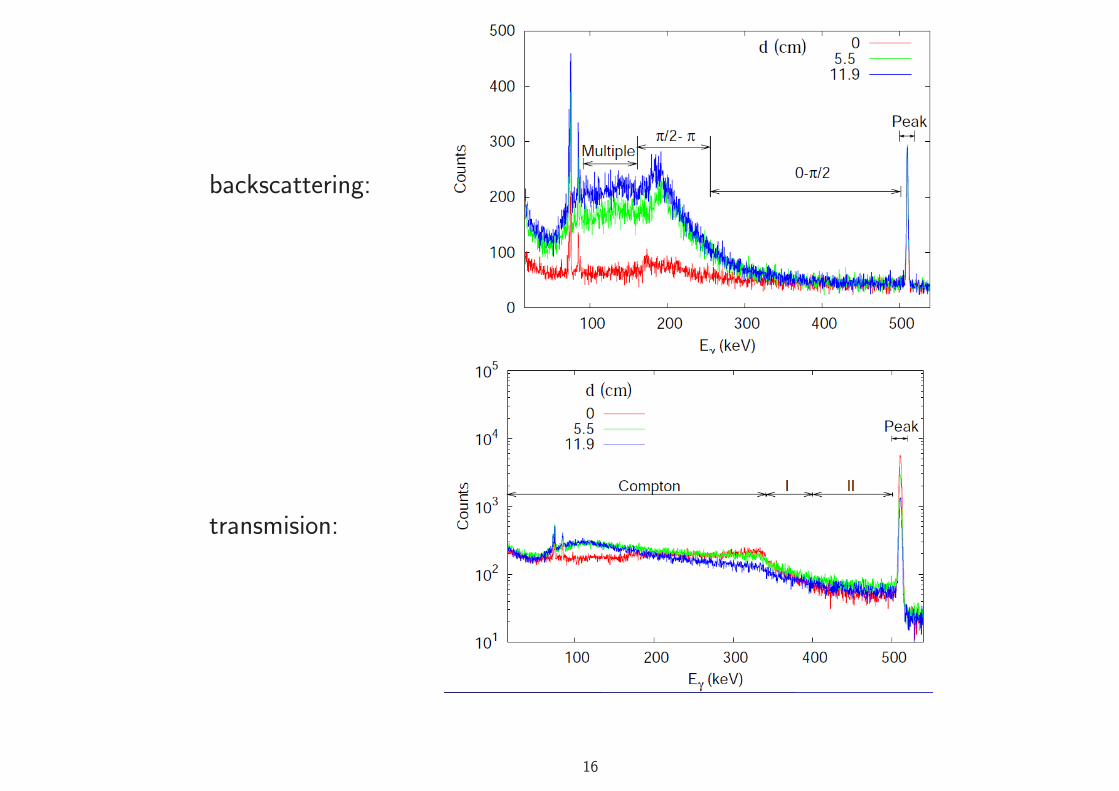
backscattering:
transmision:
16
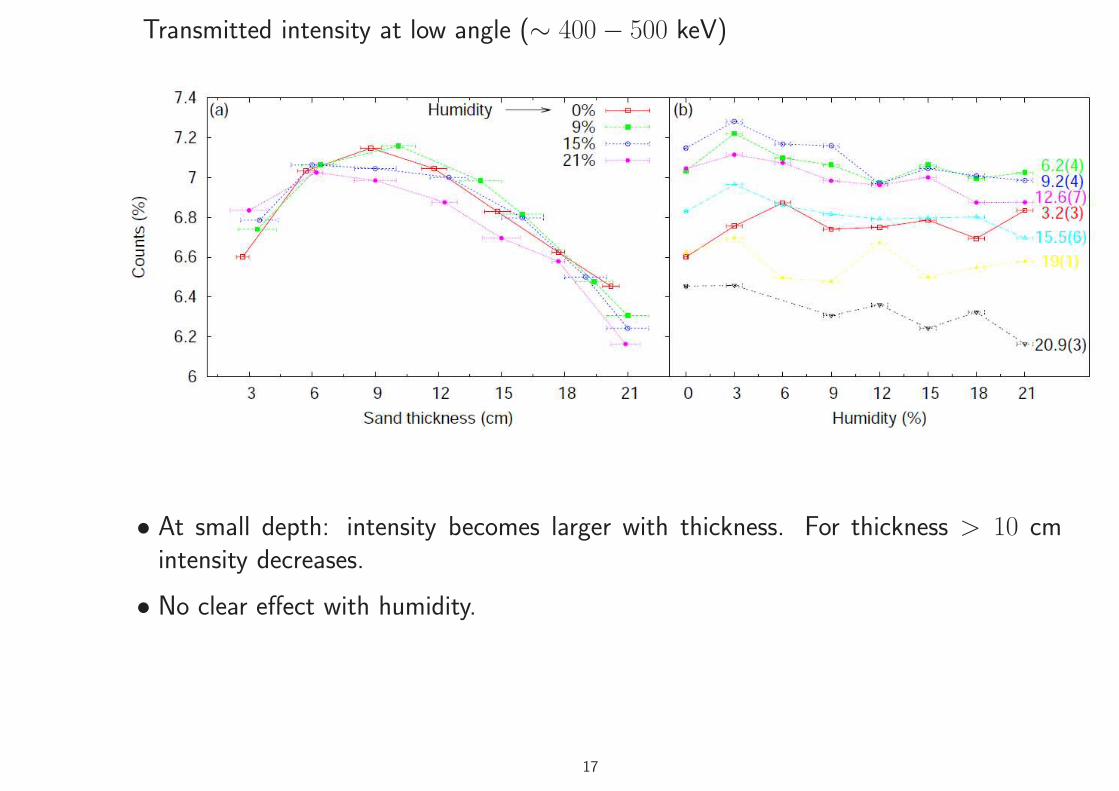
Transmitted intensity at low angle (∼ 400− 500 keV)
• At small depth: intensity becomes larger with thickness. For thickness > 10 cmintensity decreases.
• No clear effect with humidity.
17
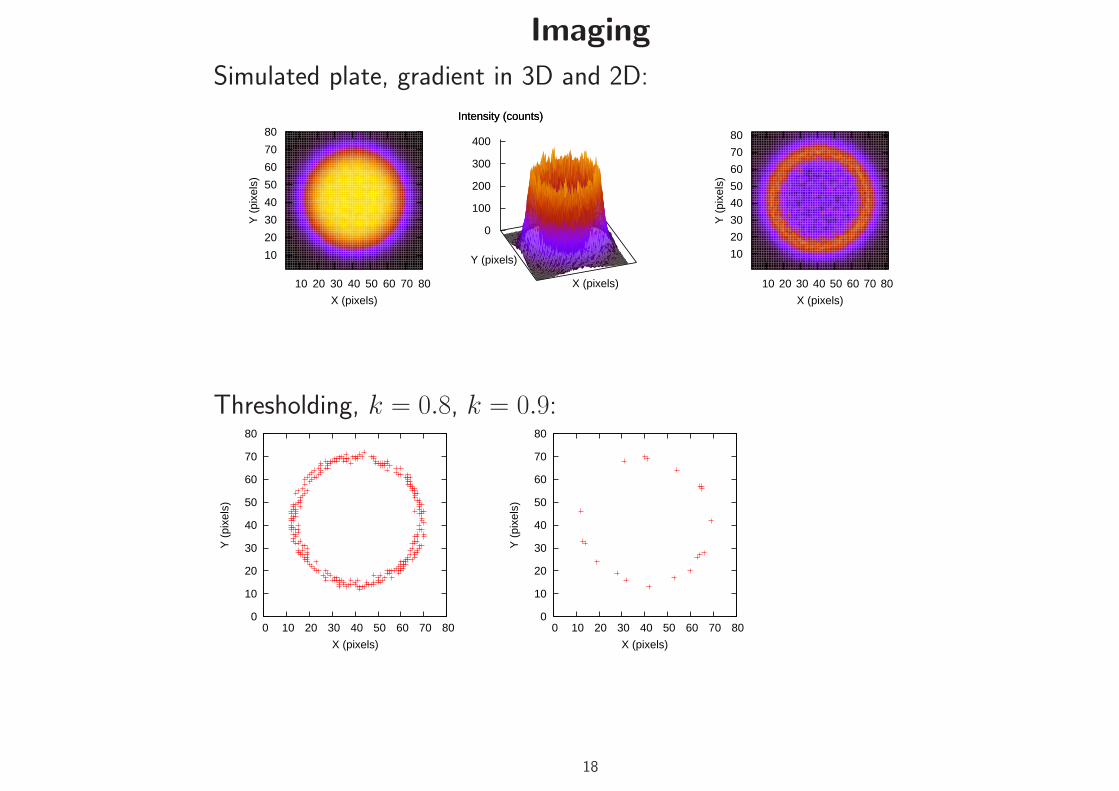
Imaging
Simulated plate, gradient in 3D and 2D:
X (pixels)
Y (
pixe
ls)
10 20 30 40 50 60 70 80
10
20
30
40
50
60
70
80 400
300
200
100
0
Intensity (counts)
X (pixels)
Y (pixels)
Intensity (counts)
X (pixels)
Y (
pixe
ls)
10 20 30 40 50 60 70 80
10
20
30
40
50
60
70
80
Thresholding, k = 0.8, k = 0.9:
0
10
20
30
40
50
60
70
80
0 10 20 30 40 50 60 70 80
Y (
pixe
ls)
X (pixels)
0
10
20
30
40
50
60
70
80
0 10 20 30 40 50 60 70 80
Y (
pixe
ls)
X (pixels)
18
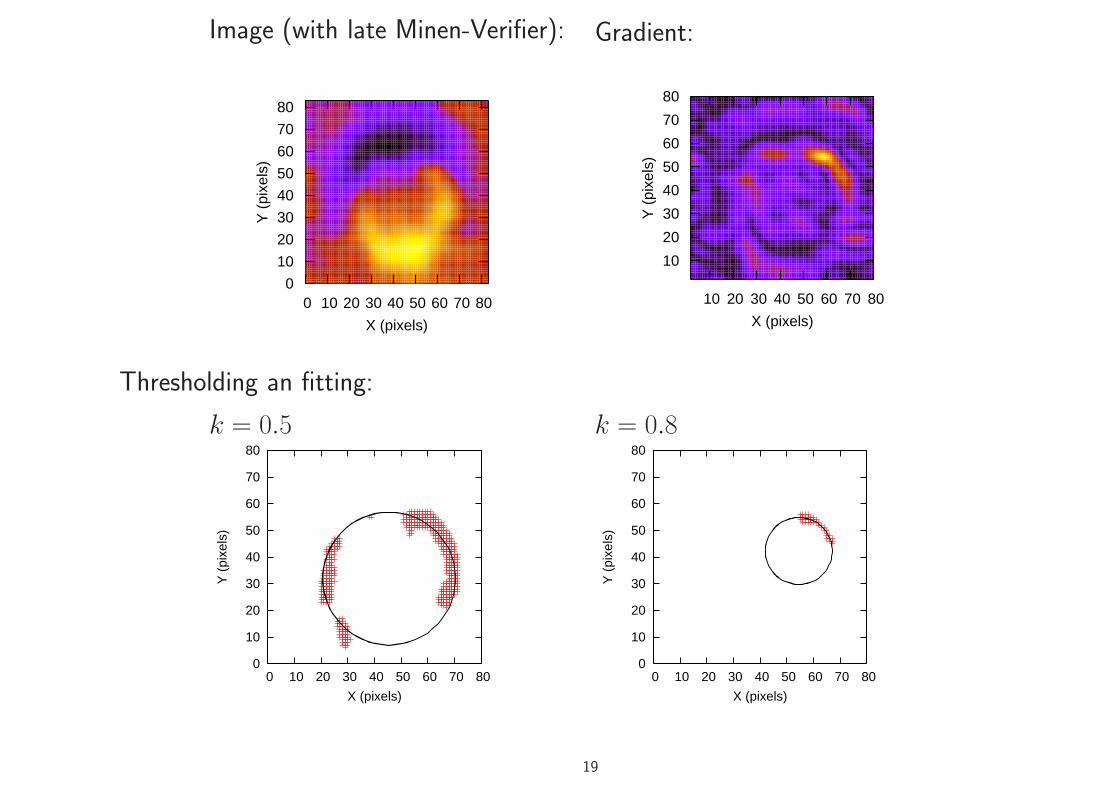
Image (with late Minen-Verifier):
X (pixels)
Y (
pixe
ls)
0 10 20 30 40 50 60 70 80 0
10
20
30
40
50
60
70
80
Gradient:
X (pixels)
Y (
pixe
ls)
10 20 30 40 50 60 70 80
10
20
30
40
50
60
70
80
Thresholding an fitting:
k = 0.5
0
10
20
30
40
50
60
70
80
0 10 20 30 40 50 60 70 80
Y (
pixe
ls)
X (pixels)
k = 0.8
0
10
20
30
40
50
60
70
80
0 10 20 30 40 50 60 70 80
Y (
pixe
ls)
X (pixels)
19
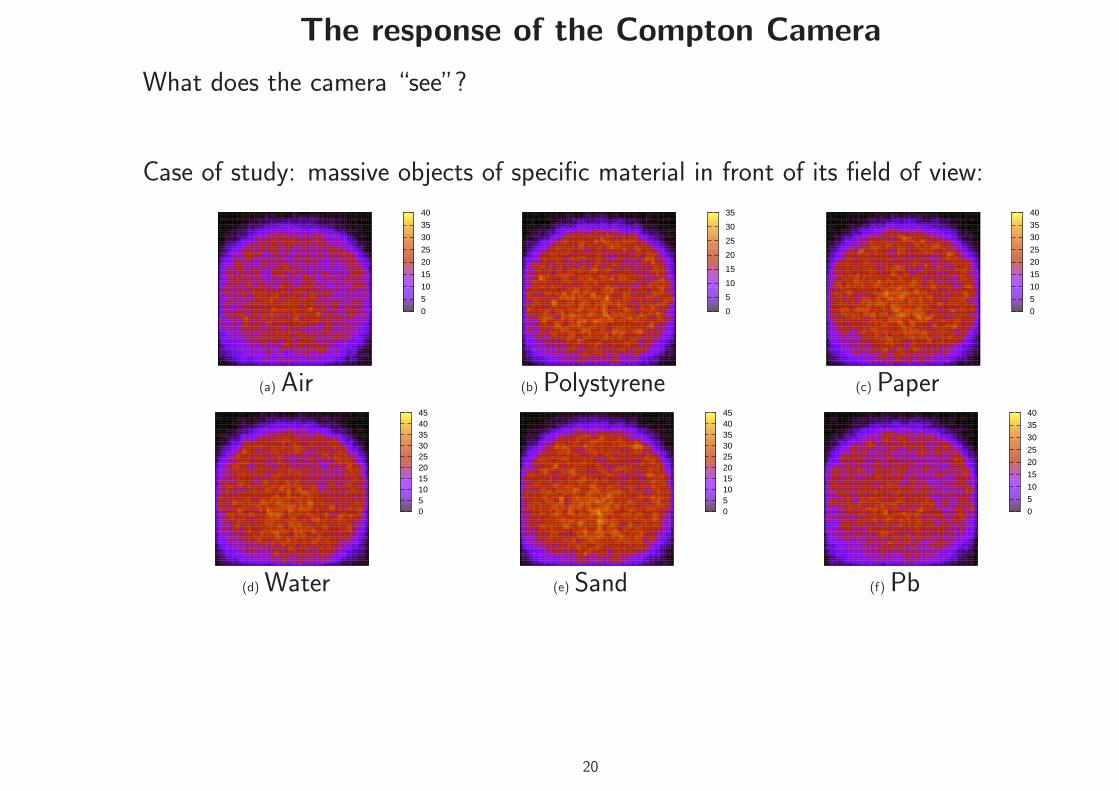
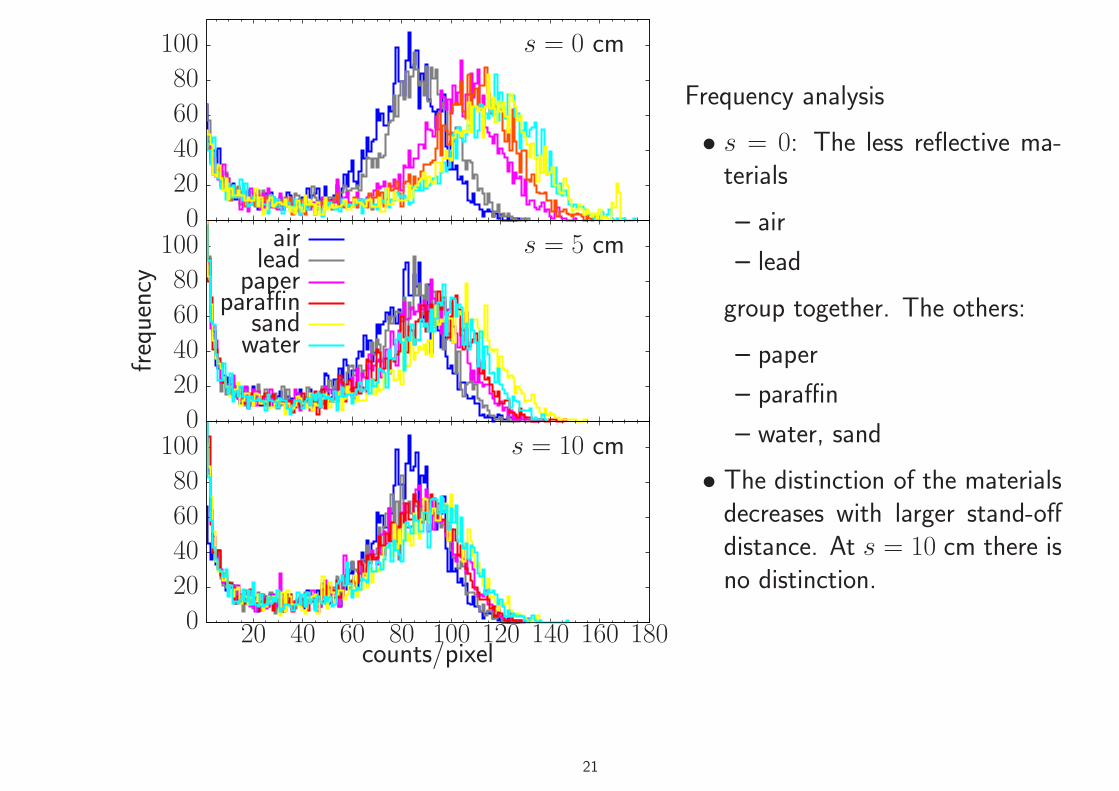
The response of the Compton Camera
What does the camera “see”?
Case of study: massive objects of specific material in front of its field of view:
0
5
10
15
20
25
30
35
40
(a) Air
0
5
10
15
20
25
30
35
(b) Polystyrene
0
5
10
15
20
25
30
35
40
(c) Paper
0 5 10 15 20 25 30 35 40 45
(d) Water
0 5 10 15 20 25 30 35 40 45
(e) Sand
0
5
10
15
20
25
30
35
40
(f) Pb
20
s = 10 cm
counts/pixel18016014012010080604020
100
80
60
40
20
0
watersand
paraffinpaperleadair s = 5 cm
frequency
100
80
60
40
20
0
s = 0 cm100
80
60
40
20
0
Frequency analysis
• s = 0: The less reflective ma-terials
– air
– lead
group together. The others:
– paper
– paraffin
– water, sand
• The distinction of the materialsdecreases with larger stand-offdistance. At s = 10 cm there isno distinction.
21
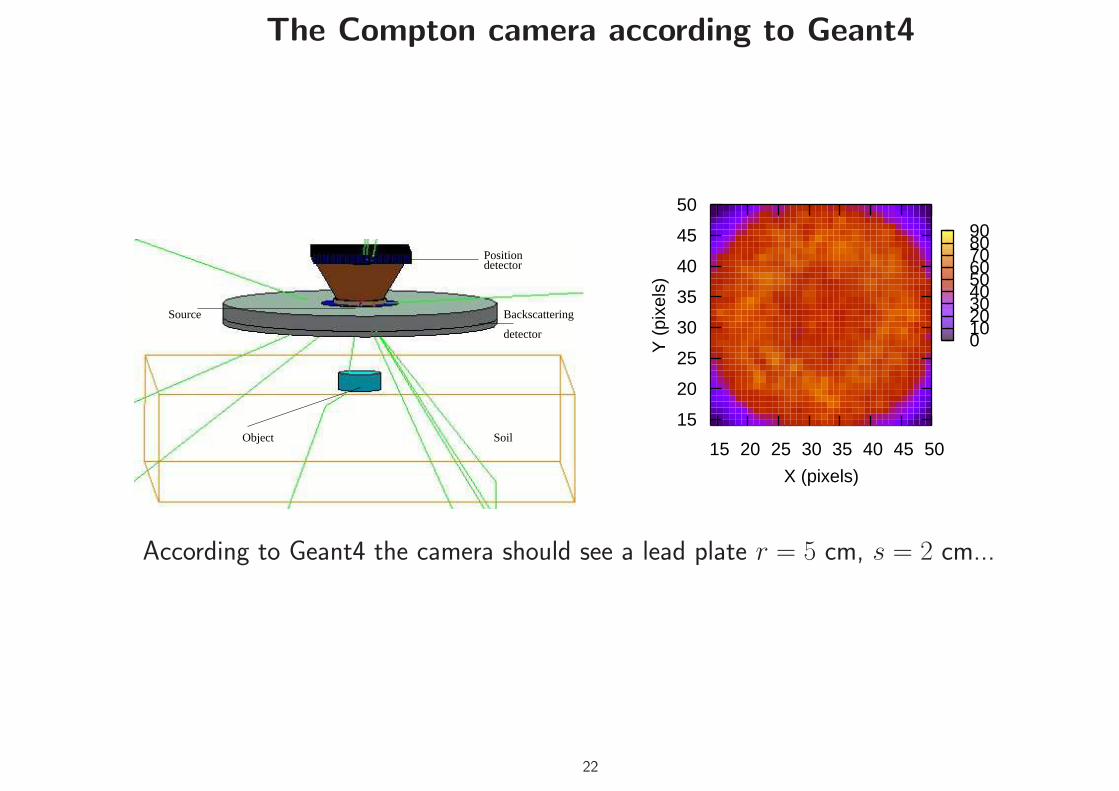
The Compton camera according to Geant4
Backscattering
detector
detectorPosition
Source
Object Soil
0 10 20 30 40 50 60 70 80 90
X (pixels)
Y (
pixe
ls)
15 20 25 30 35 40 45 50
15
20
25
30
35
40
45
50
According to Geant4 the camera should see a lead plate r = 5 cm, s = 2 cm...
22
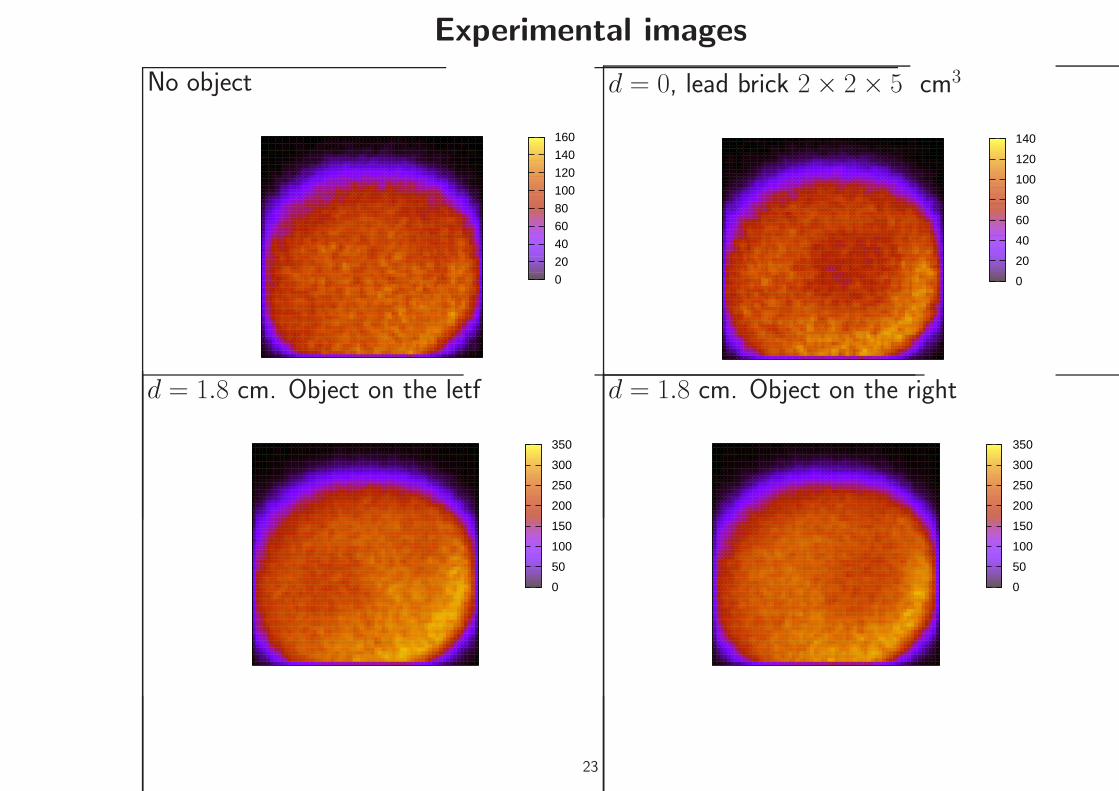
Experimental images
No object
0
20
40
60
80
100
120
140
160
d = 0, lead brick 2× 2× 5 cm3
0
20
40
60
80
100
120
140
d = 1.8 cm. Object on the letf
0
50
100
150
200
250
300
350
d = 1.8 cm. Object on the right
0
50
100
150
200
250
300
350
23

THANKS
24
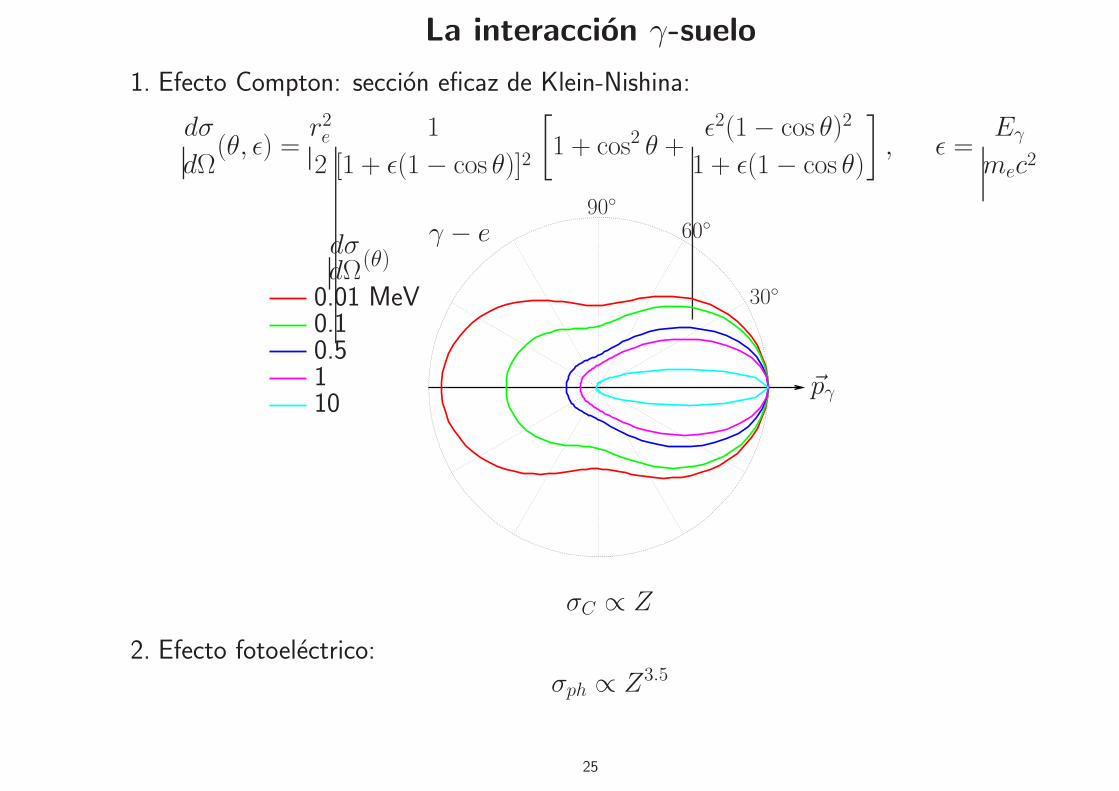
La interaccion γ-suelo
1. Efecto Compton: seccion eficaz de Klein-Nishina:
dσ
dΩ(θ, ǫ) =
r2e2
1
[1 + ǫ(1− cos θ)]2
[
1 + cos2 θ +ǫ2(1− cos θ)2
1 + ǫ(1− cos θ)
]
, ǫ =Eγ
mec2
1010.50.10.01 MeV
~pγ
90
60
30
γ − edσdΩ(θ)
σC ∝ Z
2. Efecto fotoelectrico:σph ∝ Z3.5
25
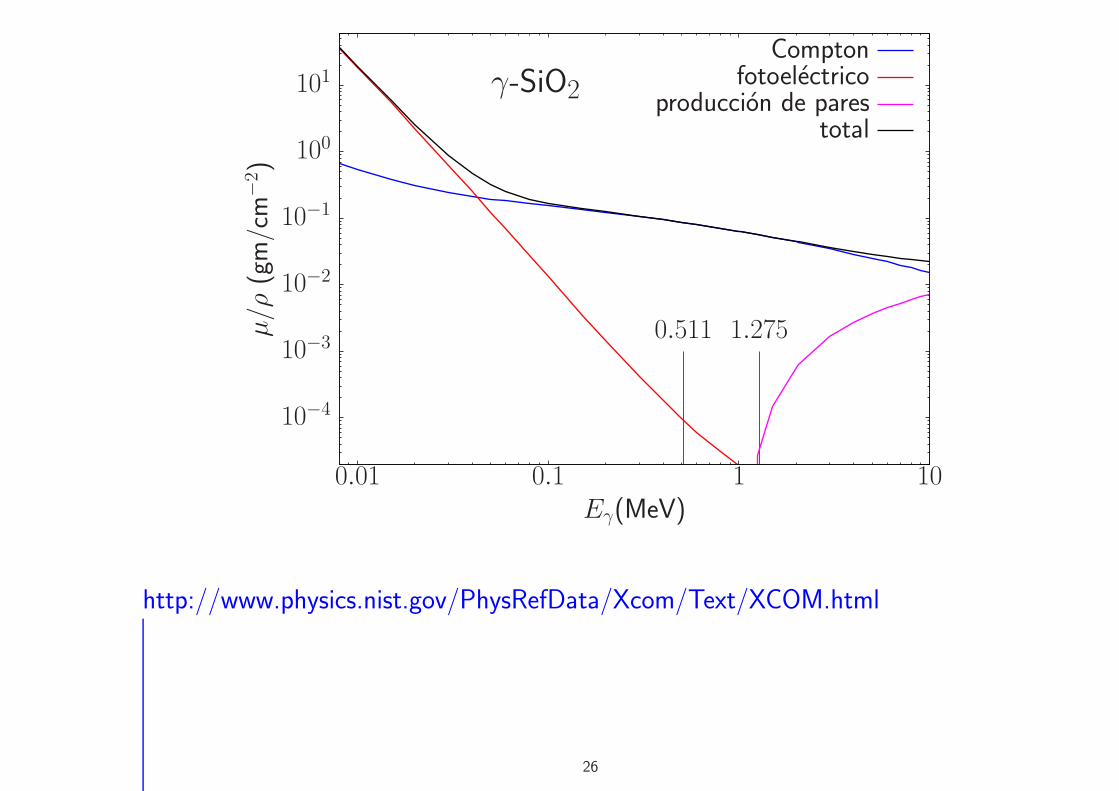
totalproduccion de pares
fotoelectricoCompton
1.2750.511
γ-SiO2
Eγ(MeV)
µ/ρ
(gm/cm
−2)
1010.10.01
101
100
10−1
10−2
10−3
10−4
http://www.physics.nist.gov/PhysRefData/Xcom/Text/XCOM.html
26
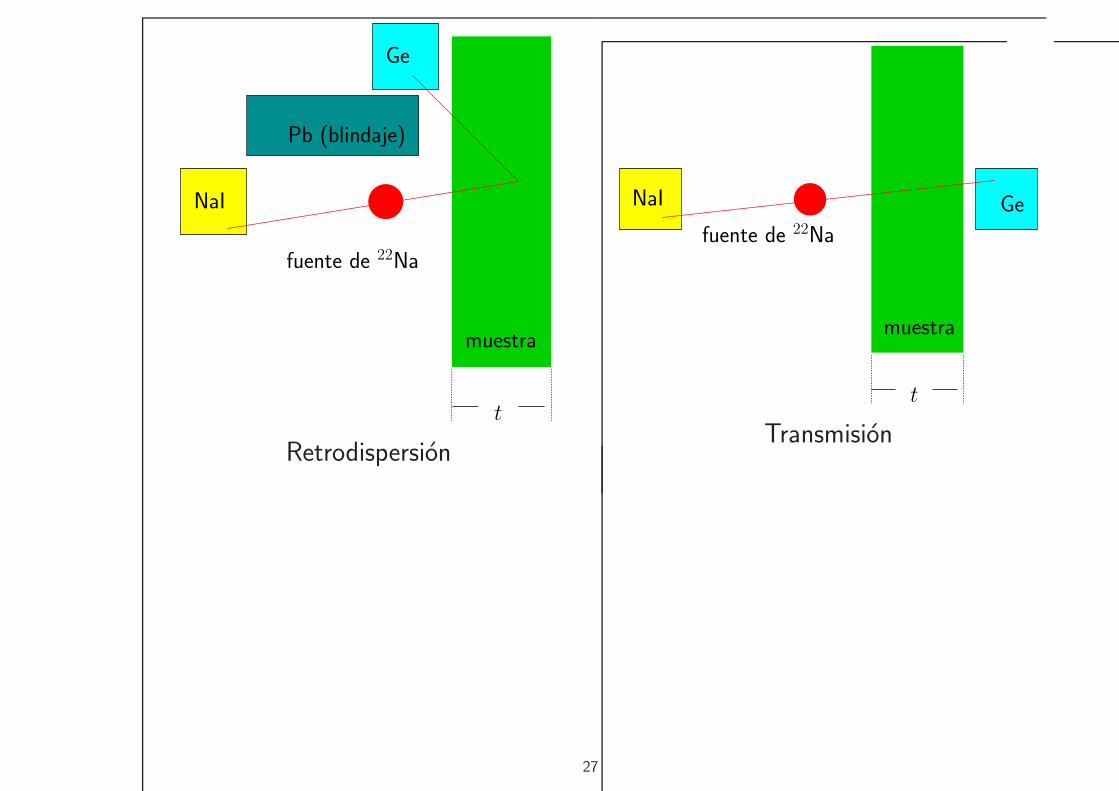
NaI
Ge
fuente de 22Na
Pb (blindaje)
muestra
t
Retrodispersion
NaI
muestra
t
Ge
fuente de 22Na
Transmision
27