NSW: A Clean Energy Superpower
172
NSW: A Clean Energy Superpower Industry Opportunities Enabled by Cheap, Clean and Reliable Electricity FINAL REPORT Prepared by KPMG with the NSW Office of the Chief Scientist and Engineer for the NSW Department of Planning, Industry and Environment 23 September 2020
Transcript of NSW: A Clean Energy Superpower

NSW: A Clean Energy Superpower Industry Opportunities Enabled by Cheap, Clean and Reliable Electricity FINAL REPORT
Prepared by KPMG with the NSW Office of the Chief Scientist and Engineer for the NSW Department of Planning, Industry and Environment
23 September 2020

DISCLAIMER INHERENT LIMITATIONS
This report has been prepared by KPMG, with input from the NSW Office of the Chief Scientist and Engineer, for the NSW Department of Planning, Industry and Environment, and as set out in the Scope Section of our engagement contract dated 18 May 2020. The services provided by KPMG in connection with this engagement comprise an advisory engagement, which is not subject to assurance or other standards issued by the Australian Auditing and Assurance Standards Board and, consequently no opinions or conclusions intended to convey assurance have been expressed.
KPMG makes no warranty of completeness, accuracy or reliability is given in relation to the statements and representations made by, and the information and documentation provided by, the NSW Department of Planning, Industry and Environment the NSW Office of the Chief Scientist and Engineer and other NSW Government agencies consulted as part of the process.
No reliance should be placed by the NSW Department of Planning, Industry and Environment on additional oral remarks provided during the presentation, unless these are confirmed in writing by KPMG.
KPMG have indicated within this report the sources of the information provided. We have not sought to independently verify those sources unless otherwise noted within the report.
KPMG is under no obligation in any circumstance to update this report, in either oral or written form, for events occurring after the report has been issued in final form.
NOTICE TO THIRD PARTIES
This report is solely for the purpose set out in the Scope Section and for the NSW Department of Planning, Industry and Environment’s information and is not to be used for any purpose not contemplated in KPMG engagement contract or to be distributed to any other party without KPMG’s prior written consent.
This report has been prepared at the request of the NSW Department of Planning, Industry and Environment in accordance with the terms of KPMGs contract dated 18 May 2020. Other than our responsibility to the NSW Department of Planning, Industry and Environment, neither KPMG nor any member or employee of KPMG undertakes responsibility arising in any way from reliance placed by a third party on this report. Any reliance placed is that party’s sole responsibility.

© 2020 KPMG, an Australian partnership and a member firm of the KPMG network of independent member firms affiliated with KPMG International Cooperative (“KPMG International”), a Swiss entity. All rights reserved. The KPMG name and logo are registered trademarks or trademarks of KPMG International. Liability limited by a scheme approved under Professional Standards Legislation.
Document Classification: KPMG Confidential
Executive summary Background The New South Wales (NSW) Government’s Net Zero Plan Stage 1: 2020-2030 sets an expectation to reduce NSW emissions by 35 per cent relative to 2005 levels by 2030 and achieve net zero emissions by 2050.1 It also outlines an objective to achieve this target via approaches that maximise economic opportunity, prosperity and wellbeing for NSW citizens.
Renewable and low-emissions electricity is a key transition pathway to reduce emissions as NSW’s coal-fired power stations approach the end of their use life. The NSW Electricity Strategy, released in 2019, provides the overarching framework to support this transition in NSW. It interfaces with the Net Zero Plan Stage 1: 2020-2030 and seeks to coordinate private investment in reliable and clean electricity infrastructure and reduce electricity prices by addressing critical market barriers to investment. Additionally, the NSW and Commonwealth governments have entered into a memorandum of understanding (MOU)where $450 million has been prioritised for the Emissions Intensity Reduction Program, which will support large NSW-based sources of emissions to transition their plant, equipment and other assets to low emissions alternatives. The memorandum also prioritises the Clean Technology Program, which will research, develop and commercialise emissions reduction technologies. Together these support the transition to generating and using reliable, affordable and sustainable renewable and low-emissions energy.2 The MOU also includes significant funding programs for electric vehicles and emissions abatement in the agriculture and land sector.
Electricity and energy are fundamental inputs to all households and industry, and there are significant current and emerging opportunities for industry growth and development in NSW over the long term. Some opportunities, such as hydrogen production, advanced manufacturing opportunities, and controlled environmental horticulture are already recognised, with industry and government already working together to coordinate efforts to channel investment and create the enabling market conditions. Other opportunities will continue to emerge over time.
The NSW Government’s collective economic and industries development plans, all of which align to its overarching 2040 Economic Blueprint, seek to create the enabling environment for such opportunities to be realised in NSW. Reliable, clean, and lower cost electricity will be a necessary pre-condition to maximising the value and long-term impact of these opportunities for jobs and growth in NSW over the short, medium and long term.
This report considers a range of these opportunities in NSW.
Purpose and Scope This report has been developed for the NSW Department of Planning, Industry and Environment (DPIE). Its purpose is to prioritise actions for government, industry and other stakeholders to pursue and enable industry development opportunities that can leverage NSW’s transition to reliable, low cost clean energy.
The scope of this report is as follows:
• identify industry development opportunities associated with integrated clean energy deployment;
• analyse potential costs and deployment rates of selected clean energy technologies;
1 Department of Planning, Industry and Environment 2019, ‘Net Zero Plan Stage 1: 2020 – 2030’, NSW Government, NSW.
2 NSW Government 2019, ‘NSW Electricity Strategy’, NSW Government, NSW.

© 2020 KPMG, an Australian partnership and a member firm of the KPMG network of independent member firms affiliated with KPMG International Cooperative (“KPMG International”), a Swiss entity. All rights reserved. The KPMG name and logo are registered trademarks or trademarks of KPMG International. Liability limited by a scheme approved under Professional Standards Legislation.
Document Classification: KPMG Confidential
• analyse the preconditions (cost and readiness) for existing and emerging industries to leverage clean energy technologies;
• analyse the potential economic size of industry opportunities to leverage clean energy technologies; and
• prioritise industry opportunities and future considerations with respect to location, technologies and policy needs and potential infrastructure requirements.
Approach and Limitations The report synthesises a broad range of domestic and international data, research, and industry information to consider each opportunity. It also includes illustrative projections of the potential long-term cost pathways of clean energy technologies to illustrate the sensitivity of opportunities to different drivers of cost. Further, it draws on available industry and government data and publicly available information to illustrate the relative size and significance of different opportunities. The report outlines the analysis method, assumptions, and data and research sources.
The report has been prepared by KPMG with input from the NSW Office of the Chief Scientist and Engineer (OCSE) and a range of other NSW Government stakeholders. OCSE provided a range of inputs in relation to the various technologies and opportunities considered in this report and the technical assumptions informing the analysis and modelling.
There is a range of potential factors impacting current and future costs and the realisation of the opportunities considered. Many of these factors are subject to significant uncertainty, particularly over longer time periods. The analysis for each opportunity is intended to provide a snapshot of the current evidence base and identify the key considerations and uncertainties associated with each opportunity.
The insights from this report are intended to form one input to the NSW Government’s consideration of actions to further investigate and accelerate the delivery of the opportunities considered. It is not intended and should not be interpreted as an appraisal of the current or future feasibility, costs or benefits associated with these opportunities. These will need to be subject to further specific consideration as part of dedicated feasibility studies as the basis of investment and/or other decisions by government and industry.
The body of the report provides further details of the approach and limitations.
Key Findings Based on current evidence and the analysis in this report, the following table summarises the opportunity size and the key actions for the NSW Government to progress opportunity development.
Table 1: Opportunity size and actions for consideration for selected industry opportunities
Industry Opportunity
Potential Opportunity Size Potential Timeframe
Suggested Actions for Consideration by the NSW Government
A NSW hydrogen industry
The National Hydrogen Strategy estimated that the hydrogen industry in Australia could generate approximately 7,600 jobs and $11 billion per year in additional GDP by 2050.3
Short, medium to long term
• Continue to strengthen partnerships across industry, research and all levels of government to accelerate industry development.
• Continue to develop and subsequently build on and implement the NSW Hydrogen Strategy.
3 The former COAG Energy Council, 2019, ‘Australia’s National Hydrogen Strategy’.

© 2020 KPMG, an Australian partnership and a member firm of the KPMG network of independent member firms affiliated with KPMG International Cooperative (“KPMG International”), a Swiss entity. All rights reserved. The KPMG name and logo are registered trademarks or trademarks of KPMG International. Liability limited by a scheme approved under Professional Standards Legislation.
Document Classification: KPMG Confidential
Industry Opportunity
Potential Opportunity Size Potential Timeframe
Suggested Actions for Consideration by the NSW Government
Green steel production
Every percentage point increase in industry output relative to current levels could deliver up to additional $20 million in annual revenues and up to $7 million in annual direct and indirect wages in today’s dollars.4
Short, medium to long term
• Continue to engage with industry to understand, monitor and consider actions to address current operational cost pressures of pathways to decarbonising operations.
• Partner with industry to assess long term strategic pathways and enabling strategies to support potential greenfield development.
Green aluminium production
Every percentage point increase in industry output (or avoided industry decline) relative to current levels could deliver an additional $50 million in annual revenues and around $14 million in annual direct wages in today’s dollars.5
Short to medium term
• Engage with industry in respect of current operations and cost pressures.
• Engage with industry to assess the economic and technical feasibility of leveraging renewable technology and storage.
Green ammonia production
Every percentage point of global market share able to be captured by NSW is worth approximately $102 million in today’s dollars (assuming 2018 market size).6 7
The economic opportunities could be significantly larger with potential for greater ammonia uptake across a wide range of industries including currently as a fertiliser and into the future as a common feedstock for production and energy storage (for hydrogen fuel)
Medium to long term
• Continue to establish and embed linkages to collaborate with existing industry initiatives such as pilot electrolysis projects in NSW and Australia.
• Build the evidence base to size the current and future market and competitive landscape, including demand for future emerging industry supply chains.
4 Estimated based on current industry revenue and estimated earnings. For direct employees, earnings were estimated based on an assumed average full-
time wage of $1,750 per week, and assuming workers are all full-time, equivalent to $273 million per year. At an assumed identical average wage of $1,750,
and an average 0.2 to 0.5 FTE, the estimated value of earnings for indirect employees could be up to $455 million per annum. The average full-time wage in
steel and aluminium smelting was derived by the Grattan Institute based on analysis of the ABS Census (2017); see Wood, T, Dundas, G and Ha, J 2020,
‘Start with steel’. A practical plan to support carbon workers and cut emissions’, Grattan Institute.
5 Based on industry revenue of $5 billion (IBISWorld, Aluminium Smelting in Australia - Market Research Report, October 2019,
https://www.ibisworld.com/au/industry/aluminium-smelting/227/, accessed 4 August 2020) and on an equivalent increase in workforce with a full-time
workforce earning $1,750 per week in June 2016 dollars, converted to March 2020 dollars (typical full-time wage in steel and aluminium smelting, derived by
the Grattan Institute based on analysis of the ABS Census (2017); see Wood, T, Dundas, G and Ha, J 2020, ‘Start with steel’. A practical plan to support
carbon workers and cut emissions’, Grattan Institute). Earnings converted into March 2020 dollars (ABS Consumer Price Index, March 2020, released 29
April 2020).
6 Ammonia, The Observatory of Economic Complexity.
7 Dollar conversions are based on the average closing price of the Australian dollar in US dollar terms in foreign exchange markets in year of observation.
Source: Australian – US Dollar Exchange Rate (AUD USD) – Historical Chart, Macrotrends.

© 2020 KPMG, an Australian partnership and a member firm of the KPMG network of independent member firms affiliated with KPMG International Cooperative (“KPMG International”), a Swiss entity. All rights reserved. The KPMG name and logo are registered trademarks or trademarks of KPMG International. Liability limited by a scheme approved under Professional Standards Legislation.
Document Classification: KPMG Confidential
Industry Opportunity
Potential Opportunity Size Potential Timeframe
Suggested Actions for Consideration by the NSW Government
Sustainable chemical and synthetic fuel production
There are many potential industry applications for synthetic fuels, including liquid organic hydrogen carriers (LHOC) to transport and store hydrogen and other chemicals made using cheaper green energy.
The international markets for chemicals and synthetic fuels, such as ethanol and methanol, are worth tens of billions of dollars and are expected to grow domestically and internationally over time as demand and use applications increase.
Increasing NSW’s capacity to capture a fraction of the domestic and international market using low-cost renewable energy sources could enable the realisation to significant economic and industry benefits in the state.
Long term • Partner with industry to understand and clarify the importance of local chemicals and synthetic fuels manufacturing and the economic and strategic importance of different end use cases.
• Consider the potential for a precinct approach for sustainable chemicals and fuels manufacturing to maximise circular economy benefits and to lower capital, infrastructure and feedstock costs, and reduce skills barriers.
• Investing, incentivising or creating regulatory enablers to stimulate industry investment and development.
• Support research and development and small demonstration trials.
Transport and logistics
Every additional one per cent share of BEV of registered passenger vehicles in NSW has the potential to result in direct cost savings of up to $89.3 million per annum.8
Based on potential future costs, total future FCEV bus operating costs in NSW may be up to $234.8 million lower than ICE bus operating costs in 2030 in today’s dollars.
Based on potential future costs, total future operating costs of articulated and semi-rigid trucks could be up to $103.1 million per annum and $42.6 million per annum lower respectively than their ICE counterparts in the respective years they attain cost competitiveness. The operating cost saving for truck operators are projected to grow annually in the years after cost-competitiveness is attained.
Short to medium term
• For buses – Use the outcomes of bus trials, such as electric bus trial by Nowra Coaches and Sydney Airport and the H2OzBus project, to inform the development of business case(s) for option to scale low-emissions bus services.
• For freight – Work with the industry to model options to optimise and prioritise investment in decarbonisation opportunities and associated infrastructure across the NSW road freight network.
• For private vehicles – Identify approaches to build on initiatives in the NSW Electric Vehicle and Hybrid Plan, including consideration of incentives, infrastructure, and other industry programs.
8 Based on the total kilometres travelled in NSW by registered passenger vehicles and total number of registered vehicles in NSW (ABS Survey of Motor
Vehicle Use, 2017-18), assuming the average passenger vehicle is a medium sized vehicle with a vehicle operating cost of $0.33/km (Principles and
Guidelines for Economic Appraisal of Transport Investment and Initiatives, NSW Treasury , 2016) and average passenger BEV has a charging cost of
$0.14/km and an average of $350 in maintenance and servicing costs per year (Mythbusting, About Electric Vehicles, Electric Vehicle Council).

© 2020 KPMG, an Australian partnership and a member firm of the KPMG network of independent member firms affiliated with KPMG International Cooperative (“KPMG International”), a Swiss entity. All rights reserved. The KPMG name and logo are registered trademarks or trademarks of KPMG International. Liability limited by a scheme approved under Professional Standards Legislation.
Document Classification: KPMG Confidential
Industry Opportunity
Potential Opportunity Size Potential Timeframe
Suggested Actions for Consideration by the NSW Government
Controlled environmental horticulture
Combined horticulture contributed around nine per cent of total gross value of production of NSW primary industries in 2016-17 (around $1.4 billion). Efficiency and yield strengths of controlled environmental horticulture and sustain growth in domestic and international demand for horticultural products can see the sector grow significantly.
As one example, the Agribusiness Precinct at the Western Sydney Aerotropolis alone is expected to contribute up to 2,500 FTE jobs, 12,000 indirect jobs, and $2.8 billion in revenue over a 10-year full scale up.9 Controlled environmental horticulture facilities will be key components in an integrated Agribusiness Precinct.
Short term • Build and leverage work underway in the Western City and Aerotropolis Authority in respect of the Agribusiness Precinct at the Western Sydney Aerotropolis.
• Continue to support the development of low-cost energy infrastructure, including Renewable Energy Zones (REZs), and water infrastructure to enable the establishment of controlled environmental horticulture (CEH) sites in strategic locations.
• Link with industry-lead feasibility studies and business cases to confirm the specific location(s), scale, and crop focus of new CEH facilities across NSW that can maximise economic impact.
It will be important that each opportunity is progressed in partnership with industry and across relevant government agencies and builds on developments and strategic priorities already established.
9 KPMG 2019, World-class intensive integrated production hub in the Western Sydney Aerotropolis.

© 2020 KPMG, an Australian partnership and a member firm of the KPMG network of independent member firms affiliated with KPMG International Cooperative (“KPMG International”), a Swiss entity. All rights reserved. The KPMG name and logo are registered trademarks or trademarks of KPMG International. Liability limited by a scheme approved under Professional Standards Legislation.
Document Classification: KPMG Confidential
Detailed Findings and Actions The following sections outline the key findings with respect to each industry opportunity. The body of the report provides detailed supporting analysis.
A NSW hydrogen industry
Key Finding: The development of a hydrogen industry is a significant long-term opportunity for NSW. In addition to the economic benefits of new industry formation, it has the potential to enable many downstream industry applications, including transport, agriculture and advanced manufacturing. However, the production, transport and storage infrastructure required for green hydrogen to be scalable and cost competitive is not expected until at least the medium term. Continued partnership across industry and government, together with new investments and research and development is critical to accelerating this pathway. Further consideration of health and safety requirements for workers, infrastructure and surrounding populations and environments should also be considered as future opportunities are clarified and explored further.
The following considerations are suggested for the NSW Government:
Actions to progress
• In partnership with industry and the Commonwealth and other State and Territory Governments, the NSW Government should continue driving the acceleration of the hydrogen pathway. This should be coordinated to support initiatives and programs under the upcoming state-based NSW Hydrogen Strategy.
• In line with this progress, the NSW Government should continue to build on the NSW Hydrogen Strategy by identifying and prioritising specific pilots and initiatives, research and development, and other programs and incentives to support and accelerate industry development.
• The NSW Government and industry should also strengthen collaboration to consider and align the safety and regulatory implications of increased hydrogen production, transport, storage and use with several current and future applications and locations.
Strategic Alignment
• NSW Hydrogen Strategy (under development) • National Hydrogen Strategy • NSW Electricity Strategy • NSW Net Zero Plan • NSW Economic Blueprint • Future Transport 2056 • NSW Freight and Ports Plan • 20-Year Economic Vision for Regional NSW • The Greater Sydney Region Plan - A Metropolis of Three Cities • The Greater Newcastle Metropolitan Plan 2036
Regional Alignment
• Greater Sydney • Hunter Valley • Illawarra-Shoalhaven • Potential collocation with other industries in inland regions.

© 2020 KPMG, an Australian partnership and a member firm of the KPMG network of independent member firms affiliated with KPMG International Cooperative (“KPMG International”), a Swiss entity. All rights reserved. The KPMG name and logo are registered trademarks or trademarks of KPMG International. Liability limited by a scheme approved under Professional Standards Legislation.
Document Classification: KPMG Confidential
Green steel
Key Finding: There is potential to develop a NSW green steel industry. There are a number of different technological pathways to reduce emission in steel making, including heating of furnaces and ovens, and as reducing agents that can replace carbon monoxide produced from coke. However, there are barriers due to infrastructure requirements, the high cost of green hydrogen technology, and the long-expected time horizon to achieving cost competitiveness for some processes.
The following considerations are suggested for the NSW Government:
Actions to progress
• Government (DPIE) should continue to work in partnership with current industry operators to: - monitor the evolving industry dialogue and emerging technology
pathways and risks; - understand shorter- and longer-term financial issues and cost
pressures, including the expected impact of NSW Government’s reform and investment agenda; and
- understand and consider options to enable continued industry development in line with industry and government objectives.
• For future potential greenfield operations, industry and government (DPIE, DPC, NSW Treasury, Regional NSW) should partner to undertake a strategic scoping study to identify and appraise transition pathways and enable strategies to support potential greenfield development.
Strategic Alignment
• Net Zero Plan: Emissions Intensity Reduction, Hydrogen, Clean Technology, and Low Emissions Building Materials programs
• NSW Hydrogen Strategy (under development) • National Hydrogen Strategy • The Greater Sydney Region Plan - A Metropolis of Three Cities • NSW Defence and Industry Strategy • 20-Year Economic Vision for Regional NSW
Regional Alignment
• Hunter Valley • Illawarra-Shoalhaven
Green aluminium
Key Finding: The recently announced closure of the Rio Tinto New Zealand Aluminium Smelters and other announcements by industry have highlighted the cost pressures and risks faced by current aluminium producers. Notwithstanding these risks, there is also potential for a future NSW green aluminium industry in NSW. It will be heavily dependent on the cost, stability and reliability of renewable electricity and storage capability that can enable the industry to compete and increase output and market share domestically and internationally.
The following considerations are suggested for the NSW Government:
Actions to progress
• Recognising the energy and cost intensity of current production, government (DPIE) should continue work with industry to: - monitor the evolving industry dialogue and emerging risks; - understand shorter- and longer-term financial issues, including the
expected impact of reforms and investments being made by the NSW Government; and
- understand and consider options to enable continued industry development in line with industry and government objectives.

© 2020 KPMG, an Australian partnership and a member firm of the KPMG network of independent member firms affiliated with KPMG International Cooperative (“KPMG International”), a Swiss entity. All rights reserved. The KPMG name and logo are registered trademarks or trademarks of KPMG International. Liability limited by a scheme approved under Professional Standards Legislation.
Document Classification: KPMG Confidential
• Government (DPIE, DPC, NSW Treasury, Regional NSW) should assist industry-led feasibility studies of any potential opportunities for future greenfield operations, that may be identified by industry and/or government, that can leverage renewable technology and storage including technical requirements and alignment with NSW and Commonwealth investments.
Strategic Alignment
• Net Zero Plan: Emissions Intensity Reduction Program • NSW Electricity Strategy • Transmission Infrastructure Strategy • The Greater Newcastle Metropolitan Plan 2036 • 20-Year Economic Vision for Regional NSW
Regional Alignment
• Hunter Valley
Green ammonia
Key Finding: There is significant economic potential for a green ammonia industry in NSW, with ammonia an important component of agricultural fertilisers, chemical feedstock and also as an energy carrier/ fuel. There appears to be pathways in the shorter term to use renewables to power existing SMR hydrogen and future green hydrogen production activities for use in low-emissions electricity powered ammonia production plants. Further opportunities exist to source bioenergy/biomethane feedstocks into current SMR hydrogen production processes. Further consideration of health and safety requirements for workers, infrastructure and surrounding populations and environments should also be considered as future opportunities are clarified and explored further.
The following considerations are suggested for the NSW Government:
Actions to progress
• Government should continue to establish and embed linkages with existing industry initiatives across Australia, including current and planned projects and trial programs.
• Build a greater evidence base to assess the size and scope of the future market opportunity and the competitive landscape. Government should consider facilitating, in partnership with industry, a market study to build on available evidence and consider several critical factors including market sizing and forecasts, capital and investment requirements and collocation with other industries and other strategic investments.
• The NSW Government and industry should also strengthen collaboration to consider and align the safety and regulatory implications of increased ammonia production, transport, storage and use with several current and future applications and locations.
Strategic Alignment
• NSW Advanced Manufacturing Industry Development Strategy • Future Transport 2056 • Energy Efficiency Action Plan • 20-Year Economic Vision for Regional NSW
Regional Alignment
• Newcastle, Hunter Valley Future production facilities can be collocated next to key productive areas in the following regions:
• Central-West Orana • New England and North West • North Coast • Illawarra-Shoalhaven

© 2020 KPMG, an Australian partnership and a member firm of the KPMG network of independent member firms affiliated with KPMG International Cooperative (“KPMG International”), a Swiss entity. All rights reserved. The KPMG name and logo are registered trademarks or trademarks of KPMG International. Liability limited by a scheme approved under Professional Standards Legislation.
Document Classification: KPMG Confidential
Sustainable chemicals and synthetic fuels
Key Finding: While there are many potential industry applications for chemicals and synthetic fuels, the current local production industry is neither well-developed nor cost-competitive. In the case of synthetic fuels, the move to electrification (particularly for vehicles) adds complexity to the opportunity and outlook where the solution for some is to switch from internal combustion engines to electric vehicles, while other transportation will decarbonise by switching from fossil to sustainable synthetic fuels. More broadly, the chemicals manufacturing industry would benefit from cheaper, reliable, low emissions electricity offering the opportunity to produce chemicals that had until now been too expensive. There needs to be consideration at many levels of the aspiration and business case for the establishment and scaling of local chemical and synthetic fuel production, both for potential local demand and potential export. Further consideration of health and safety requirements for workers, infrastructure and surrounding populations and environments should also be considered as future opportunities are clarified and explored further.
The following considerations are suggested for the NSW Government:
Actions to progress
• The NSW Government should clarify the strategic priority of increasing local chemical and synthetic fuels manufacturing in the context of its policy priorities and existing commitments, and in relation to advanced manufacturing and industry development opportunities.
• With respect to the above, DPIE should work in partnership with existing manufacturers, use industries and research organisation to further understand and clarify the economic and strategic importance of different end use cases (including in new and emerging industry applications of chemicals and synthetic fuels) and the specific infrastructure, technical, workforce and skills requirements, regulatory and cost barriers to realising these use cases.
• The NSW Government and industry should also strengthen collaboration to consider and align the safety and regulatory implications of increased chemical and synthetic fuel production, transport, storage and use with several current and future applications and locations.
Strategic Alignment
• NSW Advanced Manufacturing Industry Development Strategy • Future Transport 2056 • NSW Net Zero Plan • Commonwealth fuel security reviews
Regional Alignment
Most regions of NSW may be suitable for the development of a sustainable chemicals and synthetic fuels industry. This may be influenced by several factors including the location of bio-waste sources, renewable generation capacity, carbon capture industries or green hydrogen manufacturing plants.
Transport and logistics
Key Finding: Decarbonising the NSW freight, and public and private transport systems is a key opportunity to leverage clean energy at scale and contribute to future transport system cost efficiencies. Specific consideration is required around different transport modes to account for the different nature of these opportunities.
The following considerations are suggested for the NSW Government:

© 2020 KPMG, an Australian partnership and a member firm of the KPMG network of independent member firms affiliated with KPMG International Cooperative (“KPMG International”), a Swiss entity. All rights reserved. The KPMG name and logo are registered trademarks or trademarks of KPMG International. Liability limited by a scheme approved under Professional Standards Legislation.
Document Classification: KPMG Confidential
Actions to progress
• In the context of the NSW Long Term Transport Master Plan, DPIE, TfNSW, and NSW Treasury should continue their collaboration to develop business case(s) for options to build on and scale existing low emissions bus trials in alignment with NSW Government announcements to decarbonise Sydney’s 8,000 bus fleet.
• In the context of the NSW Freight and Ports Plan 2018-2023, DPIE, TfNSW, NSW Treasury, Regional NSW and current freight industry operators should collaborate to model options to optimise and prioritise investment in decarbonisation opportunities and associated infrastructure across the NSW road freight network.
• The government may need to consider actions to support wider decarbonisation and uptake of low-emissions passenger vehicles including analysis of the impact of existing incentives for vehicle uptake, better targeted incentives for vehicle types, partnering with industry to develop a wider charging network for battery electric vehicles (BEV) and fuel-cell electric vehicles (FCEV), and develop greater public awareness of operating difference between low-emissions vehicles and conventional vehicles.
Strategic Alignment
• Future Transport 2056 • NSW Electric and Hybrid Vehicle Plan • NSW Freight and Ports Plan • NSW Renewable Energy Action Plan • Clean Air Strategy (under development) • Transmission Infrastructure Strategy • The Greater Sydney Region Plan - A Metropolis of Three Cities • The Greater Newcastle Metropolitan Plan 2036 • 20-Year Economic Vision for Regional NSW
Regional Alignment
All regions of NSW, particularly: • Greater Sydney • Hunter Valley • Central Coast • North Coast • Illawarra-Shoalhaven • Central-West Orana • New England and North West
Controlled environmental horticulture
Key Finding: Agriculture is a strategic industry for NSW and offers significant industry growth potential, with strong and growing regional and international demand and the ability to leverage NSW and Australia’s competitive advantage as a safe and high-quality food producer. CEH is already well-established within the industry and there are major plans underway to expand CEH production as part of the Agribusiness Precinct at the Western Sydney Aerotropolis. There are further opportunities to develop CEH production across NSW. Detailed scoping is required to ensure facilities can be delivered in the shorter term and leverage current and emerging clean technologies to provide a modern and integrated approach and optimise return on investment.

© 2020 KPMG, an Australian partnership and a member firm of the KPMG network of independent member firms affiliated with KPMG International Cooperative (“KPMG International”), a Swiss entity. All rights reserved. The KPMG name and logo are registered trademarks or trademarks of KPMG International. Liability limited by a scheme approved under Professional Standards Legislation.
Document Classification: KPMG Confidential
The following considerations are suggested for the NSW Government:
Actions to progress
• Work to progress this opportunity should leverage and build on the significant evidence base already developed as part of the Agribusiness Precinct feasibility undertaken by the Western City and Aerotropolis Authority, as well as wider industry data.
• DPIE and the Department of Primary Industries should assist industry-led feasibility studies by providing information about the specific location(s), scale, and crop focus of new CEH facilities across NSW that can maximise economic impact.
Strategic Alignment
• Energy Efficiency Action Plan • The Greater Sydney Region Plan - A Metropolis of Three Cities • The Greater Newcastle Metropolitan Plan 2036 • 20-Year Economic Vision for Regional NSW
Regional Alignment
• Greater Sydney • Illawarra-Shoalhaven • Central Coast • Hunter Valley Future production facilities can be collocated next to geographically strategic productive areas in the following regions: • South East and Tablelands • Central-West Orana • New England and North West • North Coast • Riverina-Murray
© 2020 KPMG, an Australian partnership and a member firm of the KPMG network of independent member firms affiliated with KPMG International Cooperative (“KPMG International”), a Swiss entity. All rights reserved. The KPMG name and logo are registered trademarks or trademarks of KPMG International. Liability limited by a scheme approved under Professional Standards Legislation.
Document Classification: KPMG Confidential
Glossary Term Definition
ABS Australian Bureau of Statistics
ACT Australian Capital Territory
AE Alkaline electrolysis
AEMO Australian Energy Market Operator
ANZSIC Australia and New Zealand Standard Industrial Classification
ARC Australian Research Council
ARENA Australian Renewable Energy Agency
AUD Australian Dollars
BAU Business as usual
BEV Battery Electric Vehicle
BF Blast Furnace
BOF Basic Oxygen Furnaces
CAPEX Capital Expenditure
CBD Central Business District
CCS Carbon Capture and Storage
CCUS Carbon Capture, Utilisation and Storage
CEH Controlled Environment Horticulture
CHP Combined Heat and Power
CO Carbon monoxide
COAG Council of Australian Governments (has ceased and is to be replaced by the National Federation Reform Council (NFRC))
CSIRO Commonwealth Scientific and Industrial Research Organisation
DPC Department of Premier and Cabinet
DPIE Department of Planning, Industry and the Environment
DRI Direct-Reduced Iron
DUOS Distribution Use of System
EAF Electric Arc Furnaces
FCEV Fuel-Cell Electric Vehicle
FTE Full-Time Equivalent
GDP Gross Domestic Product

© 2020 KPMG, an Australian partnership and a member firm of the KPMG network of independent member firms affiliated with KPMG International Cooperative (“KPMG International”), a Swiss entity. All rights reserved. The KPMG name and logo are registered trademarks or trademarks of KPMG International. Liability limited by a scheme approved under Professional Standards Legislation.
Document Classification: KPMG Confidential
Term Definition
GJ Gigajoules
GSP Gross State Product
GVA Gross Value Added
HEV Hybrid Electric Vehicles
ICE Internal Combustion Engine
ICT Information and Communications Technology
IEA International Energy Association
IIPH Intensive Integrated Production Hub
IPART Independent Pricing and Regulatory Tribunal
MOHC Liquid organic hydrogen carriers
LPG Liquefied Petroleum Gas
ML Megalitres
MW Megawatt
NBN National Broadband Network
NEM National energy market
NRMA National Roads and Motorists’ Association
NSW New South Wales
NZE Non-Zero Exposure
OCSE NSW Office of the Chief Scientist and Engineer
OPEX Operational expenditure
PEM Proton Exchange Membrane
PHEV Plug-In Hybrid Electric Vehicle
PJ Petajoules
PPA Power purchase agreement
PV Photovoltaic
RAAF Royal Australian Air Force
REZ Renewable Energy Zone
SAF Sustainable Aviation Fuel
SAP Special Activation Precinct
SMR Steam Methane Reforming
SPK Synthetic paraffinic kerosene
TAFE Technical and Further Education
TfNSW Transport for New South Wales
TUOS Transmission Use of System
UK United Kingdom
UNSW University of New South Wales

© 2020 KPMG, an Australian partnership and a member firm of the KPMG network of independent member firms affiliated with KPMG International Cooperative (“KPMG International”), a Swiss entity. All rights reserved. The KPMG name and logo are registered trademarks or trademarks of KPMG International. Liability limited by a scheme approved under Professional Standards Legislation.
Document Classification: KPMG Confidential
Term Definition
US United States
USD United States dollars
UTS University of Technology Sydney
WACC Weighted average cost of capital

© 2020 KPMG, an Australian partnership and a member firm of the KPMG network of independent member firms affiliated with KPMG International Cooperative (“KPMG International”), a Swiss entity. All rights reserved. The KPMG name and logo are registered trademarks or trademarks of KPMG International. Liability limited by a scheme approved under Professional Standards Legislation.
Document Classification: KPMG Confidential
Contents 1Introduction 1
1.1Background 1 1.2Purpose and Scope 1 1.3Limitations 2 1.4Report Structure 3
2Background 4 2.1The Transition to Clean Energy 4 2.2Generation Investment 4 2.3Direct Benefits of Lower Electricity Prices 6 2.4Opportunities Enabled by Cheap, Clean and Reliable Electricity 9
3A NSW Hydrogen Industry 2 3.1Background 2 3.2Considerations for Opportunity Realisation 5 3.3Potential Opportunity Size 20
4Green Steel 22 4.1Background 22 4.2Considerations for Opportunity Realisation 25 4.3Potential Opportunity Size 31
5Green Aluminium 32 5.1Background 32 5.2Considerations for Opportunity Realisation 35 5.3Potential Opportunity Size 37
6Green Ammonia 38 6.1Background 38 6.2Considerations for Opportunity Realisation 41 6.3Potential Opportunity Size 44
7Sustainable Chemicals and Synthetic Fuels 45 7.1Background 45 7.2Considerations for Opportunity Realisation 50 7.3Potential Opportunity Size 53
8Transport and Logistics 55 8.1Background 55 8.2Considerations for Opportunity Realisation 61 8.3Potential Opportunity Size 68
9Controlled Environmental Horticulture 71 9.1Background 71 9.2Considerations for Opportunity Realisation 77

© 2020 KPMG, an Australian partnership and a member firm of the KPMG network of independent member firms affiliated with KPMG International Cooperative (“KPMG International”), a Swiss entity. All rights reserved. The KPMG name and logo are registered trademarks or trademarks of KPMG International. Liability limited by a scheme approved under Professional Standards Legislation.
Document Classification: KPMG Confidential
9.3Potential Opportunity Size 80
10Other potential industry opportunities 82 10.1Food and beverage manufacturing 82 10.2Advanced manufacturing 82 10.3Pulp and paper manufacturing 83 10.4Electrification of industrial process heat 83 10.5Data centres, storage and cyber security 84 10.6Mining (mineral extraction and processing) 84
11Actions for Consideration by Government 86 11.1Industry specific considerations 86 11.2Renewable energy sector skills development 94
12References 96
Appendix A: Regional Profiles 103
Appendix B: Technical Information – Hydrogen Cost Modelling 128

© 2020 KPMG, an Australian partnership and a member firm of the KPMG network of independent member firms affiliated with KPMG International Cooperative (“KPMG International”), a Swiss entity. All rights reserved. The KPMG name and logo are registered trademarks or trademarks of KPMG International. Liability limited by a scheme approved under Professional Standards Legislation.
Document Classification: KPMG Confidential
List of Figures Figure 1: Profile of expected generation investment – Central-West Orana REZ and New England REZ 5
Figure 2: Indicative direct construction and maintenance jobs from generation investment – Central-West Orana REZ and New England REZ (average annual jobs over each 5-year period) 6
Figure 3: Levelised cost of hydrogen production (at a wholesale electricity price of $40/MWh) and sensitised cases - sensitivities only 6
Figure 4: Cost of electricity as feedstock into PEM electrolyser ($ 40 / MWh starting wholesale price) 7
Figure 5: 5-year capital costs for PEM electrolyser ($ / kW) 8
Figure 6: Sensitivity analysis – Cost of hydrogen for 2020, 2021 and 2031 electrolyser technology with sensitivity of electrolyser capacity factor and wholesale cost of electricity (cost of hydrogen expressed in $ / kg) 10
Figure 7: Point-in-time forecast global ranges of cost of hydrogen from large projects ($ / kg) 11
Figure 8: Projected costs associated with green steel against black steel, including sensitised cases and the inclusion of hypothetical carbon price ($ / tonne of steel) 26
Figure 9: Projected costs associated with green steel against the incumbent technology ($/tonne) 27
Figure 10: Costs associated with green ammonia against that of the incumbent technology and sensitised cases (sensitivities only) 41
Figure 11: Costs associated with a potential hydrogen pathway for buses, comparing costs to the incumbent ($/ km) with sensitised cases (sensitivities only) 62
Figure 12: State demand case regarding hydrogen pathway for articulated trucks, comparing costs to the incumbent ($ / km) with sensitised cases (sensitivities only) 63
Figure 13: State demand case regarding hydrogen pathway for semi rigid trucks, comparing costs to the incumbent ($/km) with sensitised cases (sensitivities only) 63
Figure 14: Definition of Regional NSW 103
Figure 15: Cost of Electricity as Feedstock into PEM electrolyser 131
Figure 16: Calibrated $2/kg hydrogen case by 2050 132
Figure 17: $2/kg hydrogen case by 2050 – changing electricity price 133
Figure 18: $2/kg hydrogen case by 2040 – changing electricity price 134
Figure 19: $2/kg hydrogen case by 2030 – changing electricity price 134

© 2020 KPMG, an Australian partnership and a member firm of the KPMG network of independent member firms affiliated with KPMG International Cooperative (“KPMG International”), a Swiss entity. All rights reserved. The KPMG name and logo are registered trademarks or trademarks of KPMG International. Liability limited by a scheme approved under Professional Standards Legislation.
Document Classification: KPMG Confidential
List of Tables Table 1: Opportunity size and actions for consideration for selected industry opportunities 4
Table 2: Total energy consumption in NSW by industry. 7
Table 3: Total input expenditure on electricity and electricity share of total input expenditure, by national level industries. 7
Table 4: Share of workers in top and bottom electricity consuming industries. 8
Table 5: Potential industry opportunities enabled by cheap, clean and reliable electricity 1
Table 6: Industry opportunities considered in detail in this report 1
Table 7: Opportunity summary – Green hydrogen in NSW 4
Table 8: Main influences on portions of the hydrogen supply chain. 18
Table 9: Examples of characteristics of hydrogen supply chain with certain scale and location. 18
Table 10: Suggested extent of influence over key hydrogen success factors 19
Table 11: Opportunity summary – Green steel in NSW 24
Table 12: Opportunity summary – Green aluminium in NSW 34
Table 13: Opportunity summary – Green ammonia in NSW 39
Table 14: Opportunity summary – Sustainable chemicals and synthetic fuels in NSW 48
Table 15: Electric vehicles by motor type. 55
Table 16: Opportunity summary – Private electric vehicles in NSW 56
Table 17: Opportunity summary – NSW bus transport decarbonisation 58
Table 18: Opportunity summary – NSW freight and heavy transport industry decarbonisation 60
Table 19: Potential future operating costs for ICE and FCEV freight vehicles and cost competitive FCEV operating costs and years for articulated and semi-rigid trucks 69
Table 20: Cost competitive advantage of FCEV articulated and semi-rigid trucks 1, 5 and 10 years after achieving cost competitiveness. 70
Table 21: Opportunity Summary – Controlled environmental horticulture in NSW 75
Table 22 Renewable energy sector employment and skills development opportunity realisation pathways 94
Table 23: Summary of assumptions 128

© 2020 KPMG, an Australian partnership and a member firm of the KPMG network of independent member firms affiliated with KPMG International Cooperative (“KPMG International”), a Swiss entity. All rights reserved. The KPMG name and logo are registered trademarks or trademarks of KPMG International. Liability limited by a scheme approved under Professional Standards Legislation.
Document Classification: KPMG Confidential
THIS PAGE IS INTENTIONALLY LEFT BLANK

KPMG | 1
© 2020 KPMG, an Australian partnership and a member firm of the KPMG network of independent member firms affiliated with KPMG International Cooperative (“KPMG International”), a Swiss entity. All rights reserved. The KPMG name and logo are registered trademarks or trademarks of KPMG International. Liability limited by a scheme approved under Professional Standards Legislation.
Document Classification: KPMG Confidential
1 Introduction 1.1 Background Governments globally are seeking to reduce greenhouse gas emissions and decarbonise10 their economies to respond to the growing risks of climate change and improve long term economic resilience. To-date, 195 countries have signed the Paris Climate Agreement which agrees to limit global warming to between 1.5 and 2 degrees Celsius.11 As of June 2020, nations, states and cities collectively representing about $46 trillion (53 per cent) of global gross domestic product (GDP) have adopted a net zero emissions goal as part of this commitment.12
The New South Wales (NSW) Government’s Net Zero Plan Stage 1: 2020-2030 sets an expectation to reduce emissions by 35 per cent relative to 2005 levels by 2030 and achieve net zero emissions by 2050.13 It also outlines an objective to achieve this target via approaches that maximise economic opportunity, prosperity and wellbeing for NSW citizens. A clear pathway for renewable energy transition to maintain generation capacity and support industrial and residential users of electricity into the future is needed as existing coal-fired power stations are retired. In parallel with this Report, the NSW Chief Scientist & Engineer is developing a NSW Decarbonisation Innovation Study that identifies challenges and opportunities for meeting emissions targets and adapting to climate change. This work examines the benefits of decarbonisation and climate adaptation in generating economic development, prosperity and jobs growth in NSW across a range of industry sectors including infrastructure and construction, agriculture, services, energy, and transport. The work undertaken as part of the Decarbonisation Innovation Study helped inform the industry opportunities addressed in this report.
1.2 Purpose and Scope This report has been developed for the NSW Department of Planning, Industry and Environment (DPIE). Its purpose is to prioritise actions for government, industry and other stakeholders to pursue and enable industry development opportunities that can leverage NSW’s transition to reliable, low cost clean energy.
The scope of this report is as follows:
• identify industry development opportunities associated with integrated clean energy deployment;
• analyse potential costs and deployment rates of selected clean energy technologies;
• analyse the preconditions (cost and readiness) for existing and emerging industries to leverage clean energy technologies;
• analyse the potential economic size of industry opportunities to leverage clean energy technologies; and
• prioritise industry opportunities and future considerations with respect to location, technologies and policy needs and potential infrastructure requirements.
The report has been prepared by KPMG with input from the NSW Office of the Chief Scientist and Engineer (OCSE) and a range of other NSW Government stakeholders. OCSE provided a range of
10 Decarbonisation involves reducing or removing greenhouse emissions-intensive activities throughout energy and industry supply chains.
11 United Nations Treaty Collection 2020, https://treaties.un.org/Pages/ViewDetails.aspx?src=TREATY&mtdsg_no=XXVII-7-d&chapter=27&clang=_en,
accessed 29 June 2020.
12 Net Zero Momentum Tracker, https://www.climateworksaustralia.org/net-zero/, accessed 30 June 2020.
13 Department of Planning, Industry and Environment 2019, ‘Net Zero Plan Stage 1: 2020 – 2030’, NSW Government, NSW.

KPMG | 2
© 2020 KPMG, an Australian partnership and a member firm of the KPMG network of independent member firms affiliated with KPMG International Cooperative (“KPMG International”), a Swiss entity. All rights reserved. The KPMG name and logo are registered trademarks or trademarks of KPMG International. Liability limited by a scheme approved under Professional Standards Legislation.
Document Classification: KPMG Confidential
inputs in relation to the various technologies and opportunities considered in this report and the technical assumptions informing the analysis and modelling.
1.3 Limitations The report synthesises a broad range of domestic and international data, research, and industry information to consider each opportunity. It also includes illustrative projections of the potential long-term cost pathways of clean energy technologies to illustrate the sensitivity of opportunities to different drivers of cost. Further, it draws on available industry and government data and publicly available information to illustrate the relative size and significance of different opportunities. The report outlines the analysis method, assumptions, and data and research sources.
There is a range of potential factors impacting current and future costs and the realisation of the opportunities considered. Many of these factors are subject to significant uncertainty, particularly over longer time periods. The analysis for each opportunity is intended to provide a snapshot of the current evidence base and identify the key considerations and uncertainties associated with each opportunity.
The following specific limitations are noted in relation to the analysis in this report:
• Key assumptions underpinning this analysis – The analysis has been undertaken based on current policy decisions at a federal and State level.
• Definition and specificity of industry opportunities – This report identifies various industry opportunities at a broad level. It is recognised that some of these opportunities have broad, state-wide applicability, whereas some are more targeted to particular regions or industry facilities. The analysis of these opportunities has been undertaken at a high level based on the extent to which they are currently defined. As opportunities are defined in more detail, there should be more specific analysis undertaken of the financial and economic costs and benefits in line with government guidelines to underpin potential investment and policy decisions.
• Data and information availability and gaps – This report draws on a range of data and information sources to analyse each opportunity. However, it is important to note that there are numerous gaps in data, uncertainties in future projections, some challenges in comparability of information across different sources. To the extent practical, the analysis highlights the relevant context and any relevant caveats.
• Interpretation of technology cost projections – The analysis includes high level projections of the potential costs associated with various clean energy technologies. These projections have been developed based on available data and with supporting assumptions which are outlined in the body of the report and supported by a technical appendix outlining methodological detail. The projections are intended to help illustrate the key considerations around cost competitiveness and uptake associated with different industry opportunities, rather than provide a definitive indication of the timeframe or trajectory of costs. Projections are expected to have increased levels of uncertainty as modelling is conducted over a longer timeframe, making it difficult to compare with the confidence the long-term modelling undertaken by different published models. In practice, the costs of different technologies will be influenced by a wide range of factors over which there are varying levels of uncertainty. These factors include government policy settings, research and development, technological innovations, and investments by governments and the private sector.
• Interpretation of economic opportunity analysis – The report includes high level analysis of the potential direct economic benefits associated with each industry opportunity. The analysis is supported by a range of available data and literature and is detailed within each section of the report. The analysis should be interpreted as a high-level indication only. As opportunities are specified and costed in more detail, this analysis should be extended and refined further.
• Implications of COVID-19 – Data and evidence available to consider the various industry opportunities in this report does not consider the current or potential future impacts of COVID-19.
The insights from this report are intended to form one input to the NSW Government’s consideration of actions to further investigate and accelerate the delivery of the opportunities considered. It is not intended and should not be interpreted as an appraisal of the current or future feasibility, costs or benefits associated with these opportunities. These will need to be subject to further specific consideration as part of dedicated feasibility studies as the basis of investment and/or other decisions by government and industry.

KPMG | 3
© 2020 KPMG, an Australian partnership and a member firm of the KPMG network of independent member firms affiliated with KPMG International Cooperative (“KPMG International”), a Swiss entity. All rights reserved. The KPMG name and logo are registered trademarks or trademarks of KPMG International. Liability limited by a scheme approved under Professional Standards Legislation.
Document Classification: KPMG Confidential
The analysis in this report is to be considered in the context of the above limitations.
1.4 Report Structure The report is structured as follows:
• Section 2: Outlines the economic opportunity for NSW associated with the transition to cheap, reliable, and clean electricity;
• Sections 3–10: Describe the industry background, considerations for opportunity realisation, including cost competitiveness, strengths, barriers and infrastructure requirements, and potential economic benefits of decarbonisation for the following industries respectively:
– Section 3: A NSW hydrogen industry;
– Section 4: Green Steel;
– Section 5: Green aluminium;
– Section 6: Green ammonia;
– Section 7: Sustainable chemical and synthetic fuels;
– Section 8: Transport and logistics;
– Section 9: Controlled environmental horticulture; and
– Section 10: Other potential industry opportunities.
• Section 11: Suggested actions for consideration by the NSW Government to progress opportunity realisation.
• A series of appendices provide supplementary research and technical detail.

KPMG | 4
© 2020 KPMG, an Australian partnership and a member firm of the KPMG network of independent member firms affiliated with KPMG International Cooperative (“KPMG International”), a Swiss entity. All rights reserved. The KPMG name and logo are registered trademarks or trademarks of KPMG International. Liability limited by a scheme approved under Professional Standards Legislation.
Document Classification: KPMG Confidential
2 Background 2.1 The Transition to Clean Energy Renewable and low-emissions electricity generation is a key pathway to decarbonisation. The NSW Electricity Strategy, released in 2019, provides the overarching framework to support this transition in NSW. It interfaces closely with the Net Zero Plan Stage 1: 2020-203014, which includes $450 million for the Emissions Intensity Reduction Program and the Clean Technology Program to research, develop and commercialise emissions reduction technologies, aiming to enable the transition to reliable, affordable and sustainable renewable and low-emissions electricity generation, storage, and transmission through:
• delivering Australia’s first coordinated Renewable Energy Zone (REZ);
• saving energy, especially at times of peak demand;
• supporting the development of new electricity generators;
• setting a target to bolster the state’s energy resilience; and
• making it easier to do energy business in NSW.15
The NSW Electricity Strategy seeks to coordinate private investment in firm, clean, low cost transmission, generation and storage and reduce electricity prices by addressing critical regulatory and market challenges, distortionary price signals and investment conditions. The coordination of private investment to strategic locations is of importance in ensuring generation capacity and system strength as coal-fired power stations across NSW approach retirement from the market. The Strategy will be important in creating the confidence and certainty necessary in the market to support the required investment to replace ageing coal-fired power stations accounting for three-quarters of NSW electricity supply.
Providing the enabling investment and regulatory environment for the development of the renewable energy sector and related industries has the potential to help drive strengthened private investment in energy infrastructure (generation, transmission, storage and dispatch), encouraging business and industry to transition to clean renewable energy. This enabling environment has the potential to increase the attractiveness of NSW to:
• Interstate and international firms and investors to invest in the state’s energy infrastructure; and
• Businesses and firms seeking to leverage the NSW’s favourable energy infrastructure and commercial environment to establish cost-competitive operations or headquarters in the state.
2.2 Generation Investment A key aspect of the NSW Electricity Strategy is the delivery of coordinated REZs across NSW. A REZ involves the coordinated development of new electricity infrastructure in energy-rich areas, efficiently connecting multiple generators in the same location. REZs combine generation, transmission, storage and system strength services to ensure a secure, affordable and reliable energy system. The Government is prioritising the delivery of three REZs in the Central-West Orana, New England and South-West regions of the State.
The Electricity Infrastructure Investment Safeguard (Investment Safeguard) program supports uptake of new generation in the REZs, with an in-built development pathway determining the overall level of
14 Department of Planning, Industry and Environment 2019, ‘Net Zero Plan Stage 1: 2020 – 2030’, NSW Government, NSW.
15 NSW Government 2019, ‘NSW Electricity Strategy’, NSW Government, NSW.

KPMG | 5
© 2020 KPMG, an Australian partnership and a member firm of the KPMG network of independent member firms affiliated with KPMG International Cooperative (“KPMG International”), a Swiss entity. All rights reserved. The KPMG name and logo are registered trademarks or trademarks of KPMG International. Liability limited by a scheme approved under Professional Standards Legislation.
Document Classification: KPMG Confidential
support for generation and storage investments by the program. The Investment Safeguard aims to give investors long-term revenue certainty and accelerate the build out of new infrastructure in New South Wales. As well as new generation, the program would cater for investments in storage infrastructure, helping with both short- and long-term energy storage required for firming intermittent generation from variable renewable energy. Under the program the scheme rules would set a development pathway with a trajectory for the total volume of generation for the scheme to contract over time.
The figures below show the expected level of investment in new generation in the Central-West Orana and New England REZs under a business as usual (BAU) trajectory and under the Investment Safeguard’s development pathway. These scenarios are defined as:
• BAU – consistent with most electricity market models undertaken for the industry, this scenario assumes that participants in the national energy market (NEM) can accurately forecast future NEM outcomes and respond in advance to deliver an orderly transition from coal to other forms of generation and can consistently deliver firm supply and least aggregate cost outcomes for consumers.
• Development Pathway – the Investment Safeguard supports investment to deliver approximately 12GW of new generation assets in New South Wales by 2030. The program then supports investment to replace the volume of generation from retiring power stations two to three years before they are expected to close and continues to support additional investment to maintain affordable wholesale electricity prices through the energy transition. The firming requirement / long duration storage pathway is set to meet the Energy Security Target over the long term.
Figure 1: Profile of expected generation investment – Central-West Orana REZ and New England REZ
Source: Modelled projected generation investment estimated by Aurora Energy Research.
-
2,000
4,000
6,000
8,000
10,000
12,000
14,000
2023 - 2027 2028 - 2032 2033 - 2037 2038 - 2042
Gen
erat
ion
inve
stm
ent
($m
)
Projected generation investment
BAU Development Pathway

KPMG | 6
© 2020 KPMG, an Australian partnership and a member firm of the KPMG network of independent member firms affiliated with KPMG International Cooperative (“KPMG International”), a Swiss entity. All rights reserved. The KPMG name and logo are registered trademarks or trademarks of KPMG International. Liability limited by a scheme approved under Professional Standards Legislation.
Document Classification: KPMG Confidential
Figure 2: Indicative direct construction and maintenance jobs from generation investment – Central-West Orana REZ and New England REZ (average annual jobs over each 5-year period)
Source: Modelled indicative direct construction and maintenance jobs estimated by Aurora Energy Research.
2.3 Direct Benefits of Lower Electricity Prices Electricity and energy are fundamental inputs to all households and industries. A key expected outcome of the NSW Electricity Strategy is to lower the cost of electricity across NSW. This has the potential to deliver direct benefits to all households and businesses in our cities and regions.
2.3.1 Reduction in costs for industrial sectors Electricity is a factor of production used to varying degrees across NSW industries, with some industries spending a significantly greater share of their total input expenditures on electricity consumption. Any change in the price or supply of electricity has the potential to materially impact the efficiency and profitability of businesses and industries. In total in Australia, around $29.2 billion (or 1.7 per cent) of input costs are from electricity.16 In NSW, it is estimated that around $7.8 billion in electricity input costs is used across industries.17
In 2017-18, NSW consumed a total of 286.1 PJ of electricity (including renewables) and 1,070.3 PJ of total final energy consumption across all fuel types.18 From the state’s industrial sectors, the commercial and services industry consumed the most electricity, which was 76.1 PJ of the industry’s 95.6 PJ total energy consumption. The manufacturing industry uses less electricity (64.3 PJ), but this is due to manufacturing’s much larger total fuel consumption of 276.9 PJ comprising 92.6 PJ of black coal and 62.1 PJ of natural gas.19
16 Electricity generation and electricity transmission, ABS Australian National Accounts: Input-Output Tables, 2017-18 (released 29 May 2020).
17 NSW share based on NSW share of Australian electricity use in industries (excluding electricity generation and residential uses, from Department of
Environment and Energy, Tables F1 and F2 Australian energy consumption, by state and territory, by industry and fuel type, energy units, released
September 2019), assuming industry inputs are identical in share to ABS Australian National Accounts: Input-Output Tables, 2017-18 (released 29 May 2020).
18 Australian Government Department of Environment and Energy, Australian Energy Statistics, Table H4, Australian total final energy consumption, by
industry, by fuel, energy units (released September 2019).
19 Department of Environment and Energy, Tables F1 and F2 Australian energy consumption, by state and territory, by industry and fuel type, energy units,
released September 2019),
-
5,000
10,000
15,000
20,000
25,000
2023 - 2027 2028 - 2032 2033 - 2037 2038 - 2042
Num
ber
of d
irect
jobs
Indicative contruction and maintenance jobs
BAU Development Pathway

KPMG | 7
© 2020 KPMG, an Australian partnership and a member firm of the KPMG network of independent member firms affiliated with KPMG International Cooperative (“KPMG International”), a Swiss entity. All rights reserved. The KPMG name and logo are registered trademarks or trademarks of KPMG International. Liability limited by a scheme approved under Professional Standards Legislation.
Document Classification: KPMG Confidential
The table below summarises total energy consumption of all fuel types by industry groups in NSW (excluding the utilities sector and residential uses) in 2017-18.
Table 2: Total energy consumption in NSW by industry.
Industry Total energy consumed
Total electricity consumed
Electricity share of consumption
Agriculture, Forestry and Fishing 31.4 2.0 6.5%
Mining 65.1 16.1 24.8%
Manufacturing 276.9 64.3 23.2%
Construction 5.1 0.7 14.1%
Commercial and services 95.6 76.1 79.7%
Transport, postal & warehousing 548.7 5.3 1.0%
Total 1022.9 164.5 16.1%
Source: Based on total energy consumption by one-digit ANZSIC industry group, in Department of the Environment and Energy, Australian Energy Statistics, Table F (released September 2019).
Table 3 below presents the top electricity consuming industries by total expenditure on electricity consumption in 2017-18. Electricity share of industry expenditure appears to be relatively low for industry groups such as manufacturing. However, manufacturing sub-industry groups spend a considerable share of their total input expenditures on electricity. For example, aluminium smelting is energy intensive, with energy costs at around 25-30 per cent of smelter operating costs, rising to 30-35 per cent when the energy costs associated with alumina production is considered.20 In this context, this report will consider decarbonisation opportunities for energy intensive industries.
Table 3: Total input expenditure on electricity and electricity share of total input expenditure, by national level industries.
Industry Total electricity expenditure 2017-18
($ million)
Electricity share of total industry input
expenditure (%)
Manufacturing 7,009 2.6
Mining 6,574 6.4
Public administration and safety 2,713 4.4
Accommodation and food services 1,865 4.0
Rental hiring and real estate services 1,781 1.7
Retail trade 1,684 3.2
Transport, postal and warehousing 1,071 1.0
Professional, scientific and technical services 985 0.8
Agriculture, forestry and fishing 932 1.8
Healthcare and social assistance 835 1.5
20 Australian Aluminium Council (2012), Sustainability Report.
KPMG | 8
© 2020 KPMG, an Australian partnership and a member firm of the KPMG network of independent member firms affiliated with KPMG International Cooperative (“KPMG International”), a Swiss entity. All rights reserved. The KPMG name and logo are registered trademarks or trademarks of KPMG International. Liability limited by a scheme approved under Professional Standards Legislation.
Document Classification: KPMG Confidential
Source: Based on electricity share of inputs by one-digit ANZSIC industry group, aggregated from two-digit ANZSIC industries in ABS Australian National Accounts: Input-Output Tables, 2017-18 (released 29 May 2020).
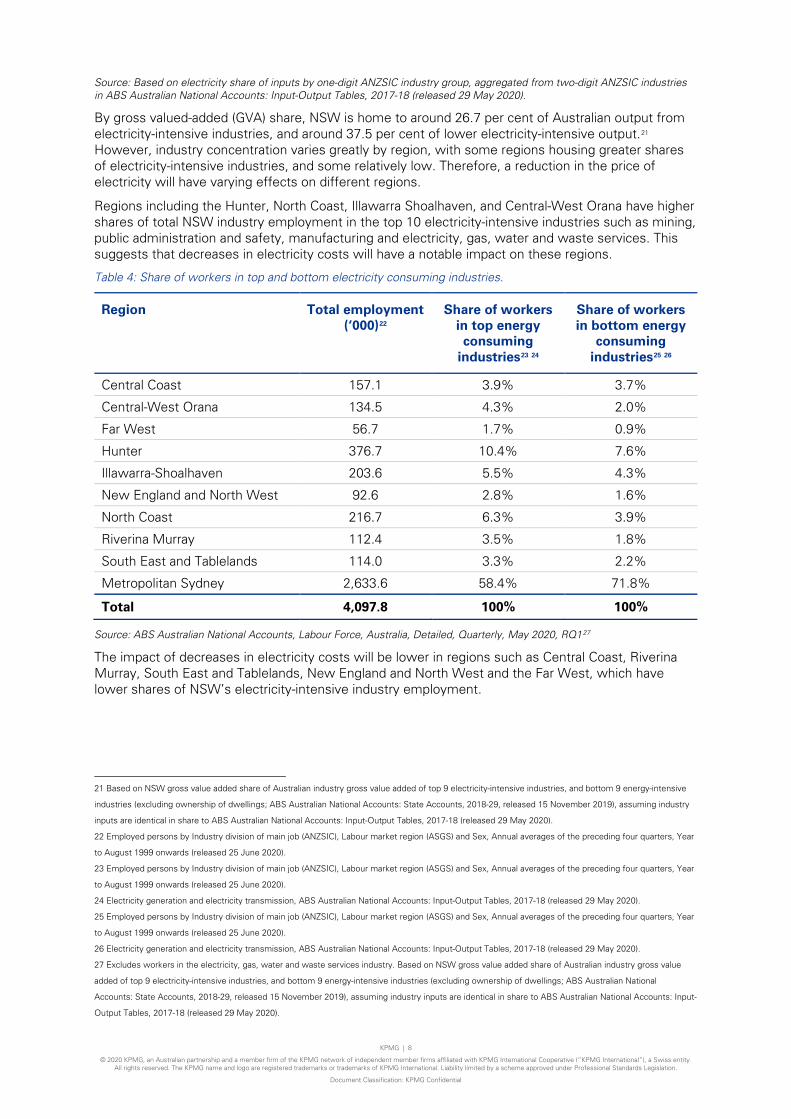
By gross valued-added (GVA) share, NSW is home to around 26.7 per cent of Australian output from electricity-intensive industries, and around 37.5 per cent of lower electricity-intensive output.21 However, industry concentration varies greatly by region, with some regions housing greater shares of electricity-intensive industries, and some relatively low. Therefore, a reduction in the price of electricity will have varying effects on different regions.
Regions including the Hunter, North Coast, Illawarra Shoalhaven, and Central-West Orana have higher shares of total NSW industry employment in the top 10 electricity-intensive industries such as mining, public administration and safety, manufacturing and electricity, gas, water and waste services. This suggests that decreases in electricity costs will have a notable impact on these regions.
Table 4: Share of workers in top and bottom electricity consuming industries.
Region Total employment (‘000)22
Share of workers in top energy consuming
industries23 24
Share of workers in bottom energy
consuming industries25 26
Central Coast 157.1 3.9% 3.7%
Central-West Orana 134.5 4.3% 2.0%
Far West 56.7 1.7% 0.9%
Hunter 376.7 10.4% 7.6%
Illawarra-Shoalhaven 203.6 5.5% 4.3%
New England and North West 92.6 2.8% 1.6%
North Coast 216.7 6.3% 3.9%
Riverina Murray 112.4 3.5% 1.8%
South East and Tablelands 114.0 3.3% 2.2%
Metropolitan Sydney 2,633.6 58.4% 71.8%
Total 4,097.8 100% 100%
Source: ABS Australian National Accounts, Labour Force, Australia, Detailed, Quarterly, May 2020, RQ127
The impact of decreases in electricity costs will be lower in regions such as Central Coast, Riverina Murray, South East and Tablelands, New England and North West and the Far West, which have lower shares of NSW’s electricity-intensive industry employment.
21 Based on NSW gross value added share of Australian industry gross value added of top 9 electricity-intensive industries, and bottom 9 energy-intensive
industries (excluding ownership of dwellings; ABS Australian National Accounts: State Accounts, 2018-29, released 15 November 2019), assuming industry
inputs are identical in share to ABS Australian National Accounts: Input-Output Tables, 2017-18 (released 29 May 2020).
22 Employed persons by Industry division of main job (ANZSIC), Labour market region (ASGS) and Sex, Annual averages of the preceding four quarters, Year
to August 1999 onwards (released 25 June 2020).
23 Employed persons by Industry division of main job (ANZSIC), Labour market region (ASGS) and Sex, Annual averages of the preceding four quarters, Year
to August 1999 onwards (released 25 June 2020).
24 Electricity generation and electricity transmission, ABS Australian National Accounts: Input-Output Tables, 2017-18 (released 29 May 2020).
25 Employed persons by Industry division of main job (ANZSIC), Labour market region (ASGS) and Sex, Annual averages of the preceding four quarters, Year
to August 1999 onwards (released 25 June 2020).
26 Electricity generation and electricity transmission, ABS Australian National Accounts: Input-Output Tables, 2017-18 (released 29 May 2020).
27 Excludes workers in the electricity, gas, water and waste services industry. Based on NSW gross value added share of Australian industry gross value
added of top 9 electricity-intensive industries, and bottom 9 energy-intensive industries (excluding ownership of dwellings; ABS Australian National
Accounts: State Accounts, 2018-29, released 15 November 2019), assuming industry inputs are identical in share to ABS Australian National Accounts: Input-
Output Tables, 2017-18 (released 29 May 2020).

KPMG | 9
© 2020 KPMG, an Australian partnership and a member firm of the KPMG network of independent member firms affiliated with KPMG International Cooperative (“KPMG International”), a Swiss entity. All rights reserved. The KPMG name and logo are registered trademarks or trademarks of KPMG International. Liability limited by a scheme approved under Professional Standards Legislation.
Document Classification: KPMG Confidential
The distribution of these benefits across regions will also likely be impacted by the location of existing and emerging energy intensive users, including those undergoing or planning to undergo transitions to decarbonise their operations. Examples of these users include:
• Manufacturers of metallurgical products such as steel and aluminium;
• Chemical and synthetic fuel manufacturers and related industries who rely on their products; and
• Transport and logistic operators;
• Food and beverage manufacturers, such as controlled environmental horticulture (CEH) facility operators, who require energy for heating during sterilisation processes and cooling for storage;
• Large scale data centres, such as those used by banks and universities, that large amounts of energy for their power and cooling systems;
• Meat processing;
• Pharmaceutical manufacturing;
• Non-metallic processing; and
• Plastics manufactures who require energy during the heating and pressure applications of plastic product development.
2.3.2 Reduction in costs for households In addition to major energy consuming industries, households are also likely to experience some reduction in expenditure if the cost of electricity production decreases. In 2020, the average NSW household spends $1,627 annually on electricity consumption.28
Based on 2016 census data, there are an estimated 2.6 million households in NSW, 980,442 of which are in the state’s regions.29 Based on the above average annual electricity spend, this suggests NSW households spend around $4.2 billion on domestic electricity consumption in total. Similarly, regional NSW households spend approximately $1.6 billion on domestic electricity consumption. 30
With the assumed cost savings over time associated with greater levels of decarbonisation of electricity generation and transmission, for every one per cent reduction of the current average annual household spend on electricity in NSW, households will save approximately $16.27 per household annually. This equates to $42.4 million in collective annual household savings across 2.6 million households in NSW, or approximately $16 million is collective annual household savings across the 980,442 households in the state’s regions.
2.4 Opportunities Enabled by Cheap, Clean and Reliable Electricity There are significant current and emerging opportunities for industry growth and development in NSW over the long-term. Some opportunities, such as hydrogen production, advanced manufacturing opportunities, and controlled environmental horticulture are already recognised, with industry and government already working together to coordinate efforts to channel investment and create the enabling market conditions. Other opportunities will continue to emerge over time.
The NSW Government’s collective economic and industry development plans, all of which align to its overarching 2040 Economic Blueprint, seek to create the enabling environment for such opportunities to be realised in NSW. Reliable, clean, and lower cost electricity will be a necessary pre-condition to maximising the value and long-term impact of these opportunities for jobs and growth in NSW over the short, medium and long term. Another important set of enablers to realise these opportunities will be skills and research and innovation capabilities of firms and institutions in NSW, both to develop
28 Canstar Blue electricity customer satisfaction survey, January 2020, https://www.canstarblue.com.au/electricity/average-electricity-bills/.
29 Based on 2016 census figures (Family and Community, Australia, State and Territory, Statistical Area Levels 2-4, Greater Capital City Statistical Area,
2011-2018, released 19 November 2019).
30 This figure is a function of available household size data from the ABS, which was last released in 2016, current available information on annual household
expenditure on electricity consumption in 2020.

KPMG | 10
© 2020 KPMG, an Australian partnership and a member firm of the KPMG network of independent member firms affiliated with KPMG International Cooperative (“KPMG International”), a Swiss entity. All rights reserved. The KPMG name and logo are registered trademarks or trademarks of KPMG International. Liability limited by a scheme approved under Professional Standards Legislation.
Document Classification: KPMG Confidential
new knowledge and to adopt it from elsewhere. The state’s universities, research organisations such as the Commonwealth Scientific and Industrial Research Organisation (CSIRO) and NSW Department of Primary Industries (DPI), and companies are investing in developing new systems and devices to transition industry to decarbonise processes and integrate renewable energy.
The table below summarises several of the potential industry opportunities in NSW, including their opportunity realisation and enabling technology pathways. Several of these industries align with the State Government’s NSW 2040 Economic Blueprint to prioritise enabling market conditions and levers and future growth industries to strengthen economic development and resilience in NSW.
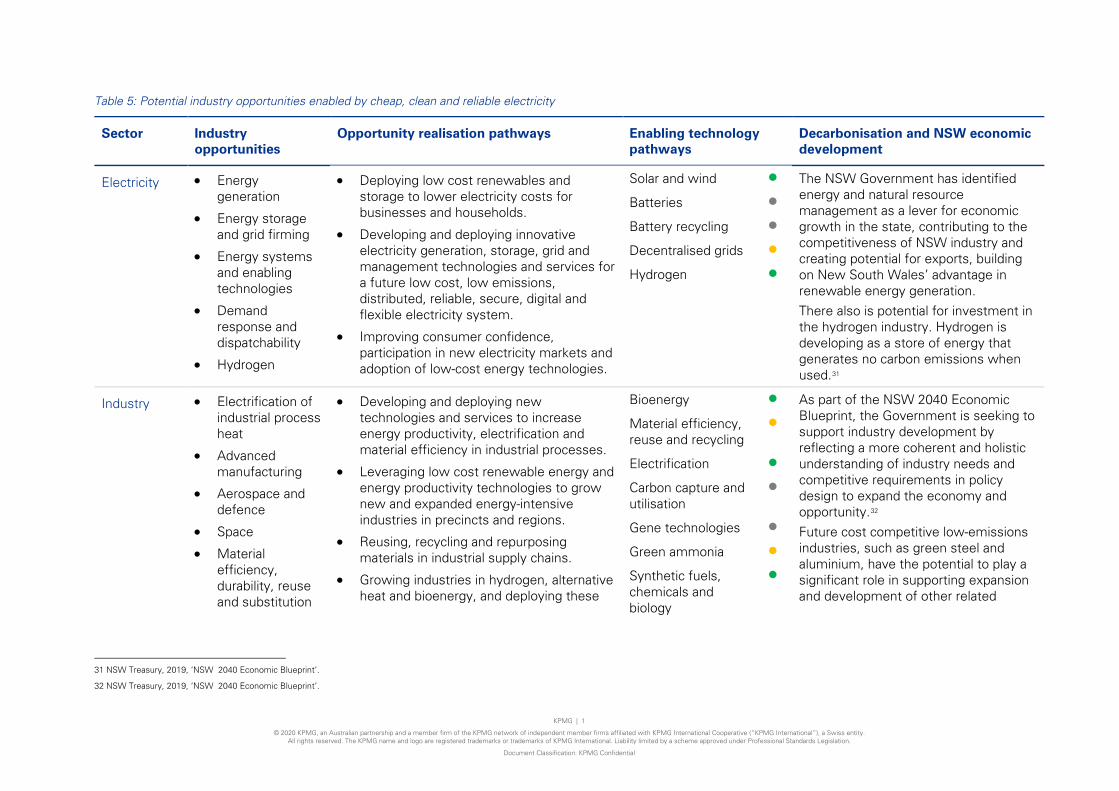
KPMG | 1
© 2020 KPMG, an Australian partnership and a member firm of the KPMG network of independent member firms affiliated with KPMG International Cooperative (“KPMG International”), a Swiss entity. All rights reserved. The KPMG name and logo are registered trademarks or trademarks of KPMG International. Liability limited by a scheme approved under Professional Standards Legislation.
Document Classification: KPMG Confidential
Table 5: Potential industry opportunities enabled by cheap, clean and reliable electricity
Sector Industry opportunities
Opportunity realisation pathways Enabling technology pathways
Decarbonisation and NSW economic development
Electricity • Energy generation
• Energy storage and grid firming
• Energy systems and enabling technologies
• Demand response and dispatchability
• Hydrogen
• Deploying low cost renewables and storage to lower electricity costs for businesses and households.
• Developing and deploying innovative electricity generation, storage, grid and management technologies and services for a future low cost, low emissions, distributed, reliable, secure, digital and flexible electricity system.
• Improving consumer confidence, participation in new electricity markets and adoption of low-cost energy technologies.
Solar and wind The NSW Government has identified energy and natural resource management as a lever for economic growth in the state, contributing to the competitiveness of NSW industry and creating potential for exports, building on New South Wales’ advantage in renewable energy generation. There also is potential for investment in the hydrogen industry. Hydrogen is developing as a store of energy that generates no carbon emissions when used.31
Batteries
Battery recycling
Decentralised grids
Hydrogen
Industry • Electrification of industrial process heat
• Advanced manufacturing
• Aerospace and defence
• Space
• Material efficiency, durability, reuse and substitution
• Developing and deploying new technologies and services to increase energy productivity, electrification and material efficiency in industrial processes.
• Leveraging low cost renewable energy and energy productivity technologies to grow new and expanded energy-intensive industries in precincts and regions.
• Reusing, recycling and repurposing materials in industrial supply chains.
• Growing industries in hydrogen, alternative heat and bioenergy, and deploying these
Bioenergy As part of the NSW 2040 Economic Blueprint, the Government is seeking to support industry development by reflecting a more coherent and holistic understanding of industry needs and competitive requirements in policy design to expand the economy and opportunity.32 Future cost competitive low-emissions industries, such as green steel and aluminium, have the potential to play a significant role in supporting expansion and development of other related
Material efficiency, reuse and recycling
Electrification
Carbon capture and utilisation
Gene technologies
Green ammonia
Synthetic fuels, chemicals and biology
31 NSW Treasury, 2019, ‘NSW 2040 Economic Blueprint’.
32 NSW Treasury, 2019, ‘NSW 2040 Economic Blueprint’.

KPMG | 2
© 2020 KPMG, an Australian partnership and a member firm of the KPMG network of independent member firms affiliated with KPMG International Cooperative (“KPMG International”), a Swiss entity. All rights reserved. The KPMG name and logo are registered trademarks or trademarks of KPMG International. Liability limited by a scheme approved under Professional Standards Legislation.
Document Classification: KPMG Confidential
Sector Industry opportunities
Opportunity realisation pathways Enabling technology pathways
Decarbonisation and NSW economic development
• Green steel making and aluminium smelting
• Green ammonia
• Cement production
energy platforms across other industrial processes and economic sectors.
Steel from hydrogen
industries including the advanced manufacturing, space and aerospace and defence industries.
Built environment
• Construction
• Product design
• Built environment planning
• Developing and deploying new technologies and services to increase energy productivity, electrification and material efficiency in the built environment.
• Growing the market for efficient and modular designs that incorporate sustainable materials, energy generation and storage, and efficiency improvements.
• Growing local supply chains in sustainable, reused and recycled construction materials.
• Building net zero industrial, commercial and residential precincts and public infrastructure that showcases best practice design, construction and operation.
Efficient modular designs
The NSW Government is considering a holistic approach to planning and infrastructure development, bringing together several factors, including workforce availability and design and future industry growth areas, to support the delivery of services, economic growth and improved living standards. The introduction of new efficiency enhancing and emissions reduction technologies during design, resourcing, construction and use stage of infrastructure has the potential to support the state in delivering it’s planning priorities at lower costs and in faster timeframes.
Energy productivity
Low emissions construction materials
Digital technologies
Electrification
Reuse and recycling of materials
Land use and agriculture
• Livestock and methane emissions
• Other agricultural emissions
• Promoting best practice sustainable land management, and growing sustainability markets and ecosystem services to provide complementary decarbonised income sources for landholders, including indigenous landholders.
Controlled environmental horticulture
Constraints to agricultural and food industry expansion are many. They include water and energy security and affordability, the availability of enough arable land and the likelihood of more
On farm renewables and bioenergy
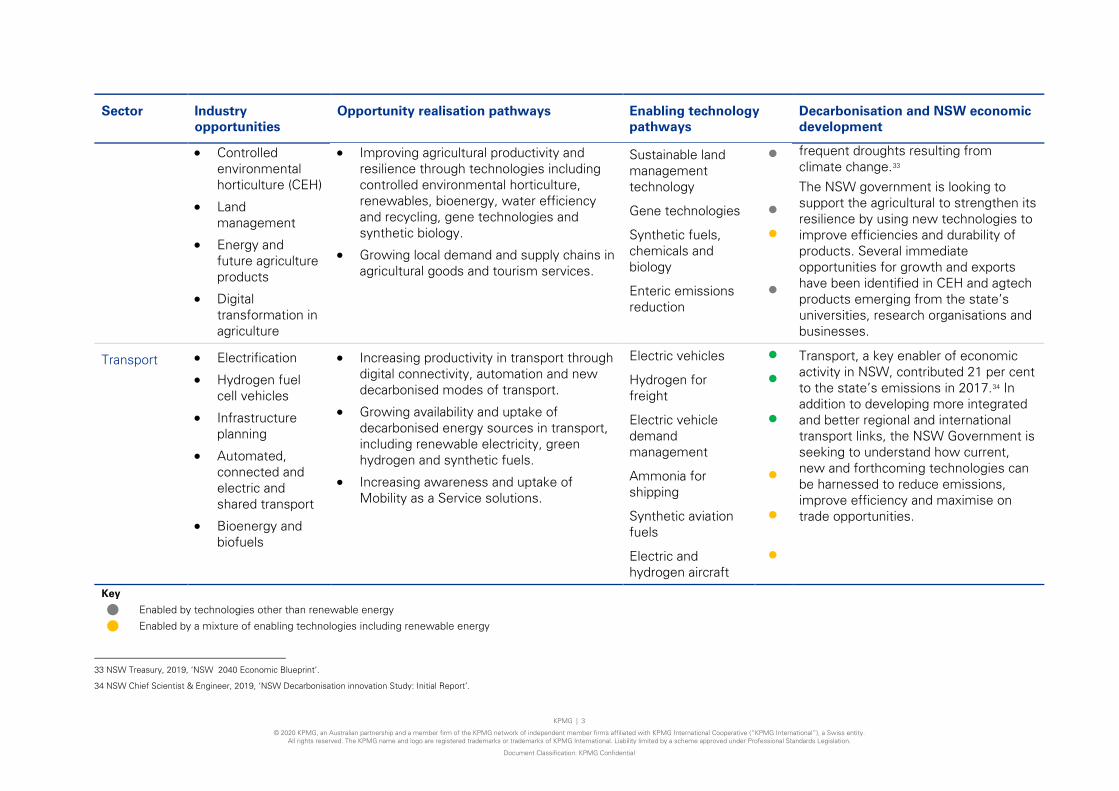
KPMG | 3
© 2020 KPMG, an Australian partnership and a member firm of the KPMG network of independent member firms affiliated with KPMG International Cooperative (“KPMG International”), a Swiss entity. All rights reserved. The KPMG name and logo are registered trademarks or trademarks of KPMG International. Liability limited by a scheme approved under Professional Standards Legislation.
Document Classification: KPMG Confidential
Sector Industry opportunities
Opportunity realisation pathways Enabling technology pathways
Decarbonisation and NSW economic development
• Controlled environmental horticulture (CEH)
• Land management
• Energy and future agriculture products
• Digital transformation in agriculture
• Improving agricultural productivity and resilience through technologies including controlled environmental horticulture, renewables, bioenergy, water efficiency and recycling, gene technologies and synthetic biology.
• Growing local demand and supply chains in agricultural goods and tourism services.
Sustainable land management technology
frequent droughts resulting from climate change.33 The NSW government is looking to support the agricultural to strengthen its resilience by using new technologies to improve efficiencies and durability of products. Several immediate opportunities for growth and exports have been identified in CEH and agtech products emerging from the state’s universities, research organisations and businesses.
Gene technologies
Synthetic fuels, chemicals and biology
Enteric emissions reduction
Transport • Electrification
• Hydrogen fuel cell vehicles
• Infrastructure planning
• Automated, connected and electric and shared transport
• Bioenergy and biofuels
• Increasing productivity in transport through digital connectivity, automation and new decarbonised modes of transport.
• Growing availability and uptake of decarbonised energy sources in transport, including renewable electricity, green hydrogen and synthetic fuels.
• Increasing awareness and uptake of Mobility as a Service solutions.
Electric vehicles Transport, a key enabler of economic activity in NSW, contributed 21 per cent to the state’s emissions in 2017.34 In addition to developing more integrated and better regional and international transport links, the NSW Government is seeking to understand how current, new and forthcoming technologies can be harnessed to reduce emissions, improve efficiency and maximise on trade opportunities.
Hydrogen for freight
Electric vehicle demand management
Ammonia for shipping
Synthetic aviation fuels
Electric and hydrogen aircraft
Key
Enabled by technologies other than renewable energy
Enabled by a mixture of enabling technologies including renewable energy
33 NSW Treasury, 2019, ‘NSW 2040 Economic Blueprint’.
34 NSW Chief Scientist & Engineer, 2019, ‘NSW Decarbonisation innovation Study: Initial Report’.
KPMG | 4
© 2020 KPMG, an Australian partnership and a member firm of the KPMG network of independent member firms affiliated with KPMG International Cooperative (“KPMG International”), a Swiss entity. All rights reserved. The KPMG name and logo are registered trademarks or trademarks of KPMG International. Liability limited by a scheme approved under Professional Standards Legislation.
Document Classification: KPMG Confidential
Sector Industry opportunities
Opportunity realisation pathways Enabling technology pathways
Decarbonisation and NSW economic development
Enabled by renewable energy technology
Source: ‘Opportunities for prosperity in a decarbonised and resilient NSW’, NSW Chief Scientist & Engineer.

KPMG | 1
© 2020 KPMG, an Australian partnership and a member firm of the KPMG network of independent member firms affiliated with KPMG International Cooperative (“KPMG International”), a Swiss entity. All rights reserved. The KPMG name and logo are registered trademarks or trademarks of KPMG International. Liability limited by a scheme approved under Professional Standards Legislation.
Document Classification: KPMG Confidential
Several of the industry opportunities identified in the table above sit in the medium- and longer-term and will require investment and effort by government and industry to develop materials, and technologies to reduce emissions and costs and increase efficiency and durability to realise these opportunities. Defining and measuring these opportunities, their time horizons, and enablers, is an important next step in identifying the necessary policy levers to realise the potential economic benefits across NSW regions and industries.
In realising these opportunities, further industry development and innovation frontiers can also open the way to commercialisation of new intellectual property, which in turn leads to new industry sectors and firms, providing employment opportunities for people across NSW.
Various analyses have considered different opportunities to those identified in Table 4 to different levels of specificity. Building on these reports and available literature, this report provides a synthesis and systematic analysis and prioritisation of industries where there is a clear understanding of their capacity to leverage or be enabled by cheaper, cleaner electricity.
There are wider intersections of industries identified in Table 4, where some opportunities may leverage decarbonisation technology pathways other than cheap renewable electricity that are outside the scope of this report (see Section 10 for a selection of these opportunities). For these opportunities, further work by government and industry will be required to clearly define and improve our understanding of the size and scope of sectors, their energy needs and strategic alignment with the growth priorities of NSW and the post-COVID-19 economic recovery. Prioritised industry opportunities analysed in this report, and their potential economic benefits, are presented in the table below.
Table 6: Industry opportunities considered in detail in this report
Opportunities Considered in this Report
Potential Economic Benefits Section Reference
A NSW hydrogen industry
• New industry formation and growth • Employment creation (and potential employment
transfer from existing fossil fuel industries) • Productivity growth in downstream industries that can
leverage hydrogen as an energy source • Increased energy security
Section 3
Green steel • Avoided industry decline or closure • Additional green premium value add to products with
the potential to increase output
Section 4
Green aluminium
• Avoided industry decline or closure • Additional green premium value add
Section 5
Green ammonia • Additional green premium value add • Improved productivity
Section 6
Sustainable chemicals and synthetic fuels
• New industry growth potential • Replacement of imports with domestic production • Domestic fuel supply and security
Section 7
Transport and logistics
• Improved productivity Section 8
Controlled environmental horticulture
• Enablement of new regions for agricultural production through access to new technologies
• Increased industry output • Improved climate resilience of agricultural output • Increased agricultural production intensity and
productivity.
Section 9

KPMG | 2
© 2020 KPMG, an Australian partnership and a member firm of the KPMG network of independent member firms affiliated with KPMG International Cooperative (“KPMG International”), a Swiss entity. All rights reserved. The KPMG name and logo are registered trademarks or trademarks of KPMG International. Liability limited by a scheme approved under Professional Standards Legislation.
Document Classification: KPMG Confidential
3 A NSW Hydrogen Industry 3.1 Background Hydrogen is emerging as a valuable carrier of energy and has the potential to play a key role in decarbonisation across several industrial sectors. This National Hydrogen Roadmap provides a blueprint for the development of an Australian hydrogen industry, by informing investment so the industry can scale in a coordinated manner.35 Coupled with the National Hydrogen Strategy and state level hydrogen plans, such as the NSW Government hydrogen initiatives (including the NSW Hydrogen Strategy which is under development), coordinated government actions are seeking to take advantage of Australia’s resources and increasing global demand for green hydrogen to develop the nation’s next major export industry.36
The small, existing hydrogen industry has the potential to grow substantially. It has a range of potential new use cases, including (but not limited to):
• Integration into existing and retrofitted natural gas networks or new reticulated networks to supplement and / or replace natural gas use;
• For use as either a reducing or heating agent in fossil-fuel intensive industrial processes such as iron smelting;
• As a potential new export industry, meeting the expected demand for hydrogen fuel in international markets where hydrogen production may not be viable, effectively enabling the export of renewable energy; and
• Other industrial use cases where it could displace other incumbent feedstock or energy sources, such as in green steel, green ammonia, chemicals manufacturing, and transportation, as well as long-term energy storage.
Hydrogen can be generated from both water (‘green hydrogen’ when made using renewable energy) and fossil fuels (‘grey hydrogen’ or, when using carbon capture, ‘blue hydrogen’). Green hydrogen can be produced via proton exchange membrane (PEM) electrolysis or alkaline electrolysis (AE) to split water into hydrogen and oxygen.37 On a large scale, the cost of PEM is currently estimated to be approximately double that of AE, with the market still developing and seeking to identify realistic cost and performance parameters.38 PEM Electrolysis is energy-intensive, requiring approximately 50 kilowatt-hours (kWh) for every kilogram (kg) of hydrogen produced. Therefore, production of green hydrogen at scale requires access to large-scale, cost competitive renewable energy generation and is closely tied to the development of renewable generation capacity.
Blue hydrogen can be produced via steam methane reforming (SMR) to produce hydrogen and carbon monoxide, coupled with carbon capture, utilisation and storage (CCUS). Similarly, hydrogen can also be generated using natural gas or brown coal (‘black’ and ‘brown’ hydrogen) together with CCUS. It
35 National Hydrogen Roadmap: Pathways to an economically sustainable hydrogen industry in Australia (13 November 2019).
36 The former COAG Energy Council, 2019, ‘Australia’s National Hydrogen Strategy’.
37 PEMs are also known as polymer electrolyte membranes.
38 Cost assessment of hydrogen production from PV and electrolysis, CSIRO (21 March 2016).
KPMG | 3
© 2020 KPMG, an Australian partnership and a member firm of the KPMG network of independent member firms affiliated with KPMG International Cooperative (“KPMG International”), a Swiss entity. All rights reserved. The KPMG name and logo are registered trademarks or trademarks of KPMG International. Liability limited by a scheme approved under Professional Standards Legislation.
Document Classification: KPMG Confidential
should be noted that green hydrogen is not necessarily directly comparable to blue/black/brown hydrogen with CCUS technologies, as CCUS are not expected to be able to cost effectively capture all carbon emissions. For example, SMR carbon capture rates have been quoted at between 53 and 90 per cent.39
Hydrogen is generally considered across industry and government to offer significant potential as part of the transition to a clean energy future, and interest continues to build domestically and internationally. To date, 19 governments have national hydrogen strategies, including China, South Korea, Japan, the UK, Germany, France, the European Union and the US have already committed to hydrogen targets.40 Others, including China, South Korea, Japan and US, already have large demonstration and pilot hydrogen fuel-cell electric vehicle (FCEV) programs with supporting FCEV infrastructure.41 During the development of Australia’s National Hydrogen Strategy, released in December 2019, the hydrogen task force developed a range of future deployment scenarios for hydrogen. One of these scenarios was a hydrogen pathway described as ‘targeted deployment’. This pathway is a targeted approach which aims to maximise economic value and benefits for effort in the deployment of hydrogen.
The NSW and Commonwealth governments are jointly funding energy and emissions reduction initiatives across the state, including the Hydrogen Technology Program.42 In addition to this, the NSW Government’s Net Zero Plan sets an aspirational target of 10 per cent hydrogen blending into the natural gas network and looks to provide grants for research and development to underpin and demonstrate the commercial viability of hydrogen technologies and handling processes across the supply chain. The objective is to support platforms to enable the commercialisation of these technologies and accelerate the development of a clean hydrogen industry in NSW.
The National Hydrogen Strategy has also established clear nationally coordinated actions for state and Commonwealth governments to implement to support the growth of a local green hydrogen industry. These actions include supporting innovative research and pilot programs aiming to improve the effectiveness of hydrogen production, transport, storage and use, leveraging existing infrastructure such as natural gas networks as well as working with potentially compatible industries to develop pathways for hydrogen uptake.43 The development of such technologies is the focus of a number of research and development programs across NSW research institutions, including hydrogen production systems (such as electrolysis, photocatalytic and other processes), hydrogen storage (chemical and liquefaction) and utilisation (heat storage, transport, electricity, industrial processes etc).
The use of hydrogen as a fuel supplement across several use cases produces cost-effectiveness benefits for end users. As a fuel in heavy vehicles, for example, hydrogen has the potential to reduce operating costs, by achieving greater running efficiency and durability. Similarly, hydrogen can be used to generate the heat required for blast furnaces in metallurgical manufacturing, such as steel production, however this is not yet cost competitive (see Section 4). Green hydrogen also has utility benefits by being stored and used to firm the electricity grid. Different hydrogen use cases are at different levels technical and commercial readiness, with several use cases such as in transportation more or less cost competitive at the moment. A variety of policy and program approaches will be required to move these cases and others further toward cost competitiveness. This maturity is illustrated in Table 7.
Green hydrogen, used in cases such as these, provides additional emissions reductions benefits, supporting NSW’s and Australia’s transition to competitive, low-emissions economies. However, it is important to note the energy and water intensity of hydrogen production using electrolysis, may have implications for supply and use considerations with other use industries, communities and local ecosystems. These aspects are discussed in the following subsections.
39 Collodi, G., et al., Techno-economic Evaluation of Deploying CCS in SMR Based Merchant H2 Production with NG as Feedstock and Fuel, Energy
Procedia (July 2017)
40 Energy Insider: 10 Strategies, 15 countries, one element, Energy Networks Australia (1 August 2019).
41 Path to Hydrogen Competitiveness: A cost perspective, Hydrogen Council (20 January 2020).
42 Memorandum of Understanding – NSW Energy Package (31 January 2020).
43 The former COAG Energy Council, 2019, ‘Australia’s National Hydrogen Strategy’.

KPMG | 4
© 2020 KPMG, an Australian partnership and a member firm of the KPMG network of independent member firms affiliated with KPMG International Cooperative (“KPMG International”), a Swiss entity. All rights reserved. The KPMG name and logo are registered trademarks or trademarks of KPMG International. Liability limited by a scheme approved under Professional Standards Legislation.
Document Classification: KPMG Confidential
Table 7: Opportunity summary – Green hydrogen in NSW
Consideration Observations Current NSW Maturity
Extent of current industry decarbonisation
Existing production processes are mature in using SMR. ARENA and CSIRO are leading investment and research projects trialling scaled use of electrolytic and photolytic processes using renewable sources.
Readiness to leverage technology pathway(s)
Opportunities for green hydrogen exist in heavy transport, chemical and metallurgical processes. While many of these applications are largely developed, some require further research and development to be more hydrogen compatible and cost competitive.
Sufficiency of existing industry infrastructure to leverage technology
Significant investment is required across all potentially compatible sectors to build new or upgrade existing hydrogen fuel networks to support production, storage, transport and use. Large portions of the existing natural gas network may be able to be leveraged to support hydrogen blending and delivery.
Key NSW regions Prospective green hydrogen plants may be suitable for location in inland regions, such as the Central-West Orana and New England and North West regions, to support agricultural, mining and future green ammonia production. Other facilities can be collocated with heavy industries such as steel manufacturing, in the Illawarra-Shoalhaven and Hunter Valley regions. Port Kembla in the Illawarra-Shoalhaven may be one of the more suitable locations in the NSW, with large scale industrial manufacturing, such as steel manufacturing, and Australia’s largest merchant hydrogen plant operated by Coregas.
Timeframe for realisation
The pathways to cost-competitive green hydrogen production, storage, transport and use will vary, requiring short, medium- and long-term considerations. Green hydrogen is not expected to be viable relative to the incumbent energy source for most use cases in the short term. Production input costs are likely to fall in the short-medium term as low-cost renewable electricity comes online, however technology, space and utilisation barriers to enable cost-effective fuel storage and transport to use locations are likely to be developed over the short, medium and long term, depending on the hydrogen fuel application type. Further investment from industries – such as steel manufacturers looking to decarbonise their production – as well as domestic and international government interventions targeting research and development and carbon pricing mechanisms are likely to support accelerated development and adoption.
Maturity key
Low or limited level
Some greater levels of maturity, however, some barriers remaining and/or current scale limited
Greater overall level of maturity and scalability

KPMG | 5
© 2020 KPMG, an Australian partnership and a member firm of the KPMG network of independent member firms affiliated with KPMG International Cooperative (“KPMG International”), a Swiss entity. All rights reserved. The KPMG name and logo are registered trademarks or trademarks of KPMG International. Liability limited by a scheme approved under Professional Standards Legislation.
Document Classification: KPMG Confidential
3.2 Considerations for Opportunity Realisation
3.2.1 Cost Competitiveness
3.2.1.1 Background information regarding calculation of costs
The CSIRO released the CSIRO National Hydrogen Roadmap in 2018. The primary objective of the Roadmap was to provide a blueprint for the development of a hydrogen industry in Australia. Subsequent to this, CSIRO provided access to the underlying data and assumptions used for the development of the Roadmap to KPMG, and together KPMG and CSIRO developed and released the Hydrogen Communities and H2City Tool based on that data and assumptions. The H2City Tool aims to calculate the full supply chain cost of hydrogen under a range of potential scenarios and is hosted on the ARENA website. It is publicly available in Microsoft Excel format and provides access to over 200 different input assumptions distilled from the underlying data and assumptions used for the development of the Roadmap.
With access to the underlying CSIRO data and assumptions used for the development of the Roadmap, KPMG has modelled a range of scenarios in this report. As the detailed CSIRO data and assumptions are confidential, we have not provided a full listing of all data and assumptions adopted by the modelling included in this report, though we note that the data and assumptions adopted by the modelling included in this report are consistent with the CSIRO National Hydrogen Roadmap, unless otherwise noted in the source.
Different assumptions to the CSIRO National Hydrogen Roadmap were adopted in the modelling for the costs of hydrogen production that utilised the H2City Tool in this report, only typically due to having access to more specific New South Wales information (for example, the nature of the New South Wales bus fleet) or more current information (for example around green steel). A list of all of these different assumptions that were adopted is included in Appendix C: Technical Information – Hydrogen Cost Modelling.
3.2.1.2 General cost cases information and limitations
There are a range of potential factors impacting current and future costs. Many of these factors are subject to significant uncertainty, particularly over long time periods. Equally, significant advancements in technology and capability are expected to occur through research and development, industry innovation, partnerships and increased investment.
To provide an indication of the factors impacting this future trajectory, KPMG has prepared the following illustration of future costs, consisting of:
• base case – assuming a starting wholesale price of electricity of $40 / MWh, with a projection of the capital costs for electrolysers consistent with the underlying CSIRO data and assumptions mentioned above;
• sensitised higher case – assuming a starting wholesale price of electricity of $50 / MWh, with a projection of the capital costs for electrolysers consistent with the underlying CSIRO data and assumptions mentioned above;
• sensitised lower case – assuming a starting wholesale price of electricity of $30 / MWh, with a projection of the capital costs for electrolysers which assumes a reduction in cost which is more pronounced than the underlying CSIRO data and assumptions.
Numerical details regarding the key assumptions in relation to all of these cases above is covered below. All the varied assumptions have also been listed in Appendix C: Technical Information Hydrogen Cost Modelling.
The sensitised cases do not represent with any confidence an upper bound or a lower bound of the cost of hydrogen production. The factors contributing to the cost of hydrogen production could vary to the extent that the costs in the future are above the sensitised higher case or below the sensitised lower case.
The purpose of this information is to provide an indication of direction and magnitude of key drivers. It is strongly emphasised that these costs are subject to a high degree of uncertainty and should be

KPMG | 6
© 2020 KPMG, an Australian partnership and a member firm of the KPMG network of independent member firms affiliated with KPMG International Cooperative (“KPMG International”), a Swiss entity. All rights reserved. The KPMG name and logo are registered trademarks or trademarks of KPMG International. Liability limited by a scheme approved under Professional Standards Legislation.
Document Classification: KPMG Confidential
interpreted in this context. They are provided for context and understanding, and as one input to the considerations in this report.
From this, the following levelised cost of hydrogen production curve has been produced below, along with some sensitised cost curves generated from varying some of the main assumptions regarding the cost of hydrogen.
Figure 3: Levelised cost of hydrogen production (at a wholesale electricity price of $40/MWh) and sensitised cases - sensitivities only
Source: Calculation from the H2City Tool, utilising underlying data and assumptions from CSIRO unless otherwise explicitly stated (Appendix C: Technical Information – Hydrogen Cost Modelling).
For the calculation in Figure 3 above, the method of production of hydrogen is that of PEM electrolysers, with electricity being the main feedstock. The key assumptions that are observed to be drivers of the cost of hydrogen are:
• The cost of electricity; and
• The projected electrolyser capital expenditure over time.
Further detail is provided below on these key assumptions.
0123456789
10
2020
2021
2022
2023
2024
2025
2026
2027
2028
2029
2030
2031
2032
2033
2034
2035
2036
2037
2038
2039
2040
2041
2042
2043
2044
2045
2046
2047
2048
2049
2050
$ /
kg H
2
Levelised Cost of Hydrogen $ / kg H2 with sensitised cases (sensitivities only)
Capex (levelised) Opex
Sensitised higher case Sensitised lower case
*Sensitised cases are sensitivities only – not upper or lower bounds.

KPMG | 7
© 2020 KPMG, an Australian partnership and a member firm of the KPMG network of independent member firms affiliated with KPMG International Cooperative (“KPMG International”), a Swiss entity. All rights reserved. The KPMG name and logo are registered trademarks or trademarks of KPMG International. Liability limited by a scheme approved under Professional Standards Legislation.
Document Classification: KPMG Confidential
3.2.1.3 Key assumption – cost of electricity
The cost of electricity constitutes a large proportion of the production operating expenditure for the cost of hydrogen and is visualised here:
Figure 4: Cost of electricity as feedstock into PEM electrolyser ($ 40 / MWh starting wholesale price)
Source: calculation from the H2City Tool, utilising underlying data and assumptions from CSIRO unless otherwise explicitly stated (Appendix C: Technical Information – Hydrogen Cost Modelling).
The cost of electricity is calculated as an aggregate of a wholesale electricity price and applicable network charges. The description of the assumptions regarding these components are as follows:
• The starting wholesale price of electricity at 2020 is $40 / MWh (before inclusion of network charges). Based on projections of the levelised cost of electricity for standalone wind farms and standalone solar PV technologies in the CSIRO publication Gencost 2018: Updated projections of electricity generation technology costs,44 the wholesale electricity price is subject to a reduction factor which is projected to decline such that the wholesale price of electricity reduces to $28 / MWh at 2050;
• For 2020 to 2030, hydrogen production projects would be sourcing electricity by connecting to the grid at a distribution level. Of these projects, it is assumed that 70% of these projects would be grid sourced and 30% would be behind the meter. Network charges are applied to the grid sourced portion of the projects. Network charges comprise of distribution use of system (DUOS) charges, transmission use of system (TUOS) charges and environmental charges. Network charges are calculated based on a ratio to wholesale prices. At 2020, the network charges are calculated to be $35 / MWh
• From 2031 onwards, hydrogen production projects would be sourcing electricity by connecting to the grid at a transmission level. Of these projects, it is assumed that 40% of these projects would be grid sourced and 60% would be behind the meter. Network charges are applied to the grid sourced portion of the projects. Given the grid connection level, network charges comprise of TUOS charges and environmental charges only and DUOS charges are avoided. Network charges are calculated based on a ratio to wholesale prices. At 2031, the network charges are calculated to be $6 / MWh.
• The sensitised cases reflect the variance of some of the above factors in the calculation of the cost of hydrogen and are outlined below. These sensitised cases reflect sensitivities only – they are not indicators of an upper bound or a lower bound of the factors i.e. the factors could vary to the extent that the cost of hydrogen production could be above the sensitised higher case or below the sensitised lower case.
44 Graham, P.W., Hayward, J, Foster, J., Story, O.1 and Havas, L. 2018, GenCost 2018. CSIRO, Australia.
0
10
20
30
40
50
60
70
8020
2020
2120
2220
2320
2420
2520
2620
2720
2820
2920
3020
3120
3220
3320
3420
3520
3620
3720
3820
3920
4020
4120
4220
4320
4420
4520
4620
4720
4820
49
$ /
MW
h

KPMG | 8
© 2020 KPMG, an Australian partnership and a member firm of the KPMG network of independent member firms affiliated with KPMG International Cooperative (“KPMG International”), a Swiss entity. All rights reserved. The KPMG name and logo are registered trademarks or trademarks of KPMG International. Liability limited by a scheme approved under Professional Standards Legislation.
Document Classification: KPMG Confidential
• For the sensitised high case, the wholesale electricity price ranges from $50 / MWh at 2020 to $35 / MWh at 2050;
• For the sensitised low case, the wholesale electricity price ranges from $30 / MWh at 2020 to $20 / MWh at 2050;
3.2.1.4 Key assumption – projected electrolyser capital expenditure
The projected electrolyser capital expenditure over time constitutes a large proportion of the capital expenditure for the cost of hydrogen. As this cost is a material amount, this cost has been visualised on a 5-year incremental basis as per below (costs below inclusive of balance of plant and stack):
Figure 5: 5-year capital costs for PEM electrolyser ($ / kW)
Source: calculation from the H2City Tool, utilising underlying data and assumptions from CSIRO unless otherwise explicitly stated (Appendix C: Technical Information – Hydrogen Cost Modelling).
As per the visualisation above, the cost curve specific to the capital costs for the electrolyser reflects a learning curve assumption. The 2050 electrolyser cost is 25.6% of the 2020 electrolyser cost. The base case and the sensitised high case both adopt this learning curvature. For the sensitised low case, the 2050 electrolyser cost is 10% of the 2020 electrolyser cost. The proportional reduction from 25.6% to 10% is on a compounded basis over the 30 years from 2020 to 2050.
This cost of hydrogen production curve modelled as well as the sensitised cases (relating only to the cost of hydrogen production) are used as inputs to a number of the industry opportunities considered later in this report. When compared to various incumbent technologies in the end use sectors (e.g. diesel for mobility cases, or coking coal steel in a ‘green’ steel case), the current calculations indicate that the cost of electricity (both wholesale and network) is a significant factor in terms of determining the overall cost competitiveness of hydrogen production costs.
3.2.1.5 Sensitivity of future potential hydrogen cost to input factors
The future cost of hydrogen will be materially shaped by the cost of electricity, electrolyser scale and electrolyser capacity factors. While in the long term the total production cost of hydrogen is expected to reduce, there is a high degree of uncertainty over this trajectory and the rate of change.
To illustrate this uncertainty, sensitivity analysis has been prepared with respect to the cost of hydrogen utilising the H2City Tool (with underlying CSIRO data and assumptions referred to above). The range for the key factors which have been subject to sensitivity analysis is:
• The Electrolyser scale (2020 small scale electrolyser, 2021 1.25 MW scale electrolyser, 2031 large scale electrolyser);
0
500
1,000
1,500
2,000
2,500
3,000
3,500
4,000
2020 2025 2030 2035 2040 2045 2050
$ /
kW

KPMG | 9
© 2020 KPMG, an Australian partnership and a member firm of the KPMG network of independent member firms affiliated with KPMG International Cooperative (“KPMG International”), a Swiss entity. All rights reserved. The KPMG name and logo are registered trademarks or trademarks of KPMG International. Liability limited by a scheme approved under Professional Standards Legislation.
Document Classification: KPMG Confidential
• Cost of electricity, ranging from a wholesale cost of electricity to be $10 / MWh to $100 / MWh (these wholesale costs are prior to application of network charges); and
• Capacity factor of electrolysers, ranging from 10% to a hypothetical maximum of 100%;
These costs of hydrogen are then placed into three categories:
• Base case (as described above in Section 3.2.1 above) – adopts parameters consistent with the balance of the report;
• Sensitivity analysis cases – adopting wholesale cost of electricity parameters that are consistent with the balance of the report with respect to the sensitised cost cases; and
• Additional sensitivities / all other cases – Reflecting further sensitivities to the above key factors.
The further sensitivity analysis is for illustrative purposes to show how and how much the cost of hydrogen is sensitive to the above key factors. As a note, certain combinations of these inputs in practice would be more likely to occur than other combinations. For example, a higher capacity factor would be expected to incur higher electricity costs, as well as the inverse i.e. attempting to have a source of electricity which has a lower cost leads to the electrolyser having a lower capacity factor.
The above ranges of key factors are not the definitive range of inputs (they do not define the maxima and minima for the above factors). For example, in certain circumstances it is possible to have negative electricity power prices. As a result, the figure below does not represent the definitive range of the costs of hydrogen. As mentioned above, there are other factors that are relevant to the cost of hydrogen (as covered in Appendix C: Technical Information – Hydrogen Cost Modelling), however for presentation reasons they are not subject to variation.
The sensitivity analysis regarding the cost of hydrogen is illustrated below, with the first set of sensitivities being in relation to the 2020 small scale electrolyser, then the 2021 1.25 MW scale electrolyser and then the 2031 large scale electrolyser.

KPMG | 10
© 2020 KPMG, an Australian partnership and a member firm of the KPMG network of independent member firms affiliated with KPMG International Cooperative (“KPMG International”), a Swiss entity. All rights reserved. The KPMG name and logo are registered trademarks or trademarks of KPMG International. Liability limited by a scheme approved under Professional Standards Legislation.
Document Classification: KPMG Confidential
Figure 6: Sensitivity analysis – Cost of hydrogen for 2020, 2021 and 2031 electrolyser technology with sensitivity of electrolyser capacity factor and wholesale cost of electricity (cost of hydrogen expressed in $ / kg)
2020 Electrolyser Technology
Base Sensitised Additional
Electrolyser Capacity Factor (%)
10% 35% 45% 55% 85% 100%
Wholesale Cost of Electricity (excluding network
charges) ($ / MWh)
10 25.83 8.35 6.80 5.81 4.24 3.81
30 27.85 10.37 8.82 7.83 6.26 5.83
40 28.86 11.38 9.83 8.84 7.27 6.84
50 29.87 12.39 10.84 9.85 8.28 7.85
80 32.90 15.42 13.86 12.88 11.31 10.87
100 34.92 17.44 15.88 14.89 13.32 12.89
2021 Electrolyser Technology
Base Sensitised Additional
Electrolyser Capacity Factor (%)
10% 35% 45% 55% 85% 100%
Wholesale Cost of Electricity (excluding network
charges) ($ / MWh)
10 22.99 7.54 6.16 5.29 3.90 3.52
30 24.99 9.54 8.16 7.29 5.90 5.52
40 25.99 10.54 9.16 8.29 6.90 6.52
50 26.99 11.54 10.16 9.29 7.90 7.52
80 29.99 14.54 13.16 12.29 10.90 10.52
100 31.99 16.54 15.16 14.29 12.90 12.52
2031 Electrolyser Technology
Base Sensitised Additional
Electrolyser Capacity Factor (%)
10% 35% 45% 55% 85% 100%
Wh
ole
sale
Co
st o
f E
lect
rici
ty (
excl
ud
ing
n
etw
ork
ch
arg
es)
($ /
M
Wh
)
10 8.14 2.96 2.50 2.21 1.75 1.62
30 9.21 4.03 3.57 3.28 2.82 2.69
40 9.75 4.57 4.11 3.82 3.35 3.22
50 10.28 5.10 4.64 4.35 3.89 3.76
80 11.89 6.71 6.25 5.96 5.49 5.36
100 12.96 7.78 7.32 7.03 6.56 6.43
Source: Calculation from the H2City Tool, utilising underlying data and assumptions from CSIRO unless otherwise explicitly stated (Appendix C: Technical Information – Hydrogen Cost Modelling).
As from the above illustrations in Figure 6, the cost of hydrogen is highly sensitive to the above factors. This is particularly apparent from the displayed cost of hydrogen from the lowest to highest factors where the cost of hydrogen is sensitive to any single one of these factors. As a result, the above should be considered when interpreting the balance of this report. For example, if it were possible to reduce the intermittency of renewable energy sources and therefore allow for a higher capacity factor for the electrolyser, this could lead to a lower cost of hydrogen production.

KPMG | 11
© 2020 KPMG, an Australian partnership and a member firm of the KPMG network of independent member firms affiliated with KPMG International Cooperative (“KPMG International”), a Swiss entity. All rights reserved. The KPMG name and logo are registered trademarks or trademarks of KPMG International. Liability limited by a scheme approved under Professional Standards Legislation.
Document Classification: KPMG Confidential
Alternatively, it is highly unlikely for hydrogen production projects to have a lower capacity factor (in an attempt to avoid the costs of electricity from spot prices in the National Electricity Market), as hydrogen production is not economically viable for a large-scale project that operates less frequently.
3.2.1.6 Other evidence
Wider information on future hydrogen production costs, including detailed supporting assumptions to understand costs, are limited. Bloomberg New Energy Finance Limited’s Hydrogen Economy Outlook publication (dated March 30, 2020) included a forecast global range of hydrogen costs as at 2019, 2030 and 2050, as shown below.
Figure 7: Point-in-time forecast global ranges of cost of hydrogen from large projects ($ / kg)
Source: Bloomberg New Energy Finance Limited Hydrogen Economy Outlook Publication March 2020.45
3.2.2 Strengths and Competitive Advantages NSW is well placed to leverage several strengths in supporting the potential for a new local hydrogen industry and meet expected growing domestic and international demand.
• NSW is abundant with intermittent renewable energy sources, such as wind and solar, and is one of the largest investors nationally in renewable energy, accounting for 31.2 per cent of all clean energy investment nationally.46 Additionally, the development of REZs provide an accelerated pathway for harnessing the states renewable energy sources, integrating them into the electricity grid to lower transmission costs and enabling industrial scale hydrogen production.
• It is suggested that hydrogen can be blended into existing natural gas networks at 5-15 per cent concentrations without significantly increasingly risk associated with use of the gas blend and end-use devices.47 This can provide a cost effective means to transport the fuel directly to end-users and be fed into appliances and production processes that are tolerant of methane blended with hydrogen. As part of the Net Zero Plan, the NSW Government’s has established an aspirational target of up to 10 per cent hydrogen blend in the natural gas network by 2030.48 The Western Sydney Green Gas Project blending trial is providing opportunities for NSW to lead the way in research and development of hydrogen integration into natural gas networks.
• Current ports and transport links can be leveraged as part of a future hydrogen fuel transport network. The Port of Newcastle and Port Kembla and other inland infrastructure (e.g. inland rail) have the potential to link future hydrogen production facilities and with export terminals and
45 Note: Renewable hydrogen costs are based on large projects with optimistic projections for CAPEX. Natural gas prices range from $1.10-10.30/MMBtu,
coal from $30-116 per tonne.
46 Renewable energy, Invest NSW.
47 Melaina, M. W., Antonia, O., and Penev, M., Blending Hydrogen into Natural Gas Pipeline Networks: A Review of Key Issues, National Renewable Energy
Laboratory (2013).
48 Net Zero Plan, Stage 1: 2020-2030, Department of Planning, Industry and Environment.

KPMG | 12
© 2020 KPMG, an Australian partnership and a member firm of the KPMG network of independent member firms affiliated with KPMG International Cooperative (“KPMG International”), a Swiss entity. All rights reserved. The KPMG name and logo are registered trademarks or trademarks of KPMG International. Liability limited by a scheme approved under Professional Standards Legislation.
Document Classification: KPMG Confidential
potential end users such as green steel and green ammonia manufacturers. Additionally, powering high-mileage cars, trucks and buses to carry passengers and goods along popular routes can also make fuel-cell vehicles more competitive, further driving down the entry costs for the transport sector (see Section 8 for more discussion of transport applications).
• NSW is home to a nationally leading science and research industry. Many of the universities in NSW have research and development programs focusing on aspects of one or all of hydrogen production, storage and utilisation technologies and processes. Examples include:
– UNSW developing storage systems such as H2Store and Lavo Hydrogen Storage Technology;
– The University of Sydney studying the production of hydrogen from biomass and waste fuels;49
– The University of Newcastle testing methods to convert coal to hydrogen while also using CCUS.50
– The University of Technology Sydney has a Hydrogen Energy Program to develop key hydrogen technologies; and
– Macquarie University investigating engineered bacteria to produce hydrogen from sugars at higher rates than other studies as part of their Biological Hydrogen Production project.51
Research and development programs studying efficiencies in electrolysis, photochemical and biomass and waste conversion methods can be leveraged to support the development of a cost competitive hydrogen industry. Other programs studying compression and liquefaction and the use of hydrogen as an export product or in natural gas blending or industrial processes can support accelerated adoption of hydrogen across sectors of the economy and in international export markets.
3.2.3 Barriers While there is a range of strengths that can be leveraged, there remains significant long-term barriers to the industry reaching end-users to adopt hydrogen as a source of energy or feedstock at scale. These barriers, described below, are expected to continue contributing to upward pressure on the price of producing, transporting, and consuming hydrogen fuel.
• Existing major hydrogen fuel production processes are heavily energy intensive, using fossil fuels to generate heat, for thermal processes, or electricity, for electrolysis. The high energy demand of production adds significant costs to producing the fuel and generates high levels of emissions. Without more abundant and cheaper renewable energy, clean hydrogen may continue to be too expensive for end-users to adopt as an alternative source of energy or feedstock.
• Hydrogen production through electrolysis is water intensive, placing additional demand on water supply. High water intensity may compete with other use industries, community water needs and water considerations for the surrounding environment or ecosystems from which water is transported. Further infrastructure and capital investment may also be required to establish water networks to feed into the hydrogen production plants, potentially adding further significant costs to industry investment.52
• Hydrogen production, storage, transportation and use will require the development, testing, standardisation and deployment of a range of specialty equipment, processes and skills for safe production and use. This includes materials that don’t become embrittled when handling hydrogen over time, high precision manufacturing of valves and joints to avoid gas leakage, monitors and sensors, accredited handing protocols.
• The production of green hydrogen as an alternative fuel source or feedstock has a high marginal cost, discouraging accelerated uptake of green hydrogen and industry specific compatible technologies. A viable local green hydrogen industry will require greater uptake from a variety of industries, particularly those that are able to collocate next to hydrogen production or transport
49 Hydrogen production from biomass and waste fuels, The University of Sydney (July 2020)
50 The University of Newcastle is playing a key role in the Hunter's energy transition, Newcastle Herald (1 December 2019).
51 Biological Hydrogen Production, Macquarie University (2019).
52 National Hydrogen Roadmap: Pathways to an economically sustainable hydrogen industry in Australia (13 November 2019).

KPMG | 13
© 2020 KPMG, an Australian partnership and a member firm of the KPMG network of independent member firms affiliated with KPMG International Cooperative (“KPMG International”), a Swiss entity. All rights reserved. The KPMG name and logo are registered trademarks or trademarks of KPMG International. Liability limited by a scheme approved under Professional Standards Legislation.
Document Classification: KPMG Confidential
facilities and generate agglomeration benefits, such as green ammonia plants and hydrogen refuelling stations for freight and bus transport.
• While NSW has extensive fuel transport infrastructure, such as roads, pipes and ports, many will require retrofitting or upgrades to equipment to ensure compatibility and safe use with hydrogen. This includes fitting terminals and fuelling locations with the right systems to enable the transfer of fuel.53
• There are long term barriers to the cost competitiveness of hydrogen fuel exports due to the significant costs to liquefy or convert it to a carrier, such as ammonia. Significant capital investment in specialised holding tanks and points of fuel transfer are required to enable hydrogen exports. Further, hydrogen transportation is highly energy intensive due to the extent of cooling required to store hydrogen in its liquid state.
• The cost of upgrading or obtaining new hydrogen fuel compatible appliances, technology or machinery may be significant for some cost sensitive industry operators or end-users, discouraging a transition to hydrogen as a source of energy or feedstock.54 For example, new FCEV bus and truck fleets will need to be purchased or some manufacturers will need to upgrade their existing machinery to be compatible with hydrogen as a production feedstock.
3.2.4 Infrastructure Requirements There is a range of different infrastructure requirements throughout the hydrogen supply chain, outlined in the sub sections below.
3.2.4.1 Hydrogen production
The production of green hydrogen in NSW will require investments in the development of production plants and renewable energy assets.
• The technical and supporting infrastructure requirements of green hydrogen plants will depend on the chosen production method; electrolysis, which uses electricity to split water, and photolytic, which uses direct sunlight. At present, hydrogen production through electrolysis is the industry’s preferred method, while other technologies, such as photolytic production, are being investigated. For plants using the electrolysis method, electrolyser units will be needed in addition to compressor units if these are not already integrated into the electrolysers.55 Photolytic plants on the other hand, require specialised semiconductors to directly dissociate water molecules.56 The plants can also operate at different scales, depending on the production method of choice, impacting the total infrastructure investment required and the development of other supporting infrastructure:
– Electrolysis plants can take advantage of renewable electricity infrastructure and be deployed at both small-scale distributed production plants as well as larger-scale centralised facilities, supporting a wider variety of hydrogen fuel applications.57
– Photolytic plants are more suited to centralised and semi-centralised scales, offering the potential for high conversion efficiency. However, photolytic plants are a more long-term green hydrogen technology pathway, due to greater research development still required to produce more efficient and robust semiconductor materials and surface coatings.58
• Utility scale renewable energy infrastructure, such as wind, solar and pumped hydro can provide low-emission electricity into the production process. Future capital investment and renewable electricity generation should be targeted at geographically strategic locations with abundant intermittent energy sources, such as the Central-West Orana, New England and North West
53 Path to Hydrogen Competitiveness: A cost perspective, Hydrogen Council (20 January 2020).
54 Hydrogen Economy Outlook: BloombergNEF (30 March 2020),
55 Hydrogen Production: Electrolysis, Office of Environment Efficiency & Renewable Energy.
56 Hydrogen Production: Photoelectrochemical Water Splitting, Office of Environment Efficiency & Renewable Energy.
57 Hydrogen Production: Electrolysis, Office of Environment Efficiency & Renewable Energy.
58 Hydrogen Production: Photoelectrochemical Water Splitting, Office of Environment Efficiency & Renewable Energy.

KPMG | 14
© 2020 KPMG, an Australian partnership and a member firm of the KPMG network of independent member firms affiliated with KPMG International Cooperative (“KPMG International”), a Swiss entity. All rights reserved. The KPMG name and logo are registered trademarks or trademarks of KPMG International. Liability limited by a scheme approved under Professional Standards Legislation.
Document Classification: KPMG Confidential
regions. Additional investment may be required to enable transmission between electricity generating assets and production plants, depending on the location of production facilities.
• Accessibility to water should also be considered due to the variations in the price of water with higher water treatment requirements. For example, fresh water is cheaper than purifying ground water and desalination. Despite this variability, the cost of water typically makes up less than two per cent of the cost of hydrogen production.59
• Considerations around occupational health and safety and risk to communities and ecosystems surrounding hydrogen production plants will also present questions about which locations are suitable for investment or development. These considerations include the impact of newly developed infrastructure on existing communities or businesses and the capacity of technologies or equipment used in facilities to mitigates any potential risks.
3.2.4.2 Transportation and export
Hydrogen transportation presents a significant cost consideration for producers and end-users as well as governments seeking to enable green hydrogen powered industries. Two hydrogen production location considerations are critical to determining the cost implications of transport:
1. Collocation with end-users – Hydrogen production is collocated with demand or end-use sites, such as near refuelling stations or industrial manufacturing plants, while electricity used in production is transported over distance via transmission infrastructure. This option may require the construction of additional electricity transmission lines and relatively limited development of hydrogen transport infrastructure as opposed to collocation with electricity generation. Collocating with end-users reduces costs associated with hydrogen transport and is considered more financially feasible. Additionally, this collocation enables hydrogen plants to gain easier access to water waste and runoff from nearby use industries, improving overall water efficiency in the economy and contributing to sustainable energy production.
2. Collocation with electricity generation – Hydrogen production is collocated with electricity generation, such as near renewable generation assets in REZs, and the subsequent produced hydrogen transported to end-use sites. While this option requires relatively less capital investment in electricity transmission infrastructure, significant investment will be needed to develop adequate hydrogen transportation networks, such as retrofitting existing natural gas networks or building new reticulated networks where transport via road or rail is not suitable. Similar to collocating with end-users, hydrogen plants will require a level of investment in water infrastructure, however, ease of access may be reduced depending on where water sources are located.
The infrastructure requirements to export hydrogen are heavily correlated with where hydrogen plants are located. Plants that are further away from export terminals, such as seaports, may require additional investment in retrofitting existing natural gas networks or building new reticulated networks to carry the hydrogen to loading terminals. Sea ports and carrier ships may also require upgrades to ensure they have compatible facilities and equipment in place to enable hydrogen transfer.
Additional consideration will need to be given toward the types of distribution and loading and unloading technologies used when transporting hydrogen to reduce or eliminate risks around loss of containment or embrittlement. Prospective hydrogen fuel departure seaports will also need to be fitted with hydrogen compatible transfer equipment, to load fuel into ship tankers and minimise spillages.
3.2.4.3 Storage
The storage of hydrogen in large quantities, such as having a strategic reserve capability for example, may generate significant costs due to the challenges arising from the chemical’s low density.60 These challenges necessitate continued research and development to improve efficiency and investment in
59 National Hydrogen Roadmap: Pathways to an economically sustainable hydrogen industry in Australia (13 November 2019).
60 Hydrogen Economy Outlook: BloombergNEF (30 March 2020),

KPMG | 15
© 2020 KPMG, an Australian partnership and a member firm of the KPMG network of independent member firms affiliated with KPMG International Cooperative (“KPMG International”), a Swiss entity. All rights reserved. The KPMG name and logo are registered trademarks or trademarks of KPMG International. Liability limited by a scheme approved under Professional Standards Legislation.
Document Classification: KPMG Confidential
the construction of robust hydrogen gas and liquid holding tanks, and other storage approaches such as hydrogen absorption alloys.61 Hydrogen storage technologies can be classified as:
• Compression: Gaseous hydrogen stored at higher pressures to decrease volume. Includes large scale underground storage (e.g. salt caverns) and ‘line packing’ in gas pipelines;
• Liquefaction: Pressurising and cooling hydrogen to -253˚C so that it is in a liquid state; and
• Chemical: Molecules such as ammonia, metal hydrides and toluene that carry hydrogen. All retain an additional energy penalty and cost associated with the recovery of hydrogen prior to use.62
Current storage options require large volumes to store hydrogen as a gas, necessitating the construction of large compressed holding tanks. This is less of an issue in stationary applications but creates challenges for the transportation and use of the fuel, impacting end use applications.63 Further development is required to improve the cost effectiveness of storage of hydrogen fuel in liquid form through either mixing with other chemicals or by reacting hydrogen and other molecules to liquid organic hydrogen carriers (LOHCs). This will enable cost-effective and feasible transportation and use by non-stationary end users such as FCEV powered buses, trucks and private vehicles.64 65
Improving efficiencies and capability in storage will also enable the development of a cost-competitive hydrogen export industry in NSW. Similar to on-land storage units, specialised holding units will be required on fuel ships for scaled transportation of hydrogen to export markets. The selection and use of both on-land storage units and units used for storage during transportation will need to consider the impact of the surrounding environmental conditions, such as temperature and moisture, on the technologies’ mechanical performances and anticipate and mitigate los of containment or embrittlement risks.
3.2.4.4 End use infrastructure
In order to achieve wider uptake of hydrogen as a source of energy or feedstock across multiple industries, several infrastructure requirements will need to be met to support various end use types, these include:
• In the longer term, upgrading or developing new gas networks, particularly around industry end user locations, to enable the transportation of hydrogen to consumption points. The characteristics of pipes used in the network need to be reflective of potential end users.66 Some reticulation pipelines will need to be able to carry pure hydrogen, while others may carry hydrogen blended with other liquids or gases, such as methane, where some appliances are able to use methane mixed with hydrogen. The CSIRO has recently developed a metal membrane to enable the separation of hydrogen from ammonia, providing a pathway for scaled use of hydrogen as well as supporting a future export industry.67
• Additional port infrastructure, including specialised holding tanks, loading stations and possibly facilities to convert and reconvert hydrogen to a chemical carrier, to enable the export of hydrogen to domestic and international end-use locations.
• Construction of new standardised hydrogen refuelling stations at strategic locations, such as key freight and passenger transport depots or locations along major routes, to allow relevant industries, including freight and buses, to access refuelling options.68
Precincts that contain hydrogen production, storage and refuelling facilities and assets will be critical to reducing the overall cost of production and costs borne by end-users. These hubs should be constructed in a way that supports the shared use of dedicated production and refuelling facilities by
61 Hydrogen can be stored via absorption in metal alloys, which are able to absorb over a thousand times their own volume in hydrogen. Solid state lattice
materials can also store hydrogen through adsorption.
62 National Hydrogen Roadmap, CSIRO (2018).
63 Hydrogen Storage, Office of Environment Efficiency & Renewable Energy.
64 Hydrogen Storage, Office of Environment Efficiency & Renewable Energy.
65 Hydrogen Economy Outlook: BloombergNEF (30 March 2020),
66 Path to Hydrogen Competitiveness: A cost perspective, Hydrogen Council (20 January 2020).
67 CSIRO tech accelerates hydrogen vehicle future, CSIRO (8 August 2018).
68 Path to Hydrogen Competitiveness: A cost perspective, Hydrogen Council (20 January 2020).

KPMG | 16
© 2020 KPMG, an Australian partnership and a member firm of the KPMG network of independent member firms affiliated with KPMG International Cooperative (“KPMG International”), a Swiss entity. All rights reserved. The KPMG name and logo are registered trademarks or trademarks of KPMG International. Liability limited by a scheme approved under Professional Standards Legislation.
Document Classification: KPMG Confidential
multiple industries, allowing hydrogen producers to reach economies of scale, while working to minimise hydrogen transportation costs. Assets that provide electricity inputs to the production process will need to be located in geographically strategic locations, such as REZs, and linked to the precincts, while industry end users of hydrogen may be able to collocate low-emissions greenfield production facilities within these hubs.
3.2.4.5 Hydrogen production, storage and utilisation facility location options
Hydrogen production, storage and utilisation facilities should be located near key transition points between producers and end-users, including near strategically planned refuelling depots or key inland rail and seaport infrastructure, to limit overall costs associated with hydrogen transportation. Production, storage or utilisation sites can be located near the Port of Newcastle and Port Kembla in the Hunter Valley and Illawarra-Shoalhaven Regions respectively, where steel, aluminium and other facilities are located. Locations for hydrogen sites could also be selected to support the development, and take advantage, of designated SAPs.
The SAPs announced to date include:
• The Williamtown SAP – located in the Hunter Region, hydrogen production facilities can support the growth of the NSW defence and aerospace industries.
• The Parkes SAP – together with the Central-West Orana Region REZ, the SAP offers opportunities to link hydrogen production with the development of low emissions freight and logistics and agriculture industries. The SAP could also host central hydrogen storage and transportation facilities, enabling hydrogen powered road freight transport through the region and leveraging proposed projects sites for the Inland Rail. Parkes is also a geographically strategic location for hydrogen production facilities, with large solar energy generation capability already in place and to be expanded under the development of the Central-West Orana REZ.
• The Wagga Wagga SAP – hydrogen production facilities can be used to support the growth of manufacturing, agribusiness and freight and logistics around the Wagga Wagga precinct, supporting further growth opportunities from the development of the Inland Rail Project and the Bomen Business Park. Wagga Wagga also hosts existing hydrogen users, such as Southern Oil Refining and its surrounds are also attractive locations for hydrogen production due to large solar energy generation capability in the area.
• The Moree SAP – like Parkes, Moree is strategically located near the New England and North West REZ and is along the proposed Inland Rail corridor.
To meet the higher electricity demand of these facilities, renewable energy assets would need to be located nearby to take advantage of geographically strategic locations, such as the Central-West Orana and New England and North West Regions, where the development of REZs can be linked with hydrogen production facilities. Further considerations will need to be made in alignment with the adoption of hydrogen across industries, where collocation to improve cost effectiveness may be optimal. As previously mentioned throughout this section, the suitability of production sites will also be impacted by assessments made with respect to occupational health and safety and other surrounding safety considerations concerning risks to communities, existing properties, surrounding or connected ecosystems arising from production, storage, transportation and use.
As previously mentioned above, green hydrogen production using electrolysis is highly water intensive, consuming nine litres of water for every one kilogram of hydrogen.69 A number of critical water infrastructure and use considerations will need to be accounted for:
• The collocation of hydrogen producing plants with water sources will reduce the need to upgrade or develop new water distribution systems to supply plants, with the capital investment in water infrastructure increasing the more distance plants are to water sources; and
• Water consumption of hydrogen plants will need to be balanced with the needs of communities, other water intensive industries, such as agriculture, interstate water agreements and environmental impacts. This balancing will require engagement with communities, industries and
69 National Hydrogen Roadmap: Pathways to an economically sustainable hydrogen industry in Australia (13 November 2019).

KPMG | 17
© 2020 KPMG, an Australian partnership and a member firm of the KPMG network of independent member firms affiliated with KPMG International Cooperative (“KPMG International”), a Swiss entity. All rights reserved. The KPMG name and logo are registered trademarks or trademarks of KPMG International. Liability limited by a scheme approved under Professional Standards Legislation.
Document Classification: KPMG Confidential
regulators to ensure negative impacts are avoided or minimised while also considering the impact of changing climate conditions on water supply in the future.
• Opportunities to use water recycling technologies in hydrogen production and use, in particular where a closed loop can be deployed, where energy is used to split water producing hydrogen and oxygen, followed by hydrogen combustion producing water and energy.

KPMG | 18
© 2020 KPMG, an Australian partnership and a member firm of the KPMG network of independent member firms affiliated with KPMG International Cooperative (“KPMG International”), a Swiss entity. All rights reserved. The KPMG name and logo are registered trademarks or trademarks of KPMG International. Liability limited by a scheme approved under Professional Standards Legislation.
Document Classification: KPMG Confidential
3.2.5 Supply Chain Considerations
3.2.5.1 Characteristics of the hydrogen supply chain at different scale and locations
In practice, given the multiple variable factors for the supply and demand of hydrogen, the potential hydrogen supply chain can manifest in multiple forms.
Some of the main influences on portions of the hydrogen supply chain are described here:
Table 8: Main influences on portions of the hydrogen supply chain.
Supply chain portion Supply Chain Influences
Production (Electrolyser)
• Size of electrolyser needs to be considered to ensure efficient utilisation
• Modular technologies likely to prevail over larger bespoke products
Electricity Source (feedstock for production)
• The need to ensure a high/higher electrolyser utilisation level would accordingly drive the energy requirements and costs;
Storage, transport and liquefaction
• Transport can be via road, rail or pipeline as gas, liquid or ammonia • Liquefaction capital, OPEX and losses in isolation may be economic,
however given the cost of shipping, this may mean that liquefaction is only viable at scale and suitable for export (rather than domestic) markets
• Dedicated pipelines for hydrogen may be required for both or either transportation across large distances or reticulation around production and use sites
Water utilisation • Water supply logistics vary depending upon scale and location • Use of water entitlements or potable water unlikely to be required
given limited marginal cost impact of desalinated or treated water even at small scale
• Oxygen by-product is utilised in water treatment reducing costs
Hydrogen use case • Hydrogen use cases vary depending upon scale and location • There is a trade-off between the lower cost of scale production and
the cost of transportation
Source: KPMG analysis based on available research.
In addition to this, given three hydrogen production circumstances, the potential characteristics of these portions of the hydrogen supply chain have been disclosed below:
Table 9: Examples of characteristics of hydrogen supply chain with certain scale and location.
Supply chain portion
Hydrogen produced at Generation Site
Hydrogen produced at a Regional Hub
Hydrogen produced on coastal area
Production (Electrolyser)
Small scale, modular systems
Larger scale, modular systems
Large scale – modular systems or bespoke
Electricity Source (feedstock for production)
Own generation supplemented with grid
Grid generation/large scale behind the meter
Grid generation/large scale behind the meter
Storage, transport and liquefaction
Liquefaction not feasible • Rail transport generally lower cost than
Liquefaction viable for shipping

KPMG | 19
© 2020 KPMG, an Australian partnership and a member firm of the KPMG network of independent member firms affiliated with KPMG International Cooperative (“KPMG International”), a Swiss entity. All rights reserved. The KPMG name and logo are registered trademarks or trademarks of KPMG International. Liability limited by a scheme approved under Professional Standards Legislation.
Document Classification: KPMG Confidential
Supply chain portion
Hydrogen produced at Generation Site
Hydrogen produced at a Regional Hub
Hydrogen produced on coastal area
dedicated H2 pipeline
• Liquefaction may be economic, but shipping unlikely at required economies of scale
Water utilisation
• Utilisation of industrial wastewater or grey water
• Desalination is possible even at small scale due to limited marginal cost impact
• Utilisation of grey, recycled of industrial wastewater.
• Likely collocated with water treatment
• Desalination is possible even at small scale due to limited marginal cost impact
• Utilisation of grey, or recycled industrial wastewater
• Water treatment including desalination is possible even at small scale due to limited marginal cost impact
Hydrogen use case
• Remote power • Energy storage • Heavy vehicle
depot
• Gas network injection
• Industrial and vehicle hubs
• Energy storage
• Export • Gas grid injection • Energy storage
Source: KPMG analysis based on available research.
3.2.5.2 Consideration of success factors
Given the current extent of hydrogen production and use, there are several success factors relevant to its adoption for wider use as well as establishment of associated supply chains.
These hydrogen success factors are identified below, along with some initial disclosure on distinctions between domestic and international influences, as well as indicative qualitative ratings of the level of these influences.
Table 10: Suggested extent of influence over key hydrogen success factors
Hydrogen Success Factors
Disclosure regarding domestic and international influences
International Influence
Domestic Influence
Electrolyser cost • Domestic – installation and maintenance • International – scale economies,
economies of manufacturing
Higher Lower
Generation and energy storage composition
• Domestic – efficient coordinated deployment (e.g. max capacity factor), lowest WACC, regulator environment
• International – scale economies, economies of manufacturing
Medium Medium
Transmission and distribution (feedstock / electricity)
• Domestic – regulatory models and renewable energy zones, construction O&M are domestic inputs
• International – equipment; incremental learning
Lower Higher

KPMG | 20
© 2020 KPMG, an Australian partnership and a member firm of the KPMG network of independent member firms affiliated with KPMG International Cooperative (“KPMG International”), a Swiss entity. All rights reserved. The KPMG name and logo are registered trademarks or trademarks of KPMG International. Liability limited by a scheme approved under Professional Standards Legislation.
Document Classification: KPMG Confidential
Hydrogen Success Factors
Disclosure regarding domestic and international influences
International Influence
Domestic Influence
Road/rail transport • Domestic – conversions of overseas equipment manufacturers
• International – Equipment; incremental learning
Medium Medium
Water availability • Domestic – Identifying grey and wastewater opportunities, including supportive regulation
• International – equipment efficiencies for desalination water treatment
Lower Higher
Liquefaction technology
Liquefaction involves both international technology and bespoke engineering
Higher Medium
Coordinated supply chain integration
• A challenge in creating a hydrogen industry is the need to contemporaneously establish supply and demand.
• This is largely a domestic market creation activity, due to the need to create expertise and know-how on a smaller domestic scale first before being able to tackle the larger export scale projects.
Lower Higher
Trade corridors and relationships
NSW existing energy trading relationships with energy importers, trade corridors (e.g. export, finance and insurance)
Lower Higher
Regulations A key barrier to new generation technologies is the absence of clear regulation, particularly on technical aspects. This covers a whole range of production, transport and use cases (e.g. network injection)
Lower Higher
Domestic H2 seed market
The ability to create comparative advantage by creating local markets, education learning to support export orientated opportunities
Lower Higher
Source: KPMG analysis based on available research.
3.3 Potential Opportunity Size Demand for hydrogen has been steadily increasing due to a number of policy and economic drivers including emissions reduction standards and manufacturers in highly cost-competitive global markets, such as steel, seeking cost-effective production inputs. Demand is expect to continue growing at an accelerated rate due to additional intra- and extra-market drivers such as international commitments to reduce greenhouse gas emissions, including the 2015 Paris Accord.70 Hydrogen is an example of a way to achieve the aim of reducing emissions, effectively providing a means to transport and store renewable energy, and there is therefore potential for a global hydrogen market to emerge. Furthermore, the cost of producing a hydrogen fuel cell has decreased by 60 per cent since 2006 and the cost is expected to fall by a further 30 per cent by 2025, making it increasingly competitive.71
There is significant opportunity for Australia to become a key market player in the production and export of hydrogen. Australia’s competitive advantages include its proximity to the Asian market, well-established trading relationships and experience in large-scale energy infrastructure construction.72 As
70 ACIL Allen Consulting, 2018, ‘Opportunities for Australia from Hydrogens Exports’.
71 The former COAG Energy Council, 2019, ‘Australia’s National Hydrogen Strategy’.
72 ACIL Allen Consulting, 2018, ‘Opportunities for Australia from Hydrogens Exports’.

KPMG | 21
© 2020 KPMG, an Australian partnership and a member firm of the KPMG network of independent member firms affiliated with KPMG International Cooperative (“KPMG International”), a Swiss entity. All rights reserved. The KPMG name and logo are registered trademarks or trademarks of KPMG International. Liability limited by a scheme approved under Professional Standards Legislation.
Document Classification: KPMG Confidential
outlined in the National Hydrogen Strategy, Australia aims to become one of the top three exporters of hydrogen to the Asian market.73
Increasing the production of hydrogen in Australia would result in the creation of thousands of new jobs, including many located in regional areas.74 The former COAG Energy Council has estimated that the hydrogen industry could generate approximately 7,600 jobs and $11 billion per year in additional GDP by 2050.75 According to model estimates made by ACIL Allen Consulting, the direct economic contribution of hydrogen production could range between $201-903 million in 2030.76 There is also potential for the economic contributions to be higher depending on the development of global markets.
73 The former COAG Energy Council, 2019, ‘Australia’s National Hydrogen Strategy’.
74 The former COAG Energy Council, 2019, ‘Australia’s National Hydrogen Strategy’.
75 The former COAG Energy Council, 2019, ‘Australia’s National Hydrogen Strategy’.
76 ACIL Allen Consulting, 2018, ‘Opportunities for Australia from Hydrogens Exports’.

KPMG | 22
© 2020 KPMG, an Australian partnership and a member firm of the KPMG network of independent member firms affiliated with KPMG International Cooperative (“KPMG International”), a Swiss entity. All rights reserved. The KPMG name and logo are registered trademarks or trademarks of KPMG International. Liability limited by a scheme approved under Professional Standards Legislation.
Document Classification: KPMG Confidential
4 Green Steel 4.1 Background The Australian and NSW steel markets are well developed, with production facilities in the Illawarra-Shoalhaven and Hunter Valley accounting for about 40 per cent of Australian steel production and approximately 30 per cent of market share of steel products.77 BlueScope is a flat steel producer which operates in 15 countries, including Australia. Its Australian operations include a steelmaking facility in Port Kembla (Illawarra-Shoalhaven), for example, approximately 2.6 million tonnes of crude steel is produced annually, at a market value of about $2 billion in sales, sold primarily in the Australian market, with some volume exported.78 Production in Port Kembla also directly employs 3,000 workers and an estimated 10,000 indirect jobs in the region (including suppliers and contractors who directly service the facility).79
Current steel production methods are highly energy and emissions intensive due to the very high temperatures required to reduce iron ore or liquefy pig iron or scrap metals and convert them into steel products. This, together with competition from steel imports, contribute to cost pressures within the industry.
There are two primary production methods used in commercial steel production from iron ore, namely:
• Blast furnace (BF)/Basic oxygen furnace (BOF), a method where:
– Iron Ore is heated in a BF with air (oxygen) and coke (producing the reducing agent CO) and limestone (flux) to produce molten pig iron (iron with a high carbon content) through a reduction reaction
– Subsequently molten pig iron and scrap steel is heated with oxygen in the BOF and is converted into liquid steel
– This method accounts for 70 per cent of global steel production; and
• Electric arc furnaces (EAFs):
– Process uses a high voltage electric current to melt metallic iron as well as scrap steel, through which oxygen is blown. Slag is formed on the surface of the molten steel using metal oxides, and subsequently coke is injected into the slag layer to form a foam from the oxidation of carbon and impurities. Depending on the final product, the molten steel, some slag and other elements are used.
– EAF can run purely on metal scrap but can also be coupled with a direct-reduced iron (DRI) stage where iron ore is mixed with natural gas (methane CH4) and undergoes direct reduction to produce metallic iron, this can be fed into the EAF with the scrap steel.80
– EAF processes account for 30 per cent of global production.81
77 Analysis of Australia’s steel manufacturing and fabricating markets: Report to the Commissioner of the Anti-Dumping Commission, Anti-Dumping
Commission (November 2017).
78 BlueScope Steel Annual Report 2018/2019, BlueScope Steel, 2020.
79 BlueScope in the Illawarra, About Us, BlueScope (accessed 6 July 2020).
80 Steel Production, American Iron and Steel Institute, accessed 13 August 2020, https://www.steel.org/steel-technology/steel-production
81 Keys, A., van Hout, M., and Daniëls, B., Decarbonisation options for the Dutch steel industry, PBL Netherlands Environmental Assessment Agency (25
November 2019).

KPMG | 23
© 2020 KPMG, an Australian partnership and a member firm of the KPMG network of independent member firms affiliated with KPMG International Cooperative (“KPMG International”), a Swiss entity. All rights reserved. The KPMG name and logo are registered trademarks or trademarks of KPMG International. Liability limited by a scheme approved under Professional Standards Legislation.
Document Classification: KPMG Confidential
• The rolling mills used to make the steel products also require heating in a reheat furnace which can be powered by natural gas.
The relative costs and economies of scale of BF/BOF and EAF methods are primarily driven by the production cost and technology improvement differences between the two methods. Both methods, however, are emissions intensive, where BF/BOFs burn coal or coke in blast furnaces and EAFs are large consumers of electricity primarily produced through fossil-fuel based generation.82 Green steel products, which substitute coal and coke with other materials such as waste car tyres, methane, biomass and hydrogen, as well as using firmed renewable electricity where possible provide a range of opportunities for manufacturers to reduce emissions from production.
Steel producers globally are seeking to increase efficiency during production and lower emissions. External market forces, particularly the introduction of carbon pricing mechanisms by European governments, have made steel manufacturers increasingly conscious of their emissions intensity in order to remain cost-competitive in those markets (see Section 4.2.1 for more discussion). In response to the above, as well as other competition factors such as input costs, steel manufacturers and researchers are investing in several pilot programs to advance green steel development, targeting uses of waste materials, natural gas, electricity and hydrogen as substitutes for coal and coke. Some examples of trials and projects include:
• UNSW and Arrium have partnered over a number of years to develop industrial scale testing for polymer injection technology using waste tyres and end of life polymers to replace coke in EAFs;83
• Swedish steel manufacturer, SSAB, which is leading HYBRIT, to design commercial scale hydrogen direct reduction plants;84
• Tata Steel has developed pilot programs in Europe for blast furnace technology to improve operating efficiency and significantly reduce emissions. There are plans to launch similar trials in India;85
• The world’s largest steelmaker, ArcelorMittal, which is planning to construct a demonstration plant in Germany capable of producing 100,000 tonnes of steel per year;86
• The German steelmaker Thyssenkrupp, one of the world’s largest steel manufacturers, who are developing a hydrogen steel demonstration plant; 87 and
• Swedish steel maker Ovako, who have successfully used hydrogen in their heating processes in its rolling mills to replace natural gas.88
Decarbonising steel production may be achieved through using greater renewable electricity to power EAFs or support the production of low-cost, low-emission hydrogen to be substituted into compatible BF/BOFs, or in DRI steps that can be coupled with EAF. Further, using low emissions hydrogen provides opportunities for iron ore exporting countries such as Australia to export DRI instead or in addition to iron ore, to be further processed into steel locally or in importing countries such as China, Japan and South Korea.89
While Australia accounts for a high share of global iron ore exports (53.7 per cent), its share of global iron and steel production is comparatively low.90 Harnessing hydrogen has the potential to enable the development of a domestic production chain that includes the final product, increasing value-add. NSW, with the prospect of developing a local hydrogen industry, may be able to take advantage of growing opportunities in DRI production and technology improvements enhancing the efficiency of renewable energy fuelled EAF steel plants.
82 Keys, A., van Hout, M., and Daniëls, B., Decarbonisation options for the Dutch steel industry, PBL Netherlands Environmental Assessment Agency (25
November 2019).
83 Wheel success: researcher teams with industry to turn tyres into steel, Australian Research Council (10 May 2013)
84 Low-emission steel production: decarbonising heavy density, Stockholm Environment Institute (April 2018).
85 Green steel: Tata Steel develops climate-friendly method of production, The Hindu Business Line (5, February 2020).
86 World first for steel: ArcelorMittal investigates the industrial use of pure hydrogen, ArcelorMittal (28 March 2019).
87 Steel breakthrough – Thyseenkrupp makes steel using hydrogen, AuManufacturing, (15 November 2019)
88 ‘World first’ as hydrogen used to power commercial steel production, Recharge (28 April 2020).
89 Gielen, D., Saygin, D., Taibi, E., and Birat, J., Renewables-based decarbonization and relocation of iron and steel making: A case study (6 March 2020).
90 Distribution of global iron ore exports in 2018, by major country, Statista (2020).

KPMG | 24
© 2020 KPMG, an Australian partnership and a member firm of the KPMG network of independent member firms affiliated with KPMG International Cooperative (“KPMG International”), a Swiss entity. All rights reserved. The KPMG name and logo are registered trademarks or trademarks of KPMG International. Liability limited by a scheme approved under Professional Standards Legislation.
Document Classification: KPMG Confidential
Industry transformation to utilise green hydrogen technology has the potential to underpin future industry growth and leverage competitive advantages. The Grattan Institute’s recent report, Start with Steel, also highlighted this opportunity, and the importance of building local skills and capability in low-emissions steel-making is a key enabler to a successful transition to green steel, best achieved through government funding to support a steel flagship project.91 The transition to green steel manufacturing can also be supported by low-cost intermediary feedstocks, such as using methane as a reducing agent which has a smaller carbon footprint compared to traditional steel manufacturing methods.
Table 11: Opportunity summary – Green steel in NSW
Consideration Observations Current NSW Maturity
Extent of current industry decarbonisation
In 2018, BlueScope announced a seven-year Power Purchase Agreement (PPA), whereby it would reduce emissions through solar energy.92 In 2019, Molycop also announced the signing of a long term PPA with Flow Power. Solar and wind energy will be sourced from farms in NSW and is expected to offset more than half of its electricity consumption in NSW.93
Readiness to leverage technology pathway(s)94
Hydrogen
Current steel production facilities in NSW are not fully compatible with hydrogen (including green hydrogen) technology and would likely require significant capital investment for commercial scale adoption.
Polymer injection technology
Molycop is working with UNSW to include plastic and waste, such as tyres, as a replacement for coke in electric arc furnaces through polymer injection technology. The technology has already demonstrated potential commercial viability.
Other medium-term opportunities95
A number of other opportunities available to the market, such as upgrading current BF/BOF production through hydrogen-rich reductants and separating and capturing CO2, can be used to reduce emissions from production as other decarbonisation technologies, such as hydrogen feedstocks, are developed and commercialised.
Sufficiency of existing industry infrastructure to leverage technology
Established NSW industry with large scale production and supporting rail and seaport infrastructure. Further study will be needed to determine the feasibility of retrofitting existing plants or developing greenfield plants that are hydrogen compatible.
Key NSW regions The Illawarra-Shoalhaven region hosts NSW’s largest steel producing plant at Port Kembla. As one of only two large steel plants in Australia, Port Kembla Steel
91 Wood, T, Dundas, G and Ha, J 2020, ‘Start with steel’. A practical plan to support carbon workers and cut emissions’, Grattan Institute.
92 BlueScope, 2018, ‘Media Release: BlueScope Underwrites Investment in 500,000 Panel Solar Farm’, https://s3-ap-southeast-
2.amazonaws.com/bluescope-corporate-umbraco-media/media/2418/bluescope-media-release-ppa-final.pdf.
93 Molycop, 2019, ‘Landmark Sustainable Power Purchase Agreement’, https://molycop.com/why-we-do-it/landmark-sustainable-power-purchase-
agreement/
94 A more expansive list of technologies is summarised in the roadmap presented in Section 10. These technologies are discussed in detailed in the body of
the report but may be considered for further assessment in future industry analyses.
95 These opportunities are not discussed in detailed in this report and may subject to further investigation in collaboration between the NSW Government
and the industry.

KPMG | 25
© 2020 KPMG, an Australian partnership and a member firm of the KPMG network of independent member firms affiliated with KPMG International Cooperative (“KPMG International”), a Swiss entity. All rights reserved. The KPMG name and logo are registered trademarks or trademarks of KPMG International. Liability limited by a scheme approved under Professional Standards Legislation.
Document Classification: KPMG Confidential
Consideration Observations Current NSW Maturity
works, operated by BlueScope Steel, is a major employer in the region and has integrated access to surrounding transport and logistics infrastructure such as key road freight routes and import-export terminals at Port Kembla. Liberty OneSteel operates steel making and product mills in Sydney and Newcastle. Like Port Kembla, these production sites have access to large transport infrastructure assets, including rail and Port Botany and the Port of Newcastle respectively. Molycop is in Waratah in Newcastle.
Timeframe for realisation
Short term consideration is required on a viable pathway to long term cost competitive green steel manufacturing Green hydrogen is not expected to be cost competitive relative to incumbent technologies over the short to medium term. However, there appear to be some immediate and acute cost and market pressures in the steel industry that may drive accelerated research and development. There may be short to medium term considerations required by government and industry to help ensure continued industry viability and sustainability, and a pathway to adoption of green technology over the requisite timeframe.
Maturity key
Low or limited level
Some greater levels of maturity, however, some barriers remaining and/or current scale limited
Greater overall level of maturity and scalability
4.2 Considerations for Opportunity Realisation
4.2.1 Cost Competitiveness The utilisation of hydrogen in green steel making has been identified as a solution through several pathways, both for iron oxide reduction and heating. There are various projections of the price of hydrogen and many factors that will impact its forward trajectory and cost competitiveness to other pathways. Further, it is acknowledged that there is significant uncertainty over its future trajectory. This will need to be a key consideration for governments in deciding how to accelerate the realisation of future opportunities.
4.2.1.1 Reaching price parity between green and black steel
The cost of producing green steel currently exceeds the cost of producing black steel (Figure 8). While the cost of producing green steel is expected to decrease over time, due to reductions in hydrogen electrolyser capital costs and electricity prices, there is still expected to be a cost gap between green steel and black steel extending to the early 2030s.

KPMG | 26
© 2020 KPMG, an Australian partnership and a member firm of the KPMG network of independent member firms affiliated with KPMG International Cooperative (“KPMG International”), a Swiss entity. All rights reserved. The KPMG name and logo are registered trademarks or trademarks of KPMG International. Liability limited by a scheme approved under Professional Standards Legislation.
Document Classification: KPMG Confidential
Figure 8: Projected costs associated with green steel against black steel, including sensitised cases and the inclusion of hypothetical carbon price ($ / tonne of steel) 96
However, only small changes in modelled assumptions could result in green steel reaching price parity by the early 2030. Efficiency improvements in electric arc technology; lower than expected hydrogen or electricity costs; or the introduction of carbon pricing for black steel could each independently result in price parity. For example, the application of a carbon price at or around expected EU ETS levels would result in price parity by the early 2030s.
The Grattan Institute (2020) estimated that at a cost of USD$1 per kilogram, green steel production would cost 25 per cent more than recent fossil fuel based production.97 However, estimates such as this do not take into account the cost-competitiveness implications of increased adoption of carbon pricing mechanisms around the world. A study by Gielen et al. (2020) indicated green hydrogen to be the least-cost option with a carbon price of around USD$67 per tonne of carbon dioxide.98 Estimates by the HYBRIT project (see Section 4.1) suggest hydrogen based DRI plants could be viable today with a carbon price of €44 to €67 per tonne.99 This is a similar figure to that found by Vogl, Åhman, and Nilsson (2018), who suggest greenfield DRI plants would be commercially viable with a carbon price of €52.100
Where parity between green steel and black steel is not achieved, customers would be required to pay a premium for zero carbon steel. Some industries have shown a willingness to purchase green steel including the automotive industry, where manufacturers such as Volkswagen or Toyota have the aim of eliminating carbon emissions completely from their value chains.101
96 Chart assumptions: Green steel production costs – Grattan Institute (2020), ‘Start with Steel’. Hydrogen production costs – CSIRO (2018), National
Hydrogen Roadmap. Wholesale electricity cost from $40 / MWh at 2020 down to $28 / MWh at 2050. Polymer electrolyte membrane electrolyser life of 10
years. Weighted average cost of capital is 4.21%. Sensitivities applied to electricity cost as well as projected capital cost of electrolysers. Brown steel production:
assumed cost of $800/tonne
BHP Base Case - A of US$24 / tonne of carbon has been included in the analysis. BHP Billiton. (2015). Climate Change: Portfolio Analysis. EU ETS Costs - FX
rate of 1.65. Annual growth rate is ~2.2% - the yellow curve below assumes that the carbon price grows by 2.2% every year up until 2030 and then stays
flat. Impacts from COVID19 have not been considered in the calculation.
97 Wood, T, Dundas, G and Ha, J 2020, ‘Start with Steel’. A practical plan to support carbon workers and cut emissions’, Grattan Institute.
98 Gielen, D., Saygin, D., Taibi, E., and Birat, J., Renewables-based decarbonization and relocation of iron and steel making: A case study (6 March 2020).
99 From mining to making: Australia’s future in zero-emissions metal, Energy Transition Hub.
100 Vogl, V., Åhman, M. and Nilsson, L.J., Assessment of hydrogen direct reduction for fossil-free steelmaking. Journal of cleaner production (2018).
101 McKinsey & Company, 2020, Decarbonisation challenge for steel.
700
900
1,100
1,300
1,500
1,700
2020
2021
2022
2023
2024
2025
2026
2027
2028
2029
2030
2031
2032
2033
2034
2035
2036
2037
2038
2039
2040
2041
2042
2043
2044
2045
2046
2047
2048
2049
2050
$/to
nn
e st
eel
Industry case cost of steel, comparing green and brown steel, $ / t Steel with sensitised cases
Sensitised green steel production cost high caseSensitised green steel production cost base caseSensitised green steel production cost low caseBrown steel production cost (assumption)Brown steel production cost including BHP central case (2030) carbon priceBrown steel production cost including EU ETS costs carbon price
*Sensitised cases are sensitivities only – not upper or lower bounds.

KPMG | 27
© 2020 KPMG, an Australian partnership and a member firm of the KPMG network of independent member firms affiliated with KPMG International Cooperative (“KPMG International”), a Swiss entity. All rights reserved. The KPMG name and logo are registered trademarks or trademarks of KPMG International. Liability limited by a scheme approved under Professional Standards Legislation.
Document Classification: KPMG Confidential
In the case of steel produced in Australia, where there is no carbon pricing mechanism, black steel products may face additional premiums or tariffs in export markets where carbon pricing mechanisms are in place. Australian steel exporters would need to appropriately recognise carbon accounting and accreditation standards. This is particularly true if our major steel export markets, Asia and the US, implement their own carbon pricing schemes and apply associated tariffs to imported products.
4.2.1.2 Cost-competitive hydrogen feedstock
Cost competitive hydrogen will also require low-cost renewable electricity generation as an input to the hydrogen fuel production process (see Section 3). The carbon price estimates above assumed renewable electricity prices of around $60/MWh. This price in NSW and Australia is also likely to be lower if renewable electricity generation assets are located in geographically strategic locations, bringing the price of wholesale renewable electricity to as low as $40/MWh by 2030, lowering downstream emissions abatement costs of green steel.102 103
The following chart illustrates the potential cost competitiveness of green steel manufacturing based on the central hydrogen cost case (and sensitised cases) outlined in Section 3. The example below represents the modelled economics of one of the hydrogen pathways for producing green steel. The below information is based on the Grattan Institute’s recent report Start with Steel, which referred to a process of direct reduction using hydrogen and smelting in an EAF.
Figure 9: Projected costs associated with green steel against the incumbent technology ($/tonne)
Source: Calculation from the H2City Tool, utilising underlying data and assumptions from CSIRO unless otherwise explicitly stated (Appendix C: Technical Information – Hydrogen Cost Modelling).
Note:
• The above projection of green steel production costs is primarily sourced from information in the Grattan Institute’s recent report, Start with Steel, with the cost of hydrogen production (as an input into the steel production process) based on the central hydrogen cost scenario as above. Further detail regarding these costs is provided below:
• The form of green steel production in relation to the above involves direct reduced of iron (DRI) using hydrogen, smelting in an electric arc furnace, and continuous casting to a semi-finished tradable product (slab or billet).
• Capital costs for a steel plant based in Eastern Australia, as per the Grattan report. As there was no learning curve assumption available in the Grattan report and given the size, scale and life of a steel plant, the capital costs were kept constant across the timeframe of the cost projection;
• Operating costs (excluding costs of hydrogen), consisting of operations, maintenance, iron, water and transport, as per the Grattan report; and
• The costs of production of hydrogen using PEM electrolysers, sourced from the H2C information as per the above Figure 9: Levelised cost of hydrogen production (at a wholesale electricity price of $40/MWh) of this document.
102 From mining to making: Australia’s future in zero-emissions metal, Energy Transition Hub.
103 Vogl, V., Åhman, M. and Nilsson, L.J., Assessment of hydrogen direct reduction for fossil-free steelmaking. Journal of cleaner production (2018).
0200400600800
10001200140016001800
2020
2021
2022
2023
2024
2025
2026
2027
2028
2029
2030
2031
2032
2033
2034
2035
2036
2037
2038
2039
2040
2041
2042
2043
2044
2045
2046
2047
2048
2049
2050
$ /
t st
eel
Industry Case Cost of Steel, comparing DRI to incumbent, $ / t Steel with sensitised cases
H2 Production Cost (Levelised) Steel Plant CAPEX (Levelised)
Steel Plant OPEX (Levelised) Coking coal steel production cost
Sensitised high case Sensitised low case
*Sensitised cases are sensitivities only – not upper or lower bounds.

KPMG | 28
© 2020 KPMG, an Australian partnership and a member firm of the KPMG network of independent member firms affiliated with KPMG International Cooperative (“KPMG International”), a Swiss entity. All rights reserved. The KPMG name and logo are registered trademarks or trademarks of KPMG International. Liability limited by a scheme approved under Professional Standards Legislation.
Document Classification: KPMG Confidential
• The sensitised high and low cases refer to changes in the assumptions to the central case, with respect to changes in the wholesale price of electricity and the projections in the capital cost of electrolysers. Details regarding these changes is outlined in Section 3.
• These sensitised cases reflect sensitivities only – they are not indicators of an upper bound or a lower bound of the factors i.e. the factors could vary to the extent that the cost of hydrogen production could be above the sensitised higher case or below the sensitised lower case.
• The amount of hydrogen required for green steel production is calculated based on conversion ratios sourced by the Grattan report (tonne of DRI per tonne of steel is 1.17, 72 kg of H2 per tonne of DRI).
• Further assumptions regarding the cost component regarding production of hydrogen are provided below in Appendix C.
Source: KPMG calculations as per H2C information utilising CSIRO data and assumptions.
4.2.2 Strengths and Competitive Advantages NSW has a long history of steel production, with well-established production facilities and a highly skilled workforce to support steel manufacturing. Steel products in NSW are made from both iron ore feedstock as well as through recycling scrap steel, depending on the facility. NSW has steel making facilities that utilise BF/BOF processes, and others deploying EAF to smelt scrap steel and iron to make new steel products.
• There is some potential to leverage existing industry infrastructure and skills. NSW has a well-established steel manufacturing industry and supporting skilled workforce. The steel industry in NSW is facing substantial challenges that are driven by oversupply in the global steel market, affecting the ability of steel manufacturers to compete with steel imports domestically and in the steel export market.104 To address these challenges, NSW can build on the foundations of the current industry, its supporting infrastructure, the research and development capability in a number of its universities, and the skills of its direct and downstream workforces to manufacture cost-competitive green steel. That said, there would be an anticipated need to invest in plant upgrades to be able to adopt this new technology (see Section 4.2.3 and Section 4.2.4 below).
• The capacity to store quantities of fuel can help to address intermittency of wind and solar required to produce green hydrogen. NSW’s abundant, but intermittent, wind and solar resources suited to making hydrogen-intensive commodities such as green steel, providing a competitive advantage for those green steel manufacturers choosing hydrogen in NSW over locations without similar levels of wind and solar resources. The capability to store quantities of hydrogen feedstock for short periods of time will enable steel plants to be flexible when intermittent renewable electricity generation impacts hydrogen production and keep their blast furnaces operational.
• It is expected that it will be more cost competitive to produce green steel in Australia than to ship hydrogen and iron ore to countries that have inferior renewable resources, due to the high costs related to shipping hydrogen. Shipping hydrogen is much more expensive than for coking coal, and shipping to Asian markets could double the cost of hydrogen relative to the cost of using it in Australia.105
• Australia is one of the most iron ore rich countries in the world, exporting minerals to high demand markets such as Asia. These deposits can be leveraged to develop local DRI production, and increased downstream steel processing, providing value-add opportunities where DRI and steel plants are located, generating employment and income opportunities.
• NSW already has local plants investing in approaches to produce green steel that don’t rely on hydrogen, but instead are moving toward sourcing renewable energy to power their heating processes, reducing waste in their production, and using other non-hydrogen replacements for coke.
4.2.3 Barriers The availability of abundant iron ore and renewable energy resources in Australia and NSW give a local green steel industry a competitive advantage over other prospective green steel producing countries.
104 Analysis of Australia’s steel manufacturing and fabricating markets: Report to the Commissioner of the Anti-Dumping Commission, Anti-Dumping
Commission (November 2017).
105 Wood, T, Dundas, G and Ha, J 2020, ‘Start with Steel’. A practical plan to support carbon workers and cut emissions’, Grattan Institute.

KPMG | 29
© 2020 KPMG, an Australian partnership and a member firm of the KPMG network of independent member firms affiliated with KPMG International Cooperative (“KPMG International”), a Swiss entity. All rights reserved. The KPMG name and logo are registered trademarks or trademarks of KPMG International. Liability limited by a scheme approved under Professional Standards Legislation.
Document Classification: KPMG Confidential
Despite these advantages, the transition to green steel manufacturing faces significant cost barriers, including:
• Oversupply in international markets, strong market competition, high costs of domestic transport and government interventions and market distortions in Australia and internationally are placing increasing pressure on steel manufacturers.106 107 There may be short to medium term considerations required by government and industry to help ensure continued industry viability and sustainability, and a pathway to adoption of green hydrogen and technology over the requisite timeframe.
• In addition to likely potential upgrades required to ensure the compatibility of existing manufacturing facilities, such as blast furnaces, or constructing DRI facilities to feed into existing EAF plants, there would likely need to be investment in new greenfield steel production capacity for the industry under a scenario where demand for NSW produced steel is greater than existing production capacity.108 This can create cost barriers to expanding production capacity in the future.
• The use of green hydrogen as a reduction feedstock has not yet been developed and used in on-going large-scale commercial operations, although several trials are underway around the world. Large scale adoption, particularly by locations in favourable positions to be first movers in the green steel industry, such as NSW, is unlikely to occur in the short or medium term. Therefore, consideration is required as to alternate potential pathways towards adoption of green hydrogen as a fuel source over the timeframe in which it is expected to become cost competitive.
• So other pathways for producing greener steel that are powered by renewable energy and use other non-hydrogen replacements for coke may be more prospective in the short term.
4.2.4 Infrastructure Requirements While there has been some success in terms of pilots and trials in the use of hydrogen to produce hydrogen-based green steel (particularly in Germany and Sweden), there are significant infrastructure requirements to facilitate a viable pathway at scale for the industry in NSW.
• Existing BF/BOFs, such as those used in BlueScope’s Port Kembla Steelworks in the Illawarra-Shoalhaven, would require new and retrofitted equipment to support hydrogen as a compatible fuel and reducing feedstock. This is critical for key parts of the production processes, such as the tuyeres, or nozzles, which normally feed coke and air into BFs. A report by McKinsey found that the cost of retrofitting may in some cases be greater than cost of greenfield green steel plants.109
• The development of new production plants located in other parts of NSW, as opposed or in addition to the existing steelworks in Port Kembla or Newcastle, will need to consider further infrastructure requirements such as access to land, major roads, rail and sea ports to take in production inputs and send intermediate and final products to domestic and export markets for further refinement and sale. Further infrastructure will be required to ensure sufficient supply of water to plants for the purposes of cooling, to protect equipment, and improving conditions for onsite workers.
• Hydrogen fuel transportation infrastructure, such as pipelines from hydrogen production facilities, will need to be constructed to support the transport of large quantities of hydrogen into green steel plants. As discussed in section 3.2.2, hydrogen can be blended into some parts of the existing natural gas network, however effective transportation through a pipeline network will require pipelines to possess specialised membranes to separate hydrogen from other gases, at points of consumption if pure hydrogen is required. However, a possible solution could be the development of a DRI facility, coupled with an EAF plant, that utilises methane that is doped with hydrogen, this could possibly lend itself to having the ratio of hydrogen to methane increased in the DRI up to a point.
106 Analysis of Australia’s steel manufacturing and fabricating markets: Report to the Commissioner of the Anti-Dumping Commission, Anti-Dumping
Commission (November 2017).
107 From mining to making: Australia’s future in zero-emissions metal, Energy Transition Hub.
108 From mining to making: Australia’s future in zero-emissions metal, Energy Transition Hub.
109 Path to hydrogen competitiveness, A cost perspective, Hydrogen Council (20 January 2020).

KPMG | 30
© 2020 KPMG, an Australian partnership and a member firm of the KPMG network of independent member firms affiliated with KPMG International Cooperative (“KPMG International”), a Swiss entity. All rights reserved. The KPMG name and logo are registered trademarks or trademarks of KPMG International. Liability limited by a scheme approved under Professional Standards Legislation.
Document Classification: KPMG Confidential
An important part of reducing the cost of hydrogen as an input is reducing fuel transportation, as current transportation methods require intensive energy consumption and specialised fuel carriers, increasing fuel costs for end users. Hydrogen production facilities should be placed near areas of industry agglomeration, such as near steel plants, to minimise fuel transport related costs.
Additionally, the production of hydrogen, and subsequent use during green steel manufacturing, requires further investment in the provision renewable energy generation and transmission, although it is noteworthy that some NSW steel producers have already signalled an intention to source renewable energy to power their non-hydrogen EAF processes. Further investment in electricity transmission infrastructure will be required to link hydrogen plants with renewable energy generation assets, such as proposed utility scale assets to be constructed in REZs across NSW. The provision of reliable and stable renewable energy supply will place downward pressure on hydrogen fuel production costs. This, alongside other external factors such as carbon pricing mechanisms, may provide a potential pathway to accelerated research, development and uptake of cost-competitive hydrogen-based steel production at an accelerated rate to what has already been forecast in this report.

KPMG | 31
© 2020 KPMG, an Australian partnership and a member firm of the KPMG network of independent member firms affiliated with KPMG International Cooperative (“KPMG International”), a Swiss entity. All rights reserved. The KPMG name and logo are registered trademarks or trademarks of KPMG International. Liability limited by a scheme approved under Professional Standards Legislation.
Document Classification: KPMG Confidential
4.3 Potential Opportunity Size Industry opportunity may be achieved through retrofitting of current production facilities or establishment of greenfield developments. Through such opportunities, to the extent that the industry can increase its cost efficiency and/or output to capture additional market share, there may be additional economic benefits realisable. All else equal, every percentage point increase in industry output achievable relative to current operations could deliver an additional $20 million in annual revenues and up to $4.9 million in annual direct and indirect wages in today’s dollars.110 Additional economic benefits may also be realised as international policy and market settings change allowing additional green premiums to be gained in markets with carbon mechanisms or by consumers demanding green steel.
110 Estimated based on current industry revenue and estimated earnings. For direct employees, earnings were estimated based on an assumed average
full-time wage of $1,750 per week, and assuming workers are all full-time, equivalent to $293 million per year. At an assumed identical average wage of
$1,750, and an average 0.2 to 0.5 FTE, the estimated value of earnings for indirect employees could be up to $489 million per annum. The average full-time
wage in steel and aluminium smelting was derived by the Grattan Institute based on analysis of the ABS Census (2017); see Wood, T, Dundas, G and Ha, J
2020, ‘Start with Steel’. A practical plan to support carbon workers and cut emissions’, Grattan Institute.

KPMG | 32
© 2020 KPMG, an Australian partnership and a member firm of the KPMG network of independent member firms affiliated with KPMG International Cooperative (“KPMG International”), a Swiss entity. All rights reserved. The KPMG name and logo are registered trademarks or trademarks of KPMG International. Liability limited by a scheme approved under Professional Standards Legislation.
Document Classification: KPMG Confidential
5 Green Aluminium 5.1 Background After steel, aluminium is the second largest metal market in the world, worth an estimated USD$56 billion.111 In 2018, Australia’s four smelters produced 1.6 million tonnes of aluminium, of which 1.45 million tonnes was exported.112 Aluminium exports are worth approximately 0.2 per cent of GDP.113 Australia is one of the world’s most emissions-intensive aluminium producers, with aluminium smelting accounting for about 10 per cent of Australia’s electricity usage and creates 6.5 per cent of total carbon emissions.114115
Aluminium production is energy-intensive, having one of the highest embodied emissions of the mass-market metals, at an average of 11.5 tonnes of carbon dioxide per tonne of aluminium. Almost 70 per cent of emissions come from electricity generation and smelting process and about 21 per cent from the degradation of carbon anodes during the electrolysis process.116 The high level of energy-intensity can mean some smelters’ electricity usage accounts for up to one-third of total production costs, with the cost of alumina feedstock comprising approximately another third and other operating costs the balance.117118
5.1.1 Current Industry Outlook NSW has one aluminium smelter in the Hunter Valley. The smelter produces approximately 580,000 tonnes of aluminium annually (or 25 per cent of Australia’s primary aluminium), of which 90 per cent is exported.119 The NSW smelter consumes 12 per cent of NSW electricity production and contributes $1.5 billion annually (0.24 per cent of GSP) to the NSW economy.120 121 The smelter’s current workforce consists of 950 FTE staff and 190 contractors.122
Current and future uncertainties are contributing to growing pressures on the continued viability of aluminium production in NSW and further afield. The growth in pressure on the industry is driven by:
• High electricity and transport costs;
• Volatility in demand and supply in domestic and international markets;123 and
111 From mining to making: Australia’s future in zero-emissions metal, Energy Transition Hub.
112 Australian Aluminium, Australian Aluminium Council Ltd.
113 Calculated using approximately A$4.3bn of exports (Australian Aluminium Council 2018), A$1.86tn GDP (IMF World Economic Outlook Database 2019).
114 Calculated using smelter operators’ published usage as a percentage of total Australian electricity consumption. IEEFA. Why aluminium smelters are a
critical component in Australian decarbonisation.
115 AFR. Generators call for notice as smelters teeter on the brink. 18 October 2019. Pacific Aluminium reported an EBITDA loss of $US22 million in 2019.
116 From mining to making: Australia’s future in zero-emissions metal, Energy Transition Hub.
117 According to the head of Rio Tinto Aluminium, Alf Barrios – Reuters. Rio Tinto Flags Higher Costs, Cloudy Australian Aluminium Future. 31 October
2019.
118 From mining to making: Australia’s future in zero-emissions metal, Energy Transition Hub.
119 NSW Chief Scientist and Engineer 2020, ‘NSW Decarbonisation Innovation Study Scoping Paper’, NSW Government, NSW.
120 NSW Chief Scientist and Engineer 2020, ‘NSW Decarbonisation Innovation Study Scoping Paper’, NSW Government, NSW.
121 Tomago Aluminium, Our Story.
122 Tomago Aluminium, Our Story.
123 Australian Mining, ‘Oversupply, high costs pressure Alcoa’s future smelting business’, 15 May 2020.

KPMG | 33
© 2020 KPMG, an Australian partnership and a member firm of the KPMG network of independent member firms affiliated with KPMG International Cooperative (“KPMG International”), a Swiss entity. All rights reserved. The KPMG name and logo are registered trademarks or trademarks of KPMG International. Liability limited by a scheme approved under Professional Standards Legislation.
Document Classification: KPMG Confidential
• Changes in policy settings in key export markets, particularly China.124
These pressures, together with recent events and current industry guidance, suggest there is a risk of local industry closure without substantial reductions in the cost of electricity and confidence in market conditions. Increasing the level of certainty of stable and low-cost electricity is suggested as a necessary (but not sufficient) pre-condition to increasing the industry’s confidence in the future outlook to make decisions around the medium to long term pathway.
5.1.2 Considerations for Industry Decarbonisation Decarbonisation, via a transition to a clean electricity system, has the potential to provide reliable, low-cost electricity that may be able to reduce uncertainty for smelters around the supply and cost of electricity and, therefore, limit the contribution of these issues to on-going cost pressures and the risk of closing smelters.125 For example, smelters with access to hydropower, such as the Bell Ray smelter in Tasmania, are able to reduce their emissions by around 70 per cent due to a lower reliance on coal-fired electricity.126 Cost-competitive hydro-powered smelters are also found in Canada, Russia, Norway and Iceland.
Importantly, investment in enhanced renewable energy generation to provide reliable, low-cost electricity will also need to be supported by sufficient electricity storage capacity in NSW to enable smelters to remain operation 24 hours a day or during periods where renewable generation capacity is low. Storage technologies, such as utility scale batteries and pumped hydro provide storage options. However, it is important to note that while it is expected that the price of electricity will fall with the development of low-cost renewable generation, there remains some uncertainty about the size of this fall, and therefore some uncertainty about the impact renewable generation will have on the on-going viability of aluminium smelting in NSW. Aluminium smelters are more likely to enter into power purchase agreements (PPA) with energy generators and are less likely to be exposed to fluctuating electricity spot prices in the short to medium term.
A smaller, but still significant emissions reduction benefit can also be gained from deploying different anodes in the process. New inert anode technologies being trialled internationally to reduce emissions and improve operating efficiency have the potential to be commercially deployable in the mid-2020s and may be able to be retrofitted to existing smelters in the future.127 Adopting these technologies has the potential to increase NSW and Australia’s competitive advantage as traders and manufacturers become increasingly conscious of the environmental impact of production inputs such as aluminium. This is already apparent in examples such as the London Metal Exchange seeking to provide a trading platform to source low-carbon aluminium.128
Accounting for the electricity generation and production technology considerations discussed above, has the potential to lower electricity costs and the emissions-intensity of production, improving long term industry competitiveness to maintain output and respond to increased aluminium demand from areas such as:
• Transportation: The transition to electric vehicles will increase demand for aluminium as car makers look to lighter materials to compensate for the weight of batteries.
• Construction: Ongoing long-term growth in China and developing markets is expected to underpin demand for aluminium
• Consumer durables, especially electronics: Companies are becoming increasingly focused on reducing carbon emissions in supply chains, increasing demand for low-carbon materials across the consumer durables sector.
124 Australian Government Department of Industry, Science, Energy and Resources, ‘Resources and Energy Quarterly December 2017: Aluminium, alumina
and bauxite’, 2017.
125 Gautam, M., Pandey, B., Agrawal, M., Carbon Footprint of Aluminium Production: Emissions and Mitigation, Environmental Carbon Footprints (2018).
126 From mining to making: Australia’s future in zero-emissions metal, Energy Transition Hub.
127 NSW Chief Scientist and Engineer 2020, ‘NSW Decarbonisation Innovation Study Scoping Paper’, NSW Government, NSW.
128 Financial Times, London Metal Exchange plans ‘low-carbon’ aluminium trading (4 June 2020).

KPMG | 34
© 2020 KPMG, an Australian partnership and a member firm of the KPMG network of independent member firms affiliated with KPMG International Cooperative (“KPMG International”), a Swiss entity. All rights reserved. The KPMG name and logo are registered trademarks or trademarks of KPMG International. Liability limited by a scheme approved under Professional Standards Legislation.
Document Classification: KPMG Confidential
Table 12: Opportunity summary – Green aluminium in NSW
Consideration Observations Current NSW Maturity
Extent of current industry decarbonisation
The Australian aluminium industry has been steadily reducing emissions output of a number of gases including greenhouse gases, perfluorocarbons and fluoride. Some opportunities exist in using renewable electricity and adoption of efficient technologies to further reduce emissions; however, these require further investment and development to ensure financial viability.
Readiness to leverage technology pathway(s)
While aluminium manufacturing is fully compatible with renewable electricity generation and storage, these sources are not currently able to support the production of low-emissions aluminium. This is due to the current cost barriers of utility scale energy storage solutions, such as utility scale batteries or pumped hydro, as well as limitations in existing energy storage capacity in the short- and medium term- to ensure aluminium plants are able to remain operational at night or when renewable generation capacity is low. Hydrogen is not directly compatible for use in aluminium production. It may have uses in producing electricity, however this is seen as less economically viable.
Sufficiency of existing industry infrastructure to leverage technology
Established NSW industry with large scale production and supporting rail and seaport infrastructure. Further development of renewable electricity generation, transmission and storage capacity is required to enable low-emission production.
Key NSW regions NSW’s only smelter is located in the Hunter Valley and is a key employer in the local area. The plant has access to electricity transmission, as well as road and rail transport links including to the Port of Newcastle to bring in production inputs and export aluminium to domestic and international markets.
Timeframe for realisation
Short term consideration is required in terms of engaging with industry in respect of the confidence and certainty of future industry outlook. In respect of future green aluminium, necessary pre-conditions of any future opportunities will require cheaper electricity, reliability of renewable electricity generation, and firming and dispatchability in the grid. The NSW smelter is currently unable to rely on renewable electricity generation to supports its operation, owing to the relative inflexibility of the smelters to power-off for extended period. Intermittent renewable energy sources in NSW, such as wind and solar, will need to be supported by the development of green energy storage and dispatch solutions. Time frames for other efficiency improvements and emissions reduction, such as the use of inert anode technology, are likely to extend over the medium to long term. There may be short- to medium-term considerations required by government and industry to help ensure continued industry viability and sustainability, and a pathway to adoption of green technology over the requisite timeframe.
Maturity key

KPMG | 35
© 2020 KPMG, an Australian partnership and a member firm of the KPMG network of independent member firms affiliated with KPMG International Cooperative (“KPMG International”), a Swiss entity. All rights reserved. The KPMG name and logo are registered trademarks or trademarks of KPMG International. Liability limited by a scheme approved under Professional Standards Legislation.
Document Classification: KPMG Confidential
Low or limited level
Some greater levels of maturity, however, some barriers remaining and/or current scale limited
Greater overall level of maturity and scalability
5.2 Considerations for Opportunity Realisation
5.2.1 Cost Competitiveness The price of aluminium is set globally on the London Metal Exchange, therefore changes or increases in electricity prices cannot be passed onto customers and must be borne by manufacturers. High electricity prices in Australia or NSW undermine the price competitiveness of Australian manufacturers.
NSW’s only smelter is the largest of Australia’s four aluminium smelters. It produced 595,000 tonnes of aluminium in 2018-19 (about 25 per cent of Australia’s production). Information published by the smelter operator suggests that to be internationally competitive, electricity pricing for the smelter needs to target A$40-50/MWh.129 For green aluminium produced in NSW to be competitive in international markets, firmed renewables would need to provide electricity at a price that is within this cost competitive range and is not susceptible to large fluctuations or undersupply in electricity generation.130 Green aluminium on the market may also benefit from price premiums as demand for low-emissions aluminium grows.
5.2.2 Strengths and Competitive Advantages With an established aluminium smelting industry, skilled workforce and supporting infrastructure, NSW would be well-placed to leverage existing industry capability to transition to green aluminium subject to its level of cost competitiveness.
• NSW has large renewable resources, such as wind and solar. NSW’s abundant, but intermittent, wind and solar resources provide opportunities for the aluminium industry to harness renewable electricity generation as a production input, with low cost pumped hydro used to firm the intermittent electricity of wind and solar.
• The abundance of renewable energy gives NSW a significant advantage in renewable electricity generation capacity. In addition to pumped hydro, solar and wind energy generating assets could be linked with other utility scale storage assets, such as batteries and biomass depots working to guarantee the 24-hour electricity supply necessary to operate aluminium smelters (further discussion of storage solutions is in Section 5.2.4). It is currently not cost competitive to produce green aluminium in NSW, however, manufacturing costs are expected to fall as renewable electricity becomes more cost competitive and technology improvement, such as the use of inert anodes to increase efficiency.
• Australia has one of the largest bauxite reserves in the world. Much of the bauxite extracted in Australia is exported as a key input to aluminium production in larger aluminium smelting countries such as China, India and Russia.131 Australia is also the second largest manufacturer of alumina, the key raw material for aluminium smelting.132 Domestically sourced bauxite and alumina, particularly from Queensland and Western Australia, can support future growth in cost competitive green aluminium industry in NSW.
• Technology advancements, such as the use of inert anodes in aluminium production, have the potential to reduce operating costs in the future. Inert anodes do not participate in reactions during electrolysis and avoid the formation of carbon dioxide and other perfluorocarbons,
129 AFR. Tomago counts cost of energy transition (7 February 2020).
130 ANFRE. Global smelters’ production costs on decline (October 2019).
131 Bauxite, Geoscience Australia.
132 From mining to making: Australia’s future in zero-emissions metal, Energy Transition Hub.

KPMG | 36
© 2020 KPMG, an Australian partnership and a member firm of the KPMG network of independent member firms affiliated with KPMG International Cooperative (“KPMG International”), a Swiss entity. All rights reserved. The KPMG name and logo are registered trademarks or trademarks of KPMG International. Liability limited by a scheme approved under Professional Standards Legislation.
Document Classification: KPMG Confidential
producing only oxygen as a by-product. However, this technology is still in development with trials underway in Canada and the US and it is likely to be commercially available in the medium term.133
• There is significant growing demand for low-carbon aluminium as a production input. Demand is expected to be driven by electric vehicle manufacturers, the construction sector and producers of consumer durables, especially electronics manufacturers.134
5.2.3 Barriers A number of factors are resulting in material cost pressures on aluminium production in NSW and Australia more broadly:
• High production costs driven particularly by increasing costs of electricity and transportation costs;
• Volatility in demand and supply of aluminium on the international market. Oversupply and drops in demand triggered by extra-market factors such as COVID-19 are forcing smelters to review their production. For example, Alcoa, which has loss-making operations in Australia, has revised its annual shipments outlook for 2020 from 3–3.1 million tonnes down to 2.9–3 million tonnes.135
• Changes of policy settings in export markets such as the use of carbon mechanisms that may place additional price premiums on Australian produced aluminium.
Moving to respond to above pressures also carries significant risks for manufacturers due to the high costs associated with winding down production capacity as well as even greater costs in bringing capacity back to pre-reduction levels. In addition to the existing challenges in the current operating environment, a number of other cost and technology challenges remain:
• Some of the key barriers to transitioning to low emissions electricity sources, such as intermittent wind and solar, are stability in the energy supply and the high costs presently associated with electricity firming and the development of dispatchable renewable electricity options.
• Current smelting processes are continuous in nature since aluminium requires constant energy supply, meaning operations cannot temporary shutdown for more than about 30-40 minutes per potline. Significant consequences for product quality and the structural integrity of smelting machinery, such as potlines, can arise in the event energy is lost due to fluctuations in electricity supply. Australian smelters have raised concerns over the potential high level of capital reinvestment required to repair or replace potlines that have ‘frozen’ over during prolonged outages, threatening the ongoing viability of production.136 For example, a power outage in the Portland smelter in Victoria caused molten aluminium to solidify resulting in production being reduced to a third of capacity and requiring a $240 million rescue package to resume full production.137 Flexible potline technology, which is in development, may be able to overcome issues with continual energy supply, caused by intermittent electricity generation for example. This would be achieved by using adjustable heat exchangers that can maintain the energy balance in each electrolysis cell, maintaining heat balance under a wide range of operating conditions.138
• The operation of inert anode cells in aluminium production faces significant challenges to achieving commercial viability. While the use of this technology has a number of cost and emissions related benefits, it will require further improvement in both process efficiency and product quality. Substantial development progress has been made recently and will require further research and development to reach a commercially viable state.139
This is an intersection of generation, transmission and storage infrastructure requirements necessary to enable decarbonisation across the state’s electricity generating assets and to allow the aluminium smelter in the Hunter Valley as the largest consumer of electricity in the state, to access reliable and stable low-emissions electricity to support its operations. The development of effective renewable
133 Inert anode technology for aluminium smelters, Climate Technology Centre & Network.
134 IEEFA. Why aluminium smelters are a critical component in Australian decarbonisation.
135 Australian Mining, ‘Oversupply, high costs pressure Alcoa’s future smelting business’, 15 May 2020.
136 Tomago Aluminium is preparing for more power shutdowns this summer, Newcastle Herald (13 September 2017).
137 High electricity prices are driving Australia’s aluminium industry out of business, Aluminium Insider (22 March 2017)
138 Why Trimet Aluminium is betting on EnPot’s virtual battery, Aluminium Insider (25 October 2017).
139 Inert anode technology for aluminium smelters, Climate Technology Centre & Network.

KPMG | 37
© 2020 KPMG, an Australian partnership and a member firm of the KPMG network of independent member firms affiliated with KPMG International Cooperative (“KPMG International”), a Swiss entity. All rights reserved. The KPMG name and logo are registered trademarks or trademarks of KPMG International. Liability limited by a scheme approved under Professional Standards Legislation.
Document Classification: KPMG Confidential
electricity generation capability in NSW will also play a role in terms of long-term fixed price electricity contracts entered into between the smelter and electricity providers, having implications on the smelter’s productive capacity and its ability to retain or expand operations.
5.2.4 Infrastructure Requirements The viability of aluminium smelters in NSW is heavily dependent on affordable, reliable and stable electricity supply. In order to decarbonise aluminium smelting operations in the state, much of the capital investment needs to be focused on generating, transmitting and storing cost competitive renewable energy from sources such as pumped hydro, solar and wind. Specifically, investment needs to ensure:
• Sufficient renewable energy generation capacity is installed in geographically strategic locations;
• Sufficient transmission capability for renewable electricity to be distributed to where it is needed;
• Integration of storage assets and other capabilities to support a more complex ecosystem of utility and distributed generation assets and strengthen demand response measures. These solutions include the use of batteries, pumped hydro, and biomass, biogas and molten salt, however the cost and practicality of using some of these solutions with production requirements varies;140 and
• Development of advanced control systems and the use of supporting technologies such as artificial intelligence to manage the interaction of diversified utility and distributed generation, transmission and storage assets.141
5.3 Potential Opportunity Size The aluminium industry in Australia directly employs around 14,500 people with the sole aluminium smelter in NSW directly employing around 950 full-time equivalent workers. Through such opportunities, to the extent that the industry can increase its cost efficiency and/or output to capture additional market share, there may be additional economic benefits realisable. All else equal, every one per cent increase in industry output and/or avoided industry decline achievable relative to current operations could deliver an additional $50 million in annual revenues nationally and around $14.2 million in annual direct wages in today’s dollars.142
140 Comparison of Dispatchable Renewable Electricity Option: Technologies for an Orderly Transition, ITP (2018).
141 IEEFA. Why aluminium smelters are a critical component in Australian decarbonisation.
142 Based on industry revenue of $5 billion (IBISWorld, Aluminium Smelting in Australia - Market Research Report, October 2019,
https://www.ibisworld.com/au/industry/aluminium-smelting/227/, accessed 4 August 2020) and on an equivalent increase in workforce with a full-time
workforce earning $1,750 per week in June 2016 dollars, converted to March 2020 dollars (typical full-time wage in steel and aluminium smelting, derived by
the Grattan Institute based on analysis of the ABS Census (2017); see Wood, T, Dundas, G and Ha, J 2020, ‘Start with Steel’. A practical plan to support
carbon workers and cut emissions’, Grattan Institute). Earnings converted into March 2020 dollars (ABS Consumer Price Index, March 2020, released 29
April 2020).

KPMG | 38
© 2020 KPMG, an Australian partnership and a member firm of the KPMG network of independent member firms affiliated with KPMG International Cooperative (“KPMG International”), a Swiss entity. All rights reserved. The KPMG name and logo are registered trademarks or trademarks of KPMG International. Liability limited by a scheme approved under Professional Standards Legislation.
Document Classification: KPMG Confidential
6 Green Ammonia 6.1 Background Ammonia has several applications, including in fertiliser for agricultural production and to produce plastics, textiles and in other chemical manufacturing processes. One key method of production is to combine hydrogen with nitrogen extracted from the air at very high temperatures using the Haber-Bosch method. Ammonia manufacturing is the world’s third largest industrial emitter for carbon dioxide, accounting for approximately 1.8 per cent of global carbon dioxide emissions.143
Globally, approximately 144 million tonnes of ammonia were produced in 2018. In the same year Australia produced approximately 1.3 million tonnes of ammonia, of which NSW produced 360,000 metric tonnes through a production plant in the Hunter Valley.144 The plant employs around 210 FTE and several contractors, contributing approximately $15 million in annual earnings to the workforce.145
In 2018, global trade in ammonia totalled USD$7.4 billion, with Australia as a net exporter of ammonia, exporting a total of USD$84.1 million (AUD$115.9 million in today’s dollars), or 1.13 per cent of total global exports.146 Australia’s share has steadily reduced from a high of just under 3.5 per cent (USD$376 million or AUD$438.8 million in today’s dollars) of global exports in 2013.147 148 In addition to exports, ammonia is also a key input to domestic industries, in particular agriculture – a growing export industry with a competitive advantage and valued at $13.3 billion, or 2.1 per cent of NSW GSP, in 2019. Ammonia is also a feedstock for nylon resins and fibres, acrylic fibres used variously in appliances, carpets, film, coating and apparel, automotive manufacturing, while ammonium phosphate is used in animal feed.149 Ammonia is also potentially viable as a fuel in some heavy transport applications such as shipping.
In 2018-19, the gross-value of NSW agricultural production was approximately 20 per cent of total Australian agricultural output, with NSW grain growers and vegetable growers contributing 25 and 23 per cent of total Australian output in their respective industries.150 Agricultural production in NSW is one of the largest ammonia consumers in Australia, collectively using more than 24,000 tonnes of anhydrous ammonia, almost 300,000 tonnes of ammonium phosphates, more 33,000 tonnes of ammonium sulphate and more than 15 million litres of urea.151 152
143 Ammonia: Zero-carbon fertiliser, fuel and energy store, The Royal Society (19 February 2020).
144 Mineral Commodity Summaries 2020, U.S. Geological Survey, released January 2020.
145 Typical full-time wage earnings are based on the manufacturing industry average in 2019 (ABS, Average Weekly Earnings, Australia, Nov 2019 (20
February 2020)). Earnings converted into March 2020 dollars (ABS Consumer Price Index, March 2020, released 29 April 2020). Estimates for total annual
earnings by full time ammonia workers are likely to be an underestimate.
146 Dollar conversions are based on the average closing price of the Australian dollar in US dollar terms in foreign exchange markets in 2018. Source:
Australian – US Dollar Exchange Rate (AUD USD) – Historical Chart, Macrotrends.
147 Ammonia, The Observatory of Economic Complexity.
148 Dollar conversions are based on the average closing price of the Australian dollar in US dollar terms in foreign exchange markets in 2018. Source:
Australian – US Dollar Exchange Rate (AUD USD) – Historical Chart, Macrotrends.
149 Chemical Industry Economic Contribution Analysis, ACIL Allen Consulting (August 2019).
150 About my region – New South Wales, Australian Government Department of Agriculture, Water and Environment.
151 Land Management and Farming Australia, 2016-17, ABS (26 June 2018).
152 Conventional SMR ammonia production, produces carbon dioxide as by-product, which is then captured and used in the production of urea, a form of
fertiliser using in agriculture. Replacing SMR with green hydrogen will eliminate this by-product, meaning alternative sources of carbon dioxide for the
production of urea will need be sourced.

KPMG | 39
© 2020 KPMG, an Australian partnership and a member firm of the KPMG network of independent member firms affiliated with KPMG International Cooperative (“KPMG International”), a Swiss entity. All rights reserved. The KPMG name and logo are registered trademarks or trademarks of KPMG International. Liability limited by a scheme approved under Professional Standards Legislation.
Document Classification: KPMG Confidential
An estimated 67 per cent of the world’s ammonia is produced using hydrogen.153 In Australia, almost three-quarters, or more than 350,000 tonnes, of annual hydrogen produced is used for ammonia production.154 Hydrogen as a component to produce conventional ammonia is undertaken using the steam methane reforming (SMR) method. The hydrogen used in this process is currently made using natural gas (methane) without CCS, leading to relatively high emissions. Some of the carbon dioxide produced through the SMR process is captured and used to produce urea, which is used in fertilisers.
The current process produces emissions via two channels; the use of natural gas, normally methane, during SMR-based hydrogen production, and methane to produce the energy used to create the pressure and temperature conditions required to react hydrogen and nitrogen together. ‘Green ammonia’ is where the process does not produce emissions and requires the use of renewable electricity and water to produce green hydrogen and capturing the CO2 produced from combusting the methane used in powering the chemical reaction of hydrogen and nitrogen. Producing green hydrogen is the most likely short-term option to reduce carbon emissions for ammonia production.
Global ammonia capacity is expected to increase four percent by 2024, with demand for ammonia in domestic and international markets expected to continue growing strongly, increasing by 65 per cent by 2050.155 Drivers of growth are expected to include strong demand from agricultural sectors, however, demand for ammonia as a carrier molecule for hydrogen is also expected to grow as the use of hydrogen, particularly green hydrogen, increases. As demand grows, and as industries transition to clean energy, there is a potential opportunity to enhance the competitiveness and productive capacity of a NSW green ammonia industry to meet growing demand.
Table 13: Opportunity summary – Green ammonia in NSW
Consideration Observations Current NSW Maturity
Extent of current industry decarbonisation
The ammonia reduction industry in NSW employs abatement technologies, such as nitrous oxide abatement technology, and efficiency maximising production processes to reduce greenhouse emissions produced during manufacturing. However, the industry remains emissions intensive through the use of fossil-fuel based feedstocks and energy inputs.
Readiness to leverage technology pathway(s)
SMR
Currently, most ammonia production facilities rely on the steam reformation of fossil fuels, particularly natural gas to produce hydrogen and carbon dioxide.
CCS
CCS technology is well established and available for use by ammonia producers in NSW. The technology is currently used across a number of plants. However, there are costs associated with the installation and maintenance of CCS abatement technologies.
Renewable generation
Ammonia production plants in NSW use electricity directly in the production process as well as indirectly
Green Hydrogen (PEM)
Currently, there is limited maturity in the production of hydrogen using PEM technologies and further utility scale
153 Opportunities for Australian from Hydrogen Exports, ACIL Allen Consulting (August 2018).
154 The former COAG Energy Council, ‘Australia’s National Hydrogen Strategy’.
155 Mineral Commodity Summaries 2020, U.S. Geological Survey, released January 2020.

KPMG | 40
© 2020 KPMG, an Australian partnership and a member firm of the KPMG network of independent member firms affiliated with KPMG International Cooperative (“KPMG International”), a Swiss entity. All rights reserved. The KPMG name and logo are registered trademarks or trademarks of KPMG International. Liability limited by a scheme approved under Professional Standards Legislation.
Document Classification: KPMG Confidential
Consideration Observations Current NSW Maturity
electrification using renewable energy generation sources is required.
Sufficiency of existing industry infrastructure to leverage technology
SMR
As aforementioned, SMR is the primary method used in the production of ammonia and is currently being used in NSW to expand existing production output out of the Hunter Valley.
CCS
CCS is readily available and compatible with existing production processes. However, it is important to note that CCS has a limited ability to eliminate fossil-fuel based emissions from production, necessitating the use of other complimentary technologies to eliminate emissions.
Renewable generation
Total electricity generation, whether for direct use, or for the production of hydrogen, will need to grow significantly and be primarily produced using renewable or low emissions energy sources.
Green Hydrogen (PEM)
While current ammonia production plants are fully compatible with the use of hydrogen in their production processes, additional infrastructure will be needed for hydrogen produced in PEM facilities either on site or at other production locations. This also includes the transportation of hydrogen fuel to ammonia production sites at required scales.
Key NSW regions Production of ammonia in NSW is currently concentrated in the Hunter Valley supporting local industry. Further consideration for the development of greenfield green ammonia production plants may be considered near other use locations in NSW.
Timeframe for realisation
Short term consideration is required on a viable pathway to long term cost competitive green ammonia manufacturing. In the short term, there are opportunities to leverage existing technologies such as CCS and renewable electricity generation to considerably reduce emissions from ammonia production. The long-term decarbonisation of ammonia production will rely heavily on the decarbonisation of hydrogen production using PEM technologies. These currently present significant barriers but are expected to become cost competitive as technological advancements progress and market demand for green ammonia rises.
Maturity key
Low or limited level
Some greater levels of maturity, however, some barriers remaining and/or current scale limited
Greater overall level of maturity and scalability
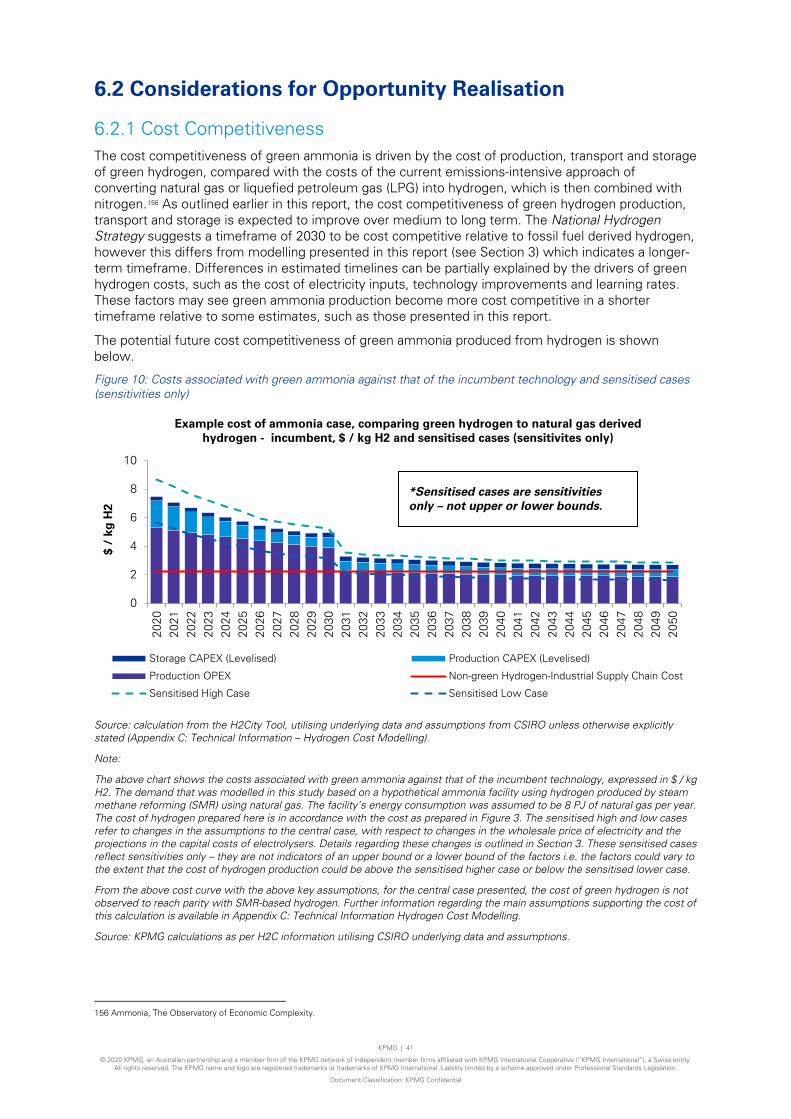
KPMG | 41
© 2020 KPMG, an Australian partnership and a member firm of the KPMG network of independent member firms affiliated with KPMG International Cooperative (“KPMG International”), a Swiss entity. All rights reserved. The KPMG name and logo are registered trademarks or trademarks of KPMG International. Liability limited by a scheme approved under Professional Standards Legislation.
Document Classification: KPMG Confidential
6.2 Considerations for Opportunity Realisation
6.2.1 Cost Competitiveness The cost competitiveness of green ammonia is driven by the cost of production, transport and storage of green hydrogen, compared with the costs of the current emissions-intensive approach of converting natural gas or liquefied petroleum gas (LPG) into hydrogen, which is then combined with nitrogen.156 As outlined earlier in this report, the cost competitiveness of green hydrogen production, transport and storage is expected to improve over medium to long term. The National Hydrogen Strategy suggests a timeframe of 2030 to be cost competitive relative to fossil fuel derived hydrogen, however this differs from modelling presented in this report (see Section 3) which indicates a longer-term timeframe. Differences in estimated timelines can be partially explained by the drivers of green hydrogen costs, such as the cost of electricity inputs, technology improvements and learning rates. These factors may see green ammonia production become more cost competitive in a shorter timeframe relative to some estimates, such as those presented in this report.
The potential future cost competitiveness of green ammonia produced from hydrogen is shown below.
Figure 10: Costs associated with green ammonia against that of the incumbent technology and sensitised cases (sensitivities only)
Source: calculation from the H2City Tool, utilising underlying data and assumptions from CSIRO unless otherwise explicitly stated (Appendix C: Technical Information – Hydrogen Cost Modelling).
Note:
The above chart shows the costs associated with green ammonia against that of the incumbent technology, expressed in $ / kg H2. The demand that was modelled in this study based on a hypothetical ammonia facility using hydrogen produced by steam methane reforming (SMR) using natural gas. The facility’s energy consumption was assumed to be 8 PJ of natural gas per year. The cost of hydrogen prepared here is in accordance with the cost as prepared in Figure 3. The sensitised high and low cases refer to changes in the assumptions to the central case, with respect to changes in the wholesale price of electricity and the projections in the capital costs of electrolysers. Details regarding these changes is outlined in Section 3. These sensitised cases reflect sensitivities only – they are not indicators of an upper bound or a lower bound of the factors i.e. the factors could vary to the extent that the cost of hydrogen production could be above the sensitised higher case or below the sensitised lower case.
From the above cost curve with the above key assumptions, for the central case presented, the cost of green hydrogen is not observed to reach parity with SMR-based hydrogen. Further information regarding the main assumptions supporting the cost of this calculation is available in Appendix C: Technical Information Hydrogen Cost Modelling.
Source: KPMG calculations as per H2C information utilising CSIRO underlying data and assumptions.
156 Ammonia, The Observatory of Economic Complexity.
0
2
4
6
8
10
2020
2021
2022
2023
2024
2025
2026
2027
2028
2029
2030
2031
2032
2033
2034
2035
2036
2037
2038
2039
2040
2041
2042
2043
2044
2045
2046
2047
2048
2049
2050
$ /
kg H
2
Example cost of ammonia case, comparing green hydrogen to natural gas derived hydrogen - incumbent, $ / kg H2 and sensitised cases (sensitivites only)
Storage CAPEX (Levelised) Production CAPEX (Levelised)
Production OPEX Non-green Hydrogen-Industrial Supply Chain Cost
Sensitised High Case Sensitised Low Case
*Sensitised cases are sensitivities only – not upper or lower bounds.

KPMG | 42
© 2020 KPMG, an Australian partnership and a member firm of the KPMG network of independent member firms affiliated with KPMG International Cooperative (“KPMG International”), a Swiss entity. All rights reserved. The KPMG name and logo are registered trademarks or trademarks of KPMG International. Liability limited by a scheme approved under Professional Standards Legislation.
Document Classification: KPMG Confidential
6.2.2 Strengths and Competitive Advantages The expected growth in ammonia demand, coupled with NSW’s comparative advantage in low-cost renewable electricity generation capability, presents a range of potential strengths for NSW to leverage over the medium to long term as green hydrogen becomes more cost competitive relative to incumbent fuels.
• NSW has an existing fossil-fuel-based hydrogen and ammonia industry, as well as end-users within the state, providing an opportunity to leverage existing resources, infrastructure and technology to provide a low-cost pathway to substitute emissions-intensive hydrogen with green hydrogen in ammonia production.157
• NSW and Australia have large agricultural sectors that use ammonia as an input to production, particularly grain growers, presenting a potential opportunity for cost competitive green ammonia to meet future demand. In 2018-19, the gross value of NSW agricultural production was approximately 19 per cent of total Australian production ($11.7 billion of $60 billion), with NSW grain growers and vegetable growers contributing 25 and 23 per cent of total Australian output.158
• From a domestic and international standpoint, demand for ammonia is expected to continue to grow into the future, providing market certainty for ammonia producers looking to transition to green ammonia production. Significant growth in demand is likely to come from the agricultural and manufacturing sectors, where ammonia is a key production input.
• Further market opportunities and returns on investment for NSW green ammonia producers could be realised in green ammonia as an energy carrier reaches cost competitiveness to enable adoption as an alternative source of fuel for transport modes, such as the global shipping industry, where companies such as Man Energy Solutions and Wärtsilä developed ammonia powered 2- and 4-stroke ship engines for trial and market delivery.159 160
6.2.3 Barriers While demand for ammonia is expected to continue rising domestically and globally, there remains a number of barriers to decarbonising the NSW ammonia production industry and producing globally competitive green ammonia.
6.2.3.1 Production and use barriers
• Fossil-fuel-based ammonia plants, such as those using natural gas or LPG, would require investment in retrofitting their facilities to support green hydrogen-based production processes. High investment costs for some producers, coupled with high-cost green hydrogen in the near term, may discourage accelerated adoption. The collocation of green hydrogen and green ammonia plants will also require investment in greenfield plants.
• Hydrogen production, storage, transportation and use will require the development and testing and standardisation of a range of specialty equipment, processes and skills for safe production and use. This includes materials that don’t become embrittled when handling hydrogen over time, high precision manufacturing of valves and joints to avoid gas leakage, monitors and sensors, accredited handing protocols. Ammonia can also cause embrittlement of materials and is stored under pressure and at low temperatures.
• The use of green hydrogen in ammonia manufacturing provides a pathway to sustainable, low-emissions production. However, the production of green hydrogen, generated by electrolysis of water, and its subsequent use in green ammonia production is water intensive, requiring water sustainability and efficiency considerations to be accounted for. Further considerations may need to be made to account for wastewater treatment requirements in alignment with community and environmental protection standards.
157 Decarbonization of industrial sectors: The next frontier, McKinsey & Company (June 2018).
158 About my region – New South Wales, Australian Government Department of Agriculture, Water and Environment.
159 Wood, T, Dundas, G and Ha, J 2020, ‘Start with Steel’. A practical plan to support carbon workers and cut emissions’, Grattan Institute.
160 Marine Sector Turns to Ammonia to Decarbonize Shipping, Green Tech Media (21 May 2020).

KPMG | 43
© 2020 KPMG, an Australian partnership and a member firm of the KPMG network of independent member firms affiliated with KPMG International Cooperative (“KPMG International”), a Swiss entity. All rights reserved. The KPMG name and logo are registered trademarks or trademarks of KPMG International. Liability limited by a scheme approved under Professional Standards Legislation.
Document Classification: KPMG Confidential
• There are opportunities for converting hydrogen to ammonia for transportation and then converting back to hydrogen at port terminals, however current processes for doing this are highly energy intensive and expensive.161 Research to address this barrier is in development, with the metal membrane developed by the CSIRO providing a pathway for conversion and transport (see Section 3.2.4).
• Compared to larger markets such as those for steel or aluminium, the international market for ammonia is smaller and more competitive, with several competitive producing nations, placing pressure on ammonia manufacturers to produce cost-competitive chemicals. This can be relieved through the provision of low-cost and reliable renewable electricity to reduce the cost of production inputs paid by ammonia manufacturers, enhanced targeting of export markets and end-use applications to increase market share and consumers.
• A potential market for green ammonia is in agricultural fertilisers. These are often supplied as urea (CO(NH2)2) which is made from ammonia and the CO2 biproduct from the SMR process. Therefore, if SMR is replaced as the source of hydrogen, a different source of CO2 needs to be obtained.
6.2.3.2 Market barriers
• There are several other countries in renewable energy-rich locations that may have the capability to produce cost-competitive green hydrogen and, therefore, green ammonia. Locations such as the US, Argentina, North Africa and the Middle East have abundant renewable energy sources, while the US, Russia and the Middle East may be able to produce cost-competitive low-emissions fossil hydrogen using natural gas and carbon storage.
• Oversupply of ammonia into the international market or drops in the price of fossil fuel feedstocks can affect the cost competitiveness of green ammonia in the near term, disadvantaging green ammonia manufacturers.
6.2.4 Infrastructure Requirements Any region in NSW that has cost-competitive renewable green hydrogen, proximity to ports, distribution sites or agriculture production locations, and sufficient land and labour availability is suitable to expand NSW’s presence in green ammonia production. Based on existing infrastructure, the Hunter Valley and Illawarra-Shoalhaven regions are both suitable options for green ammonia production facility given their proximity to existing port infrastructure at the Port of Newcastle and Port Kembla respectively. Port Botany in the Greater Sydney region could also be considered to collocated green ammonia and green hydrogen plants to support international exports or use in ammonia-powered shipping. These regions are also suitable due to the availability of workforce skilled in carbon-heavy industries. Other production locations can be placed further inland in proximity to rich pasture lands in the Riverina-Murray, Central-West Orana and New England and North West regions.
The investment and capital costs of retrofitting brownfield green ammonia plants or developing greenfield manufacturing plants may be influenced by the following infrastructure collocation considerations:
• The collocation of hydrogen production and storage facilities with green ammonia production plants may be a critical factor in the cost of production, allowing for reduced hydrogen transportation costs. Collocation or integrated hydrogen and ammonia production plants will have varying capital costs depending on chosen option and scale.
• Ammonia transportation infrastructure and storage facilities around production plants, near transport terminals or proximate to end-use locations.
• Renewable energy infrastructure, such as generation, transmission and storage capability will likely need to be strategically located in renewable energy abundant areas of NSW to ensure sufficient supply of low-cost renewable energy to hydrogen fuel production facilities.
• Water distribution networks will need to be upgraded or constructed to support hydrogen production plants or integrated hydrogen-ammonia facilities. This may require investment in
161 Opportunities for Australian from Hydrogen Exports, ACIL Allen Consulting (August 2018).

KPMG | 44
© 2020 KPMG, an Australian partnership and a member firm of the KPMG network of independent member firms affiliated with KPMG International Cooperative (“KPMG International”), a Swiss entity. All rights reserved. The KPMG name and logo are registered trademarks or trademarks of KPMG International. Liability limited by a scheme approved under Professional Standards Legislation.
Document Classification: KPMG Confidential
distribution pipes, the construction of reservoirs or catchments and sufficient wastewater capture and treatment equipment to ensure compliance with community and environmental safety standards.
In addition to infrastructure access and capital costs factors, considerations around occupational health and safety and risk to surrounding communities, properties and ecosystems will also present questions about which locations are suitable for investment or development and whether a greenfield or brownfield site is more appropriate to develop.
With respect to storage, ammonia storage and transportation units and technologies must be considerate of the higher consequences associated with loss of containment compared to other chemicals, such as ammonium nitrate or natural gas. The choice of storage unit and transportation technology used as well as the proximity of facilities and equipment to other infrastructure, residential dwellings and ecosystems must comply with safety requirements under existing national standards to prevent loss of containment or embrittlement of capital and equipment.
6.3 Potential Opportunity Size The NSW ammonia industry has the potential to play a competitive role increasing Australia’s share of global ammonia exports through the adoption of low-cost, low-emissions green hydrogen fuel. Future market opportunities may be able to be realised as industries adopt ammonia as a fuel source, including the international maritime shipping industry.
The potential economic benefits of increasing Australia’s market share of global ammonia exports to meet new and emerging opportunities could be substantial, where increasing the national share by one percentage point of the global ammonia export market worth approximately $102.3 million in today’s dollars (assuming 2018 market size).162 163 Transitioning NSW’s ammonia production plants to produce cost-competitive green ammonia may allow NSW to protect and grow its market share and play a leading role in strengthen the national ammonia industry.
Globally cost competitive green ammonia can be used to return to Australia’s previous highest share of the global ammonia export market of 3.48 per cent achieved in 2013. Achieving this would be equivalent to $355.7 million of global exports in today’s dollars, or $239.8 million more than 2018 export levels, in today’s dollars.164 165
162 Ammonia, The Observatory of Economic Complexity.
163 Dollar conversions are based on the average closing price of the Australian dollar in US dollar terms in foreign exchange markets in year of observation.
Source: Australian – US Dollar Exchange Rate (AUD USD) – Historical Chart, Macrotrends.
164 Ammonia, The Observatory of Economic Complexity.
165 Dollar conversions are based on the average closing price of the Australian dollar in US dollar terms in foreign exchange markets in year of observation.
Source: Australian – US Dollar Exchange Rate (AUD USD) – Historical Chart, Macrotrends. Earnings converted into March 2020 dollars (ABS Consumer Price
Index, March 2020, released 29 April 2020).

KPMG | 45
© 2020 KPMG, an Australian partnership and a member firm of the KPMG network of independent member firms affiliated with KPMG International Cooperative (“KPMG International”), a Swiss entity. All rights reserved. The KPMG name and logo are registered trademarks or trademarks of KPMG International. Liability limited by a scheme approved under Professional Standards Legislation.
Document Classification: KPMG Confidential
7 Sustainable Chemicals and Synthetic Fuels 7.1 Background Australia has a large chemical and synthetic fuel manufacturing sector, with a national contribution to GDP in 2017-18 of $37.7 billion and employing 211,821 FTE jobs. For NSW, the industry in 2017-18 had the highest value of GSP of any state estimated at $11.3 billion, or a GSP share of between 1.34 and 1.87 per cent, employing between 47,007 and 63,948 FTE workers.166
The presence of this industry, supported by the state’s research, education and training institutions, provides NSW several opportunities to decrease emissions in fossil dependent industries. The development of renewable energy infrastructure provides local producers with a potential avenue to increase the scale of production or product offering of cost-competitive sustainable chemicals and synthetic fuels due to cheaper energy inputs. The availability of cheaper energy inputs also provides a pathway for local firms to provide new chemicals to markets seeking green premium products or to produce chemicals and synthetic fuels, such as liquid organic hydrogen carriers (LOHC), synthetic biofuels and e-fuels, that will be enablers of the energy transition across industries.
As industries look to decarbonise, several technology options have the potential to play a significant role in meeting the unique needs of producers and operators, with the cost, volume and energy density of alternative fuels being critical considerations. Electrification, for example, is a technology that is already being employed across several industries, including transport, to replace fossil fuels. However, for some industries, such as aviation and maritime and international shipping, electrification technologies have limited application in displacing fossil fuels.167
There may also be wider opportunities to collocate any new greenfield production plants with new renewable energy infrastructure and transport linkages, such as the REZs and SAPs under development and the construction of the Inland Rail and other rail infrastructure upgrades.
7.1.1 Synthetic fuels and hydrogen carriers Synthetic fuels are liquid fuels manufactured, through chemical conversion processes, from carbon sources such as coal, carbon dioxide, natural gas, biogas and biomass.168
There are two main methods currently used in manufacturing synthetic fuels, both of which involve the emissions intensive conversion of fossil fuels into a synthesis gas mixture of carbon monoxide, carbon dioxide and hydrogen. These methods include:
• Methanol synthesis - produced by reacting the synthesis gas at relatively high pressure and temperature using a copper catalyst, or a catalyst to make alkenes; and
• Fischer Tropsch - carbon dioxide is reacted with hydrogen to produce carbon monoxide which is then reacted with hydrogen over either a cobalt or iron catalysts to produce a range of hydrocarbons.
166 Chemical Industry Economic Contribution Analysis, ACIL Allen Consulting (August 2019).
167 Sustainable synthetic carbon based fuels for transport: Policy briefing, The Royal Society (2019).
168 Sustainable synthetic carbon based fuels for transport: Policy briefing, The Royal Society (2019).

KPMG | 46
© 2020 KPMG, an Australian partnership and a member firm of the KPMG network of independent member firms affiliated with KPMG International Cooperative (“KPMG International”), a Swiss entity. All rights reserved. The KPMG name and logo are registered trademarks or trademarks of KPMG International. Liability limited by a scheme approved under Professional Standards Legislation.
Document Classification: KPMG Confidential
Synthetic fuels produced through these reactions can extract carbon dioxide from point source capture, such as the exhausts of industrial processes and direct capture. While they still emit carbon dioxide when burnt, synthetic fuels may be able to displace fossil fuels and reduce overall emissions by:
• Capturing and using carbon dioxide during production; and
• Reducing the need for continued extraction, refinement and burning of conventional fuels such as petroleum based liquid fuels.
Additionally, total emissions from the production and use of synthetic fuels can be further reduced if electricity and hydrogen used during production are sourced from industries such as a renewable electricity generation industry and green hydrogen industry.169
Synthetic fuels, especially electrofuels (efuels), are less developed in NSW compared to industries such as ammonia manufacturing, with some key technologies still in the research and development phase. Similar to green ammonia, sustainable synthetic fuels have significant potential to follow on from the growth of green hydrogen, serving as LOHCs, and benefiting from low-cost, low-emission renewable electricity. Developments in synthetic fuels that don’t need to rely on fossil fuel feedstock are being looked at by a range of NSW and national research organisations and universities.
The main advantages of sustainable synthetic fuels are:
• They have the potential to be manufactured as substitutes for jet fuel, diesel and fuel oil for use in the aviation and maritime industries where using low-emissions electricity or hydrogen is challenging or not feasible;
• They have a similar volume and energy density to existing fuels, meaning they require similar technologies for transportation, storage and use; and
• They have the capability to be designed to burn with fewer particulates, such as nitrogen oxides, to conventional fuels.170
In addition to these advantages, and more specific to the NSW and Australian context, the local production of synthetic fuels provides an opportunity to substitute imported fuels, reducing reliance on imports and improving domestic fuel supply, capability and security.
Use of green inputs enables the manufacture of carbon based sustainable synthetic fuels that can be categorised into two sustainable synthetic fuel types; efuels and synthetic biofuels.
7.1.1.1 Efuels
Efuels are synthetic fuels manufactured using captured carbon dioxide or carbon monoxide together with low-carbon hydrogen. They are termed electro- or efuels because the hydrogen used during the reaction process is obtained from renewable electricity sources such as wind and solar. Efuels are produced by first producing green hydrogen using electrolysis powered by renewable electricity which is then reacted in high concentrations of captured carbon dioxide from sources such as steel and ammonia production or fossil-fuel power generation.
A range of efuel technologies have been developed and are commercial, including gas-to-liquids technologies at a small to medium scale. Other technologies, including electrolytic carbon dioxide conversion and synthetic natural gas, are not as developed or researched.171 Given the level of development, it is likely that efuel processes will be integrated with existing fuel processes in the next 5 – 10 years.172 This will improve carbon efficiency in the short term while innovative fuels are developing in the longer term.
169 Sustainable synthetic carbon based fuels for transport: Policy briefing, The Royal Society (2019).
170 Sustainable synthetic carbon based fuels for transport: Policy briefing, The Royal Society (2019).
171 Sustainable synthetic carbon based fuels for transport: Policy briefing, The Royal Society (2019).
172 Sustainable synthetic carbon based fuels for transport: Policy briefing, The Royal Society (2019).

KPMG | 47
© 2020 KPMG, an Australian partnership and a member firm of the KPMG network of independent member firms affiliated with KPMG International Cooperative (“KPMG International”), a Swiss entity. All rights reserved. The KPMG name and logo are registered trademarks or trademarks of KPMG International. Liability limited by a scheme approved under Professional Standards Legislation.
Document Classification: KPMG Confidential
The efuel industry is still in early stages of development domestically and internationally and will require further research and development as well as targeted government policy to encourage production and improve cost competitiveness.
7.1.1.2 Synthetic biofuels
Synthetic biofuels can be defined as fuels synthesised from biomass or waste or biofuels using chemical or thermal processes.173 In Australia, ethanol and biodiesel – both synthetic biofuels, are typically used for transport.174 While no comprehensive statistical series are available from industry or government on national biofuel production, trade and sales, limited data suggests biofuel production in Australia has decreased from a peak of 400 megalitres (ML) in 2014.175 176
Ethanol is used as a renewable transport fuel and is produced by fermenting starch and sugars from feedstocks such as wheat, sorghum, and molasses.177 There are currently three major ethanol production facilities in Australia. Two are located in Queensland, and the largest, Manildra Ethanol Plant, is located in Nowra, NSW. The Manildra Ethanol Plant in Nowra produces approximately 68 per cent of ethanol in Australia from waste wheat.178 Two states in Australia have mandated the sale of ethanol blended fuels to encourage use of ethanol and biofuels. In 2007, NSW mandated that six per cent of petrol sales must be ethanol and in 2017, Queensland mandated that three per cent of petrol sales must be ethanol.179 Production is currently sufficient to meet Australian ethanol demand, however, additional production capacity may be required to meet further increases with local production.180
Biodiesel produced in Australia is predominantly derived from animal fats or used cooking oil.181 Interest in biodiesel has resulted in technological innovations, research and trial projects. However, biodiesel represented less than one per cent of all transport fuel used in the country in 2012–13182 and contributed 0.5 per cent of the transport fuel energy mix in 2016–17.183 There was an increase in biodiesel imports between 2013 and 2015 and domestic production has fallen sharply in recent years.184 The decline in production is due to a number of factors, including high costs for feedstock (e.g. tallow), low oil prices, and tax implications.185 The largest biodiesel producer, Australian Renewable Fuels, closed in 2016.186 However, demand for biodiesel overseas has enabled Australia to export tallow to Singapore for the production of renewable biodiesel and also exports canola for use in the production of biofuels in Europe.187 In 2018, Neste Corp committed to doubling its renewable
173 Sustainable synthetic carbon based fuels for transport: Policy briefing, The Royal Society (2019).
174 Australian Competition and Consumer Commission, ‘Biofuels’, https://www.accc.gov.au/consumers/petrol-diesel-
lpg/biofuels#:~:text=Biofuels%20and%20the%20ACCC,-Biofuels%20(particularly%20ethanol&text=Two%20states%20have%20mandated%20the,
petrol%20and%20bio%2Dbased%20diesel.
175 Farrell, R., 2017, Australia Biofuels Annual, USDA Foreign Agricultural Service.
176 Farrell, R., 2017, Australia Biofuels Annual, USDA Foreign Agricultural Service.
177 Farrell, R., 2017, Australia Biofuels Annual, USDA Foreign Agricultural Service.
178 Rural Industries Research and Development Corporation, ‘Bioenergy markets: ethanol’, http://biomassproducer.com.au/markets/bioenergy-markets-in-
australia/ethanol/#.Xw_EiSgzY2y.
179 Australian Competition and Consumer Commission, ‘Biofuels’, https://www.accc.gov.au/consumers/petrol-diesel-
lpg/biofuels#:~:text=Biofuels%20and%20the%20ACCC,-
Biofuels%20(particularly%20ethanol&text=Two%20states%20have%20mandated%20the,petrol%20and%20bio%2Dbased%20diesel.
180 Rural Industries Research and Development Corporation, ‘Bioenergy markets: ethanol’, http://biomassproducer.com.au/markets/bioenergy-markets-in-
australia/ethanol/#.Xw_EiSgzY2y.
181 Farrell, R., 2017, Australia Biofuels Annual, USDA Foreign Agricultural Service.
182 Roads and Maritime Services NSW, 2017, ‘Technology Study: Alternative Fuels’,
https://www.rms.nsw.gov.au/documents/about/environment/air/technology-study-alternative-fuels.pdf.
183 Cochrane, M., 2017, ‘Australian Biofuels 2017 Industry Overview and Developments’,
https://web.archive.org/web/20180510051203/https://apfiforum.com/wp-content/uploads/2016/03/APAC-Mike-Cochran.pdf.
184 Farrell, R., 2017, Australia Biofuels Annual, USDA Foreign Agricultural Service.
185 Farrell, R., 2017, Australia Biofuels Annual, USDA Foreign Agricultural Service.
186 Farrell, R., 2017, Australia Biofuels Annual, USDA Foreign Agricultural Service.
187 Farrell, R., 2017, Australia Biofuels Annual, USDA Foreign Agricultural Service.

KPMG | 48
© 2020 KPMG, an Australian partnership and a member firm of the KPMG network of independent member firms affiliated with KPMG International Cooperative (“KPMG International”), a Swiss entity. All rights reserved. The KPMG name and logo are registered trademarks or trademarks of KPMG International. Liability limited by a scheme approved under Professional Standards Legislation.
Document Classification: KPMG Confidential
diesel production in Singapore for export to the US.188 This indicates that while there is limited demand for biodiesel production in Australia due to price of feedstock, low oil prices and tax factors, demand continues to grow for biodiesel production globally.
Synthetic fuels present opportunities to reduce dependency of imported fuels by substituting imported liquid fuels, such as diesel and petroleum, with locally produced fuels that can meet local transport, industry and private demand. A key opportunity area for growth is in the production of biofuel for the aviation industry. There is interest and commitment from the aviation industry to use sustainable aviation fuel (SAF), including support from Boeing, Airbus, Qantas and Virgin Australia.189 The International Civil Aviation Organisation has also committed to reducing carbon emissions by 50 per cent from 2005 to 2050.190 Due to the long range and speed needed for civil aviation, high energy dense fuel such as kerosene is required.191 Aviation biofuel blends such as synthetic paraffinic kerosene (SPK), which is made from bio-derived oils can also be used when blended with traditional kerosene.192 Blending SAF with traditional fuel will be key to reaching this commitment.193 Qantas operated Australia’s first commercial flight using SAF from Sydney to Adelaide in 2012 and research continues to be conducted around the development of ‘drop-in’ SAF which is compatible with existing engines.
A number of production facilities have been proposed in NSW including an ethanol plant at Deniliquin, which would produce up to 115 million litres of fuel grade ethanol annually.194 A proof of concept paper was also released in 2019 for a proposed synthetic fuel plant in NSW, which will use waste sawmill residue and waste lubricating oil to produce biofuel.195
Table 14: Opportunity summary – Sustainable chemicals and synthetic fuels in NSW
Consideration Observations Current NSW Maturity
Extent of current industry decarbonisation
The largest producer of ethanol, Manildra Ethanol Plant, has adopted several sustainability commitments. These include an Environmental Farm, recycling water and the production of sustainable products with zero waste.196
Readiness to leverage technology pathway(s) to decarbonisation
Efuels
Efuels may be readily dropped into existing engines with little to no fuel blending required, however significant cost-competitiveness barriers remain and are unlikely to see efuel adopted at scale in the short-medium term.
Synthetic biofuels
Existing technology exists at the Manildra Ethanol Plant; however, further production facilities may require the development of solar and wind farms to produce sustainable energy that is required for the production of biofuels.
188 Biomass Magazine, 2018, ‘Neste to more than double renewable diesel capacity in Singapore’, http://biomassmagazine.com/articles/15819/neste-to-
more-than-double-renewable-diesel-capacity-in-singapore.
189 Farrell, R., 2017, Australia Biofuels Annual, USDA Foreign Agricultural Service.
190 BioEnergy Australia, ‘IEA Commentary: Are Aviation Biofuels Ready for Take Off?’, https://www.bioenergyaustralia.org.au/news/iea-commentary-are-
aviation-biofuels-ready-for-take-off/.
191 Sustainable synthetic carbon based fuels for transport: Policy briefing, The Royal Society (2019).
192 Sustainable synthetic carbon based fuels for transport: Policy briefing, The Royal Society (2019).
193 BioEnergy Australia, ‘IEA Commentary: Are Aviation Biofuels Ready for Take Off?’, https://www.bioenergyaustralia.org.au/news/iea-commentary-are-
aviation-biofuels-ready-for-take-off/.
194 Farrell, R., 2017, Australia Biofuels Annual, USDA Foreign Agricultural Service.
195 RSK, 2019, ‘Synthetic fuel manufacture: Proof of Concept LCA’.
196 Manildra Group, ‘Sustainability Commitments’, https://www.manildra.com.au/sustainability-commitments/.

KPMG | 49
© 2020 KPMG, an Australian partnership and a member firm of the KPMG network of independent member firms affiliated with KPMG International Cooperative (“KPMG International”), a Swiss entity. All rights reserved. The KPMG name and logo are registered trademarks or trademarks of KPMG International. Liability limited by a scheme approved under Professional Standards Legislation.
Document Classification: KPMG Confidential
Sufficiency of existing industry infrastructure to leverage technology
Efuels
Existing plants are unable to produce efuels cost competitively at scale and require further investment in retrofitting existing facilities or the construction of greenfield plants that house the requisite electrolysers and catalysts needed for successful efuel production.
Synthetic biofuels
A large-scale production facility is located on NSW’s South Coast. Greenfield production facilities would need to ensure sufficient infrastructure to support production.
Key NSW regions NSW has an existing ethanol production facility in Nowra in the Illawarra-Shoalhaven region, which produces 68 per cent of Australia’s ethanol. 197 Several production facilities have been proposed in NSW including an ethanol plant at Deniliquin in the Riverina-Murray region, which may have the potential to produce up to 115 million litres of fuel grade ethanol annually.198 The development of key transport and industry infrastructure such as the Western Sydney Airport present potential collocation options for chemical and synthetic fuel production plants for consideration by government and industry.199 There may also be wider opportunities to collocate any new greenfield production plants with new renewable energy infrastructure and transport linkages, such as the REZs and SAPs under development and the construction of the Inland Rail and other rail infrastructure upgrades.
Timeframe for realisation
Efuels are unlikely to be commercially viable for use in industry in the short-medium term due to significant cost disadvantages. Targeted and sustained industry initiatives and policies such as increased aircraft efficiency, decarbonisation of airline fleets, production mandates or low carbon fuel standards on fuel suppliers, carbon pricing, fuel taxation and removal of subsidies will be essential to achieving cost competitiveness. NSW can draw on its existing ethanol plant in Nowra to continue producing the majority of Australia’s ethanol in the short term, and production capacity may increase further, subject to the potential new production facility in Deniliquin. In the medium term, larger-scale production of ethanol and biodiesel will be dependent on the construction of additional greenfield facilities, the timing of which may be linked to wider electricity infrastructure development within the REZs. Current scale is not cost competitive, there are issues around tax and the sector needs a lot more support such as in research and development for it be to a viable proposition. Development of pilot facilities and opportunities to collocate capabilities to obtain critical mass and efficiencies could assist in reducing costs.
Maturity key
Low or limited level
Some greater levels of maturity, however, some barriers remaining and/or current scale limited
Greater overall level of maturity and scalability
197 Rural Industries Research and Development Corporation, ‘Bioenergy markets: ethanol’, http://biomassproducer.com.au/markets/bioenergy-markets-in-
australia/ethanol/#.Xw_EiSgzY2y.
198 Farrell, R., 2017, Australia Biofuels Annual, USDA Foreign Agricultural Service.
199 NSW Chief Scientist and Engineer, 2020, ‘NSW Decarbonisation Innovation Study, Scoping Paper’.
KPMG | 50
© 2020 KPMG, an Australian partnership and a member firm of the KPMG network of independent member firms affiliated with KPMG International Cooperative (“KPMG International”), a Swiss entity. All rights reserved. The KPMG name and logo are registered trademarks or trademarks of KPMG International. Liability limited by a scheme approved under Professional Standards Legislation.
Document Classification: KPMG Confidential
7.2 Considerations for Opportunity Realisation
7.2.1 Cost Competitiveness
7.2.1.1 Efuels
Efuels require significant amounts of electricity and water inputs, which can make them relatively expensive and inefficient to produce relative to fossil fuel comparators. The current cost of efuels is estimated to be around $7.30/litre for diesel equivalent.200 However, it is estimated that the cost of production will reduce by 2050, which will primarily be driven by lower costs of power.201
With respect to limited resources such as electricity supply, drop-in efuel production is not as energy efficient as the direct supply of electricity for electric vehicles.202 This may be similar to other synthetic fuels, where electricity dominates production costs, and is likely to be even larger for efuels manufacturing.203 To achieve the same output, efuels are likely to require five times more total electricity generation than would be required to run a fully electric vehicle, therefore making them more cost and energy resource inefficient.204 In the current market, where there are better alternatives (in particular direct charging) efuels are not a competitive option for producers or end-users with significant advancements in technologies to improve efficiency and bring down costs.
Despite cost-competitiveness and efficiency issues, efuels may be given further consideration for sectors where limited low-emission fuel alternatives exist, in particular in the aviation sector.205 However, the ability of efuels to achieve significant emissions reduction in aviation by 2050 are constrained and would require adding the equivalent of 24% of the current electricity generation.206 This means other measures such as increased aircraft efficiency, production mandates or low carbon fuel standards on aviation fuel suppliers, carbon pricing, fuel taxation and removal of subsidies remain essential.207
7.2.1.2 Biofuels
Chemical and synthetic fuel prices have tended to follow trends for oil and wholesale petrol, however, biofuel prices tend to be impacted by climatic conditions and upstream market forces due to the nature of inputs.208 For example, first generation producers reliant to feedstock markets will likely see material costs rise as a result of recent drought, fire and flood events. While inbound transport and rental costs remain in line with sector averages, numerous firms have left the industry due to the uncompetitive cost base associated with raw material purchase or scarcity.209 Sector analysis undertaken by IBISWorld found the costs associated with input materials for the industry were more than double that with oil and gas competitors.210 Other significant costs include the transport and storage of bulk feedstock materials required in the production process.
200 Sustainable synthetic carbon based fuels for transport: Policy briefing, The Royal Society (2019). Currency conversion applied for Euros to Australian
Dollars.
201 Sustainable synthetic carbon based fuels for transport: Policy briefing, The Royal Society (2019).
202 ‘Electrofuels what role in EU transport decarbonisation’, Transport and Environment (November 2017).
203 Eberle, U. & Systemtechnik, Ludwig & Fuels, FVV. (2016). FVV Study "Renewables in Transport 2050: Empowering a sustainable mobility future with
zero emission fuels from renewable electricity".
204 ‘Electrofuels what role in EU transport decarbonisation’, Transport and Environment (November 2017).
205 IEA (2019), ‘Putting CO2 to Use’.
206 ‘Electrofuels what role in EU transport decarbonisation’, Transport and Environment (November 2017).
207 ‘Electrofuels what role in EU transport decarbonisation’, Transport and Environment (November 2017).
208 IPART NSW, 2019, ‘IPART Ethanol Market Monitoring Report’, https://www.ipart.nsw.gov.au/files/sharedassets/website/shared-files/investigation-
compliance-monitoring-transport-publications-ethanol-market-monitoring-201819/final-report-ethanol-market-monitoring-201819-december-2019.pdf
209 USDA Foreign Agricultural Survey, 2017, ‘Global Agricultural Information Network: Australia, Biofuels’,
https://apps.fas.usda.gov/newgainapi/api/report/downloadreportbyfilename?filename=Biofuels%20Annual_Canberra_Australia_8-15-2017.pdf
210 Anthony Kelly, 2019, ‘IBISWorld Australian Specialised Industry Report OD5088: ‘Ethanol Fuel Production in Australia’

KPMG | 51
© 2020 KPMG, an Australian partnership and a member firm of the KPMG network of independent member firms affiliated with KPMG International Cooperative (“KPMG International”), a Swiss entity. All rights reserved. The KPMG name and logo are registered trademarks or trademarks of KPMG International. Liability limited by a scheme approved under Professional Standards Legislation.
Document Classification: KPMG Confidential
While competitive pricing mechanisms have been introduced by IPART, the industry remains susceptible to profit erosion due to an inability to directly pass on fluctuations in raw material costs where they occur out of cycle with changes in wholesale oil and petrol prices.
Some cost challenges, including feedstock costs, may be partially addressed in third-generation biofuels. However, modelling of micro-algal based biofuel production found this solution is unlikely to adequately reduce the cost base of production or support sufficient production in the Australian context to reach NSW targets within the near term.211 Equivalent modelling of yeast-based, third generation biofuel production is not yet available due to the recent evolution of the technology.
7.2.2 Strengths and Competitive Advantages
7.2.2.1 Efuels
Efuels have several advantages over synthetic biofuels and/or conventional fuels:
• Efuels can be used as drop-in fuel as a substitute for many fossil fuels with little no blending required;
• Compared to synthetic biofuels, efuel production is better able to achieve large-scale rapid production;
• While still producing carbon emissions when burnt, efuels have a better emission reductions potential if captured carbon dioxide is used during manufacturing, allowing the production of a zero-carbon fuel.
• Carbon can have a negative effect on price under carbon pricing mechanisms, allowing efuels to be more cost-competitive compared to other conventional synthetic and fossil-fuels.
7.2.2.2 Chemicals and synthetic biofuels
Producing chemicals using sustainable processes opens up opportunities for new chemical product categories, and with premium pricing through accessing green low emissions markets. As discussed in the hydrogen section of this report, long term storage and transport of hydrogen can be achieved using energy carrier chemicals such as ammonia and LOHC, so chemistries to produce energy carrier molecules, provide an option by which energy from photovoltaic or wind can be stored, transported and exported. The use of production biproducts, such as carbon dioxide, captured from the production of a range of chemicals and fuels, as well as other products across industries, can also be used by manufacturers to produce synthetic chemicals and fuels providing avenues for manufacturers to replace the common petrochemical sources otherwise required in chemical production.
As one of the two states in Australia with a biofuel mandate, NSW has a competitive advantage in biofuel production.212 Extensive research and trials have been conducted in the past, meaning that existing knowledge and lessons can be leveraged in the future. An Australian Research Council (ARC) Centre of Excellence in Synthetic Biology has recently been announced, which will be administered by Macquarie University and will enhance research into synthetic biology, including constructing biological systems to convert biomass to biofuel.213
A key strength of many regions across NSW is agricultural production. With the appropriate production facilities, there is an opportunity for the agricultural sectors to produce and consume its own fuel to develop agricultural circular economies in regional NSW.214 Additionally, energy losses and emissions from manufacturing and using synthetic fuels are able to be overcome through the use of low-cost, low-emissions renewable electricity.215
211 Journal of Applied Phycology, Philip Kenny and Kevin J. Flynn, 2017, ‘Physiology limits commercially viable photoautotrophic production of microalgal
biofuels’
212 NSW Chief Scientist and Engineer, 2020, ‘NSW Decarbonisation Innovation Study, Scoping Paper’.
213 Australian Research Council, 2019, ‘2020 ARC Centre of Excellence in Synthetic Biology’, https://www.arc.gov.au/2020-arc-centre-excellence-synthetic-
biology.
214 NSW Chief Scientist and Engineer, 2020, ‘NSW Decarbonisation Innovation Study, Scoping Paper’.
215 The Royal Society 2019, ‘Sustainable synthetic carbon based fuels for transport: Policy briefing’.

KPMG | 52
© 2020 KPMG, an Australian partnership and a member firm of the KPMG network of independent member firms affiliated with KPMG International Cooperative (“KPMG International”), a Swiss entity. All rights reserved. The KPMG name and logo are registered trademarks or trademarks of KPMG International. Liability limited by a scheme approved under Professional Standards Legislation.
Document Classification: KPMG Confidential
While there is competition from biofuel produced overseas, imported fuel ethanol and biodiesel are currently taxed at high rates and are therefore disadvantaged over domestic biofuels. Since mid-2015, imported biodiesel has been subject to the full rate of excise that applies to traditional diesel. Prior to this, biodiesel imports received a full excise rebate to encourage the use of biofuel.216 Furthermore, ethanol imports are subject to a general tariff of five per cent and full excise at customs.217 These measures may further contribute to the cost competitiveness for domestic production of biofuel.
7.2.3 Barriers While there is interest in the manufacturing of sustainable chemicals and synthetic fuels in NSW, there are a number of barriers to production and use.
7.2.3.1 Efuels
Some research, cost and implementation challenges remain for efuels, including:
• The current understanding of catalysis to produce efuels requires further research and development to drive efficiency in chemical reaction and reduce production costs;
• Developing more efficient and lower cost electrolysis technologies for the conversion of water to low-carbon hydrogen;
• There is limited capability at present to make small scale conversion of syngas or other electro-derived intermediate chemicals into chemicals and fuels more commercially attractive and scale better to renewable generators such as wind and solar assets;
• Intermittency of renewable electricity generation, particularly wind and solar, may present operational challenges for efuel manufacturers; and
• Further research and development is required to ensure efuels are tailored to a wider range of engine types and requirements to optimise engine performance and improve the cost-competitiveness of efuels over conventional fuels.
7.2.3.2 Chemicals and synthetic fuels
• Chemicals and synthetic fuels from both biomass and carbon dioxide are currently more expensive than fossil fuels, for example around €4.50/litre for diesel equivalent efuel and around €1/litre petrol equivalent biofuel. Innovation in each process stage has the potential to reduce these costs in the future to enable production and scale up to defossilise the current and growing future transport demands. Estimated future costs vary greatly but range from 60 cents to €1.50 per litre for diesel equivalent efuel by 2050.218
• The cost premium is a key barrier to the wider use of sustainable aviation fuel, since fuel cost is the single largest expense for airlines. Fuel accounts for approximately 22 per cent of direct costs and increasing the expense by using SAF is a challenge.219
• To be economically efficient, power-to-gas (PtG) and power-to-liquid (PtL)facilities require inexpensive renewable electricity and high fuel load hours.220 Excess renewable power is not sufficient to meet the energy requirements to enable the production of chemicals and synthetic fuels. Instead, building renewable power plants should be considered explicitly for the purpose of producing chemicals and synthetic fuels. The development of production plants in fossil-fuel exporting countries, such as Australia, would provide opportunities for a post-fossil business model.221
216 Farrell, R., 2017, Australia Biofuels Annual, USDA Foreign Agricultural Service.
217 Farrell, R., 2017, Australia Biofuels Annual, USDA Foreign Agricultural Service.
218 The Royal Society 2019, ‘Sustainable synthetic carbon based fuels for transport: Policy briefing’.
219 BioEnergy Australia, ‘IEA Commentary: Are Aviation Biofuels Ready for Take Off?’, https://www.bioenergyaustralia.org.au/news/iea-commentary-are-
aviation-biofuels-ready-for-take-off/.
220 PtG and PtL facilities are capital intensive and have high fixed costs. In order to be operated in an economically efficient manner, these facilities need to
achieve 3,000 to 4,000 full load hours annually.
221 Aora Verkehrswende, Agora Energiewende and Frontier Economics 2018, ‘The Future Cost of Electricity-Based Synthetic Fuels’, Germany.

KPMG | 53
© 2020 KPMG, an Australian partnership and a member firm of the KPMG network of independent member firms affiliated with KPMG International Cooperative (“KPMG International”), a Swiss entity. All rights reserved. The KPMG name and logo are registered trademarks or trademarks of KPMG International. Liability limited by a scheme approved under Professional Standards Legislation.
Document Classification: KPMG Confidential
7.2.4 Infrastructure Requirements
7.2.4.1 Efuels
The production of efuel requires large scale production facilities with sophisticated heating systems. Large volumes of electricity are required to produce biofuels, due to significant conversion losses.222 Sourcing the energy needed from renewable sources increases the need for large geographical areas for wind and solar farms.223
The relatively high energy density of efuels means they are compatible with existing energy infrastructure, limiting the level of new capital investment required. However, efuel manufacturing in NSW and Australia is relatively small, scaling up production will likely require the development of greenfield plants fitted with electrolysers, efuel holding and short-term storage capacity and catalysts to enable carbon-dioxide and hydrogen to react. Additional connecting water infrastructure will be needed to support water supply into facilities with integrated green hydrogen production capability.
7.2.4.2 Transportation
The transportation of biodiesel usually occurs by truck, rail or barge.224 There is therefore a need for production facilities to be located within proximity to rail or road networks. As mentioned previously, there is an opportunity to expand production of biofuel for the aviation industry given the interest and commitment from the sector. Since the Western Sydney Airport has not yet been developed, the Greenfield site provides a potential opportunity to establish infrastructure to produce SAF at the point of distribution.225
NSW is well placed to continue producing biofuels, since the Manildra Ethanol Plant in Nowra already produces approximately 68 per cent of ethanol in Australia.226 The planned development of the ethanol plant at Deniliquin, which would produce an additional 115 million litres of fuel grade ethanol annually, will contribute to NSW’s infrastructure to produce biofuels.227
7.3 Potential Opportunity Size Chemicals and synthetic fuels have a range of potential applications across household and industry. While these have not been explored exhaustively in this report, two key end use cases have been considered to illustrate the potential size and scale of the opportunity.
In 2015, ethanol blended fuel, which is 10 per cent ethanol, supplied around 12.1 per cent of total road transport fuel (or about 2,194 million litres of 18,070 million litres).228 This implies that around half of ethanol produced in Australia is used in other products and/or exported, given production capacity of 440 million litres annually in Australia, worth around $487.4 million annually. 229 230 If the ethanol blended fuel share of road transport fuel was to increase one percentage point (and production was similarly scaled up, assuming exports remained constant), this implies an increase in revenue of around $20.1 million per annum, and a decrease in petroleum imports of around $24 million.231
222 Agora Verkehrswende, Agora Energiewende and Frontier Economics, 2018, ‘The Future Cost of Electricity-Based Synthetic Fuels’.
223 Agora Verkehrswende, Agora Energiewende and Frontier Economics, 2018, ‘The Future Cost of Electricity-Based Synthetic Fuels’.
224 Biodiesel magazine, 2008, ‘Moving Biodiesel’, http://www.biodieselmagazine.com/articles/2049/moving-
biodiesel#:~:text=The%20three%20primary%20ways%20to,across%20land%20to%20major%20markets.
225 NSW Chief Scientist and Engineer, 2020, ‘NSW Decarbonisation Innovation Study, Scoping Paper’.
226 Rural Industries Research and Development Corporation, ‘Bioenergy markets: ethanol’, http://biomassproducer.com.au/markets/bioenergy-markets-in-
australia/ethanol/#.Xw_EiSgzY2y.
227 Farrell, R., 2017, Australia Biofuels Annual, USDA Foreign Agricultural Service.
228 Farrell, R., 2017, Australia Biofuels Annual, USDA Foreign Agricultural Service.
229 Farrell, R., 2017, Australia Biofuels Annual, USDA Foreign Agricultural Service.
230 Based on IPART’s assumed wholesale cost per litre of 110.4 cents, and 440 million litres produced; IPART, 2020, IPART Monitors the Retail and
Wholesale Market for Fuel Ethanol.
231 Based on the 2019 average price for gasoline and 2019 average AUD/USD exchange rate.

KPMG | 54
© 2020 KPMG, an Australian partnership and a member firm of the KPMG network of independent member firms affiliated with KPMG International Cooperative (“KPMG International”), a Swiss entity. All rights reserved. The KPMG name and logo are registered trademarks or trademarks of KPMG International. Liability limited by a scheme approved under Professional Standards Legislation.
Document Classification: KPMG Confidential
Sustainable aviation fuel is less than 0.1 per cent of total aviation fuel used globally, or around 15 million litres in 2018.232 The high price of sustainable aviation fuel compared to fossil jet fuel is a barrier to wider take up. However, the industry is committed to emissions reduction goals, in which sustainable aviation fuel is a key enabler. If the use of sustainable aviation fuel increased to 150 million litres by 2035 and NSW was able to supply 10 per cent of the global market, this may be worth around $22.5 million (assuming a price of $1.50 per litre).233 However, this estimated level of production and supply of sustainable synthetic aviation fuel would still only account for roughly one per cent of total aviation fuel consumption, indicating there are significant opportunities for continued growth to create new markets
While this analysis does not cover all potential applications of chemicals and synthetic fuels, it indicates that there is a significant opportunity for the production and use of chemicals and synthetic fuels in NSW, particularly to the extent that it can cost-effectively replace need for imported fuels with domestic production.
232 Le Feuvre, P., 18 March 2019, Are aviation biofuels ready for take off?, International Energy Agency. Accessed 16 July 2020.
233 Conventional jet fuel is projected to be $1.5 per litre in 2035, within the range of biofuel prices estimated. Hayward, J.A. et al., 2013, The economics of producing sustainable aviation fuel: a regional
case study in Queensland, Australia, Global Change Biology Bioenergy.

KPMG | 55
© 2020 KPMG, an Australian partnership and a member firm of the KPMG network of independent member firms affiliated with KPMG International Cooperative (“KPMG International”), a Swiss entity. All rights reserved. The KPMG name and logo are registered trademarks or trademarks of KPMG International. Liability limited by a scheme approved under Professional Standards Legislation.
Document Classification: KPMG Confidential
8 Transport and Logistics 8.1 Background Zero emissions road vehicles currently focus on two differing types of vehicle, namely battery electric vehicles (BEV) and fuel-cell electric vehicles (FCEV). Electric vehicles use electric motors for propulsion, which includes plug-in hybrid, BEVs and FCEVs.234 These vehicles have several existing and possible future applications across industry and private use.
There have been significant steps to decarbonise public transport in NSW in recent years, including electric trains and buses in Sydney. The most common types of electric vehicles are outlined in the table below.
Table 15: Electric vehicles by motor type.
Electric vehicle type Description
Plug-in hybrid electric vehicle (PHEV)
These vehicles contain both an internal combustion engine (ICE) and an electric motor so are not zero-emissions. The electric motor can be charged via an electrical plug, while the ICE requires conventional fuel. Our analysis and discussion below will not consider PHEVs, as they are not zero-emissions, however they may be considered by government and vehicle owners as a transition vehicle in some circumstances.
Battery electric vehicle (BEV)
BEVs rely solely on battery packs for the electric motors and have no ICE. Therefore, these require no conventional fuel and are charged via a charging point in the same way as a PHEV. Some BEV also recharge while operating using kinetic energy converted into electricity.
Fuel-cell electric vehicle (FCEV)
FCEVs rely on a fuel-cell rather than a battery pack to power its internal motor. Typically, fuel-cell motors require hydrogen (in addition to oxygen from the atmosphere) to drive a chemical reaction that generates energy for the motors.
Source: Automated and Zero Emission Vehicle Infrastructure Advice: Energy Impacts and Modelling, KPMG.
Electric vehicles are suitable for various purposes, including in industry, public transport and private vehicle use. The use of different types of electric vehicles is dependent on a number of factors, including:
• The driving range of existing vehicles on the market;
• The model varieties and their uses available on the market;
• Durability of vehicles, particularly in being proven across various applications;
• Conditions, including that H2 vehicles are more resilient to high ambient temperature conditions compared with BEV; and
234 Electric Vehicles, ARENA (12 July 2020).

KPMG | 56
© 2020 KPMG, an Australian partnership and a member firm of the KPMG network of independent member firms affiliated with KPMG International Cooperative (“KPMG International”), a Swiss entity. All rights reserved. The KPMG name and logo are registered trademarks or trademarks of KPMG International. Liability limited by a scheme approved under Professional Standards Legislation.
Document Classification: KPMG Confidential
• Cost-competitiveness of fuel inputs such as electricity and hydrogen.
Globally, BEVs currently account for a larger share of zero-emissions vehicles sold than FCEVs across most vehicle types, however, the future share across vehicle types and the potential emergence of new technologies is uncertain.
8.1.1 Passenger vehicles Australia has lagged other countries in the adoption of BEVs. In 2018, BEV sales in Australia totalled 2,216 and represented less than one per cent of the total market for new vehicles.235 In NSW, BEVs accounted for 2,274 of 6.6 million registered vehicles in 2019, an increase of 25 per cent on the previous year.236 Despite the relatively small share of total new vehicle sales and registration, demand for BEVs is expected to grow strongly in Australia and NSW, with BEV and PHEVs forecast to reach 615,000 in new vehicle sales nationally per year by 2030.237 New private BEV sales are expected to rise by four per cent by 2025, 21 per cent by 2030 and 73 per cent by 2040.238
FCEV development has progressed at a slower pace than BEVs and there are only three models available globally.239 While FCEVs may challenge BEVs due to their higher driving range and ability to use hydrogen as fuel directly,240 FCEVs are expected to become cost competitive for vehicles with longer-range (such as trucks, coaches and taxis) first.241 For smaller vehicles with short ranges, such as urban passenger cars, the battery required is relatively small meaning that BEV technologies will remain competitive.242
Table 16: Opportunity summary – Private electric vehicles in NSW
Consideration Observations Current NSW Maturity
Extent of current industry decarbonisation
The very low level of uptake of electric vehicles in NSW and Australia more broadly points to a significant opportunity to increase decarbonisation efforts at scale in the future. While FCEVs are not currently available in Australia, the ACT government (in partnership with Hyundai) committed to include FCEVs in their fleet in mid-2020. Prior to COVID-19, Hyundai was planning to release FCEVs into the Australian market in late 2020.
Readiness to leverage technology pathway(s) to decarbonisation
BEVs
With the ability to connect EVs to current conventional charging points, there are minimal technological barriers to BEVs. Further, as the electricity mix continues to shift to a greater level of renewables over time, the emissions associated with BEVs will continue to reduce.
FCEVs
There are relatively higher barriers in terms of FCEV uptake due to the need for investment in refuelling stations. Further, to enable FCEV uptake at scale, these requirements would be extensive.
235 State of Electric Vehicles, Electric Vehicle Council (August 2019).
236 Electric vehicles, Roads and Maritime.
237 Australian Electric Vehicle Market Study, Energeia (May 2018).
238 NSW Electric and Hybrid Vehicle Plan, Transport for NSW (2019).
239 Energeia, 2018, ‘Australian Electric Vehicle Market Study’.
240 Energeia, 2018, ‘Australian Electric Vehicle Market Study’.
241 Hydrogen Council, 2020, ‘Path to hydrogen competitiveness: A cost perspective’.
242 Hydrogen Council, 2020, ‘Path to hydrogen competitiveness: A cost perspective’.

KPMG | 57
© 2020 KPMG, an Australian partnership and a member firm of the KPMG network of independent member firms affiliated with KPMG International Cooperative (“KPMG International”), a Swiss entity. All rights reserved. The KPMG name and logo are registered trademarks or trademarks of KPMG International. Liability limited by a scheme approved under Professional Standards Legislation.
Document Classification: KPMG Confidential
Consideration Observations Current NSW Maturity
Sufficiency of existing industry infrastructure to leverage technology
BEVs
From a capacity point of view, existing electricity infrastructure is sufficient to enable greater uptake of BEVs. However, there are concerns around disturbances to local grid stability by fast charging hotspots. Controlled charging behaviour and smart chargers are preferable for this reason.
FCEVs
There is industry interest in establishing hydrogen refuelling stations in Australia, including:
• Australian company H2X aims to work with hydrogen gas producer Coregas to produce hybrid FCEV vehicles in Port Kembla. Coregas operates the largest merchant hydrogen plant in Australia at Port Kembla and built one of the only hydrogen refuelling stations in NSW, at Macquarie Park in Sydney.
• One in the ACT to support the ACT government’s FCEV fleet;
• A Hyundai station in North Ryde and an additional planned station in Western Sydney; and
• Toyota will establish one at their Altona facility to trial two FCEV forklifts in their Toyota Parts Centre. The Altona refuelling stations will also support the Toyota Mirai passenger vehicle trial in partnership with Melbourne’s Hobson Bay City Council.243
Key NSW regions The potential benefits of decarbonising private vehicles could be achieved state-wide, subject to uptake and cost competitiveness.
Timeframe for realisation
Decarbonisation of private vehicles is suggested to be at least a medium-term consideration given the relatively low current levels of uptake. Due to the different compatibility of BEVs and FCEVs with current technologies, there may be different time horizons associated with continued uptake and maturity at scale of these technologies in the private vehicle network. Further, in the case of FCEVs, there would need to be further consideration of the levers required to enable and incentivise investment in the requisite network infrastructure in terms of refuelling stations. However, some stakeholders believed that private FCEVs may be a more viable option in rural and regional areas due to ‘range anxiety’. The establishment of refuelling stations for other vehicles such as buses and heavy vehicles may have a knock-on effect of stimulating the private FCEV market.
Maturity key
Low or limited level
Some greater levels of maturity, however, some barriers remaining and/or current scale limited
Greater overall level of maturity and scalability
243 Toyota Partnering with Melbourne Council for Australian First Hydrogen FCEV Trials, Toyota (November 2018).

KPMG | 58
© 2020 KPMG, an Australian partnership and a member firm of the KPMG network of independent member firms affiliated with KPMG International Cooperative (“KPMG International”), a Swiss entity. All rights reserved. The KPMG name and logo are registered trademarks or trademarks of KPMG International. Liability limited by a scheme approved under Professional Standards Legislation.
Document Classification: KPMG Confidential
8.1.2 Buses The NSW Government Climate Change Policy framework sets an aspirational objective for NSW to achieve net zero emissions by 2050. Transport currently contributes 21% of the state’s annual greenhouse gas emissions. Decarbonising transport systems is critical to achieving the NSW Government’s net zero emissions objective.
A significant share of NSW’s bus assets are located in the Greater Sydney region to reflect its higher demand and population density. In 2019 alone, Opal linked bus services carried approximately 308.4 million individual passenger journeys.244 Based on available 2014-15 regional data from NSW Transport, bus services in regional NSW carried just 4.1 million individual passenger journeys.245
Currently, NSW bus services, both metropolitan and outer and regional, are largely operated using diesel fuels, with a number using other fuels such as LPG. The larger bus passenger shares carried by Sydney and metropolitan services indicates the adoption of decarbonisation technologies in these services is likely to have the greatest potential impact on reducing NSW’s bus transport industry’s emissions.
There is a range of opportunities to introduce decarbonisation technologies into NSW bus services to support the delivery of the government’s Net Zero commitments. Technologies, such as the adoption of FCEVs and BEVs, have the potential to improve the operational efficiency of on road transport via a reduction in the cost of fuel and power inputs and reductions in indirect maintenance costs associated with combustion engines or battery powered alternatives.
Globally there were 460,000 electric buses operating in 2018, an increase of 25 per cent on 2017 numbers. Battery electric vehicles account for 93 per cent of new electric bus registrations. China represents 99 per cent of the global market for electric buses.246
As part of the NSW Electric and Hybrid Vehicle Plan, the state government committed to integrating NSW’s first fully electric bus trial. The trial will test four battery electric buses from 2019 in Sydney’s Inner West with the aim to replace Sydney’s 8,000 diesel buses in the longer term.247 TfNSW has also sought additional expressions of interest from leaders in the energy, transport, and manufacturing and financial sectors to participates in trials of zero emissions buses and associated technologies.248 The adoption of electric buses internationally started in China and other countries have also transitioned their bus fleets to electricity. For example, Europe’s electric bus market increased by 48 per cent from 2017 to 2018.249 Electric buses are now estimated to make up 13 per cent of the total number of city buses worldwide.250
This section will consider the requirements and downstream economic benefits of FCEV adoption across the NSW bus network.
Table 17: Opportunity summary – NSW bus transport decarbonisation
Consideration Observations Current NSW Maturity
Extent of current industry decarbonisation
There are a number of pathways to decarbonise bus fleets across Australia, including through the use of FCEVs and BEVs. Some trialling of BEV technology has taken place in Nowra, Sydney Airport and Sydney’s Inner West. However, decarbonisation has not yet been achieved at scale.
244 Public Transport Patronage – Top Level Chart, Monthly Opal Trips, NSW Transport.
245 NSW and Sydney Transport Facts 2016, NSW Transport (28 April 2016).
246 Climateworks Australia (2019), ‘Submission to the inquiry into electric buses in regional and metropolitan public transport networks in New South
Wales’.
247 NSW Government Future Transport, 2019, ‘NSW Electric and Hybrid Vehicle Plan’.
248 Expressions of Interest sought for Zero Emission Bus Trials, TfNSW (4 May 2020).
249 Sustainable Bus, ‘Electric bus, main fleets and projects around the world’, https://www.sustainable-bus.com/electric-bus/electric-bus-public-transport-
main-fleets-projects-around-world/.
250 Sustainable Bus, ‘Electric bus, main fleets and projects around the world’, https://www.sustainable-bus.com/electric-bus/electric-bus-public-transport-
main-fleets-projects-around-world/.

KPMG | 59
© 2020 KPMG, an Australian partnership and a member firm of the KPMG network of independent member firms affiliated with KPMG International Cooperative (“KPMG International”), a Swiss entity. All rights reserved. The KPMG name and logo are registered trademarks or trademarks of KPMG International. Liability limited by a scheme approved under Professional Standards Legislation.
Document Classification: KPMG Confidential
Consideration Observations Current NSW Maturity
Readiness to leverage technology pathway(s) to decarbonisation
FCEVs
Hydrogen is a compatible fuel source for bus transport. Bus operators in NSW have not yet adopted FCEVs in commercial operations. Investment in FCEV bus fleets is required in addition to capital investment in hydrogen refuelling stations. The H2OzBus consortium is working towards agreement on feasibility, scope and funding with a view to deploying the 100 buses as a trial for more widespread roll-out.
BEVs (not considered in this report)
BEV buses also present a pathway to decarbonisation with the technology already widely used in several international locations. The NSW Government has a number of BEV bus trials underway or planned with sector leaders as part of its strategy to transition the entire public bus fleet to zero emissions.
Existing industry infrastructure
Bus services rely on the existing road network and no upgrades to the road network would be required to realise this opportunity. There would be a need to invest in re-fuelling centres and bus depots. However, there is the opportunity for these to be streamlined at strategic locations within the public transport network – a relatively lower expected investment than for the private vehicle network.
Key NSW regions Benefits are potentially realisable across all areas of NSW where bus transport activity currently occurs. However, there will likely be a need to prioritise consideration in the first instance to areas of higher geographic concentration of transport assets and passenger demand to target investment requirements and ensure benefits realisation. Based on TfNSW data, these journeys are primarily concentrated in the Greater Sydney region, with fewer services operating in regional areas of NSW. Consideration should also be given links between transport networks and existing and planned SAPs and intermodal hubs to centralise hydrogen production plants in these locations.
Timeframe for realisation
Decarbonisation across bus services has the potential to be achieved in the shorter term, depending on the extent of supporting infrastructure investment. Based on the available data, FCEV buses may become cost competitive in the short term. However, consideration will be required in terms of the level of investment required to support fleet replacements and development of refuelling stations to ensure investment and benefits realisation are targeted.
Maturity key
Low or limited level
Some greater levels of maturity, however, some barriers remaining and/or current scale limited
Greater overall level of maturity and scalability
8.1.3 Heavy vehicles Heavy vehicles are typically used for freight purposes, transporting bulk goods and commodities. Domestic freight is predominantly transported by road, accounting for approximately 75 per cent of

KPMG | 60
© 2020 KPMG, an Australian partnership and a member firm of the KPMG network of independent member firms affiliated with KPMG International Cooperative (“KPMG International”), a Swiss entity. All rights reserved. The KPMG name and logo are registered trademarks or trademarks of KPMG International. Liability limited by a scheme approved under Professional Standards Legislation.
Document Classification: KPMG Confidential
freight movement in Australia, using rigid and articulated trucks.251 Freight transport to and from air and sea terminals, as well as to their final destinations, is also often carried out by heavy vehicles.
Decarbonisation of the heavy freight vehicles can be supported through BEVs, PHEVs, or FCEVs. Each of these vehicle types requires different considerations around vehicle production costs, costs of fuel inputs, fuel efficiency, and supporting infrastructure. Of these, the use of hydrogen fuel cell technology for FCEV freight and heavy vehicles is considered a key opportunity given the reduced weight of the vehicle and the relatively higher specific energy of hydrogen compared to batteries.252
The Hydrogen Council estimates that FCEV medium and heavy-duty trucks may become cost comparable with BEVs by 2025.253 BEV alternatives remain competitive for light commercial vehicles that require smaller batteries. FCEV trucks are more fuel efficient than ICE vehicles and may become cost competitive with traditional vehicles by 2030.254 Hyundai Motors has recently committed to supplying 1,000 heavy duty FCEV trucks to the Swiss commercial vehicle market from 2019 to 2023.255
Table 18: Opportunity summary – NSW freight and heavy transport industry decarbonisation
Consideration Observations Current NSW Maturity
Extent of current industry decarbonisation
There are small scale uses of electric and FCEV trucks across Australia, however, these uses have not yet been achieved or rolled out cost competitively at scale to-date.
Readiness to leverage technology pathway(s) to decarbonisation
The NSW and Australian freight industries have yet to adopt FCEVs. Investment in FCEV truck fleets is required in addition to capital investment in hydrogen refuelling stations.
Existing industry infrastructure
The NSW freight network is supported by extensive road infrastructure linking key regions and productive centres with domestic markets and transport hubs. Investments would be required in fleet infrastructure and fuelling stations. However, there is the opportunity for these to be streamlined at strategic locations within the public transport network – a relatively lower expected investment than for the private vehicle network.
Key NSW regions Benefits are potentially realisable across all areas of NSW where bus transport activity currently occurs. However, there will likely be a need to prioritise consideration as to the strategic areas required. Given the importance of overall connectivity across the freight network in driving productivity, there would need to be consideration of the system impacts as an input to prioritising areas of potential investment.
Timeframe for realisation
Decarbonisation across heavy vehicles has the potential to be achieved in the short to medium term, depending on the extent of supporting infrastructure investment. Based on the available data, FCEV heavy vehicles may become cost competitive in the short to medium term. However, consideration will be required in terms of the level of investment required to support fleet
251 Freight and Supply Chains, Australian Government Department of Infrastructure, Transport, Regional Development and Communications, 2019,
Transport, Australian Government,
252 Fuelling the future of mobility: Hydrogen and fuel cell solutions for transportation, 2020, Deloitte China.
253 Hydrogen Council, 2020, ‘Path to hydrogen competitiveness: A cost perspective’.
254 Hydrogen Council, 2020, ‘Path to hydrogen competitiveness: A cost perspective’.
255 Hyundai Motors, ‘Hyundai Motor and H2 Energy to bring the world’s first fleet of fuel cell electric trucks into commercial operation’,
https://www.hyundai.co.nz/hyundai-motor-and-h2-energy-to-bring-the-world-s-first-fleet-of-fuel-cell-electric-trucks-into-commercial-operation-.

KPMG | 61
© 2020 KPMG, an Australian partnership and a member firm of the KPMG network of independent member firms affiliated with KPMG International Cooperative (“KPMG International”), a Swiss entity. All rights reserved. The KPMG name and logo are registered trademarks or trademarks of KPMG International. Liability limited by a scheme approved under Professional Standards Legislation.
Document Classification: KPMG Confidential
replacements and development of refuelling stations to ensure investment and benefits realisation are targeted.
Maturity key
Low or limited level
Some greater levels of maturity, however, some barriers remaining and/or current scale limited
Greater overall level of maturity and scalability
8.2 Considerations for Opportunity Realisation
8.2.1 Cost Competitiveness
8.2.1.1 BEV and FCEV private vehicles
While the purchase price for BEVs remains high compared to ICE, it was estimated that BEVs will start to achieve total cost of ownership parity by early 2020.256 One of the key contributors to the increased affordability will be the new and growing used BEV market.
BEVs are much cheaper to run and maintain than standard ICE vehicles. Financial savings on fuel costs can be as high as 70 per cent, while maintenance cost savings can reach 40 per cent. A typical car travelling 13,700 km a year would save an average of $1,000 (or $1,200 if the vehicle charges overnight on an off-peak electricity tariff rate).257
The Hydrogen Council estimates that mid-size FCEV cars will reach cost competitiveness around 2030 while smaller urban cars are not expected to meet cost parity and only reach similar cost levels to BEV in 2040.258 The Hydrogen Council therefore concludes that BEVs are better for urban private usage than FCEVs due to the shorter range requirement. FCEVs are more competitive for vehicles with heavier use and longer-range requirements, such as large passenger cars, SUVs or taxi fleets.259
8.2.1.2 FCEV buses
Key to hydrogen fuel cost and supply considerations for buses is the energy generation mix used to supply energy for its production and the infrastructure required to transport and store the fuel. The energy generation mix used during the production and supply process can have a significant impact on the final price of the hydrogen paid by bus operators.
Analysis by the Hydrogen Council suggests that FCEV buses are the most cost-efficient way to decarbonise long-range bus segments in the medium term, however in the short-term it will not cost less than battery buses.260 Fuel cell buses outcompete BEV buses when the range required exceeds 400km, however for buses with shorter range (such as urban buses), BEVs remains more competitive.261 It is estimated that FCEV buses for long-distance urban buses and coaches could outcompete battery in 2025 and ICE buses by 2030.262
256 The Driven, 2019, ‘Total cost of EVs in Australia may match petrol cars by next year’, https://thedriven.io/2019/04/30/total-cost-of-evs-in-australia-may-
match-petrol-cars-by-next-year/.
257 Transport for NSW, Roads and Maritime. 2020, ‘Electric vehicles’, https://www.rms.nsw.gov.au/roads/registration/get-nsw-registration/electric-
vehicles/index.html
258 Hydrogen Council, 2020, ‘Path to hydrogen competitiveness: A cost perspective’.
259 Hydrogen Council, 2020, ‘Path to hydrogen competitiveness: A cost perspective’.
260 Hydrogen Council, 2020, ‘Path to hydrogen competitiveness: A cost perspective’.
261 Hydrogen Council, 2020, ‘Path to hydrogen competitiveness: A cost perspective’.
262 Hydrogen Council, 2020, ‘Path to hydrogen competitiveness: A cost perspective’.

KPMG | 62
© 2020 KPMG, an Australian partnership and a member firm of the KPMG network of independent member firms affiliated with KPMG International Cooperative (“KPMG International”), a Swiss entity. All rights reserved. The KPMG name and logo are registered trademarks or trademarks of KPMG International. Liability limited by a scheme approved under Professional Standards Legislation.
Document Classification: KPMG Confidential
Figure 11: Costs associated with a potential hydrogen pathway for buses, comparing costs to the incumbent ($/ km) with sensitised cases (sensitivities only)
Source: calculation from the H2City Tool, utilising underlying data and assumptions from CSIRO unless otherwise explicitly stated (Appendix C: Technical Information – Hydrogen Cost Modelling).
Note: The above chart shows the costs associated with a potential bus application, expressed in $ / km. Some of the key assumptions supporting the above chart are:
• The demand for hydrogen regarding buses as an end use was calculated as stated in Section 3 on hydrogen technologies (annual state-based forecasts with an uptake curve);
• Production of hydrogen is from PEM electrolysers – the costs associated with this production are outlined as above in Figure 3;
• Costs have been included to reflect transporting produced hydrogen from a renewable energy zone to refuelling stations (by truck and trailer);
• Capital expenditure has been subject to a levelising process, reflecting the financing and repayment of CAPEX over time along with a cost of capital component.
• The sensitised high and low cases refer to changes in the assumptions to the central case, with respect to changes in the wholesale price of electricity and the projections to the capital costs of the electrolysers. Details regarding these changes is outlined in Section 3.
• These sensitised cases reflect sensitivities only – they are not indicators of an upper bound or a lower bound of the factors i.e. the factors could vary to the extent that the cost of hydrogen production could be above the sensitised higher case or below the sensitised lower case.
• The costs of the vehicles are highly sensitive to capital costs and the point of parity is heavily driven by the relationship between the capital and operating costs (including fuel) of the vehicles, as well as the mileage of the vehicles themselves.
Source: KPMG calculations as per H2C information utilising CSIRO underlying data and assumptions.
From the above figure with the key assumptions, it is possible that FCEV buses could potentially reach parity with ICE buses in the short term. Further information regarding the main assumptions supporting the cost of this calculation is available in Appendix C: Technical Information Hydrogen Cost Modelling.
8.2.1.3 FCEV trucks
Similar with the adoption and use of hydrogen fuel across bus fleets, key considerations to hydrogen fuel cost and supply is the generation used to supply energy for its production and the infrastructure required to transport and store the fuel.
Analysis by the Hydrogen Council suggests that fuel cell trucks are the lowest-cost way to decarbonise in the medium and heavy-duty segments, while BEV are less attractive due to the large size, weight penalty, cost of battery required and long recharging times.263
263 Hydrogen Council, 2020, ‘Path to hydrogen competitiveness: A cost perspective’.
0.0
0.5
1.0
1.520
2020
2120
2220
2320
2420
2520
2620
2720
2820
2920
3020
3120
3220
3320
3420
3520
3620
3720
3820
3920
4020
4120
4220
4320
4420
4520
4620
4720
4820
4920
50
$ / k
m
State Demand Case regarding hydrogen pathway for buses, comparing costs to incumbent, $ / km (all capex levelised) with sensitised cases (sensitivities only)
End user vehicle costs Transportation and Refuelling Station CostsHydrogen Production and Storage Bus incumbent cost - ICESensitised higher case Sensitised lower case
*Sensitised cases are sensitivities only – not upper or lower bounds.
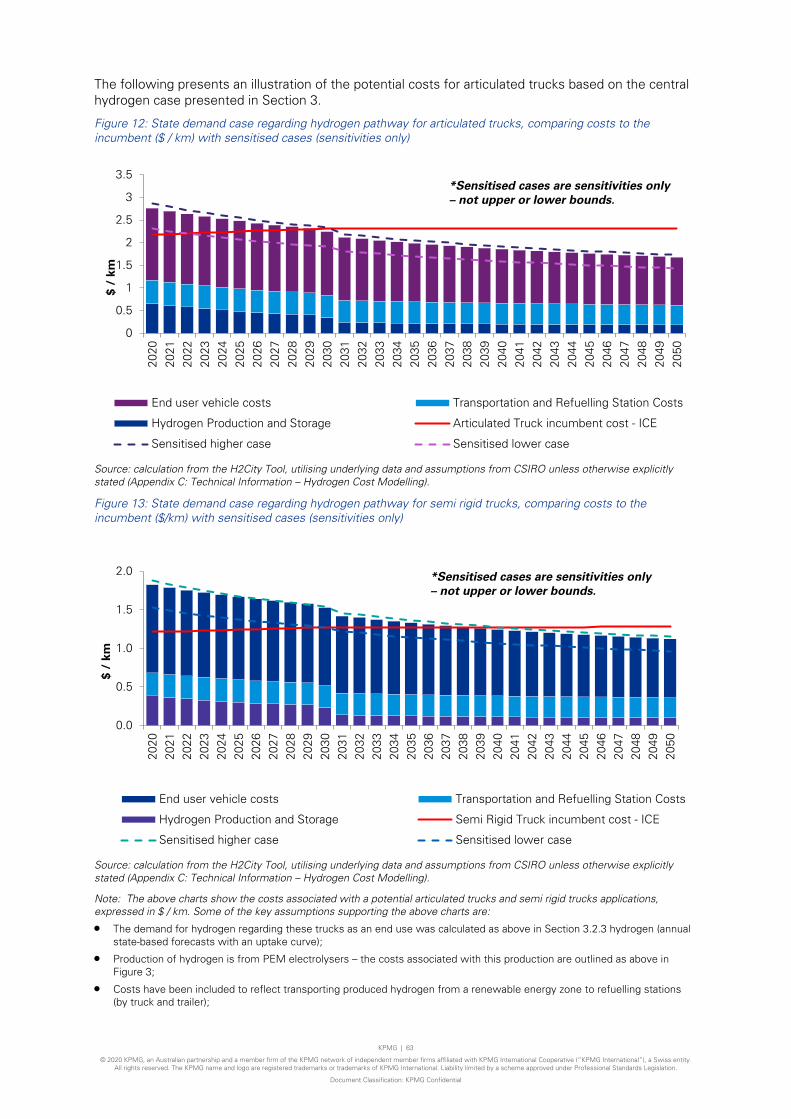
KPMG | 63
© 2020 KPMG, an Australian partnership and a member firm of the KPMG network of independent member firms affiliated with KPMG International Cooperative (“KPMG International”), a Swiss entity. All rights reserved. The KPMG name and logo are registered trademarks or trademarks of KPMG International. Liability limited by a scheme approved under Professional Standards Legislation.
Document Classification: KPMG Confidential
The following presents an illustration of the potential costs for articulated trucks based on the central hydrogen case presented in Section 3.
Figure 12: State demand case regarding hydrogen pathway for articulated trucks, comparing costs to the incumbent ($ / km) with sensitised cases (sensitivities only)
Source: calculation from the H2City Tool, utilising underlying data and assumptions from CSIRO unless otherwise explicitly stated (Appendix C: Technical Information – Hydrogen Cost Modelling).
Figure 13: State demand case regarding hydrogen pathway for semi rigid trucks, comparing costs to the incumbent ($/km) with sensitised cases (sensitivities only)
Source: calculation from the H2City Tool, utilising underlying data and assumptions from CSIRO unless otherwise explicitly stated (Appendix C: Technical Information – Hydrogen Cost Modelling).
Note: The above charts show the costs associated with a potential articulated trucks and semi rigid trucks applications, expressed in $ / km. Some of the key assumptions supporting the above charts are:
• The demand for hydrogen regarding these trucks as an end use was calculated as above in Section 3.2.3 hydrogen (annual state-based forecasts with an uptake curve);
• Production of hydrogen is from PEM electrolysers – the costs associated with this production are outlined as above in Figure 3;
• Costs have been included to reflect transporting produced hydrogen from a renewable energy zone to refuelling stations (by truck and trailer);
0
0.5
1
1.5
2
2.5
3
3.5
2020
2021
2022
2023
2024
2025
2026
2027
2028
2029
2030
2031
2032
2033
2034
2035
2036
2037
2038
2039
2040
2041
2042
2043
2044
2045
2046
2047
2048
2049
2050
$ /
km
End user vehicle costs Transportation and Refuelling Station Costs
Hydrogen Production and Storage Articulated Truck incumbent cost - ICE
Sensitised higher case Sensitised lower case
0.0
0.5
1.0
1.5
2.0
2020
2021
2022
2023
2024
2025
2026
2027
2028
2029
2030
2031
2032
2033
2034
2035
2036
2037
2038
2039
2040
2041
2042
2043
2044
2045
2046
2047
2048
2049
2050
$ /
km
End user vehicle costs Transportation and Refuelling Station Costs
Hydrogen Production and Storage Semi Rigid Truck incumbent cost - ICE
Sensitised higher case Sensitised lower case
*Sensitised cases are sensitivities only – not upper or lower bounds.
*Sensitised cases are sensitivities only – not upper or lower bounds.

KPMG | 64
© 2020 KPMG, an Australian partnership and a member firm of the KPMG network of independent member firms affiliated with KPMG International Cooperative (“KPMG International”), a Swiss entity. All rights reserved. The KPMG name and logo are registered trademarks or trademarks of KPMG International. Liability limited by a scheme approved under Professional Standards Legislation.
Document Classification: KPMG Confidential
• Capital expenditure has been subject to a levelising process, reflecting the financing and repayment of capex over time along with a cost of capital component.
• The sensitised high and low cases refer to changes in the assumptions to the central case, with respect to changes in the wholesale price of electricity and the projections to the capital costs of the electrolysers. Details regarding these changes are outlined in Section 3.
• These sensitised cases reflect sensitivities only – they are not indicators of an upper bound or a lower bound of the factors i.e. the factors could vary to the extent that the cost of hydrogen production could be above the sensitised higher case or below the sensitised lower case.
• The costs of the vehicles are highly sensitive to capital costs and the point of parity is heavily driven by the relationship between the capital and operating costs (including fuel) of the vehicles, as well as the mileage of the vehicles themselves.
Source: KPMG calculations as per H2C information utilising underlying CSIRO data and assumptions.
From the above figure with the key assumptions, heavy articulated trucks could potentially reach parity within 10 years and semi rigid trucks over 15 years. Further information regarding the main assumptions supporting the cost of this calculation is available in Appendix C: Technical Information Hydrogen Cost Modelling.
8.2.2 Strengths and Competitive Advantages There is a range of considerations in terms of strengths that can support each of the opportunities around buses, freight and private vehicles.
8.2.2.1 BEVs (Private vehicles, metropolitan buses and light trucks)
• BEVs are much cheaper to run and maintain than standard ICE vehicles.264
• Vehicle owners may also benefit from enhanced flexibility if charging points are available near places of work, key passenger routes and commercial loading and depot locations as well as council areas and shopping centre car parks.
• Charging at home or onsite with off peak energy prices will potentially allow car owners to provide extra energy back to the home or sell back to the grid during periods of higher demand.
• While small, there is an existing distribution and sales presence of BEVs in Australia, adding growing convenience for BEV owners.
8.2.2.2 FCEVs (All)
• FCEV engines are more tolerant of harsh conditions, such as temperature and heat on inland highways and freight and long-haul bus routes and can therefore be expected to have a longer operating lifetimes compared to batteries. This can be particularly important given the summer high temperatures that can be reached in regional areas of NSW.
• Production is significantly cleaner due to very low requirements on raw material inputs compared to the higher level of raw materials needed for combustion engines or batteries. This is evident for BEVs where heavy metals such as lithium and cobalt are required during production and whose extraction, processing and utilisation are water and energy intensive. This is particularly important given NSW’s low lithium deposits, supporting the development of local fuel cell production plants as opposed to locally manufactured batteries for BEVs.
• Lower raw material input requirements of FCEVs make them more economically attractive for end-of-life processing and recycling, reducing costs, the quantity of materials entering processing and the high costs and challenges associated with processing the toxic remains of batteries that have reached their end-use.265
Building on the above, there are further strengths specifically related to the potential to decarbonise the NSW bus and road freight networks.
264 The cost of electricity, including consideration for increased renewable electricity generation in the future, may or may not be material in determining the
attractiveness of BEVs for private vehicle owners. A number of other factors, including maintenance costs and price of BEVs themselves may be more
influential,
265 Lithium battery recycling in Australia: Current status and opportunities for developing a new industry, 2019, CSIRO.

KPMG | 65
© 2020 KPMG, an Australian partnership and a member firm of the KPMG network of independent member firms affiliated with KPMG International Cooperative (“KPMG International”), a Swiss entity. All rights reserved. The KPMG name and logo are registered trademarks or trademarks of KPMG International. Liability limited by a scheme approved under Professional Standards Legislation.
Document Classification: KPMG Confidential
• The level of investment required to decarbonise the NSW bus and freight network is relatively limited compared to that required across other industries across the state.266 Further, given the areas of high geographic concentration of transport assets across NSW, there is potential for prioritisation of investment and projects to accelerate decarbonisation for high demand services.267
• Relatively limited infrastructure upgrades (e.g. hydrogen fuelling stations) would be required to support buses and heavy freight compared with private vehicles. For example, fuelling stations could be located along key transport routes such as highways and metropolitan arterial roads, compared with a relatively larger and more distributed network for private FCEVs.268 For example, hydrogen fuelling stations can be placed along the key Sydney-Melbourne, Sydney-Brisbane and Melbourne-Brisbane freight routes at locations that are considerate of heavy vehicle fuel range and other location based factors such as proximity to transport hubs and, zoning restrictions and regulations. Dedicated fuelling stations for buses and trucks (outside of depots and transport terminals) may also be fitted to support private passenger vehicles fuelling points into the future.
• There are collocation opportunities with other key infrastructure. Destinations for freight tend to be concentrated around freight and logistics-intensive precincts in cities, providing a clear option for the collocation of hydrogen fuel production and storage facilities and hydrogen fuelling stations at journey start or end points, such as key aerial, rail and sea ports that have existing freight and logistics infrastructure.269 Similarly, bus depots can be retrofitted or collocated with hydrogen refuelling and storage infrastructure.
Comparatively, it would be expected that there would be relatively high costs associated with achieving this transition at scale for private vehicles.
8.2.3 Barriers The key barriers relate to the nature and scale of infrastructure investment required to achieve the transition across different modes of transport.
8.2.3.1 BEVs (Private vehicles, metropolitan buses and light trucks)
Public, private and commercial uptake of BEVs in NSW is largely limited by cost, range and infrastructure barriers:
• There are significantly fewer BEV models than ICE models available in Australia. In August 2019, there were only nine BEV models available which ran exclusively on an electric-powered battery.270
• BEVs come at a significantly higher market price than conventional ICE vehicles, diesel fuel vehicles, and most cases, PHEVs. For comparison, Renault ZOE, a small hatchback BEV, became available for sale in Australia with a price of $42,470. By comparison, a base model petrol-fuelled Renault Cleo hatchback retails in Australia for approximately $16,000.271 Included in the cost of BEVs for some vehicle owners is the cost of household installed charging points. While some vehicles simply plug into a standard wall socket, this may not be the case for all BEV models.
• Recharging infrastructure does not yet have enough capacity to support a large number of registered BEVs. This presents a competitive disadvantage for BEVs compared to ICE vehicles necessitating planned investment and initiatives to increase recharging capacity. In NSW, there are approximately 300 public charging points for electric and plug-in vehicles (excluding those available on private car parks, shopping centres and households). Many of these charging points are in metropolitan areas of NSW, limiting regional uptake of BEVs. The IEA has recommended a
266 Decarbonisation of transport: Options and challenges, 2019, the European Academies’ Science Advisory Council.
267 Public Transport Patronage – Top Level Chart, Last updated June 2020, Transport for NSW.
268 The Hydrogen Economy: Opportunities, Costs, Barriers, and R&D Needs, 2004, The National Academies of Sciences, Engineering and Medicine.
269 Hydrogen as a Transport Fuel: Location options for a freight-based initial deployment of hydrogen refuelling stations, 2019, Council of Australian
Governments Energy Council.
270 Budget Direct, ‘Electric cars available in Australia: 2020 Guide’, https://www.budgetdirect.com.au/blog/electric-vehicles-available-in-australia.html.
271 Automated and Zero Emission Vehicle Infrastructure Advice: Energy Impacts and Modelling, KPMG (9 July 2019).
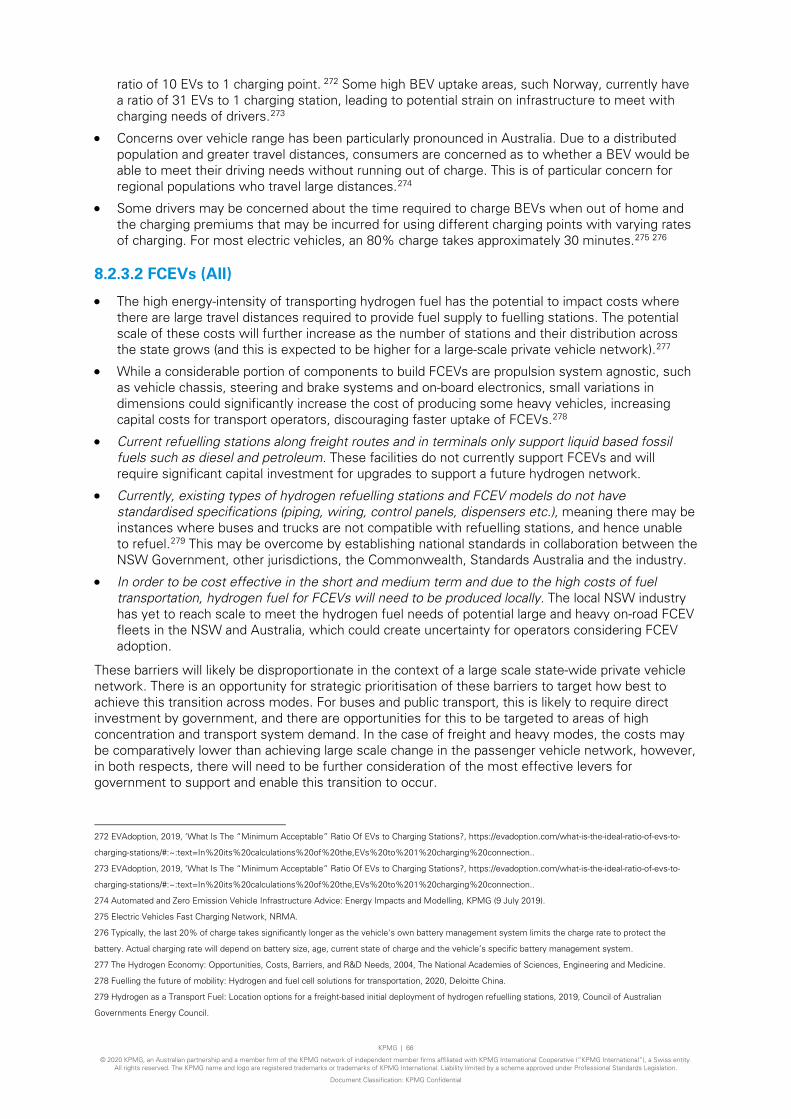
KPMG | 66
© 2020 KPMG, an Australian partnership and a member firm of the KPMG network of independent member firms affiliated with KPMG International Cooperative (“KPMG International”), a Swiss entity. All rights reserved. The KPMG name and logo are registered trademarks or trademarks of KPMG International. Liability limited by a scheme approved under Professional Standards Legislation.
Document Classification: KPMG Confidential
ratio of 10 EVs to 1 charging point. 272 Some high BEV uptake areas, such Norway, currently have a ratio of 31 EVs to 1 charging station, leading to potential strain on infrastructure to meet with charging needs of drivers.273
• Concerns over vehicle range has been particularly pronounced in Australia. Due to a distributed population and greater travel distances, consumers are concerned as to whether a BEV would be able to meet their driving needs without running out of charge. This is of particular concern for regional populations who travel large distances.274
• Some drivers may be concerned about the time required to charge BEVs when out of home and the charging premiums that may be incurred for using different charging points with varying rates of charging. For most electric vehicles, an 80% charge takes approximately 30 minutes.275 276
8.2.3.2 FCEVs (All)
• The high energy-intensity of transporting hydrogen fuel has the potential to impact costs where there are large travel distances required to provide fuel supply to fuelling stations. The potential scale of these costs will further increase as the number of stations and their distribution across the state grows (and this is expected to be higher for a large-scale private vehicle network).277
• While a considerable portion of components to build FCEVs are propulsion system agnostic, such as vehicle chassis, steering and brake systems and on-board electronics, small variations in dimensions could significantly increase the cost of producing some heavy vehicles, increasing capital costs for transport operators, discouraging faster uptake of FCEVs.278
• Current refuelling stations along freight routes and in terminals only support liquid based fossil fuels such as diesel and petroleum. These facilities do not currently support FCEVs and will require significant capital investment for upgrades to support a future hydrogen network.
• Currently, existing types of hydrogen refuelling stations and FCEV models do not have standardised specifications (piping, wiring, control panels, dispensers etc.), meaning there may be instances where buses and trucks are not compatible with refuelling stations, and hence unable to refuel.279 This may be overcome by establishing national standards in collaboration between the NSW Government, other jurisdictions, the Commonwealth, Standards Australia and the industry.
• In order to be cost effective in the short and medium term and due to the high costs of fuel transportation, hydrogen fuel for FCEVs will need to be produced locally. The local NSW industry has yet to reach scale to meet the hydrogen fuel needs of potential large and heavy on-road FCEV fleets in the NSW and Australia, which could create uncertainty for operators considering FCEV adoption.
These barriers will likely be disproportionate in the context of a large scale state-wide private vehicle network. There is an opportunity for strategic prioritisation of these barriers to target how best to achieve this transition across modes. For buses and public transport, this is likely to require direct investment by government, and there are opportunities for this to be targeted to areas of high concentration and transport system demand. In the case of freight and heavy modes, the costs may be comparatively lower than achieving large scale change in the passenger vehicle network, however, in both respects, there will need to be further consideration of the most effective levers for government to support and enable this transition to occur.
272 EVAdoption, 2019, ‘What Is The “Minimum Acceptable” Ratio Of EVs to Charging Stations?, https://evadoption.com/what-is-the-ideal-ratio-of-evs-to-
charging-stations/#:~:text=In%20its%20calculations%20of%20the,EVs%20to%201%20charging%20connection..
273 EVAdoption, 2019, ‘What Is The “Minimum Acceptable” Ratio Of EVs to Charging Stations?, https://evadoption.com/what-is-the-ideal-ratio-of-evs-to-
charging-stations/#:~:text=In%20its%20calculations%20of%20the,EVs%20to%201%20charging%20connection..
274 Automated and Zero Emission Vehicle Infrastructure Advice: Energy Impacts and Modelling, KPMG (9 July 2019).
275 Electric Vehicles Fast Charging Network, NRMA.
276 Typically, the last 20% of charge takes significantly longer as the vehicle's own battery management system limits the charge rate to protect the
battery. Actual charging rate will depend on battery size, age, current state of charge and the vehicle’s specific battery management system.
277 The Hydrogen Economy: Opportunities, Costs, Barriers, and R&D Needs, 2004, The National Academies of Sciences, Engineering and Medicine.
278 Fuelling the future of mobility: Hydrogen and fuel cell solutions for transportation, 2020, Deloitte China.
279 Hydrogen as a Transport Fuel: Location options for a freight-based initial deployment of hydrogen refuelling stations, 2019, Council of Australian
Governments Energy Council.

KPMG | 67
© 2020 KPMG, an Australian partnership and a member firm of the KPMG network of independent member firms affiliated with KPMG International Cooperative (“KPMG International”), a Swiss entity. All rights reserved. The KPMG name and logo are registered trademarks or trademarks of KPMG International. Liability limited by a scheme approved under Professional Standards Legislation.
Document Classification: KPMG Confidential
8.2.4 Infrastructure Requirements The nature of the infrastructure requirements and considerations may vary according to location in metropolitan and regional NSW.
8.2.4.1 BEV (Private vehicles, metropolitan buses and light trucks)
Private use of BEV is partially dependant on the availability of public and private fast charging infrastructure. This includes charging located:
• Near road-side parking;
• In privately owned car parks and shopping centres;
• Any required installation of in-house charging points; and
• At light commercial truck and bus depots.
Furthermore, it is necessary to consider the availability of charging infrastructure that is specially designed for different manufacturers. For example, Tesla use their own chargers which may require other BEVs to use an adaptor for their charging stations.
The NRMA has developed its Electric Vehicle Fast Charging Network of more than 40 stations dispersed across NSW.280 In addition to these, there are hundreds of charging points dispersed across NSW, particularly in Sydney and metropolitan areas. These charging points are either:
• Public stations – installed by business or government; and
• High power stations – such as those operated by the NRMA providing fast charge capability.281
Vehicle compatibility with charging points at different stations may vary according to the vehicle model and charge point socket type. Standardised fast charging stations will need to be developed across the state to enable use by various vehicle owners. Further downstream infrastructure consideration may need to be made for the safe recycling and disposal of battery components.
The infrastructure requirements are greater for a larger number of registered BEV passenger vehicles due to the demand for charging points. This is less of an issue for metropolitan buses or light commercial trucks which can have dedicated charging infrastructure installed at existing depots and refuelling locations.
8.2.4.2 FCEVs (All)
The key infrastructure requirements and consideration for the use of FCEVs relate to the standardisation and collocation of fuel production plants with key transport and logistics hubs, such as bus depots and freight terminals.
• The planning, regulatory and investment requirements for the construction of hydrogen refuelling stations, including the use of standardised refuelling stations and FCEV fuel injection design;282
• A mixture of production collocated with delivery sites and hydrogen transported via road networks to refuelling stations will be required to support wider adoption of FCEVs by transport operators. Due to current limitations around the high energy intensity and spatial requirements of transporting and storing hydrogen fuel, collocating major production and refuelling facilities will support reduction in the price of hydrogen fuel for end-users, such as freight operators. Further investment in technology will be required however, to reduce the costs associated with unavoidable fuel transport to refuelling stations located along long intrastate and interstate routes such as at Wagga Wagga and Albury which are located on or near major transit highways.
• Hydrogen fuel transport and storage infrastructure will be required to support FCEV transport operators. Hydrogen fuel transport and storage requires significant levels of energy to ensure fuel
280 Electric Vehicle Fast Charging Network, NRMA.
281 Mapped: Electric Car Charging Stations & Locations in Australia, Drive Zero.
282 Hydrogen as a Transport Fuel: Location options for a freight-based initial deployment of hydrogen refuelling stations, 2019, Council of Australian
Governments Energy Council.

KPMG | 68
© 2020 KPMG, an Australian partnership and a member firm of the KPMG network of independent member firms affiliated with KPMG International Cooperative (“KPMG International”), a Swiss entity. All rights reserved. The KPMG name and logo are registered trademarks or trademarks of KPMG International. Liability limited by a scheme approved under Professional Standards Legislation.
Document Classification: KPMG Confidential
is at cold enough temperatures to enable transport and storage. Further technology solutions will be necessary to reduce high energy use and minimise fugitive fuel loss.
Similar to above, the key consideration is associated with the extent of infrastructure required to achieve change at scale across buses, freight and heavy modes (relatively more targeted) compared to private network (relatively more significant). There will need to be further consideration by government of the most appropriate levers to support and enable the required level of investment and uptake.
8.3 Potential Opportunity Size
8.3.1 Passenger vehicles In 2017-18, more than 4.2 million passenger vehicles in NSW travelled approximately 54 billion kilometres, with an average of 12,627 kilometres travelled per vehicle per year.283 In the same year, it is estimated vehicle owners collectively spent nearly $18 billion on vehicle operating costs, with the average estimated annual operating costs for an ICE passenger vehicle in NSW was $4,205.284
BEVs have lower vehicle operating costs, inclusive of maintenance and charging. Based on the average kilometres travelled by a conventional passenger vehicle in NSW, the operating costs for a private BEV is estimated to $2,118 in 2018.285 Based on these figures, for every additional one per cent share BEV of registered passenger vehicles in NSW, there could be savings of up to $89.3 million per annum.286 287 The private savings of BEV ownership can be increased if the BEV is charged during off-peak times and/or using a privately owned solar installation, such as a household solar unit. However, under the current and near-term electricity generation mix, off-peak charging may be reliant on the use of coal powered generation if charging is taking place in the absence of any small or utility scale electricity storage.
8.3.2 FCEV buses Across NSW in 2017-18, buses travelled a total of 628 million kilometres including public routes (258 million), dedicated school bus (148 million), charter (111 million) and other (111 million) purposes. Of this, urban and other areas of regional NSW account for approximately 292.6 million kilometres, or 46.6 per cent, of total bus service kilometres travelled.288 In 2017-18, it is estimated that the total
283 Survey of Motor Vehicle Use, Australia, 12 months ended 30 June 2018 (released 20 March 2019).
284 Based on the total kilometres travelled in NSW by registered passenger vehicles and total number of registered vehicles in NSW (ABS Survey of Motor
Vehicle Use, 2017-18), assuming the average passenger vehicle is a medium sized vehicle with a vehicle operating cost of $0.33/km using the following
operating parameters: Speed (km/hour) = 50km/hour, International Roughness Index (IRI) = 3, NAASRA Roughness Meter (NRM) = 78; Gradient = 6 per
cent; Curvature = Straight (20 degrees / km) (TfNSW Economic Parameter Values, 2020). Vehicle operating costs are based on the TfNSW recommendation
to use the rural Australian Transport Assessment and Planning (ATAP) Guidelines fuel consumption model as presented in Australian Transport Assessment
and Planning PV2 Road Parameter Values (2016). (Principles and Guidelines for Economic Appraisal of Transport Investment and Initiatives, NSW Treasury,
June 2018).
285 Based on the total kilometres travelled in NSW by registered passenger vehicles and total number of registered vehicles in NSW (ABS Survey of Motor
Vehicle Use, 2017-18), assuming the average passenger BEV has a charging cost of $0.14/km and an average of $350 in maintenance and servicing costs
per year (Mythbusting, About Electric Vehicles, Electric Vehicle Council).
286 Based on the total kilometres travelled in NSW by registered passenger vehicles and total number of registered vehicles in NSW (ABS Survey of Motor
Vehicle Use, 2017-18), assuming the average passenger vehicle is a medium sized vehicle with a vehicle operating cost of $0.33/km (TfNSW Economic
Parameter Values, 2020) and average passenger BEV has a charging cost of $0.14/km and an average of $350 in maintenance and servicing costs per year
(Mythbusting, About Electric Vehicles, Electric Vehicle Council).
287 Estimates are based on the total number of vehicles and average kilometres travelled by passenger vehicles in 2017-18 (ABS, Survey of Motor Vehicle
Use, Australia, 12 months ended 30 June 2018). Future benefits realised are likely to be larger than presented in this report once growth in the total number
of passenger vehicles and/or average kilometres travelled are accounted for.
288 Survey of Motor Vehicle Use, Australia, 12 months ended 30 June 2018 (released 20 March 2019).

KPMG | 69
© 2020 KPMG, an Australian partnership and a member firm of the KPMG network of independent member firms affiliated with KPMG International Cooperative (“KPMG International”), a Swiss entity. All rights reserved. The KPMG name and logo are registered trademarks or trademarks of KPMG International. Liability limited by a scheme approved under Professional Standards Legislation.
Document Classification: KPMG Confidential
operating costs for the bus networks across NSW were $710.7 million, in today’s dollars, with regional NSW accounting for approximately $261.4 million.289
In 2020, the cost per kilometre of operating an internal combustion engine (ICE) bus is estimated at $1.08/km, compared to $1.13/km for hydrogen fuelled FCEV buses.290 291 Hydrogen fuelled buses are expected to become operationally more cost effective per kilometre by 2022, while the operating costs of ICE buses are expected to increase gradually over time.292 This provides incentives for the government to invest in the adoption of hydrogen fuelled FCEVs into the public bus fleet, which is likely to be followed by private bus operators, if operating environment requirements, such as those mentioned in the infrastructure requirements section above, are met.
Based on the analysis outlined above, the potential operating costs of hydrogen fuelled buses could be $0.78/km by 2030, in today’s dollars. Based on this cost level, the approximate total kilometres travelled by bus services in NSW in 2017-18, total bus operating costs is estimated to be $495.6 million in 2030, or approximately $234.8 million lower than ICE bus operating costs in 2030.293 294
8.3.3 FCEV trucks Around 75 per cent of NSW freight is transported via the road network.295 In the year to June 2018, rigid and articulated trucks travelled a total of 4,588 million kilometres transporting freight across NSW.296 The total vehicle operating costs of rigid and articulated freight in NSW are estimated to be around $7,143 billion annually in today’s dollars.297
Like buses, there is potential for hydrogen fuelled FCEVs to become a commercially viable for freight operators in the short to medium term. Table 18 below shows the vehicle operating cost per kilometre for ICE and FCEV freight vehicles. In 2020, the operating costs of both FCEV articulated and semi-rigid freight vehicles were significantly higher per kilometre than their ICE counterparts.298 299
Table 19: Potential future operating costs for ICE and FCEV freight vehicles and cost competitive FCEV operating costs and years for articulated and semi-rigid trucks
Freight and engine type Operating cost in 2020 ($/km)
Hydrogen cost competitiveness ($/km)
ICE Articulated trucks $2.18/km $2.31/km (2030)
FCEV Articulated trucks $2.76/km $2.24/km (2030)
ICE Semi-rigid trucks $1.21/km $1.28/km (2039)
FCEV Semi-rigid trucks $1.83/km $1.26/km (2039)
289 Based on the respective shares of kilometres travelled in NSW by registered heavy buses operating in capital city, other urban areas, other areas,
multiplied by the total kilometres travelled by heavy buses (from the ABS 2019 Survey of Motor Vehicle Use (12 months to 30 June 2018)), multiplied by
vehicle operating costs from KPMG calculations based on the data and information sources identified.
290 KPMG calculations based on the data and information sources identified.
291 The calculations for the operating costs of hydrogen fuelled buses are inclusive of hydrogen production and storage, transportation and refuelling station,
and end-user vehicle costs.
292 KPMG calculations based on the data and information sources identified.
293 KPMG calculations based on the data and information sources identified.
294 Estimates are based on the total number of buses and average kilometres travelled by buses in 2017-18 (ABS, Survey of Motor Vehicle Use, Australia,
12 months ended 30 June 2018). Future benefits realised are likely to be larger than presented in this report once growth in the total number of buses and/or
average kilometres travelled are accounted for.
295 Australian Government Department of Infrastructure, Transport, Regional Development and Communications, 2019, Transport, Australian Government,
296 ABS, 2019; Survey of Motor Vehicle Use (12 months to 30 June 2018). Calculated based on the laden distance travelled for work purposes, and average
load weights reported by respondents.
297 KPMG calculations based on the data and information sources identified.
298 KPMG calculations based on the data and information sources identified.
299 The calculations for the operating costs of FCEV trucks are inclusive of hydrogen production and storage, transportation and refuelling station, and end-
user vehicle costs.

KPMG | 70
© 2020 KPMG, an Australian partnership and a member firm of the KPMG network of independent member firms affiliated with KPMG International Cooperative (“KPMG International”), a Swiss entity. All rights reserved. The KPMG name and logo are registered trademarks or trademarks of KPMG International. Liability limited by a scheme approved under Professional Standards Legislation.
Document Classification: KPMG Confidential
Source: KPMG calculations.
Based on the central hydrogen cost modelled and the assumptions underpinning the modelling, FCEVs could become cost competitive for articulated freight trucks by the year 2030, and 2039 for semi-rigid freight trucks.300 There are opportunities for articulated truck operators to adopt FCEVs within the next decade to, particularly when considering the cost per kilometre of operating ICE articulated trucks is expected to gradually increase over time and beyond 2030.
Based on an estimated future operating cost of FCEV articulated trucks of $2.24/km and the approximate total kilometres travelled by articulated trucks in NSW in 2017-18, total annual FCEV articulated truck operating costs in NSW are estimated to be around $3.6 billion in 2030, in today’s dollars, or approximately $103.1 million lower than the operating costs of ICE articulated trucks in the same year.301 302
Similarly, by 2039, the potential future operating of FCEV semi-rigid trucks could be $1.26/km. Based on the approximate total kilometres travelled by semi-rigid trucks in NSW in 2017-18, total annual FCEV semi-rigid truck operating costs in NSW are estimated to be around $3.8 billion 2039, in today’s dollars, or approximately $42.6 million lower, than the operating costs of ICE semi-rigid truck in the same year.303 304
The cost-effectiveness advantages of FCEV articulated and semi-rigid trucks relative to their ICE counterparts is expected to grow annually beyond reaching their respective cost competitive years in 2030 and 2039 respectively. Table 19 below shows the projected growth in the cost competitiveness of FCEV articulated and semi-rigid trucks compared to their respect ICE counterparts.305
Table 20: Cost competitive advantage of FCEV articulated and semi-rigid trucks 1, 5 and 10 years after achieving cost competitiveness.
Vehicle type Cost competitive year +1 ($m)
Cost competitive year +5 ($m)
Cost competitive year +10 ($m)
ICE Articulated trucks $3,717.0 $3,727.8 $3,718.6
FCEV Articulated trucks $3,402.5 $3,197.1 $2,989.3
FCEV cost advantage (+/-) $313.5 $530.7 $729.2
ICE Semi-rigid trucks $3,819.2 $3,821.7 $3,829.0
FCEV Semi-rigid trucks $3,728.7 $3,564.9 $3,393.2
FCEV cost advantage (+/-) $90.5 $256.8 $435.8
Source: KPMG calculations.
300 KPMG calculations.
301 KPMG calculations.
302 Estimates are based on the total number of articulated trucks and average kilometres travelled by articulated trucks in 2017-18 (ABS, Survey of Motor Vehicle Use, Australia, 12 months ended 30
June 2018). Future benefits realised are likely to be larger than presented in this report once growth in the total number of articulated trucks and/or average kilometres travelled are accounted for.
303 KPMG calculations.
304 Estimates are based on the total number of semi-rigid trucks and average kilometres travelled by semi-rigid trucks in 2017-18 (ABS, Survey of Motor
Vehicle Use, Australia, 12 months ended 30 June 2018). Future benefits realised are likely to be larger than presented in this report once growth in the total
number of semi-rigid trucks and/or average kilometres travelled are accounted for.
305 Estimates are based on the total number of articulated and semi-rigid trucks and average kilometres travelled in 2017-18 (ABS, Survey of Motor Vehicle
Use, Australia, 12 months ended 30 June 2018). Future benefits realised are likely to be larger than presented in this report once growth in the total number
of articulated and semi-rigid trucks and/or average kilometres travelled are accounted for.

KPMG | 71
© 2020 KPMG, an Australian partnership and a member firm of the KPMG network of independent member firms affiliated with KPMG International Cooperative (“KPMG International”), a Swiss entity. All rights reserved. The KPMG name and logo are registered trademarks or trademarks of KPMG International. Liability limited by a scheme approved under Professional Standards Legislation.
Document Classification: KPMG Confidential
9 Controlled Environmental Horticulture 9.1 Background Horticulture is one of Australia’s largest agricultural sectors, after livestock and broad care crops, with an estimated gross value of production of $9.1 billion and employing over 67,000 people. However, controlled environmental horticulture (CEH), including glasshouse, undercover and protected cropping, produces a relatively small share of horticulture output, accounting for $1.3 billion of national production and around 10,000 of the horticulture workforce in 2013.306
CEH is a sophisticated technology-based approach to agriculture where producers are directly able to control the conditions in which they grow produce. CEH combines high technology greenhouses with hydroponic (soil-less) growing systems. It can allow producers to more effectively optimise growing conditions, using technology such as hydroponics, and maximise output.307 These approaches often involve technology intensive systems integrated within a range of facilities, and range from common practice greenhouses and shade houses through to more sophisticated systems such as stacked vertical farming and integrated horticulture and aquaculture systems.
CEH is best suited to the production of fast-growing foods, such as leafy greens (salad and herb products), mushrooms, tomatoes, some berries, and integrated fish aquaculture. Other food products, such as perennial crops, broad acre crops (grains and cereals) and tree crops (nut and fruit varieties) are not as well suited for production in CEH due to their typical longer growth periods and greater scale required for viable production.
CEH is distinct from broad-acre farming and is a fully integrated controlled system that enables consistent and reliable control of the growing environment and effectively management of nutrition, pests and diseases in crops.308 The key benefits to CEH production methods include:
• The use of technologies, such as lighting, temperature and water irrigations systems to enable year-round production, regardless of external environmental conditions;
• Mitigating the risk of variable climatic conditions experienced in typical horticulture operations (storms, wind, hail, frost etc.). Depending on the product and risk this means that it could be viable to transition traditional horticulture operations to protected cropping given increasing climate variability.
306 Hadley, D., Controlled Environmental Horticulture Industry in Potential in NSW, University of New England (September 2017).
307 Benke, K. and Tomkins, B., Future food-production systems: vertical farming and controlled-environment agriculture Sustainability: Science, Practice and
Policy (12 July 2017)
308 Protect cropping, Horticulture, Department of Primary Industries.

KPMG | 72
© 2020 KPMG, an Australian partnership and a member firm of the KPMG network of independent member firms affiliated with KPMG International Cooperative (“KPMG International”), a Swiss entity. All rights reserved. The KPMG name and logo are registered trademarks or trademarks of KPMG International. Liability limited by a scheme approved under Professional Standards Legislation.
Document Classification: KPMG Confidential
• Technologies allow growing conditions to be optimised to allow for significantly greater crop yields, reducing input cost per unit of production;309
• Water irrigation, capture and recycling systems enable significant efficiencies in water use to be achieved, allowing CEH producers to reduce strains on water supply and operate in water scarce environments.310 This is particularly important for the resilience of the NSW agricultural sector as the state manages water scarcity and supply issues and future challenges arising from climate change.
• CEH facilities also draw on a variety of inputs for production, including renewable energy generation, fertilisers and bio waste (usually an internally source by-product) and water from nearby reservoirs or recycled water waste or runoff from other industries, reducing input costs and contributing to the circular economy.
Despite the above benefits, CEH facilities have high energy requirements, particularly larger facilities. For CEH operations primarily using electricity, electricity consumption may fluctuate throughout the year, with demand likely to be higher in the summer to achieve cooling, while heating during the colder months of the year can be provided by onsite solid fuel boilers, for example.311
The majority of controlled environmental horticulture production in Australia is undertaken in NSW, Victoria and South Australia with the main production categories including tomatoes, lettuce varieties, cucumber, capsicums and cut flowers and nurseries.312 In NSW, the greenhouse sector is the largest employer (per production area) of agricultural workers and is one of the fastest growing agricultural sectors in the state.313 Production mainly occurs in concentrated areas of the Hunter Valley, Greater Sydney and Illawarra-Shoalhaven regions with other locations including Tamworth in the New England and North West region and the North Coast.314
Agribusiness Precinct – Western Sydney Aerotropolis
As part of the development of the Western Sydney Aerotropolis, the NSW Government is driving the creation of a world-class agribusiness precinct. The Intensive Integrated Production Hub (IIPH) is intended to be a world-class, fully integrated intensive food production hub incorporating protected cropping horticulture, energy production systems, efficient use of water, waste, heat and CO2, and will integrate across other industry sectors and the community. Products used to estimate revenue potential included snack tomatoes, truss tomatoes, blueberries and capsicum
High level financial analysis by KPMG indicates that the IIPH could generate up to $541 million pa in revenue from a 500 ha site and $277 million pa in revenue from a 250 ha site.315 Over ten years of operations the IIPH is forecast to generate revenue of $2,800 million (500 ha) and $1,400 million (250 ha) site.316 Analysis of workforce requirements indicates that the IIPH could generate up to 2,500 jobs (FTE) on a 500 ha site and 1,300 jobs (FTE) on a 250 ha site.317
The IIPH can adopt circular economy principles and be a first mover in the use of technology that is creating a globally connected supply chains to drive better economic, social and environmental outcomes such as climate resilience and food waste minimisation.
309 Hadley, D., Controlled Environmental Horticulture Industry in Potential in NSW, University of New England (September 2017).
310 Barbosa, G. L., et al., Comparison of Land, Water, and Energy Requirements of Lettuce Grown Using Hydroponic vs. Conventional Agricultural Methods,
International Journal of Environmental Research and Public Health (12 June 2015).
311 Green House Energy Profile Study, Prosperity Group (27 September 2019).
312 Value of Agricultural Commodities Produced, Australia, 2016-17, ABS (21 May 2018).
313 Guidelines for the development of controlled environmental horticulture, NSW Department of Primary Industries.
314 Hadley, D., Controlled Environmental Horticulture Industry in Potential in NSW, University of New England (September 2017).
315 KPMG, 2019, ‘World-class intensive integrated production hub in the Western Sydney Aerotropolis’.
316 KPMG, 2019, ‘World-class intensive integrated production hub in the Western Sydney Aerotropolis’.
317 KPMG, 2019, ‘World-class intensive integrated production hub in the Western Sydney Aerotropolis’.

KPMG | 73
© 2020 KPMG, an Australian partnership and a member firm of the KPMG network of independent member firms affiliated with KPMG International Cooperative (“KPMG International”), a Swiss entity. All rights reserved. The KPMG name and logo are registered trademarks or trademarks of KPMG International. Liability limited by a scheme approved under Professional Standards Legislation.
Document Classification: KPMG Confidential
Sundrop Farm
Sundrop Farm was opened in 2016 near Port Augusta in South Australia, to produce fruits and vegetables in a sustainably developed, ‘closed loop’ glasshouse environment. Their produce includes tomatoes, chillies, cucumbers and berries – with significant quantities being exported.318 The facilities use solar energy to desalinate seawater and to fuel their agriculture (heating and other utilities), growing on a coconut husk base instead of soil to allow production on semi-arid land without the use of pesticides or finite natural resources. 319
Grid backup to the solar electricity source allows continued operations in poor weather, representing 10-15% of the facilities’ needs when solar energy drops. However, through the concentrated solar power generation and desalination, the plant achieves and estimated saving of 26,000 tonnes of C02 annually, and 2 million litres of diesel per year. 320
The $200 million project was originally underwritten by the Commonwealth’s Clean Energy Finance Corporation, enabling a $100 million investment from KKR in 2014. A further $6 million was contributed by the Government of South Australia321. The facility was sold in 2019 for between $200 and $250 million322, and has reported lower costs than comparative suppliers323 due to efficiencies in the growing process and disintermediation with end customers – including a 10 year supply agreement with Coles Supermarkets.324 Revenues in 2018-2019 were estimated to be $127.9 million – representing approximately 17.1% of the total Australian under cover vegetable growing market.
Using glasshouse environments, investment in solar and desalination technologies, and use of alternatives to soil, Sundrop has achieved significant reductions in pollution while retaining competitive production volumes. In addition to these benefits, the project has employed almost 200 local staff in the same region as South Australia’s last coal power station - creating employment and reskilling opportunities for local communities. This has included the development of an on-site training, research and development centre focussing on vegetable-picking robotics, climate control and energy efficient technologies.325
318 Facilities, Sundrop, 2020
319‘If you’ve eaten a tomato recently, there’s a pretty good chance it came from here’, GQ Magazine (17 June 2017)
320 World-first solar tower powered tomato farm opens in Port Augusta, RenewEconomy (7 October 2016).
321 Sundrop bucks RET investment drought with $100m KKR deal’ RenewEconomy (10 December 2014).
322 Futuristic renewable-energy agribusiness Sundrop sells to trans-Tasman investment firm, ABC News (15 May 2019).
323 Renewable Feasts, Climate Council, (2018).
324 Overview of Sundrop Farms: Redefining sustainable greenhouse production of fresh fruits and vegetables, Sundrop (October 2017)
325 IBISWorld, 2019 ‘Under Cover Vegetable Growing in Australia – AO122’

KPMG | 74
© 2020 KPMG, an Australian partnership and a member firm of the KPMG network of independent member firms affiliated with KPMG International Cooperative (“KPMG International”), a Swiss entity. All rights reserved. The KPMG name and logo are registered trademarks or trademarks of KPMG International. Liability limited by a scheme approved under Professional Standards Legislation.
Document Classification: KPMG Confidential
Nectar Farms
Nectar Farms is a glasshouse farming business based in regional Australia, seeking to employ 1000 staff across Australia in the next 5 years.326 Their farming systems are designed to reduce the need for costly water supplies and the use of pesticides through ‘closed loop’ hydroponic, nutrient and water systems327. Nectar Farms is still developing its first, 10-hectare glasshouse site in Joel-Joel Victoria, with an intent to produce truss tomatoes initially, with the potential to produce lettuces, cucumbers, zucchinis and berries in coming years.
Nectar has sought to differentiate its approach to be one of ‘smart farming’ with ‘community investment’ – primarily through the design of an operating model which draws together contemporary glasshouse technology with a skills development package for adjacent regions. While not in construction yet, additional plans are laid to move to 100% renewable energy sources (primarily wind) in coming years though an adjacent ‘Green Power Hub’ in Bulgana (Victoria).328
The $220 million project is expected to deliver more consistent produce as a result of the technology employed, and increased volumes.
9.1.1 Energy intensity of CEH facilities The energy intensity of CEH facilities varies depending on the crop and size of the facility with more large-scale and technologically advanced CEH systems consuming more energy during the production cycle. Heating, ventilation, air-conditioning, lighting, and dehumidification represent the largest end uses in these facilities.329 Some estimates suggest, up to 60 per cent of a CEH facility’s costs go to energy, with lighting accounting for roughly one-half of energy use.330 Other major energy intensive production factors may include the use of irrigation pumps to water crops and heating purposes as well as on-site cool store facilities. Production intensive facilities, such as intensive vertical farms may consume between 8,700 and 70,000 MWh of electricity annually depending on the crop and size of the facility.331
Electricity for facilities can currently be sourced from:
• Offsite fossil-fuel based or renewable generation assets.
• Onsite fossil-fuel based or renewable generation assets.
• Onsite energy assets such as combined heat and power (CHP) units – that efficiently convert natural gas or biogas produced in facilities to heat and electricity.
In addition to electricity, CEH facilities may use other sources of energy depending on their production needs. These may include diesel, synthetic or biofuels to power onsite pumps and generators and LPG to power some on-site equipment, including forklifts and other light vehicles that may be in use on larger CEH production sites.332
Increased use of CEH production benefits presents many opportunities for the NSW horticulture sector to take advantage of favourable local conditions to expand production and grow domestic and international market share. To achieve this in an industry with tight profit margins, the industry,
326 About us, Nectar Farms, 2020.
327 Stawell's Nectar Farms project still on horizon, Stawell Times, (6 March 2020).
328 Nectar Farms to invest $220 million in hydroponics, AU Manufacturing (16 October 2019).
329 Controlled Environment Agriculture: Emerging Opportunities Series, American Council for an Energy-Efficient Economy.
330 UGA researchers receive $5 million to help reduce energy costs of indoor farming, UGA College of Agricultural and Environmental Sciences (10
September 2018).
331 Indoor Agriculture: A Utility, Water, Sustainability, Technology and Market Overview, Electric Power Research Institute (June 2018).
332 Economic evaluation of farm energy audits and benchmarking of energy use on vegetable farms, John Cumming Infotech Research, Hort Innovation
(2014).

KPMG | 75
© 2020 KPMG, an Australian partnership and a member firm of the KPMG network of independent member firms affiliated with KPMG International Cooperative (“KPMG International”), a Swiss entity. All rights reserved. The KPMG name and logo are registered trademarks or trademarks of KPMG International. Liability limited by a scheme approved under Professional Standards Legislation.
Document Classification: KPMG Confidential
government and regulators may need to make considerations for electricity consumption that account for:
• The additional demand that an increased number of medium- and large-scale CEH productions will place on the electricity grid, particularly for night-time operations;
• The electricity generation mix including the use of on-site renewable energy generation as well as connection to utility-scale renewable energy generation assets; and
Setting day and night-time cycles with CEH facilities to synchronise with off-peak pricing conditions.333
Table 21: Opportunity Summary – Controlled environmental horticulture in NSW
Consideration Observations Current NSW Maturity
Industry decarbonisation
A number of operations have the potential to be able to harness renewable electricity to power some or all of their operations, including through the use of renewable energy as well as biogas and biowaste generated during production or some other sources. The transition is more challenging and costly, however, for larger operations. In respect of greenfield operations, there is the potential to design and establish around these technologies, however, the associated capital costs are significant. The Agribusiness Precinct at the Western Sydney Aerotropolis represents the most significant current opportunity being considered, noting that it is currently subject to further feasibility analysis and consideration by government.
Technology compatibility (incl. infrastructure requirements)
Renewable electricity generation is already widely used as a source of electricity in Australian and international operations. Green synthetic fuels and ammonia are not currently used for onsite transport purposes, however there may be applications as compatible vehicles enter the market and green fuels become cost competitive. Water recycling or desalination technology is required and is already used in some states, including in South Australia. Sundrop farms sources water from the ocean and desalinates it for agricultural use.334 BEVs and FCEVs may become cost-competitive for onsite vehicles in the medium to long term if there is a viable electricity connection or hydrogen supply in the vicinity of the CEH facility. There may be some use of green hydrogen to power onsite vehicles, and particularly LPG powered forklifts, in the long term. Bio-waste and biomass energy sources are a widely used source energy across various stages of the production cycle. Developments in collection and processing technologies are increasing their fuel efficiency,
Existing industry infrastructure
Operations across the NSW controlled environmental agriculture sector use a variety of operation structures based
333 Controlled Environment Agriculture: Emerging Opportunities Series, American Council for an Energy-Efficient Economy.
334 Sundrop, ‘Facilities’, https://www.sundropfarms.com/facilities/#.

KPMG | 76
© 2020 KPMG, an Australian partnership and a member firm of the KPMG network of independent member firms affiliated with KPMG International Cooperative (“KPMG International”), a Swiss entity. All rights reserved. The KPMG name and logo are registered trademarks or trademarks of KPMG International. Liability limited by a scheme approved under Professional Standards Legislation.
Document Classification: KPMG Confidential
Consideration Observations Current NSW Maturity
on the scale of their production and the types of crop they grow. Medium and large-scale operations have access to onsite systems that vary in nature based on product type, including:
• Lighting systems; • Generators; • Irrigations systems; • Green houses; • Water collection and purification; • Vertical and/or other types of growth platforms; • Waste collection and management systems; • Onsite cooling and storage facilities; • Package and processing machinery; and • Vehicles, such as forklifts and trucks.
Medium to large operations have more complex systems and production cycle processes, while some of the assets listed above may not apply to the same degree for smaller producers.
Key NSW regions There is significant potential for this opportunity within the Western Sydney Aerotropolis. A pre-feasibility study in relation to the NSW Government’s proposed Agribusiness Precinct was undertaken in 2019 and identified the potential for to provide the opportunity for up to 2,500 FTE jobs and an estimated total of 12,000 jobs including indirect jobs, $2.8 billion revenue over a 10 year full scale up and the delivery of fresh food production through an integrated circular economy.335 There is also merit in relation to the potential for specific new opportunities collocated with REZs and SAPs, in order to leverage new energy generation infrastructure and transport links – a key factor of production costs. More broadly, this opportunity has potential applicability across most regions, including the Central-West Orana, Riverina, North West, North Coast, noting the need to consider existing infrastructure than can be leveraged and the potential additional costs to realise these opportunities.
Timeframe for realisation
The overall timeframe for realisation of opportunities is expected to be short to medium term, since many facilities are already used at large commercial scale in some states. However, different considerations are required in terms of the realisation of this opportunity for existing and new production facilities. Further, the required actions to support these different opportunities will vary by geographic location and product type. For existing intensive agricultural facilities, the pathway for realisation of this opportunity is likely to primarily be a function of the cost competitiveness of clean technologies for the different factors of production. Based on the analysis in prior sections of this report, while many of these technologies are subject to a range of uncertainties around future costs, many appear likely to be medium term propositions. In respect of the Western Sydney Aerotropolis Agribusiness Precinct, it is noted that the NSW Government is continuing to progress work in relation to this opportunity. For potential new facilities (outside the Agribusiness Precinct), detailed feasibility analysis is required to consider the merits of opportunities in
335 KPMG 2019, World-class intensive integrated production hub in the Western Sydney Aerotropolis.

KPMG | 77
© 2020 KPMG, an Australian partnership and a member firm of the KPMG network of independent member firms affiliated with KPMG International Cooperative (“KPMG International”), a Swiss entity. All rights reserved. The KPMG name and logo are registered trademarks or trademarks of KPMG International. Liability limited by a scheme approved under Professional Standards Legislation.
Document Classification: KPMG Confidential
Consideration Observations Current NSW Maturity
specific regions and for different products. While demand is expected to continue to grow and NSW and Australia have a competitive advantage in agricultural exports, there are important considerations around a number of factors impacting potential feasibility:
• there are high capital cost requirements to establishing new facilities, together with the ongoing operating costs;
• different crops have different expected growing conditions, inputs and growing requirements, and expected yields;
• there are varying timeframes over which future supporting infrastructure is expected to be established.
Maturity key
Low or limited level
Some greater levels of maturity, however, some barriers remaining and/or current scale limited
Greater overall level of maturity and scalability
9.2 Considerations for Opportunity Realisation
9.2.1 Cost Competitiveness Compared to conventional horticulture production, such as field or row cropping and low-tech greenhouses, CEH require significant up-front capital investment to secure specific equipment required throughout the entire production cycle. CEH does, however, have the potential to improve productivity based on land, labour and water inputs, as well as providing increased resilience for producers to weather and climatic events.
Different opportunities, depending on the location, scale, crops, and connecting infrastructure will have very different cost positions and these will need to be considered on a case by case basis.
Specific and detailed consideration of all of these factors will be critical in ensuring that opportunities are effectively targeted and prioritised. Further, it will be important that such analysis is used as an input to determine the most appropriate levers to support the realisation of specific opportunities in different regions, noting that the interplay of the above issues will vary across different geographies and production contexts. Further context is provided in the sub sections below.
9.2.2 Strengths and Competitive Advantages Controlled environmental horticulture has the potential to significantly increase production capacity and output in some agricultural products such as leafy greens, tomatoes, and berry varieties. Collocating controlled production facilities powered by renewable energy near transport hubs also has the potential to further support the development of this opportunity.
• Most regions of NSW (apart from the Far West), have favourable conditions for controlled environmental horticulture facilities. The Northern Tablelands for example, are advantaged by their altitude, meaning they rarely experience days above 30 degrees Celsius – which can inhibit yield productivity – and have relatively high levels of solar radiation. Other areas of regional NSW also have cheaper land on which facilities can be established, however there are additional geographic and cost considerations for supporting infrastructure (see Section 9.2.3).336
• CEH facilities are significantly more water efficient than conventional broad acre or less technologically advanced horticultural systems. This allows reduced costs for inputs, greater yields per litre of water used in production and the minimisation of additional demand pressure
336 Hadley, D., Controlled Environmental Horticulture Industry in Potential in NSW, University of New England (September 2017).

KPMG | 78
© 2020 KPMG, an Australian partnership and a member firm of the KPMG network of independent member firms affiliated with KPMG International Cooperative (“KPMG International”), a Swiss entity. All rights reserved. The KPMG name and logo are registered trademarks or trademarks of KPMG International. Liability limited by a scheme approved under Professional Standards Legislation.
Document Classification: KPMG Confidential
placed on local and irrigated water supplies that are critical for surrounding communities, other use industries and ecosystems.
• NSW has extensive domestic and international freight transport options, including major highways and rail routes connecting agricultural locations and a number of regional and metro air terminals, including the future Western Sydney Airport. Producers in the state will also have access to a second airport in Western Sydney, in addition to the existing international airport, that will further enable the expeditious export of production to growing international markets, particularly in Asia. The development of special activation and auxiliary precincts around key transport hubs will also increase connectivity between intensive system facilities and surrounding related industries.
• CEH often produces crops that grow faster than outdoor systems. These systems also have the added advantage of providing producers with direct control over the conditions in which they grow and harvest their products.337 This allows producers a higher level of year-round flexibility in the types and quantities of products they produce to respond rapidly to changes in demand for products in the market and reduce waste during planting, growing, harvesting and processing.
• Controlled environmental horticulture provides an alternative method of production for some agricultural products, such as tomatoes, berries and leafy greens, in response to reductions in available land for agricultural purposes and changing climate and environmental conditions. These alternatives are significantly less land and water intensive and have the potential to be fully powered by green energy sources such as wind and solar, reducing emissions during production.
• Intensive system facilities have more opportunities to achieve efficiencies in production than other production methods. This is because of their capability to use by-products that are sourced internally or from other sectors, reducing costs for production inputs such as electricity and diesel, promoting water recycling and contributing to the circular economy.338
• Digital enablement in production, such as the use of immutable blockchain technology, can support food assurance (including the ability to demonstrate and ensure quality, safety, environmental management, workplace health and safety certifications), creating competitive advantages and drive price premiums in both the domestic and international market through demonstrable traceability and transparency of food.339
9.2.3 Barriers There are a number of barriers to the decarbonisation of existing facilities and the development of new sites across NSW.
For existing intensive agricultural facilities, the key barrier to the realisation of this opportunity is likely to be the cost competitiveness of clean technologies and the associated capital costs to transition. Based on the analysis in prior sections of this report, while many of these technologies are subject to a range of uncertainties around future costs, many appear likely to be medium to long term propositions.
For potential new facilities, notwithstanding expected growth in demand for agricultural product, there is a range of significant barriers that need to be considered. Many of these directly relate back to the high capital costs of market entry and the implications of clean electricity and technology cost pathways on cost competitiveness.
• Establishing greenfield controlled environmental horticulture assets is capital intensive and expensive due to their specialised equipment requirements.340 Producers seeking to start up intensive facilities often require large sums of start-up capital or debt supports.
• CEH facilities have very high energy needs that can increase costs significantly if affordable fossil fuel-based electricity, renewable energy or cheaper biogases or biomasses for use in energy generation are not available. Some operations also rely on the use of diesel-powered vehicles,
337 World-class intensive integrated production bub in the Western Sydney Aerotropolis, KPMG (February 2019)
338 Potential Economic Pay-off of a Circular Economy, KPMG (28 April 2019)
339 The National Blockchain Roadmap: Progressing towards a blockchain-empowered future, Australian Government Department of Industry, Science and
Resources (February 2020)
340 Hadley, D., Controlled Environmental Horticulture Industry in Potential in NSW, University of New England (September 2017).

KPMG | 79
© 2020 KPMG, an Australian partnership and a member firm of the KPMG network of independent member firms affiliated with KPMG International Cooperative (“KPMG International”), a Swiss entity. All rights reserved. The KPMG name and logo are registered trademarks or trademarks of KPMG International. Liability limited by a scheme approved under Professional Standards Legislation.
Document Classification: KPMG Confidential
they may need incur additional costs if they were to decarbonise their vehicles. However, there are opportunities to use other fuels that are produced using green processes, including hydrogen powered forklifts.
• The energy and water dependant nature of operations limits the locations in which they can be placed without additional capital expenditure to develop supporting energy and water infrastructure.
• The development of large-scale operation in regional areas of NSW is heavily dependent upon those areas having good transport port infrastructure to link facilities with export hubs, potentially requiring additional cost-intensive infrastructure development. Newly developed operations need to be well connected via road, rail and air to ensure the products can be cost effectively transported to domestic and international consumer markets.
• Land costs for CEH may also vary, with systems collocated near urban areas, domestic consumers or transport and logistics hubs, such as the proposed Western Sydney Airport and Aerotropolis, likely to be more expensive and require greater initial investment. One solution may be for local government to rezone areas relatively closer to export infrastructure to enable collocated production. Re-zoning does, however, lead to increased land prices, meaning operations may not be viable in these areas for all but the most highly productive enterprises growing high-value produce.341
• Locating operations near urban areas or transport infrastructure such as airports, may require further investigation of environmental impacts. For example, berry production has the potential to attract foraging birds which could increase the risk of bird-strike with aircraft, leading production to potentially be considered a wildlife attracting land use.342
9.2.4 Infrastructure Requirements The decarbonisation of existing controlled environmental horticulture operations and the construction of new operations in strategic locations across NSW will require several infrastructure considerations to ensure viable production. Many of these considerations will need to be considered on a case by case basis, depending on the type of produce grown in the facility, pointing to the need for further feasibility investigation in each case.
9.2.4.1 Production
New operations will require investment in the following capital:
• The external shell of the controlled facility, including foundations and support. The physical and technical characteristics of the external shell will be dependent on the type of produce housed in the facility and the geotechnical (ground) conditions that may impact the foundations of the structure;
• Lighting systems and accompanying electrical wiring to control the amount of light and radiation given to plants throughout daily and seasonal operations;
• Internal and external irrigations systems to bring in, filter, dispatch and then collect water;
• Vertical and/or other types of growth platforms to be housed within the facility. The physical and technical requirements of these platforms is heavily dependent on the types of produce grown on them;
• Access to water supply and water treatment / desalinisation plant;
• Waste collection and management systems;
• Onsite cooling and storage facilities;
• Package and processing machinery; and
• Onsite vehicles, such as forklifts and trucks (operation scale dependent).
341 Hadley, D., Controlled Environmental Horticulture Industry in Potential in NSW, University of New England (September 2017).
342 World-class intensive integrated production hub in the Western Sydney Aerotropolis, KPMG (February 2019)

KPMG | 80
© 2020 KPMG, an Australian partnership and a member firm of the KPMG network of independent member firms affiliated with KPMG International Cooperative (“KPMG International”), a Swiss entity. All rights reserved. The KPMG name and logo are registered trademarks or trademarks of KPMG International. Liability limited by a scheme approved under Professional Standards Legislation.
Document Classification: KPMG Confidential
9.2.4.2 Energy inputs
Energy inputs are a key cost consideration for intensive system operators, covering the full span of the production cycle. Considerations for energy supporting infrastructure include:
• Powering operations using onsite renewable generation assets, such as solar and wind farms, or through power purchase agreements with renewable generation asset owners.
• Using solar thermal or photovoltaic technologies to generate part or all of the heat requirements for CEH facilities. These systems require:
– External solar energy collection units, such as mirror systems or PV systems, and their accompanying electrical infrastructure requirements;
– Water reservoir holding tanks, typically stored underground; and
– Irrigation and plumbing, such as black polyethylene tubing, to transfer heated water through CEH facilitates and carry cooled water back into the holding reservoir;
– Possible additional irrigation infrastructure to source water for the system, including recycled water from onsite production and from water waste and runoff from other nearby sectors.
• Onsite generators powered by low-emissions fuels such as hydrogen, green ammonia, synthetic biofuels and bio-waste. Much of the biomass used may be internally sourced;
• Charging and/or refuelling for onsite BEV or FCEV vehicles. Other types of holding tanks for substitute fuels may also be considered.
As a further consideration, new operations may be located in geographically strategic locations in NSW regions where growth conditions and the development of SAPs and REZs align to reduce total capital associated with transmission infrastructure.
9.2.4.3 Transport
The product quality and ultimate sale and consumption of horticultural goods, like other types of agricultural produce such as meat and seafood, is sensitive to the time it takes for goods to reach consumers and the conditions in which those goods are being processed and transported. While this sensitivity can be partially remediated through improved technology and crop breeding, expeditious transport plays a key role in ensuring products reach consumers and retain their product integrity. Transport infrastructure and considerations for horticultural products include:
• Additional road and rail links, including loading terminals, near newly developed operations; and
• Additional cold storage logistics and processing facilities and equipment in transport precincts, including cold chain infrastructure.
Depending on the location of the operation, the scale and cost of these transport requirements will vary. More specific requirements, such as the technical qualities needed by transport modes to transfer specific goods, may also vary, adding further considerations.
9.3 Potential Opportunity Size Combined horticulture contributed around nine per cent of total gross value of production of NSW primary industries in 2016-17 (around $1.4 billion).343 The value of NSW horticultural exports reached $325 million in 2016-17 (reflecting an increase of 41 per cent in the five-year moving average), including exports of $241 million to Asia, and $35 million to Oceania.344 Global demand for horticulture products is expected to continue to grow globally. In Asia and The Middle East in particular, demand is predicted to increase between 59 per cent and 98 per cent by 2050 respectively.345 Such level of growth in demand point to a significant potential opportunity for NSW to support and capture an
343 NSW Department of Primary Industries, NSW Primary Industries Performance, Data & Insights 2017. Accessed 14 July 2020.
344 NSW Department of Primary Industries, NSW Primary Industries Performance, Data & Insights 2017. Accessed 14 July 2020.
345 Harvard Business Review, 2016, Global demand for food is rising – can we meet it?

KPMG | 81
© 2020 KPMG, an Australian partnership and a member firm of the KPMG network of independent member firms affiliated with KPMG International Cooperative (“KPMG International”), a Swiss entity. All rights reserved. The KPMG name and logo are registered trademarks or trademarks of KPMG International. Liability limited by a scheme approved under Professional Standards Legislation.
Document Classification: KPMG Confidential
increased share of growth in these regions, as well as more broadly domestically and internationally. An increase in horticulture output of one per cent in NSW is the equivalent of around $8 million in increased revenue in today’s dollars.346
There is a range of areas of potential benefit for the industry associated with this opportunity. These include, but are not limited to:
• Improved cost efficiency (existing facilities) – The total expenditure on electricity inputs by the Australian agriculture industry was $903 million in 2017-18, of which about 22 per cent is in NSW (by GVA share).347 Decreases in the cost of electricity may result in significant cost savings for the industry, including horticulture. Analysis from Agrology (2019) also found that novel heat solutions (i.e. those proposed in circular economies) could also decrease the cost of heat for Australian growers.348
• Increased economic activity from new facilities – The establishment of new intensive horticultural facilities has the potential to generate increased economic activity associated with construction and ongoing operation. Such benefits would be driven by factors such as the location, scale and sophistication of the facility. As an example, the pre-feasibility study for the Agribusiness Precinct at the Western Sydney Aerotropolis, undertaken in 2019, identified the potential to deliver up to 2,500 FTE jobs and an estimated total of 12,000 jobs including indirect jobs, $2.8 billion revenue over a 10 year full scale up and the delivery of fresh food production through an integrated circular economy.349
• Wider benefits (all facilities) – Other circular economy principles also have the potential to generate benefits for the industry, including by creating renewable energy (biogas) using generated waste which could be used by other industries. Fertiliser costs could also be decreased through a closed system, integrated by Blue Farms (Urban Ecological Service Ltd) in partnership with the University of Sydney, has also created a closed loop ‘aquaponics’ system whereby plants are grown on a suspended medium above a fish production system, from which waste feeds into a treatment tank and turned into fertiliser nutrients for the plants.
• Drought resistant production – The application of CEH production methods across a number of compatible crops in NSW enables an increased level of drought resistance to be developed within the agricultural industry. This is primarily driven using technologies, such as temperature control and highly efficient water irrigation systems. Drought resistance, and increased water efficiency, will be critical to the ongoing viability of the NSW agricultural sector as the industry is forced to adjust to water shortages, population water needs and climate change.
346 Assumes that horticulture’s share is 9 per cent of agriculture, forestry and fishing gross value added; ABS Australian National Accounts: Input-Output
Tables, 2017-18 (released 29 May 2020); ABS Australian National Accounts: State Accounts, 2018-19 (released 15 November 2019). Earnings converted into
March 2020 dollars (ABS Consumer Price Index, March 2020, released 29 April 2020).
347 Electricity generation and electricity transmission, ABS Australian National Accounts: Input-Output Tables, 2017-18 (released 29 May 2020); ABS
Australian National Accounts: State Accounts, 2018-19 (released 15 November 2019).
348 Agrology, 2019, Cost of Production Analysis: Hightech Glasshouse Production in Australia.
349 KPMG 2019, World-class intensive integrated production hub in the Western Sydney Aerotropolis.

KPMG | 82
© 2020 KPMG, an Australian partnership and a member firm of the KPMG network of independent member firms affiliated with KPMG International Cooperative (“KPMG International”), a Swiss entity. All rights reserved. The KPMG name and logo are registered trademarks or trademarks of KPMG International. Liability limited by a scheme approved under Professional Standards Legislation.
Document Classification: KPMG Confidential
10 Other potential industry opportunities The opportunities considered in detail in this report are not exhaustive. Further analysis of other potential industry opportunities, or opportunities yet to be conceived, will be important to continue to assist in clarifying the nature and extent of opportunities and the actions required.
In addition to the industries considered in detail in this report, this section sets out high level considerations around several other potential opportunities.
NSW decarbonisation initiatives have the potential to spark international interest from businesses in the renewable energy and sustainability sectors to establish their Australian or Asia-Pacific base in the state. These initiatives also provide opportunities for Sydney’s growing sustainable finance sector to further capitalise upon the city’s status as a regional and global financial hub. The guarantee of affordable and reliable clean energy will be of interest to all international firms seeking to locate their Australian or regional operations in NSW and in so doing will ensure their operations meet shareholder or consumer demands for green products and services.
10.1 Food and beverage manufacturing NSW has the largest food and beverage manufacturing industry in Australia, with the sector contributing $30.1 billion to the NSW economy in 2016-17, or 32 per cent of the Australian industry total.350 Food and beverage manufacturing, such as meat processing, dairy product manufacturing, milling and confectionaries, requires significant levels of natural gas to primarily produce thermal energy as well as to operate industrial machinery and storage facilities such and cool stores. Energy costs can typically account for at least 15 per cent of total operational costs of a food business.351 The current NSW food and beverage manufacturing industry primarily sources its energy needs from natural gas and electricity (typically coal fired), with natural gas being the main fuel type in the industry. Additional direct and indirect energy consumption and emissions in the industry are generated through the transportation of produced foods and beverages as they are distributed to transit hubs and points of purchase.
Energy efficiency technologies and electrification – supported by the provision of low-cost, low-emission renewable electricity – where appropriate to minimise or eliminate the use of natural gas applications have an important contribution to make in terms of supporting the certainty and cost competitiveness of local manufacturing and industry competitive position domestically and internationally.
10.2 Advanced manufacturing NSW has the largest number of manufacturing businesses of any state or territory in Australia. These businesses collectively generate $33 billion in industry value added and employ more than 253,000 people in a range of industries.352
350 NSW Department of Industry, ‘NSW food and beverage manufacturing industry development strategy’, 2019.
351 Australian Government Department of Industry, Science, Energy and Resources, Manufacturing
352 NSW Department of Industry, ‘NSW Advanced Manufacturing Industry Development Strategy’, 2018.

KPMG | 83
© 2020 KPMG, an Australian partnership and a member firm of the KPMG network of independent member firms affiliated with KPMG International Cooperative (“KPMG International”), a Swiss entity. All rights reserved. The KPMG name and logo are registered trademarks or trademarks of KPMG International. Liability limited by a scheme approved under Professional Standards Legislation.
Document Classification: KPMG Confidential
Today, NSW is home to a broad range of industry sectors such as food and beverages, aerospace, medical technology and creative industries.353 These industries can be characterised by higher energy intensity, meaning the competitiveness of some businesses may be vulnerable to energy input costs. Together with advancements in efficiency enhancing technologies, the provision of reliable low-cost, low-emissions electricity generation and storage to the sector has the potential to reduce operating costs across the sector, increase productivity and encourage greater levels of greenfield and brownfield investments.
The advanced manufacturing industry could also have an important role to play in supporting the NSW Government’s Net Zero emissions target by producing the necessary technologies and equipment, such as solar panels, wind turbine magnets to support a transition to clean renewable electricity generation, or vehicles that run on renewable energy sources. A broad spectrum of research and development projects occurring in NSW research institutions and industry have the potential to provide technologies that if commercialised will accelerate the progression toward renewable and decarbonisation industries.
10.3 Pulp and paper manufacturing The pulp and paper industry contributed $3.7 billion to the Australian economy in 2018, with roughly 75 per cent of the industry concentrated in regional NSW and Victoria.354 The pulp and paper manufacturing industry produces several products directly or by supplying secondary manufacturers to produce goods ranging from the paper used in books and magazines to cartons, paper stationery, tissues, nappies, paper towels and sanitary goods. The industry is traditionally heavily energy and water intensive, however, the Australian industry is one of the leaders in the use of energy and water efficiency practices.355 The industry continues to advance efficiency and sustainability measures by using independently certified renewable resources; internationally recognised best practices for recycling; and continuously improves its energy/water efficiency and emissions.356
The industry is facing several challenges, including falling demand for paper products as the widespread adoption of digitisation is increasingly substituting paper products. Steady falls in demand for these products is further driving the need find greater efficiencies and cost reductions.357
10.4 Electrification of industrial process heat Low-cost renewable electricity presents an attractive short-term electrification opportunity to enable fuel switching from natural gas and other high emission fuel types. In NSW, indirect gas boiler use and process heating are two end use processes that consumed a combined 141.6 PJ of energy, or 57 per cent of the entire manufacturing division energy use in 2015-16.358 At present, this heat is predominately provided by coal, with gas combustion the second biggest source. Options for electrification include heat pumps, electromagnetic heating, resistance heating and electric arc systems and it is possible to develop electric-driven options for all process heat applications if processes are suitably redesigned. In Australia, the substitution of fossil fired heat by renewables with short-term economically viable options is estimated at 56 PJ/year, equal to 12 per cent of total industrial gas use for heat.359
Electrification of industrial process heat can have significant decarbonisation and cost-saving benefits across most manufacturing industries. Crucially, exploring electrification pathways to industrial process heat supports the NSW Government’s Advanced Manufacturing Industry Development Strategy and 20-Year Economic Vision for Regional NSW by providing an avenue through which industries can achieve
353 NSW Department of Industry, ‘NSW Advanced Manufacturing Industry Development Strategy’, 2018.
354 Australian Industry and Skills Committee, ‘Pulp and Paper Manufacturing’, 02 April 2020.
355 Australian Industry and Skills Committee, ‘Pulp and Paper Manufacturing’, 02 April 2020.
356 Australian Industry and Skills Committee, ‘Pulp and Paper Manufacturing’, 02 April 2020.
357 Australian Industry and Skills Committee, ‘Pulp and Paper Manufacturing’, 02 April 2020.
358 pitt&sherry, ‘Industry Sector Analysis’, 2018.
359 ARENA, ‘Renewable Energy Options for Industrial Process Heat’, 2019.
KPMG | 84
© 2020 KPMG, an Australian partnership and a member firm of the KPMG network of independent member firms affiliated with KPMG International Cooperative (“KPMG International”), a Swiss entity. All rights reserved. The KPMG name and logo are registered trademarks or trademarks of KPMG International. Liability limited by a scheme approved under Professional Standards Legislation.
Document Classification: KPMG Confidential
greater operational efficiency and invest recouped costs in expanded production and industry and market development.
10.5 Data centres, storage and cyber security The growth of the internet and cloud computing has resulted in significant expansion in data usage and storage requirements. This data is held in data centres, which have become fast-growing consumers of power.360 Data centres account for almost four per cent of Australia’s total energy consumption and around 10 per cent of the world’s energy consumption.361 Although major energy users, data centres contribute substantially to energy savings elsewhere in the economy by enabling digitalisation, in transport, infrastructure and across industry.362 The acceleration of digital transformation by business and government has seen rapid growth in demand for data centre and storage, placing additional emphasis on the need to invest in greater cyber security safeguards. The NSW Government’s NSW Cyber Security Industry Development Strategy and Cyber Security Strategy have recognised this and are investing in ensuring businesses and government agencies have the necessary cybersecurity practices and technology to boost resilience and competitiveness.363 364
With energy consumption by data centres expected to grow significantly in future years, the supply of low-cost, low-emissions electricity will assist in positioning Sydney and NSW as a competitive location to establish data centre infrastructure. The collocation of low-cost and reliable green energy with important communication fibre backbones, helps to ensure data centres can cost-effectively meet demand while ensuring emissions generated from electricity consumption do not significantly increase. This has the potential to give renewable electricity generation a comparative advantage over traditional electricity generation as data centre operators and information and communications technology firms, such as Apple and Google, seek to sustainably optimise their operating performance.365
10.6 Mining (mineral extraction and processing) Mining is a long-established industry in NSW that traditionally extracts coal, however there is growing demand for gold, copper and lithium extraction among other minerals for domestic consumption and export. The mineral extraction and processing industry is in a constant state of change as new technologies, such as automation, and new processing methods are adopted to improve production efficiency and the cost-competitiveness of minerals sold in the market. NSW is often considered a mature exploration destination. This is because much of the exploration recently has been in brownfield sites to extend existing operations rather than greenfield exploration that can lead to new discoveries.366 The end-to-end mineral extraction and processing industry contributed the largest annual increases in net energy consumption in the decade to 2012-13.367 While much of the increase in net energy consumption can be explained by expanded production, energy productivity (the energy needed to produce each unit of output) has been declining. This is due to a number of important reasons, including:
• Reductions in the quality of ore bodies, necessitating higher energy use for processing; and
360 Australian Government Department of Industry, Science, Energy and Resources, ‘Data centres’.
361 Australian Energy Council, ‘Big data: A big energy challenge?’, 18 October 2018.
362 Australian Government Department of Industry, Science, Energy and Resources, ‘Data centres’.
363 Department of Industry, ‘NSW Cyber Security Industry Development Strategy’, 2018.
364 Digital.NSW, ‘NSW Cyber Security Strategy’, 2019.
365 Australian Energy Council, ‘Big data: A big energy challenge?’, 18 October 2018.
366 NSW Department of Planning, Industry and Environment, ‘NSW Minerals Strategy’, February 2019.
367 Australian Government Department of Industry, Science, Energy and Resources, ‘Energy Management in Mining: Leading Practice Sustainable Development
Program for the Mining Industry’, September 2016.

KPMG | 85
© 2020 KPMG, an Australian partnership and a member firm of the KPMG network of independent member firms affiliated with KPMG International Cooperative (“KPMG International”), a Swiss entity. All rights reserved. The KPMG name and logo are registered trademarks or trademarks of KPMG International. Liability limited by a scheme approved under Professional Standards Legislation.
Document Classification: KPMG Confidential
• Some ore bodies are becoming less accessibly as pit get deeper, requiring more energy to access and extract them.368
In addition to increased energy consumption, mineral extraction and processing can be heavily water intensive, placing strain and local water resources and generating environmental risks from water discharges.369 As global demand for high-tech metal alloys, rare earth metals and other minerals grows, mineral extractors and processors are under increasing pressure to maintain supply chains to meet demand while also responding to consumer demands for sustainably sourced minerals. 370 The use of new technologies to reduce the emissions and water impacts of extraction and processing is becoming increasingly important, particularly as the industry seeks to maintain its cost-competitiveness in the face of additional policy and market forces. Given that new low emissions electric vehicles utilise batteries containing considerable embedded carbon, including from mining and refining processes and material production, producers wishing to sell materials into the renewable energy value chain will have increasing pressures to decarbonise their minerals processes in alignment with the expectations of the electric vehicles and PV sectors.371 Opportunities to address energy and water use in minerals extraction, processing and production of materials include accessing renewable electricity to power onsite equipment, using heat recovery measures to recycle energy produced through processes such as exothermic chemical steps, as well as water capture and recycling. Several new mining developments in NSW are seeking ores and minerals that are important in the renewable energy marketplace. Metals and minerals that are used in solar panels, storage batteries, magnets used in turbines and vehicles as well as other equipment are prospective in NSW. For those miners seeking to sell into the renewables market, the benefits of powering their mining and processing activities using renewable sources can enhance their value and emission-reducing credentials as inputs into renewable technologies.
368 Australian Government Department of Industry, Science, Energy and Resources, ‘Energy Management in Mining: Leading Practice Sustainable Development
Program for the Mining Industry’, September 2016.
369 Prosser, I., Wolf, L., and Littleboy, A, ‘Water in mining and industry’, 2011, CSIRO.
370 NSW Department of Planning, Industry and Environment, ‘NSW Minerals Strategy’, February 2019.
371 Carbon Brief, ‘Factcheck: How electric vehicles help to tackle climate change’, 13 May 2019.

KPMG | 86
© 2020 KPMG, an Australian partnership and a member firm of the KPMG network of independent member firms affiliated with KPMG International Cooperative (“KPMG International”), a Swiss entity. All rights reserved. The KPMG name and logo are registered trademarks or trademarks of KPMG International. Liability limited by a scheme approved under Professional Standards Legislation.
Document Classification: KPMG Confidential
11 Actions for Consideration by Government 11.1 Industry specific considerations The following table summarises the key findings of the report and suggested areas for further consideration by the NSW Government in continuing to progress each opportunity.
The transition to lower cost, reliable, green energy presents an opportunity for NSW in relation to:
The readiness of NSW to harness this opportunity is as follows: Key Findings and Actions for Consideration
Current cost competitiveness
Readiness to leverage technology
Sufficiency of existing
Infrastructure
Timeframe for Opportunity Realisation
Potential opportunity size and regions
Steel production
Renewable energy (heating)
Short term Every percentage point increase in industry output relative to current levels could deliver up to additional $20 million in annual revenues and up to $7 million in annual direct and indirect wages in today’s dollars. Key NSW regions:
• Hunter Valley • Illawarra-Shoalhaven
Key Finding: There is potential to develop a NSW green steel industry. There are a number of different technological pathways to reduce emission in steel making, including heating of furnaces and ovens, and as reducing agents that can replace carbon monoxide produced from coke. However, there are barriers due to infrastructure requirements, the high cost of green hydrogen technology, and the long-expected time horizon to achieving cost competitiveness for some processes. The following considerations are suggested for the NSW Government: Recognising the energy and cost intensive of current production, government (DPIE) should continue to work in partnership with industry to:
• monitor the evolving industry dialogue and emerging technology pathways and risks; • understand shorter- and longer-term financial issues, including the expected impact of
reforms and investments being made by the NSW Government; and • understand and consider options to enable continued industry development in line
with industry and government objectives. For future potential greenfield operations, industry and government (DPIE, DPC, NSW Treasury, Regional NSW) should partner to undertake a strategic scoping study to identify
Hydrogen
Medium-long term
Polymer injection technology
Short-medium term
TGS-BF with CCS
Short-medium term
HIsarna
Short-medium term
ULCORED (natural gas)
Short-medium term
ULCOWIN
Short-medium term

KPMG | 87
© 2020 KPMG, an Australian partnership and a member firm of the KPMG network of independent member firms affiliated with KPMG International Cooperative (“KPMG International”), a Swiss entity. All rights reserved. The KPMG name and logo are registered trademarks or trademarks of KPMG International. Liability limited by a scheme approved under Professional Standards Legislation.
Document Classification: KPMG Confidential
The transition to lower cost, reliable, green energy presents an opportunity for NSW in relation to:
The readiness of NSW to harness this opportunity is as follows: Key Findings and Actions for Consideration
Current cost competitiveness
Readiness to leverage technology
Sufficiency of existing
Infrastructure
Timeframe for Opportunity Realisation
Potential opportunity size and regions
ULCOLYSIS
Short-medium term
and appraise transition pathways that leverage renewable energy and methane technologies (including those that are tolerant to partial or full replacement with hydrogen) to lead a future viable green steel industry. The findings should enable decisions around appropriate strategies and levers to give effect to desired industry pathways.
Hydrogen production and export
SMR
Current The former COAG Energy Council estimated that the hydrogen industry in Australia could generate approximately 7,600 jobs and $11 billion per year in additional GDP by 2050. Key NSW regions:
• Greater Sydney • Hunter Valley • Illawarra-Shoalhaven Potential collocation with other industries in inland regions.
Key Finding: The development of a hydrogen industry is a significant long-term opportunity for NSW. In addition to the economic benefits of new industry formation, it has the potential to enable many downstream industry applications, including transport, agriculture and advanced manufacturing. However, the production, transport and storage infrastructure required for green hydrogen to be scalable and cost competitive is not expected until at least the medium term. Continued partnership across industry and government, together with new investments and research and development is critical to accelerating this pathway. Further consideration of health and safety requirements for workers, infrastructure and surrounding populations and environments should also be considered as future opportunities are clarified and explored further. In partnership with industry and the Commonwealth and other State and Territory Governments, the NSW Government should continue driving the acceleration of the hydrogen pathway. This should be coordinated to support initiatives and programs under the upcoming state-based NSW Hydrogen Strategy. In line with this progress, the NSW Government should continue to build on the NSW Hydrogen Strategy by identifying and prioritising specific pilots and initiatives, research and development, and other programs and incentives to support and accelerate industry development. The NSW Government and industry should also strengthen collaboration to consider and align the safety and regulatory implications of increased hydrogen production, transport, storage and use with several current and future applications and locations. These considerations may include the co-development and implementation of regulations/legislation and standards to eliminate or manage risks such as workplace health and safety requirements, state- and nation-wide technical standards and risk mitigation practices that address loss of containment, environmental impacts and proximity to residential dwellings and commercial properties.
PEM
Short-medium term
Aluminium production
Renewable generation
Short to Medium term
Every percentage point increase in industry output (or avoided industry decline) relative to current levels could deliver an additional $50 million in annual revenues and around $14 million in annual direct wages in today’s dollars. Key NSW regions:
Key Finding: The recently announced closure of the Rio Tinto New Zealand Aluminium Smelters and other announcements by industry have highlighted the cost pressures and risks faced by current aluminium producers. Notwithstanding these risks, there is also potential for a future NSW green aluminium industry in NSW. It will be heavily dependent on the cost, stability and reliability of renewable electricity and storage capability that can enable the industry to compete and increase output and market share domestically and internationally. The following considerations are suggested for the NSW Government:
• Recognising the energy and cost intensive of current production, government (DPIE) should continue work in partnership with industry to:
• monitor the evolving industry dialogue and emerging risks;
Battery storage
Medium term
Pumped hydro
Short to Medium term

KPMG | 88
© 2020 KPMG, an Australian partnership and a member firm of the KPMG network of independent member firms affiliated with KPMG International Cooperative (“KPMG International”), a Swiss entity. All rights reserved. The KPMG name and logo are registered trademarks or trademarks of KPMG International. Liability limited by a scheme approved under Professional Standards Legislation.
Document Classification: KPMG Confidential
The transition to lower cost, reliable, green energy presents an opportunity for NSW in relation to:
The readiness of NSW to harness this opportunity is as follows: Key Findings and Actions for Consideration
Current cost competitiveness
Readiness to leverage technology
Sufficiency of existing
Infrastructure
Timeframe for Opportunity Realisation
Potential opportunity size and regions
• Hunter Valley • understand shorter- and longer-term financial issues, including the expected impact of reforms and investments being made by the NSW Government;
• understand and consider options to enable continued industry development in line with industry and government objectives; and
• Understand the confidence and certainty of the future industry outlook. Government (DPIE, DPC, NSW Treasury, Regional NSW) should assist the industry where appropriate to assess the feasibility of future potential greenfield operations that can leverage renewable technology and storage. This should be supported by:
• Confirmation of the long-term industry development objectives; • Market analysis, accounting for current and anticipated future drivers of demand,
including from the technology, transport and consumer durables industries, domestically and internationally;
• Technical and infrastructure requirements – In particular, this should address the question of the feasibility and cost-competitiveness of overcoming technical and financial barriers to storage options and addressing intermittency of renewable energy supply to the grid. The analysis should include, at a minimum, the consideration of:
• REZs and broader alignment with development initiatives; • Solar and wind generation capacity and strategic geographies for further investment;
and • Storage technologies and infrastructure such as utility scale batteries and the use of
pumped hydro (Snowy Hydro in particular). • Cost benefit analysis of options with consideration of construction and operations
(including operational, workforce and skills); • Analysis of risk management strategies; and • Analysis of the investment requirements, profiling, and potential actions.
Ammonia production
SMR
Current Every one percentage point of global market share able to be captured by NSW is worth approximately $102 million in today’s dollars (assuming 2018 market size). Key NSW regions:
• Newcastle, Hunter Valley Future production facilities can be collocated next to key productive areas in the following regions:
• Central-West Orana • New England and North
West
Key Finding: There is significant economic potential for a green ammonia industry in NSW, with ammonia an important component of agricultural fertilisers, chemical feedstock and also as an energy carrier/ fuel. There appears to be pathways in the shorter term to use renewables to power existing SMR hydrogen and future green hydrogen production activities for use in low-emissions electricity powered ammonia production plants. Further opportunities exist to source bioenergy/biomethane feedstocks into current SMR hydrogen production processes. Further consideration of health and safety requirements for workers, infrastructure and surrounding populations and environments should also be considered as future opportunities are clarified and explored further. Government should continue to establish and embed linkages with existing industry initiatives, including:
• A green Ammonia consortium led by Queensland Nitrates (QN) and partners Neoen and Worley and supported by ARENA;
• Intec Pivot’s green ammonia facility plant upgrade, supported by ARENA; and • Yara Pilbara and ENGIE’s feasibility study on a renewable hydrogen to ammonia
solution in fertiliser production.
CCS
Short term
Electrification
Short-medium term
Green hydrogen (PEM)
Long term

KPMG | 89
© 2020 KPMG, an Australian partnership and a member firm of the KPMG network of independent member firms affiliated with KPMG International Cooperative (“KPMG International”), a Swiss entity. All rights reserved. The KPMG name and logo are registered trademarks or trademarks of KPMG International. Liability limited by a scheme approved under Professional Standards Legislation.
Document Classification: KPMG Confidential
The transition to lower cost, reliable, green energy presents an opportunity for NSW in relation to:
The readiness of NSW to harness this opportunity is as follows: Key Findings and Actions for Consideration
Current cost competitiveness
Readiness to leverage technology
Sufficiency of existing
Infrastructure
Timeframe for Opportunity Realisation
Potential opportunity size and regions
• North Coast • Illawarra-Shoalhaven
A greater evidence base is required to assess the size and scope of the future market opportunity and the competitive landscape. Government should consider facilitating, in partnership with industry, a market study to build on available evidence and consider:
• Market size and scope, and upstream and downstream supply chain characteristics; • Current and emerging demand drivers and supply capacity, including the potential
implications of high demand growth areas domestically and internationally such as: • advanced manufacturing, including account for the NSW Government’s commitments
and investments around advanced manufacturing in the: • COVID-19 Recovery Plan; • the NSW Advanced Manufacturing Industry Development Strategy; and • the Western Sydney Advanced Manufacturing Precinct as part of the Western Sydney
Aerotropolis. • heavy vehicle transportation; • international shipping; and • hydrogen transportation. The outcomes from the market study should inform a feasibility study to prioritise options for greenfield industry development, focussing on:
• Confirmation of the long-term industry development objectives; • Identification and costing of the requirements and options to develop the NSW
ammonia industry, including: • Location – With consideration of collocation of production near renewable energy
production and downstream industries such as agricultural production; • Technical and infrastructure requirements – Including consideration of: • Requirements of integrated green hydrogen and ammonia production; and • Advancements in renewable electricity generation and storage capability. • Capital requirements – electrolysers, compressors, condensers, cooling units, storage
tanks and facilities and additional connecting infrastructure for use industries; • Operational and workforce requirements – sufficient energy generation, transmission
and storage capacity, supply of green hydrogen if sourced off-site, additional skilled workers for greenfield plants;
• Analysis of risk management strategies, including in relation to plant and equipment, processes and skills needs; and
• Analysis of the investment requirements, profiling, and potential actions. The NSW Government and industry should also strengthen collaboration to consider and align the safety and regulatory implications of increased ammonia production, transport, storage and use with several current and future applications and locations. These considerations may include the co-development and implementation of regulations/legislation and standards to eliminate or manage risks such as workplace health and safety requirements, state- and nation-wide technical standards and risk mitigation practices that address loss of containment, environmental impacts and proximity to residential dwellings and commercial properties.

KPMG | 90
© 2020 KPMG, an Australian partnership and a member firm of the KPMG network of independent member firms affiliated with KPMG International Cooperative (“KPMG International”), a Swiss entity. All rights reserved. The KPMG name and logo are registered trademarks or trademarks of KPMG International. Liability limited by a scheme approved under Professional Standards Legislation.
Document Classification: KPMG Confidential
The transition to lower cost, reliable, green energy presents an opportunity for NSW in relation to:
The readiness of NSW to harness this opportunity is as follows: Key Findings and Actions for Consideration
Current cost competitiveness
Readiness to leverage technology
Sufficiency of existing
Infrastructure
Timeframe for Opportunity Realisation
Potential opportunity size and regions
Chemical and synthetic fuel production
Methanol synthesis
Current There are many potential industry applications for synthetic fuels (including LHOC to transport and store hydrogen) and other chemicals made using cheaper green energy. The international markets for chemicals and synthetic fuels, such as ethanol and methanol, are worth tens of billions of dollars and are expected to grow domestically and internationally over time as demand and use applications increase. Increasing NSW’s capacity to capture a fraction of the domestic and international market using low-cost renewable energy sources could enable the realisation of significant economic and industry benefits in the state. Key NSW regions: Most regions of NSW may be suitable for the development of a sustainable synthetic fuels industry. This may be influenced by a number of factors including the location of bio-waste sources, renewable generation capacity, carbon capture industries or green hydrogen manufacturing plants.
Key Finding: While there are many potential industry applications for chemicals and synthetic fuels, the current local production industry is neither well-developed nor cost-competitive. In the case of synthetic fuels, the move to electrification (particularly for vehicles) adds complexity to the opportunity and outlook where the solution for some is to switch from internal combustion engines to electric vehicles, while other transportation will decarbonise by switching from fossil to sustainable synthetic fuels. More broadly, the chemicals manufacturing industry would benefit from cheaper, reliable, low emissions electricity offering the opportunity to produce chemicals that had until now been too expensive. There needs to be consideration at many levels of the aspiration and business case for the establishment and scaling of local chemical and synthetic fuel production, both for potential local demand and potential export. Further consideration of health and safety requirements for workers, infrastructure and surrounding populations and environments should also be considered as future opportunities are clarified and explored further. The NSW Government should clarify the strategic priority of increasing local chemical and synthetic fuels manufacturing in the context of its policy priorities and existing commitments, and in relation to advanced manufacturing and industry development opportunities. With respect to the above, DPIE should work in partnership with existing manufacturers, use industries and research organisations to further understand and clarify the economic and strategic importance of different end use cases (including in new and emerging industry applications of synthetic fuels), role of advanced chemical manufacturing processes in generating or refining chemicals at scale using renewables, and meeting green market requirements for clean chemicals production, and the specific infrastructure, technical, workforce and skills requirements, regulatory and cost barriers to realising these use cases. Subject to the above, government should consider the relative merits of:
• Formalising an industry development strategy and action plan; • Investing in or otherwise incentivising or creating regulatory enablers to stimulate
industry investment and development; and • Increasing priority and focus on pilots, trials, and research and development to
accelerate industry and skills development. • A precinct approach for sustainable chemicals and fuels manufacturing to maximise
circular economy benefits and to lower capital, infrastructure and feedstock costs, and reduce skills barriers.
The NSW Government and industry should also strengthen collaboration to consider and align the safety and regulatory implications of increased chemical and synthetic fuel production, transport, storage and use with several current and future applications and locations. These considerations may include the co-development and implementation of regulations/legislation and standards to eliminate or manage risks such as workplace health and safety requirements, state- and nation-wide technical standards and risk mitigation practices that address loss of containment, environmental impacts and proximity to residential dwellings and commercial properties.
Fischer-Tropsch
Current
Efuels
Long term
Synthetic biofuels
Medium term

KPMG | 91
© 2020 KPMG, an Australian partnership and a member firm of the KPMG network of independent member firms affiliated with KPMG International Cooperative (“KPMG International”), a Swiss entity. All rights reserved. The KPMG name and logo are registered trademarks or trademarks of KPMG International. Liability limited by a scheme approved under Professional Standards Legislation.
Document Classification: KPMG Confidential
The transition to lower cost, reliable, green energy presents an opportunity for NSW in relation to:
The readiness of NSW to harness this opportunity is as follows: Key Findings and Actions for Consideration
Current cost competitiveness
Readiness to leverage technology
Sufficiency of existing
Infrastructure
Timeframe for Opportunity Realisation
Potential opportunity size and regions
Transport and logistics
Passenger vehicles Every additional one per cent share of BEV of registered passenger vehicles in NSW has the potential to result in direct cost savings of up to $89.3 million per annum. Based on potential future costs, total future bus operating costs may be up to $234.8 million lower than ICE bus operating costs in 2030 in today’s dollars. Based on potential future costs, total future operating costs of articulated and semi-rigid trucks could be up to $103.1 million per annum and $42.6 million per annum lower respectively than their ICE counterparts in the respective years they attain cost competitiveness. The operating cost saving for truck operators are projected to grow annually in the years after cost-competitiveness is attained. Key NSW regions:
All regions of NSW, particularly:
• Greater Sydney • Hunter Valley • Central Coast • North Coast • Illawarra-Shoalhaven • Central-West Orana • New England and North
West
Key Finding: Decarbonising the NSW freight, and public and private transport systems is a key opportunity to leverage clean energy at scale and contribute to future transport system cost efficiencies. Specific consideration is required around different transport modes to account for the different nature of these opportunities. Private passenger vehicles (BEV) Existing technology and the availability of PHEVs and BEVs in the market has already seen some uptake of low emissions private passenger vehicles in NSW. Current technologies and growing consumer demand low-emissions vehicles is driving some improvements in the development of cost-competitive BEV and PHEV models, making the transition to low-emissions passenger vehicles achievable in the short term. The government may need to consider the following actions to support wider decarbonisation initiatives in transport, such as the NSW Electric Vehicle and Hybrid Plan:
• Analysis of the impact of existing incentives and the potential development of further incentives to encourage greater uptake;
• Phasing of incentives by vehicle type, such as incentives for PHEVs in the short term as a transition pathway to BEVs;
• Develop greater awareness of the benefits of low-emissions vehicle ownership, including of lower operating costs and driving range; and
• Working with the industry and private enterprises to establish a wider network of accessible charging stations across the state.
Buses
In the context of the NSW Long Term Transport Master Plan, DPIE, OCSE, TfNSW and NSW Treasury should continue their collaboration to Use the outcomes of bus trials, such as electric bus trial by Nowra Coaches and Sydney Airport and the H2OzBus consortium looking at hydrogen infrastructure development, to inform the development of business case(s) for option to scale low-emissions bus services. The insight from existing and planned trials as well as the development of a future business case(s) should be coordinated with a view to achieving the NSW Government’s objectives for a zero-emissions Sydney bus fleet. The NSW Government may also partner with public and private bus operators to establish pathways to zero emission transitions with focus on contract arrangements, knowledge sharing on business and operating models and setting horizon targets. Options should be prioritised based on factors such as:
• Areas of high demand service areas and population growth; • Suitability of vehicle types for various routes; and • Synergies with other infrastructure projects and priorities (e.g. Sydney Metro, Western
Sydney Airport and Aerotropolis). Freight and heavy modes
Options to decarbonise the freight and heavy vehicle network should be considered from an overall freight system perspective due to the interconnectedness of the intrastate and interstate freight network. Further, potential approaches, including the whether to use
ICE
Current
BEV
Short term
FCEV
Short term
Buses
ICE
Current
BEV
Short term
FCEV
Short term
Freight and heavy modes
ICE
Current
BEV
Medium term
FCEV
Medium term

KPMG | 92
© 2020 KPMG, an Australian partnership and a member firm of the KPMG network of independent member firms affiliated with KPMG International Cooperative (“KPMG International”), a Swiss entity. All rights reserved. The KPMG name and logo are registered trademarks or trademarks of KPMG International. Liability limited by a scheme approved under Professional Standards Legislation.
Document Classification: KPMG Confidential
The transition to lower cost, reliable, green energy presents an opportunity for NSW in relation to:
The readiness of NSW to harness this opportunity is as follows: Key Findings and Actions for Consideration
Current cost competitiveness
Readiness to leverage technology
Sufficiency of existing
Infrastructure
Timeframe for Opportunity Realisation
Potential opportunity size and regions
BEVs or FCEVs, may vary for different freight vehicle types, with some, such as FCEV semi-rigid trucks, potentially able to achieve cost effectiveness sooner than others. In the context of the NSW Freight and Ports Plan 2018-2023, DPIE, TfNSW, NSW Treasury and current freight industry operators should build on existing partnerships and knowledge sharing to model options to optimise and prioritise investment in decarbonisation opportunities and associated infrastructure across the NSW road freight network. This should consider the use of FCEVs and BEVs and issues such as:
• The number of refuelling or charging stations needed along key routes; • The current aging and depreciation of existing truck fleets to determine timeframes for
transitions and clean vehicle uptake; • How decarbonisation can align with government initiatives as well as the strategic and
financial objectives of freight operators; • The collocation of key refuelling stations with green hydrogen fuel development plants
and/or leveraging high growth areas including regional SAPs and planned REZs.
Controlled environmental horticulture
Renewable energy
Short term Combined horticulture contributed around nine per cent of total gross value of production of NSW primary industries in 2016-17 (around $1.4 billion). The Agribusiness Precinct at the Western Sydney Aerotropolis alone is expected to contribute up to 2,500 FTE jobs, 12,000 indirect jobs, and $2.8 billion in revenue over a 10-year full scale up. Key NSW regions:
• Greater Sydney • Illawarra-Shoalhaven • Central Coast • Hunter Valley Future production facilities can be collocated next to geographically strategic productive areas in the following regions:
• Central-West Orana • New England and North
West
Key Finding: Agriculture is a strategic industry for NSW and offers significant growth potential, with strong and growing regional and international demand and the ability to leverage NSW and Australia’s competitive advantage as a safe and high-quality food producer. CEH is already well-established within the industry and there are major plans underway to expand CEH production as part of the Agribusiness Precinct at the Western Sydney Aerotropolis. There are further opportunities to develop CEH production across NSW. Detailed scoping is required to ensure facilities can be delivered in the shorter term and leverage current and emerging clean technologies to provide a modern and integrated approach and optimise return on investment. Work to progress this opportunity should leverage and build on the significant evidence base already developed as part of the Agribusiness Precinct feasibility undertaken by the Western City and Aerotropolis Authority, as well as wider industry data. DPIE and the Department of Primary Industries should assist industry-led feasibility studies by providing information about the specific location(s), scale, and crop focus of new CEH facilities across NSW that can maximise economic impact. The output of feasibility studies undertaken should be a short list of detailed investment-ready options for government and industry to confirm the pathway for investment. The key issues to be addressed should include:
• Existing domestic and international market penetration and expected growth areas; • Location options, including the benefits of collocation with: • Other infrastructure investments – cold storage and processing facilities, renewable
energy installations, lighting and temperature control systems and irrigation networks. • Regional investments – REZs and agribusiness hubs, particularly in SAPs. • Freight network – access to export food processing facilities fitted with suitable cooled
storage infrastructure. Road links and possible collocation with air terminals will enable expeditious export to maintain food quality.
• Optimal production scale and mix;
Biogas and bio-waste
Short term
Liquid fossil-fuels
Current
LPG
Current

KPMG | 93
© 2020 KPMG, an Australian partnership and a member firm of the KPMG network of independent member firms affiliated with KPMG International Cooperative (“KPMG International”), a Swiss entity. All rights reserved. The KPMG name and logo are registered trademarks or trademarks of KPMG International. Liability limited by a scheme approved under Professional Standards Legislation.
Document Classification: KPMG Confidential
The transition to lower cost, reliable, green energy presents an opportunity for NSW in relation to:
The readiness of NSW to harness this opportunity is as follows: Key Findings and Actions for Consideration
Current cost competitiveness
Readiness to leverage technology
Sufficiency of existing
Infrastructure
Timeframe for Opportunity Realisation
Potential opportunity size and regions
• North Coast • Riverina-Murray
• Integration of production facilities with other sectors to promote circular economy production and increase efficiency, particularly in the use of bio-waste and by-products and water recycling; and
• Approaches to target market development, including the prioritisation of product types and varieties to align with domestic and international high growth demand consumer markets.
Maturity key
Limited maturity and scale
Some areas of greater maturity, however, barriers remaining and/or scale limited
Greater overall level of maturity and scalability
Source: KPMG analysis based on the evidence base outlined earlier in this report.

KPMG | 94
© 2020 KPMG, an Australian partnership and a member firm of the KPMG network of independent member firms affiliated with KPMG International Cooperative (“KPMG International”), a Swiss entity. All rights reserved. The KPMG name and logo are registered trademarks or trademarks of KPMG International. Liability limited by a scheme approved under Professional Standards Legislation.
Document Classification: KPMG Confidential
11.2 Renewable energy sector skills development In addition to the considerations required for the realisation of opportunities outlined in this report, additional skills and workforce requirements will need to be addressed to drive the development of a leading renewable energy sector in NSW.
A challenge to cost-effectively realising the economic and employment opportunities outlined in this report is creating the regulatory conditions and incentives to address skilled labour shortages. Currently, skills shortages exist within the renewable energy labour market (such as grid engineers, electrical engineers, supervisory control and data acquisition engineers and construction managers) resulting in several barriers to clean energy transition. These include, but are not limited to:
• Competition within the renewable energy sector and with other industries for skilled labour; • Higher rates of employee turn-over, increasing recruitment and retention costs; • Delays in the commencement and/or completion and costs of projects, such as large-scale wind and
solar developments; and • Reduced efficiencies within the renewable energy sector to meet the demand and needs of a diverse
range of end-users.
All the opportunities discussed in this report – as well as those not in the scope of this report or not yet conceived – require adequate supply of appropriately skilled labour as a necessary condition for realisation. Recent research by the UTS Institute for Sustainable Futures has identified potential pathways to support employment and skills development in the sector and the positioning of employment in the sector as a competitive career pathway for NSW residents.
These items are not exhaustive and additional horizon planning to support the development of the required skills and workforce capability in NSW, including appropriate occupational health and safety qualifications and standardised competency requirements, will need to be considered in collaboration and partnership between the NSW Government, relevant Commonwealth agencies, industry and communities.
Table 22 Renewable energy sector employment and skills development opportunity realisation pathways
Opportunity realisation pathway
Conditions and incentives
Increasing the supply and retention of skilled labour
• Development of fit-for-purpose short training courses to bridge pre-requisite qualification gaps.
• Alignment of the apprenticeship system with the renewable energy sector, including group training and apprentice sharing schemes.
• Implementation of work retention strategies, such as transfer arrangements and portability of entitlements, by the industry.
Using the Renewable Energy Zones to improve coordination and planning
• Development a place -based approach to workforce planning around REZs in regional areas
• Integrate with the workforce planning of Special Activation Precincts (SAPs) connected or related to REZs.
• Development of incentives by government and industry to maximise local training and employment as well as attract intrastate and interstate labour to avoid skills shortages which could occur when major renewable energy projects coincide with the construction of transmission lines.
Renewable energy auctions with local content and training requirements
• Consider the development of schemes, quotas and initiatives in partnership with local industry to encourage greater use of locally produced material inputs to renewable energy and industry projects
• Build on existing initiatives by the NSW Government to foster a stable operating environment for industry and investors to invest in long-term business development.

KPMG | 95
© 2020 KPMG, an Australian partnership and a member firm of the KPMG network of independent member firms affiliated with KPMG International Cooperative (“KPMG International”), a Swiss entity. All rights reserved. The KPMG name and logo are registered trademarks or trademarks of KPMG International. Liability limited by a scheme approved under Professional Standards Legislation.
Document Classification: KPMG Confidential
Opportunity realisation pathway
Conditions and incentives
Regional industry development
• Development of appropriate transition pathways for regional communities, particularly in coal regions, in collaboration between the NSW Government, relevant Commonwealth agencies, industry and communities.
• Industry advocation and participation in regional industry development plans.
• Alignment of industry and government regional development plans with broader skills and workforce development initiatives to minimise structural unemployment.
Pre-planning for hydro and pumped hydro
• Development of fit-for-purpose training courses and programs to bridge pre-requisite qualification and experience gaps to address hydro skills shortages in Australia.
• Development of a pre-planning approach to minimise competition for skills and skill shortages that is likely to occur as major hydro and transmission projects coincide with one another.
• Development and implementation of incentives for a range of relevant construction, trade and engineering qualifications to support the supply of direct construction jobs as well as related supply chain businesses, such as concrete and steel manufacturers.
Source: Renewable Energy Jobs in Australia: Stage One, UTS Institute for Sustainable Futures.

KPMG | 96
© 2020 KPMG, an Australian partnership and a member firm of the KPMG network of independent member firms affiliated with KPMG International Cooperative (“KPMG International”), a Swiss entity. All rights reserved. The KPMG name and logo are registered trademarks or trademarks of KPMG International. Liability limited by a scheme approved under Professional Standards Legislation.
Document Classification: KPMG Confidential
12 References ABC News, 2019, ‘Futuristic renewable-energy agribusiness Sundrop sells to trans-Tasman investment firm.
ABS, 2016, Census.
ABS, 2018, ‘Land Management and Farming Australia, 2016-17’.
ABS, 2018, ‘Value of Agricultural Commodities Produced, Australia, 2016-17’.
ABS, 2019, ‘Data by Region, 2011-18’.
ABS, 2019, ‘Survey of Motor Vehicle Use, 2017-18’.
ABS, 2020, ‘Australian National Accounts: Input-Output Tables, 2017-18’.
ABS, 2020, ‘Employed persons by Industry division of main job (ANZSIC), Labour market region (ASGS) and Sex, Annual averages of the preceding four quarters, Year to August 1999 onwards’.
ABS, 2020, ‘Regional Population Growth, Australia’.
ACIL Allen Consulting, 2018, ‘Opportunities for Australia from Hydrogens Exports’.
ACIL Allen Consulting, 2019, ‘Chemical Industry Economic Contribution Analysis’.
AFR, 2019, ‘Generators call for notice as smelters teeter on the brink’.
AFR, 2020, ‘Tomago counts cost of energy transition’.
Agrology, 2019, ‘Cost of Production Analysis: Hightech Glasshouse Production in Australia’.
Aluminium Insider, 2017, ‘High electricity prices are driving Australia’s aluminium industry out of business’.
Aluminium Insider, 2017, ‘Why Trimet Aluminium is betting on EnPot’s virtual battery’.
American Council for an Energy-Efficient Economy, 2019, ‘Controlled Environment Agriculture: Emerging Opportunities Series’.
American Iron and Steel Institute, ‘Steel Production’, https://www.steel.org/steel-technology/steel-production
ANFRE, 2019, ‘Global smelters’ production costs on decline’.
Anti-Dumping Commission, 2017, ‘Analysis of Australia’s steel manufacturing and fabricating markets: Report to the Commissioner of the Anti-Dumping Commission’.
ArcelorMittal, 2019, ‘World first for steel: ArcelorMittal investigates the industrial use of pure hydrogen’. Recharge, 2020, ‘‘World first’ as hydrogen used to power commercial steel production’.
ARENA, 2020, ‘Electric Vehicles’.
ARENA, 2019, ‘Renewable Energy Options for Industrial Process Heat’.
AU Manufacturing, 2019, ‘Nectar Farms to invest $220 million in hydroponics’.
AuManufacturing, 2019, ‘Steel breakthrough – Thyseenkrupp makes steel using hydrogen’.
Australian Aluminium Council, ‘Australian Aluminium’.
Australian Aluminium Council, 2012, ‘Sustainability Report’.

KPMG | 97
© 2020 KPMG, an Australian partnership and a member firm of the KPMG network of independent member firms affiliated with KPMG International Cooperative (“KPMG International”), a Swiss entity. All rights reserved. The KPMG name and logo are registered trademarks or trademarks of KPMG International. Liability limited by a scheme approved under Professional Standards Legislation.
Document Classification: KPMG Confidential
Australian Competition and Consumer Commission, ‘Biofuels’.
Australian Energy Council, 2018, ‘Big data: A big energy challenge?’.
Australian Government Department of Agriculture, Water and Environment, ‘About my region – New South Wales’.
Australian Government Department of Environment and Energy, 2019, ‘Australian Energy Statistics, Table F, Australian energy consumption, by state and territory, by industry and fuel type, energy units’.
Australian Government Department of Environment and Energy, 2019, ‘Australian Energy Statistics, Table H, Australian total final energy consumption, by industry, by fuel, energy units’.
Australian Government Department of Industry, Science, Energy and Resources, 2016, ‘Energy Management in Mining: Leading Practice Sustainable Development Program for the Mining Industry’.
Australian Government Department of Industry, Science and Resources 2020, ‘The National Blockchain Roadmap: Progressing towards a blockchain-empowered future’.
Australian Government Department of Industry, Science, Energy and Resources, ‘Manufacturing’.
Australian Government Department of Industry, Science, Energy and Resources, ‘Data centres’.
Australian Government Department of Infrastructure, Transport, Regional Development and Communications, 2019, ‘Transport’.
Australian Government Department of Infrastructure, Transport, Regional Development and Communications, 2019, ‘Freight and Supply Chains’.
Australian Industry and Skills Committee, 2020, ‘Pulp and Paper Manufacturing’.
Australian Mining, 2020, ‘Oversupply, high costs pressure Alcoa’s future smelting business’.
Australian Research Council, 2013, ‘Wheel success: researcher teams with industry to turn tyres into steel’.
Australian Research Council, 2019, ‘2020 ARC Centre of Excellence in Synthetic Biology’.
Barbosa, G. L., et al., 2015, ‘Comparison of Land, Water, and Energy Requirements of Lettuce Grown Using Hydroponic vs. Conventional Agricultural Methods’, International Journal of Environmental Research and Public Health.
Benke, K. and Tomkins, B., 2017, ‘Future food-production systems: vertical farming and controlled-environment agriculture’, Sustainability: Science, Practice and Policy.
Biodiesel Magazine, 2008, ‘Moving Biodiesel’.
BioEnergy Australia, 2019, ‘IEA Commentary: Are Aviation Biofuels Ready for Take Off?’.
Biomass Magazine, 2018, ‘Neste to more than double renewable diesel capacity in Singapore’.
BloombergNEF, 2020, ‘Hydrogen Economy Outlook’.
BlueScope, 2018, ‘Media Release: BlueScope Underwrites Investment in 500,000 Panel Solar Farm’.
BlueScope, 2020, ‘BlueScope in the Illawarra, About Us’.
BlueScope, 2020, ‘BlueScope Steel Annual Report 2018/2019’.
Budget Direct, 2020, ‘Electric cars available in Australia: 2020 Guide’.
Carbon Brief, 2019, ‘Factcheck: How electric vehicles help to tackle climate change’.
Canstar, 2020, ‘Canstar Blue electricity customer satisfaction survey’.
Climate Council, 2018, ‘Renewable Feasts’.
Climate Technology Centre & Network, ‘Inert anode technology for aluminium smelters’.

KPMG | 98
© 2020 KPMG, an Australian partnership and a member firm of the KPMG network of independent member firms affiliated with KPMG International Cooperative (“KPMG International”), a Swiss entity. All rights reserved. The KPMG name and logo are registered trademarks or trademarks of KPMG International. Liability limited by a scheme approved under Professional Standards Legislation.
Document Classification: KPMG Confidential
Climateworks Australia, ‘Net Zero Momentum Tracker’, https://www.climateworksaustralia.org/net-zero/.
Climateworks Australia, 2019, ‘Submission to the inquiry into electric buses in regional and metropolitan public transport networks in New South Wales’.
COAG Energy Council, 2019, ‘Australia’s National Hydrogen Strategy’.
Cochrane, M., 2017, ‘Australian Biofuels 2017 Industry Overview and Developments’,
Collodi, G., et al., 2017, ‘Techno-economic Evaluation of Deploying CCS in SMR Based Merchant H2 Production with NG as Feedstock and Fuel’, Energy Procedia.
Council of Australian Governments Energy Council, 2019, ‘Hydrogen as a Transport Fuel: Location options for a freight-based initial deployment of hydrogen refuelling stations’.
CSIRO, 2016, ‘Cost assessment of hydrogen production from PV and electrolysis’.
CSIRO, 2018, ‘CSIRO tech accelerates hydrogen vehicle future.
CSIRO, 2019, ‘Lithium battery recycling in Australia: Current status and opportunities for developing a new industry’.
CSIRO, 2019, ‘National Hydrogen Roadmap: Pathways to an economically sustainable hydrogen industry in Australia.
Deloitte China, 2020, ‘Fuelling the future of mobility: Hydrogen and fuel cell solutions for transportation.
Digital.NSW, 2019, ‘NSW Cyber Security Strategy’.
Drive Zero, ‘Mapped: Electric Car Charging Stations & Locations in Australia’.
Eberle, U. & Systemtechnik, Ludwig & Fuels, FVV., 2016, ‘FVV Study "Renewables in Transport 2050: Empowering a sustainable mobility future with zero emission fuels from renewable electricity"’.
Electric Power Research Institute, 2018, ‘Indoor Agriculture: A Utility, Water, Sustainability, Technology and Market Overview.
Electric Vehicle Council, ‘Mythbusting, About Electric Vehicles’.
Electric Vehicle Council, 2019, ‘State of Electric Vehicles’.
Energeia, 2018, ‘Australian Electric Vehicle Market Study’.
Energia, 2018, ‘Australian Electric Vehicle Market Study.
Energy Networks Australia, 2019, ‘Energy Insider: 10 Strategies, 15 countries, one element’.
Energy Transition Hub, 2019, ‘From mining to making: Australia’s future in zero-emissions metal’.
European Academies’ Science Advisory Council, 2019, ‘Decarbonisation of transport: Options and challenges’.
EVAdoption, 2019, ‘What Is The “Minimum Acceptable” Ratio of EVs to Charging Stations?’.
Farrell, R., 2017, ‘Australia Biofuels Annual’, USDA Foreign Agricultural Service.
Financial Times, 2020, ‘London Metal Exchange plans ‘low-carbon’ aluminium trading‘.
Gautam, M., Pandey, B., Agrawal, M., 2018, ‘Carbon Footprint of Aluminium Production: Emissions and Mitigation’, Environmental Carbon Footprints.
Geoscience Australia, ‘Bauxite’.
Gielen, D., Saygin, D., Taibi, E., and Birat, J., 2020, ‘Renewables-based decarbonization and relocation of iron and steel making: A case study’.
GQ Magazine, 2020, ‘If you’ve eaten a tomato recently, there’s a pretty good chance it came from here’.

KPMG | 99
© 2020 KPMG, an Australian partnership and a member firm of the KPMG network of independent member firms affiliated with KPMG International Cooperative (“KPMG International”), a Swiss entity. All rights reserved. The KPMG name and logo are registered trademarks or trademarks of KPMG International. Liability limited by a scheme approved under Professional Standards Legislation.
Document Classification: KPMG Confidential
Graham, P.W., et. al, 2018, ‘GenCost 2018’, CSIRO.
Green Tech Media, 2020, ‘Marine Sector Turns to Ammonia to Decarbonize Shipping’.
Hadley, D., 2017, ‘Controlled Environmental Horticulture Industry in Potential in NSW’, University of New England.
Harvard Business Review, 2016, ‘Global demand for food is rising – can we meet it?’.
Hydrogen Council, 2020, ‘Path to hydrogen competitiveness, A cost perspective’.
Hydrogen Council, 2020, ‘Path to hydrogen competitiveness: A cost perspective’.
Hyundai Motors, ‘Hyundai Motor and H2 Energy to bring the world’s first fleet of fuel cell electric trucks into commercial operation’.
IBISWorld, 2019, ‘Under Cover Vegetable Growing in Australia – AO122’.
IBISWorld, 2029, ‘Aluminium Smelting in Australia - Market Research Report’.
IEA, 2019, ‘Putting CO2 to Use’.
IEEFA, 2020, ‘Why aluminium smelters are a critical component in Australian decarbonisation’.
InvestNSW, NSW Government.
InvestNSW, Renewable energy.
IPART NSW, 2019, ‘IPART Ethanol Market Monitoring Report’,
ITP, 2018, ‘Comparison of Dispatchable Renewable Electricity Option: Technologies for an Orderly Transition’.
John Cumming Infotech Research, 2014, ‘Economic evaluation of farm energy audits and benchmarking of energy use on vegetable farms’, Hort Innovation.
Kelly, A., 2019, ‘IBISWorld Australian Specialised Industry Report OD5088: ‘Ethanol Fuel Production in Australia’.
Kenny, P. and Flynn, K. F., 2017, ‘Physiology limits commercially viable photoautotrophic production of microalgal biofuels’, Journal of Applied Phycology.
Keys, A., van Hout, M., and Daniëls, B., 2019, ‘Decarbonisation options for the Dutch steel industry’, PBL Netherlands Environmental Assessment Agency.
KPMG, 2019, ‘Automated and Zero Emission Vehicle Infrastructure Advice: Energy Impacts and Modelling’.
KPMG, 2019, ‘Potential Economic Pay-off of a Circular Economy’.
KPMG, 2019, ‘World-class intensive integrated production hub in the Western Sydney Aerotropolis’.
Le Feuvre, P., 2019, ‘Are aviation biofuels ready for take off?’, International Energy Agency.
Macquarie University, 2019, ‘Biological Hydrogen Production’.
Manildra Group, ‘Sustainability Commitments’.
McKinsey & Company, 2018, ‘Decarbonization of industrial sectors: The next frontier.
Melaina, M. W., Antonia, O., and Penev, M., 2013, ‘Blending Hydrogen into Natural Gas Pipeline Networks: A Review of Key Issues’, National Renewable Energy Laboratory.
Molycop, 2019, ‘Landmark Sustainable Power Purchase Agreement’.
Nectar Farms, 2020, ‘About us’.
Newcastle Herald, 2017, ‘Tomago Aluminium is preparing for more power shutdowns this summer’.
Newcastle Herald, 2019, ‘The University of Newcastle is playing a key role in the Hunter's energy transition’.

KPMG | 100
© 2020 KPMG, an Australian partnership and a member firm of the KPMG network of independent member firms affiliated with KPMG International Cooperative (“KPMG International”), a Swiss entity. All rights reserved. The KPMG name and logo are registered trademarks or trademarks of KPMG International. Liability limited by a scheme approved under Professional Standards Legislation.
Document Classification: KPMG Confidential
NRMA, ‘Electric Vehicle Fast Charging Network’.
NSW Chief Scientist and Engineer, 2020, ‘NSW Decarbonisation Innovation Study Scoping Paper’.
NSW Chief Scientist and Engineer, 2020, ‘Opportunities for prosperity in a decarbonised and resilient NSW’.
NSW Chief Scientist & Engineer, 2019, ‘NSW Decarbonisation innovation Study: Initial Report’.
NSW Department of Industry, 2018, ‘NSW Advanced Manufacturing Industry Development Strategy’.
NSW Department of Industry, 2018, ‘NSW Cyber Security Industry Development Strategy’.
NSW Department of Industry, 2019, ‘NSW food and beverage manufacturing industry development strategy’.
NSW Department of Planning, Industry and Environment, ‘NSW 2019 Population Projections’.
NSW Department of Planning, Industry and Environment, 2019, ‘NSW Minerals Strategy’.
NSW Department of Planning, Industry and Environment, 2019, ‘NSW Electricity Strategy’.
NSW Department of Planning, Industry and Environment, 2020, ‘Memorandum of Understanding – NSW Energy Package’.
NSW Department of Planning, Industry and Environment, 2020, ‘Net Zero Plan, Stage 1: 2020-2030’.
NSW Department of Primary Industries, ‘Guidelines for the development of controlled environmental horticulture’.
NSW Department of Primary Industries, ‘NSW Primary Industries Performance, Data & Insights 2017’.
NSW Department of Primary Industries, ‘Protect cropping, Horticulture’, https://www.dpi.nsw.gov.au/agriculture/horticulture/greenhouse#:~:text=Protected%20cropping%2C%20also%20referred%20to,pests%2C%20diseases%20and%20adverse%20weather.
NSW Government, ‘Far West’, https://www.nsw.gov.au/our-regions/far-west
NSW Government, ‘Illawarra-Shoalhaven’, https://www.nsw.gov.au/our-regions/illawarra-shoalhaven.
NSW Government, ‘Snowy Mountains Special Activation Precinct’, https://www.nsw.gov.au/snowy-hydro-legacy-fund/special-activation-precincts/snowy-mountains-special-activation-precinct.
NSW Government, ‘South East and Tablelands’, https://www.nsw.gov.au/our-regions/south-east-tablelands
NSW Treasury, 2019, ‘NSW 2040 Economic Blueprint’.
NSW Treasury, 2016, ‘Principles and Guidelines for Economic Appraisal of Transport Investment and Initiatives’.
Office of Environment Efficiency & Renewable Energy, ‘Hydrogen Production: Electrolysis’.
Office of Environment Efficiency & Renewable Energy, ‘Hydrogen Production: Photoelectrochemical Water Splitting’.
Office of Environment Efficiency & Renewable Energy, ‘Hydrogen Storage’.
Orica, ‘Kooragang Island, Operations’.
pitt&sherry, 2018, ‘Industry Sector Analysis’.
Prosperity Group, 2019, ‘Green House Energy Profile Study.
Prosser, I., Wolf, L., and Littleboy, A., 2011, ‘Water in mining and industry’, CSIRO.
RenewEconomy, 2016, ‘World-first solar tower powered tomato farm opens in Port Augusta’.
RenewEconomy, 2014, ‘Sundrop bucks RET investment drought with $100m KKR deal’.

KPMG | 101
© 2020 KPMG, an Australian partnership and a member firm of the KPMG network of independent member firms affiliated with KPMG International Cooperative (“KPMG International”), a Swiss entity. All rights reserved. The KPMG name and logo are registered trademarks or trademarks of KPMG International. Liability limited by a scheme approved under Professional Standards Legislation.
Document Classification: KPMG Confidential
Rio Tinto Flags Higher Costs, Cloudy Australian Aluminium Future, Reuters, 31 October 2019.
Roads and Maritime Services NSW, 2017, ‘Technology Study: Alternative Fuels’, https://www.rms.nsw.gov.au/documents/about/environment/air/technology-study-alternative-fuels.pdf.
Roads and Maritime, ‘Electric vehicles’, NSW Government.
RSK, 2019, ‘Synthetic fuel manufacture: Proof of Concept LCA’.
Rural Industries Research and Development Corporation, ‘Bioenergy markets: ethanol’, http://biomassproducer.com.au/markets/bioenergy-markets-in-australia/ethanol/#.Xw_EiSgzY2y.
Statista, 2020, ‘Distribution of global iron ore exports in 2018, by major country’.
Stawell Times, 2020, ‘Stawell's Nectar Farms project still on horizon’,
Stockholm Environment Institute, 2018, ‘Low-emission steel production: decarbonising heavy density’.
Sundrop, ‘Facilities’, https://www.sundropfarms.com/facilities/#.
Sundrop, 2017, ‘Overview of Sundrop Farms: Redefining sustainable greenhouse production of fresh fruits and vegetables’.
Sundrop, 2020, ‘Facilities’.
Survey of Motor Vehicle Use, Australia, 12 months ended 30 June 2018 (released 20 March 2019).
Sustainable Bus, ‘Electric bus, main fleets and projects around the world’, https://www.sustainable-bus.com/electric-bus/electric-bus-public-transport-main-fleets-projects-around-world/.
Transport for NSW, 2020, TfNSW Economic Parameter Values’.
Transport for NSW, 2020, ‘Expressions of Interest sought for Zero Emission Bus Trials’.
The Driven, 2019, ‘Total cost of EVs in Australia may match petrol cars by next year’, https://thedriven.io/2019/04/30/total-cost-of-evs-in-australia-may-match-petrol-cars-by-next-year/.
The Hindu Business Line, 2020, ‘Green steel: Tata Steel develops climate-friendly method of production’.
The National Academies of Sciences, Engineering and Medicine 2004, ‘The Hydrogen Economy: Opportunities, Costs, Barriers, and R&D Needs’.
The Observatory of Economic Complexity, ‘Ammonia’.
The Royal Society 2019, ‘Sustainable synthetic carbon based fuels for transport: Policy briefing’.
The Royal Society, 2020, ‘Ammonia: Zero-carbon fertiliser, fuel and energy store’.
The University of Sydney, 2020, ‘Hydrogen production from biomass and waste fuels’.
Tomago Aluminium, Our Story.
Toyota Partnering with Melbourne Council for Australian First Hydrogen FCEV Trials, Toyota (November 2018).
Transport and Environment, 2017, ‘Electrofuels what role in EU transport decarbonisation’.
Transport and Infrastructure Council, 2016, ‘Australian Transport Assessment and Planning PV2 Road Parameter Values’.
Transport for NSW, 2016, ‘NSW and Sydney Transport Facts 2016’.
Transport for NSW, 2019, ‘NSW Electric and Hybrid Vehicle Plan’.
Transport for NSW, 2019, ‘NSW Electric and Hybrid Vehicle Plan’.
Transport for NSW, 2020, ‘Public Transport Patronage – Top Level Chart.

KPMG | 102
© 2020 KPMG, an Australian partnership and a member firm of the KPMG network of independent member firms affiliated with KPMG International Cooperative (“KPMG International”), a Swiss entity. All rights reserved. The KPMG name and logo are registered trademarks or trademarks of KPMG International. Liability limited by a scheme approved under Professional Standards Legislation.
Document Classification: KPMG Confidential
Transport for NSW, 2020, Public Transport Patronage – Top Level Chart, Monthly Opal Trips’.
Transport for NSW, Roads and Maritime. 2020, ‘Electric vehicles’, https://www.rms.nsw.gov.au/roads/registration/get-nsw-registration/electric-vehicles/index.html
U.S. Geological Survey, 2020, ‘Mineral Commodity Summaries 2020’.
UGA College of Agricultural and Environmental Sciences, 2018, ‘UGA researchers receive $5 million to help reduce energy costs of indoor farming’.
United Nations Treaty Collection, 2020, https://treaties.un.org/Pages/ViewDetails.aspx?src=TREATY&mtdsg_no=XXVII-7-d&chapter=27&clang=_en, accessed 29 June 2020.
USDA Foreign Agricultural Survey, 2017, ‘Global Agricultural Information Network: Australia, Biofuels’, https://apps.fas.usda.gov/newgainapi/api/report/downloadreportbyfilename?filename=Biofuels%20Annual_Canberra_Australia_8-15-2017.pdf
UTS Institute for Sustainable Futures, 2012, ‘Calculating Global Energy Sector Jobs: 2012 Methodology’, http://cfsites1.uts.edu.au/find/isf/publications/rutovitzharris2012globalenergyjobsmethycalc.pdf.
Verkehrswende, A., Energiewende, A. and Frontier Economics, 2018, ‘The Future Cost of Electricity-Based Synthetic Fuels’.
Vogl, V., Åhman, M. and Nilsson, L.J., Assessment of hydrogen direct reduction for fossil-free steelmaking. Journal of cleaner production (2018).
Water NSW, Dams of Greater Sydney and Surround: Shoalhaven, https://www.waternsw.com.au/__data/assets/pdf_file/0006/55923/Shoalhaven-Dam-Booklet_WEB1.pdf
Wood, T., Dundas, G., and Ha, J., 2020, ‘Start with steel. A practical plan to support carbon workers and cut emissions’, Grattan Institute.

KPMG | 103
© 2020 KPMG, an Australian partnership and a member firm of the KPMG network of independent member firms affiliated with KPMG International Cooperative (“KPMG International”), a Swiss entity. All rights reserved. The KPMG name and logo are registered trademarks or trademarks of KPMG International. Liability limited by a scheme approved under Professional Standards Legislation.
Document Classification: KPMG Confidential
Appendix A: Regional Profiles For the purpose of this report, Regional NSW is taken to incorporate the following regions, as defined by the NSW Government and illustrated below:
• Central Coast
• Central-West Orana
• Far West
• Hunter
• Illawarra-Shoalhaven
• New England and North West
• North Coast
• Riverina Murray Figure 14: Definition of Regional NSW
Unless otherwise noted, all data analysis undertaken for this report is aligned to these established regional definitions for the purposes of consistency.

KPMG | 104
© 2020 KPMG, an Australian partnership and a member firm of the KPMG network of independent member firms affiliated with KPMG International Cooperative (“KPMG International”), a Swiss entity. All rights reserved. The KPMG name and logo are registered trademarks or trademarks of KPMG International. Liability limited by a scheme approved under Professional Standards Legislation.
Document Classification: KPMG Confidential
A.1 Central Coast372
A.1.1 Regional highlights
Just over one-hour drive from Sydney and Newcastle, the Central Coast region is home to a dynamic economy featuring a range of professional and public sector services and some Australia’s best-known food and beverage producers. The region boasts favourable connectivity, linked to the National Broadband Network (NBN), major air, rail and road transport corridors and key utility and telecommunications infrastructure. The Central Coast is also home to over 24,000 businesses that take advantage of the region’s cost-competitive location and high quality of living and service availability, collectively contributing almost $11 billion to the NSW economy in 2019.373
Estimated residential population
Forecast population growth to 2041
Number of businesses
Regional GDP
344,016 people374 431,864375 22,604376 $10.9 billion
A.1.2 Demographics and Economy
The Central Coast is located in NSW fastest growing corridor, Sydney to Newcastle. The region has an aging population which has resulted in strong growth in the demand for health care and social services. Health care and social services, retail trade and construction are the region’s largest employer industries while agriculture and mining are some of the largest contributors to regional GDP.
Employed persons
Unemployment rate
Tertiary education
Working age population**
140,759377 6.9%378 58.2%379 60.6%380
Top three industry employers by share of employment in the region381
Health care and social services
Construction
Professional and financial services
372 Data for the Central Coast region has been summarised in this section based on ABS SA4 region boundaries and may not align with the DPIE regional
boundaries identified for analysis in this paper. Therefore, data presented may not accurately reflect the true values in the DPIE defined regions. Refer to
Appendix B.3 for more information.
373 Regional NSW, Central Coast, NSW Government, https://www.investregional.nsw.gov.au/regions/central-coast/
374 Regional Population Growth, Australia (released 25 March 2020).
375 NSW Department of Planning, Industry and Environment, NSW 2019 Population Projections, NSW Government.
376 Data by Region, 2013-18 (released 19 November 2019).
377 Data by Region, 2013-18 (released 19 November 2019).
378 Regional Population Growth, Australia (released 25 March 2020).
379 ABS Census, 2016.
380 Regional Population Growth, Australia (released 25 March 2020).
381 Data by Region, 2013-18 (released 19 November 2019).
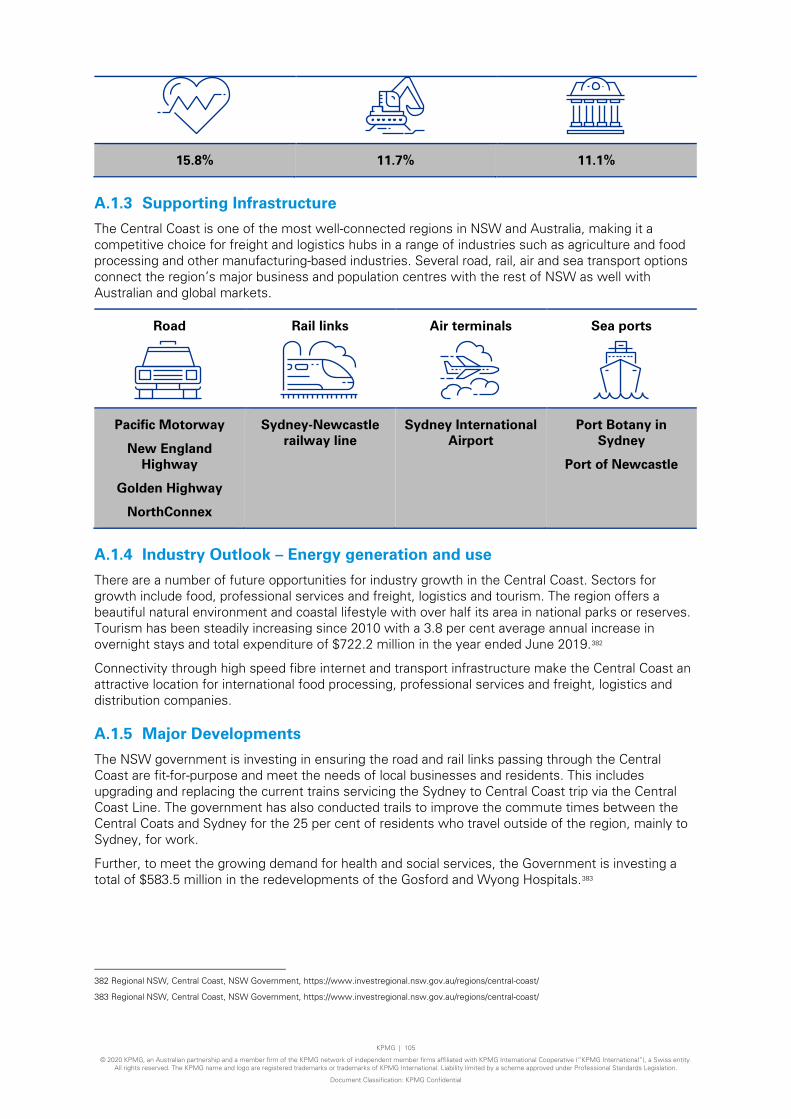
KPMG | 105
© 2020 KPMG, an Australian partnership and a member firm of the KPMG network of independent member firms affiliated with KPMG International Cooperative (“KPMG International”), a Swiss entity. All rights reserved. The KPMG name and logo are registered trademarks or trademarks of KPMG International. Liability limited by a scheme approved under Professional Standards Legislation.
Document Classification: KPMG Confidential
15.8% 11.7% 11.1%
A.1.3 Supporting Infrastructure
The Central Coast is one of the most well-connected regions in NSW and Australia, making it a competitive choice for freight and logistics hubs in a range of industries such as agriculture and food processing and other manufacturing-based industries. Several road, rail, air and sea transport options connect the region’s major business and population centres with the rest of NSW as well with Australian and global markets.
Road
Rail links
Air terminals
Sea ports
Pacific Motorway
New England Highway
Golden Highway
NorthConnex
Sydney-Newcastle railway line
Sydney International Airport
Port Botany in Sydney
Port of Newcastle
A.1.4 Industry Outlook – Energy generation and use
There are a number of future opportunities for industry growth in the Central Coast. Sectors for growth include food, professional services and freight, logistics and tourism. The region offers a beautiful natural environment and coastal lifestyle with over half its area in national parks or reserves. Tourism has been steadily increasing since 2010 with a 3.8 per cent average annual increase in overnight stays and total expenditure of $722.2 million in the year ended June 2019.382
Connectivity through high speed fibre internet and transport infrastructure make the Central Coast an attractive location for international food processing, professional services and freight, logistics and distribution companies.
A.1.5 Major Developments
The NSW government is investing in ensuring the road and rail links passing through the Central Coast are fit-for-purpose and meet the needs of local businesses and residents. This includes upgrading and replacing the current trains servicing the Sydney to Central Coast trip via the Central Coast Line. The government has also conducted trails to improve the commute times between the Central Coats and Sydney for the 25 per cent of residents who travel outside of the region, mainly to Sydney, for work.
Further, to meet the growing demand for health and social services, the Government is investing a total of $583.5 million in the redevelopments of the Gosford and Wyong Hospitals.383
382 Regional NSW, Central Coast, NSW Government, https://www.investregional.nsw.gov.au/regions/central-coast/
383 Regional NSW, Central Coast, NSW Government, https://www.investregional.nsw.gov.au/regions/central-coast/

KPMG | 106
© 2020 KPMG, an Australian partnership and a member firm of the KPMG network of independent member firms affiliated with KPMG International Cooperative (“KPMG International”), a Swiss entity. All rights reserved. The KPMG name and logo are registered trademarks or trademarks of KPMG International. Liability limited by a scheme approved under Professional Standards Legislation.
Document Classification: KPMG Confidential
A.2 Central-West Orana 384
A.2.1 Regional highlights
The Central-West Orana region has it key industry strengths in advanced manufacturing, healthcare, mining and agribusiness and food processing.
The agricultural and mining sectors are particularly strong with diverse agricultural outputs and significant deposits of coal, gold, copper, nickel, cobalt and lithium which make the twos sectors large contributors to regional GDP. The tourism industry in the region has also seen notable growth of more than 8 per cent in recent years and is projected to continue its strong growth.
Estimated residential population
Forecast population growth to 2041
Number of businesses
Regional GDP
290,604 people385 306,011386 28,165387 $14.5 billion388
A.2.2 Demographics and Economy
While mining and agriculture are the largest contributors to the regional economy, the aging population and growing tourism industry present significant growth areas for investment and employment. The tourism industry for example, has experience growth of more than 8 per cent in recent years.
Employed persons
Unemployment rate %**
Tertiary education
Working age population**
129,467389 6.2%390 57.1%391 60.6%392
Top three industry employers by share of employment393
Health care and social services
Agribusiness and food
Forestry
384 Data for the Central-West Orana region has been summarised in this section based on ABS SA4 region boundaries and may not align with the DPIE
regional boundaries identified for analysis in this paper. Therefore, data presented may not accurately reflect the true values in the DPIE defined regions.
Refer to Appendix B.3 for more information.
385 Regional Population Growth, Australia (released 25 March 2020).
386 NSW Department of Planning, Industry and Environment, NSW 2019 Population Projections, NSW Government.
387 Data by Region, 2013-18 (released 19 November 2019).
388 Regional NSW, Central Coast, NSW Government, https://www.investregional.nsw.gov.au/regions/central-coast/
389 Data by Region, 2013-18 (released 19 November 2019).
390 Data by Region, 2013-18 (released 19 November 2019).
391 ABS Census, 2016.
392 Data by Region, 2013-18 (released 19 November 2019).
393 Data by Region, 2013-18 (released 19 November 2019).

KPMG | 107
© 2020 KPMG, an Australian partnership and a member firm of the KPMG network of independent member firms affiliated with KPMG International Cooperative (“KPMG International”), a Swiss entity. All rights reserved. The KPMG name and logo are registered trademarks or trademarks of KPMG International. Liability limited by a scheme approved under Professional Standards Legislation.
Document Classification: KPMG Confidential
12.7% 9.6% 9.6%
A.2.3 Supporting Infrastructure
In the Central-West Orana region, major service and industry centres are well connected by road and rail to NSW and Australia. This makes the region a favourable location for the companies as goods and products are easily transported to other locations. Several road, rail and air transport options connect the region’s major business and population centres with the rest of NSW as well with Australian and global markets.
Road
Rail links
Air terminals
Mitchell Highway
Newell Highway
Golden Highway
Western Region Lines
Blue Mountain Lines
Dubbo City Regional Airport
Parkes Airport
Bathurst Airport
Mudgee Airport
Orange Airport
A.2.4 Industry Outlook – Energy generation and use
There are a number of future growth opportunities for industries in the Central-West Orana region. Major areas of expansion and investment include ag-tech, resource extraction and processing, freight and logistics and health care and social assistance. Food and beverage production, including fruit and boutique wines, is also a strong area of economic growth, particularly around the large centres of Mudgee and Orange. Similar to other regions across the state, the Central-West Orana region has an aging population that is placing increasing demand on local health and aged care services, providing opportunities for the sector to be expanded as the population continues to age over the coming decades.
The region has also been earmarked as one of NSW’s REZs as part of the 2019 Renewable Energy Strategy, where fast tracked infrastructure projects will focus on developing a thriving renewable energy industry that will ensure current and future demand will continue to be met at affordable prices and emissions reductions continue in line with the State’s environmental protection objectives.
A.2.5 Major Developments
The Parkes SAP will provide accelerated development and investment in the region around Parkes, proving opportunities for local business and industry to expand operations and access new markets with locally produced products. The SAP will take advantage of existing rail and road infrastructure collocated around Parkes.
The Melbourne to Brisbane Inland Rail Corridor is a major interstate infrastructure project that will link business and industry across Victoria, NSW and Queensland and enable faster movement of a greater quantity of goods between key production areas. The Parkes SAP will be collocated where the Inland

KPMG | 108
© 2020 KPMG, an Australian partnership and a member firm of the KPMG network of independent member firms affiliated with KPMG International Cooperative (“KPMG International”), a Swiss entity. All rights reserved. The KPMG name and logo are registered trademarks or trademarks of KPMG International. Liability limited by a scheme approved under Professional Standards Legislation.
Document Classification: KPMG Confidential
Rail passes through the Central-West Orana region to allow local business and industry to access more markets.

KPMG | 109
© 2020 KPMG, an Australian partnership and a member firm of the KPMG network of independent member firms affiliated with KPMG International Cooperative (“KPMG International”), a Swiss entity. All rights reserved. The KPMG name and logo are registered trademarks or trademarks of KPMG International. Liability limited by a scheme approved under Professional Standards Legislation.
Document Classification: KPMG Confidential
A.3 Far West394
A.3.1 Regional highlights
The Far West region has a small population relative to other regions in NSW and Australia. Across its vast landscape, agriculture and mining are large contributors to its regional economy. High value agriculture, including food and beverage manufacturing, broad acre cropping and grazing, and intensive agriculture and horticulture, is showing sustained growth in the region. Large scale agriculture and mining operations, as well as the local tourism industry and ecosystems are supported by one of the largest river systems in the world, the Barwon-Darling River system.395
Estimated residential population
Forecast population growth to 2041
Number of businesses
Regional GDP
39,742 people396 39,889397 3817398 $2 billion 399
A.3.2 Demographics and Economy
The Far West region contributes over $2 billion to the NSW economy. Large-scale food manufacturing and agribusiness industries are supported by key water security projects. The region is strategically placed at the crossroads of the state economies of NSW, Victoria, Queensland and South Australia, enabling opportunities to access larger domestic markets and transit routes.
While agriculture and mining are large industries in GVA terms, health care and social assistance is the largest employing industry in the region. This is primarily driven by an aging population. Just over half of the adult population have attained tertiary qualifications, indicating the presence of a larger skills and labour based workforce.
Employed persons
Unemployment rate *
Tertiary education
Working age population*
20,036400 7%401 51.8%402 60.9%403
Top three industry employers by share of employment404
394 Data for the Far West region has been summarised in this section based on ABS SA4 region boundaries and may not align with the DPIE regional
boundaries identified for analysis in this paper. Therefore, data presented may not accurately reflect the true values in the DPIE defined regions. Refer to
Appendix B.3 for more information.
395 Regional NSW, Central Coast, NSW Government, https://www.investregional.nsw.gov.au/regions/far-west/
396 Regional Population Growth, Australia (released 25 March 2020).
397 NSW Department of Planning, Industry and Environment, NSW 2019 Population Projections, NSW Government.
398 Data by Region, 2011-18 (released 19 November 2019).
399 Regional NSW, Far West, NSW Government, https://www.investregional.nsw.gov.au/regions/far-west/
400 Data by Region, 2013-18 (released 19 November 2019).
401 Data by Region, 2013-18 (released 19 November 2019).
402 ABS Census, 2016.
403 Data by Region, 2013-18 (released 19 November 2019).
404 Regional Population Growth, Australia (released 25 March 2020).

KPMG | 110
© 2020 KPMG, an Australian partnership and a member firm of the KPMG network of independent member firms affiliated with KPMG International Cooperative (“KPMG International”), a Swiss entity. All rights reserved. The KPMG name and logo are registered trademarks or trademarks of KPMG International. Liability limited by a scheme approved under Professional Standards Legislation.
Document Classification: KPMG Confidential
Health care and social assistance
Forestry
Agribusiness and food
13.1% 13.1% 12%
A.3.3 Supporting Infrastructure
The Far West region has access to a number of rail and road freight routes that enable connection with major trading ports in Adelaide, and Sydney, however, the vastness of the region does place additional costs on the transport of goods. The region is also serviced by air terminals in Broken Hill and Cobar that provide an interface with Sydney, Adelaide, Melbourne and other regional air terminals. The airports of the Far West also provide additional options for the movement of people, particularly tourists to the region.
Connectivity of supply chains to larger domestic and international export markets will continue to be improved as road and rail infrastructure projects come into service, allowing the movement of a greater quantity of tradable goods.405
Road
Rail links
Air terminals
Barrier Highway
Kamilario Highway
Mitchell Highway
Silver City Highway
Broken Hill Line
Western Region line
Broken Hill Airport
Bourke Airport
Cobar Airport
A.3.4 Industry Outlook – Energy generation and use
The number of tourists and the spending they produce has grown in the past year. The growth of tourism is driven by the region's natural heritage, national parks and a wealth of Aboriginal culture and objects.406
Energy Assets include Broken Hill and Nyngan Solar Plants. AGL Energy has developed two large-scale solar photovoltaic power plants in the Far West region.407
A.3.5 Major Developments
The Aboriginal and Local Job Skills Pilot represents investment that is planned to build local employment. The pilot will help young people transition from training to employment in Bourke, Brewarrina, Cobar and Walgett, by partnering with suppliers to generate demand for local jobs.408
Mobile phone coverage is a significant challenge along major transportation routes and in smaller communities. To address this, a priority in the Far West is to improve connectivity by upgrading or
405Regional NSW, Far West, NSW Government, https://www.investregional.nsw.gov.au/regions/far-west/
406 Regional NSW, Far West, NSW Government, https://www.investregional.nsw.gov.au/regions/far-west/
407 Regional NSW, Far West, NSW Government, https://www.investregional.nsw.gov.au/regions/far-west/https://www.investregional.nsw.gov.au/success-
stories/broken-hill-and-nyngan-solar-plants/
408 NSW Government, Far West, https://www.nsw.gov.au/our-regions/far-west

KPMG | 111
© 2020 KPMG, an Australian partnership and a member firm of the KPMG network of independent member firms affiliated with KPMG International Cooperative (“KPMG International”), a Swiss entity. All rights reserved. The KPMG name and logo are registered trademarks or trademarks of KPMG International. Liability limited by a scheme approved under Professional Standards Legislation.
Document Classification: KPMG Confidential
developing new mobile base stations. The purpose will be to remove black spot sites, improving lives and provide better connectivity409
A.4 Hunter Valley410
A.4.1 Regional highlights411
The Hunter Valley is one of NSW’s most popular destinations, located just two hours’ drive north of Sydney. Its major Port, the Port of Newcastle, provides easy access to markets and the Asia Pacific region.
The region has strong local industries such as defence, education, health and advanced manufacturing industries The Hunter wine region is one of Australia's best-known wine regions, playing a pivotal role in the history of Australian wine as one of the first wine regions planted in the early 19th century. There are approximately 50,862 businesses operating in Hunter region. Technological investment by the NSW government in the ‘Internet of Things' network across Newcastle CBD encourages potential growth.412
Estimated residential population
Forecast population growth to 2041
Number of businesses
Regional GDP
747,944 people413 863,131414 50,862415 $34.7 billion 416
A.4.2 Demographics and Economy417
The contribution of the Hunter region to NSW’s economy is the largest among all the region in regional NSW. Mining accounts for 38 per cent of the revenue generated in the region.
The Hunter region has a diverse economy with qualities across cutting edge producing, aviation, defence, the travel industry and mining. The Hunter wine region is one of Australia's best known wine regions, playing a pivotal role in the history of Australian wine as one of the first wine regions planted in the early 19th century. The University in Hunter provide world class talent pool to support the growth of different industries in the region. The Hunter consolidates and provide favourable business condition with connectivity to other areas.
Employed persons
Unemployment rate
Tertiary education
Working age population**
409 NSW Government, Far West, https://www.nsw.gov.au/our-regions/far-west
410 Data for the Hunter region has been summarised in this section based on ABS SA4 region boundaries and may not align with the DPIE regional
boundaries identified for analysis in this paper. Therefore, data presented may not accurately reflect the true values in the DPIE defined regions. Refer to
Appendix B.3 for more information.
411 Regional NSW, Hunter, NSW Government, https://www.investregional.nsw.gov.au/regions/hunter/
412 Regional NSW, Hunter, NSW Government, https://www.investregional.nsw.gov.au/regions/hunter/
413 Regional Population Growth, Australia (released 25 March 2020).
414 NSW Department of Planning, Industry and Environment, NSW 2019 Population Projections, NSW Government.
415 Data by Region, 2013-18 (released 19 November 2019).
416 Regional NSW, Hunter, NSW Government, https://www.investregional.nsw.gov.au/regions/hunter/
417 Regional NSW, Hunter, NSW Government, https://www.investregional.nsw.gov.au/regions/hunter/
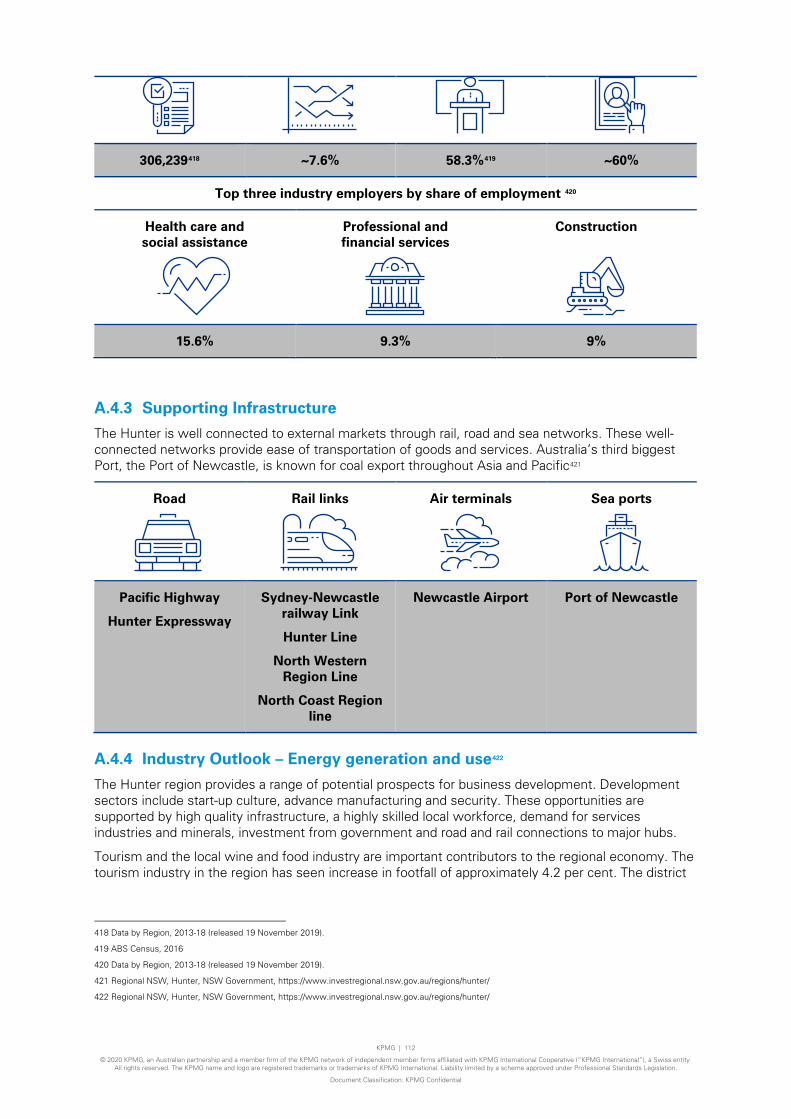
KPMG | 112
© 2020 KPMG, an Australian partnership and a member firm of the KPMG network of independent member firms affiliated with KPMG International Cooperative (“KPMG International”), a Swiss entity. All rights reserved. The KPMG name and logo are registered trademarks or trademarks of KPMG International. Liability limited by a scheme approved under Professional Standards Legislation.
Document Classification: KPMG Confidential
306,239418 ~7.6% 58.3%419 ~60%
Top three industry employers by share of employment 420
Health care and social assistance
Professional and financial services
Construction
15.6% 9.3% 9%
A.4.3 Supporting Infrastructure
The Hunter is well connected to external markets through rail, road and sea networks. These well-connected networks provide ease of transportation of goods and services. Australia’s third biggest Port, the Port of Newcastle, is known for coal export throughout Asia and Pacific421
Road
Rail links
Air terminals
Sea ports
Pacific Highway
Hunter Expressway
Sydney-Newcastle railway Link
Hunter Line
North Western Region Line
North Coast Region line
Newcastle Airport Port of Newcastle
A.4.4 Industry Outlook – Energy generation and use422
The Hunter region provides a range of potential prospects for business development. Development sectors include start-up culture, advance manufacturing and security. These opportunities are supported by high quality infrastructure, a highly skilled local workforce, demand for services industries and minerals, investment from government and road and rail connections to major hubs.
Tourism and the local wine and food industry are important contributors to the regional economy. The tourism industry in the region has seen increase in footfall of approximately 4.2 per cent. The district
418 Data by Region, 2013-18 (released 19 November 2019).
419 ABS Census, 2016
420 Data by Region, 2013-18 (released 19 November 2019).
421 Regional NSW, Hunter, NSW Government, https://www.investregional.nsw.gov.au/regions/hunter/
422 Regional NSW, Hunter, NSW Government, https://www.investregional.nsw.gov.au/regions/hunter/

KPMG | 113
© 2020 KPMG, an Australian partnership and a member firm of the KPMG network of independent member firms affiliated with KPMG International Cooperative (“KPMG International”), a Swiss entity. All rights reserved. The KPMG name and logo are registered trademarks or trademarks of KPMG International. Liability limited by a scheme approved under Professional Standards Legislation.
Document Classification: KPMG Confidential
is home to a multi-million-dollar pure blood horse rearing industry, world-class wineries and national parks, and its stream estuaries are the biggest clam makers in the state.423
Hunter Energy is looking to create energy from renewable source and focusing on using waste and non-reusable products such as biomass, waste mine gas, waste wood products and refuse waste to meet energy demand in the region. Hunter Energy has recently acquired Redbank Power Station for this424
A.4.5 Major Developments
The Williamtown Special Activation Precinct has been announced to create the defence and aerospace hub in this region.425 The precinct will create new jobs and boost the local economy. This will attract talent, people and business across the nations to Hunter, boosting research in field of defence and aerospace.
The Hunter Innovation Project aims to transform the region into a digitally innovated region. The project has three pillars: a new innovation hub, a digital precinct and smart city infrastructure. The new innovation hub will support technology focused industries and the project has received funding of $17.8 million so far.426
423 Regional NSW, Hunter, NSW Government, https://www.investregional.nsw.gov.au/regions/hunter/
424 Hunter Energy, https://hunterenergy.com.au/
425 Regional NSW, Hunter, NSW Government, https://www.investregional.nsw.gov.au/regions/hunter/
426 Regional NSW, Hunter, NSW Government, https://www.investregional.nsw.gov.au/regions/hunter/

KPMG | 114
© 2020 KPMG, an Australian partnership and a member firm of the KPMG network of independent member firms affiliated with KPMG International Cooperative (“KPMG International”), a Swiss entity. All rights reserved. The KPMG name and logo are registered trademarks or trademarks of KPMG International. Liability limited by a scheme approved under Professional Standards Legislation.
Document Classification: KPMG Confidential
A.6 Illawarra-Shoalhaven427
A.6.1 Regional highlights
The Illawarra-Shoalhaven region is advantageously located just one hour from Sydney airport, giving it network benefits from global and domestic markets. The region is home to natural resources such as coal and other minerals which support manufacturing sectors.
In recent years, freight and logistics have emerged as growth sectors due to the expansion of Port Kembla. The region has strong presence in defence and provides technology and services to Australia and other countries. The natural beauty of the area, vibrant economy and relaxed lifestyle along the coast makes it an enticing place for people to stay, work and play.428
Estimated residential population
Forecast population growth to 2041
Number of businesses
Regional GDP
420,140 people429 504,910430 24,934431 $15.5 billion 432
A.6.2 Demographics and Economy
The Illawarra-Shoalhaven region contributes A$15.5 billion to NSW annually, supporting 24,900 businesses.433
In the past, the region was known for world-class steel making and coal mining industries, but sectors such as advanced manufacturing, ICT, professional services and defence have grown significantly in recent years. Together, these sectors make Illawarra-Shoalhaven the third-largest economy in NSW. The region’s national parks and diversity of wildlife make it an attractive place for tourists to visit.
Employed persons
Unemployment rate
Tertiary education
Working age population**
427 Data for the Illawarra-Shoalhaven region has been summarised in this section based on ABS SA4 region boundaries and may not align with the DPIE
regional boundaries identified for analysis in this paper. Therefore, data presented may not accurately reflect the true values in the DPIE defined regions.
Refer to Appendix B.3 for more information.
428 Regional NSW, Illawarra-Shoalhaven, NSW Government, https://www.investregional.nsw.gov.au/regions/illawarra-shoalhaven/
429 Regional Population Growth, Australia (released 25 March 2020).
430 NSW Department of Planning, Industry and Environment, NSW 2019 Population Projections, NSW Government.
431 Data by Region, 2013-18 (released 19 November 2019).
432 Regional NSW, Illawarra-Shoalhaven, NSW Government, https://www.investregional.nsw.gov.au/regions/illawarra-shoalhaven/
433 Regional NSW, Illawarra-Shoalhaven, NSW Government, https://www.investregional.nsw.gov.au/regions/illawarra-shoalhaven/

KPMG | 115
© 2020 KPMG, an Australian partnership and a member firm of the KPMG network of independent member firms affiliated with KPMG International Cooperative (“KPMG International”), a Swiss entity. All rights reserved. The KPMG name and logo are registered trademarks or trademarks of KPMG International. Liability limited by a scheme approved under Professional Standards Legislation.
Document Classification: KPMG Confidential
165,053434 6.9%435 59.7%436 64.1%437
Top three industry employers by share of employment 438
Health care and aged care
Education
Construction and infrastructure
15.2% 10.6% 10.2%
A.6.3 Supporting Infrastructure
Illawarra-Shoalhaven is serviced by excellent infrastructure including access to the NBN and several road, rail, air and sea transport options which connect the region’s major business and population centres with the rest of NSW and with Australian and global markets.439
Road
Rail links
Air terminals
Sea ports
Princess Highway South Coast Line Shellharbour Airport
Moruya Airport
Port Kembla
A.6.4 Industry Outlook – Energy generation and use440
The region, which was previously known for world class steel manufacturing and mining industries, has now emerged as growth sector for freight and logistics supported by expansion of Port Kembla.
Due to world class University of Wollongong, the region produces talent for innovation and research. The Kangaroo Valley is considered a prime tourist hotspot featuring rolling agricultural landscapes and dairy industries. The presence of Australia’s only naval air station along with two naval bases provide opportunities in defence and manufacturing sector
Kangaroo Valley Pumping and Power Station: Eraring Energy is leading the hydro-electric power generation Shoalhaven Scheme. The Canberra -Dapto transmission line is used to feed power to state.441
434 Data by Region, 2013-18 (released 19 November 2019).
435 This figure is based on data for the Illawarra region, based on ABS SA4 region boundaries. The latest figure for unemployment in the region is from
2016. These may not align with the DPIE regional boundaries identified for analysis in this paper. Therefore, data presented may not accurately reflect the
true values in the DPIE defined regions. Refer to Appendix B.3 for more information.
436 ABS Census, 2016.
437 This figure is based on data for the Illawarra region, based on ABS SA4 region boundaries. These may not align with the DPIE regional boundaries
identified for analysis in this paper. Therefore, data presented may not accurately reflect the true values in the DPIE defined regions. Refer to Appendix B.3
for more information.
438 Data by Region, 2013-18 (released 19 November 2019).
439 Regional NSW, Illawarra-Shoalhaven, NSW Government, https://www.investregional.nsw.gov.au/regions/illawarra-shoalhaven/
440 Regional NSW, Illawarra-Shoalhaven, NSW Government, https://www.investregional.nsw.gov.au/regions/illawarra-shoalhaven/
441 Water NSW, Dams of Greater Sydney and Surround: Shoalhaven, https://www.waternsw.com.au/__data/assets/pdf_file/0006/55923/Shoalhaven-Dam-
Booklet_WEB1.pdf

KPMG | 116
© 2020 KPMG, an Australian partnership and a member firm of the KPMG network of independent member firms affiliated with KPMG International Cooperative (“KPMG International”), a Swiss entity. All rights reserved. The KPMG name and logo are registered trademarks or trademarks of KPMG International. Liability limited by a scheme approved under Professional Standards Legislation.
Document Classification: KPMG Confidential
A.6.5 Major Developments
Port-Kembla Community Investment Fund: The NSW Government has established the Port Kembla Community Investment Fund to activate, enhance and build community amenity in Port Kembla. The program is designed to achieve:
• Increased economic activity;
• Enhanced activation and connectivity of public infrastructure, precincts and community spaces;
• Improved environmental air, land and waterway quality; and
• Projects funded under the fund must positively contribute to one or more of these desired outcomes.
Port Kembla Revitalisation Plan: The motive of this project to improve and expand Port Kembla which supports transport of goods and connectivity with other regions and countries. As part of this project, a partnership with Wollongong City Council will be established and $1 million per annum will be provided to the Port Kembla Community Investment Fund to find ways to use surplus land and create jobs and employment.442
Other major developments include road and rail upgrade underway and planned for in the Wollongong and surrounding areas. This includes upgrades to the Albion Park bypass and the berry bypass to improve connectivity, access and travel times.
442 NSW Government, Illawarra-Shoalhaven, https://www.nsw.gov.au/our-regions/illawarra-shoalhaven.

KPMG | 117
© 2020 KPMG, an Australian partnership and a member firm of the KPMG network of independent member firms affiliated with KPMG International Cooperative (“KPMG International”), a Swiss entity. All rights reserved. The KPMG name and logo are registered trademarks or trademarks of KPMG International. Liability limited by a scheme approved under Professional Standards Legislation.
Document Classification: KPMG Confidential
A.7 New England and North West443
A.7.1 Regional highlights
Located approximately halfway between Sydney and Brisbane, the New England & North West region has a diverse economy. The agriculture sector is so strong that it represents approximately one fifth of NSW agriculture produce.444 The region is rich in minerals such as coal, metal and gemstone, make it the ideal location for mining industries. The region’s connectivity by rail and road transportation and good broadband network connectivity attracts business across sectors. The region has strong renewable energy sector, including a wind energy plant which produces energy for the region.445
Estimated residential population
Forecast population growth to 2041
Number of businesses
Regional GDP
187,071 people446 190,965447 >20,256448 $8.4 billion 449
A.7.2 Demographics and Economy
There are approximately 20,256 businesses in the region and employ approximately 87,296 people. The region contributes over A$8.4 billion to the NSW economy and is known for its agriculture products, for which there is demand in domestic and international markets. Examples of agriculture products that the region supplies domestically and internationally include grains and pulses, beef, citrus, cotton, lamb, nuts, vegetables, poultry.450
The agribusiness and forestry sectors employ the largest proportion of people (12.9%) followed by health care and aged care employ 11.6% of people.
Employed persons
Unemployment rate
Tertiary education
Working age population**
443 Data for the New England and North West region has been summarised in this section based on ABS SA4 region boundaries and may not align with the
DPIE regional boundaries identified for analysis in this paper. Therefore, data presented may not accurately reflect the true values in the DPIE defined
regions. Refer to Appendix B.3 for more information.
444 Regional NSW, New England and North West, NSW Government,
https://www.investregional.nsw.gov.au/regions/new-england-and-north-west/
445 Regional NSW, New England and North West, NSW Government,
https://www.investregional.nsw.gov.au/regions/new-england-and-north-west/
446 Regional Population Growth, Australia (released 25 March 2020).
447 NSW Department of Planning, Industry and Environment, NSW 2019 Population Projections, NSW Government.
448 Data by Region, 2013-18 (released 19 November 2019).
449 Regional NSW, New England and North West, NSW Government,
https://www.investregional.nsw.gov.au/regions/new-england-and-north-west/
450 Regional NSW, New England and North West, NSW Government, https://www.investregional.nsw.gov.au/regions/new-england-and-north-west/west

KPMG | 118
© 2020 KPMG, an Australian partnership and a member firm of the KPMG network of independent member firms affiliated with KPMG International Cooperative (“KPMG International”), a Swiss entity. All rights reserved. The KPMG name and logo are registered trademarks or trademarks of KPMG International. Liability limited by a scheme approved under Professional Standards Legislation.
Document Classification: KPMG Confidential
87,296451 6.4% 55.7%452 60.6%
Top three industry employers by share of employment 453
Agribusiness and food
Forestry
Health and aged care
Agribusiness and food
12.9%
Forestry
12.9%
Health and aged care
11.6%
A.7.3 Supporting Infrastructure
The region’s air, rail and road infrastructure as well as broadband network ensures good connectivity to other NSW regions and Australian states. The region is located close to Sydney which provides access to key road and rail network for business purposes. 454
Road
Rail links
Air terminals
Sea ports
Newell Highway
Gwydir Highway
New England Highway
Kamilaroi Highway
North Western Region Line
Narrabri
Armidale
Inverell
Moree
A.7.4 Industry Outlook – Energy generation and use
Favourable climate and rich soils enable continued growth of the region’s agribusiness and horticulture sector. The region also produces renewable energy, including solar and wind resources, in order to meet energy demand.
The New England and North West region is home to one of the largest solar farms in Australia ‘The White Rock Wind and Solar Farm’ at Moree.455 This solar farm plays a vital role in meeting household and business needs, as it was designed to generate 175 megawatts to provide energy to 105,000 households. 456
There is also a unique opportunity to generate additional wind energy on the Tablelands. The region is home to NSW’s largest wind farm ‘Sapphire’, which has 75 turbines that can power 115,000 homes.
451 Data by Region, 2013-18 (released 19 November 2019).
452 ABS Census, 2016.
453 Data by Region, 2011-18 (released 19 November 2019).
454 Regional NSW, New England and North West, NSW Government, https://www.investregional.nsw.gov.au/regions/new-england-and-north-west/
455 Regional NSW, Goldwind Australia, https://www.investregional.nsw.gov.au/success-stories/white-rock-wind-and-solar-farm-project/
456 Regional NSW, Goldwind Australia, https://www.investregional.nsw.gov.au/success-stories/white-rock-wind-and-solar-farm-project/

KPMG | 119
© 2020 KPMG, an Australian partnership and a member firm of the KPMG network of independent member firms affiliated with KPMG International Cooperative (“KPMG International”), a Swiss entity. All rights reserved. The KPMG name and logo are registered trademarks or trademarks of KPMG International. Liability limited by a scheme approved under Professional Standards Legislation.
Document Classification: KPMG Confidential
A.7.5 Major Developments
An investment of $9.3 billion has been made for the Inland Rail project. The project will increase connectivity, freight productivity and upgrades road network infrastructure investment.457
The Moree Special Activation Precinct represents a new business hub that specialises in agribusiness, logistics and food processing industries. The Precinct will also take advantage of existing infrastructure.458
457 Regional NSW, New England and North West, NSW Government, https://www.investregional.nsw.gov.au/regions/new-england-and-north-west/
458 Regional NSW, New England and North West, NSW Government, https://www.investregional.nsw.gov.au/regions/new-england-and-north-west/

KPMG | 120
© 2020 KPMG, an Australian partnership and a member firm of the KPMG network of independent member firms affiliated with KPMG International Cooperative (“KPMG International”), a Swiss entity. All rights reserved. The KPMG name and logo are registered trademarks or trademarks of KPMG International. Liability limited by a scheme approved under Professional Standards Legislation.
Document Classification: KPMG Confidential
A.8 North Coast459
A.8.1 Regional highlights
The North Coast is known for its pleasant and biological diverse environment. Tourism in the region attracts approximately 13.7 million people in 2018, generating employment for the local population.460 The region provides a high quality of life for residents, despite population increases in recent years.
The region has strong manufacturing sectors across food, defence, transport and timber as a result of its skilled labour workforce.461
Estimated residential population
Forecast population growth to 2041
Number of businesses
Regional GDP
528,663 people462 570,351463 >43,321464 $17.8 billion 465
A.8.2 Demographics and Economy
Due to its strengths in agriculture, horticulture, and aquaculture, the North Coast has long been known as an exporter of high quality food and beverage, contributing A$ 17.8 billion to the NSW economy.466 The region is well equipped with productive farmland and exports macadamia and pecan nuts to other states and countries.
There are approximately 43,321 businesses operating in this region, which provide employment to approximately 203,551 people.467
Employed persons
Unemployment rate
Tertiary education
Working age population**
459 Data for the North Coast region has been summarised in this section based on ABS SA4 region boundaries and may not align with the DPIE regional
boundaries identified for analysis in this paper. Therefore, data presented may not accurately reflect the true values in the DPIE defined regions. Refer to
Appendix B.3 for more information.
460 Regional NSW, North Coast, NSW Government, https://www.investregional.nsw.gov.au/regions/north-coast/
461 Regional NSW, North Coast, NSW Government, https://www.investregional.nsw.gov.au/regions/north-coast/
462 Regional Population Growth, Australia (released 25 March 2020).
463 NSW Department of Planning, Industry and Environment, NSW 2019 Population Projections, NSW Government.
464 Data by Region, 2013-18 (released 19 November 2019).
465 Regional NSW, North Coast, NSW Government, https://www.investregional.nsw.gov.au/regions/north-coast/
466 Regional NSW, North Coast, NSW Government, https://www.investregional.nsw.gov.au/regions/north-coast
467 Regional NSW, North Coast, NSW Government, https://www.investregional.nsw.gov.au/regions/north-coast

KPMG | 121
© 2020 KPMG, an Australian partnership and a member firm of the KPMG network of independent member firms affiliated with KPMG International Cooperative (“KPMG International”), a Swiss entity. All rights reserved. The KPMG name and logo are registered trademarks or trademarks of KPMG International. Liability limited by a scheme approved under Professional Standards Legislation.
Document Classification: KPMG Confidential
203,551468 8.1%469 59.1%470 55.4%471
Top three industry employers by share of employment 472
Health and aged care
Construction
Education
Health and aged care
16.3%
Construction
9.5%
Education
9.3%
A.8.3 Supporting Infrastructure
The region is surrounded by cosmopolitan cities of Sydney and Brisbane, and the Pacific Highway provides connectivity via road. The Port of Yamba is the region’s main commercial port and is widely used for exporting and importing goods. There are six air terminals that provide air transport and connect the region to other regions and states473
Road
Rail links
Air terminals
Sea ports
Pacific Highway
New England Highway
North Coast Region line
Lismore
Grafton
Ballina
Coffs Harbour
Tweed heads
Port of Yamba
Port Macquarie
A.8.4 Industry Outlook – Energy generation and use
There are a number of future opportunities for industry growth in the North Coast. Sectors for growth include food, manufacturing, renewable energy and tourism. The region’s clean, green environment, soils and climatic conditions enable an expanding high-value food and beverage industry.
The region benefits from several nationally recognised tourist attractions and some of the state’s most important environmental and cultural heritage sites, with potential for further tourism growth.
468 Data by Region, 2013-18 (released 19 November 2019).
469 This figure is based on data for the Mid North Coast region, based on ABS SA4 region boundaries. The latest unemployment data for the region is from
2016. ABS SA4 region boundaries may not align with the DPIE regional boundaries identified for analysis in this paper. Therefore, data presented may not
accurately reflect the true values in the DPIE defined regions. Refer to Appendix B.3 for more information.
470 ABS Census, 2016.
471 Data for the North Coast region has been summarised in this section based on ABS SA4 region boundaries and may not align with the DPIE regional
boundaries identified for analysis in this paper. Therefore, data presented may not accurately reflect the true values in the DPIE defined regions. Refer to
Appendix B.3 for more information.
472 Data by Region, 2013-18 (released 19 November 2019).
473 Regional NSW, North Coast, NSW Government, https://www.investregional.nsw.gov.au/regions/north-coast

KPMG | 122
© 2020 KPMG, an Australian partnership and a member firm of the KPMG network of independent member firms affiliated with KPMG International Cooperative (“KPMG International”), a Swiss entity. All rights reserved. The KPMG name and logo are registered trademarks or trademarks of KPMG International. Liability limited by a scheme approved under Professional Standards Legislation.
Document Classification: KPMG Confidential
The ongoing protection of the natural environment and wise use and management of natural resources is critical for sustainability of the region.
Renewable energy has strong regional support and private investment into alternative energy supplies is encouraged.474
A.8.5 Major Developments
The government has invested in a number of infrastructure projects, including $4.35 billion to upgrade the Pacific Highway between Woolgoolga and Ballina by 2020 and a further $12.9 million to upgrade the region’s airports. These investments will improve connectivity to the region.
The government has also invested in the development of a 1,700-bed correctional facility at Grafton.475
474 Regional NSW, North Coast, NSW Government, https://www.investregional.nsw.gov.au/regions/north-coast
475Regional NSW, North Coast, NSW Government, https://www.nsw.gov.au/our-regions/north-coast

KPMG | 123
© 2020 KPMG, an Australian partnership and a member firm of the KPMG network of independent member firms affiliated with KPMG International Cooperative (“KPMG International”), a Swiss entity. All rights reserved. The KPMG name and logo are registered trademarks or trademarks of KPMG International. Liability limited by a scheme approved under Professional Standards Legislation.
Document Classification: KPMG Confidential
A.9 Riverina Murray476
A.9.1 Regional highlights
The Riverina Murray region is popular for its food production and is one of the country’s major food producing region. The region’s growth in agriculture is supported by Murray and Murrumbidgee rivers which have national significance. The region's booming manufacturing, health care and social assistance and farming sectors are the region's main employers. Tourism has also seen increase in recent years, contributing $1.5 billion in expenditure of regional economy.477
Estimated residential population
Forecast population growth to 2041
Number of businesses
Regional GDP
282,501 people478 284,269479 ~26,833480 $13.2 billion 481
A.9.2 Demographics and Economy
Known as the ‘food bowl of NSW’, Riverina Murray contributes around A$3.1 billion to agricultural production.482 The area is capitalizing on rising demand for agricultural products, value-added manufacturing and, increasingly, sustainable tourism in Asia and other countries. With research and development expertise in grain, livestock, olive oil and wine production, the renowned AgTech cluster in Wagga Wagga partners closely with industry to innovate and add value to the global food value chains, thus cause increase in employment.
Employed persons
Unemployment rate
Tertiary education
Working age population**
132,545483 5.2%484 55.6%485 61.9%486
476 Data for the Riverina Murray region has been summarised in this section based on ABS SA4 region boundaries and may not align with the DPIE regional
boundaries identified for analysis in this paper. Therefore, data presented may not accurately reflect the true values in the DPIE defined regions. Refer to
Appendix B.3 for more information.
477 Regional NSW, Riverina-Murray, NSW Government, https://www.investregional.nsw.gov.au/regions/riverina-murray/
478 Regional Population Growth, Australia (released 25 March 2020).
479 NSW Department of Planning, Industry and Environment, NSW 2019 Population Projections, NSW Government.
480 Data by Region, 2013-18 (released 19 November 2019).
481 Regional NSW, Riverina-Murray, NSW Government, https://www.investregional.nsw.gov.au/regions/riverina-murray/
482 Regional NSW, Riverina Murray, NSW Government, https://www.investregional.nsw.gov.au/regions/riverina-murray/
483 Data by Region, 2013-18 (released 19 November 2019).
484 This figure is based on data for the Riverina region, based on ABS SA4 region boundaries. These may not align with the DPIE regional boundaries
identified for analysis in this paper. Therefore, data presented may not accurately reflect the true values in the DPIE defined regions. Refer to Appendix B.3
for more information. The latest unemployment data for the region is from 2016.
485 ABS Census, 2016.
486 This figure is based on the Riverina area, as per the ABS SA4 region boundaries and may not align with the DPIE regional boundaries identified for
analysis in this paper. Therefore, data presented may not accurately reflect the true values in the DPIE defined regions. Refer to Appendix B.3 for more
information.

KPMG | 124
© 2020 KPMG, an Australian partnership and a member firm of the KPMG network of independent member firms affiliated with KPMG International Cooperative (“KPMG International”), a Swiss entity. All rights reserved. The KPMG name and logo are registered trademarks or trademarks of KPMG International. Liability limited by a scheme approved under Professional Standards Legislation.
Document Classification: KPMG Confidential
Top three industry employers by share of employment 487
Health care and age care
Agriculture
Forestry
11.7% 10.7% 10.7%
A.9.3 Supporting Infrastructure
The Riverina Murray is linked to both domestic and international markets through a series of national freight corridors. These corridors connect the region to ports and international airports, which benefit the freight and logistics industries in the region. Charles Sturt University provides talent for a variety of regional industries488
Road
Rail links
Air terminals
Sea ports
Sturt Highway
Olympic Highway
Goldfields Highway
Cobb Highway
Newell Highway
Southern Region line Griffith
Narrendera
Wagga Wagga
A.9.4 Industry Outlook – Energy generation and use
The Riverina Murray area offers a range of potential opportunities for industry development and growth sectors include agribusiness, food, forestry and manufacturing advancement. The region has a good reputation in sustainable resource management and continues to utilise technology to optimize its diversification of agricultural resources. Development will be powered by advancement in agricultural technology and productivity, new freight and transport links, the effects of water trade and regulation and the economic conditions at national and global level. 489
A.9.5 Major Developments
Wagga is a highly open city with rail and road links to major cities in Australia including Sydney, Melbourne, Adelaide and Canberra. A new Special Activation Precinct will expand on private and government investments already made, creating an effective transport and logistics hub that will provide faster access, create jobs and attract investors, which will make the region an ideal place for business490
487 Regional Population Growth, Australia (released 25 March 2020).
488 Regional NSW, Riverina-Murray, NSW Government, https://www.investregional.nsw.gov.au/regions/riverina-murray/
489 Regional NSW, Riverina-Murray, NSW Government, https://www.investregional.nsw.gov.au/regions/riverina-murray/
490 Regional NSW, Riverina-Murray, NSW Government, https://www.investregional.nsw.gov.au/regions/riverina-murray/

KPMG | 125
© 2020 KPMG, an Australian partnership and a member firm of the KPMG network of independent member firms affiliated with KPMG International Cooperative (“KPMG International”), a Swiss entity. All rights reserved. The KPMG name and logo are registered trademarks or trademarks of KPMG International. Liability limited by a scheme approved under Professional Standards Legislation.
Document Classification: KPMG Confidential
A.10 South East and Tablelands 491
A.10.1 Regional highlights
The South East and Tablelands region has close links to the Australian Capital Territory and incorporates the Snowy Mountains, Hilltops and the Far South Coast. Major town centres include Bega, Cooma, Goulburn, Queanbeyan and Young, while historic towns and villages such as Braidwood and Tilba offer unique cultural and lifestyle experiences for visitors and residents.
The region is characterised by rural landscapes and is supported by strong tourism and agriculture industries.492
Estimated residential population
Forecast population growth to 2041
Number of businesses
Regional GDP
229,910493 278,215494 25,723495 $10.1 billion496
A.10.2 Demographics and Economy
The South East and Tablelands region is a significant producer of renewable energy, agricultural, manufactured food and aquaculture products. Primary industries include dairy and aquaculture and products are exported to other Australian states and to the Asia-Pacific region through the Port of Eden.497
Tourism to the region has been growing in recent years, especially through cruises from the Port of Eden and tourists visiting Jindabyne and the Snowy Mountains.498
Employed persons
Unemployment rate
Tertiary education
Working age population**
491 Data for the South East and Tablelands region has been summarised in this section based on ABS SA4 region boundaries and may not align with the
DPIE regional boundaries identified for analysis in this paper. Therefore, data presented may not accurately reflect the true values in the DPIE defined
regions. Refer to Appendix B.3 for more information.
492 NSW Government, Snowy Mountains Special Activation Precinct, https://www.nsw.gov.au/snowy-hydro-legacy-fund/special-activation-precincts/snowy-
mountains-special-activation-precinct.
493 Regional Population Growth, Australia (released 25 March 2020). This figure is based on ABS SA4 region boundaries and may not align with the DPIE
regional boundaries identified for analysis in this paper.
494 NSW Department of Planning, Industry and Environment, NSW 2019 Population Projections, NSW Government.
495 Regional NSW, South East and Tablelands, NSW Government,https://www.investregional.nsw.gov.au/regions/south-east-and-tablelands/.
496 Regional NSW, South East and Tablelands, NSW Government,https://www.investregional.nsw.gov.au/regions/south-east-and-tablelands/.
497 NSW Government, South East and Tablelands, https://www.nsw.gov.au/our-regions/south-east-tablelands
498 Regional NSW, South East and Tablelands, NSW Government,https://www.investregional.nsw.gov.au/regions/south-east-and-tablelands/.

KPMG | 126
© 2020 KPMG, an Australian partnership and a member firm of the KPMG network of independent member firms affiliated with KPMG International Cooperative (“KPMG International”), a Swiss entity. All rights reserved. The KPMG name and logo are registered trademarks or trademarks of KPMG International. Liability limited by a scheme approved under Professional Standards Legislation.
Document Classification: KPMG Confidential
97,339499 4.9%500 x501 61.2%502
Top three industry employers by share of employment 503
Public administration and safety
Health care and social assistance
Retail trade
14.1% 11.6% 9.8%
A.10.3 Supporting Infrastructure
The region is well connected to domestic and international markets, due to its proximity to Canberra, the international airport and the Port of Eden. The region is also connected to the rest of NSW through a series of major road and rail networks.504
Road
Rail links
Air terminals
Sea ports
Princes Highway
Snowy Mountains Highway
Monaro Highway
Kings Highway
Southern Rail line
Rail line to Canberra Canberra
International Airport
Cooma Airport
Meriumbula Airport
Moruya Airport
Port of Eden
A.10.4 Industry Outlook – Energy generation and use
The NSW Government has made significant investment in the Snowy Hydro Scheme and wind and solar farms across the South East and Tablelands, making the region well-known for its renewable energy.505
Some areas across the region, including the Bega Valley, Eurobodalla and Wingecarribee Shires, have large populations of people above 65 years. As the population continues to age across the region,
499 Data by Region, 2013-18 (released 19 November 2019). This figure is based on the Capital Region, as per the ABS SA4 region boundaries and may not
align with the DPIE regional boundaries identified for analysis in this paper. Therefore, data presented may not accurately reflect the true values in the DPIE
defined regions. Refer to Appendix B.3 for more information. The latest available employment data for the region is from 2016.
500 This figure is based on data for the Capital region, based on ABS SA4 region boundaries. These may not align with the DPIE regional boundaries
identified for analysis in this paper. Therefore, data presented may not accurately reflect the true values in the DPIE defined regions. Refer to Appendix B.3
for more information. The latest unemployment data for the region is from 2016.
501 ABS Census, 2016.
502 This figure is based on the Capital Region, as per the ABS SA4 region boundaries and may not align with the DPIE regional boundaries identified for
analysis in this paper. Therefore, data presented may not accurately reflect the true values in the DPIE defined regions. Refer to Appendix B.3 for more
information.
503 Regional Population Growth, Australia (released 25 March 2020). This figure is based on the Capital Region, as per the ABS SA4 region boundaries and
may not align with the DPIE regional boundaries identified for analysis in this paper. Therefore, data presented may not accurately reflect the true values in
the DPIE defined regions. Refer to Appendix B.3 for more information.
504 Regional NSW, South East and Tablelands, NSW Government,https://www.investregional.nsw.gov.au/regions/south-east-and-tablelands/.
505 NSW Government, South East and Tablelands, https://www.nsw.gov.au/our-regions/south-east-tablelands

KPMG | 127
© 2020 KPMG, an Australian partnership and a member firm of the KPMG network of independent member firms affiliated with KPMG International Cooperative (“KPMG International”), a Swiss entity. All rights reserved. The KPMG name and logo are registered trademarks or trademarks of KPMG International. Liability limited by a scheme approved under Professional Standards Legislation.
Document Classification: KPMG Confidential
there will be increased demand for health and aged care services and therefore a growth in these sectors.506
A.10.5 Major Developments
Snowy Mountains Special Activation Precinct: the development of the Snowy Mountains SAP is currently being investigated and will focus on Jindabyne’s town centre and Kosciuszko National Park. The aim of the SAP is to increase tourism and to grow Jindabyne to become ‘Australia’s Alpine Capital’.507
The redevelopment of the Port of Eden will support the growing tourism industry in the region. The project will enable the Port to accommodate cruise ships with a larger number of passengers.
506 NSW Government, South East and Tablelands, https://www.nsw.gov.au/our-regions/south-east-tablelands
507 NSW Government, Snowy Mountains Special Activation Precinct, https://www.nsw.gov.au/snowy-hydro-legacy-fund/special-activation-precincts/snowy-
mountains-special-activation-precinct.

KPMG | 128
© 2020 KPMG, an Australian partnership and a member firm of the KPMG network of independent member firms affiliated with KPMG International Cooperative (“KPMG International”), a Swiss entity. All rights reserved. The KPMG name and logo are registered trademarks or trademarks of KPMG International. Liability limited by a scheme approved under Professional Standards Legislation.
Document Classification: KPMG Confidential
Appendix B: Technical Information – Hydrogen Cost Modelling This appendix documents the technical information and assumptions underpinning the illustrative hydrogen cost projections reflected in this report.
Purpose As mentioned in Section 3: A NSW Hydrogen Industry, subsequent to CSIRO releasing the CSIRO National Hydrogen Roadmap in 2018, CSIRO provided access to the underlying data and assumptions used for the development of the roadmap to KPMG, and together KPMG and CSIRO developed and released the Hydrogen Communities & H2City Tool (H2C) based on that data and assumptions.
With access to the underlying CSIRO data and assumptions used for the development of the Roadmap, KPMG has modelled a range of scenarios in this report. As the detailed CSIRO data and assumptions are confidential, we have not provided a full listing of all data and assumptions adopted by the modelling included in this report, though we note that the data and assumptions adopted by the modelling included in this report are consistent with the CSIRO National Hydrogen Roadmap, unless otherwise noted in the source.
Different assumptions to the CSIRO National Hydrogen Roadmap were adopted in the modelling for this report, only typically due to having access to more specific New South Wales information (for example, the nature of the New South Wales bus fleet) or more current information (for example around green steel), or to ensure the consistency of assumptions adopted in the modelling in other workstreams regarding other projects (for example wholesale electricity prices).
A list of all assumptions adopted in the modelling for this report that was different to that adopted in the modelling to support the CSIRO National Hydrogen Roadmap, are included here. The key structure and key assumptions of the H2C model is disclosed further below:
Table 23: Summary of assumptions
CSIRO National Roadmap Assumption for Industry Opportunities Report
Electricity Price curve ($ / MWh)
Average of $54 / MWh across the timeframe 2020 to 2050
From $40 / MWh at 2020 to ~$28 / MWh at 2050. Details of this curvature are disclosed below. Sensitised higher cost case - from $50 / MWh at 2020 to ~$35 / MWh at 2050 Sensitised lower cost case - from $30 / MWh at 2020 to ~$21 / MWh at 2050

KPMG | 129
© 2020 KPMG, an Australian partnership and a member firm of the KPMG network of independent member firms affiliated with KPMG International Cooperative (“KPMG International”), a Swiss entity. All rights reserved. The KPMG name and logo are registered trademarks or trademarks of KPMG International. Liability limited by a scheme approved under Professional Standards Legislation.
Document Classification: KPMG Confidential
CSIRO National Roadmap Assumption for Industry Opportunities Report
Electrolyser Life (years)
~18 years (implied) (based on 150,000 runtime hours, and an annual hour count based on an annual electrolyser capacity factor of 95%)
10 years Sensitised lower cost case - 17.5 years
Electrolyser Capital Costs over time (learning curve)
The 2050 electrolyser cost is 25.6% of the 2020 electrolyser cost. The capital cost in 5-year increments is visualised below.
Sensitised lower cost case - that the 2050 electrolyser cost is 10% of the 2020 electrolyser cost. Other cases are unchanged.
Weighted Average Cost of Capital (%)
7% 4.21%
Bus kilometre assumption (1 bus km per year)
From ~26,000 km per year to ~15,000 km per year
60,000 km per year (reflects a NSW bus fleet)
The sensitised cases reflect sensitivities only – they are not indicators of an upper bound or a lower bound of the factors i.e. the factors could vary to the extent that the cost of hydrogen production could be above the sensitised higher case or below the sensitised lower case.
Limitations The H2C tool is used to prepare indicative high-level projections of the potential costs associated with hydrogen and various industry use cases over different time periods. This analysis has been developed based on available data and with supporting assumptions sources, however, it is important to note that there are numerous gaps in data, uncertainties in future projections, and some challenges in comparability of information across different sources. The projections are intended to help illustrate the key considerations around cost competitiveness and uptake associated with different industry opportunities, rather than provide a definitive indication of the timeframe or trajectory of costs. In practice, the costs of different technologies will be influenced by a wide range of factors over which there are varying levels of uncertainty. These factors include government policy settings, research and development, technological innovations, and investments by governments and the private sector.
The analysis in this report is to be considered in the context of the above limitations.
Modelling Assumptions The following sub sections outline the key structure of the H2C model, its supporting data, and key assumptions.
Supply Chain Components Modelled The H2C modelling reflects the following key components of the supply chain:
• Demand;
• Production;
• Storage;
• Transportation and transmission;
• Local infrastructure and augmentation; and
• End user costs.

KPMG | 130
© 2020 KPMG, an Australian partnership and a member firm of the KPMG network of independent member firms affiliated with KPMG International Cooperative (“KPMG International”), a Swiss entity. All rights reserved. The KPMG name and logo are registered trademarks or trademarks of KPMG International. Liability limited by a scheme approved under Professional Standards Legislation.
Document Classification: KPMG Confidential
Descriptions of the below components are provided, along with explicit mention of the main assumptions that underpin the projections.
Demand
The demand for is hydrogen based on the following:
• For the mobility cases, demand is expressed based on vehicle count which is then converted into an energy requirement by fuel efficiency information and vehicle travelling data (sourced from CSIRO data); and
• For all other demand cases, demand is based on energy required.
The energy requirement is then used to determine the amounts of the supply chain required to meet the demand. As some parts of the supply chain are directly driven by the amount of hydrogen (H2) required, the H2C converts the energy requirement to kilograms of H2. The key conversion ratio used is a low heating value of 0.12 GJ:kg.
Production
The main assumed method of hydrogen production is assumed to be PEM electrolysis. For production by PEM electrolyser, the main costs and operating assumptions are as follows:
• The installed capacity, CAPEX and fixed OPEX per unit is based on CSIRO underlying data. Given the capital costs for the electrolyser is a material portion of the cost of production of hydrogen, this has been visualised below on a 5-year incremental basis;
Source: calculation from the H2City Tool, utilising underlying data and assumptions from CSIRO unless otherwise explicitly stated (Appendix C: Technical Information – Hydrogen Cost Modelling).
• The assumed capacity factor for the electrolysers is 85%;
• Electricity consumption costs are based on the following:
– Electricity consumption rate is 54 kWh to 45 kWh / kg H2 from 2020 to 2050 (CSIRO data)
• Assumption of a ‘small scale’ electricity price from 2020 to 2029 inclusive:
– The starting price for this small-scale electricity is assumed to be $40 / MWh.
– The price is a blend of grid sourced electricity and behind the meter electricity. The blend is 70% grid, 30% behind the meter. Network charges (DUOS, TUOS and environmental charges) are applied to the grid sourced electricity.
• Assumption of a ‘large scale’ electricity price from 2030 to 2050 inclusive, reflecting a greater purchasing amount of electricity with increasing demand for hydrogen:
0
500
1,000
1,500
2,000
2,500
3,000
3,500
4,000
2020 2025 2030 2035 2040 2045 2050
$ /
kW

KPMG | 131
© 2020 KPMG, an Australian partnership and a member firm of the KPMG network of independent member firms affiliated with KPMG International Cooperative (“KPMG International”), a Swiss entity. All rights reserved. The KPMG name and logo are registered trademarks or trademarks of KPMG International. Liability limited by a scheme approved under Professional Standards Legislation.
Document Classification: KPMG Confidential
– The blend is 40% grid, 60% behind the meter. Network charges (TUOS and environmental only, no DUOS) are applied to the grid sourced electricity.
• This cost of electricity has been visualised below; Figure 15: Cost of Electricity as Feedstock into PEM electrolyser
Source: calculation from the H2City Tool, utilising underlying data and assumptions from CSIRO unless otherwise explicitly stated (Appendix C: Technical Information – Hydrogen Cost Modelling).
Water consumption costs are based on the following:
• Water consumption rate is 9L / kg H2 (CSIRO data). Although not modelled in detail (as the H2C calculations are not project specific), the source of the water is assumed to be from a desalination plant. Please note that this amount is based on the theoretical chemical conversion process of electrolysis. In practice, some amount of extra water is required given the process is not perfectly efficient (some loss factor). That being said, the difference in dollar / costing terms is not material.
• The water price is assumed to be 0.182c per litre.
Storage
An assumption is made for the costs of storage (including compression) of hydrogen prior to its delivery to users. This cost is costing $1,143 / kg H2 for one day.
Transportation
Transportation refers to costs associated with delivery of hydrogen from production source to user locations. This is mainly relevant for mobility cases (delivery to refuelling stations).
For mobility cases, the assumed method of delivery is transportation is truck and trailer. The cost assumption is $2.33 per tonne of hydrogen per kilometre transported.
Local infrastructure and augmentation
Local infrastructure / augmentation refers to costs required to either create, or upgrade infrastructure to enable users to be able to access hydrogen.
This is mainly relevant for the mobility cases (refuelling stations for customers).
0
10
20
30
40
50
60
70
8020
2020
2120
2220
2320
2420
2520
2620
2720
2820
2920
3020
3120
3220
3320
3420
3520
3620
3720
3820
3920
4020
4120
4220
4320
4420
4520
4620
4720
4820
49
$ /
MW
h

KPMG | 132
© 2020 KPMG, an Australian partnership and a member firm of the KPMG network of independent member firms affiliated with KPMG International Cooperative (“KPMG International”), a Swiss entity. All rights reserved. The KPMG name and logo are registered trademarks or trademarks of KPMG International. Liability limited by a scheme approved under Professional Standards Legislation.
Document Classification: KPMG Confidential
End user costs
End user costs refer to costs which are directly related to the end user. These costs are mainly relevant for the mobility cases (the actual vehicle purchase and operating expenses associated with them).
Overarching Assumptions The treatment of the above components of the supply chain are as follows:
• Operating expenditure is recognised on a cash basis.
• Capital expenditure is subject to a levelising process. Although this not a true levelising with discounting being applied, what this process does is reflect the financing and repayment of the capital expenditure over time, having regard to what could be a commercially feasible length of asset ownership. As a result of this, there is a cost of capital component associated with the asset.
• For length of ownership:
– Electrolysers are 10 years;
– Light vehicles, articulated trucks and heavy trucks are 5 years;
– Buses are 15 years; and
– All other major items of capital expenditure are 20 years.
• For the cost of capital:
– The assumption for regulatory weighted average cost of capital is 4.21% p.a.
– The assumption for contestable weighted average cost of capital is 5.19% p.a.
Alternate Cost of Hydrogen Scenarios The purpose of the following cost of hydrogen calculations is to illustrate some projections with varying assumptions. These scenarios are also subject to the above limitations.
For each of these calculations, the cost curve is provided here along with the main assumptions that depart from the above modelling assumptions:
Figure 16: Calibrated $2/kg hydrogen case by 2050
Source: calculation from the H2City Tool, utilising underlying data and assumptions from CSIRO unless otherwise explicitly stated (Appendix C: Technical Information – Hydrogen Cost Modelling).

KPMG | 133
© 2020 KPMG, an Australian partnership and a member firm of the KPMG network of independent member firms affiliated with KPMG International Cooperative (“KPMG International”), a Swiss entity. All rights reserved. The KPMG name and logo are registered trademarks or trademarks of KPMG International. Liability limited by a scheme approved under Professional Standards Legislation.
Document Classification: KPMG Confidential
The above cost curve illustrates an example of how the cost of hydrogen could be calculated to be $2 / kg by 2050 based on certain assumptions being met:
Main departing assumptions:
• For the wholesale electricity price:
– The assumption is that the wholesale price for electricity will lower to $25 / MWh by 2050 (previously $28 / MWh by 2050)
• For the electrolyser’s capital expenditure:
– The assumption is that the capital expenditure cost for electrolysers in 2050 is 18.6% of the capital expenditure cost for electrolysers in 2020 (CSIRO data indicated that this percentage is 25.6%)
• For the cost of capital:
– The assumption for weighted average cost of capital is 3.2% p.a.
Figure 17: $2/kg hydrogen case by 2050 – changing electricity price
Source: calculation from the H2City Tool, utilising underlying data and assumptions from CSIRO unless otherwise explicitly stated (Appendix C: Technical Information – Hydrogen Cost Modelling).
The above cost curve illustrates an example of how the cost of hydrogen could be calculated to be $2 / kg by 2050 based on mainly changing the electricity price assumption:
Main departing assumptions:
• For the wholesale electricity price:
– The assumption is that the wholesale price for electricity will lower to $21.1 / MWh by 2050 (previously $28 / MWh by 2050)
• For the cost of capital:
– The assumption for weighted average cost of capital is 4.0% p.a.

KPMG | 134
© 2020 KPMG, an Australian partnership and a member firm of the KPMG network of independent member firms affiliated with KPMG International Cooperative (“KPMG International”), a Swiss entity. All rights reserved. The KPMG name and logo are registered trademarks or trademarks of KPMG International. Liability limited by a scheme approved under Professional Standards Legislation.
Document Classification: KPMG Confidential
Figure 18: $2/kg hydrogen case by 2040 – changing electricity price
Source: calculation from the H2City Tool, utilising underlying data and assumptions from CSIRO unless otherwise explicitly stated (Appendix C: Technical Information – Hydrogen Cost Modelling).
The above cost curve illustrates an example of how the cost of hydrogen could be calculated to be $2 / kg by 2040 based on mainly changing the electricity price assumption:
Main departing assumptions:
• For the wholesale electricity price:
– The assumption is that the wholesale price for electricity will lower to $20.7 / MWh by 2040
• For the cost of capital:
– The assumption for weighted average cost of capital is 4.0% p.a.
Figure 19: $2/kg hydrogen case by 2030 – changing electricity price
Source: calculation from the H2City Tool, utilising underlying data and assumptions from CSIRO unless otherwise explicitly stated (Appendix C: Technical Information – Hydrogen Cost Modelling).
The above cost curve illustrates an example of how the cost of hydrogen could be calculated to be $2 / kg by 2030 based on mainly changing the electricity price assumption:
Main departing assumptions:
• For the wholesale electricity price:
– The assumption is that the wholesale price for electricity will lower to $8.6 / MWh by 2030

KPMG | 135
© 2020 KPMG, an Australian partnership and a member firm of the KPMG network of independent member firms affiliated with KPMG International Cooperative (“KPMG International”), a Swiss entity. All rights reserved. The KPMG name and logo are registered trademarks or trademarks of KPMG International. Liability limited by a scheme approved under Professional Standards Legislation.
Document Classification: KPMG Confidential
• For the cost of capital:
– The assumption for weighted average cost of capital is 4.0% p.a.

Document Classification: KPMG Confidential
THIS PAGE IS INTENTIONALLY LEFT BLANK

www.kpmg.com.au
© 2020 KPMG, an Australian partnership and a member firm of the KPMG network of independent member firms affiliated with KPMG International Cooperative (“KPMG International”), a Swiss entity. All rights reserved.
The KPMG name and logo are registered trademarks or trademarks of KPMG International. Liability limited by a scheme approved under Professional Standards Legislation.
Document Classification: KPMG Confidential
January 2016
Contact us
Ted Surette Global Head: Power & Utilities +61 2 9335 8720 [email protected] Steven Casey Partner +61 2 9455 9470 [email protected] Brad Hopkins Partner +61 7 3233 9407 [email protected] James McAtamney Director +61 2 9455 9985 [email protected]