NRDC: All-In-One Computer Idle Power Analysis (PDF)
21
AiO Idle Power Analysis Page 1 of 21 All-In-One Computer Idle Power Analysis AGGIOS, INC. 2967 Michelson Dr., Suite G 700 Irvine, CA 92612 Phone: (949) 212-0130 Email: [email protected] AUTHORS Vojin Zivojnovic Ph.D., Principal Investigator Davorin Mista, Senior Investigator April 28, 2016 Project funded by Natural Resources Defense Council, and managed by Pierre Delforge
-
Upload
nguyenthuy -
Category
Documents
-
view
231 -
download
1
Transcript of NRDC: All-In-One Computer Idle Power Analysis (PDF)

AiO Idle Power Analysis
Page 1 of 21
All-In-One Computer Idle Power Analysis
AGGIOS, INC.
2967 Michelson Dr., Suite G 700
Irvine, CA 92612
Phone: (949) 212-0130
Email: [email protected]
AUTHORS
Vojin Zivojnovic Ph.D., Principal Investigator
Davorin Mista, Senior Investigator
April 28, 2016
Project funded by Natural Resources Defense Council, and managed by Pierre Delforge

AiO Idle Power Analysis
Page 2 of 21
Legal Notices
The authors make no warranty, express or implied, and assume no legal liability for the information
in this report; nor do they represent that the use of this information will not infringe upon privately
owned rights.
Inquires related to this document should be directed to the authors (see contact information on cover
page).
All trademarks are the property of their respective owners.

AiO Idle Power Analysis
Page 3 of 21
Introduction
The aim of this project was to compare the power consumption of typical All-in-One (AiO)
computers, in order to assess energy efficiency strategies employed by each manufacturer. We
focused on the those states in which the computer is not in use, i.e. idle, sleep, and off.
The idle state is defined as in the Energy Star 6.1 standard where short idle and long idle are being
distinguished. In short idle, the computer is inactive with the display active. Long idle is when the
computer is inactive, but the display is suspended.
The sleep state is a state in which the operating system (OS) has suspended itself, keeping the
memory powered in order to quickly resume when needed. The computer still requires power in
this state.
The off state is the state where the OS has shut down. The computer no longer requires power and it
is safe to disconnect the power cord, but typically the computer will still offer some wake-up
capabilities in this state so the power consumption is not zero.
We also looked at the power consumption for more realistic idle conditions a typical user would
experience, based on the real-world-idle definition in the CASE initiative addendum from Aug.3rd,
2013.1
1 http://www.energy.ca.gov/appliances/2014-AAER-01/prerulemaking/documents/comments_12-
AAER-2A/

AiO Idle Power Analysis
Page 4 of 21
Devices Tested
The devices chosen were one iMac and one Windows based all-in-one computer with similar
specifications:
Apple iMac Lenovo B40-30
Model Number A1418 B40-30
Display 21.5”, 1080p
IPS Display
21.5” 1080p
IPS Display
Processor Intel i5-4570R at 2.7GHz
65W TDP
4th generation Intel Core i5
Intel i5 4460T at 1.90GHz
35W TDP
4th generation Intel Core i5
RAM 2 DIMMs of 4GB, DDR3
1600MHz
1 DIMM of 4GB, DDR3
1600MHz
Storage HGST 1 TB SATA HDD,
5400RPM, 2.5”
(Model: HTS541010A9E662)
Seagate 1 TB SATA SSHD2,
7200RPM, 3.5”
(Model: ST 1000DX001)
8GB SSD Memory
Optical Drive N/A DVD-RW
Ports 4xUSB3.0, 2xThunderbolt,
1xSD-Reader
2xUSB3.0, 3xUSB2.0,
1xHDMI, 1xSD-Reader
Operating System Apple OSX 10.10.5,
(Yosemite)
Microsoft Windows 10
PSU rating 180 W 120 W
Energy Star 6.1 Compliant Yes No
Date purchased Purchased in Aug’2015 Purchased in Oct’2015
List price (before any
discounts)
$1299,- $926,-
2 Hybrid solid state and hard disk drive.

AiO Idle Power Analysis
Page 5 of 21
Test Setup
The test setup consisted of an AC power meter, a data acquisition device (DAQ) for DC power
measurements, as well as a DC electronic load.
Equipment used:
Yokogawa WT310 Digital AC Power Meter
Keysight U2356A Multifunction Data Acquisition (DAQ) device
Steren 602-270 Digital Multimeter
BK Precision 8510 Programmable DC Electronic Load
50 m𝛺, 3W Shunt Resistor
Software used:
TECHPOWERUP ThrottleStop 6.00
Primate Labs Geekbench 3
The software used to evaluate the All-in-One computers were TECHPOWERUP ThrottleStop 6.00
and Primate Labs Geekbench 3. ThrottleStop was used to determine the idle state distribution of the
processor. The single and multicore performance of the All-in-One computers were determined
from Geekbench.
The Yokogawa WT310 Digital AC Power Meter was used to measure the AC power consumption of
the computers. The AC power meter was used with the Yokogawa WTViewerFreePlus software to
record the AC power consumption of the computers at each time interval, and to adjust the
sampling rate of the measurement. Recorded measurements from the software were saved in a CSV
file. Sampling rate for the AC power measurements were recorded at 250ms.
The BK Precision 8510 Programmable DC Electronic Load is used to measure the efficiency of the
power supply (a.k.a power adapter) of each computer, by generating a DC power load to the output.
DC power is adjusted by programming the voltage, current, and power settings in the device. In this

AiO Idle Power Analysis
Page 6 of 21
project, the programmable DC electronic load device was used to generate DC power on the AiO
power adapters. DC power was generated by adjusting the “P-Set” settings of the electronic load. In
“P-Set” mode, the user may adjust the DC power output to a desired power level. For this project,
the programmable DC electronic load device was set to low DC power ranges to determine idle
efficiencies. In high load efficiency measurement, the device was adjusted from 25% to the
maximum power supported by the power adapter.
The Keysight U2356A Multifunctional DAQ device is a high-speed 64-channel digital multimeter,
and simple scope function. For the purpose of this test, the DAQ device was used with the Keysight
Measurement Manager for data logging the DC power consumption of each SATA components in
the computer. Since the device is limited to input voltages of 10 V, DC power measurements of the
components were determined by attaching a 50m𝛺 shunt resistor to the ground line of the SATA
power cable. The shunt resistor was used to determine the current traveling through the wire. By
applying the Ohm’s Law equation, the DC power was calculated by using the measured voltage of
the power cable multiplied by the current of the shunt resistor. To record the DC power
consumption, a scaling factor was calculated by using the measured voltage of the shunt resistor
divided by the DC power produced on the wire. The scaling factor inside the Keysight Measurement
Manager were adjusted to the computed result.
𝐼𝑠ℎ𝑢𝑛𝑡 = 𝑉𝑠ℎ𝑢𝑛𝑡 / 𝑅𝑠ℎ𝑢𝑛𝑡 ( Eqn. 1)
𝑃 = 𝑉𝑎𝑐𝑡𝑢𝑎𝑙 ∙ 𝐼𝑠ℎ𝑢𝑛𝑡 ( Eqn. 2)
𝑆𝑐𝑎𝑙𝑖𝑛𝑔 𝑓𝑎𝑐𝑡𝑜𝑟 = 𝑉𝑠ℎ𝑢𝑛𝑡 / 𝑃 (Eqn. 3)
Voltage measurement of the shunt resistor and computer component, were measured from a digital
multimeter.
Measurements
The following aspects were evaluated:
● System performance
● System AC power consumption in idle states
● System AC power consumption in real-world idle
● Component DC power
● Power Adapter efficiency
● Processor C-States
AiO Idle Power Analysis
Page 7 of 21
System Performance
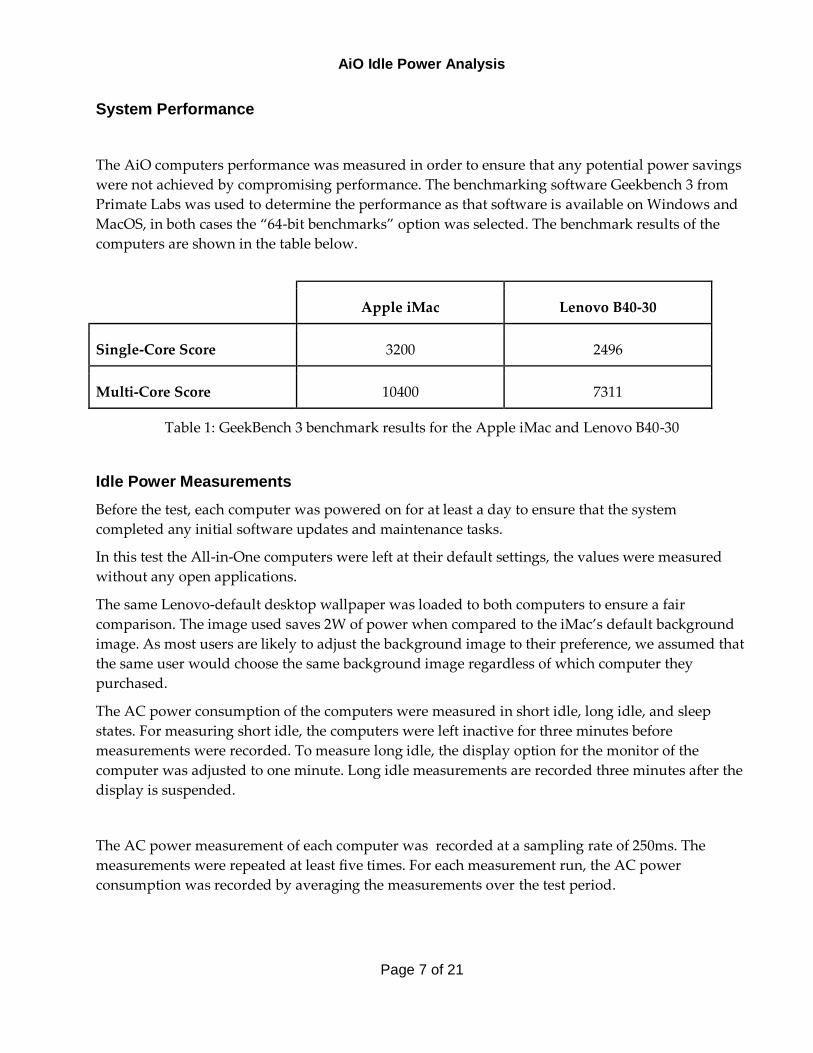
The AiO computers performance was measured in order to ensure that any potential power savings
were not achieved by compromising performance. The benchmarking software Geekbench 3 from
Primate Labs was used to determine the performance as that software is available on Windows and
MacOS, in both cases the “64-bit benchmarks” option was selected. The benchmark results of the
computers are shown in the table below.
Apple iMac Lenovo B40-30
Single-Core Score 3200 2496
Multi-Core Score 10400 7311
Table 1: GeekBench 3 benchmark results for the Apple iMac and Lenovo B40-30
Idle Power Measurements
Before the test, each computer was powered on for at least a day to ensure that the system
completed any initial software updates and maintenance tasks.
In this test the All-in-One computers were left at their default settings, the values were measured
without any open applications.
The same Lenovo-default desktop wallpaper was loaded to both computers to ensure a fair
comparison. The image used saves 2W of power when compared to the iMac’s default background
image. As most users are likely to adjust the background image to their preference, we assumed that
the same user would choose the same background image regardless of which computer they
purchased.
The AC power consumption of the computers were measured in short idle, long idle, and sleep
states. For measuring short idle, the computers were left inactive for three minutes before
measurements were recorded. To measure long idle, the display option for the monitor of the
computer was adjusted to one minute. Long idle measurements are recorded three minutes after the
display is suspended.
The AC power measurement of each computer was recorded at a sampling rate of 250ms. The
measurements were repeated at least five times. For each measurement run, the AC power
consumption was recorded by averaging the measurements over the test period.

AiO Idle Power Analysis
Page 8 of 21
As we noticed that the antivirus software (McAfee) of the Lenovo PC appeared to be constantly
busy, we also repeated the measurements with the antivirus software disabled, resulting in a
significant reduction of the power consumption in both short and long idle. For a fair comparison
we also measured the Lenovo PC’s power with the antivirus software removed. The iMac on the
other hand does not come with any antivirus software pre-installed.
In their sleep state, power is still required in order to power the DRAM memory, which is being kept
in an energy-efficient self-refresh state. Additionally power is being consumed in order to keep
Bluetooth connections active for communication with the keyboard, as the computers can be woken
up via keyboard.
Both computers still consume power when turned off but plugged in. This is most likely due to
wake capabilities, such as timer-wake, as well as Ethernet wake (Wake-on-LAN), despite such
features not being enabled.
Apple iMac
w. original
background
Apple iMac
w. Lenovo
background
Lenovo B40-30
with Antivirus
Enabled
Lenovo B40-30
with Antivirus
Disabled
Short Idle 24.1 W 22.1 W 46.9 W 37.3 W
Long Idle 9.1 W 9.1 W 27.9 W 16.8 W
Sleep 1.4 W 1.4 W 1.2 W 1.2 W
Off 0.5 W 0.5 W 1.2 W 1.2 W
Table 2: Idle measurements of Apple iMac and Lenovo B40-30
Real-World Idle Measurements
The purpose of the real world idle measurement was to determine the idle power consumption of
the computer under representative use. In the Energy Star 6.1 standard, short idle implies that the
user does not have any background windows opened or processes active before the computer
reaches the idle state. To determine the possible idle conditions of a typical user, the idle
consumption of the computers was measured in three real world cases where the average user may
have the web browser and standard application windows (Microsoft Word, PDF reader, Windows

AiO Idle Power Analysis
Page 9 of 21
Media Player, and Windows Explorer) opened. The different scenarios are outlined in the table
below.
Description
Energy Star No background process active or windows opened.
Real World A 3 Google Chrome tabs opened (Google homepage, GMail, NY times op-ed),
3 Word windows (3 generic Word templates), 1 PDF document opened
from a generic reader, a Windows Explorer tab opened on the C: drive, and
an AVG antivirus suite running in the background without scanning.
Real World B Continuation of Case A, but with three additional web content opened on
the browser (LA Times homepage, Amazon.com homepage, and a user
login Facebook newsfeed).
Real World C Resumption from Case B with Pandora in the browser tab to determine.
Table 3: Real-world idle scenario definitions
Our measurements revealed different behaviors between the two computers. The iMac exhibited a 7
Watt increase in short-idle only, while the Lenovo’s power consumption increased by only around 3
Watts but in both the short and long idle states.
Apple iMac Lenovo B40-30
Short Idle Long Idle Short Idle Long Idle
Energy Star 22.1 W 9.1 W 37.3 W 16.8 W
Energy Star with
equal brightness3
28.1 W 9.1 W 37.3 W 16.8 W
Real World A 29.0 W 9.3 W 40.5 W 19.2 W
Real World B 29.5 W 9.3 W 40.7 W 19.4 W
Real World C 29.8 W 9.4 W 40.9 W 20.4 W
Table 4: Measurements under real-world idle conditions
3 iMac auto brightness control (ABC) disabled and manually set to same brightness as Lenovo
machine

AiO Idle Power Analysis
Page 10 of 21
Component Power Measurements
The power consumption of the SATA drives and the displays of the AiO computers was measured
to determine the contribution of those components to the overall power consumption of the
computers.
The SATA components measured for the Lenovo B40-30 were the SSHD hybrid drive, and the
optical drive. The iMac is equipped with an HDD only.
Figure 1: SATA DC power measurement test setup
To measure the DC power of the SATA components a DAQ device was connected to shunt resistors
on the SATA power cable. The measurements were recorded at a sample rate of 10ms and averaged
over 1 minute.

AiO Idle Power Analysis
Page 11 of 21
iMac HDD
Short Idle Long Idle
5 V - -
12 V 1.68 W 0.5 W
Total 1.68 W 0.5 W
Table 5: iMac HDD DC power
Lenovo SSHD
Short Idle Long Idle
5 V 0.19 W 0.13 W
12 V 3.18 W 3.25 W
Total 3.37 W 3.38 W
Table 6: Lenovo SSHD DC power
Lenovo Optical Drive
Short Idle Long Idle
5 V 0.08 W 0.08 W
Total 0.08 W 0.08 W
Table 7: Optical drive DC power measurement
Display Power
The power consumption of the displays of the AiO computers was determined by measuring the AC
power of the AiO computers after disconnecting the built-in display and connecting an external
display instead.
The iMac was shipped with auto-brightness control enabled, which adjusts display brightness to
ambient lighting conditioned, whereas the Lenovo B40 was shipped with display brightness set to
maximum. We first tested the two computers in typical office lighting conditions with display
brightness settings as shipped, then disabled auto-brightness control on the iMac and manually set it
to equal the brightness of the Lenovo.

AiO Idle Power Analysis
Page 12 of 21
Apple iMac Lenovo B40-30
Effective Display Power
Consumption (DC)
7.1 W 17.0 W
Effective Display Power
Consumption, equal
brightness
12.3 W 17.0 W
Table 8:Effective display power consumption of Apple iMac and Lenovo B40-30
For the remaining components, such as CPU, motherboard, memory, we have not been able to
measure each of them individually due to the compact design of the motherboards. Nevertheless,
we are able to estimate the power consumption of the CPUs based on their C-states reported in the
short idle state.
Component Power Breakdown
Apple iMac Lenovo B40-30
Display 7.1 W 17.0 W
HDD 1.7 W 3.4 W
PSU 3.8 W 4.8 W
CPU (est.) 4.0 W 3.8 W
Motherboard + Memory (est.) 5.6 W 8.3 W
Total 22.2 W 37.3 W
Table 9: Component power breakdown in Short-Idle

AiO Idle Power Analysis
Page 13 of 21
Power Supply Unit (PSU) Efficiency Measurements
The purpose of this task was to determine the efficiency of the power supply (a.k.a power adapters)
used in the AiO computers. Efficiency of the adapters were observed in idle and high DC load
configurations.
The DC load was generated using a programmable DC electronic load attached to the output
terminal of the power adapters. The AC power was measured at each DC load using the AC power
meter. The AC/DC efficiency of the power adapter was determined by dividing the induced DC
power by the measured AC power.
For the efficiency measurement of the B40-30 power adapter, an external female module was
connected to the output terminal of the power adapter. The positive terminal of the power adapter
was connected to the positive channel of the programmable DC electronic load, and negative
terminal to the negative portion of the channel. The DC load was adjusted from 2W to 12W to
simulate idle conditions. To determine the efficiency of the power adapter in high DC load, the DC
power was set at 25% to 100% (i.e. 25%, 50%, 75%, and 100%) of the supported nominal power
rating. For example, the B40-30 nominal power rating is 120W, at 25% load, the programmable DC
load is set to 30W. AC power consumption of the power adapter was recorded from reading the
display of the AC power meter, while the DC power was displayed on the electronic load.
Since the iMac has an integrated power adapter, it had to be disassembled in order to gain access to
the power adapter. The positive and negative channels of the power adapters were connected
directly to the programmable DC electronic load device. Efficiency of the power adapter was
determined by following the same procedures as the B40-30.
Figure 2: Power adapter efficiency from low load to 25% load
70%
75%
80%
85%
90%
95%
100%
0 10 20 30 40 50
Eff
icie
ncy
Watts DC
Power Supply Efficiency
Lenovo B40
Apple iMac
ES short idle
ES long idle

AiO Idle Power Analysis
Page 14 of 21
Lenovo B40-30 with clean OS installation
To determine the power consumption impacts of the preinstalled software for the AiO computers
we did a clean install of the OS. This was not possible on the iMac as Apple doesn’t enable users to
install the OS from scratch. On the Lenovo B40-30 we did a clean installation of Windows 10.
A Western Digital Green 1TB HDD was used for the OS installed. That drive consumes 1 Watt less
in short idle, and about 2.5W less in long idle, when compared to the Seagate SSHD drive built into
the Lenovo AiO computer. The results below have been normalized to eliminate the difference in
HDD consumption from this comparison.
After the standard OS installation procedure, the background of the computer was modified to the
background image included by Lenovo. The AC and DC power measurements were conducted
using the same equipment and procedures as the previous idle and component test.
AC Power
Fresh Windows 10
install
AC Power Pre-
Installed OS
AC Power Pre-
Installed OS
with anti-virus
Short Idle 35.80 W 37.30 W 46.94 W
Long Idle 16.95 W 16.77 W 27.93 W
Table 10: Windows 8 idle measurements for the Lenovo B40-30
From the measured results, the power measured for the Lenovo B40-30 with the clean OS installed
demonstrated a lower power consumption than the pre-installed operating system in the short idle
state, while there was no significant difference in long idle. The additional 1.5 Watts observed in the
short-idle state can most likely be attributed to the pre-installed software included with the Lenovo
AiO computer.

AiO Idle Power Analysis
Page 15 of 21
C-State Analysis
In this step we analyzed the idle power states reached by the processors, also known as the C-States
according to the ACPI standard. The C-States apply to both the core as well as the package. Core C-
states specify the C-states of the CPU only (without caches, GPU, on-chip peripherals, etc) whereas
the Package C-State involves the complete processor. The higher the C-state levels (C6, C7) the lower
power they draw.
To identify the C-States reached, the software ThrottleStop was used on Windows. The enabled C-
States were determined by reading out the reported C-state breakdown in ThrottleStop after
allowing the computer to remain idle for five minutes, . For the iMac, the powermetrics command
was used in the terminal to display C-State statistics.
The 4th generation Core-i5 CPUs used in these AiO computers both support the C7 and package-C7
state as the lowest possible power state. However, neither of the AiO computers was able to reach
these states. According to the data reported by the software used, the iMac only reached a Core-C6
and Package-C3 state, while the Lenovo reached Core-C7 and Package C2, which basically indicates
that either the rest of the system configuration does not satisfy the preconditions for entering those
states, or they were not enabled on the software side.
Lowest C-States Observed
Apple iMac Lenovo B40-30
Lowest Core C-State C6 C7
Lowest Package C-State C3 C2
Table 11: C-State analysis for the Apple iMac and Lenovo B40-30
The motherboards used in the AiO computers do not have a separate 12V input for the CPU
hence it is not possible to take dedicated power measurements for the CPU only. However,
based on previous measurements with Intel Haswell processors used in desktop computers
we have seen power savings of 2-3 Watts between the C3 and C7 package C-states.

AiO Idle Power Analysis
Page 16 of 21
Apple iMac with Windows 8
In order to determine how much impact the MacOS operating system has on the power savings
achieved by the iMac, we installed Windows 8 on the iMac. Similar to the Windows idle and C-state
measurements, the same procedure and equipment was used for the measurement.
Installation of Windows 8 was performed on the iMac through the “Boot Camp Assistant”
application included in MacOS. Hence the same hard drive is used for either OS on the iMac.
In short idle the iMac running Windows 8 showed an even lower power consumption than with
MacOS, while MacOS was slightly more efficient than Windows in the long idle state.
OSX 10.10.54 Windows 8
Short Idle 22.15 W 19.44 W
Long Idle 9.14 W 10.72 W
Sleep 1.40 W 1.48 W
Table 12: Idle measurement for Apple iMac with OSX and Windows
Lowest C-States Observed
OSX 10.10.5 Windows 8
Lowest Core C-State C6 C6
Lowest Package C-State C3 C6
Table 13: C-State analysis for the Apple iMac and Lenovo B40-30
The C-State analysis shows that Windows 8 is able to get the CPU into a lower idle state than
MacOS, which most likely contributes to a significant portion of the power savings in the short idle
state, as we typically see a 1 watt difference between the C3 and C6 package C-states.
4 The default Windows 8 setting for the iMac had been set to full brightness. Returning to OSX and measuring
the computer with the same brightness setting, the short idle power consumption is 35.24W.

AiO Idle Power Analysis
Page 17 of 21
Wake-up Latencies
On stationary computers that don’t use a battery, users are typically less motivated to keep power
management features enabled. One critical factor here are the latencies observed when waking up
out of sleep mode. The quicker the wakeup latencies are, the less likely it is that power management
(such as automatic display switch off and automatic transition to sleep mode) will annoy the user,
and the user will disable this energy savings feature.
Latency measurements from sleep and long idle to active state were performed to determine the
responsiveness of the two computers.
The latency from long idle to active state was determined by opening an image file when the system
is in long idle. A previously unopened image was transferred to the computer to avoid system cache
files. Once the system entered long idle, a timer was used to record the time it would take for the
computer to reach active state from opening the image file. The sleep to active state was determined
by recording the amount of time it takes for the computer to transition from sleep state to active
display.
The iMac displayed a faster wake up latency than the B40-30. Judging by the power consumption
display on the Yokogawa WT310 AC power measurement, the B40-30 reaches the active state in less
than one second. Most of the latency for the B40-30 is from the display activation time. The display
of the B40-30 appeared to introduce a significant additional delay for the system to turn back on.
Apple iMac Lenovo B40-30 Windows8 on iMac
Sleep to Active 1.74 s 5.37 s 4.08 s
Long Idle to Active 1.35 s 4.22 s 2.5 s
Table 14: Latency measurement for Apple iMac and Lenovo B40-30
In order to assess the impact of the hardware on the wakeup latencies, we also repeated the same
measurements using Windows 8 installed on the iMac. The results confirm that the display does
appear to play a significant role. Nevertheless, MacOS still wakes up roughly twice as fast from
Sleep as well as from Long Idle when compared to Windows when hardware differences are
eliminated.
When strictly looking at the idle power consumption, Windows appears to have a slight edge over
MacOS provided the same underlying hardware. However, even when factoring out the impacts of
the faster display, MacOS wakes up from long idle about twice as fast as Windows, and 2.5 times
faster from its sleep state.
AiO Idle Power Analysis
Page 18 of 21
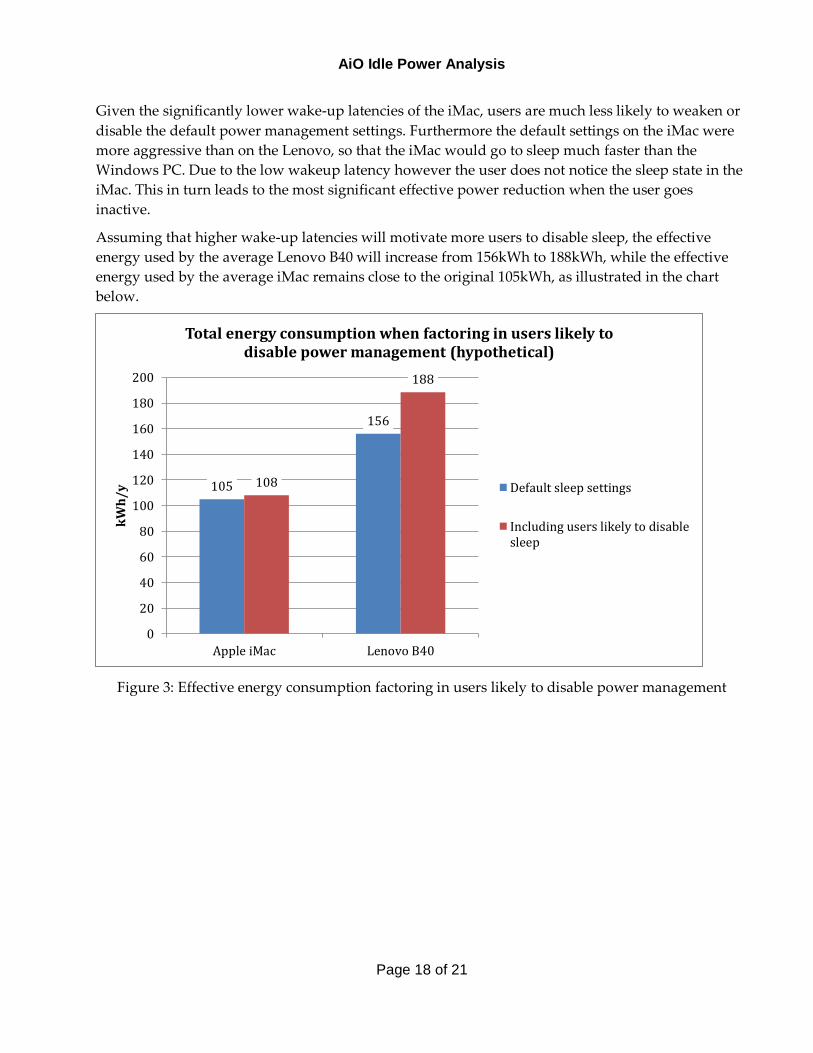
Given the significantly lower wake-up latencies of the iMac, users are much less likely to weaken or
disable the default power management settings. Furthermore the default settings on the iMac were
more aggressive than on the Lenovo, so that the iMac would go to sleep much faster than the
Windows PC. Due to the low wakeup latency however the user does not notice the sleep state in the
iMac. This in turn leads to the most significant effective power reduction when the user goes
inactive.
Assuming that higher wake-up latencies will motivate more users to disable sleep, the effective
energy used by the average Lenovo B40 will increase from 156kWh to 188kWh, while the effective
energy used by the average iMac remains close to the original 105kWh, as illustrated in the chart
below.
Figure 3: Effective energy consumption factoring in users likely to disable power management
105
156
108
188
0
20
40
60
80
100
120
140
160
180
200
Apple iMac Lenovo B40
kW
h/
y
Total energy consumption when factoring in users likely to disable power management (hypothetical)
Default sleep settings
Including users likely to disablesleep

AiO Idle Power Analysis
Page 19 of 21
Summary
The analysis of the AiO computers in this project showed significantly lower idle power levels in the
iMac compared to the Lenovo AiO PC. The reason for this difference however appears to stem less
from the operating systems but primarily from the more energy efficient components and design
used in the iMac.
Figure 4 - Breakdown of component power consumption in Short Idle
Running the two different operating systems on the exact same hardware allows to eliminate
hardware differences from the equation, however directly comparing the two operating systems
regarding energy efficiency is still not straightforward, as the power in idle is not the only metric
that impacts overall energy efficiency. Especially the faster wake-up from long-idle and sleep will
impact users’ inclination to disable or delay sleep or long-idle states, resulting in an even higher
effective power consumption for the average Lenovo B40 PC.
Despite its better efficiency in idle, the iMac still leaves some room for improvement. It appears that
the iMac we tested could be using less power by enabling the higher C-states in the CPU. The table
below outlines a few of the opportunities for improving energy efficiency.
0
5
10
15
20
25
30
35
40
Display HDD PSU CPU(est.)
Rest* Total
Wa
tts
iMac
Lenovo

AiO Idle Power Analysis
Page 20 of 21
Apple iMac A1418 Lenovo B40-30
Full utilization of Intel C-states, including
package C7
Full utilization of Intel C-states, including
package C7
More efficient power supply Better display efficiency
Ship display with auto-brightness control,
instead of max brightness
More efficient hard drive
Reduce sleep wake latency and more aggressive
power management settings (shorter time before
auto-sleep)
Table 15: Opportunities for improving energy efficiency in the tested AiO computers
The higher performance and lower latency of the iMac show that higher efficiency does not
necessarily impact performance, on the contrary in this case.
The iMac is significantly more expensive than the Lenovo, and this may explain part of the efficiency
difference in some components, such as the display, however most of the efficiency improvement
opportunities could be implemented at little or no cost, and are therefore not constrained by price.
AiO Idle Power Analysis
Page 21 of 21
References
[1] Power Management States: P-States, C-States, and Package C-States:
https://software.intel.com/en-us/articles/power-management-states-p-states-c-states-and-package-c-
states#_Toc383778910
[2] ACPI - Advanced Configuration and Power Interface:
http://www.uefi.org/sites/default/files/resources/ACPI_6.0.pdf
[3] Codes and Standards Enhancement (CASE) Initiative - Analysis of Standards Proposal for
Computers, Addendum to submittal on August 6, 2013:
http://www.energy.ca.gov/appliances/2014-AAER-01/prerulemaking/documents/comments_12-
AAER-2A/California_IOUs_Standards_Proposal_Addendum_Computers_2014-10-27_TN-73899.pdf