2006 Rooftops to Rivers Report – NRDC
54
ROOFTOPS TO RIVERS Green Strategies for Controlling Stormwater and Combined Sewer Overflows Project Design and Direction Nancy Stoner, Natural Resources Defense Council Authors Christopher Kloss, Low Impact Development Center Crystal Calarusse, University of Maryland School of Public Policy Natural Resources Defense Council June 2006
-
Upload
alley-creek-watershed-plan-resources-library -
Category
Documents
-
view
221 -
download
0
description
This report by the Natural Resources Defence Council looks at planning and design strategies for reducing storm water impacts on water quality.
Transcript of 2006 Rooftops to Rivers Report – NRDC

ROOFTOPS TO RIVERS
Green Strategies for Controlling Stormwaterand Combined Sewer Overflows
Project Design and DirectionNancy Stoner, Natural Resources Defense Council
AuthorsChristopher Kloss, Low Impact Development CenterCrystal Calarusse, University of Maryland School of Public Policy
Natural Resources Defense CouncilJune 2006
ABOUT NRDCThe Natural Resources Defense Council is a national nonprofit environmental organization with more than 1.2million members and online activists. Since 1970, our lawyers, scientists, and other environmental specialists haveworked to protect the world’s natural resources, public health, and the environment. NRDC has offices in NewYorkCity, Washington, D.C., Los Angeles, San Francisco, and Beijing. Visit us at www.nrdc.org.
ACKNOWLEDGMENTSNRDC wishes to acknowledge the support of The McKnight Foundation; The Charles Stewart Mott Foundation;The Joyce Foundation; The Geraldine R. Dodge Foundation, Inc.; The Marpat Foundation; The Morris and GwendolynCafritz Foundation; Prince Charitable Trusts; The Mary Jean Smeal Family Fund; The Brico Fund, Inc.; The SummitFund of Washington; The Naomi and Nehemiah Cohen Foundation; and The Jelks Family Foundation, Inc.
NRDC Director of Communications: Phil GutisNRDC Publications Manager: Alexandra KennaughNRDC Publications Editor: Lisa GoffrediProduction: Bonnie GreenfieldCover Photo: ©2006 Corbis. View of Arlington, Virginia, seen from across the Potomac River in Washington, D.C.
Copyright 2006 by the Natural Resources Defense Council.
For additional copies of this report, send $5.00 plus $3.95 shipping and handling to NRDC Reports Department, 40 West 20th Street, New York, NY 10011. Californiaresidents must add 7.5% sales tax. Please make checks payable to NRDC in U.S. dollars.
This report is printed on paper that is 100 percent post-consumer recycled fiber, processed chlorine free.
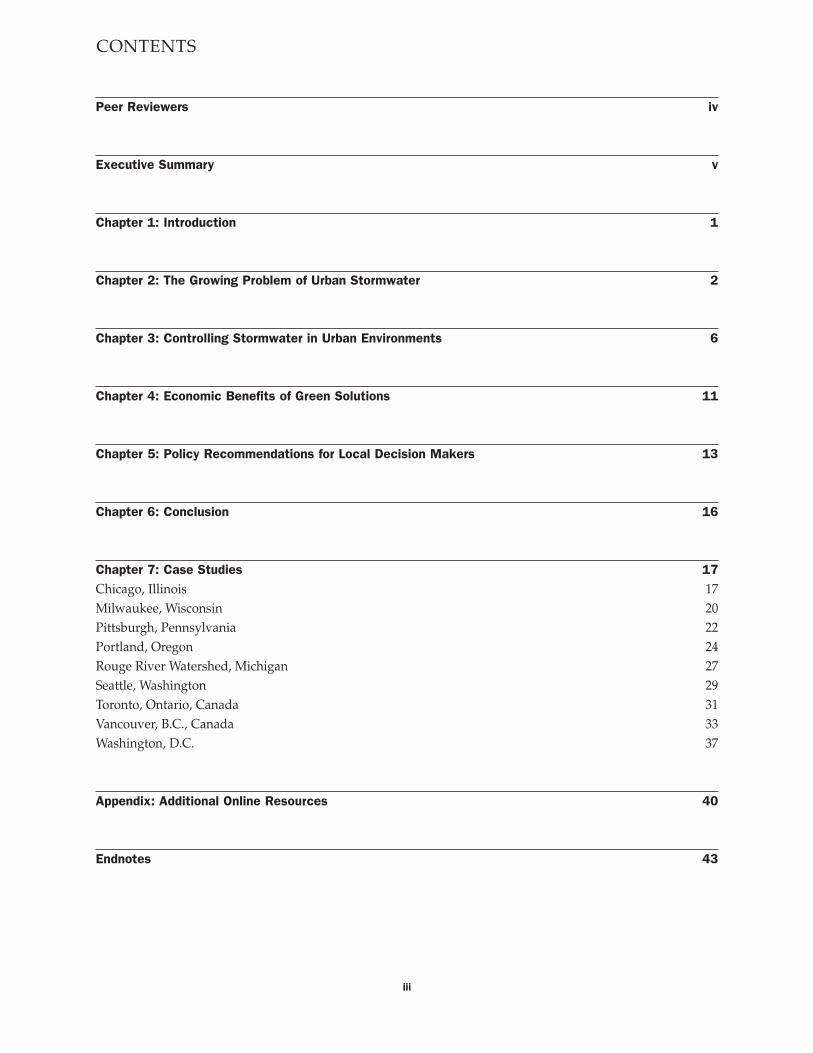
Peer Reviewers iv
Executive Summary v
Chapter 1: Introduction 1
Chapter 2: The Growing Problem of Urban Stormwater 2
Chapter 3: Controlling Stormwater in Urban Environments 6
Chapter 4: Economic Benefits of Green Solutions 11
Chapter 5: Policy Recommendations for Local Decision Makers 13
Chapter 6: Conclusion 16
Chapter 7: Case Studies 17Chicago, Illinois 17Milwaukee, Wisconsin 20Pittsburgh, Pennsylvania 22Portland, Oregon 24Rouge River Watershed, Michigan 27Seattle, Washington 29Toronto, Ontario, Canada 31Vancouver, B.C., Canada 33Washington, D.C. 37
Appendix: Additional Online Resources 40
Endnotes 43
iii
CONTENTS
Katherine BaerAmerican Rivers
Tom ChapmanMilwaukee Metropolitan Sewerage District
Mike CoxSeattle Public Utilities
Robert GooU.S. EPA
Bill GraffinMilwaukee Metropolitan Sewerage District
Jose GutierrezCity of Los Angeles Environmental AffairsDepartment
Emily HauthCity of Portland Bureau of Environmental Services
Jonathan HelmusCity of Vancouver
iv
PEER REVIEWERS
Darla InglisSeattle Public Utilities
Otto KauffmannCity of Vancouver
Jim MiddaughCity of Portland Bureau of Environmental Services
Steve ModdemeyerSeattle Public Utilities
Laurel O’SullivanConsultant to Natural Resources Defense Council
Brad SewellNatural Resources Defense Council
Mike ShribergPublic Interest Research Group in Michigan
Heather WhitlowThe Casey Trees Endowment Fund
David YurkovichCity of Vancouver
As an environmental strategy, green infrastructureaddresses the root cause of stormwater and
combined sewer overflow (CSO) pollution: the con-version of rain and snow into runoff. This pollutionis responsible for health threats, beach closings,swimming and fishing advisories, and habitatdegradation. Water quality standards are unlikelyto be met without effectively managing stormwaterand CSO discharges. Green infrastructure—trees,vegetation, wetlands, and open space preserved orcreated in developed and urban areas—is a strategyfor stopping this water pollution at its source.
The urban landscape, with its large areas ofimpermeable roadways and buildings—known asimpervious surfaces—has significantly altered themovement of water through the environment. Over100 million acres of land have been developed inthe United States, and with development and sprawlincreasing at a rate faster than population growth,urbanization’s negative impact on water quality isa problem that won’t be going away. To counteractthe effects of urbanization, green infrastructure isbeginning to be used to intercept precipitation andallow it to infiltrate rather than being collected onand conveyed from impervious surfaces.
EXECUTIVE SUMMARY
Each year, the rain and snow that falls on urbanareas in the United States results in billions of gallonsof stormwater runoff and CSOs. Reducing runoff withgreen infrastructure decreases the amount of pollutionintroduced into waterways and relieves the strain onstormwater and wastewater infrastructure. Efforts inmany cities have shown that green infrastructure canbe used to reduce the amount of stormwater dischargedor entering combined sewer systems and that it canbe cost-competitive with conventional stormwaterand CSO controls. Additional environmental benefitsinclude improved air quality, mitigation of the urbanheat island effect, and better urban aesthetics.
Green infrastructure is also unique because it offersan alternative land development approach. New devel-opments that use green infrastructure often cost lessto build because of decreased site development andconventional infrastructure costs, and such develop-ments are often more attractive to buyers because ofenvironmental amenities. The flexible and decentral-ized qualities of green infrastructure also allow it tobe retrofitted into developed areas to provide storm-water control on a site-specific basis. Green infra-structure can be integrated into redevelopment effortsranging from a single lot to an entire citywide plan.
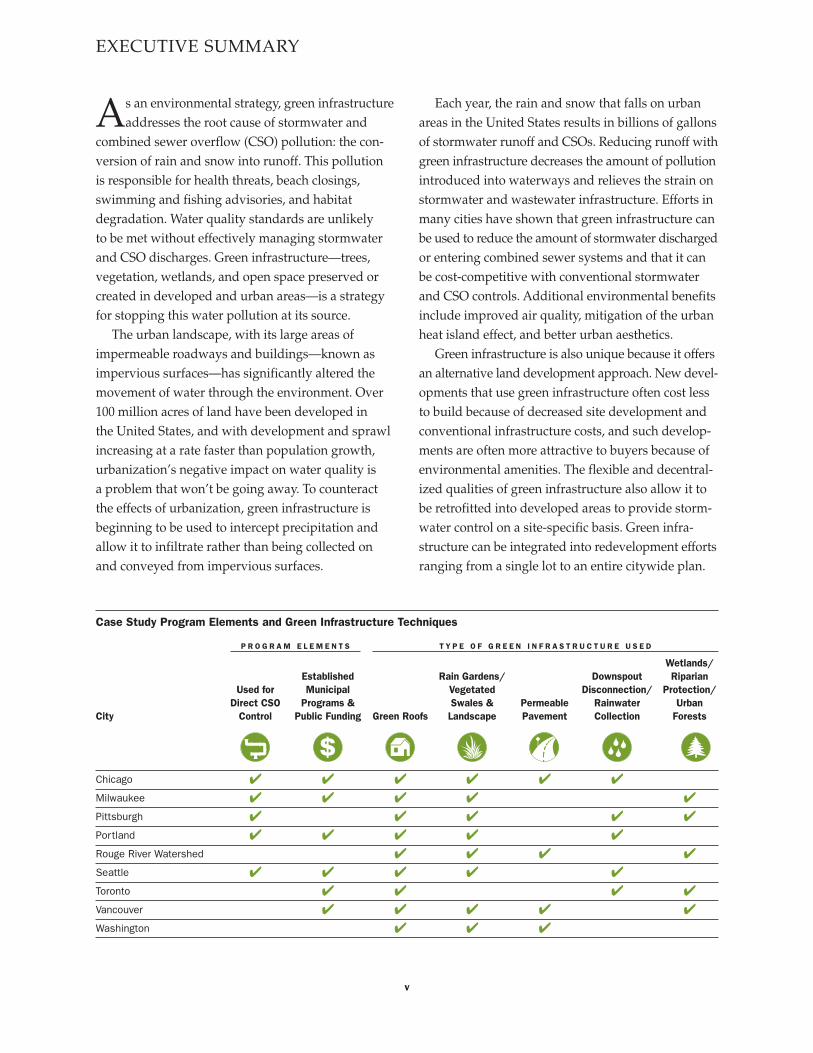
Case Study Program Elements and Green Infrastructure Techniques
Wetlands/Established Rain Gardens/ Downspout Riparian
Used for Municipal Vegetated Disconnection/ Protection/Direct CSO Programs & Swales & Permeable Rainwater Urban
City Control Public Funding Green Roofs Landscape Pavement Collection Forests
Chicago � � � � � �
Milwaukee � � � � �
Pittsburgh � � � � �
Portland � � � � �
Rouge River Watershed � � � �
Seattle � � � � �
Toronto � � � �
Vancouver � � � � �
Washington � � �
P R O G R A M E L E M E N T S T Y P E O F G R E E N I N F R A S T R U C T U R E U S E D
v
vi
Natural Resources Defense Council Rooftops to Rivers
Nonetheless, wider adoption of green infra-structure still faces obstacles. Among these is theeconomic investment that is required across thecountry for adequate stormwater and CSO control.Although green infrastructure is in many casesless costly than traditional methods of stormwaterand sewer overflow control, some municipalitiespersist in investing only in existing conventionalcontrols rather than trying an alternative approach.Local decision makers and organizations musttake the lead in promoting a cleaner, moreenvironmentally attractive method of reducingthe water pollution that reaches their communities.NRDC recommends a number of policy stepslocal decision makers can take to promote the useof green infrastructure:
1. Develop with green infrastructure and pollution
management in mind. Build green space into
new development plans and preserve existingvegetation.
2. Incorporate green infrastructure into long-term
control plans for managing combined sewer overflows.
Green techniques can be incorporated into plans forinfrastructure repairs and upgrades.
3. Revise state and local stormwater regulations to
encourage green design. A policy emphasis should beplaced on reducing impervious surfaces, preservingvegetation, and providing water quality improvements.
The case studies that begin on page 17 offernine examples of successful communities thathave reaped environmental, aesthetic, and eco-nomic benefits from a number of green infrastruc-ture initiatives.
The table on page v provides a summaryof information contained within the case studies.
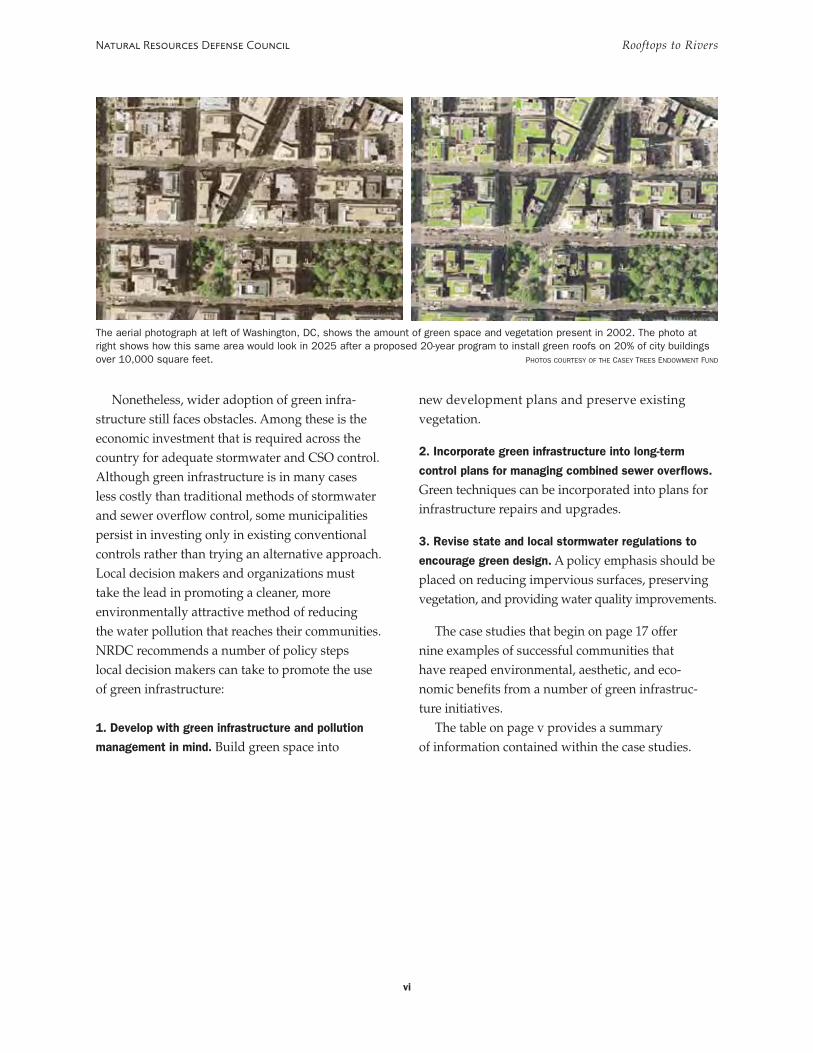
The aerial photograph at left of Washington, DC, shows the amount of green space and vegetation present in 2002. The photo atright shows how this same area would look in 2025 after a proposed 20-year program to install green roofs on 20% of city buildingsover 10,000 square feet. PHOTOS COURTESY OF THE CASEY TREES ENDOWMENT FUND
Water pollution problems in the United Stateshave evolved since the days when Ohio’s
Cuyahoga River was on fire. Increasingly, water pol-lution from discrete sources such as factory pipes isbeing overshadowed by overland flows from streets,rooftops, and parking lots, which engorge down-stream waterways every time it rains. This storm-water has nowhere to go because the naturalvegetation and soils that could absorb it have beenpaved over. Instead, it becomes a high-speed, high-velocity conduit for pollution into rivers, lakes, andcoastal waters.
Most U.S. cities have separate stormwater sewersystems through which contaminated stormwaterflows directly into waterways through undergroundpipes, causing streambank scouring and erosion anddumping pet waste, road runoff, pesticides, fertilizer,and other pollutants directly into waterways. Inolder cities, particularly in the Northeast and GreatLakes regions, stormwater flows into the same pipesas sewage and causes these combined pipes to over-flow—dumping untreated human, commercial, andindustrial waste into waterways. Stormwater pollu-tion has been problematic to some extent for as longas there have been cities, but the volume of storm-water continues to grow as development replacesporous surfaces with impervious blacktop, rooftop,and concrete.
Contaminated stormwater and raw sewagedischarges from combined sewer overflows (CSOs)are required to be controlled under the Clean WaterAct, but progress is slow because the problems arelarge and multi-faceted and because the solutionsare often expensive. A substantial influx of addi-tional resources is needed at the federal, state, and
1
CHAPTER 1
local levels, but fresh thinking is needed also. SomeU.S. cities are already taking steps to successfullybuild green infrastructure into their communities.
Emerging green infrastructure techniquespresent a new pollution-control philosophy basedon the known benefits of natural systems thatprovide multimedia pollution reduction and usesoil and vegetation to trap, filter, and infiltratestormwater. The cities already using green infra-structure are finding that it is a viable alternativeto conventional stormwater management. Althoughused widely overseas, particularly in Germanyand Japan, the use of green infrastructure in theUnited States is still in its infancy; however, dataindicate that it can effectively reduce stormwaterrunoff and remove stormwater pollutants, andcities that have implemented green design arealready reaping the benefits (see the case studieson page 17).
INTRODUCTION
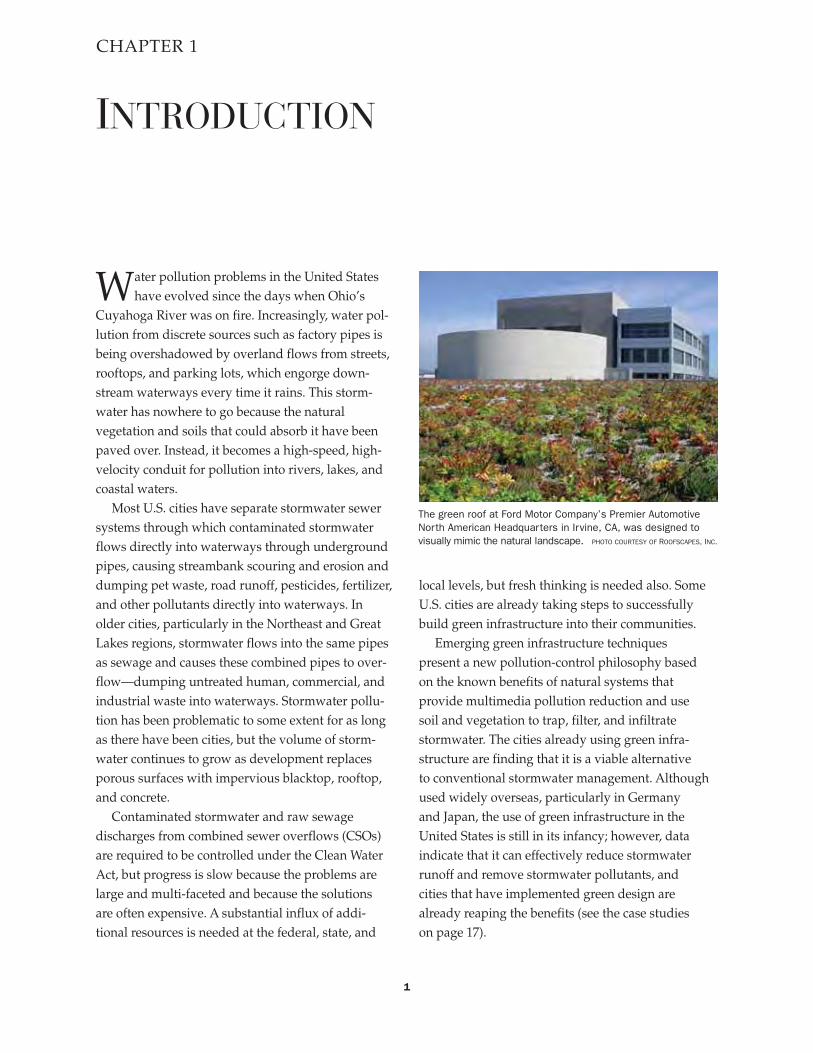
The green roof at Ford Motor Company’s Premier AutomotiveNorth American Headquarters in Irvine, CA, was designed tovisually mimic the natural landscape. PHOTO COURTESY OF ROOFSCAPES, INC.
Development as we have come to know it in theUnited States—large metropolitan centers sur-
rounded by sprawling suburban regions—has con-tributed greatly to the pollution of the nation’s waters.As previously undeveloped land is paved over andbuilt upon, the amount of stormwater running off roofs,streets, and other impervious surfaces into nearbywaterways increases. The increased volume of storm-water runoff and the pollutants carried within itcontinue to degrade the quality of local and regionalwater bodies. As development continues, nature’sability to maintain a natural water balance is lost toa changing landscape and new impervious surfaces.
The trees, vegetation, and open space typicalof undeveloped land capture rain and snowmelt,allowing it to largely infiltrate where it falls. Undernatural conditions, the amount of rain that isconverted to runoff is less than 10% of the rainfallvolume.1,2 Replacing natural vegetation and
2
CHAPTER 2
landscape with impervious surfaces has significantenvironmental impacts. The level of imperviousnessin a watershed has been shown to be directly relatedto the health of its rivers, lakes, and estuaries.Research indicates that water quality in receivingwater bodies is degraded when watershed impervi-ousness levels are at or above 10% and that aquaticspecies can be harmed at even lower levels.3
Both the National Oceanic and AtmosphericAdministration (NOAA) and Pennsylvania StateUniversity estimate that there are 25 million acres ofimpervious surfaces in the continental United States.4
This quantity represents nearly one-quarter of themore than 107 million acres—almost 8% of non-federal land in the contiguous United States—thathad been developed by 2002.5 In urban areas, it is notuncommon for impervious surfaces to account for45% or more of the land cover.
This combination of developed land and impervi-ous surfaces presents the primary challenge of storm-water mitigation. Existing stormwater and wastewaterinfrastructure is unable to manage stormwater ina manner adequate to protect and improve waterquality. Standard infrastructure and controls fail toreduce the amount of stormwater runoff from urbanenvironments or effectively remove pollutants.
THE DEFICIENCIES OF CURRENT URBANSTORMWATER INFRASTRUCTUREStormwater management in urban areas primarilyconsists of efficiently collecting and conveyingstormwater. Two systems are currently used: separate
THE GROWING PROBLEMOF URBAN STORMWATER
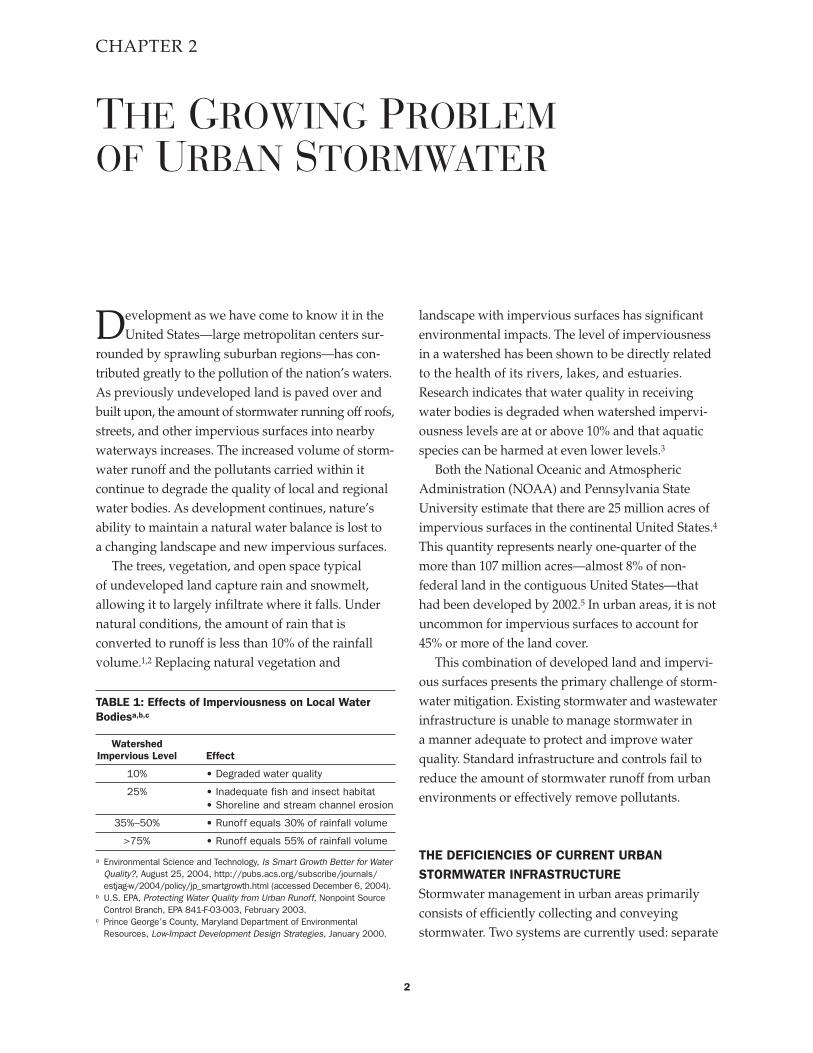
TABLE 1: Effects of Imperviousness on Local WaterBodiesa,b,c
WatershedImpervious Level Effect
10% • Degraded water quality
25% • Inadequate fish and insect habitat• Shoreline and stream channel erosion
35%–50% • Runoff equals 30% of rainfall volume
>75% • Runoff equals 55% of rainfall volume
a Environmental Science and Technology, Is Smart Growth Better for WaterQuality?, August 25, 2004, http://pubs.acs.org/subscribe/journals/estjag-w/2004/policy/jp_smartgrowth.html (accessed December 6, 2004).
b U.S. EPA, Protecting Water Quality from Urban Runoff, Nonpoint SourceControl Branch, EPA 841-F-03-003, February 2003.
c Prince George’s County, Maryland Department of EnvironmentalResources, Low-Impact Development Design Strategies, January 2000.
stormwater sewer systems and combined sewersystems. Separate stormwater sewer systems collectonly stormwater and transmit it with little or no treat-ment to a receiving stream, where stormwater andits pollutants are released into the water. Combinedsewer systems collect stormwater in the same setof pipes that are used to collect sewage, sending themixture to a municipal wastewater treatment plant.
Separate Stormwater Sewer SystemsThe large quantities of stormwater that wash acrossurban surfaces and discharge from separate storm-water sewer systems contain a mix of pollutants,shown in Table 2, deposited from a number ofsources.6,7 Stormwater pollution from separatesystems affects all types of water bodies in thecountry and continues to pose a largely unaddressedthreat. In 2002, 21% of all swimming beach advisoriesand closings were attributed to stormwater runoff.8
Table 3 shows the percentage of assessed (monitored)waters in the United States for which stormwater hasbeen identified as a significant source of pollution.9
Combined Sewer SystemsWhile pollution from separate sewer systems is aproblem affecting a large majority of the country,
3
Natural Resources Defense Council Rooftops to Rivers
pollution from combined sewer systems tends to bea more regional problem concentrated in the olderurban sections of the Northeast, the Great Lakes
TABLE 2: Urban Stormwater Pollutants
Pollutant Source
Bacteria Pet waste, wastewater collection systems
Metals Automobiles, roof shingles
Nutrients Lawns, gardens, atmospheric deposition
Oil and grease Automobiles
Oxygen-depleting Organic matter, trashsubstances
Pesticides Lawns, gardens
Sediment Construction sites, roadways
Toxic chemicals Automobiles, industrial facilities
Trash and debris Multiple sources
TABLE 3: Urban Stormwater’s Impact on Water Quality
Water Body Type Stormwater’s Rank % of Impairedas Pollution Source Waters Affected
Ocean shoreline 1st 55% (miles)
Estuaries 2nd 32% (sq. miles)
Great Lakes 2nd 4% (miles)shoreline
Lakes 3rd 18% (acres)
Rivers 4th 13% (miles)
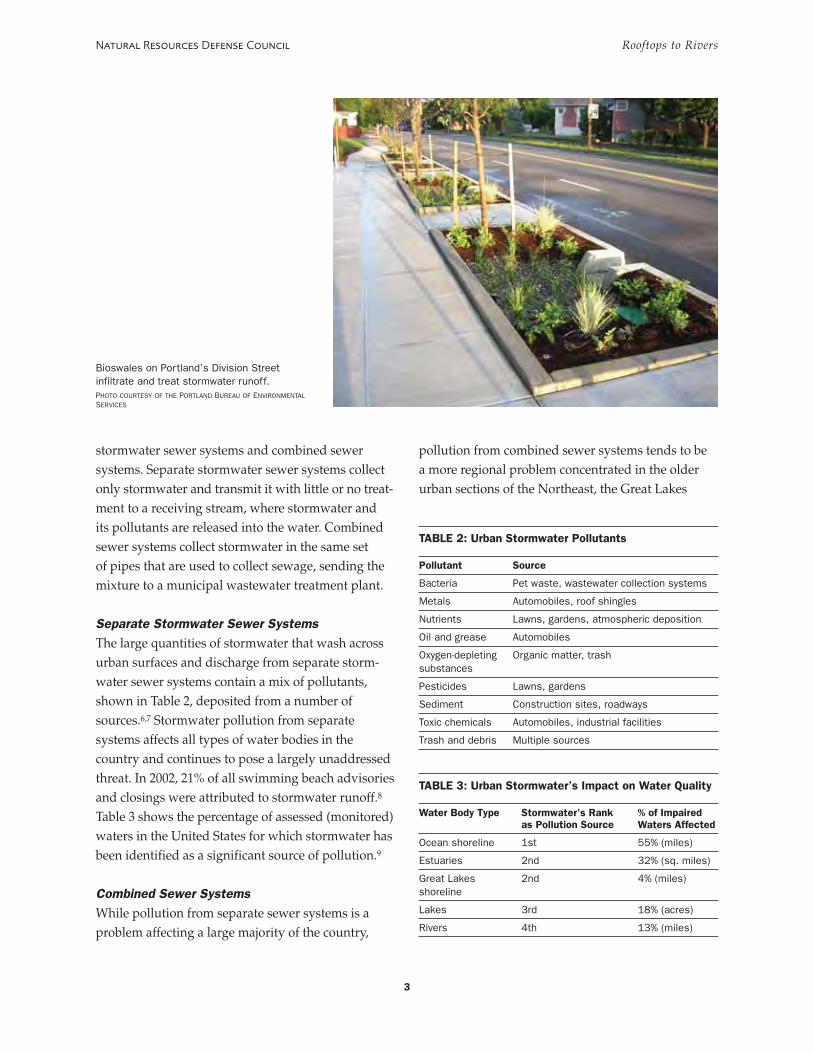
Bioswales on Portland’s Division Streetinfiltrate and treat stormwater runoff.PHOTO COURTESY OF THE PORTLAND BUREAU OF ENVIRONMENTALSERVICES
region, and the Pacific Northwest. Combined sewers,installed before the mid-twentieth century and priorto the use of municipal wastewater treatment, arepresent in 746 municipalities in 31 states and theDistrict of Columbia.10 They were originally used asa cost-effective method of transporting sewage andstormwater away from cities and delivering them toreceiving streams. As municipal wastewater treat-ment plants were installed to treat sewage and protectwater quality, the limited capacity of combined sewersduring wet weather events became apparent.11
During dry periods or small wet weather events,combined sewer systems carry untreated sewageand stormwater to a municipal wastewater treatmentplant where the combination is treated prior to beingdischarged. Larger wet weather events overwhelm acombined sewer system by introducing more storm-water than the collection system or wastewatertreatment plant is able to handle. In these situations,rather than backing up sewage and stormwater intobasements and onto streets, the system is designed todischarge untreated sewage and stormwater directlyto nearby water bodies through a system of com-bined sewer overflows (CSOs). In certain instances,despite the presence of sewer overflow points, base-ment and street overflows still occur. Even smallamounts of rainfall can trigger a CSO event; Wash-ington D.C.’s combined sewer system can overflowwith as little as 0.2 inch of rainfall.12
4
Natural Resources Defense Council Rooftops to Rivers
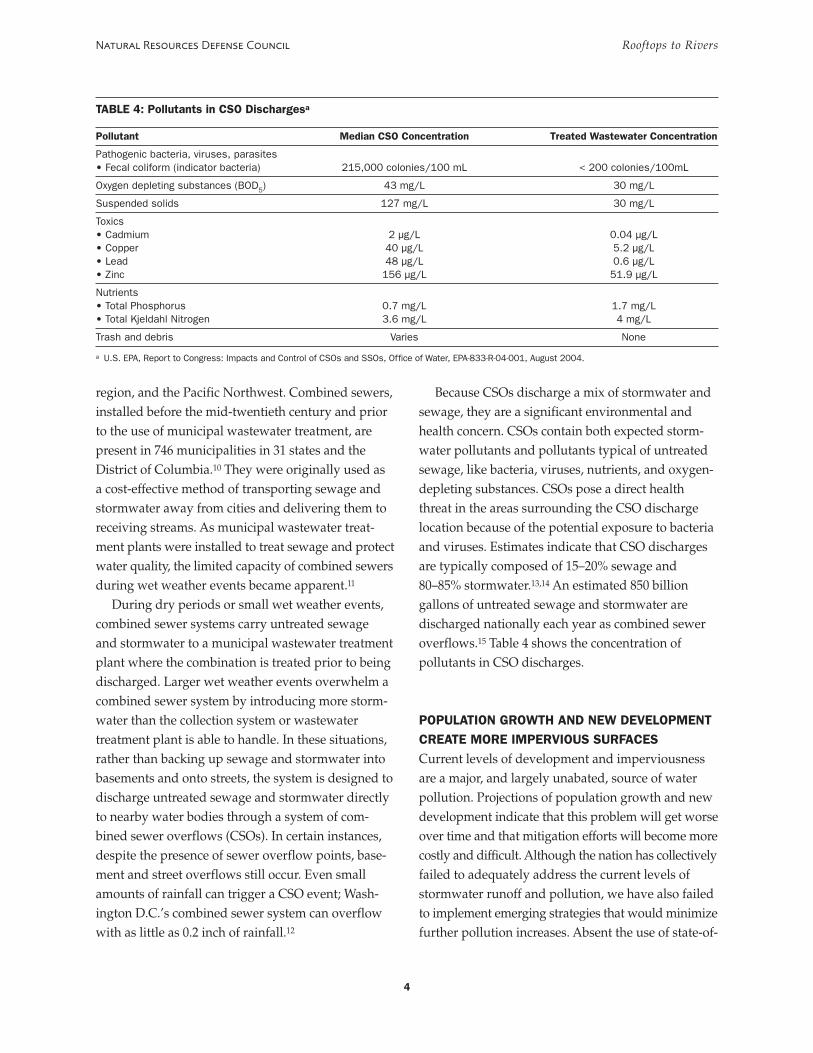
Because CSOs discharge a mix of stormwater andsewage, they are a significant environmental andhealth concern. CSOs contain both expected storm-water pollutants and pollutants typical of untreatedsewage, like bacteria, viruses, nutrients, and oxygen-depleting substances. CSOs pose a direct healththreat in the areas surrounding the CSO dischargelocation because of the potential exposure to bacteriaand viruses. Estimates indicate that CSO dischargesare typically composed of 15–20% sewage and80–85% stormwater.13,14 An estimated 850 billiongallons of untreated sewage and stormwater aredischarged nationally each year as combined seweroverflows.15 Table 4 shows the concentration ofpollutants in CSO discharges.
POPULATION GROWTH AND NEW DEVELOPMENTCREATE MORE IMPERVIOUS SURFACESCurrent levels of development and imperviousnessare a major, and largely unabated, source of waterpollution. Projections of population growth and newdevelopment indicate that this problem will get worseover time and that mitigation efforts will become morecostly and difficult. Although the nation has collectivelyfailed to adequately address the current levels ofstormwater runoff and pollution, we have also failedto implement emerging strategies that would minimizefurther pollution increases. Absent the use of state-of-
TABLE 4: Pollutants in CSO Dischargesa
Pollutant Median CSO Concentration Treated Wastewater Concentration
Pathogenic bacteria, viruses, parasites• Fecal coliform (indicator bacteria) 215,000 colonies/100 mL < 200 colonies/100mL
Oxygen depleting substances (BOD5) 43 mg/L 30 mg/L
Suspended solids 127 mg/L 30 mg/L
Toxics• Cadmium 2 µg/L 0.04 µg/L• Copper 40 µg/L 5.2 µg/L• Lead 48 µg/L 0.6 µg/L• Zinc 156 µg/L 51.9 µg/L
Nutrients• Total Phosphorus 0.7 mg/L 1.7 mg/L• Total Kjeldahl Nitrogen 3.6 mg/L 4 mg/L
Trash and debris Varies None
a U.S. EPA, Report to Congress: Impacts and Control of CSOs and SSOs, Office of Water, EPA-833-R-04-001, August 2004.
the-art stormwater controls, each new acre of landdeveloped and each new parcel of impervious surfacewill introduce new pollution into our waterways.
Recent studies also indicate that stormwaterpollution may soon start to increase at a higherrate than in the past. Over the past two decades,the rate of land development has been two timesgreater than the rate of population growth. Between1982 and 1997, while the U.S. population grew 15%,the amount of developed land in the continentalUnited States grew 34%, an increase of 25 millionacres.16,17 The 25 million acres developed duringthis 15-year period represent nearly 25% of the totalamount of developed land in the contiguous states.This rapid development pattern is alarming not onlybecause of the conversion of a large and growingpercentage of the remaining undeveloped land, butalso because of the increase in stormwater runoff thataccompanies development.
If the relationship between land development andpopulation growth continues, a significant amount ofland will be developed in the coming decades. Theanticipated 22% growth in U.S. population from 2000to 2025 will add an additional 68 million acres ofdevelopment.18 By 2030, half of the total square
5
Natural Resources Defense Council Rooftops to Rivers
footage of buildings—200 billion square feet—willhave been built after the year 2000.19
Much of this population growth and new devel-opment will occur in coastal regions, a particularconcern because urban stormwater runoff is alreadythe largest source of ocean shoreline water pollution.Although coastal counties comprise only 17% ofthe total acreage of the contiguous United Statesthey are home to more than 50% of the U.S. popu-lation. Because of high population concentrationson limited land areas, coastal counties contain ahigher percentage of development than interiorcounties. In 1997, 27 million acres of coastal countieshad been developed, accounting for nearly 14% ofthe total land area. By contrast, 71 million acres,about 4% of the total land area of interior counties,had been developed.20 Based on these trends,increased population and development in thesecoastal environments is likely to not only lead togreater amounts of impervious surfaces in coastalwatersheds, but also higher percentages of impervi-ousness. Conventional methods of stormwatercontrol will not be able to adequately manage thehigher amount of stormwater pollution implied bythis increased imperviousness.
The foremost challenge of reducing stormwaterpollution and CSO discharges is finding an
effective method of reducing the amount of storm-water created in urban environments. Methodscurrently used to manage stormwater largely fail toaddress the underlying problem of imperviousness.
Stormwater collected in separate systems typicallyis not treated before being discharged. In instanceswhere treatment is provided, it usually consists offiltration to remove suspended solids, debris, andfloatables. Because dissolved materials and nutrientsare difficult to treat in urban stormwater and littlehas been done to abate the scouring, erosion, andother physical impacts of stormwater discharges,treatment efforts have been largely ineffective atdiminishing stormwater-related water pollution.
Most municipal stormwater discharges are regu-lated as point sources under the Clean Water Act(CWA) and require a National Pollutant DischargeElimination System (NPDES) permit. However, end-of-pipe treatment and control typical of other per-mitted point-source discharges are often impractical forurban stormwater, because of the large volumes ofstormwater; generated and space constraints in urbanareas. Permits for urban stormwater require munici-palities to develop a stormwater management planand to implement best management practices.1 Thesemanagement measures are typically used in lieu ofspecific pollutant removal requirements. “Performance-based” standards are generally not required, and mini-mum control measures are sufficient for compliance.
As a result, compliance with urban stormwaterpermits does not necessarily result in improved
6
CHAPTER 3
water quality. Municipalities that develop programsto actually reduce stormwater pollution are moti-vated to do so because of their proximity to uniqueor valued water bodies or because of a need toprotect drinking water supplies. Some of the moreaggressive and innovative stormwater programs arelocated around sensitive or important water bodieslike the Chesapeake Bay, the Great Lakes, or PugetSound. Federal regulations require states to identifyquality-limited waterways and determine thereduction in the Total Maximum Daily Load (TMDL)of those pollutants necessary to meet water qualitystandards, but these pollutant load-reductionrequirements are not often translated into effectivestormwater management programs.2
Municipalities are required to implement short-term and long-term strategies to reduce overflowsfrom combined sewer systems, but significantnumbers of overflows continue to occur. The CWAprohibits the dry weather discharge of untreatedsewage and requires wet weather CSO dischargesto be limited and to control discharges of solidsand floatables. Federal regulations also require thatmunicipalities develop long-term CSO control plansthat detail procedures and infrastructure modifica-tions necessary to minimize wet weather overflowsand meet water quality standards.3 The long-termcontrol plans focus primarily on managing storm-water impacts on combined sewer systems.
Mitigating CSOs is costly. The 2000 Clean Water-sheds Needs Survey (CWNS) estimated that $56 bil-lion (2005 dollars) in capital investment was neededfor CSO control.4 Separating combined sewer lines
CONTROLLING STORMWATERIN URBAN ENVIRONMENTS
and building deep storage tunnels are the two cur-rently preferred methods of CSO control. The costsfor separating combined sewers, disconnecting storm-water inlets from the combined sewer system, anddirecting them to a newly installed separate stormsewer system range from $500 to $600 per foot of sewerseparated, or $2.6 million to $3.2 million for each mileof combined sewer to be separated.5 While sewer sep-aration will eliminate CSO discharges and the releaseof untreated sewage, the trade-off is an increase inthe volume of untreated stormwater discharges.
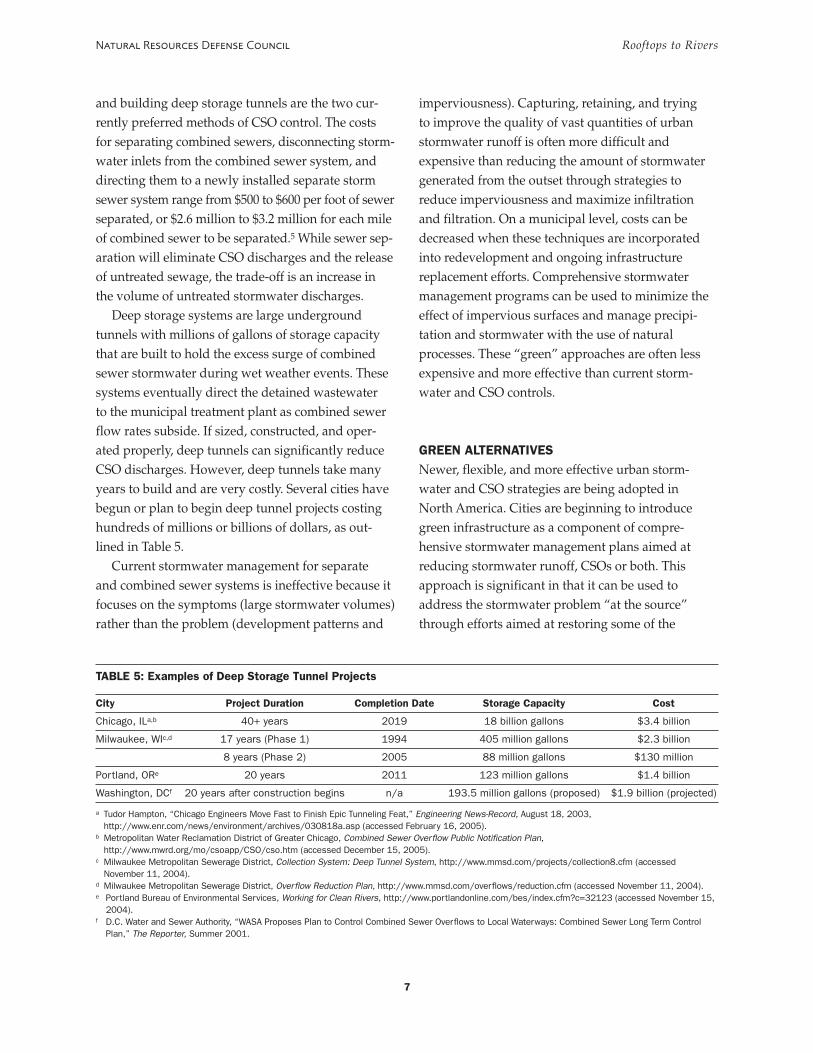
Deep storage systems are large undergroundtunnels with millions of gallons of storage capacitythat are built to hold the excess surge of combinedsewer stormwater during wet weather events. Thesesystems eventually direct the detained wastewaterto the municipal treatment plant as combined sewerflow rates subside. If sized, constructed, and oper-ated properly, deep tunnels can significantly reduceCSO discharges. However, deep tunnels take manyyears to build and are very costly. Several cities havebegun or plan to begin deep tunnel projects costinghundreds of millions or billions of dollars, as out-lined in Table 5.
Current stormwater management for separateand combined sewer systems is ineffective because itfocuses on the symptoms (large stormwater volumes)rather than the problem (development patterns and
7
Natural Resources Defense Council Rooftops to Rivers
imperviousness). Capturing, retaining, and tryingto improve the quality of vast quantities of urbanstormwater runoff is often more difficult andexpensive than reducing the amount of stormwatergenerated from the outset through strategies toreduce imperviousness and maximize infiltrationand filtration. On a municipal level, costs can bedecreased when these techniques are incorporatedinto redevelopment and ongoing infrastructurereplacement efforts. Comprehensive stormwatermanagement programs can be used to minimize theeffect of impervious surfaces and manage precipi-tation and stormwater with the use of naturalprocesses. These “green” approaches are often lessexpensive and more effective than current storm-water and CSO controls.
GREEN ALTERNATIVESNewer, flexible, and more effective urban storm-water and CSO strategies are being adopted inNorth America. Cities are beginning to introducegreen infrastructure as a component of compre-hensive stormwater management plans aimed atreducing stormwater runoff, CSOs or both. Thisapproach is significant in that it can be used toaddress the stormwater problem “at the source”through efforts aimed at restoring some of the
TABLE 5: Examples of Deep Storage Tunnel Projects
City Project Duration Completion Date Storage Capacity Cost
Chicago, ILa,b 40+ years 2019 18 billion gallons $3.4 billion
Milwaukee, WIc,d 17 years (Phase 1) 1994 405 million gallons $2.3 billion
8 years (Phase 2) 2005 88 million gallons $130 million
Portland, ORe 20 years 2011 123 million gallons $1.4 billion
Washington, DCf 20 years after construction begins n/a 193.5 million gallons (proposed) $1.9 billion (projected)
a Tudor Hampton, “Chicago Engineers Move Fast to Finish Epic Tunneling Feat,” Engineering News-Record, August 18, 2003,http://www.enr.com/news/environment/archives/030818a.asp (accessed February 16, 2005).
b Metropolitan Water Reclamation District of Greater Chicago, Combined Sewer Overflow Public Notification Plan,http://www.mwrd.org/mo/csoapp/CSO/cso.htm (accessed December 15, 2005).
c Milwaukee Metropolitan Sewerage District, Collection System: Deep Tunnel System, http://www.mmsd.com/projects/collection8.cfm (accessedNovember 11, 2004).
d Milwaukee Metropolitan Sewerage District, Overflow Reduction Plan, http://www.mmsd.com/overflows/reduction.cfm (accessed November 11, 2004).e Portland Bureau of Environmental Services, Working for Clean Rivers, http://www.portlandonline.com/bes/index.cfm?c=32123 (accessed November 15,
2004).f D.C. Water and Sewer Authority, “WASA Proposes Plan to Control Combined Sewer Overflows to Local Waterways: Combined Sewer Long Term Control
Plan,” The Reporter, Summer 2001.
natural hydrologic function of areas that have beenurbanized. Green infrastructure can also be used tolimit development in sensitive headwaters regionsand groundwater recharge areas to avoid the seg-mentation and isolation of natural environmentalareas and resources.
Green infrastructure can be applied in manyforms. It traditionally has been thought of as theinterconnected network of waterways, wetlands,woodlands, wildlife habitats, and other naturalareas that maintain natural ecological processes.6
In practice, installing green infrastructure meanspreserving, creating, or restoring vegetated areasand natural corridors such as greenways, parks, con-servation easements, and riparian buffers. Whenlinked together through an urban environment,these lands provide rain management benefits simi-lar to natural undeveloped systems, thereby reducingthe volume of stormwater runoff. With green infra-structure, stormwater management is accomplishedby letting the environment manage water naturally:capturing and retaining rainfall, infiltrating runoff,and trapping and absorbing pollutants. For example,the Village Homes community in Davis, California,uses a system of vegetated swales and meanderingstreams to manage stormwater. The natural drainage
8
Natural Resources Defense Council Rooftops to Rivers
system is able to infiltrate and retain a rainfallvolume greater than the 10-year storm withoutdischarging to the municipal storm sewer system.
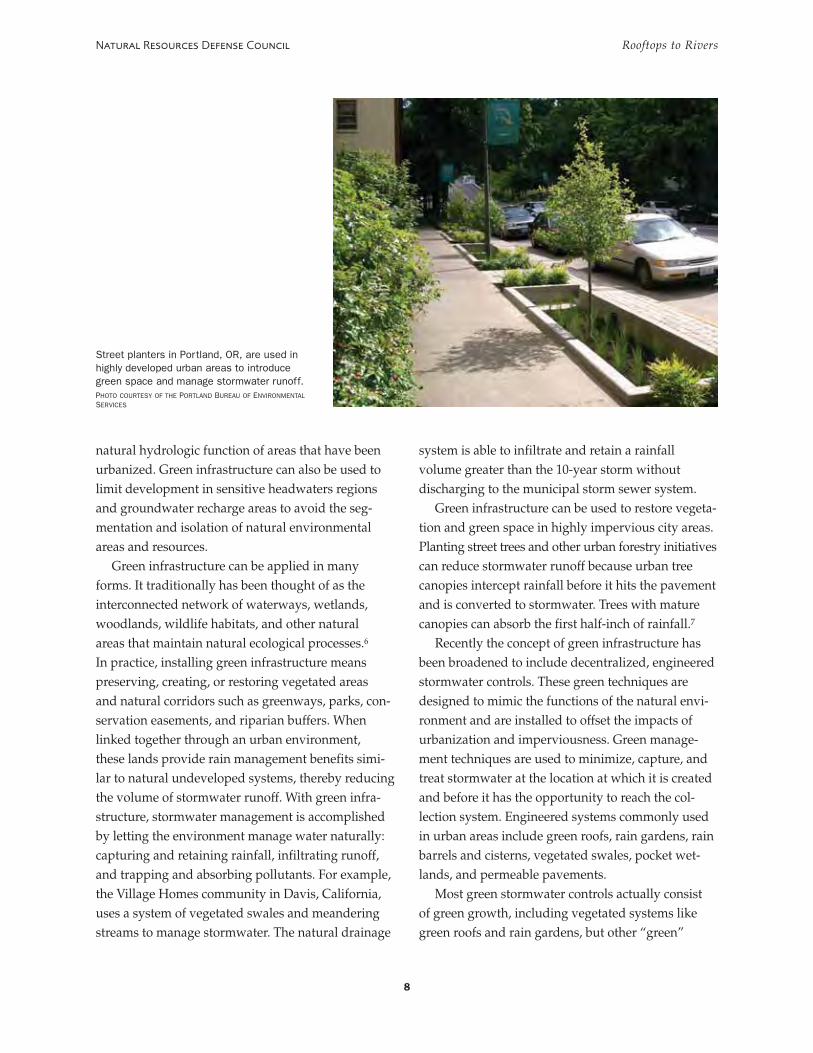
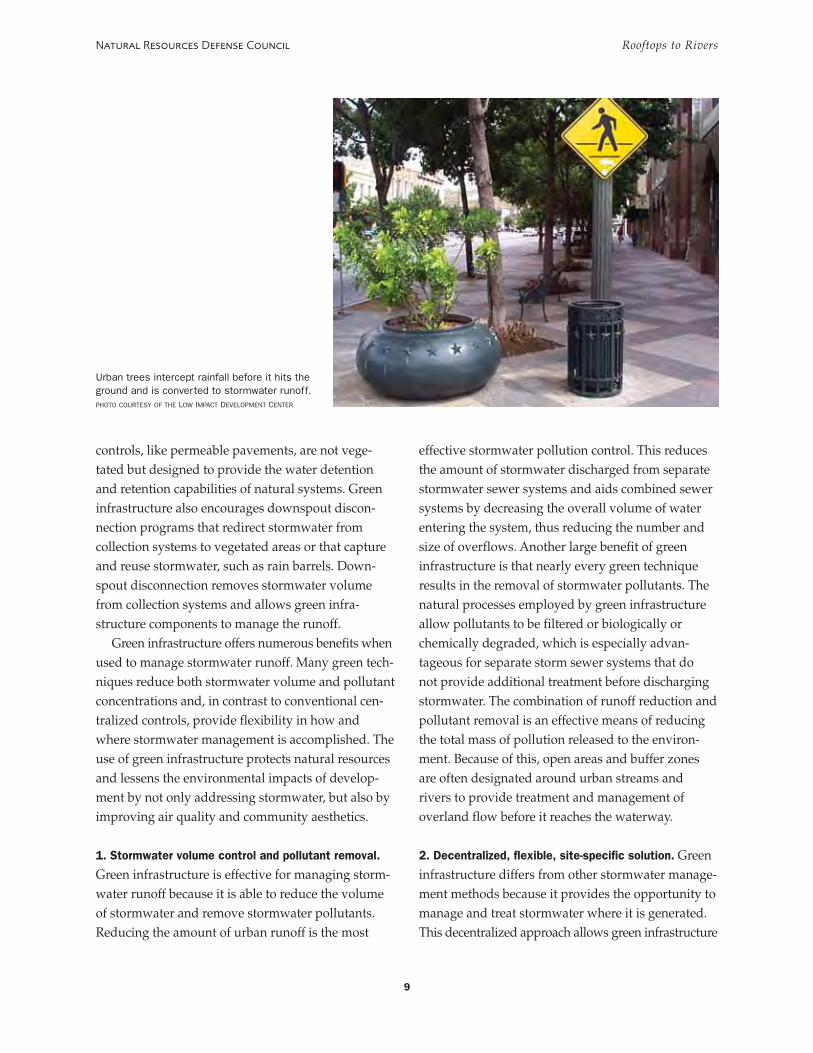
Green infrastructure can be used to restore vegeta-tion and green space in highly impervious city areas.Planting street trees and other urban forestry initiativescan reduce stormwater runoff because urban treecanopies intercept rainfall before it hits the pavementand is converted to stormwater. Trees with maturecanopies can absorb the first half-inch of rainfall.7
Recently the concept of green infrastructure hasbeen broadened to include decentralized, engineeredstormwater controls. These green techniques aredesigned to mimic the functions of the natural envi-ronment and are installed to offset the impacts ofurbanization and imperviousness. Green manage-ment techniques are used to minimize, capture, andtreat stormwater at the location at which it is createdand before it has the opportunity to reach the col-lection system. Engineered systems commonly usedin urban areas include green roofs, rain gardens, rainbarrels and cisterns, vegetated swales, pocket wet-lands, and permeable pavements.
Most green stormwater controls actually consistof green growth, including vegetated systems likegreen roofs and rain gardens, but other “green”
Street planters in Portland, OR, are used inhighly developed urban areas to introducegreen space and manage stormwater runoff.PHOTO COURTESY OF THE PORTLAND BUREAU OF ENVIRONMENTALSERVICES
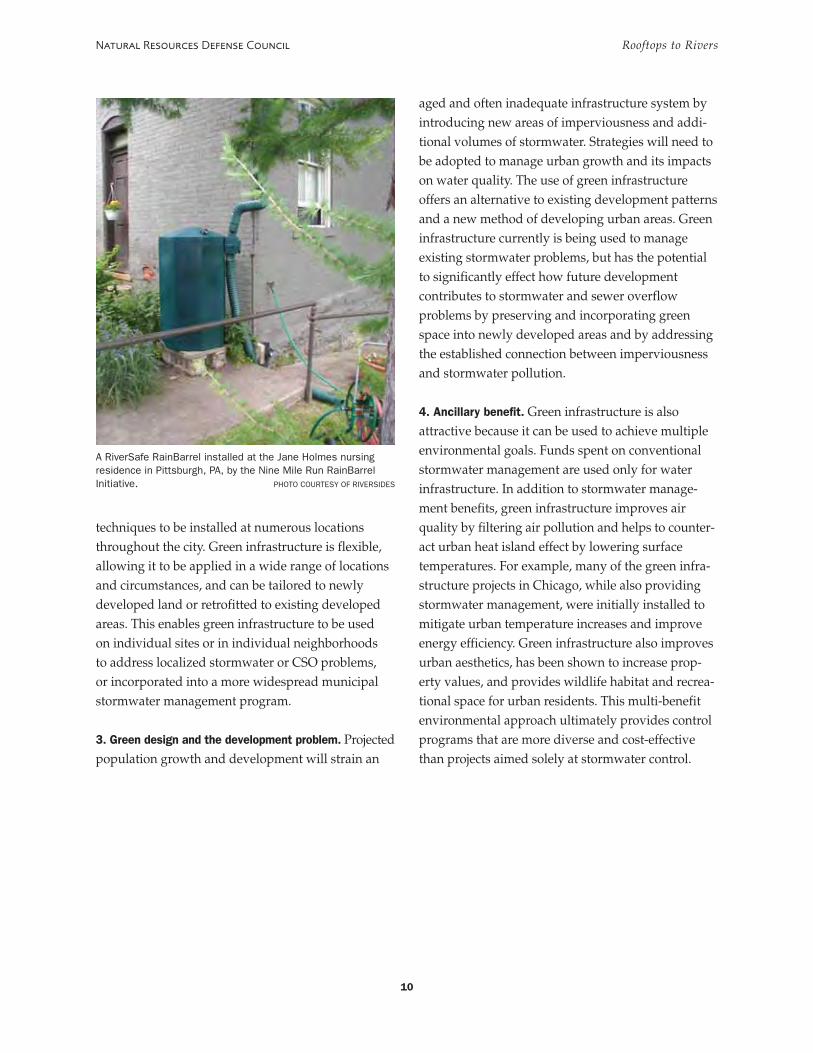
controls, like permeable pavements, are not vege-tated but designed to provide the water detentionand retention capabilities of natural systems. Greeninfrastructure also encourages downspout discon-nection programs that redirect stormwater fromcollection systems to vegetated areas or that captureand reuse stormwater, such as rain barrels. Down-spout disconnection removes stormwater volumefrom collection systems and allows green infra-structure components to manage the runoff.
Green infrastructure offers numerous benefits whenused to manage stormwater runoff. Many green tech-niques reduce both stormwater volume and pollutantconcentrations and, in contrast to conventional cen-tralized controls, provide flexibility in how andwhere stormwater management is accomplished. Theuse of green infrastructure protects natural resourcesand lessens the environmental impacts of develop-ment by not only addressing stormwater, but also byimproving air quality and community aesthetics.
1. Stormwater volume control and pollutant removal.
Green infrastructure is effective for managing storm-water runoff because it is able to reduce the volumeof stormwater and remove stormwater pollutants.Reducing the amount of urban runoff is the most
9
Natural Resources Defense Council Rooftops to Rivers
effective stormwater pollution control. This reducesthe amount of stormwater discharged from separatestormwater sewer systems and aids combined sewersystems by decreasing the overall volume of waterentering the system, thus reducing the number andsize of overflows. Another large benefit of greeninfrastructure is that nearly every green techniqueresults in the removal of stormwater pollutants. Thenatural processes employed by green infrastructureallow pollutants to be filtered or biologically orchemically degraded, which is especially advan-tageous for separate storm sewer systems that donot provide additional treatment before dischargingstormwater. The combination of runoff reduction andpollutant removal is an effective means of reducingthe total mass of pollution released to the environ-ment. Because of this, open areas and buffer zonesare often designated around urban streams andrivers to provide treatment and management ofoverland flow before it reaches the waterway.
2. Decentralized, flexible, site-specific solution. Greeninfrastructure differs from other stormwater manage-ment methods because it provides the opportunity tomanage and treat stormwater where it is generated.This decentralized approach allows green infrastructure
Urban trees intercept rainfall before it hits theground and is converted to stormwater runoff.PHOTO COURTESY OF THE LOW IMPACT DEVELOPMENT CENTER
techniques to be installed at numerous locationsthroughout the city. Green infrastructure is flexible,allowing it to be applied in a wide range of locationsand circumstances, and can be tailored to newlydeveloped land or retrofitted to existing developedareas. This enables green infrastructure to be usedon individual sites or in individual neighborhoodsto address localized stormwater or CSO problems,or incorporated into a more widespread municipalstormwater management program.
3. Green design and the development problem. Projectedpopulation growth and development will strain an
10
Natural Resources Defense Council Rooftops to Rivers
aged and often inadequate infrastructure system byintroducing new areas of imperviousness and addi-tional volumes of stormwater. Strategies will need tobe adopted to manage urban growth and its impactson water quality. The use of green infrastructureoffers an alternative to existing development patternsand a new method of developing urban areas. Greeninfrastructure currently is being used to manageexisting stormwater problems, but has the potentialto significantly effect how future developmentcontributes to stormwater and sewer overflowproblems by preserving and incorporating greenspace into newly developed areas and by addressingthe established connection between imperviousnessand stormwater pollution.
4. Ancillary benefit. Green infrastructure is alsoattractive because it can be used to achieve multipleenvironmental goals. Funds spent on conventionalstormwater management are used only for waterinfrastructure. In addition to stormwater manage-ment benefits, green infrastructure improves airquality by filtering air pollution and helps to counter-act urban heat island effect by lowering surfacetemperatures. For example, many of the green infra-structure projects in Chicago, while also providingstormwater management, were initially installed tomitigate urban temperature increases and improveenergy efficiency. Green infrastructure also improvesurban aesthetics, has been shown to increase prop-erty values, and provides wildlife habitat and recrea-tional space for urban residents. This multi-benefitenvironmental approach ultimately provides controlprograms that are more diverse and cost-effectivethan projects aimed solely at stormwater control.
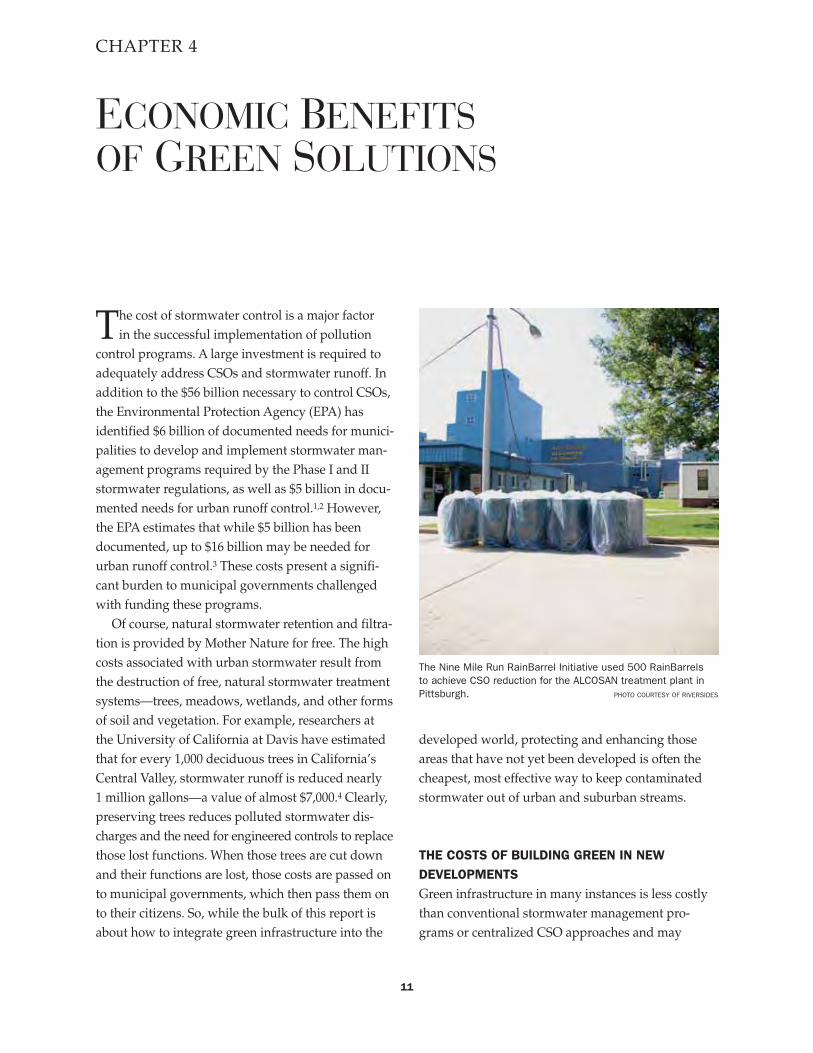
A RiverSafe RainBarrel installed at the Jane Holmes nursingresidence in Pittsburgh, PA, by the Nine Mile Run RainBarrelInitiative. PHOTO COURTESY OF RIVERSIDES
11
The cost of stormwater control is a major factorin the successful implementation of pollution
control programs. A large investment is required toadequately address CSOs and stormwater runoff. Inaddition to the $56 billion necessary to control CSOs,the Environmental Protection Agency (EPA) hasidentified $6 billion of documented needs for munici-palities to develop and implement stormwater man-agement programs required by the Phase I and IIstormwater regulations, as well as $5 billion in docu-mented needs for urban runoff control.1,2 However,the EPA estimates that while $5 billion has beendocumented, up to $16 billion may be needed forurban runoff control.3 These costs present a signifi-cant burden to municipal governments challengedwith funding these programs.
Of course, natural stormwater retention and filtra-tion is provided by Mother Nature for free. The highcosts associated with urban stormwater result fromthe destruction of free, natural stormwater treatmentsystems—trees, meadows, wetlands, and other formsof soil and vegetation. For example, researchers atthe University of California at Davis have estimatedthat for every 1,000 deciduous trees in California’sCentral Valley, stormwater runoff is reduced nearly1 million gallons—a value of almost $7,000.4 Clearly,preserving trees reduces polluted stormwater dis-charges and the need for engineered controls to replacethose lost functions. When those trees are cut downand their functions are lost, those costs are passed onto municipal governments, which then pass them onto their citizens. So, while the bulk of this report isabout how to integrate green infrastructure into the
CHAPTER 4
developed world, protecting and enhancing thoseareas that have not yet been developed is often thecheapest, most effective way to keep contaminatedstormwater out of urban and suburban streams.
THE COSTS OF BUILDING GREEN IN NEWDEVELOPMENTSGreen infrastructure in many instances is less costlythan conventional stormwater management pro-grams or centralized CSO approaches and may
ECONOMIC BENEFITSOF GREEN SOLUTIONS
The Nine Mile Run RainBarrel Initiative used 500 RainBarrelsto achieve CSO reduction for the ALCOSAN treatment plant inPittsburgh. PHOTO COURTESY OF RIVERSIDES
12
Natural Resources Defense Council Rooftops to Rivers
provide an opportunity to decrease the economicburden of stormwater management. Studies inMaryland and Illinois show that new residentialdevelopments using green infrastructure stormwatercontrols saved $3,500 to $4,500 per lot (quarter- tohalf-acre lots) when compared to new developmentswith conventional stormwater controls.5,6 Thesedevelopments were conceived and designed toreduce and manage stormwater runoff by preservingnatural vegetation and landscaping, reducing overallsite imperviousness, and installing green stormwatercontrols. Cost savings for these developmentsresulted from less conventional stormwater infra-structure and paving and lower site preparationcosts. Importantly, in addition to lowering costs,each of the sites discharges less stormwater than con-ventional developments. Adding to the cost savings,developments utilizing green infrastructure normallyyield more lots for sale by eliminating land-consumingconventional stormwater controls, and lots in greendevelopments generally have a higher sale pricebecause of the premium that buyers place onvegetation and conservation development.7,8
OUTFITTING EXISTING DEVELOPMENTS WITHGREEN INFRASTRUCTUREThe economics of retrofitting existing urban areaswith stormwater controls differ from new develop-ment. Urban stormwater retrofits can be expensiveand complicated by space constraints, although thisis not always the case. Based upon the costs of theirpilot projects, city officials in Seattle and Vancouver(discussed in the case studies on pages 29 and 33),believe that the costs of future green infrastructureinstallations will be similar to or slightly more thanconventional stormwater controls.9,10 The analysisconducted by the city of Vancouver indicates thatretrofitting green infrastructure into locations withexisting conventional stormwater controls will costonly marginally more than rehabilitating the conven-tional system, but introducing green infrastructureinto new development will cost less.11 However,while green infrastructure may be more expensive in
some instances, municipalities believe that the addi-tional benefits of green controls—including the crea-tion of more aesthetic city space and the significantreduction in water pollution—justify the added cost.In addition, green infrastructure can be incrementallyintroduced into urban environments, allowing thecosts to be incurred over a longer period of time.
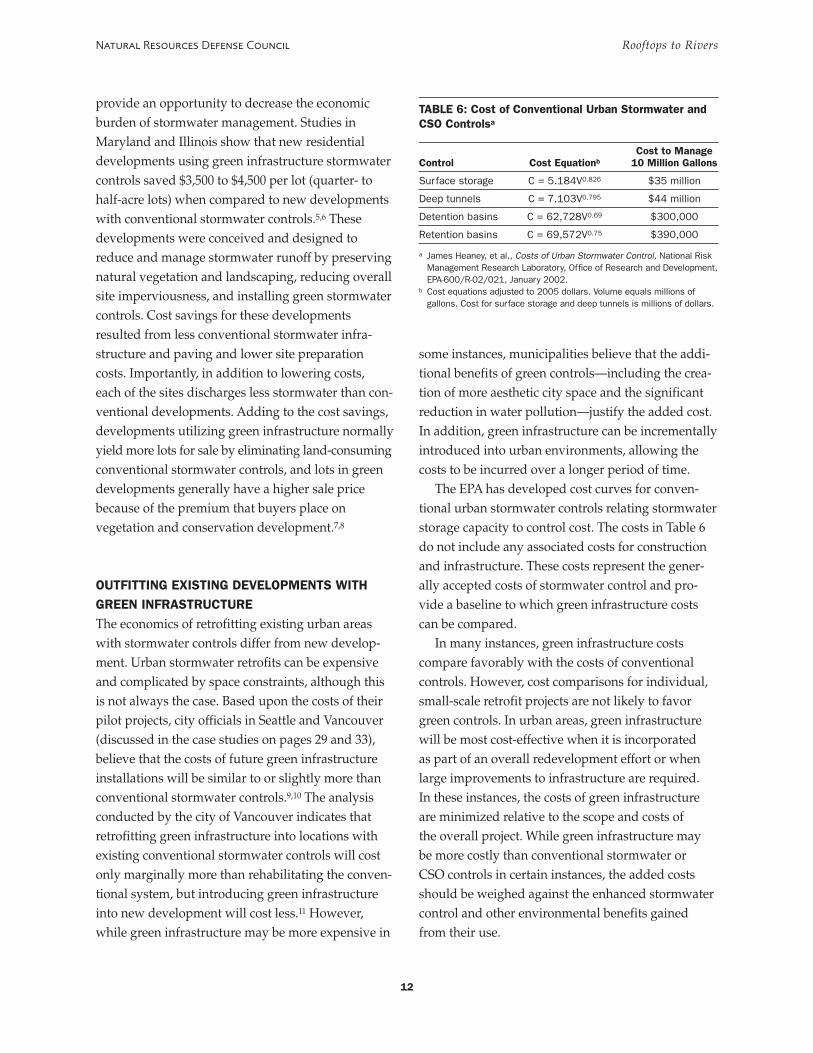
The EPA has developed cost curves for conven-tional urban stormwater controls relating stormwaterstorage capacity to control cost. The costs in Table 6do not include any associated costs for constructionand infrastructure. These costs represent the gener-ally accepted costs of stormwater control and pro-vide a baseline to which green infrastructure costscan be compared.
In many instances, green infrastructure costscompare favorably with the costs of conventionalcontrols. However, cost comparisons for individual,small-scale retrofit projects are not likely to favorgreen controls. In urban areas, green infrastructurewill be most cost-effective when it is incorporatedas part of an overall redevelopment effort or whenlarge improvements to infrastructure are required.In these instances, the costs of green infrastructureare minimized relative to the scope and costs ofthe overall project. While green infrastructure maybe more costly than conventional stormwater orCSO controls in certain instances, the added costsshould be weighed against the enhanced stormwatercontrol and other environmental benefits gainedfrom their use.
TABLE 6: Cost of Conventional Urban Stormwater andCSO Controlsa
Cost to ManageControl Cost Equationb 10 Million Gallons
Surface storage C = 5.184V0.826 $35 million
Deep tunnels C = 7.103V0.795 $44 million
Detention basins C = 62,728V0.69 $300,000
Retention basins C = 69,572V0.75 $390,000
a James Heaney, et al., Costs of Urban Stormwater Control, National RiskManagement Research Laboratory, Office of Research and Development,EPA-600/R-02/021, January 2002.
b Cost equations adjusted to 2005 dollars. Volume equals millions ofgallons. Cost for surface storage and deep tunnels is millions of dollars.
13
Although green infrastructure has been shown toreduce stormwater runoff and combined sewer
overflows and improve water quality, its adoptionacross the country has been slow. Cities that haveincorporated green infrastructure into their storm-water management programs have often done sobecause of direct efforts to encourage alternativestormwater approaches. The following recommenda-tions can be used to encourage the use of greeninfrastructure in municipalities.
1. Get development right the first time. Reducing orpreventing stormwater runoff is the most effectiveway to minimize pollution because it preventspollutants from being transported to water bodies.Incorporating green infrastructure into the earlieststages of community development can negate orlimit the need for larger-scale, more expensivestormwater controls. Minimizing imperviousness,preserving existing vegetation, and incorporatinggreen space into designs all decrease the impact thaturbanization has on water quality. Used in this way,green infrastructure design is a more cost-effectivestrategy, often costing less to develop per lot whileyielding more lots at an increased sale price.1,2
2. Incorporate green infrastructure into long-term
control plans for managing combined sewer overflows.
Cities with combined sewer systems are required todevelop long-term plans to reduce sewer overflowsenough to meet water quality standards.3 Greeninfrastructure has proven to be valuable in reducinginflows into combined sewer systems and should be
CHAPTER 5
integrated into such plans. Rather than relying solelyon conventional, centralized storage projects toreduce CSO volumes, municipalities shouldconsidering using green techniques, which can beintegrated into redevelopment projects andinfrastructure repairs and upgrades. Each yearPortland, Oregon’s downspout disconnectionprogram diverts 1 billion gallons of stormwater fromthe collection system and has been used to helpalleviate localized combined sewer system backupsin city neighborhoods.4
3. Revise state and local stormwater regulations to
encourage green design. Most state and localstormwater regulations focus on peak flow ratecontrol. To encourage more effective stormwatermanagement, these regulations should be revised torequire minimizing and reducing impervioussurfaces, protecting existing vegetation, maintainingpredevelopment runoff volume and infiltrationrates, and providing water quality improvements.These requirements encourage green infrastructurebecause it can meet each of these objectives. Portland,Oregon, requires on-site stormwater managementfor new development and redevelopment in bothCSO and separate sewer areas of the city andencourages use of green infrastructure to complywith the regulation (more details about Portland’sdevelopment regulations can be found in the casestudy on page 24).
New Jersey’s stormwater management standardsrequire 300-foot riparian buffers and stipulate apreference for nonstructural best management
POLICY RECOMMENDATIONSFOR LOCAL DECISION MAKERS
practices (BMPs). These standards also institutewater quantity as well as quality regulations. Thewater quantity standards require no change ingroundwater recharge volume following construc-tion and that infiltration be used to maintain pre-development runoff volumes and peak flow rates.Any increase in runoff volume must be offset by adecrease in post-construction peak flow rate. Waterquality standards require a reduction in stormwaternutrient loads to the “maximum extent feasible”and total suspended solids (TSS) reductions of 80%.If the receiving water body is a high-quality wateror tributary, the required TSS reduction is 95%.5
Berlin, Germany, has incorporated the Green AreaFactor (GAF) into its regulations. Based on land useand zoning, the GAF sets a greening target for eachproperty that provides the required ratio of vegetatedelements to impervious surface. Once propertyowners apply for a building permit, they are requiredto satisfy the green target goal. Property ownersselect green infrastructure practices from an approvedlist and determine compliance by calculating theproportion of the property dedicated to the greeningtarget. Selected green infrastructure practices areweighted according to their effectiveness at meetingenvironmental goals.6
14
Natural Resources Defense Council Rooftops to Rivers
To date, the U.S. federal government has declinedto set performance standards for stormwater dis-charges from development or to add specifics to the“maximum extent practicable” standard set by theClean Water Act for discharges from municipalities.7
Since the federal government has failed to showleadership in this area, state and local entities mustdo so.
4. Establish dedicated funding for stormwater
management that rewards green design. Adequatefunding is critical for successful stormwatermanagement programs. The billions of dollarsnecessary to mitigate stormwater pollution andcombined sewer overflows require federal fundingto augment state and municipal funding. Toencourage its use, dedicated stormwater fundingsources could identify a preference for green infra-structure or establish a funding scale based uponthe relative use of green management techniques.
Many jurisdictions are creating stormwater utili-ties similar in function to water and wastewater utili-ties. Stormwater utilities allow for the assessmentand collection of a user fee dedicated to a stormwatermanagement program. Other jurisdictions dedicatea certain portion of collected local tax revenue to a
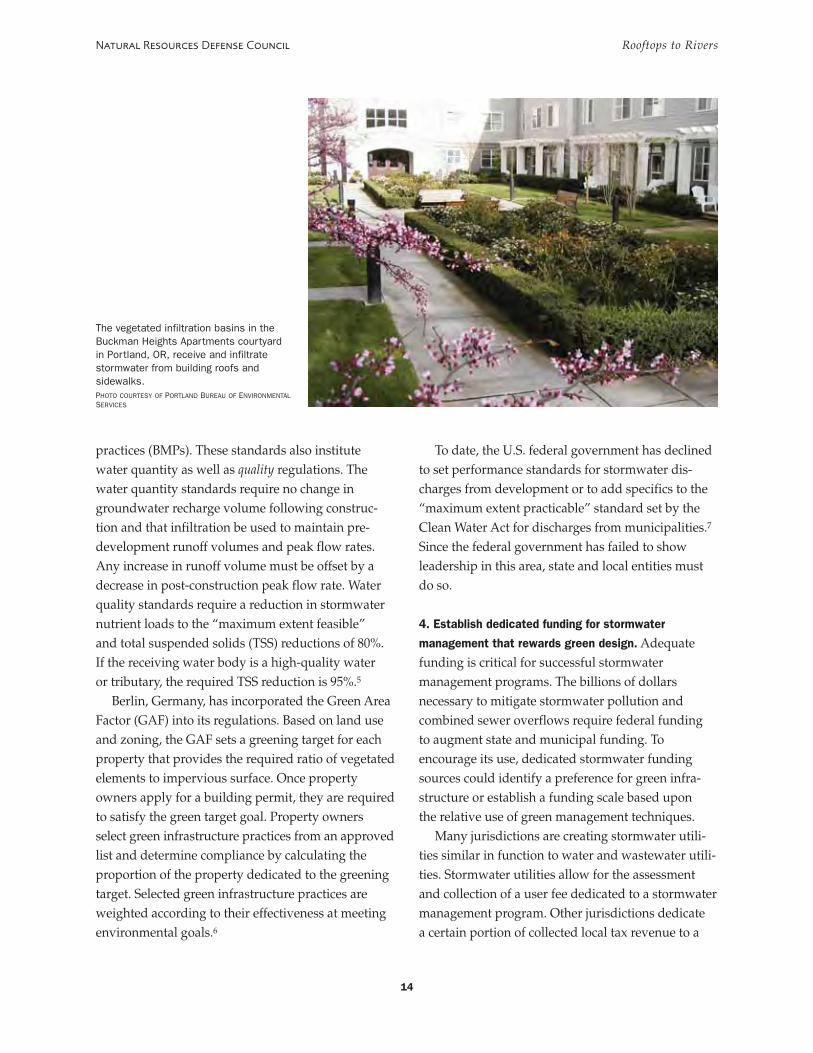
The vegetated infiltration basins in theBuckman Heights Apartments courtyardin Portland, OR, receive and infiltratestormwater from building roofs andsidewalks.PHOTO COURTESY OF PORTLAND BUREAU OF ENVIRONMENTALSERVICES
stormwater fund. Establishing a dedicated fundremoves stormwater management from generalrevenue funding, which is subject to variable fundingand competes with other general taxation programsfor money. Stormwater utilities, where allowed byenabling legislation, are popular because of theability to determine a user rate structure and as acomplement to incentive programs.8,9
5. Provide incentives for residential and commercial
use of green infrastructure. Various incentives arealready in place to encourage green infrastructureuse in a number of cities. For example, Portland,Oregon, allows additional building square footagefor buildings with green roofs, and Chicago providesa density bonus option for buildings with vegetativecover on the roof.10,11 The city of Chicago also pro-vided 20 $5,000 grants to install small-scale com-mercial or residential green roofs in early 2006.12 Alsobeginning in 2006, Portland will provide up to a 35%discount in its stormwater utility fee for propertieswith on-site stormwater management.13 Marylandprovides credits for using green infrastructure whendetermining compliance with its stormwater regu-latory requirements. Six different credits, all relatedto green infrastructure design, are available.14 Severalcities fund or subsidize downspout disconnectionprograms; Portland’s program pays homeowners$53 per downspout disconnected or the city willdisconnect the downspouts for free.
6. Review and revise local development ordinances.
Local zoning requirements and building codes ofteninadvertently discourage the use of green infra-structure. Provisions requiring downspouts to beconnected to the stormwater collection systemprohibit disconnection programs and the use of greenspace for treatment of rooftop runoff. Mandatorystreet widths and building setbacks can unnecessarilyincrease imperviousness. Stormwater treatmentrequirements that favor centralized collection andtreatment and prescribe treatment options offer little
15
Natural Resources Defense Council Rooftops to Rivers
opportunity or incentive to use green infrastructure.Jurisdictions should review their applicable storm-water and wastewater ordinances and revise themto remove barriers to green infrastructure use andencourage more environmentally friendly regulations.15
7. Preserve existing trees, open space, and stream
buffers. Too often, development removes nearly allexisting natural features. Simply preserving trees,open space, and stream buffers and incorporatingthem into the community will help maintain waterquality and manage stormwater runoff while lessen-ing the need for additional stormwater controls.For example, New Jersey’s stormwater managementstandards require 300-foot riparian buffers fornew developments and redevelopments to protectwater quality.16
8. Encourage and use smart growth. Smart growth canbe used to limit sprawl and reduce the introductionof impervious surfaces. Smart growth policies canidentify and protect sensitive environmental areasand direct development to locations with adequateinfrastructure. By limiting sprawl and discouragingdevelopment in sensitive areas, smart growth mayincrease population densities and imperviousness inpreviously urbanized areas. Smart growth strategiesshould be coupled with green infrastructure to limitthe stormwater and infrastructure effects of a poten-tial increase in urbanization.
9. Get the community involved. Green infrastructurepresents an opportunity for community outreach andeducation. Downspout disconnections, rain barrels,rain gardens, and green roofs may individuallymanage a relatively small volume of stormwater butcollectively can have a significant impact. Portland’sdownspout disconnection program, for example,now diverts 1 billion gallons of stormwater awayfrom the combined sewer system each year. Greeninfrastructure can be introduced into a communityone lot at a time.
16
CHAPTER
While development, imperviousness, and urban-ization have all taken their toll on downstream
waterways, current stormwater and combined seweroverflow (CSO) mitigation efforts have failed toadequately address the problem or improve waterquality because they are focused on end-of-pipesolutions. Current levels of development andimperviousness have degraded the nation’s waterquality, and future population growth and develop-ment will only exacerbate the problem. Additionaldevelopment will make stormwater and CSO controlsolutions even more difficult and costly.
Green infrastructure offers the opportunity to notonly develop new areas in a more environmentallyefficient manner, but also to rehabilitate existing devel-oped areas. Urbanization and development alter howwater is distributed throughout the environment. Muchgreater volumes of stormwater are generated and dis-charged to receiving water bodies in developed areasthan would be in the natural environment. Greeninfrastructure is providing measurable water qualityimprovements, most notably in stormwater volumereduction and CSO mitigation.
Some jurisdictions and cities have chosen greeninfrastructure as a preferable method of stormwateror CSO control based upon the specific needs andgoals of the municipality. Others have installed greeninfrastructure to experiment with innovative storm-water or combined sewer overflow pilot projects. Butall of these efforts demonstrate how it can be success-fully integrated into urban communities.
A common driver among the cities using greeninfrastructure is compliance with regulatory require-ments. The catalyst for Portland, Oregon’s activeprogram, for example, is a need to satisfy a number
CHAPTER 6
of environmental commitments, including a consentdecree to limit CSO discharges, Safe DrinkingWater Act standards influencing the quality of infil-trated stormwater, and emerging TMDL load andwaste load allocations.1 Other cities with combinedsewer systems, or those that discharge stormwaterto sensitive receiving waters, face similar require-ments. Such regulations only increase the oppor-tunities for creativity and willingness on the partof municipal decision makers to actively promoteand introduce green infrastructure. City leadersare finding that when faced with the simultaneouschallenges of regulatory requirements, infrastructurelimitations, and financial constraints, green infra-structure often emerges as an appropriate meansof satisfying each.
Another commonality among cities that haveincorporated green infrastructure into theirstormwater and CSO control plans is a commitmentfrom city personnel. Whether elected officials orprofessional staff, these city leaders have recognizedthe benefits of green infrastructure and havesuccessfully communicated its value to the public.These cities have also been innovative with theirregulations and environmental policies, looking forexisting and alternative avenues to encourageadoption of new stormwater and CSO controlstrategies. These efforts are often popular because ofthe public’s positive response to the “greenscaping”that has accompanied the programs. As many localdecision makers have already found, using greeninfrastructure in place of or in combination with lesseffective conventional methods of handlingstormwater runoff can have benefits beyond justeconomic cost savings and reduced pollution.
CONCLUSION
CH
ICA
GO
The following nine case studies illustrate efforts inNorth America to incorporate green infrastructure
into urban stormwater and combined sewer overflow(CSO) control strategies, but this is not an exhaustivelist. Several factors were used to select case-study cities.Among them were extent and duration of programefforts, availability of information and quantifiabledata, geographic location, and the number and typeof green infrastructure elements practiced.
Chicago, IllinoisProgressive environmental change through creativeuse of green infrastructurePopulation: 2.9 millionType of green infrastructure used: green roofs; raingardens, vegetated swales, and landscape; perme-able pavement; downspout disconnection/rainwatercollectionProgram elements: used for direct CSO control;established municipal programs and public funding
Historically, Chicago has been known morefor its industrial horsepower than for progressiveenvironmental ideas. Rivers like Bubbly Creek stillbear the names they earned from the pollution theyonce contained. Stories of the city’s sewage andpollution problems from as early as the 1880s stillpersist as popular legends. However, recent initia-tives show that Chicago is emerging as a leader ingreen development, with an extensive green roofprogram, environmentally sensitive demonstrationprojects, and municipal policies that encouragedecentralized stormwater management. The cityhas been particularly creative in its approach, usinggreen infrastructure projects to not only manage
CHAPTER 7
stormwater runoff but also to address otherenvironmental issues, such as mitigating urbanheat island effects and improving energy efficiencyin buildings.
Stormwater Collection Through Expansion of theCombined Sewer SystemWhile the city’s past environmental infrastructureprojects have had dubious goals, the water qualityof Lake Michigan, the city’s drinking water source,has long been a concern. In the early 1900s, sewageand stockyard pollution from the Chicago Riverprompted Chicago officials to reverse the courseof the South Branch of the river away from LakeMichigan and to the Mississippi River in an effortto improve the lake’s water quality.1 Water issuesremain a concern for the city more than a centurylater. The city manages one of the largest wastewatercollection and treatment systems in the world andcontends with flooding, surface water qualityimpairment, and CSOs. Urban runoff challenges areexacerbated by the magnitude of infrastructureneeded to serve Chicago’s population. The city itselfhas over 4,400 miles of sewage infrastructure thatcost about $50 million annually to maintain.2 Approx-imately 3 million people call Chicago home, andthe population of the entire six-county metro regionsurrounding the city exceeds 8 million; the region’spopulation is projected to increase 20% by 2030.3
Impervious surfaces cover approximately 58% ofthe city.4
Chicago has pursued a number of initiatives toimprove stormwater collection, the most ambitiousbeing a $3.4 billion project to collect and store storm-water and sewage from the combined sewer system.5
CASE STUDIES
17
CHAPTER
In the 1970s, the Metropolitan Water ReclamationDistrict began construction of the primary controlsolution for CSOs—the Tunnel and Reservoir Plan(TARP). In 2003, with only part of the system opera-tional, more than 44 billion gallons of stormwaterwere captured; 10 billion gallons, however, werereleased as CSOs.6 Approximately 2.5 billion gallonsof storage are currently available in the TARP system.An additional 15.6 billion gallons of storage will beavailable when two more reservoirs are added to thesystem; construction is scheduled for completion in2019.7,8 When complete, the system will handle mostof Chicago’s CSO discharges, storing combined runoffand sewage until it can be sent for secondary treat-ment at a wastewater treatment plant.
Chicago’s Green Roof ProgramAlthough the Metropolitan Water ReclamationDistrict has committed to this massive public worksproject, the city has also pursued several initiativesto install green infrastructure that promotes on-sitestormwater management, including green roofs,permeable paving projects, rain barrels, and greenbuildings. Much of this investment in green infra-structure has paralleled the increase in populationand building within the city over the last decade.
18
Natural Resources Defense Council Rooftops to Rivers
And, unlike the past, the Chicago River is now seenas a public amenity rather than a liability.
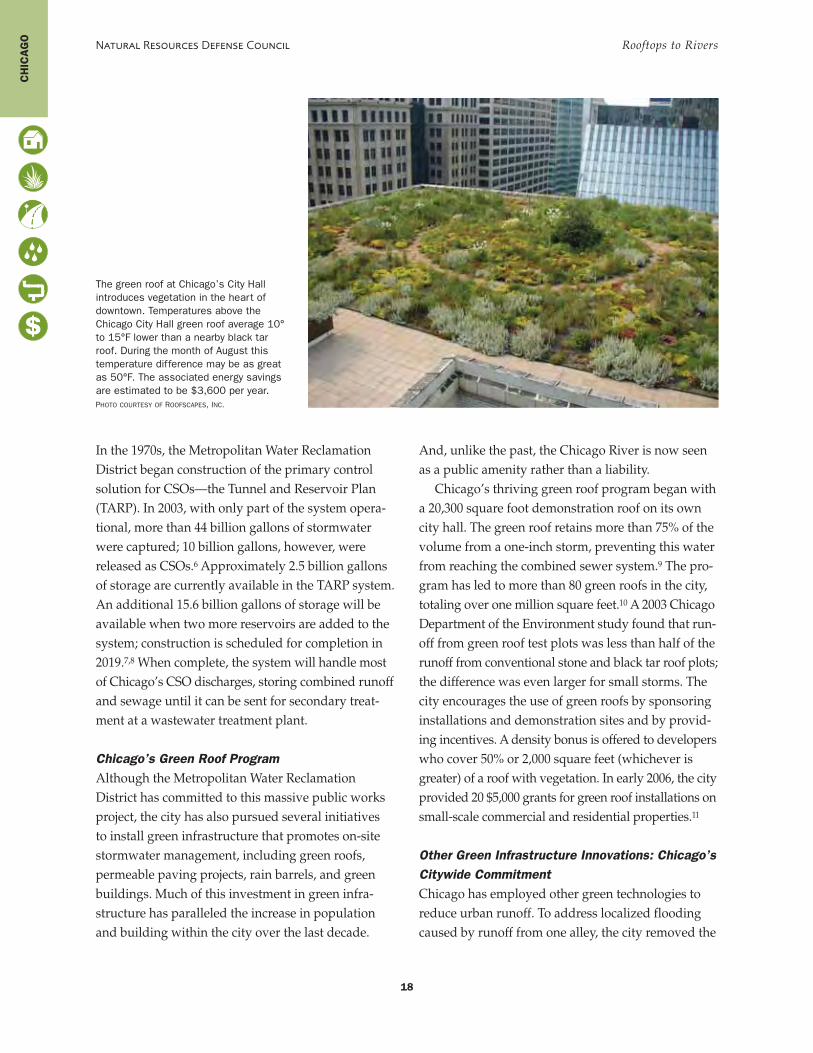
Chicago’s thriving green roof program began witha 20,300 square foot demonstration roof on its owncity hall. The green roof retains more than 75% of thevolume from a one-inch storm, preventing this waterfrom reaching the combined sewer system.9 The pro-gram has led to more than 80 green roofs in the city,totaling over one million square feet.10 A 2003 ChicagoDepartment of the Environment study found that run-off from green roof test plots was less than half of therunoff from conventional stone and black tar roof plots;the difference was even larger for small storms. Thecity encourages the use of green roofs by sponsoringinstallations and demonstration sites and by provid-ing incentives. A density bonus is offered to developerswho cover 50% or 2,000 square feet (whichever isgreater) of a roof with vegetation. In early 2006, the cityprovided 20 $5,000 grants for green roof installations onsmall-scale commercial and residential properties.11
Other Green Infrastructure Innovations: Chicago’sCitywide CommitmentChicago has employed other green technologies toreduce urban runoff. To address localized floodingcaused by runoff from one alley, the city removed the
CH
ICA
GO
The green roof at Chicago’s City Hallintroduces vegetation in the heart ofdowntown. Temperatures above theChicago City Hall green roof average 10°to 15°F lower than a nearby black tarroof. During the month of August thistemperature difference may be as greatas 50°F. The associated energy savingsare estimated to be $3,600 per year.PHOTO COURTESY OF ROOFSCAPES, INC.
asphalt from the 630 foot long, 16 foot wide alley andreplaced it with a permeable paving system. Now,instead of generating stormwater runoff, the alleywill infiltrate and retain the volume of a three-inch,one-hour rain event.12 The permeable pavementrequires little maintenance and has a life expectancyof 25 to 35 years.13 In this same ward, vegetated swalesare also being used for stormwater management.
In June 2004, Chicago has embarked on a city-wide green building effort. Chicago Mayor RichardM. Daley presented The Chicago Standard, a set ofconstruction principles designed for municipalbuildings. The standards are based on the Leader-ship in Energy and Environmental Design (LEEDTM)Green Building Ration System14 and emphasizesustainability, water efficiency, energy effects, andindoor air quality as well as stormwater manage-ment. For both the green roof and green buildingefforts, Chicago has created municipal demonstrationprojects to develop professional expertise in the cityon these technologies.
Chicago Center for Green Technology. The centerpieceof the city’s green building efforts is the ChicagoCenter for Green Technology. The Chicago Depart-ment of Environment transformed this property froma 17-acre brownfield full of construction debris tothe first municipal building to receive the LEEDTM
platinum rating.15 The 34,000 square foot centerserves as an educational facility and rental space fororganizations and businesses with an environmentalcommitment. Four 3,000 gallon cisterns capturestormwater that is used for watering the landscaping.The site also features a green roof, bioswales, perme-able paving, and a rain garden. Chicago Departmentof Environment models indicate that Green Tech’sstormwater management technologies retain morethan 50% of stormwater on site—for a three-inchstorm, the site releases 85,000 gallons of stormwaterto the sewer system instead of the expected 175,000gallons.16 The success of the Green Tech projectspurred several other green building projects,including three new green libraries; a new policestation to be monitored for a national case study;
19
Natural Resources Defense Council Rooftops to Rivers
green renovations on a firehouse and police head-quarters; and the Green Bungalow Initiative, a pilotproject to affordably retrofit four of Chicago’s historicbungalows with green technologies and monitorany corresponding energy savings. The program hasthus far shown average energy savings for the greenbungalows of 15% to 49%.17
The city has also pursued public outreach pro-grams, engaging homeowners through its recent rainbarrel and rain garden programs. In the fall of 2004city residents purchased more than 400 55-gallonrain barrels for $15 each.18 The program cost the city$40,000 excluding city labor. The Department ofEnvironment estimates the pilot project has thepotential to divert 760,000 gallons annually from thecombined sewer system, a relatively small numbercompared to the total amount of stormwater runoffin the city. However, the program was targeted toareas with a high frequency of basement flooding,meaning the program may have a more significantimpact in these localized areas. Since the water inrain barrels can be used for other purposes such aslandscaping, this program has additional conserva-tion benefits as well. The city also began a comple-mentary rain garden program, planting four raingardens along with signage explaining benefits.
Chicago has also complemented its ground-levelinitiatives with two studies on the effectiveness ofgreen infrastructure technologies. The first is themonitoring study of the green roof box plots. Thesecond is a 2004 Department of Environment Storm-water Reduction Practices Feasibility Study that usedhydraulic modeling to assess the effectiveness of bestmanagement practices for the Norwood Park sewer-shed. The study found that downspout disconnectionwould achieve peak flow reductions in the 1,370-acrearea by 30% for a six-month or one-year storm if allhomes in the 80% residential area disconnected theirdownspouts from the sewer system.19,20 This wouldpotentially reduce peak flow in the CSO outfall pipeby 20% and water levels in the sewer system by eightinches to two feet. The study also showed that three-inch and six-inch-deep rain gardens installed at eachhome could reduce total runoff by approximately 4%
CH
ICA
GO
and 7%, respectively, for the same six-month or one-year storm events.
For Additional InformationChicago Department of the Environment:http://egov.cityofchicago.org/city/webportal/portalEntityHomeAction.do?entityName=Environment&entityNameEnumValue=05
Milwaukee, WisconsinInvesting in green infrastructure to improve waterqualityPopulation: 587,000Type of green infrastructure used: green roofs; raingardens, vegetated swales, and landscape; wetlands,riparian protection, or urban forestsProgram elements: used for direct CSO control;established municipal programs and public funding
Like many municipalities with a combined sewersystem, Milwaukee has a history of exposure tofrequent CSO events and was faced with finding aviable overflow control strategy. To reduce the num-ber of CSOs and their impact on the water quality ofLake Michigan and its tributaries, the MilwaukeeMetropolitan Sewerage District (MMSD), theregional wastewater treatment agency, built a deeptunnel storage system in the 1980s and 1990s. MMSDinvested $3 billion during this period to reduce over-flows. As a complement to this large capital invest-ment, MMSD is investing in green infrastructureprojects to reduce stormwater inflow into the com-bined sewer system and mitigate stormwater runoff.
MMSD manages wastewater from 28 municipali-ties with a combined population of about 1.1 millionpeople in a 420 square mile service area. All 28 com-munities own and operate their own sewer systems,which drain into 300 miles of regional sewers ownedby MMSD. The district’s two wastewater treatmentplants each process about 80 to 100 million gallonsof wastewater on a dry day.21 Treated wastewateris discharged to Lake Michigan, which also servesas the city’s drinking water supply.22 The city ofMilwaukee and the village of Shorewood own and
20
Natural Resources Defense Council Rooftops to Rivers
operate combined sewers, which make up 5% ofMMSD’s total service area. Combined sewer over-flow points are located along rivers that flow intoLake Michigan.23 The $2.3 billion Deep TunnelSystem project, completed by MMSD in 1994, pro-vided 405 million gallons of underground sewerstorage. Begun in 1986, the 19.4-mile-long systemcollects and temporarily stores the large quantitiesof stormwater and wastewater that are conveyedthrough the sewers during wet weather events.24
Prior to the system becoming operational,Milwaukee averaged 50 to 60 CSO events a year,which discharged 8 to 9 billion gallons of sewageand stormwater. The Deep Tunnel System wasdesigned to limit CSOs to 1.4 events per year; inthe first 10 years of operation, from 1994 until 2003,annual average CSO discharges were 1.2 billiongallons from 2.5 average annual events.25,26 Heavyrains in the spring of 2004 resulted in 1 billion gallonsof CSO discharges during a two-week period.27
Although the Deep Tunnel System has substantiallyreduced CSO events, excessive quantities of storm-water can still trigger overflows, and MMSD hascommitted an additional $900 million to an overflowreduction plan.28
Milwaukee’s Green Infrastructure ApproachAs an additional strategy to limit CSO discharges,MMSD has begun to install green infrastructurewithin the combined sewer area to decrease thevolume of stormwater entering the system. Oneof the first initiatives was a disconnection programthat redirected building downspouts from the com-bined sewer system to rain barrels. Overflow fromthe rain barrels is directed to pervious areas and raingardens. In a cooperative cost-sharing arrangementwith public entities and private businesses in the city,MMSD partnered with others to install more than60 rain gardens to receive and treat roof runoff. Thetotal combined cost of these pilot projects was approx-imately $170,000.29
The Highland Gardens housing project. Seven greenroofs have been installed in the Milwaukee region.
MIL
WA
UK
EE
One of these is at the Highland Gardens housingproject, a 114-unit mid-rise for senior citizens andpeople with disabilities. A 20,000 square foot greenroof was installed at a cost of $380,000. The roofwill retain 85% of a two-inch rainfall. The remain-ing 15% of the water volume is directed to raingardens and a retention basin used for on-siteirrigation.30 These management strategies preventstormwater from being discharged to the collec-tion system.
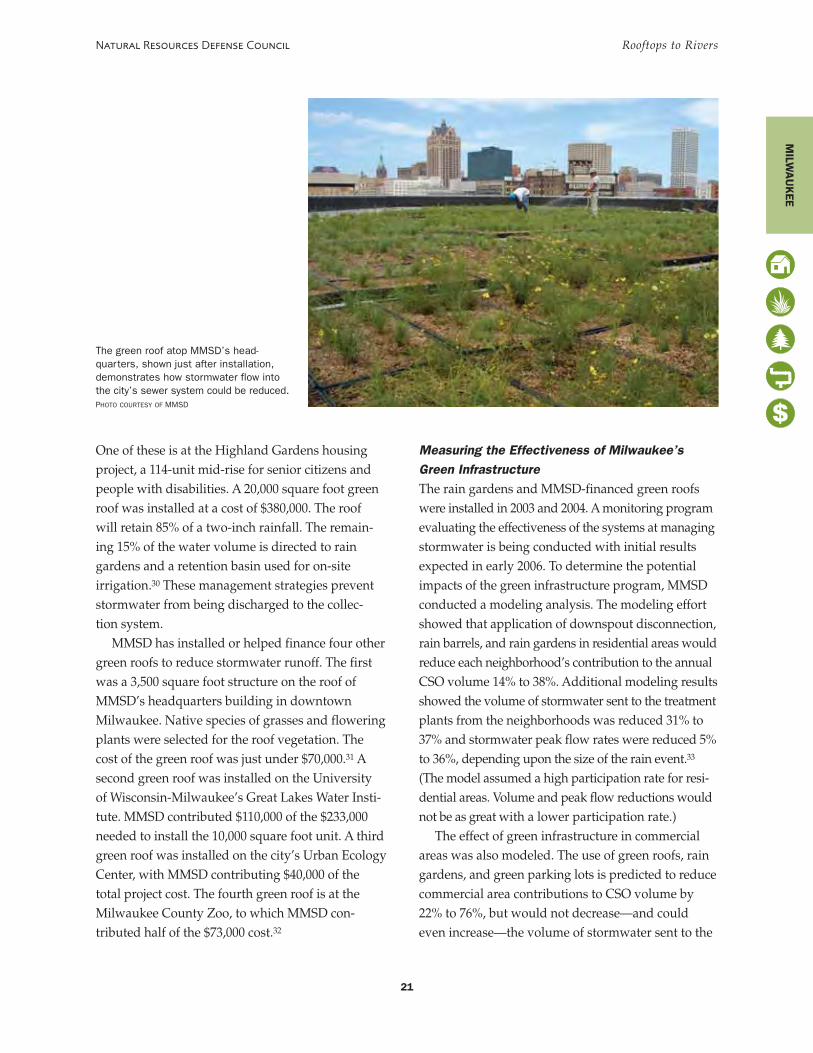
MMSD has installed or helped finance four othergreen roofs to reduce stormwater runoff. The firstwas a 3,500 square foot structure on the roof ofMMSD’s headquarters building in downtownMilwaukee. Native species of grasses and floweringplants were selected for the roof vegetation. Thecost of the green roof was just under $70,000.31 Asecond green roof was installed on the Universityof Wisconsin-Milwaukee’s Great Lakes Water Insti-tute. MMSD contributed $110,000 of the $233,000needed to install the 10,000 square foot unit. A thirdgreen roof was installed on the city’s Urban EcologyCenter, with MMSD contributing $40,000 of thetotal project cost. The fourth green roof is at theMilwaukee County Zoo, to which MMSD con-tributed half of the $73,000 cost.32
21
Natural Resources Defense Council Rooftops to Rivers
Measuring the Effectiveness of Milwaukee’sGreen InfrastructureThe rain gardens and MMSD-financed green roofswere installed in 2003 and 2004. A monitoring programevaluating the effectiveness of the systems at managingstormwater is being conducted with initial resultsexpected in early 2006. To determine the potentialimpacts of the green infrastructure program, MMSDconducted a modeling analysis. The modeling effortshowed that application of downspout disconnection,rain barrels, and rain gardens in residential areas wouldreduce each neighborhood’s contribution to the annualCSO volume 14% to 38%. Additional modeling resultsshowed the volume of stormwater sent to the treatmentplants from the neighborhoods was reduced 31% to37% and stormwater peak flow rates were reduced 5%to 36%, depending upon the size of the rain event.33
(The model assumed a high participation rate for resi-dential areas. Volume and peak flow reductions wouldnot be as great with a lower participation rate.)
The effect of green infrastructure in commercialareas was also modeled. The use of green roofs, raingardens, and green parking lots is predicted to reducecommercial area contributions to CSO volume by22% to 76%, but would not decrease—and couldeven increase—the volume of stormwater sent to the
MILW
AU
KEE
The green roof atop MMSD’s head-quarters, shown just after installation,demonstrates how stormwater flow intothe city’s sewer system could be reduced.PHOTO COURTESY OF MMSD
treatment plants. Stormwater peak flow rates fromcommercial areas are predicted to be reduced 13% to69% with the introduction of green infrastructure.34
MMSD has allocated more than $5.5 million forfiscal years 2002 through 2014 for rain water rerout-ing programs intended to prevent stormwater fromentering the combined sewer system. An additional$4.5 million has been allocated for fiscal years 2003through 2009 to promote, install, and monitor greeninfrastructure practices aimed at reducing stormwater.35
MMSD is also purchasing and protecting open spaceto reduce stormwater runoff and improve water qualityin its urban waterways. The capital budget designatesfunds to purchase privately owned wetlands to pre-vent development and establish conservation ease-ments. More than $27 million has been allocated forfiscal years 2000 through 2011. As of fiscal year 2005,775 acres had been purchased in three watersheds forjust under $5.8 million.36 A greenways initiative willidentify lands that compose greenway connections,linkages between sites, delineated environmentalcorridors, isolated natural wetlands, open space, andriparian wetlands. Linkages between these areas willbe acquired to protect and establish greenways alongjurisdictional waterways or their tributaries. Prefer-ential consideration is given to land that providesstormwater or flood management benefit.37
For Additional InformationMilwaukee Metropolitan Sewerage District:http://www.mmsd.com/home/index.cfm
Pittsburgh, Pennsylvania“Restorative development” beautifies land andcleans waterPopulation: 325,000Type of green infrastructure used: green roofs; raingardens, vegetated swales, and landscape; down-spout disconnection/rainwater collection; wetlands,riparian protection, or urban forestsProgram elements: used for direct CSO control
Pittsburgh is a postindustrial city struggling torepair the environmental degradation wrought by
22
Natural Resources Defense Council Rooftops to Rivers
its manufacturing past. The city’s development as asteel powerhouse and mining center is intrinsicallytied to its geographic and hydrologic setting. Thecity has developed around the confluence of threerivers—the Allegheny, the Monongahela, and theOhio. Over the past two decades Pittsburgh’s metro-politan population has declined, partly due to thecollapse of the steel industry. The city’s populationdecreased by 9.5% in the 1990s and the entire metro-politan area saw a decline of 1.5%, trends that weresignificantly greater than other same-size cities inthe northeastern central area.38 The “steel city” is leftwith pollution nuisances like brownfields and slagheaps, as well as a shrinking urban center and aconsiderable sewage overflow problem.
It is precisely because of this industrial reputationand declining urban center that Pittsburgh has hadthe opportunity and the incentive to redevelop andreclaim large land parcels and turn them into green-ways and parks. The restoration, described as“restorative redevelopment,” is motivated by a desireto restore habitat, beautify land, increase parkland,and raise property values—in all, generally makingPittsburgh a more attractive city.39 Pittsburgh’s effortsin alternative stormwater management have been acombination of government-sponsored restorationof green space and privately funded demonstrationsites. The impetus for Pittsburgh’s green restorationcomes largely from the private sector, charitablefoundations, and citizens’ groups.
Water Pollution from Pittsburgh’s Sewer SystemPittsburgh clearly has a need for supplementalstormwater management projects. The city’s storm-water runoff contributes to frequent CSOs. In 2003,red-flag advisories for impaired water quality wereissued on 111 out of 139 summer recreation days(from May 15 to October 1). In 2004, 125 red-flagadvisories were issued.40 The metropolitan areacontains more than 300 combined sewer outfallsand over 4,000 miles of underground pipes. Manyof these outfalls are upstream of drinking waterintakes. Solving Pittsburgh’s wet weather sewageproblems is a complicated problem that is
PIT
TSB
UR
GH
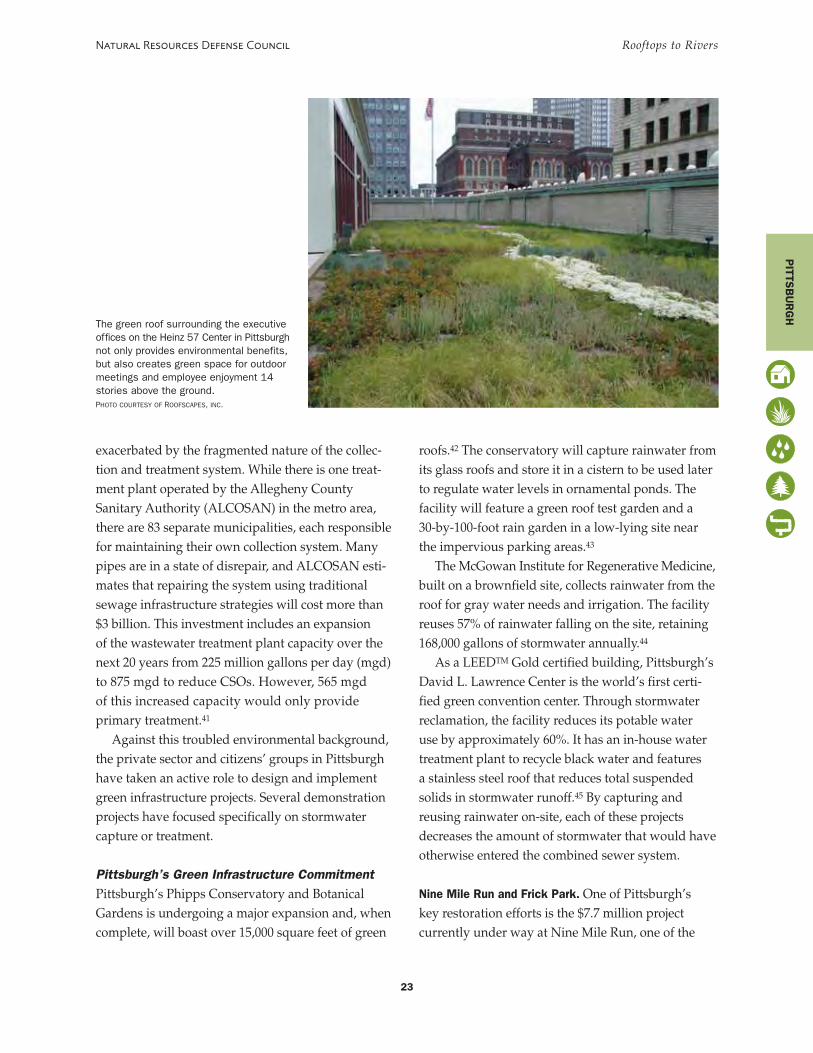
exacerbated by the fragmented nature of the collec-tion and treatment system. While there is one treat-ment plant operated by the Allegheny CountySanitary Authority (ALCOSAN) in the metro area,there are 83 separate municipalities, each responsiblefor maintaining their own collection system. Manypipes are in a state of disrepair, and ALCOSAN esti-mates that repairing the system using traditionalsewage infrastructure strategies will cost more than$3 billion. This investment includes an expansionof the wastewater treatment plant capacity over thenext 20 years from 225 million gallons per day (mgd)to 875 mgd to reduce CSOs. However, 565 mgdof this increased capacity would only provideprimary treatment.41
Against this troubled environmental background,the private sector and citizens’ groups in Pittsburghhave taken an active role to design and implementgreen infrastructure projects. Several demonstrationprojects have focused specifically on stormwatercapture or treatment.
Pittsburgh’s Green Infrastructure CommitmentPittsburgh’s Phipps Conservatory and BotanicalGardens is undergoing a major expansion and, whencomplete, will boast over 15,000 square feet of green
PITTS
BU
RG
H
23
Natural Resources Defense Council Rooftops to Rivers
roofs.42 The conservatory will capture rainwater fromits glass roofs and store it in a cistern to be used laterto regulate water levels in ornamental ponds. Thefacility will feature a green roof test garden and a30-by-100-foot rain garden in a low-lying site nearthe impervious parking areas.43
The McGowan Institute for Regenerative Medicine,built on a brownfield site, collects rainwater from theroof for gray water needs and irrigation. The facilityreuses 57% of rainwater falling on the site, retaining168,000 gallons of stormwater annually.44
As a LEEDTM Gold certified building, Pittsburgh’sDavid L. Lawrence Center is the world’s first certi-fied green convention center. Through stormwaterreclamation, the facility reduces its potable wateruse by approximately 60%. It has an in-house watertreatment plant to recycle black water and featuresa stainless steel roof that reduces total suspendedsolids in stormwater runoff.45 By capturing andreusing rainwater on-site, each of these projectsdecreases the amount of stormwater that would haveotherwise entered the combined sewer system.
Nine Mile Run and Frick Park. One of Pittsburgh’skey restoration efforts is the $7.7 million projectcurrently under way at Nine Mile Run, one of the
The green roof surrounding the executiveoffices on the Heinz 57 Center in Pittsburghnot only provides environmental benefits,but also creates green space for outdoormeetings and employee enjoyment 14stories above the ground.PHOTO COURTESY OF ROOFSCAPES, INC.
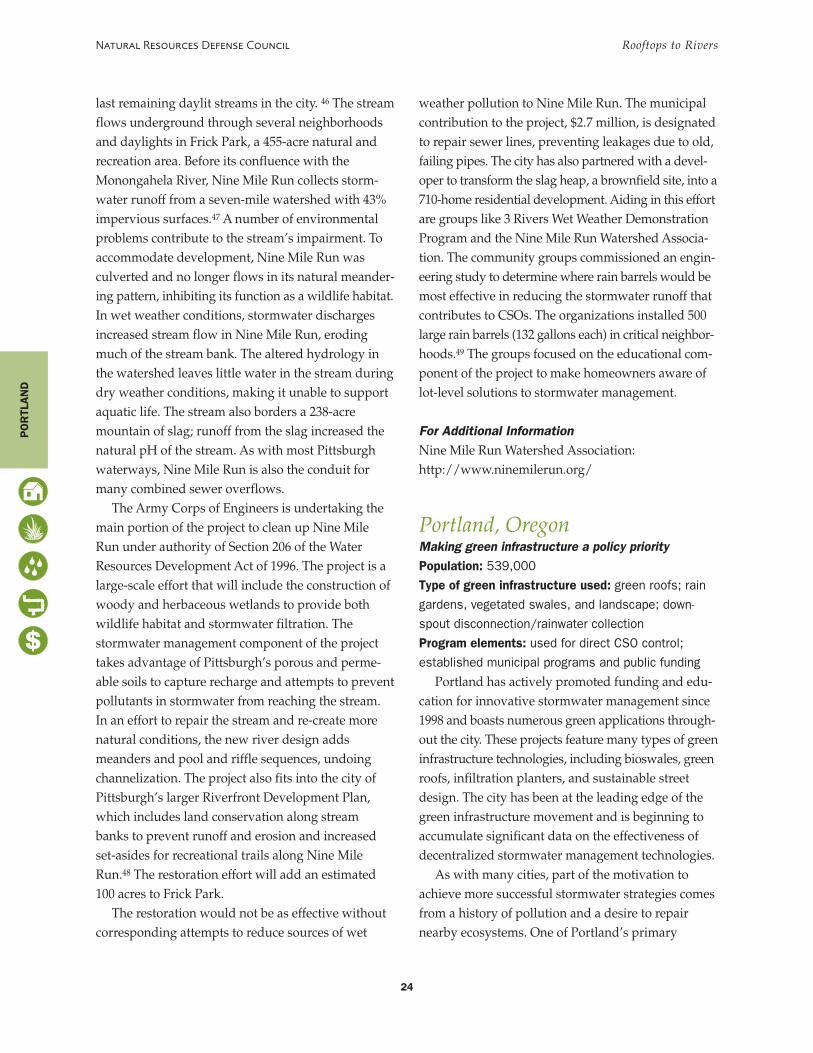
last remaining daylit streams in the city. 46 The streamflows underground through several neighborhoodsand daylights in Frick Park, a 455-acre natural andrecreation area. Before its confluence with theMonongahela River, Nine Mile Run collects storm-water runoff from a seven-mile watershed with 43%impervious surfaces.47 A number of environmentalproblems contribute to the stream’s impairment. Toaccommodate development, Nine Mile Run wasculverted and no longer flows in its natural meander-ing pattern, inhibiting its function as a wildlife habitat.In wet weather conditions, stormwater dischargesincreased stream flow in Nine Mile Run, erodingmuch of the stream bank. The altered hydrology inthe watershed leaves little water in the stream duringdry weather conditions, making it unable to supportaquatic life. The stream also borders a 238-acremountain of slag; runoff from the slag increased thenatural pH of the stream. As with most Pittsburghwaterways, Nine Mile Run is also the conduit formany combined sewer overflows.
The Army Corps of Engineers is undertaking themain portion of the project to clean up Nine MileRun under authority of Section 206 of the WaterResources Development Act of 1996. The project is alarge-scale effort that will include the construction ofwoody and herbaceous wetlands to provide bothwildlife habitat and stormwater filtration. Thestormwater management component of the projecttakes advantage of Pittsburgh’s porous and perme-able soils to capture recharge and attempts to preventpollutants in stormwater from reaching the stream.In an effort to repair the stream and re-create morenatural conditions, the new river design addsmeanders and pool and riffle sequences, undoingchannelization. The project also fits into the city ofPittsburgh’s larger Riverfront Development Plan,which includes land conservation along streambanks to prevent runoff and erosion and increasedset-asides for recreational trails along Nine MileRun.48 The restoration effort will add an estimated100 acres to Frick Park.
The restoration would not be as effective withoutcorresponding attempts to reduce sources of wet
24
Natural Resources Defense Council Rooftops to Rivers
weather pollution to Nine Mile Run. The municipalcontribution to the project, $2.7 million, is designatedto repair sewer lines, preventing leakages due to old,failing pipes. The city has also partnered with a devel-oper to transform the slag heap, a brownfield site, into a710-home residential development. Aiding in this effortare groups like 3 Rivers Wet Weather DemonstrationProgram and the Nine Mile Run Watershed Associa-tion. The community groups commissioned an engin-eering study to determine where rain barrels would bemost effective in reducing the stormwater runoff thatcontributes to CSOs. The organizations installed 500large rain barrels (132 gallons each) in critical neighbor-hoods.49 The groups focused on the educational com-ponent of the project to make homeowners aware oflot-level solutions to stormwater management.
For Additional InformationNine Mile Run Watershed Association:http://www.ninemilerun.org/
Portland, OregonMaking green infrastructure a policy priorityPopulation: 539,000Type of green infrastructure used: green roofs; raingardens, vegetated swales, and landscape; down-spout disconnection/rainwater collectionProgram elements: used for direct CSO control;established municipal programs and public funding
Portland has actively promoted funding and edu-cation for innovative stormwater management since1998 and boasts numerous green applications through-out the city. These projects feature many types of greeninfrastructure technologies, including bioswales, greenroofs, infiltration planters, and sustainable streetdesign. The city has been at the leading edge of thegreen infrastructure movement and is beginning toaccumulate significant data on the effectiveness ofdecentralized stormwater management technologies.
As with many cities, part of the motivation toachieve more successful stormwater strategies comesfrom a history of pollution and a desire to repairnearby ecosystems. One of Portland’s primary
PO
RTL
AN
D
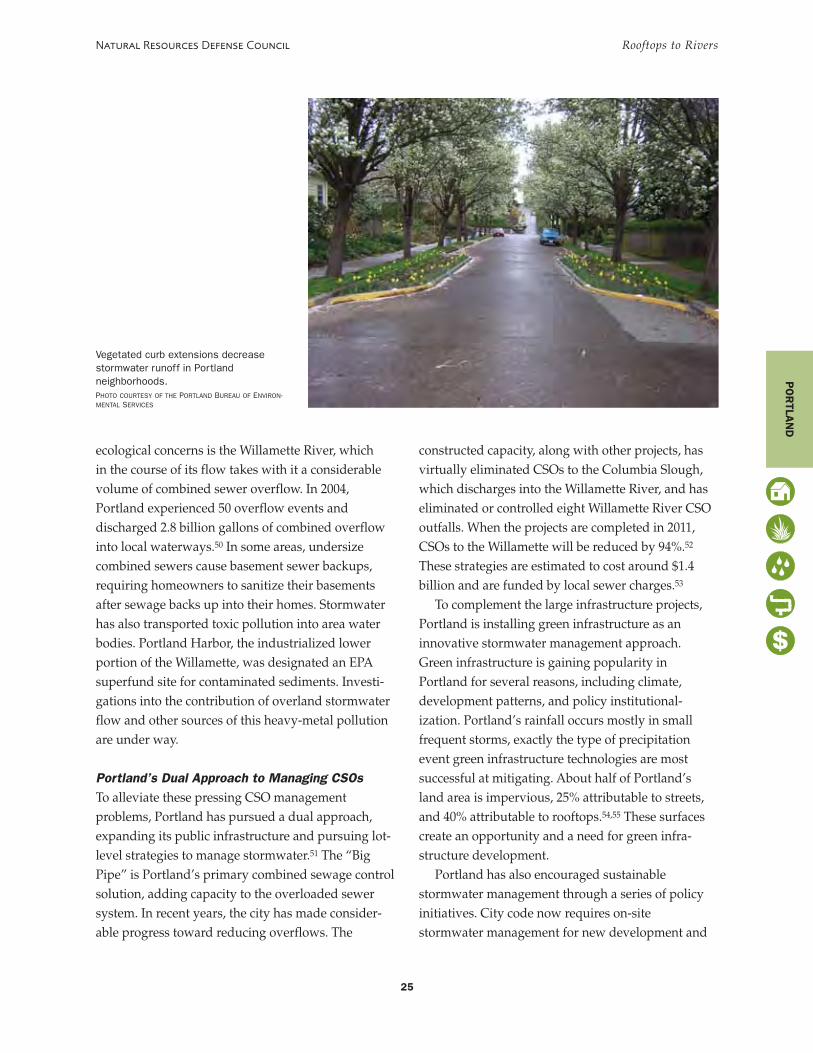
ecological concerns is the Willamette River, whichin the course of its flow takes with it a considerablevolume of combined sewer overflow. In 2004,Portland experienced 50 overflow events anddischarged 2.8 billion gallons of combined overflowinto local waterways.50 In some areas, undersizecombined sewers cause basement sewer backups,requiring homeowners to sanitize their basementsafter sewage backs up into their homes. Stormwaterhas also transported toxic pollution into area waterbodies. Portland Harbor, the industrialized lowerportion of the Willamette, was designated an EPAsuperfund site for contaminated sediments. Investi-gations into the contribution of overland stormwaterflow and other sources of this heavy-metal pollutionare under way.
Portland’s Dual Approach to Managing CSOsTo alleviate these pressing CSO managementproblems, Portland has pursued a dual approach,expanding its public infrastructure and pursuing lot-level strategies to manage stormwater.51 The “BigPipe” is Portland’s primary combined sewage controlsolution, adding capacity to the overloaded sewersystem. In recent years, the city has made consider-able progress toward reducing overflows. The
PO
RTLA
ND
25
Natural Resources Defense Council Rooftops to Rivers
constructed capacity, along with other projects, hasvirtually eliminated CSOs to the Columbia Slough,which discharges into the Willamette River, and haseliminated or controlled eight Willamette River CSOoutfalls. When the projects are completed in 2011,CSOs to the Willamette will be reduced by 94%.52
These strategies are estimated to cost around $1.4billion and are funded by local sewer charges.53
To complement the large infrastructure projects,Portland is installing green infrastructure as aninnovative stormwater management approach.Green infrastructure is gaining popularity inPortland for several reasons, including climate,development patterns, and policy institutional-ization. Portland’s rainfall occurs mostly in smallfrequent storms, exactly the type of precipitationevent green infrastructure technologies are mostsuccessful at mitigating. About half of Portland’sland area is impervious, 25% attributable to streets,and 40% attributable to rooftops.54,55 These surfacescreate an opportunity and a need for green infra-structure development.
Portland has also encouraged sustainablestormwater management through a series of policyinitiatives. City code now requires on-sitestormwater management for new development and
Vegetated curb extensions decreasestormwater runoff in Portlandneighborhoods.PHOTO COURTESY OF THE PORTLAND BUREAU OF ENVIRON-MENTAL SERVICES
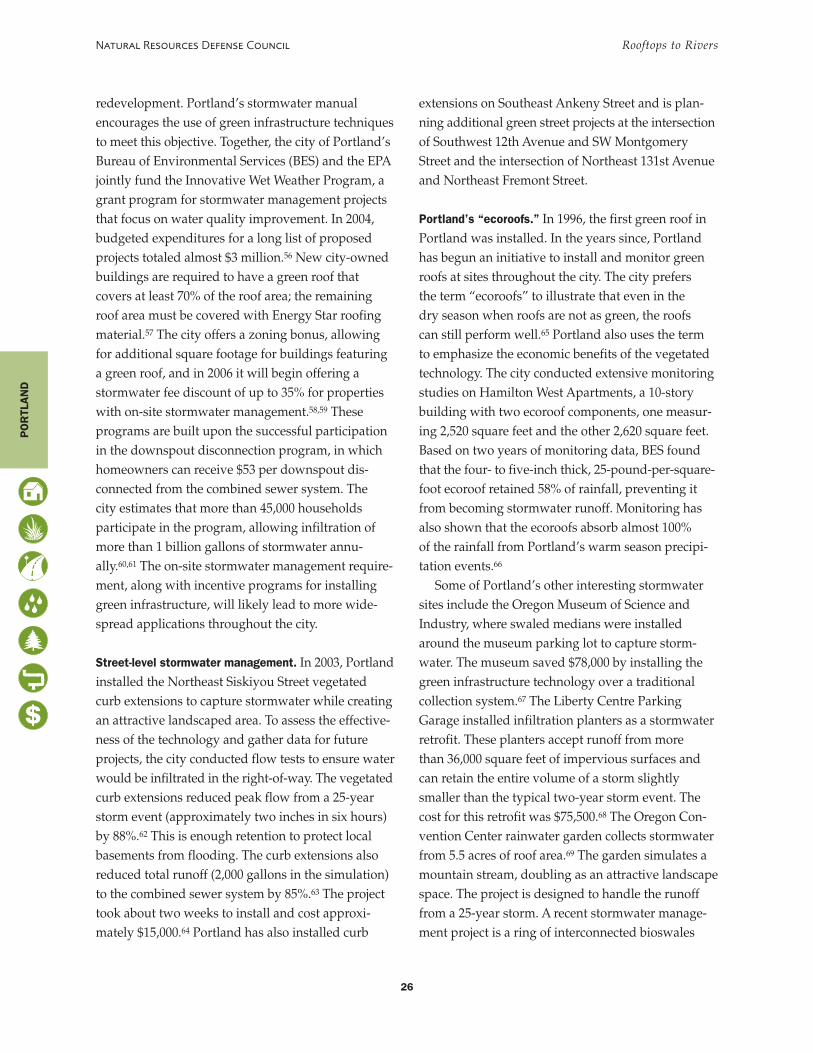
redevelopment. Portland’s stormwater manualencourages the use of green infrastructure techniquesto meet this objective. Together, the city of Portland’sBureau of Environmental Services (BES) and the EPAjointly fund the Innovative Wet Weather Program, agrant program for stormwater management projectsthat focus on water quality improvement. In 2004,budgeted expenditures for a long list of proposedprojects totaled almost $3 million.56 New city-ownedbuildings are required to have a green roof thatcovers at least 70% of the roof area; the remainingroof area must be covered with Energy Star roofingmaterial.57 The city offers a zoning bonus, allowingfor additional square footage for buildings featuringa green roof, and in 2006 it will begin offering astormwater fee discount of up to 35% for propertieswith on-site stormwater management.58,59 Theseprograms are built upon the successful participationin the downspout disconnection program, in whichhomeowners can receive $53 per downspout dis-connected from the combined sewer system. Thecity estimates that more than 45,000 householdsparticipate in the program, allowing infiltration ofmore than 1 billion gallons of stormwater annu-ally.60,61 The on-site stormwater management require-ment, along with incentive programs for installinggreen infrastructure, will likely lead to more wide-spread applications throughout the city.
Street-level stormwater management. In 2003, Portlandinstalled the Northeast Siskiyou Street vegetatedcurb extensions to capture stormwater while creatingan attractive landscaped area. To assess the effective-ness of the technology and gather data for futureprojects, the city conducted flow tests to ensure waterwould be infiltrated in the right-of-way. The vegetatedcurb extensions reduced peak flow from a 25-yearstorm event (approximately two inches in six hours)by 88%.62 This is enough retention to protect localbasements from flooding. The curb extensions alsoreduced total runoff (2,000 gallons in the simulation)to the combined sewer system by 85%.63 The projecttook about two weeks to install and cost approxi-mately $15,000.64 Portland has also installed curb
26
Natural Resources Defense Council Rooftops to Rivers
extensions on Southeast Ankeny Street and is plan-ning additional green street projects at the intersectionof Southwest 12th Avenue and SW MontgomeryStreet and the intersection of Northeast 131st Avenueand Northeast Fremont Street.
Portland’s “ecoroofs.” In 1996, the first green roof inPortland was installed. In the years since, Portlandhas begun an initiative to install and monitor greenroofs at sites throughout the city. The city prefersthe term “ecoroofs” to illustrate that even in thedry season when roofs are not as green, the roofscan still perform well.65 Portland also uses the termto emphasize the economic benefits of the vegetatedtechnology. The city conducted extensive monitoringstudies on Hamilton West Apartments, a 10-storybuilding with two ecoroof components, one measur-ing 2,520 square feet and the other 2,620 square feet.Based on two years of monitoring data, BES foundthat the four- to five-inch thick, 25-pound-per-square-foot ecoroof retained 58% of rainfall, preventing itfrom becoming stormwater runoff. Monitoring hasalso shown that the ecoroofs absorb almost 100%of the rainfall from Portland’s warm season precipi-tation events.66
Some of Portland’s other interesting stormwatersites include the Oregon Museum of Science andIndustry, where swaled medians were installedaround the museum parking lot to capture storm-water. The museum saved $78,000 by installing thegreen infrastructure technology over a traditionalcollection system.67 The Liberty Centre ParkingGarage installed infiltration planters as a stormwaterretrofit. These planters accept runoff from morethan 36,000 square feet of impervious surfaces andcan retain the entire volume of a storm slightlysmaller than the typical two-year storm event. Thecost for this retrofit was $75,500.68 The Oregon Con-vention Center rainwater garden collects stormwaterfrom 5.5 acres of roof area.69 The garden simulates amountain stream, doubling as an attractive landscapespace. The project is designed to handle the runofffrom a 25-year storm. A recent stormwater manage-ment project is a ring of interconnected bioswales
PO
RTL
AN
D
around the New Seasons Market at Seven CornersSoutheast Division Street. This project reducesimpervious surfaces and will remove 1 milliongallons of stormwater annually from the combinedsewer system.70 All of these projects will be eligibleto apply for the stormwater fee discount when it isfully implemented in mid-2006.
New Directions in Portland’s Green Infrastructure:The Stormwater Trading ProgramThe city was recently awarded a $288,000 U.S. EPAgrant for a feasibility study to determine the viabilityof a stormwater trading program. As conceptualized,the trading program would allow developers whowere unable to satisfy the on-site stormwater man-agement requirement to privately finance or buycredits for stormwater mitigation elsewhere withinthe city, provided that the purchased credit met waterquality and discharge volume requirements. Theinitial cost of the stormwater credits would likely bebased on the cost of a publicly financed program. Thefirst phase of the study will determine if the approachis economically beneficial and if the program can pro-vide acceptable environmental results. If the tradingapproach is determined to be feasible, later phases ofthe study will outline the model approach, determinethe geographic trading area, select appropriate bestmanagement practices, and develop economic modelsfor program valuation. In later phases, the city alsoplans to demonstrate the operation of the tradingsystem through pilot program implementation.71
For Additional InformationPortland Bureau of Environmental Services:http://www.portlandonline.com/bes
Rouge River Watershed, MichiganCleaning up the watershed with green approachesto stormwater managementPopulation: 1.5 millionType of green infrastructure used: green roofs; raingardens, vegetated swales, and landscape; permeablepavement; wetlands, riparian protection, or urban forests
27
Natural Resources Defense Council Rooftops to Rivers
The Rouge River Watershed in southeast Michigancovers nearly 450 square miles and is home to thehistorically industrial city of Detroit. Fifty percent ofthe watershed is urbanized, and more than 1.5 millionpeople live within its boundaries.72 As a tributary andmajor pollution source to the Detroit River, the RougeRiver was designated an Area of Concern by the Inter-national Joint Commission in the Great Lakes.73,74 Withindustrial and municipal wastewater dischargesbelieved to be effectively permitted and controlled, thefocus of the water restoration efforts in the watershedhas shifted to addressing wet weather pollution. Storm-water runoff was responsible for creating excessive flowwithin the river, damaging stream banks and riparianhabitat, introducing pollutants, and causing CSOs.
In 1992, the Wayne County, Michigan Departmentof the Environment initiated the Rouge River Projectto address wet weather pollution within the watershed.The project is funded by U.S. EPA grants and municipalfunding and serves as a national demonstration projectfor reclaiming degraded urban rivers.75 An assessmentof the watershed in the mid-1990s found that storm-water runoff had many deleterious effects on waterquality and river health. Increased river flows fromstormwater discharges had eroded 60% to 90% of theriver banks on the Rouge River’s major branches.76
Soil washed from the river banks was deposited alongthe river bottom downstream, degrading naturalstream habitats. Stormwater runoff and pollution hadnot only contributed to a decline in river fish popula-tions, but also a number of consumption bans andadvisories. Nutrient loadings caused seasonal decreasesin river oxygen levels, and increased river bacteriacounts and resulted in swimming advisories.77
Evaluating the most effective means of improvingthe water quality of the river, the Rouge River Projectadopted a watershed-based approach for wet weatherpollution control. The first step in this approach wasthe 1997 adoption of the Michigan NPDES GeneralStormwater Permit. The permit is unique becausethe watershed communities requested permissionfrom the U.S. District Court overseeing the rivercleanup to develop a draft permit acceptable to thecommunities and state and federal regulators. The
RO
UG
E RIV
ERW
ATERSH
ED
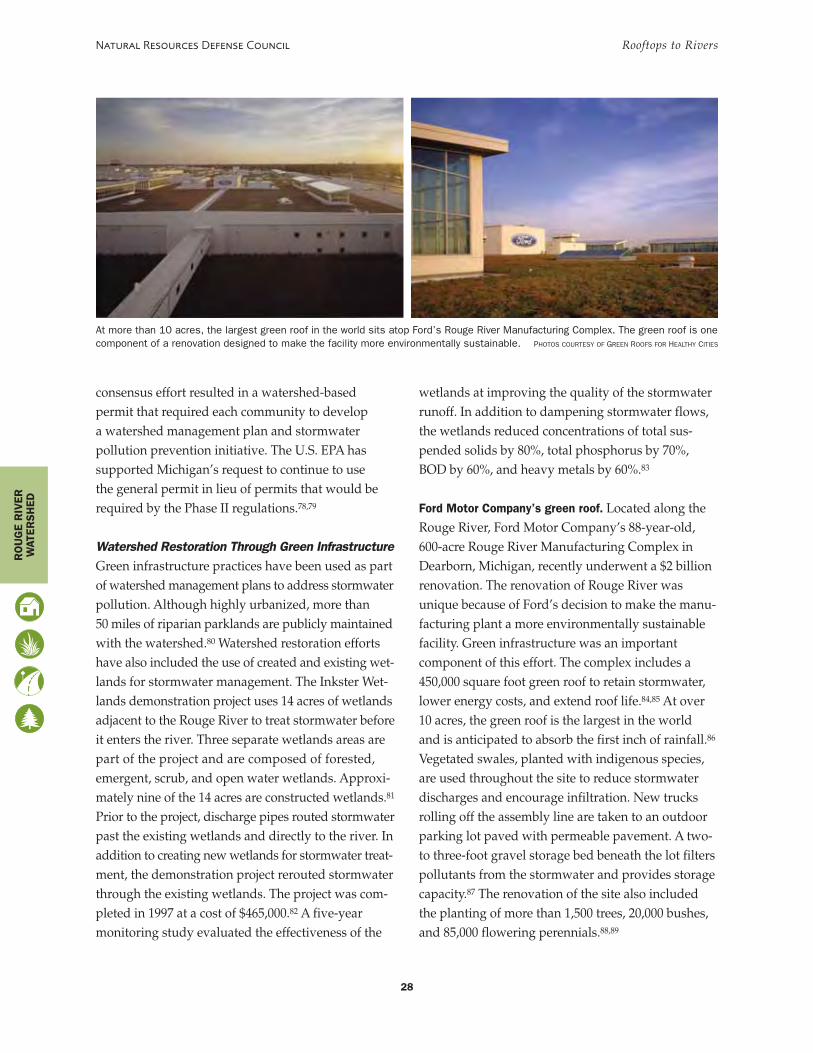
consensus effort resulted in a watershed-basedpermit that required each community to developa watershed management plan and stormwaterpollution prevention initiative. The U.S. EPA hassupported Michigan’s request to continue to usethe general permit in lieu of permits that would berequired by the Phase II regulations.78,79
Watershed Restoration Through Green InfrastructureGreen infrastructure practices have been used as partof watershed management plans to address stormwaterpollution. Although highly urbanized, more than50 miles of riparian parklands are publicly maintainedwith the watershed.80 Watershed restoration effortshave also included the use of created and existing wet-lands for stormwater management. The Inkster Wet-lands demonstration project uses 14 acres of wetlandsadjacent to the Rouge River to treat stormwater beforeit enters the river. Three separate wetlands areas arepart of the project and are composed of forested,emergent, scrub, and open water wetlands. Approxi-mately nine of the 14 acres are constructed wetlands.81
Prior to the project, discharge pipes routed stormwaterpast the existing wetlands and directly to the river. Inaddition to creating new wetlands for stormwater treat-ment, the demonstration project rerouted stormwaterthrough the existing wetlands. The project was com-pleted in 1997 at a cost of $465,000.82 A five-yearmonitoring study evaluated the effectiveness of the
28
Natural Resources Defense Council Rooftops to Rivers
wetlands at improving the quality of the stormwaterrunoff. In addition to dampening stormwater flows,the wetlands reduced concentrations of total sus-pended solids by 80%, total phosphorus by 70%,BOD by 60%, and heavy metals by 60%.83
Ford Motor Company’s green roof. Located along theRouge River, Ford Motor Company’s 88-year-old,600-acre Rouge River Manufacturing Complex inDearborn, Michigan, recently underwent a $2 billionrenovation. The renovation of Rouge River wasunique because of Ford’s decision to make the manu-facturing plant a more environmentally sustainablefacility. Green infrastructure was an importantcomponent of this effort. The complex includes a450,000 square foot green roof to retain stormwater,lower energy costs, and extend roof life.84,85 At over10 acres, the green roof is the largest in the worldand is anticipated to absorb the first inch of rainfall.86
Vegetated swales, planted with indigenous species,are used throughout the site to reduce stormwaterdischarges and encourage infiltration. New trucksrolling off the assembly line are taken to an outdoorparking lot paved with permeable pavement. A two-to three-foot gravel storage bed beneath the lot filterspollutants from the stormwater and provides storagecapacity.87 The renovation of the site also includedthe planting of more than 1,500 trees, 20,000 bushes,and 85,000 flowering perennials.88,89
At more than 10 acres, the largest green roof in the world sits atop Ford’s Rouge River Manufacturing Complex. The green roof is onecomponent of a renovation designed to make the facility more environmentally sustainable. PHOTOS COURTESY OF GREEN ROOFS FOR HEALTHY CITIES
RO
UG
E R
IVER
WAT
ERSH
ED
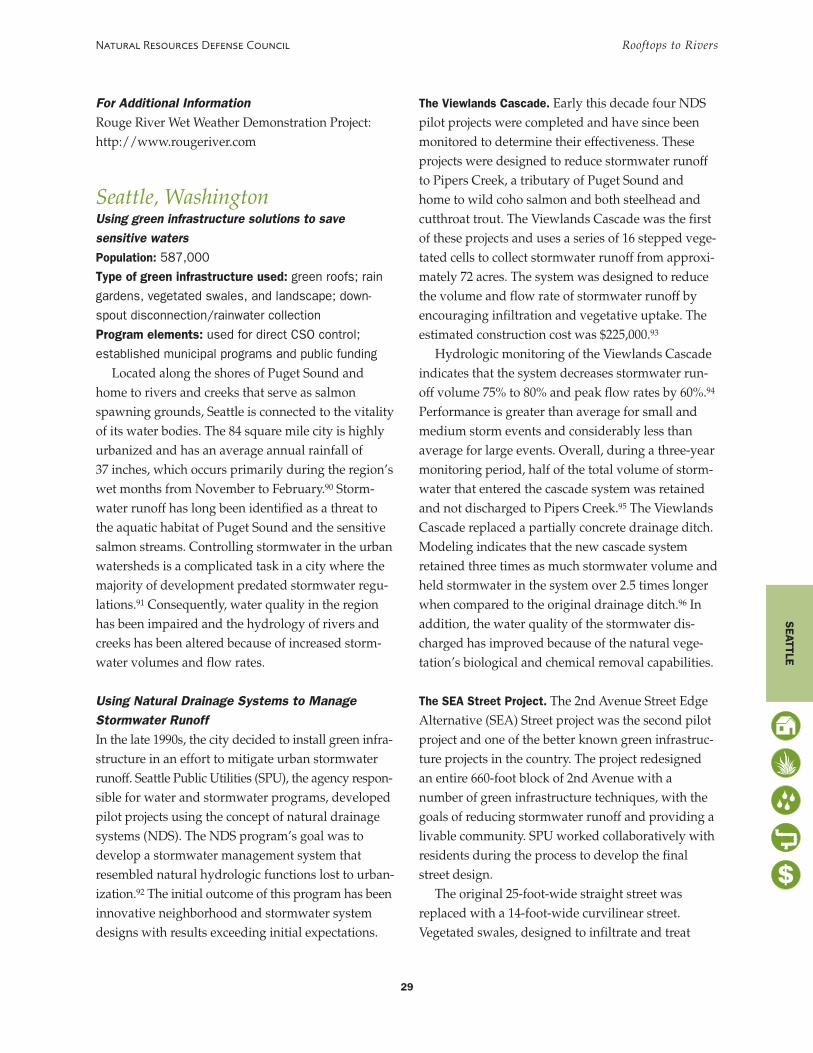
For Additional InformationRouge River Wet Weather Demonstration Project:http://www.rougeriver.com
Seattle, WashingtonUsing green infrastructure solutions to savesensitive waters Population: 587,000Type of green infrastructure used: green roofs; raingardens, vegetated swales, and landscape; down-spout disconnection/rainwater collectionProgram elements: used for direct CSO control;established municipal programs and public funding
Located along the shores of Puget Sound andhome to rivers and creeks that serve as salmonspawning grounds, Seattle is connected to the vitalityof its water bodies. The 84 square mile city is highlyurbanized and has an average annual rainfall of37 inches, which occurs primarily during the region’swet months from November to February.90 Storm-water runoff has long been identified as a threat tothe aquatic habitat of Puget Sound and the sensitivesalmon streams. Controlling stormwater in the urbanwatersheds is a complicated task in a city where themajority of development predated stormwater regu-lations.91 Consequently, water quality in the regionhas been impaired and the hydrology of rivers andcreeks has been altered because of increased storm-water volumes and flow rates.
Using Natural Drainage Systems to ManageStormwater RunoffIn the late 1990s, the city decided to install green infra-structure in an effort to mitigate urban stormwaterrunoff. Seattle Public Utilities (SPU), the agency respon-sible for water and stormwater programs, developedpilot projects using the concept of natural drainagesystems (NDS). The NDS program’s goal was todevelop a stormwater management system thatresembled natural hydrologic functions lost to urban-ization.92 The initial outcome of this program has beeninnovative neighborhood and stormwater systemdesigns with results exceeding initial expectations.
SEATTLE
29
Natural Resources Defense Council Rooftops to Rivers
The Viewlands Cascade. Early this decade four NDSpilot projects were completed and have since beenmonitored to determine their effectiveness. Theseprojects were designed to reduce stormwater runoffto Pipers Creek, a tributary of Puget Sound andhome to wild coho salmon and both steelhead andcutthroat trout. The Viewlands Cascade was the firstof these projects and uses a series of 16 stepped vege-tated cells to collect stormwater runoff from approxi-mately 72 acres. The system was designed to reducethe volume and flow rate of stormwater runoff byencouraging infiltration and vegetative uptake. Theestimated construction cost was $225,000.93
Hydrologic monitoring of the Viewlands Cascadeindicates that the system decreases stormwater run-off volume 75% to 80% and peak flow rates by 60%.94
Performance is greater than average for small andmedium storm events and considerably less thanaverage for large events. Overall, during a three-yearmonitoring period, half of the total volume of storm-water that entered the cascade system was retainedand not discharged to Pipers Creek.95 The ViewlandsCascade replaced a partially concrete drainage ditch.Modeling indicates that the new cascade systemretained three times as much stormwater volume andheld stormwater in the system over 2.5 times longerwhen compared to the original drainage ditch.96 Inaddition, the water quality of the stormwater dis-charged has improved because of the natural vege-tation’s biological and chemical removal capabilities.
The SEA Street Project. The 2nd Avenue Street EdgeAlternative (SEA) Street project was the second pilotproject and one of the better known green infrastruc-ture projects in the country. The project redesignedan entire 660-foot block of 2nd Avenue with anumber of green infrastructure techniques, with thegoals of reducing stormwater runoff and providing alivable community. SPU worked collaboratively withresidents during the process to develop the finalstreet design.
The original 25-foot-wide straight street wasreplaced with a 14-foot-wide curvilinear street.Vegetated swales, designed to infiltrate and treat
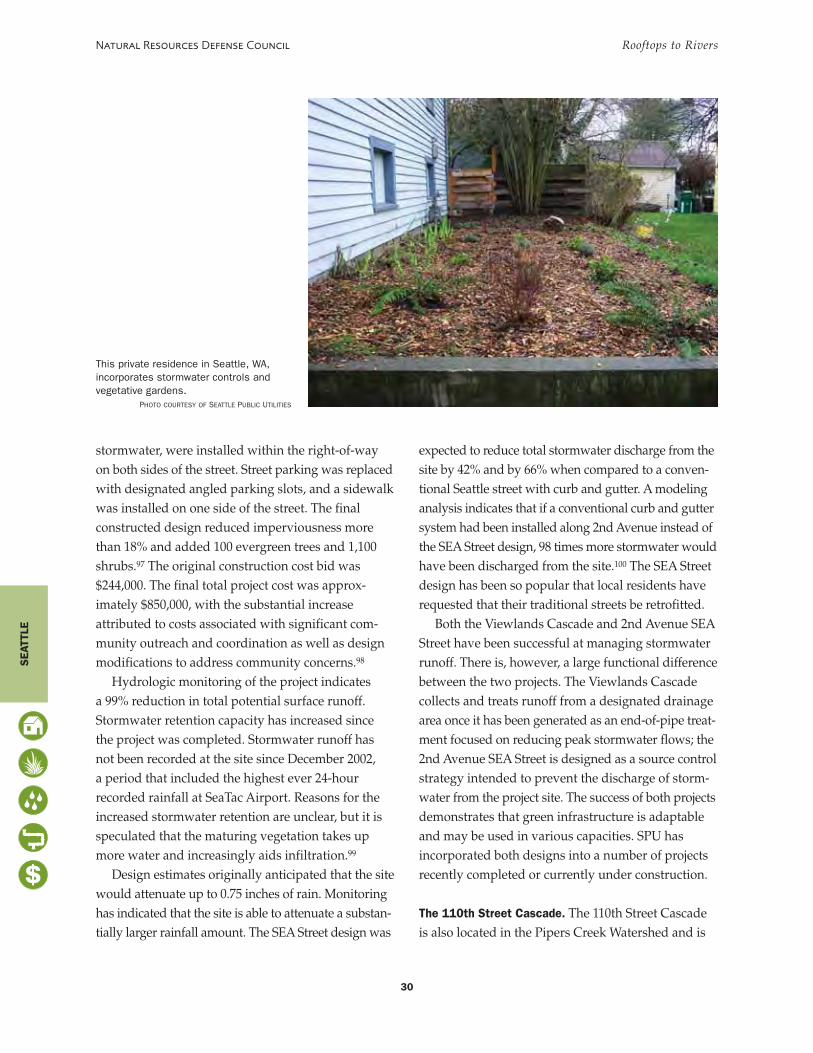
stormwater, were installed within the right-of-wayon both sides of the street. Street parking was replacedwith designated angled parking slots, and a sidewalkwas installed on one side of the street. The finalconstructed design reduced imperviousness morethan 18% and added 100 evergreen trees and 1,100shrubs.97 The original construction cost bid was$244,000. The final total project cost was approx-imately $850,000, with the substantial increaseattributed to costs associated with significant com-munity outreach and coordination as well as designmodifications to address community concerns.98
Hydrologic monitoring of the project indicatesa 99% reduction in total potential surface runoff.Stormwater retention capacity has increased sincethe project was completed. Stormwater runoff hasnot been recorded at the site since December 2002,a period that included the highest ever 24-hourrecorded rainfall at SeaTac Airport. Reasons for theincreased stormwater retention are unclear, but it isspeculated that the maturing vegetation takes upmore water and increasingly aids infiltration.99
Design estimates originally anticipated that the sitewould attenuate up to 0.75 inches of rain. Monitoringhas indicated that the site is able to attenuate a substan-tially larger rainfall amount. The SEA Street design was
30
Natural Resources Defense Council Rooftops to Rivers
expected to reduce total stormwater discharge from thesite by 42% and by 66% when compared to a conven-tional Seattle street with curb and gutter. A modelinganalysis indicates that if a conventional curb and guttersystem had been installed along 2nd Avenue instead ofthe SEA Street design, 98 times more stormwater wouldhave been discharged from the site.100 The SEA Streetdesign has been so popular that local residents haverequested that their traditional streets be retrofitted.
Both the Viewlands Cascade and 2nd Avenue SEAStreet have been successful at managing stormwaterrunoff. There is, however, a large functional differencebetween the two projects. The Viewlands Cascadecollects and treats runoff from a designated drainagearea once it has been generated as an end-of-pipe treat-ment focused on reducing peak stormwater flows; the2nd Avenue SEA Street is designed as a source controlstrategy intended to prevent the discharge of storm-water from the project site. The success of both projectsdemonstrates that green infrastructure is adaptableand may be used in various capacities. SPU hasincorporated both designs into a number of projectsrecently completed or currently under construction.
The 110th Street Cascade. The 110th Street Cascadeis also located in the Pipers Creek Watershed and is
This private residence in Seattle, WA,incorporates stormwater controls andvegetative gardens.
PHOTO COURTESY OF SEATTLE PUBLIC UTILITIES
SEA
TTLE
designed to treat runoff from a 28-acre drainagebasin. Monitoring at the cascade is measuring flowrate and water quality.101 Completed in early 2005,the Broadview Green Grid project reconstructed anentire neighborhood’s drainage system in a 32-acresub-basin in the Pipers Creek Watershed. The projectused both SEA Street designs and cascade systems.The north-south streets in the project area werereconstructed using the SEA Street design. Each ofthese streets discharges to an east-west flowingsystem of vegetated swales and cascades.102 ThePinehurst Green Grid, a second neighborhood scalereconstruction project, is in the construction phase.
The High Point Redevelopment is under construc-tion and is one of the city’s largest recent redevelop-ment efforts. Forty blocks will be redeveloped in a129-acre mixed income housing area to eventuallycontain 1,600 units. The project area is 65% impervi-ous and densely populated. The NDS design willincorporate approximately 22,000 feet of vegetatedand grassy swales and is scheduled for completionin 2007.103 In 2004, the NDS program received anInnovations in American Government Award fromHarvard University’s Kennedy School of Govern-ment. The award, accompanied by a $100,000 grant,highlights effective government projects.104
In addition to the NDS design concept, the cityof Seattle also promotes rainwater harvesting. The327,000 square foot King Street Center uses three5,400 gallon tanks to collect rainwater from thebuilding’s roof. The collected rainwater is filteredand pumped through a dedicated piping system fortoilet flushing and landscaping needs. The systemprovides 1.4 million of the approximately 2.2 milliongallons—60%—of the toilet flushing water neededannually and reduces the stormwater dischargedfrom the building by the same amount.105
In March 2005, SPU began the second phase of asubsidized rain barrel and cistern program intendedto distribute the rainwater-harvesting devices through-out the city. The first phase of the program distributed1,500 rain barrels at a reduced rate to private home-owners.106 In addition, SPU initiated the Freemont rain-water harvesting study on March 1, 2005. The project,
31
Natural Resources Defense Council Rooftops to Rivers
conducted with the cooperation of 10 single-family resi-dential homeowners in the combined sewer area, isstudying the effectiveness of slowly draining cisterns toretain peak stormwater runoff. The costs of the programwill be compared to the costs of detaining an equalvolume of wastewater in centralized vaults beforebeing metered out to the municipal wastewater treat-ment plant. The project will also test the acceptance andeffectiveness of rain gardens in the residential area.107
Another approach to mitigating stormwaterrunoff is green roofs. The city of Seattle has installedfour green roofs over the past several years. In orderto evaluate the ability of these green roofs to reducestormwater runoff, the city is embarking on amultiple-year data collection initiative. The goal is toprovide information that can be used to modify thecity’s stormwater code and potentially provideincentives to encourage the construction of greenroofs in both public and commercial applications.
Seattle has also begun an urban forestry initiativeto reduce stormwater runoff. A master plan forplanting trees on city streets implemented in 1999established a goal of increasing the city’s tree canopyfrom 27% of city surface area to 40%.108
For Additional InformationSeattle Public Utilities Natural Drainage Systems:http://www.ci.seattle.wa.us/util/About_SPU/Drainage_&_Sewer_System/Projects/Natural_Drainage_Systems/NATURALDR_20031203121352.asp
Toronto, Ontario, CanadaA long-term “Water Pollution Solution” focuses ongreen infrastructurePopulation: 2.5 millionType of green infrastructure used: green roofs;downspout disconnection/rainwater collection;wetlands, riparian protection, or urban forestsProgram elements: established municipal programsand public funding
Covering 240 square miles along the shores ofLake Ontario, Toronto is the largest city in Canada,
TOR
ON
TO
with 2.5 million residents. The entire Toronto metro-politan region has a population of 4.5 million peoplespread out over 560 square miles. This vast urbanexpanse is also home to an extensive infrastructurenetwork with 2,800 miles of storm sewers and over2,600 outfalls.109 Like the Great Lakes cities in theUnited States, Toronto’s urban stormwater is a lead-ing cause of water pollution in Lake Ontario and itstributaries and necessitates expensive investmentsdirected toward CSO mitigation and stormwatermanagement. Toronto and its surrounding water-sheds are part of an Area of Concern under a RemedialAction Plan (RAP), a policy designation derived fromamendments to the 1972 bilateral Canada-U.S. GreatLakes Water Quality Agreement. The Toronto RAPcovers Toronto Bay and six watersheds: EtobicokeCreek, Mimico Creek, Humber River, Don River,Highland Creek, and Rouge River. Goals include therestoration of drinkable, fishable, swimmable, andaesthetically pleasing water and habitat areas.110
The RAP explicitly highlights pollution from urbanstormwater runoff as one of the primary sources ofecosystem degradation to this region.111
Faced with the difficult challenge of limiting storm-water runoff and pollution, Toronto has developed aunique policy approach for managing stormwaterwith the goal of eliminating adverse effects of wetweather flows and achieving measurable improve-ment in ecosystem health within the watershed.112 InJuly 2003, Toronto’s City Council approved a 25-yearstormwater plan, the Water Pollution Solution, for-merly called the Wet Weather Flow ManagementPlan. This plan is a comprehensive strategy to dealwith surface water quality and quantity, sewageoverflows, and habitat protection. Toronto’s approachincludes increasing traditional methods of storm-water storage capacity and improving conveyancestructures, but it also includes greener approaches,especially for some short-term solutions.
Toronto’s Four Principles of StormwaterManagementThe Wet Weather Plan is explicitly based on fourinnovative principles for stormwater management:
32
Natural Resources Defense Council Rooftops to Rivers
(1) recognizing rainwater and snowmelt as a valuableresource; (2) managing wet weather flows on awatershed basis; (3) implementing the hierarchy ofwet weather practices beginning with “source,” then“conveyance,” and lastly, “end-of pipe” solutions;and (4) educating communities and involving thepublic.113 Capital costs for the program are estimatedto be around $800 million; operational and main-tenance costs are expected to be around $13 millionannually.114 The city has earmarked $200,000annually for community projects that contributeto the Water Pollution Solution.115
Toronto’s program involves a significant down-spout disconnection effort to prevent runoff fromentering both the stormwater and combined sewersystems. The city will disconnect residences for freeand provide splash guards or rain barrels to protectresidential foundations. As of June 2000, Torontoestimated that approximately 20,000 homes had beendisconnected.116 Downspout disconnection effortshave been targeted at areas that either experiencelocalized flooding or have a significant runoff impacton Toronto’s beaches.
Toronto has made extensive use of the naturalfiltering and flood control capacity of wetlands andvegetated areas to help achieve the goals of the RAP.The city has embarked on wetland and streamrestoration programs to facilitate stormwatermanagement that will achieve cleaner streams andenhanced wildlife habitat. Toronto is committing$106 million for the capital costs to restore over40 miles of streams, and expects operation andmaintenance costs for this stream restoration to beroughly $500,000 per year.117 Several wetlands havealready been restored, including Chester SpringsMarsh, a 7.5 -acre wetland restored on the site of anold landfill. This particular wetland was restoredspecifically to prevent nutrients and pollutants fromreaching the Don River. Wetlands originally per-formed this filtering function before the Don waschanneled in the late 19th century.118 The recoveredarea has witnessed a substantial increase in thenumber of species that visit the site, spurring cityplans to build and restore several more wetlands.
TOR
ON
TO
Toronto’s green roofs. Toronto has also becomea center for green roof technologies. While notexplicitly part of the stormwater plan, the greenroof initiatives are expected to have an impact onstormwater mitigation. Based on an EnvironmentCanada study, the nonprofit industry associationGreen Roofs for Healthy Cities estimates thatgreening 6% of Toronto’s roofs would cost about$36 million over 10 years and would retain almost1 billion gallons of stormwater annually.119 In 2002,several Canadian organizations announced the GreenRoof Infrastructure Demonstration Project, a public-private partnership that will fund more than $800,000in green roof costs.120
Toronto currently has over 100 green roofs, includ-ing an intensive installation on the Toronto City Halland an extensive installation on the gymnasiumroof of the Eastview Neighbourhood CommunityCentre.121 The National Research Council’s Institutefor Research in Construction installed a monitoringsystem on the Eastview roof to measure both qualityand quantity of stormwater runoff.122 Early findingsfrom an upcoming study to investigate the potentialfor widespread green roof installations in Toronto(The Municipal Cost Savings Benefits of Green Roofs)indicate 57% average annual flow reductions fromthe Eastview green roof plots compared to traditionalroofs.123 The plots also showed peak flow rates of25% to 60% during summer and 10% to 30% in latefall of those measured from conventional roofs.124
These preliminary monitoring results were achievedbefore vegetation had reached maturity.
A Ryerson University study evaluated the munici-pal level benefits and costs of wide-scale imple-mentation of green roofs in Toronto. For the study,a Geographic Information Systems (GIS) databasewas used to model and aggregate environmentalbenefits and a methodology was developed to mone-tize these benefits. The study assumed that green roofswould be installed on all city flat roofs more than3,750 square feet and would cover at least 75% of theroof. Using this assumption, more than 12,000 acresof green roofs, representing 8% of the total land areain the city, could be installed in Toronto.125
VAN
CO
UVER
33
Natural Resources Defense Council Rooftops to Rivers
The study findings estimated nearly $270 millionof municipal capital cost savings and more than$30 million in annual savings with this number ofinstalled green roofs. Five primary benefits were quan-tified in the study: (1) reduced stormwater flows intothe separate storm sewer system, (2) reduced storm-water flows into the combined sewer system, (3) im-proved air quality, (4) mitigated urban heat islandeffects, and (5) reduced energy consumption. The studyestimated more than $100 million in stormwater cap-ital cost savings, $40 million in CSO capital cost sav-ings and nearly $650,000 in CSO annual cost savings.
The researchers anticipate that the only coststo the city will be those to promote green roofs,although the city will also likely incur costs tomonitor design and construction of the green roofs.The cost to retrofit existing roofs with green roofs islikely to be borne by private industry during thenormal maintenance cycle. Recent green roof projectsin Canada have averaged $6 to $7 per square foot,suggesting a total cost of $3 billion to $3.7 billion for12,000 acres of green roofs.126,127 While the total costto install the green roofs is large, it would be spreadacross numerous building owners and developers.The additional cost of a green roof for the minimumarea roof in the study, 3,750 square feet, would be$22,000 to $27,000.
For Additional InformationCity of Toronto—Protecting Water Quality: http://www.toronto.ca/water/protecting_quality/index.htm
Vancouver, B.C., CanadaCreative green design for city parks and roadsPopulation: 600,000Type of green infrastructure used: green roofs;rain gardens, vegetated swales, and landscape;permeable pavement; wetlands, riparian protection,or urban forestsProgram elements: established municipal programsand public funding
Situated 25 miles north of the U.S.-Canadianborder and bounded on three sides by water,
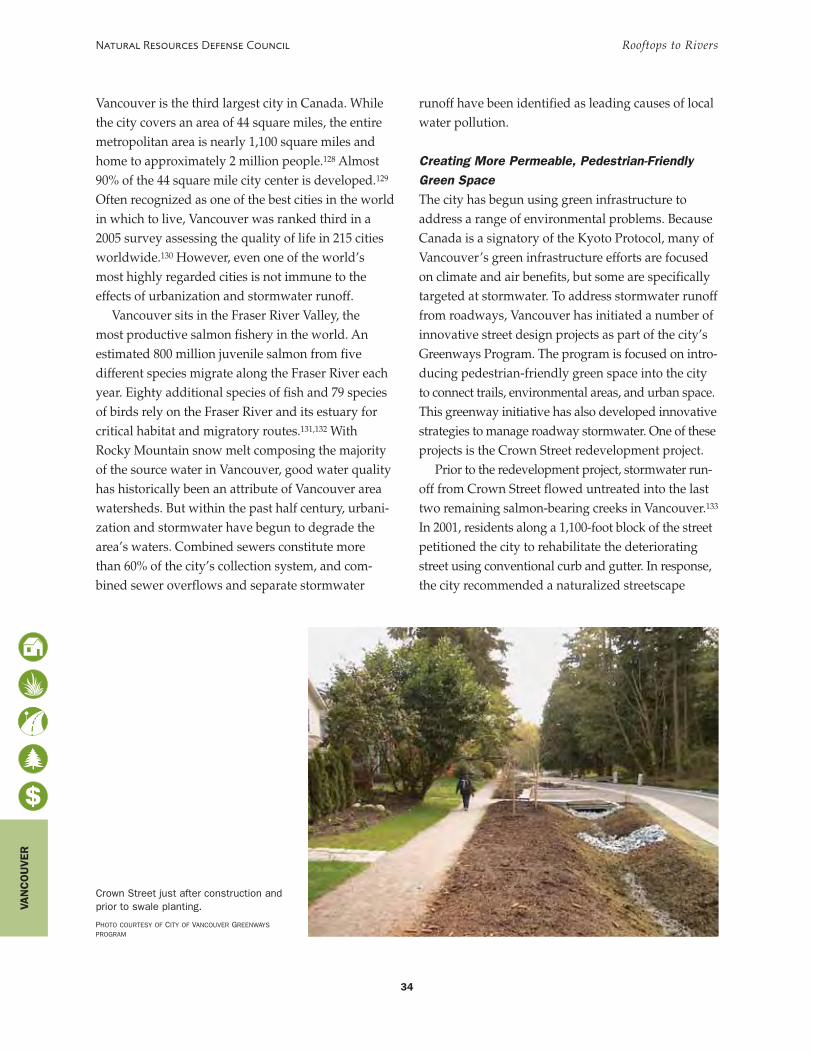
Vancouver is the third largest city in Canada. Whilethe city covers an area of 44 square miles, the entiremetropolitan area is nearly 1,100 square miles andhome to approximately 2 million people.128 Almost90% of the 44 square mile city center is developed.129
Often recognized as one of the best cities in the worldin which to live, Vancouver was ranked third in a2005 survey assessing the quality of life in 215 citiesworldwide.130 However, even one of the world’smost highly regarded cities is not immune to theeffects of urbanization and stormwater runoff.
Vancouver sits in the Fraser River Valley, themost productive salmon fishery in the world. Anestimated 800 million juvenile salmon from fivedifferent species migrate along the Fraser River eachyear. Eighty additional species of fish and 79 speciesof birds rely on the Fraser River and its estuary forcritical habitat and migratory routes.131,132 WithRocky Mountain snow melt composing the majorityof the source water in Vancouver, good water qualityhas historically been an attribute of Vancouver areawatersheds. But within the past half century, urbani-zation and stormwater have begun to degrade thearea’s waters. Combined sewers constitute morethan 60% of the city’s collection system, and com-bined sewer overflows and separate stormwater
34
Natural Resources Defense Council Rooftops to Rivers
runoff have been identified as leading causes of localwater pollution.
Creating More Permeable, Pedestrian-FriendlyGreen SpaceThe city has begun using green infrastructure toaddress a range of environmental problems. BecauseCanada is a signatory of the Kyoto Protocol, many ofVancouver’s green infrastructure efforts are focusedon climate and air benefits, but some are specificallytargeted at stormwater. To address stormwater runofffrom roadways, Vancouver has initiated a number ofinnovative street design projects as part of the city’sGreenways Program. The program is focused on intro-ducing pedestrian-friendly green space into the cityto connect trails, environmental areas, and urban space.This greenway initiative has also developed innovativestrategies to manage roadway stormwater. One of theseprojects is the Crown Street redevelopment project.
Prior to the redevelopment project, stormwater run-off from Crown Street flowed untreated into the lasttwo remaining salmon-bearing creeks in Vancouver.133
In 2001, residents along a 1,100-foot block of the streetpetitioned the city to rehabilitate the deterioratingstreet using conventional curb and gutter. In response,the city recommended a naturalized streetscape
VAN
CO
UVER
Crown Street just after construction andprior to swale planting.
PHOTO COURTESY OF CITY OF VANCOUVER GREENWAYSPROGRAM
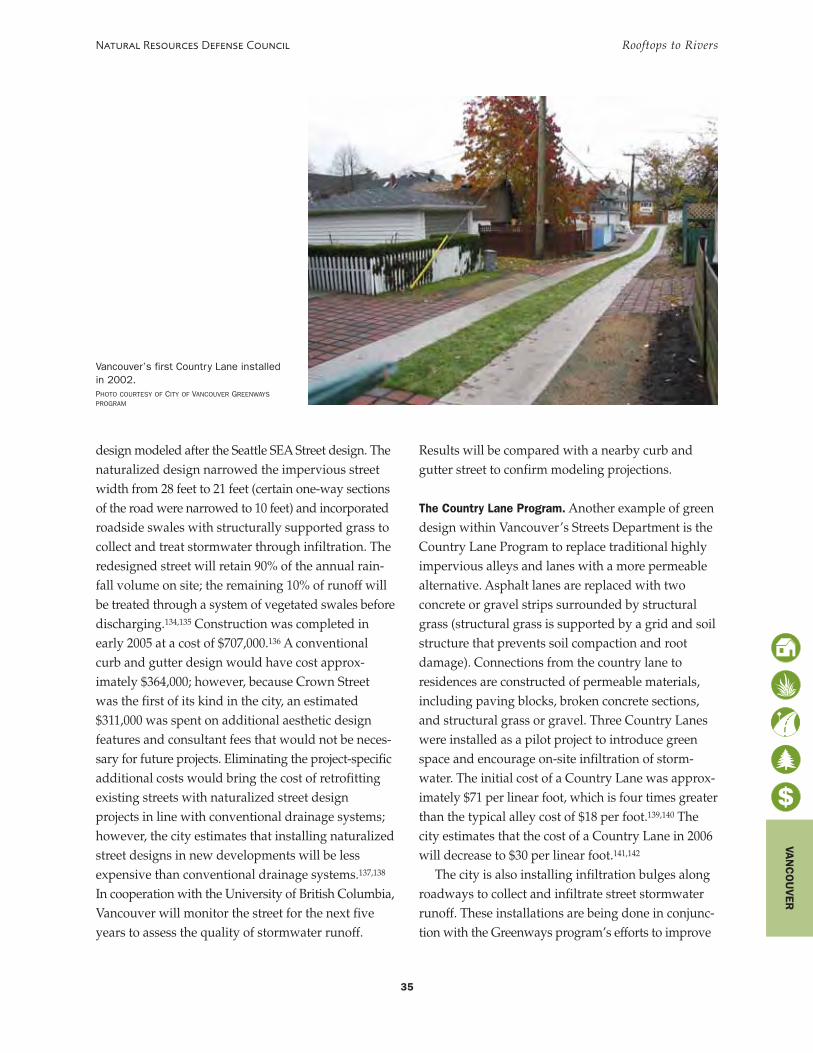
design modeled after the Seattle SEA Street design. Thenaturalized design narrowed the impervious streetwidth from 28 feet to 21 feet (certain one-way sectionsof the road were narrowed to 10 feet) and incorporatedroadside swales with structurally supported grass tocollect and treat stormwater through infiltration. Theredesigned street will retain 90% of the annual rain-fall volume on site; the remaining 10% of runoff willbe treated through a system of vegetated swales beforedischarging.134,135 Construction was completed inearly 2005 at a cost of $707,000.136 A conventionalcurb and gutter design would have cost approx-imately $364,000; however, because Crown Streetwas the first of its kind in the city, an estimated$311,000 was spent on additional aesthetic designfeatures and consultant fees that would not be neces-sary for future projects. Eliminating the project-specificadditional costs would bring the cost of retrofittingexisting streets with naturalized street designprojects in line with conventional drainage systems;however, the city estimates that installing naturalizedstreet designs in new developments will be lessexpensive than conventional drainage systems.137,138
In cooperation with the University of British Columbia,Vancouver will monitor the street for the next fiveyears to assess the quality of stormwater runoff.
35
Natural Resources Defense Council Rooftops to Rivers
Results will be compared with a nearby curb andgutter street to confirm modeling projections.
The Country Lane Program. Another example of greendesign within Vancouver’s Streets Department is theCountry Lane Program to replace traditional highlyimpervious alleys and lanes with a more permeablealternative. Asphalt lanes are replaced with twoconcrete or gravel strips surrounded by structuralgrass (structural grass is supported by a grid and soilstructure that prevents soil compaction and rootdamage). Connections from the country lane toresidences are constructed of permeable materials,including paving blocks, broken concrete sections,and structural grass or gravel. Three Country Laneswere installed as a pilot project to introduce greenspace and encourage on-site infiltration of storm-water. The initial cost of a Country Lane was approx-imately $71 per linear foot, which is four times greaterthan the typical alley cost of $18 per foot.139,140 Thecity estimates that the cost of a Country Lane in 2006will decrease to $30 per linear foot.141,142
The city is also installing infiltration bulges alongroadways to collect and infiltrate street stormwaterrunoff. These installations are being done in conjunc-tion with the Greenways program’s efforts to improve
VAN
CO
UVER
Vancouver’s first Country Lane installedin 2002.PHOTO COURTESY OF CITY OF VANCOUVER GREENWAYSPROGRAM
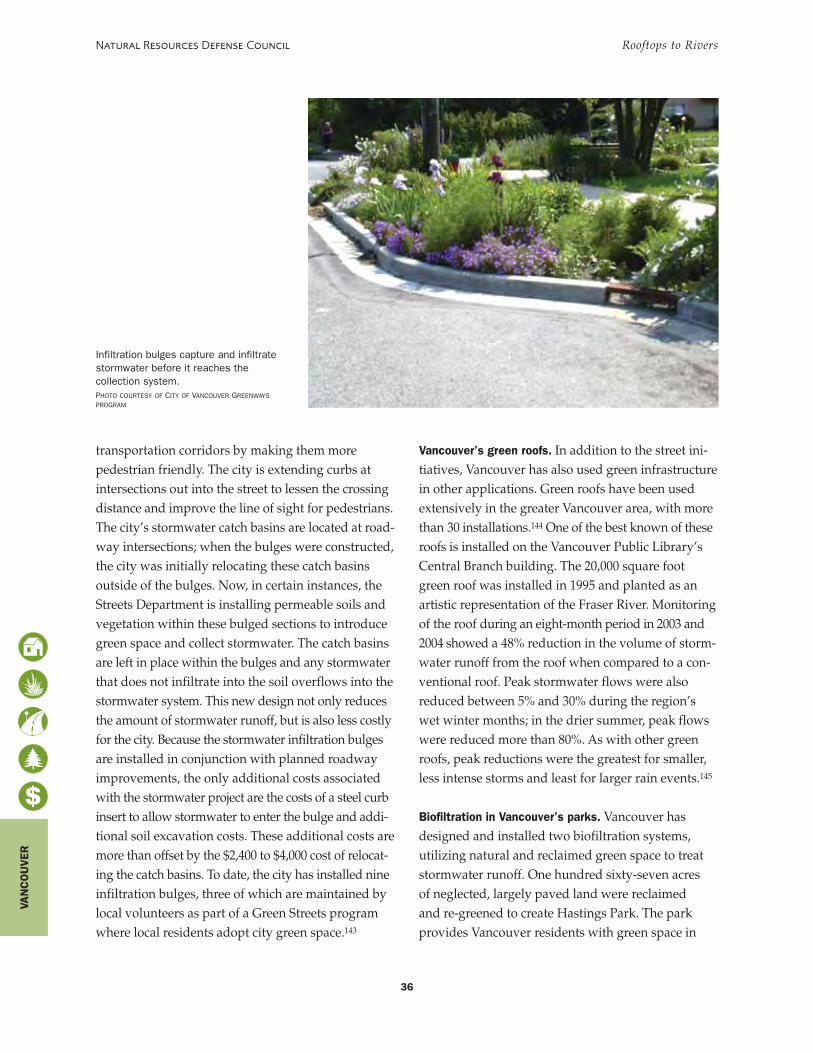
transportation corridors by making them morepedestrian friendly. The city is extending curbs atintersections out into the street to lessen the crossingdistance and improve the line of sight for pedestrians.The city’s stormwater catch basins are located at road-way intersections; when the bulges were constructed,the city was initially relocating these catch basinsoutside of the bulges. Now, in certain instances, theStreets Department is installing permeable soils andvegetation within these bulged sections to introducegreen space and collect stormwater. The catch basinsare left in place within the bulges and any stormwaterthat does not infiltrate into the soil overflows into thestormwater system. This new design not only reducesthe amount of stormwater runoff, but is also less costlyfor the city. Because the stormwater infiltration bulgesare installed in conjunction with planned roadwayimprovements, the only additional costs associatedwith the stormwater project are the costs of a steel curbinsert to allow stormwater to enter the bulge and addi-tional soil excavation costs. These additional costs aremore than offset by the $2,400 to $4,000 cost of relocat-ing the catch basins. To date, the city has installed nineinfiltration bulges, three of which are maintained bylocal volunteers as part of a Green Streets programwhere local residents adopt city green space.143
36
Natural Resources Defense Council Rooftops to Rivers
Vancouver’s green roofs. In addition to the street ini-tiatives, Vancouver has also used green infrastructurein other applications. Green roofs have been usedextensively in the greater Vancouver area, with morethan 30 installations.144 One of the best known of theseroofs is installed on the Vancouver Public Library’sCentral Branch building. The 20,000 square footgreen roof was installed in 1995 and planted as anartistic representation of the Fraser River. Monitoringof the roof during an eight-month period in 2003 and2004 showed a 48% reduction in the volume of storm-water runoff from the roof when compared to a con-ventional roof. Peak stormwater flows were alsoreduced between 5% and 30% during the region’swet winter months; in the drier summer, peak flowswere reduced more than 80%. As with other greenroofs, peak reductions were the greatest for smaller,less intense storms and least for larger rain events.145
Biofiltration in Vancouver’s parks. Vancouver hasdesigned and installed two biofiltration systems,utilizing natural and reclaimed green space to treatstormwater runoff. One hundred sixty-seven acresof neglected, largely paved land were reclaimedand re-greened to create Hastings Park. The parkprovides Vancouver residents with green space in
Infiltration bulges capture and infiltratestormwater before it reaches thecollection system.PHOTO COURTESY OF CITY OF VANCOUVER GREENWAYSPROGRAM
VAN
CO
UVER
a highly urbanized section of the city. Within thepark is the biofiltration system referred to as theSanctuary. This system receives stormwater runofffrom a 300-acre residential area to the south of thepark and uses natural biological processes to treatthe runoff prior to discharging it to the BurrardInlet.146 The biofiltration pond was designed inconjunction with the sewer separation project thatinstalled a new separate stormwater collectionsystem in the neighborhood bordering the park.The Sanctuary also provides additional aestheticand environmental benefits by serving as valuablehabitat for wildlife and birds.147,148
A second biofiltration system is used in StanleyPark, a 1,000-acre urban park in Vancouver. Thepark is bisected by the Stanley Park Causeway, amajor commuter route. Prior to the construction ofthe biofiltration wetlands, causeway runoff floweduntreated into the Lost Lagoon, Beaver Lake, andadjacent forests. To manage and treat this storm-water, runoff was directed to a wetland constructedwithin the Lost Lagoon. The wetland uses naturalfiltration and biological processes to treat thestormwater before it is discharged to the lagoon.The innovative stormwater wetland was built toharmonize with the existing green space of thepark and to provide habitat for plants and wildlife.Areas of the wetland not open to the public providenecessary space for birds to remain undisturbed byhuman activity.149,150
For Additional InformationCity of Vancouver Streets Design—EnvironmentallySustainable Options: http://www.city.vancouver.bc.ca/engsvcs/streets/design/enviro.htm#lanes
Washington, D.C.Using green infrastructure to combat years of riverpollutionPopulation: 563,000Type of green infrastructure used: green roofs;rain gardens, vegetated swales, and landscape;permeable pavement
WA
SH
ING
TON
, DC
37
Natural Resources Defense Council Rooftops to Rivers
Washington, D.C., sits at the confluence of thePotomac and Anacostia rivers and is home to a third,Rock Creek. These rivers in the nation’s capital havehistorical and symbolic importance. The PotomacRiver is designated an American Heritage River andis often synonymous with the seat of the country’sfederal government. Unfortunately, Washington’srivers are also significantly affected by the largeamount of urbanization surrounding them. Approxi-mately 65% of the District is covered with impervi-ous surfaces.151 Development and urbanization havetaken a toll on the natural features within the city;over the past 30 years, the District has lost 64% of itsareas with heavy tree cover and experienced a 34%increase in stormwater runoff.152
Cleaning Up Washington’s Most Polluted WatersThrough Green InfrastructureOne-third of the city is served by a combined sewersystem dating to the beginning of the 1900s andearlier. Estimated annual CSO discharges to the city’sthree rivers are 2.5 billion gallons.153,154 The AnacostiaRiver, which receives 60% of the CSO discharges, isone of the most polluted in the nation. Fifty percentof brown bullhead catfish collected for study fromthe river had cancerous liver tumors and approxi-mately 25% had cancerous skin tumors.155 The city’sapproved long-term CSO control plan (LTCP) willcost approximately $1.9 billion and focuses primarilyon a deep tunnel system and sewer separation, butalso recognizes the importance of incorporatinggreen infrastructure within the city.
Low Impact Development at the Navy Yard on the
Anacostia River. The Washington Navy Yard, alongthe banks of the Anacostia River, has been a notori-ous source of the river’s water quality problems. Thebase has been subject to decades of military pollutionand has been a main source of toxic water pollution.In 2001, the Navy Yard installed a number of greeninfrastructure pilot projects to manage stormwaterrunoff. Downspouts were disconnected and directedto rain barrels, and permeable pavement, raingardens, and tree box filters were installed. These
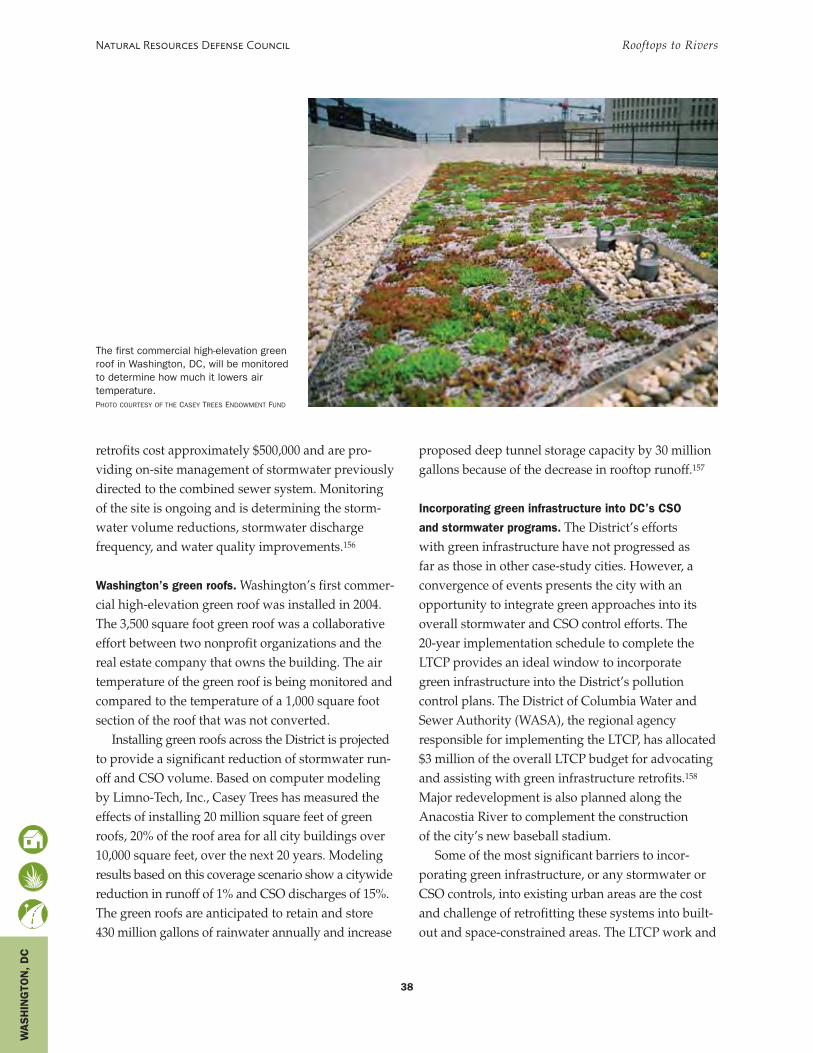
retrofits cost approximately $500,000 and are pro-viding on-site management of stormwater previouslydirected to the combined sewer system. Monitoringof the site is ongoing and is determining the storm-water volume reductions, stormwater dischargefrequency, and water quality improvements.156
Washington’s green roofs. Washington’s first commer-cial high-elevation green roof was installed in 2004.The 3,500 square foot green roof was a collaborativeeffort between two nonprofit organizations and thereal estate company that owns the building. The airtemperature of the green roof is being monitored andcompared to the temperature of a 1,000 square footsection of the roof that was not converted.
Installing green roofs across the District is projectedto provide a significant reduction of stormwater run-off and CSO volume. Based on computer modelingby Limno-Tech, Inc., Casey Trees has measured theeffects of installing 20 million square feet of greenroofs, 20% of the roof area for all city buildings over10,000 square feet, over the next 20 years. Modelingresults based on this coverage scenario show a citywidereduction in runoff of 1% and CSO discharges of 15%.The green roofs are anticipated to retain and store430 million gallons of rainwater annually and increase
38
Natural Resources Defense Council Rooftops to Rivers
proposed deep tunnel storage capacity by 30 milliongallons because of the decrease in rooftop runoff.157
Incorporating green infrastructure into DC’s CSO
and stormwater programs. The District’s effortswith green infrastructure have not progressed asfar as those in other case-study cities. However, aconvergence of events presents the city with anopportunity to integrate green approaches into itsoverall stormwater and CSO control efforts. The20-year implementation schedule to complete theLTCP provides an ideal window to incorporategreen infrastructure into the District’s pollutioncontrol plans. The District of Columbia Water andSewer Authority (WASA), the regional agencyresponsible for implementing the LTCP, has allocated$3 million of the overall LTCP budget for advocatingand assisting with green infrastructure retrofits.158
Major redevelopment is also planned along theAnacostia River to complement the constructionof the city’s new baseball stadium.
Some of the most significant barriers to incor-porating green infrastructure, or any stormwater orCSO controls, into existing urban areas are the costand challenge of retrofitting these systems into built-out and space-constrained areas. The LTCP work and
The first commercial high-elevation greenroof in Washington, DC, will be monitoredto determine how much it lowers airtemperature.PHOTO COURTESY OF THE CASEY TREES ENDOWMENT FUND
WA
SH
ING
TON
, D
C
Anacostia redevelopment lower these barriersbecause of the large capital investment that willaccompany the projects and substantial overhaul andupgrade of associated infrastructure. These projectsoffer the opportunity to integrate green infrastructurefrom the start and take advantage of the associatedcost savings. The city will also have the opportunityto learn from several major cities that have been suc-cessfully integrating green infrastructure intostormwater and CSO mitigation plans.
A number of the policy recommendations describedearlier in this report could be used effectively toencourage green infrastructure. The District currentlycharges a nominal stormwater fee to its residents andcommercial properties located in the separate sewerarea. The stormwater fee could be restructured,similar to Portland, Oregon’s model, to allow a ratereduction for those properties that install greeninfrastructure or manage stormwater on site. To be
39
Natural Resources Defense Council Rooftops to Rivers
an adequate incentive, the current annual stormwaterfee would need to be significantly increased. Asimilar system could be adopted in the combinedsewer area as well. Private grant programs, like theChesapeake Bay Foundation’s green roof grantprogram, currently exist as an incentive to installgreen infrastructure in the city. The District shouldcomplement these efforts with a city-administeredfinancial assistance program for green infrastructure.
For Additional InformationCasey Trees—Green Roof Vision for DC: http://www.caseytrees.org/pdfs/Green%20Roof%20Vision%20for%20DC%20-%20Full%20Report%20082405.pdf
University of Maryland School of Public Policy,Reducing Combined Sewer Overflows: Toward CleanWater in Washington, D.C. (May 2002): http://www.publicpolicy.umd.edu/faculty/nelson/CSO_Complete.pdf
WA
SH
ING
TON
, DC
40
AG-588-02 Urban Waterways: Designing StormwaterWetlands for Small Watersheds, N.C. State UniversityPublicationhttp://statelibrary.dcr.state.nc.us/tss/deposito.htm
Alternative Stormwater Managementhttp://appliedeco.com/StormWaterMgt.cfm
Municipal Research and Services Center ofWashington, Best Management Practices (BMPs) forStorm and Surface Water Management: PollutionPrevention/Good Housekeepinghttp://www.mrsc.org/subjects/environment/water/sw-BMP.aspx#runoff
The Stormwater Manager’s Resource Center,Bioretention as a Water Quality Best ManagementPracticehttp://www.stormwatercenter.net/Practice/110-Bioretention.pdf
The Center for Watershed Protection, StormwaterManagement and Stormwater Management Practiceshttp://www.cwp.org/stormwater_mgt.htm &http://www.cwp.org/stormwater_practices.htm
Chagrin River Watershed Partners—WatershedToolkithttp://www.crwp.org/page13.html
City of Portland Bureau of Environmental Serviceshttp://www.portlandonline.com/bes
APPENDIX
City of Vancouver Greenways Initiativehttp://www.city.vancouver.bc.ca/engsvcs/streets/greenways/otherInitiatives.htm
N.C. State University, WATERSHEDS: A DecisionSupport System for Non-Point Pollution Controlhttp://www.water.ncsu.edu/watershedss
Comprehensive Environmental, Inc., The PurerInnovative Stormwater Management Programhttp://ceiengineers.com/publications/Purerdesign.pdf
International Stormwater Best Management (BMP)Databasehttp://www.bmpdatabase.org
An Internet Guide to Financing StormwaterManagementhttp://stormwaterfinance.urbancenter.iupui.edu
U.S. Green Building Council, LEED(r) for ExistingBuildingshttps://www.usgbc.org/FileHandling/show_general_file.asp?DocumentID=799
The Low Impact Urban Development Center, LowImpact Development (LID) Urban Design Toolshttp://www.lid-stormwater.net
Natural Resources Defense Council, UrbanStormwater Solutionshttp://www.nrdc.org/water/pollution/nstorm.asp
ADDITIONAL ONLINE RESOURCES
National Stormwater Centerhttp://npdes.com
U.S. Environmental Protection Agency, NPDESStormwater Program for Regulated Small MS4shttp://cfpub.epa.gov/npdes/stormwater/phase2.cfm
Puget Sound Action Team, Low Impact Developmenthttp://www.psat.wa.gov/Programs/LID.htm
Rain Gardens—A How-to Manual for Home Ownershttp://clean-water.unex.edu/pubs/raingarden/rgmanual.pdf
Rain Gardens—Improve Stormwater Management inYour Yardhttp://www.cmhc-schl.gc.ca/en/burema/gesein/abhose/abhose_075.cfm
Scholz-Barth, Katrin, Green Roofs: StormwaterManagement from the Top Downhttp://www.edcmag.com/CDA/ArticleInformation/features/BNP_Features_Item/0,4120,18769,00.html
Seattle Public Utilities, Natural Drainage Systemshttp://www.ci.seattle.wa.us/util/About_SPU/Drainage_&_Sewer_System/Natural_Drainage_Systems/index.asp
Home*A*Syst North Carolina, StormwaterManagement for Homeownershttp://www.soil.ncsu.edu/assist/homeassist/stormwater
New York, New Jersey, Puerto Rico, Virgin IslandsRegional Water Coordination Program, StormwaterManagement in Your Backyardhttp://rwqp.rutgers.edu/univ/nj/Stormwater%20Management%20Education%20Program.htm
The Stormwater Management Academyhttp://www.stormwater.ucf.edu
41
Natural Resources Defense Council Rooftops to Rivers
Stormwater, A Stormwater Management Plan YourCommunities, Businesses, and Residents WillSupporthttp://www.forester.net/sw_0103_plan.html
Stormwater Plant Materials—A Resource Guidehttp://www.lowimpactdevelopment.org/lid%20articles/idpmcarswpm.pdf
Texas A&M Cooperative Extension, StormwaterManagementhttp://tcebookstore.org/pubinfo.cfm?pubid=2049
The Center for Watershed Protection, Urban StreamRepair Practiceshttp://www.cwp.org/Downloads/ELC_USRM4red.pdf
U.S. Department of Energy, Building Toolbox:Stormwater Management Strategieshttp://www.eere.energy.gov/buildings/info/design/buildingsiting/stormwater.html
U.S. EPA Urban Watershed Management Research,Stormwater Management Model (SWMM)http://www.epa.gov/ednnrmrl/models/swmm/index.htm
University of Washington College of Engineering,Use of Constructed Wetlands for Improving StormwaterQualityhttp://www.engr.washington.edu/epp/cee/ucw.html
Using Constructed Wetlands to Improve WaterQualityhttp://www.orst.edu/agcomwebfile/edmat/ec1408.pdf
Regional Coordination Program, Weather Reports andWatershed Protection: A Winning Combinationhttp://rwqp.rutgers.edu/univ/nj/Stormwater%20Management%20Education%20Program/66issue.pdf
42
Natural Resources Defense Council Rooftops to Rivers
American Rivers, Catching the Rain: a Great LakesResource Guide to Natural Stormwater Management(July 2004)http://www.americanrivers.org/site/PageServer?pagename=AMR_publications
Taxpayers for Common Sense, Banking on the Future:Investing in Smart Water Strategies for Pennsylvania andthe Nation (Aug. 2005)http://www.taxpayer.net/waterinfrastructure/banking.pdf
U.S. Public Interest Group and American Rivers,Waterways at Risk: How Low-Impact Development CanReduce Runoff Pollution in Michigan (Oct. 2005)http://pirgim.org/MI.asp?id2=19931
Environmental Integrity Project, Report: Backed Up,Cleaning Up Combined Sewer Systems in the Great Lakes(May 2005)http://www.environmentalintegrity.org/page88.cfm
U.S .EPA, Stormwater Best Management PracticesDesign Guide (Sept. 2004)www.epa.gov/ost/stormwater
U.S. EPA, Report to Congress: Impacts and Control ofCSOs and SSOs (Aug. 2004)http://cfpub.epa.gov/npdes/docs.cfm?program_id=5&view=allprog&sort=name
U.S. EPA, National Management Measures to ControlNonpoint Source Pollution from Urban Areas(Jan. 2006)http://www.epa.gov/owow/nps/urbanmm/
U.S. EPA, Using Smart Growth Techniques asStormwater Best Management Practices (2006)http://www.epa.gov/smartgrowth/stormwater.htm
National Association of Local GovernmentEnvironmental Professionals, et al., Smart Growth forClean Water (2003)http://www.nalgep.org/publications/PublicationsDetail.cfm?LinkAdvID=42157
The Trust for Public Land, Building Green Infra-structure (June 2000)http://www.tpl.org/tier3_cdl.cfm?content_item_id=915&folder_id=745
43
Chapter 21 U.S. Environmental Protection Agency, Protecting Water Quality fromUrban Runoff, Nonpoint Source Control Branch, EPA 841-F-03-003,February 2003.
2 Prince George’s County, Maryland Department of EnvironmentalResources, Low-Impact Development Design Strategies, January 2000.
3 Dana Beach, Coastal Sprawl: The Effects of Urban Design on AquaticEcosystems in the United States, Pew Ocean Commission, 2002.
4 See note 3.
5 U.S. Department of Agriculture, National Resources Inventory: 2002Annual NRI, Natural Resources Conservation Service, April 2004.
6 See note 1.
7 U.S. EPA, Report to Congress: Impacts and Control of CSOs and SSOs,Office of Water, EPA-833-R-04-001, August 2004.
8 See note 7.
9 U.S. EPA, National Water Quality Inventory, 2000 Report, Office of Water,EPA-841-R-02-001, August 2002.
10 See note 7.
11 See note 7.
12 D.C. Water and Sewer Authority, CSO Overflow Predictions for AverageYear, August 2004,http://www.dcwasa.com/education/css/cso_predictions.cfm (accessedFebruary 18, 2005).
13 Milwaukee Metropolitan Sewerage District, Overflows: CSOs, http://www.mmsd.com/overflows/csos.cfm (accessed November 11, 2004).
14 Portland Bureau of Environmental Services, The Cornerstone Projects,http://www.portlandonline.com/bes/index.cfm?&a=40678&c=32123(accessed February 16, 2005).
15 See note 7.
16 See note 3.
17 USDA, Summary Report 1997 National Resources Inventory, NaturalResources Conservation Service, December 1999 (revised December2000).
18 See note 3.
19 Arthur C. Nelson, Toward a New Metropolis: The Opportunity to RebuildAmerica, The Brookings Institution, December 2004.
20 See note 3.
Chapter 31 Environmental Integrity Project, Weathering the Storm: Controlling StormWater Pollution in the Great Lakes States, September 2004.
2 James Salzman and Barton H. Thompson Jr., Environmental Law andPolicy (New York: Foundation Press, 2003).
3 “Combined Sewer Overflow (CSO) Control Policy, Final Policy,”Federal Register, Vol. 59, No. 75 (April 19, 1994) pp. 18, 688.
4 See note 7, Chapter 2.
5 Onondaga County Department of Water Environment Protection,Sewer Separation, Onondaga Lake Improvement Project, http://www.lake.onondaga.ny.us/ol30305.htm (accessed February 16, 2005).
6 Mark A. Benedict and Edward T. McMahon, “Green Infrastructure:Smart Conservation for the 21st Century,” Renewal Resources Journal,Autumn 2002.
7 Casey Trees Endowment, Trees Provide Us with a Variety of Benefits:Cleaner Water and Less Polluted Runoff, http://www.caseytrees.org/resources/casefortrees.html (accessed July 8, 2005).
ENDNOTES
Chapter 41 U.S. EPA, Report to Congress: Clean Watersheds Needs Survey 2000, Officeof Wastewater Management, August 20, 2003.
2 Costs adjusted from 2000 to 2005 dollars.
3 See note 1.
4 USDA Forest Service, Pacific Southwest Research Station, Center forUrban Forest Research, http://cufr.ucdavis.edu/research/water.asp(accessed January 31, 2006).
5 John Haugland, Changing Cost Perceptions: An Analysis of ConservationDevelopment, Conservation Research Institute, February 2005.
6 Larry Coffman, “Low Impact Development Design: A New Paradigmfor Stormwater Management Mimicking and Restoring the NaturalHydrologic Regime, An Alternative Stormwater Management Tech-nology” (Conference Proceedings from the National Conference on Toolsfor Urban Water Resource Management and Protection, February 2000).
7 Rocky Mountain Institute, Green Development Services: Village Homes—Davis, California, http://www.rmi.org/sitepages/pid209.php (accessedDecember 8, 2005).
8 See note 5.
9 See note 5.
10 The City of Vancouver, Crown Street: Vancouver’s First EnvironmentallySustainable Street, TAC’s Environmental Council, March 30, 2005.
11 Personal communication with Otto Kauffmann, Engineering ProjectCoordinator, City of Vancouver Streets Division, November 2005.
Chapter 51 See note 5, Chapter 4.
2 See note 7, Chapter 4.
3 33 U.S.C. 1342(q).
4 City of Portland Bureau of Environmental Services, DownspoutDisconnection Program Hits the Billion Gallon Mark, 2005 News Releases,June 2005,http://www.portlandonline.com/bes/index.cfm?&a=82190&c=37621(accessed June 16, 2005).
5 “Stormwater Management Rule,” New Jersey Register, N.J.A.C., Vol. 7,No. 8 (February 2, 2004).
6 Melissa Keeley, “Green Roofs and the Green Area Factor: An UrbanGreen-Infrastructure Policy Instrument” (Proceedings from the GreeningRooftops for Sustainable Communities Conference, Washington, D.C.,May 4–6, 2005).
7 69 Fed. Reg. 22472 (April 26, 2004).
8 Peter H. Lehner, et al., Stormwater Strategies: Community Responses toRunoff Pollution, Natural Resources Defense Council, May 1999.
9 James W. Woodworth, Jr., Out of the Gutter: Reducing Polluted Runoff inthe District of Columbia, Natural Resources Defense Council, July 2002.
10 Tom Liptan and Eric Strecker, Ecoroofs (Greenroofs)—A More SustainableInfrastructure. (Proceedings from the National Conference on UrbanStormwater: Enhancing Programs at the Local Level, Chicago, IL,February 17–20, 2003).
11 City of Toronto Planning Division, Making Green Roofs Happen: ADiscussion Paper Presented to Toronto’s Roundtable on the Environment,November 2005, http://www.toronto.ca/greenroofs/policy.htm#making(accessed December 14, 2005).
12 City of Chicago, City Launches Green Roof Grant Program, http://egov.cityofchicago.org (accessed December 14, 2005).
13 Portland Bureau of Environmental Services, Stormwater DiscountProgram, http://www.portlandonline.com/bes/index.cfm?&a=80606&c=31019 (accessed October 6, 2005).
44
Natural Resources Defense Council Rooftops to Rivers
14 Maryland Department of the Environment, 2000 Maryland StormwaterDesign Manual, Water Management Administration, June 16, 2000.
15 A legal review checklist for reviewing zoning and building coderegulations is in J. Woodworth, Out of the Gutter: Reducing Polluted Runoffin the District of Columbia 52-8 (NRDC, July 2002).
16 See note 5.
Chapter 6: Conclusion1 Personal communication with Jim Middaugh, Program Manager—City of Portland Endangered Species Act Program, December 2005.
Chapter 7: Case Studies1 J.R. McNeill, Something New Under the Sun: An Environmental History ofthe Twentieth-Century World (New York: W.W. Norton & Company, Inc.,2000).
2 City of Chicago, Conserve Chicago Together: Combined Sewers, http://egov.cityofchicago.org/city/webportal/portalContentItemAction.do?BV_SessionID=@@@@1676589694.1109911064@@@@&BV_EngineID=cccdadddmlmhlidcefecelldffhdffn.0&contentOID=536910787&contenTypeName=COC_EDITORIAL&topChannelName=SubAgency&blockName=Conserve+Chicago+Together%2FSewers+of+Chicago%2FI+Want+To&context=dept&channelId=0&programId=0&entityName=Conserve+Chicago+Together&deptMainCategoryOID=-536889943(accessed November 19, 2004).
3 City of Chicago, Chicago’s Water Agenda 2003, http://www.cityofchicago.org/WaterManagement/wateragenda.pdf (accessedNovember 2004).
4 U.S. EPA, Urban Heat Island Pilot Project: Chicago, http://www.epa.gov/heatisland/pilot/chicago.html (accessed December 2004).
5 Tudor Hampton, “Chicago Engineers Move Fast to Finish EpicTunneling Feat,” Engineering News-Record, August 18, 2003, http://www.enr.com/news/environment/archives/030818a.asp (accessedFebruary 16, 2005).
6 Personal communication with Richard Lanyon, Director of Researchand Development, Metropolitan Water Reclamation District of GreaterChicago, February 02, 2005.
7 Metropolitan Water Reclamation District of Greater Chicago, Tunneland Reservoir Plan: The Deep Tunnel, http://www.mwrdgc.dst.il.us/plants/tarp.htm (accessed December 2004).
8 See note 2.
9 City of Chicago Department of Environment, About the Rooftop Garden,http://egov.cityofchicago.org/city/webportal/portalContentItemAction.do?BV_SessionID=@@@@1889397944.1108095328@@@@&BV_EngineID=ccccadddkgejkficefecelldffhdfgn.0&contentOID=536908578&contenTypeName=COC_EDITORIAL&topChannelName=Dept&blockName=Environment%2FCity+Hall+Rooftop+Garden%2FI+Want+To&context=dept&channelId=0&programId=0&entityName=Environment&deptMainCategoryOID=-536887205 (accessed January 2005).
10 City of Chicago Department of Environment, Green Roofs Open to thePublic, http://egov.cityofchicago.org/city/webportal/portalContentItemAction.do?BV_SessionID=@@@@0826962830.1109912191@@@@&BV_EngineID=cccdadddmlmhlidcefecelldffhdffn.0&contentOID=536912340&contenTypeName=COC_EDITORIAL&topChannelName=Dept&blockName=Environment%2FAbout+Chicago%27s+Green+Roofs%2FI+Want+To&context=dept&channelId=0&programId=0&entityName=Environment&deptMainCategoryOID=-536887205 (accessed January 2005).
11 See note 11, Chapter 5.
12 City of Chicago Department of Environment, Urban Heat IslandInitiative Alley Reconstruction, http://egov.cityofchicago.org/webportal/COCWebPortal/COC_ATTACH/UHIAlley.pdf (accessed January 2005).
13 Invisible Structures, Inc., Porous Alleyway Demonstration Project: Ward48, City of Chicago. http://www.invisiblestructures.com/Med&tech/WhitePapers/GV2Alley.pdf (accessed January 2005).
14 The LEED(tm) principles were designed by the U.S. Green BuildingCouncil.
15 City of Chicago Department of Environment, Center for GreenTechnology: History. http://www.cityofchicago.org/Environment/GreenTech/sub/about_history.html (accessed January 2005).
16 City of Chicago Department of Environment, Center for GreenTechnology: Water, http://www.cityofchicago.org/Environment/GreenTech/sub/water.html (accessed January 2005).
17 City of Chicago Department of Environment, Green BungalowInitiative, http://egov.cityofchicago.org/city/webportal/portalContentItemAction.do?blockName=Environment%2fGreen+Building%2fI+Want+To&deptMainCategoryOID=-536887205&channelId=0&programId=0&entityName=Environment&topChannelName=Dept&contentOID=536910325&Failed_Reason=Invalid+timestamp,+engine+has+been+restarted&contenTypeName=COC_EDITORIAL&com.broadvision.session.new=Yes&Failed_Page=%2fwebportal%2fportalContentItemAction.do&context=dept (accessedDecember 9, 2005).
18 City of Chicago Department of Environment, press release, “NewRain Barrel Program Announced,” August 28, 2004, and “Grass RootsWater Education Campaign: Rain Garden and Rain Barrel Pilot Projects.”
19 Rainfall events are defined by estimating their probability of occur-rence. For example, a one-year storm event is predicted to occur onceeach year; likewise, a 25-year storm is a rainfall event large enough that itis predicted to occur on average only once in 25 years or, statistically, ithas a 4% chance of occurring in any given year. Specific storm events areoften a defining component of stormwater regulations. (U.S. GeologicalSurvey, Water Science for Schools, http://ga.water.usgs.gov/edu/100yearflood.html, accessed January 31, 2006).
20 City of Chicago Department of Environment, Stormwater ReductionPractices Feasibility Study, June 11, 2004.
21 Milwaukee Metropolitan Sewerage District, What is an Overflow?,http://www.mmsd.com/overflows/overflow.cfm (accessedNovember 11, 2004).
22 See note 21.
23 Personal communication with Thomas Chapman, Section Manager,Watercourse Division, Milwaukee Metropolitan Sewerage District,Milwaukee, Wisconsin, November 2004.
24 Milwaukee Metropolitan Sewerage District, Collection System: DeepTunnel System, http://www.mmsd.com/projects/collection8.cfm(accessed November 11, 2004).
25 Milwaukee Metropolitan Sewerage District, MMSD Proposes Short-Term Action Plan to Reduce Volume of Sewer Overflows, http://www.mmsd.com/news/news_detail.cfm?id=27 (accessed November 11, 2004).
26 See note 21.
27 Personal communication with Bill Graffin, Public InformationManager, Milwaukee Metropolitan Sewerage District, Milwaukee,Wisconsin, December 2005.
28 See note 21.
29 Milwaukee Metropolitan Sewerage District, Summary of StormwaterReduction BMP Demonstration Projects, November 16, 2004.
30 Whitney Gould, “Sky’s the Limit for ‘Green Roof’ Advocate,”Milwaukee Journal Sentinel, November 28, 2004, http://www.jsonline.com/news/metro/nov04/279426.asp (accessed March 1, 2005).
31 Mark L. Kass, “Beyond Flood Control,” Stormwater, March/April2004, http://www.forester.net/sw_0403_beyond.html (accessedJanuary 5, 2005).
32 See note 29.
45
Natural Resources Defense Council Rooftops to Rivers
33 Eric Loucks, et al., Final Summary of Stormwater Reduction Results,Memorandum Prepared for the Milwaukee Metropolitan SewerageDistrict, March 9, 2004.
34 See note 33.
35 Milwaukee Metropolitan Sewerage District, 2005 MilwaukeeMetropolitan Sewerage District Annual Budget.
36 See note 35.
37 See note 35.
38 National Research Council, Regional Cooperation for Water QualityImprovement in Southwestern Pennsylvania, National Academies Press,January 2005.
39 Bruce Ferguson, et al., “Restorative Redevelopment: The Nine MileRun Model,” Stormwater, January 13, 2004.
40 Sustainable Pittsburgh, Southwestern Pennsylvania Regional IndicatorsReport 2004, Fall 2004.
41 See note 38.
42 Jim Taylor, Attacking Pittsburgh’s Storm Water Problem, EnvironmentalDesign + Construction, May 01, 2003, http://www.edcmag.com/CDA/Archives/f218916daa697010VgnVCM100000f932a8c0 (accessedJanuary 30, 2006).
43 Phipps Conservatory, “Phipps Expansion Raises Region’s NationalProfile,” Momentum, Summer 2004.
44 Jim Taylor, “A ‘Green Roof’ Primer” (Presented at the AllianceBuilding Breakfast, Green Building Alliance, July 28, 2004).
45 David L. Lawrence Convention Center, Green Building,http://www.pittsburghcc.com/html/greenbuilding.htm# (accessedFebruary 2005).
46 United States Army Corps of Engineers, Project Fact Sheet: ConstructionGeneral, http://www.lrp.usace.army.mil/pm/fact_sheet/pfs_cg_sec206_ninemile.pdf.
47 David Black, Flyer for Biohabitats, Inc., Presentation at HydrosystemsEngineering Seminar Series.
48 City of Pittsburgh Department of City Planning, Pittsburgh’s RegionalParks Master Plan: A New Ethic of Stewardship, April 2001.
49 Personal communication with Jeffrey Bergman, Program Coordinator,Nine Mile Run Watershed Association, February 10, 2005.
50 City of Portland Bureau of Environmental Services, Working for CleanRivers, http://www.portlandonline.com/bes/index.cfm?c=32123(accessed January 2005).
51 City of Portland Bureau of Environmental Services, StormwaterManagement in Portland, http://www.portlandonline.com/bes/index.cfm?c=31892 (accessed December 2004).
52 See note 50.
53 See note 50.
54 City of Portland Bureau of Environmental Services, Sustainable SiteDevelopment: Stormwater Practices for New, Redevelopment and Infill Projects,November 2003.
55 Doug Hutchinson, et al., Stormwater Monitoring Two Ecoroofs inPortland, Oregon, USA, City of Portland Bureau of EnvironmentalServices, 2003.
56 City of Portland Bureau of Environmental Services, EnvironmentalAssessment: Innovative Wet Weather Program, April 2004.
57 See note 11, Chapter 5.
58 See note 10, Chapter 5.
59 See note 13, Chapter 5.
60 City of Portland Bureau of Environmental Services, DownspoutDisconnection Program, http://www.portlandonline.com/oni/index.cfm?c=28992 (accessed January 2005).
61 See note 4, Chapter 5.
62 City of Portland Bureau of Environmental Services, Flow Test Report:Siskiyou Curb Extension, August 04, 2004, http://www.portlandonline.com/shared/cfm/image.cfm?id=63097 (accessed January 2005).
63 See note 62.
64 City of Portland Bureau of Environmental Services, SustainableStormwater Management: Green Streets, http://www.portlandonline.com/shared/cfm/image.cfm?id=65931
65 See note 10, Chapter 5.
66 See note 55.
67 See note 54.
68 City of Portland Bureau of Environmental Services, Liberty CenterParking Garage, http://www.portlandonline.com/shared/cfm/image.cfm?id=66824 (accessed February 2005).
69 City of Portland Bureau of Environmental Services, Oregon ConventionCenter Rainwater Garden, http://www.portlandonline.com/bes/index.cfm?&a=68703&c=36848 (accessed February 2005).
70 City of Portland Bureau of Environmental Services, SustainableStormwater Solutions: New Seasons Seven Corners Store Project,http://www.portlandonline.com/shared/cfm/image.cfm?id=73809(accessed February 2005).
71 See note 1, Conclusion.
72 The Rouge River Project, An Overview of the Rouge River, Rouge RiverNational Wet Weather Demonstration Project, http://www.rougeriver.com/geninfo/overview.html (accessed October 4, 2005).
73 Department of the Environment, Wayne County, Michigan, RougeRiver National Wet Weather Demonstration Project—CSO Basins: Getting theMost Performance for Your Pollution Control Dollar, RPO-CSO-TR52, June2005.
74 See note 72.
75 See note 73.
76 U.S. EPA, Great Lakes Areas of Concern: Rouge River, http://www.epa.gov/glnpo/aoc/rougriv.html (accessed October 4, 2005).
77 See note 76.
78 The Rouge River Project, Overview Description of Storm WaterManagement for the Rouge River, Rouge River National Wet WeatherDemonstration Project, http://www.rougeriver.com/stormwater/overview.html (accessed October 4, 2005).
79 See note 76.
80 See note 76.
81 The Rouge River Project, Inkster Wetlands Project, Rouge RiverNational Wet Weather Demonstration Project, http://www.rougeriver.com/wetlands/inkster/inkster/index.html (accessed October 4, 2005).
82 Wayne County Rouge River National Wet Weather DemonstrationProject, Inkster Wetlands, Wayne County, MI, The Rouge River Project,August 2002.
83 See note 82.
84 Ford Motor Company, Rouge Renovation, http://www.ford.com/en/goodWorks/environment/cleanerManufacturing/rougeRenovation.htm(accessed October 7, 2005).
85 Don Hammonds, “Greener, Literally: Ford’s Better Ideas for NewerPlant Include Grass-Covered Roof, Pollution-Eating Plants,” PittsburghPost Gazette, November 12, 2004, http://www.post-gazette.com/pg/04317/410625.stm (accessed October 7, 2005).
86 Greenroofs.com, North American Case Studies, http://www.greenroofs.com/north_american.htm (accessed June 21, 2005).
87 See note 86.
88 See note 84.
89 The Associated Press, “Ford Overhauls Historic Factory to be Green,”MSNBC.com, http://msnbc.com/id/4843708 (accessed October 7, 2005).
46
Natural Resources Defense Council Rooftops to Rivers
90 Darla Inglis, Seattle Public Utilities’ Natural Drainage System Program(Proceedings from the National Low Impact Development Conference,College Park, Maryland, September 21-23, 2004).
91 See note 90.
92 See note 90.
93 Richard R. Horner, et al., Hydrologic Monitoring of the Seattle Ultra-Urban Stormwater Management Projects: Summary of the 2000–2003 WaterYears, University of Washington Department of Civil and EnvironmentalEngineering, Water Resources Series: Technical Report No. 181, Seattle,Washington, October 2004.
94 See note 93.
95 See note 93.
96 See note 93.
97 See note 93.
98 See note 93.
99 See note 93.
100 See note 93.
101 See note 90.
102 See note 90.
103 See note 90.
104 Seattle Public Utilities, Natural Drainage Systems Receive $100,000Award—Harvard Recognizes Innovative City Program, http://www.ci.seattle.wa.us/util/About_SPU/News/News_Releases/COS_003041.asp(accessed December 16, 2005).
105 Puget Sound Action Team, Rooftop Rainwater Harvesting, NaturalApproaches to Stormwater Management, March 2003.
106 Personal communication with Steve Moddemeyer, Senior StrategicAdvisor, Seattle Department of Planning and Development, February2005.
107 See note 106.
108 Gabriel Scheer, Sustainable Street Design: An Analysis of Best PracticesAs Seen Within the Seattle Context, (Seattle: University of Washington,2004).
109 City of Toronto, Water Services, Toronto’s Water Pollution Solution—Going for the Flow, http://www.toronto.ca/water/protecting_quality/wwfmmp/index.htm (accessed April 26, 2005).
110 Environment Canada, Remedial Action Plans (RAPs): Toronto andRegion Area of Concern, Rap Status, http://www.on.ec.gc.ca/water/raps/toronto/status_e.html (accessed May 18, 2005).
111 Environment Canada, Remedial Action Plans (RAPs): Toronto andRegion Area of Concern, General Information, http://www.on.ec.gc.ca/water/raps/toronto/intro_e.html (accessed May 18, 2005).
112 City of Toronto, Wet Weather Flow Management Policy, August 2003.
113 See note 112.
114 See note 109.
115 City of Toronto, Water Services. Water Services—Community Programfor Stormwater Management, http://www.city.toronto.on.ca/water/news/cpsm (accessed April 26, 2005).
116 City of Toronto Department of Works and Emergency Services,Stormwater Pollution: Tips on How You Can Improve Water Quality, June2000.
117 City of Toronto, Wet Weather Flow Management Master Plan: StreamRestoration and End-of-Pipe Project Summary (2003–2027).
118 City of Toronto, Restoration Projects, http://www.city.toronto.on.ca/don/restoration.htm (accessed April 26, 2005).
119 Scott Peck, “Green Roofs for Healthy Cities” (Presentation given atClimate Air Connections Workshop at Clean Air Foundation), April 2003.
120 National Research Council Institute for Research in Construction,Press Release: Government of Canada Reveals Major Greenhouse GasReductions and Air Quality Benefits from Widespread Use of ‘Green Roofs,’October 9, 2002.
121 Nicole Cohen, “Look Up, Look Way Up,” Eye Weekly, July 15, 2004,http://www.eye.net/eye/issue/issue_07.15.04/city/roofs.html(accessed January 30, 2006).
122 The Garland Company, Inc., The Green Revolution Continues onToronto, December 2003.
123 Karen Liu and John Minor, “Performance Evaluation of an ExtensiveGreen Roof” (Presentation at Green Rooftops for Sustainable Communi-ties, Washington D.C., May 2005).
124 See note 123.
125 Doug Banting, et al., Report on the Environmental Benefits and Costs ofGreen Roof Technology for the City of Toronto, City of Toronto and OntarioCentres of Excellence—Earth and Environmental Technologies, October31, 2005, http://www.toronto.ca/greenroofs/pdf/fullreport103105.pdf(accessed December 16, 2005).
126 American dollars converted from Canadian equivalent based onDecember 19, 2005, exchange rate.
127 See note 125.
128 Kimberly Pedersen, Meadows in the Sky: Contemporary Applications forEco-roofs in the Vancouver Region, (Vancouver, B.C.: University of BritishColumbia, 2001).
129 See note 128.
130 Canadian Broadcasting Corporation, Vancouver 3rd in World inQuality of Life Survey, CBC News, March 13, 2005.
131 See note 128.
132 River Works, Fraser Facts: The Importance of the Fraser River,http://www.riverworks.org/fraser.htm (accessed April 20, 2005.
133 Scott Deveau, “Street in for Crowning Touch,” The Vancouver Courier,September 22, 2004, http://www.vancourier.com/issues04/092204/news/092204nn9.html (accessed March 9, 2005).
134 Alexandra Steed, Naturalized Streetscapes: A Case Study of CrownStreet, Vancouver, Greenways—City of Vancouver.
135 Personal communication with Otto Kauffmann, Engineering ProjectCoordinator, City of Vancouver Streets Division, April 2005.
136 American dollars converted from Canadian equivalent based onApril 25, 2005, exchange rate.
137 See note 10, Chapter 4.
138 See note 11, Chapter 4.
139 Personal communication with Joanne Griffin, City of VancouverStreets Design Branch, June 2005.
140 American dollars converted from Canadian equivalent based onJune 23, 2005, exchange rate.
141 See note 135.
142 American dollars converted from Canadian equivalent based onNovember 22, 2005, exchange rate.
143 Personal communication with David Yurkovich, GreenwaysLandscape Designer, City of Vancouver Greenways Branch, April 2005.
144 Kim Davis, Green Roof Inventory: Preface Report Greater VancouverRegional District, The Greater Vancouver Regional District Policy andPlanning Department, December 12, 2002.
145 Chris Johnston, et al., Vancouver Public Library Green Roof MonitoringProject, Public Works and Government Services Canada, April 30, 2004.
146 The Hastings Park Conservancy, The Sanctuary, http://www.vcn.bc.ca/greenhp/Sanctuary.html (accessed March 28, 2005).
147 The City of Vancouver, Broad City Initiatives, http://www.city.vancouver.bc.ca/sustainability/initiatives.htm (accessed March 9, 2005).
47
Natural Resources Defense Council Rooftops to Rivers
148 Project for Public Spaces, Hastings Park, http://www.pps.org/gps/one?public_place_id=517 (accessed March 28, 2005).
149 Kerr Wood Leidal Associates Ltd., Project Profiles—Stanley Park,http://www.kwl.bc.ca/project _profiles/projects/stanleypark.htm(accessed March 29, 2005).
150 The Stanley Park Ecological Society, Frequently Asked Questions - LostLagoon, http://www.vcn.bc.ca/spes/volunteer/vol_faqs.htm (accessedApril 25, 2005).
151 See note 9, Chapter 5.
152 Barbara Deutsch, et al., Re-Greening Washington, DC: A Green RoofVision Based On Storm Water and Air Quality Benefits, Casey TreeEndowment Fund and Limno-Tech, Inc., August 24, 2005.
153 See note 12, Chapter 2.
154 District of Columbia Water and Sewer Authority, Combined SewerSystem Long Term Control Plan—Final Report, June 2002.
155 U.S. Fish and Wildlife Service, Evaluating the Health of the TidalPotomac River Watershed—Tumor Surveys in Brown Bullhead Catfish, May2000, http://www.fws.gov/chesapeakebay/pdf/BULLHEAD.PDF(accessed July 11, 2005).
156 Personal communication with Neil Weinstein, Executive Director,Low Impact Development Center, July 2005.
157 See note 152.
158 See note 154.

![[PROPOSED] CONSENT DECREE - NRDC](https://static.fdocuments.in/doc/165x107/620cff0a282b357906659994/proposed-consent-decree-nrdc.jpg)