Novartis Environmental Sustainability and Occupational ...
24
Novartis AG Novartis Environmental Sustainability and Occupational Health and Safety Data Supplement 2019
Transcript of Novartis Environmental Sustainability and Occupational ...

Novartis AG
Novartis Environmental Sustainability and Occupational Health and Safety Data Supplement 2019

Novartis Environmental Sustainability and Occupational Health and Safety Data Supplement 20192
Novartis Environmental Sustainability and Occupational Health and Safety Data Supplement 2019 Section 1 Introduction 3
Section 2 Novartis GRI content index 4
Section 3 Management approach 5
Section 4 Energy 8
Section 5 Water 11
Section 6 Emissions 14
Section 7 Waste and materials 18
Section 8 Occupational Health and Safety 21

Novartis Environmental Sustainability and Occupational Health and Safety Data Supplement 2019 3
Section 1
Introduction Environmental sustainability is important to the sustainability of our business. Our continued in-vestment in our planet supports our purpose to improve and extend people’s lives and is a way to give back to society.
We want to be a catalyst for change and a leader in environmental sustainability. We drive sustain-ability through our own operations and across our value chain, which accounts for 80% of our overall environmental footprint. Underpinned by ambitious targets, our strategy focuses on cli-mate, waste and water from a 2016 baseline.
Climate
2025 • Only renewable energy used (carbon-neutral own operations) – Scope 1 and 2
• Environmental criteria in all sup-plier contracts
2030 • Carbon footprint reduced by half – Scope 1, 2 and 3
Waste
2025 • Eliminate PVC in packaging
• Waste disposal reduced by half
2030 • Plastic neutral
• All new products meet sus tain-able design principles
Water
2025 • Water consumption reduced by half in our operations
• No water quality impacts from manufacturing effluents
2030 • Water neutral in all areas
• Enhance water quality wherever we operate
Achieving these targets will enable Novartis to become carbon neutral as well as energy and climate resilient. We will also become water sus-tainable by ensuring sufficient and safe water, and being a good water steward wherever we operate. Further becoming plastic-neutral, min-imizing waste and increasing material efficiency will support the creation of a circular economy.
Employee health and safety is an integral part of our responsibility as an employer. Novartis is committed to providing all associates and those working for the company with safe workplaces.
We have used the United Nations’ Sustainable Development Goals (SDGs) to inform our strate-gy. The SDGs are a set of 17 goals for the period 2015 to 2030 to end poverty, protect the planet and ensure prosperity for all. Achieving these goals will require a concerted effort and Novartis is keen to play its part. As a healthcare company, we have prioritized 9 SDGs where we feel we can make the biggest contribution through our environmental sustainability strategy and our fo-cus on occupational health and safety:
SDG 3 Good health and well-being
SDG 6 Clean water and sanitation
SDG 7 Affordable and clean energy
SDG 8 Decent work and economic growth
SDG 12 Responsible consumption and production
SDG 13 Climate action
SDG 14 Life below water
SDG 15 Life on land
SDG 16 Peace, justice and strong institutions
This document provides information on our strat-egy, management approach and the progress we have made against our targets.

Novartis Environmental Sustainability and Occupational Health and Safety Data Supplement 20194
Section 2
Novartis GRI content indexDisclosure number Disclosure title
UNGC principle UN SDG Page
300 – Environment
Materials
301-1 Materials used by weight or volume 8 8, 12 20
301-2 Recycled input materials used 8 8, 12 20
301-3 Reclaimed products and their packaging materials 8 8, 12 20
Energy
302-1 Energy consumption within the organization 7, 8, 9 7, 8, 12, 13 9
302-2 Energy consumption outside of the organization 8 7, 8, 12, 13 9
302-3 Energy intensity 8 7, 8, 12, 13 10
302-4 Reduction of energy consumption 7, 8, 9 7, 8, 12, 13 10
302-5 Reduction in energy requirements of products and services 8, 9 7, 8, 12, 13 10
Water
303-1 Water withdrawal by source 7, 8 6, 12 12
303-2 Water sources significantly affected by withdrawal of water 7, 8, 9 6, 12 13
303-3 Water recycled and reused 7, 8, 9 6, 12 13
Emissions
305-1 Direct (Scope 1) GHG emissions 7, 8 3, 12, 13, 14, 15 14
305-2 Energy indirect (Scope 2) GHG emissions 7, 8 3, 12, 13, 14, 15 15
305-3 Other indirect (Scope 3) GHG emissions 7, 8 3, 12, 13, 14, 15 16
305-4 GHG emissions intensity 8 13, 14, 15 16
305-5 Reduction of GHG emissions 7, 8, 9 13, 14, 15 16
305-6 Emissions of ozone-depleting substances (ODS) 7, 8, 9 3, 12 17
305-7 Nitrogen oxides (NOx), sulfur oxides (SOx), and other significant air emissions
7, 8, 9 3, 12, 14, 15 17
Effluents and Waste
306-1 Water discharge by quality and destination 7, 8, 9 3, 6, 12, 14 19
306-2 Waste by type and disposal method 7, 8 3, 6, 12 19
306-3 Significant spills 8, 9 6, 12, 14, 15 20
Environmental Compliance
307-1 Non-compliance with environmental laws and regulations 7, 8 16 20
400 – Social
Occupational Health and Safety
403-1 Workers representation in formal joint management-worker health and safety committees
8 21
403-2 Types of injury and rates of injury, occupational diseases, lost days, and absenteeism, and number of work-related fatalities
3, 8 22
403-3 Workers with high incidence or high risk of diseases related to their occupation
3, 8 24
403-4 Health and safety topics covered in formal agreements with trade unions
8 25

Novartis Environmental Sustainability and Occupational Health and Safety Data Supplement 2019 5
Section 3
Management approachAbout this report
This document aims to meet the needs and ex-pectations of Environmental Sustainability (ES) and Health and Safety (H&S) professional au-diences by offering easy access to our perfor-mance on HSE topics. Novartis reports its per-formance following Global Reporting Initiative (GRI) guidelines for sustainability reporting.
This report covers all regions and operations from January 1, 2019 to December 31, 2019 and progress against our 2016 baseline. All infor-mation reflects the continuing operations of the Novartis Group, including the various changes in the Group’s portfolio of activities in prior years.
The 2019 environmental data published in the Annual Report 2019 and in the Novartis in Society ESG Report 2019 is based on nine-month actual data (January to September 2019) plus three-month estimates. This report has been updated with actual data for the full year 2019 and the information is summarized in the HSE data fact-sheet on our website.
In addition, Novartis has been reporting compre-hensive energy, greenhouse gas (GHG) and wa-ter data via the CDP program since 2003. Our 2019 responses to CDP Climate Change and CDP Water Security can be found here.
How we report
Performance of operating units is monitored on a monthly and quarterly basis. Data is collected, validated and consolidated in the Novartis HSE Data Management System (DMS). This sys-tem provides the company with the information needed to monitor progress against our strate-gy and to take corrective actions as necessary to ensure we remain on track.
2019 data was collected from more than 160 re-porting units owned and managed by Novartis. This covers all sites with relevant impacts – in-cluding all production, formulation and research and development sites, as well as major head-quarters offices. Our H&S data reporting cov-ers all workers: Novartis associates, third-party personnel and contractors, i.e. staff who regu-larly work on a Novartis site, such as cleaning, catering, security, engineering and maintenance personnel.
Our HSE workbook provides definitions, require-ments, explanations and examples that HSE staff need to take into account in order to per-form their HSE reporting and performance man-agement functions within Novartis. De minimis criteria have been established for reporting units that do not contribute to more than 0.10% of the Novartis total. These eligible sites report H&S data but are not subject to mandatory reporting of environmental data – for these sites, water, energy and waste data is estimated based on associate numbers (Novartis associates and third-party personnel) and average assumed consumption per person and per day (averages calculated from comparable Novartis locations).
Novartis believes the performance data pre-sented in this HSE Data Supplement represents a fair and balanced picture of the company’s HSE performance. Performance indicators fol-low GRI requirements for core environmental and social indicators, and for selected additional indicators that were deem material following a materiality assessment performed in 2017 when our strategy was developed.
Managing changes to the Novartis environmental baseline
Ambitious targets for climate, water and waste reduction have been set for 2025 and 2030, against a 2016 baseline year. We adjust our baseline when the impact of an acquisition or divestment on our 2016 climate baseline is ± 5% (Scope 1 and Scope 2 carbon footprint mea-sured as tCO2e). When a change in the Scope 1 and Scope 2 carbon footprint baseline is trig-gered, the 2016 baseline for Scope 3 carbon footprint, water and waste is adjusted at the same time.
A baseline change will not be triggered when there is a ± 5% change to water or waste emis-sions. This is because the environmental signif-icance of water depends on location and the environmental significance of waste depends on its characteristics rather than the volume or amount produced.
Accordingly, all HSE performance data prior to 2019 presented in this report have been restat-ed to take into account the spin-off of the Alcon division, and to reflect continuing operations for Novartis.

Novartis Environmental Sustainability and Occupational Health and Safety Data Supplement 20196
Health, Safety and Environmental management system
We take our responsibility for environmental im-pacts seriously, and we plan to continue to do what we can to reduce or mitigate our environ-mental impacts through our ambitious envi ron-mental sustainability strategy and our climate targets, which have been approved by the Science Based Targets initiative. The Novartis Trust and Reputation Committee oversees the company’s strategy and governance on corpo-rate responsibility, which includes climate-relat-ed issues.
We have established an HSE management sys-tem defining clear roles and responsibilities within the company. Function, business unit and site leadership owns and is accountable for environmental sustainability as well as occu-pational health and safety performance within their operation(s) and location(s). Management demonstrates visible leadership by role-mod-eling HSE behaviors, appropriately prioritizing HSE programs and activities, integrating HSE considerations into strategic and operational decisionmaking and by providing compelling HSE objectives. This includes supporting strate-gies and plans, clearly defining roles and re-
sponsibilities, allocating appropriate resources, holding responsible individuals accountable for results and actively engaging in program imple-mentation.
Our internal HSE management system covers all workers (Novartis associates, third-party per-sonnel and contractors). It aligns with relevant international management system standards (e.g., ISO 14001 and OHSAS 18001) and industry guidance to drive good practice and regulatory compliance across our sites. This allows us to plan for certification, which we encourage our sites to pursue to improve transparency with stakeholders. In 2019:
• 52% of our workers at manufacturing sites worked on sites externally certified for their H&S management system (OSHA 18001 or ISO 45001 certifications)
• 62% worked on sites with a certified environ-mental management system (ISO 14001 or Eco-Management and Audit Scheme (EMAS) certification)
• 27% worked on sites with a certified energy management system (ISO 50001)
Trust and Reputation Committee (CEO Led)
Environmental Sustainability Strategy Implementation (ESSI) Steering Committee, Executive Committee Novartis (ECN) level
Glo
bal P
roje
ct
Man
agem
ent O
ffice
(PM
O) Business
ServicesTechnical
OperationsSupply Chain
Drug Development
ResearchCommercial Operations
ESS work streams aligned to Focus Areas
Climate
Waste
Water
Enablers (Procurement, Finance, People & Organization, Global Health & Corporate Responsibility & IT)
Novartis Environmental Sustainability and Occupational Health and Safety Data Supplement 2019 7
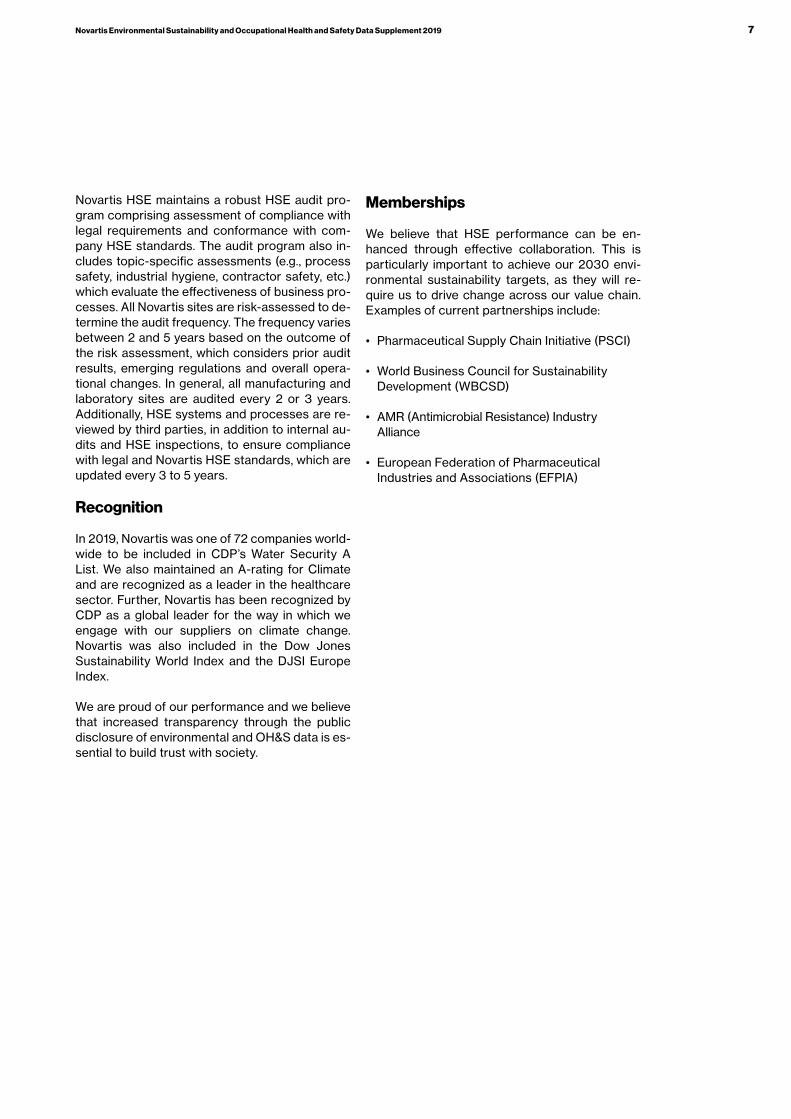
Novartis HSE maintains a robust HSE audit pro-gram comprising assessment of compliance with legal requirements and conformance with com-pany HSE standards. The audit program also in-cludes topic-specific assessments (e.g., process safety, industrial hygiene, contractor safety, etc.) which evaluate the effectiveness of business pro-cesses. All Novartis sites are risk-assessed to de-termine the audit frequency. The frequency varies between 2 and 5 years based on the outcome of the risk assessment, which considers prior audit results, emerging regulations and overall opera-tional changes. In general, all manufacturing and laboratory sites are audited every 2 or 3 years. Additionally, HSE systems and processes are re-viewed by third parties, in addition to internal au-dits and HSE inspections, to ensure compliance with legal and Novartis HSE standards, which are updated every 3 to 5 years.
Recognition
In 2019, Novartis was one of 72 companies world-wide to be included in CDP’s Water Security A List. We also maintained an A-rating for Climate and are recognized as a leader in the healthcare sector. Further, Novartis has been recognized by CDP as a global leader for the way in which we engage with our suppliers on climate change. Novartis was also included in the Dow Jones Sustainability World Index and the DJSI Europe Index.
We are proud of our performance and we believe that increased transparency through the public disclosure of environmental and OH&S data is es-sential to build trust with society.
Memberships
We believe that HSE performance can be en-hanced through effective collaboration. This is particularly important to achieve our 2030 envi-ronmental sustainability targets, as they will re-quire us to drive change across our value chain. Examples of current partnerships include:
• Pharmaceutical Supply Chain Initiative (PSCI)
• World Business Council for Sustainability De vel op ment (WBCSD)
• AMR (Antimicrobial Resistance) Industry Alliance
• European Federation of Pharmaceutical In dus tries and Associations (EFPIA)

Novartis Environmental Sustainability and Occupational Health and Safety Data Supplement 20198
Section 4
Energy Targets 2019 Achievements
2025• Only renewable energy used (carbon-neutral
own operations) – Scope 1 and 2
• Environmental criteria in all supplier contracts
2.5% reduction in total energy consumption vs. 2018
6.0% reduction in total energy consumption vs. 2016 baseline (811 173 GJ)
2030• Carbon footprint reduced by half –
Scope 1, 2 and 3
see “Emissions” section
Highlights 2019
• Active energy management systems – using data and digital to identify and implement energy efficiency opportunities – have been further embedded at key sites.
• Heating, Ventilation and Air Conditioning systems (HVAC) have been optimized across the network.
• Several waste heat recovery opportunities have been implemented.
• Sustainability assessments were conducted at a number of sites to drive immediate changes in operational procedures and long-term investments that will reduce emissions.
• A competitive bid process was started for a power purchase agreement to decarbonize all the electricity Novartis procures in Europe.
• Novartis proactively engaged in legislator education sessions at the state and national level in the US to advocate for carbon pricing, adoption of renewable energy and of zero emissions vehicles.

Novartis Environmental Sustainability and Occupational Health and Safety Data Supplement 2019 9
302-1 Energy consumption within the organization
Novartis has a longstanding, comprehensive energy program aimed at improving energy ef-ficiency for all industrial and commercial opera-tions as well as using renewable energy sources where available and feasible.
Energy consumption is reported at least quarter-ly at all Novartis sites. We monitor the purchase and use of all types of energy sources and fuels. On-site generated energy data is separated into energy generated from fossil sources (natural gas, light oil and fossil waste), biomass fuels
and renewable sources (photovoltaic, thermal solar, hydroelectric, etc.). The use of purchased energy, including electricity, steam and hot wa-ter, is calculated from the net value of all energy acquired from external sources. Energy that is generated on site but sold to other organizations is deducted from our total energy consumption. Conversion and transformation factors for fuels and for purchased energy are based on stand-ards used by the International Energy Agency (IEA). More details are available in our CDP 2019 response.
Unit: Gigajoule (GJ) 2016 2017 2018 20191
On-site generated energy 5 879 104 5 841 794 5 748 647 6 191 408
Renewable energy sources 22 602 19 526 23 740 22 871
Wood or other biomass fuels 142 822 147 800 157 515 70 799
Gas fuels 5 434 000 5 410 215 5 313 481 5 865 267
Oil fuel 136 681 134 965 124 467 84 071
Fossil waste fuel 143 000 129 287 129 444 148 400
Purchased energy 7 802 927 7 641 257 7 448 989 6 687 789
Purchased renewable electricity 1 969 554 2 008 533 2 434 367 2 160 680
Purchased non-renewable electricity 4 282 554 4 146 867 3 612 062 3 224 928
Purchased steam 1 279 078 1 247 707 1 181 183 1 089 031
Other purchased energy 271 740 238 150 221 377 213 150
Energy sold 117 533 128 598 121 017 125 872
Sold electricity 11 227 9 424 17 700 17 084
Sold steam & heat 106 306 119 174 103 317 108 788
Energy consumption 13 564 499 13 354 452 13 076 619 12 753 3261 In 2019 we started operating a Combined Heat and Power plant, leading to an increased gas fuel use but reduced electricity consumption
302-2 Energy consumption outside of the organization
We do not collect information on energy con-sumption for areas outside the organization (upstream and downstream). For the materials supply chain, we assess the carbon footprint and report this as Scope 3 GHG emissions. We
believe that climate (GHG) impact is the most relevant aspect related to energy consumption and is therefore more important to report than energy alone.

Novartis Environmental Sustainability and Occupational Health and Safety Data Supplement 201910
302-3 Energy intensity
Energy intensity is a valid indicator to support site energy managers and local management in evaluating progress made against targets and considering further measures toward high-er energy efficiency. We measure energy con-sumption in relation to sales, number of associ-ates and indoor areas conditioned for specified
types of operations. These parameters may vary widely depending of the type and portfolio of products manufactured in a certain operation, the type of application of a particular building and the climate zone where the operating unit is located.
302-4 Reduction of energy consumption
In an effort to further increase energy efficiency and reduce GHG emissions, Novartis has estab-lished a comprehensive energy management program to ensure all energy considerations are given appropriate attention in investment projects. Energy efficiency, renewable energy, updating our manufacturing technology, and greener infrastructure are all key elements of our energy strategy. New projects are a major focus for energy savings, as it is more effective to build in efficiency from the start than to re-design an existing system. In addition, all our major sites have been audited to assess energy systems and identify potential for improvement.
Since 2016, Novartis has saved 800 000 GJ of energy, which amounts to a 5.9% reduction.
302-5 Reduction in energy requirements of products and services
In general, pharmaceutical and medical prod-ucts do not require energy during use; therefore, we do not consider reduction in energy require-ments of products and services relevant for our business.
15
12
9
6
3
02016 2017 2018 2019
Energy. on-site generated (million GJ)Energy, purchased (million GJ)
7.8 7.64 7.45 6.69
5.88 5.84 5.75 6.19
350
300
250
200
150
100
50
02016 2017 2018 2019
Energy, intensity per area (GJ/100m2)Energy, intensity per sales (GJ/mio USD)Energy, intensity per associate (GJ/associate)
338 331 316 315318 315 292 269133 130 123 125
Cumulative energy savings generated from energy-savings projects (million GJ) since 2016
0.8
0.7
0.6
0.5
0.4
0.3
0.2
0.1
0.02016 2017 2018 2019
0.12 0.37 0.59 0.8

Novartis Environmental Sustainability and Occupational Health and Safety Data Supplement 2019 11
Section 5
Water Targets 2019 Achievements
2025• Water consumption reduced by half in our
operations
• No water quality impacts from manufacturing effluents
6.8% reduction in total water consumption (water discharged to treatment and water lost) vs. 2018
15.0% reduction in total water consumption (water discharged to treatment and water lost) vs. 2016 baseline (1 995 469 m3)
79% of our own manufacturing sites had no water quality impacts from manufacturing effluents. Our remaining sites and our key suppliers are working to meet this target before the end of 2025.
2030• Water neutral in all areas
• Enhance water quality wherever we operate
We initiated a first pilot on integrated watershed management to create a water-neutral loca-tion in India. The project will focus on capabil-ity-building and establishing community-based organizations to develop and maintain technical interventions that help to secure water avail-ability, e.g., collecting rainwater and recharging natural reservoirs for farmers.
We collaborated with World Resources Insti tute (WRI), Valuing Nature and Quantis to develop a method to assess the benefits of water steward ship activities (Volumetric Water Benefit Accounting).
Highlights 2019
• We remain on track to meet our 2025 water reduction target despite increased production at our biotech plants, which is driving increased water consumption.
• Environmental sustainability assessments at key sites have identified significant water-saving opportunities, which are now being implemented.
• We have published science-based targets for antibiotics from manufacturing operations in a peer reviewed journal.
• A water quality maturity tool has been piloted and rolled out at our factories and manufacturing suppliers in high-risk regions. This enables us to identify the manufacturers that require support to meet Novartis water quality standards.
• Supplier water quality expectations have been outlined in the new Novartis Third Party Code and in new contract templates.

Novartis Environmental Sustainability and Occupational Health and Safety Data Supplement 201912
303-1 Total water withdrawal by sources
Novartis makes every effort to ensure water is used efficiently and that any water released from our sites meets regulatory limits and our internal quality standards in order to protect the environment. We create a water balance for our sites by monitoring all water inputs by source and discharge by receiving environment. This methodology ensures we have an accurate pic-ture of how we use and manage water.
The water directly extracted from the environ-ment is used mainly for cooling purposes before being returned to the source. This water is pri-marily used for the cooling of fermentation and other biochemical processes, for the cooling of computer servers in data centers, and for the comfort cooling of offices. Such cooling with wa-ter allows us to reduce our energy consumption because we do not need mechanical chillers.
Unit: cubic meter (m3) 2016 2017 2018 2019
Water drawn from aquatic environment1 64 835 666 62 368 789 58 963 662 57 347 696
From aquatic environment, groundwater - - - 48 251 431
From aquatic environment, surface water - - - 9 096 265
Water collected from rain 81 550 72 575 55 276 14 452
Water purchased from external suppliers 10 882 265 10 068 094 10 401 306 9 332 525
Water from other sources 51 326 53 526 45 345 21 332
Water withdrawal 75 850 807 72 562 984 69 465 589 66 716 006
Water released directly to aquatic environment 62 438 532 60 837 464 57 897 035 55 511 939
Water discharged via treatment 11 391 471 10 889 791 10 568 927 9 883 821
Water lost (evaporated or to other destination)
1 644 076 1 314 545 1 316 432 1 196 256
Water consumption (treatment & lost)2 13 035 547 12 204 337 11 885 359 11 080 077
Water recycled and reused 19 842 575 20 997 107 16 386 164 14 709 3811 In 2019, we started to report water extraction from groundwater and from surface water separately to better
understand and map our water use.2 Our Group internal definition of “Water Consumption” is the sum of all water discharged via treatment and of
all water lost, and as such is different from CDP/GRI definitions, which would correspond to water lost in the above table. This change was made to ensure that we focus on reducing the water we use, which requires treatment before being returned to the environment.

Novartis Environmental Sustainability and Occupational Health and Safety Data Supplement 2019 13
303-2 Water sources significantly affected by withdrawal of water
Novartis has identified short-term and long-term risks related to water scarcity based on the WRI Aqueduct Tool. Locations with higher water risks have been asked to conduct assessments to manage and minimize their dependence on water.
There are no water sources significantly affected by the withdrawal of water from our operations: 14% of our total water withdrawal is supplied by local public water utilities or from other sources.
The remaining 86% is drawn from groundwater wells or from surface water bodies and used for cooling before being returned to the source, with negligible losses or variation in quality.
We have reported comprehensive water use and impact data via the CDP water program since 2010 and were scored A for Water Security in 2019. Our 2019 response to CDP Water Security can be found here.
303-3 Water recycled and reused
In 2019, Novartis recycled or reused 14.7 million m3 of water, which represents 22% of our total wa-ter withdrawal.
Water extracted from the aquatic environment (million m3)Water purchased from suppliers (million m3)
80
60
40
20
02016 2017 2018 2019
10.9 10.1 10.4 9.3
64.8 62.4 59 57.3
Water discharged via treatment (million m3)Water lost (million m3)
15
12
9
6
3
02016 2017 2018 2019
1.6 1.3 1.3 1.2
11.4 10.9 10.6 9.9

Novartis Environmental Sustainability and Occupational Health and Safety Data Supplement 201914
Section 6
EmissionsTargets 2019 Achievements
2025• Only renewable energy used (carbon-neutral
own operations) – Scope 1 and 2
• Environmental criteria in all supplier contracts
3.9% reduction in total GHG emissions from energy con sump tion (Scope 1 and 2) vs. 2018
7.7% reduction in total GHG emissions from energy consumption (Scope 1 and 2) vs. 2016 baseline (74 196 tCO2e)
2030• Carbon footprint reduced by half –
Scope 1, 2 and 3
5.0% increase in total carbon footprint (GHG emis sions from Scope 1, 2 and 3) vs. 2016 baseline (321 103 tCO2e)
Highlights 2019
• Our climate strategy was approved in 2019 by the Science Based Targets initiative, an organization that mobilizes companies to set science-based targets toward a low-
carbon economy. Our 2025 climate target is consistent with the reductions required to keep global warming to 1.5°C.
305-1 Direct (Scope 1) GHG emissions
Novartis has reported GHG emissions in accor-dance with the WRI’s and WBCSD’s Greenhouse Gas Protocol for all sites under its operational control since 2005.
The reporting structure includes Scope 1 car-bon dioxide (CO2) emissions from stationary combustion installations, production process-es and refrigeration systems, as well as Scope 1 CO2 emissions from company-owned and leased vehicles. GHG emissions are reported on a quarterly basis and calculated in metric tons of CO2 equivalent using emission factors provid-
ed by energy suppliers or factors from the IEA. Novartis uses the global warming potential fac-tors from the 2007 Intergovernmental Panel on Climate Change (IPCC) Report for GHGs other than CO2.
GHG emissions of gases unrelated to combus-tion (e.g., hydrochlorofluorocarbons) are not in-cluded in Scope 1 GHG emissions. The primary source of these emissions is loss from refrig-eration equipment. Novartis does not collect data on biogenic CO2 emissions as the potential quantities are not significant.

Novartis Environmental Sustainability and Occupational Health and Safety Data Supplement 2019 15
305-2 Energy indirect (Scope 2) GHG emissions
The reporting structure includes Scope 2 GHG emissions from purchased energy sources such as electricity, steam and other purchased ener-gy sources. We calculate Scope 2 GHG emis-sions following the location and market-based methods in accordance with the GHG Protocol Scope 2 guidance, reflecting the emissions from the electricity that a company is purchasing compared to the electricity that is generated locally.
Market-based Scope 2 GHG emissions, used in the context of our climate strategy, are calculated
using emission factors derived from energy at-tributes certificates or from contractual instru-ments with energy suppliers. Location-based Scope 2 emissions are calculated using stan-dard emission factors published by the IEA. Both are reported on a quarterly basis in met-ric tons of CO2 equivalent. In the absence of contractual agreements for the market-based method, we use location-based emission fac-tors. This approach supports our strategy to in-crease our proportion of renewable-based elec-tricity worldwide to reduce our Scope 2 GHG emissions.
Unit: metric ton of CO2 emissions equivalent (tCO2e) 2016 2017 2018 2019
GHG Scope 1 Emissions, from vehicles 129 323 140 788 146 297 128 351
GHG Scope 1 Emissions, from stationary combustion installations
320 413 318 429 321 737 343 406
GHG Scope 1 Emissions, from process sources 14 732 12 082 12 789 12 772
GHG Scope 1 Emissions 464 468 471 299 480 823 484 529
GHG Scope 2 Emissions, market-based 508 715 463 419 452 359 412 498
GHG Scope 2 Emissions, location-based 725 968 635 321 631 305 565 460
GHG forestry offsets 65 682 71 832 54 881 29 791
Total GHG Scope 1 and Scope 2 emissions (market-based)
973 182 934 718 933 182 897 027
Total GHG Scope 1 and Scope 2 emissions (market-based) from energy consumption
958 451 922 636 920 393 884 255
GHG Scope 3, Purchased goods and services 4 058 116 4 192 521 4 040 112 4 527 169
GHG Scope 3, Capital goods 566 749 434 212 390 419 418 073
GHG Scope 3, Fuel and energy related activities 274 155 270 500 265 702 247 674
GHG Scope 3, Upstream transportation and distribution 272 572 261 103 266 288 315 557
GHG Scope 3, Waste generated in operations 40 240 34 117 33 666 23 894
GHG Scope 3, Business travel 125 478 199 992 211 723 191 293
GHG Scope 3, Employee commute 149 137 150 338 155 690 148 472
GHG Scope 3, Upstream leased assets N/A N/A N/A N/A
GHG Scope 3, Downstream transportation and distribution
42 843 40 956 40 779 35 993
GHG Scope 3, Processing of sold products N/A N/A N/A N/A
GHG Scope 3, Use of sold products 124 326 111 260 134 850 142 494
GHG Scope 3, End-of-life treatment of sold products N/A N/A N/A N/A
GHG Scope 3, Downstream leased assets N/A N/A N/A N/A
GHG Scope 3, Franchises N/A N/A N/A N/A
GHG Scope 3, Investments N/A N/A N/A N/A
Total GHG Scope 3 emissions 5 653 616 5 694 999 5 539 229 6 050 619
Total GHG Scope 1, Scope 2 and Scope 3 emissions 6 626 543 6 629 717 6 472 411 6 947 646

Novartis Environmental Sustainability and Occupational Health and Safety Data Supplement 201916
305-3 Other indirect (Scope 3) GHG emissions
Scope 3 GHG emissions are estimated using an Environmental Extended Input Output Analysis.
Based on this analysis, the most significant sources of Scope 3 emissions for Novartis are “purchased goods and services” (75% of our Scope 3 emissions) and “upstream transporta-tion and distribution” (about 5% of our Scope 3 emissions). These are the most significant categories for Novartis in terms of size, reduc-tion opportunities and potential to influence.
“Capital goods” is another important category (about 7% of our Scope 3 emissions); however, the reduction opportunities and the potential to influence are limited as more than 90% of the emissions in this category are from suppli-ers who do not have a direct relationship with Novartis (e.g. Tier 2 suppliers or beyond).
For more details on our Scope 3 emissions (methods, approach and assumptions), please refer to our 2019 CDP response here.
305-4 GHG emissions intensity
We monitor GHG emissions intensity in rela-tion to sales, production quantity and number of associates for specified types of operations. These parameters may vary widely depending
of the type and portfolio of products manufac-tured in a certain operation, the type of applica-tion of a particular building and the climate zone where the operating unit is located.
305-5 Reduction of GHG emissions
Our ambition is to be carbon-neutral in our own operations and energy and climate-resilient by 2025. Our priorities are to reduce our energy de-mand by investing in efficiency and to increase our share of renewable energy. For example, all climate emissions from the electricity we use in Novartis offices and R&D facilities in the USA are now being compensated, thanks to the re-newable energy credits generated by our Santa Rita East wind farm, developed with Invenergy in Texas in 2019.
In addition, we are using carbon sequestration projects to further reduce our carbon footprint by compensating part of the GHG emissions generated by our use of fossil fuels. Our four forestry projects in Argentina, Mali, China and Colombia provide long-term benefits to the environment and to local communities. These benefits range from conserving or enhancing biodiversity to building capacity, generating em-ployment and local revenues. These forestry projects are implemented in accordance with certification schemes such as the United National Clean Development Mechanism (CDM) for the Columbia and Argentina projects.
GHG Scope 1, vehicles (ktCO2e)GHG Scope 2, market-based method (ktCO2e) GHG Scope 1, combustion & process (ktCO2e)
1000
800
600
400
200
02016 2017 2018 2019
335.1 330.5 334.5 356.2
508.7 463.4 452.4 412.5
129.3140.8 146.3 128.4
GHG Scope 2, purchased energy (ktCO2e) market based methodGHG Scope 2, purchased energy (ktCO2e) location based
method
800
700
600
500
400
300
200
100
02016 2017 2018 2019
508.7 463.4 452.4 412.5726.0 635.3 631.3 565.5
Novartis Environmental Sustainability and Occupational Health and Safety Data Supplement 2019 17
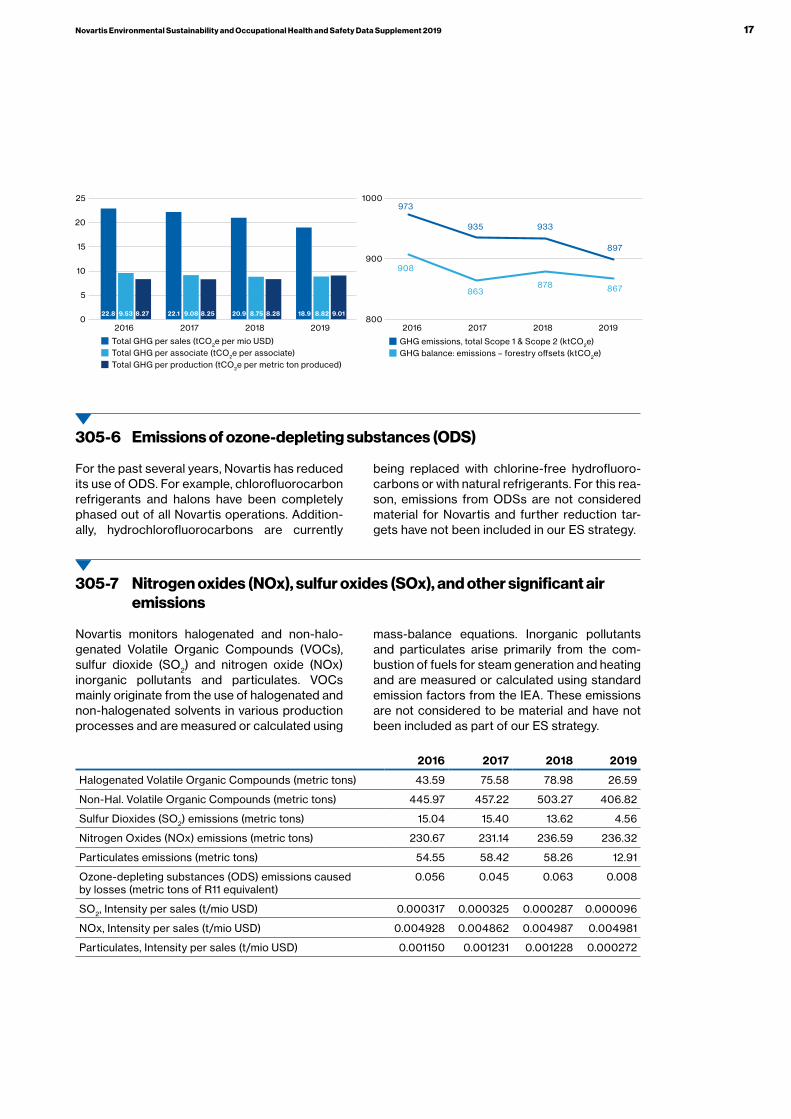
305-6 Emissions of ozone-depleting substances (ODS)
For the past several years, Novartis has reduced its use of ODS. For example, chlorofluorocarbon refrigerants and halons have been completely phased out of all Novartis operations. Addition-ally, hydrochlorofluorocarbons are currently
being replaced with chlorine-free hydrofluoro-carbons or with natural refrigerants. For this rea-son, emissions from ODSs are not considered material for Novartis and further reduction tar-gets have not been included in our ES strategy.
305-7 Nitrogen oxides (NOx), sulfur oxides (SOx), and other significant air emissions
Novartis monitors halogenated and non-halo-genated Volatile Organic Compounds (VOCs), sulfur dioxide (SO2) and nitrogen oxide (NOx) inorganic pollutants and particulates. VOCs mainly originate from the use of halogenated and non-halogenated solvents in various production processes and are measured or calculated using
mass-balance equations. Inorganic pollutants and particulates arise primarily from the com-bustion of fuels for steam generation and heating and are measured or calculated using standard emission factors from the IEA. These emissions are not considered to be material and have not been included as part of our ES strategy.
2016 2017 2018 2019
Halogenated Volatile Organic Compounds (metric tons) 43.59 75.58 78.98 26.59
Non-Hal. Volatile Organic Compounds (metric tons) 445.97 457.22 503.27 406.82
Sulfur Dioxides (SO2) emissions (metric tons) 15.04 15.40 13.62 4.56
Nitrogen Oxides (NOx) emissions (metric tons) 230.67 231.14 236.59 236.32
Particulates emissions (metric tons) 54.55 58.42 58.26 12.91
Ozone-depleting substances (ODS) emissions caused by losses (metric tons of R11 equivalent)
0.056 0.045 0.063 0.008
SO2, Intensity per sales (t/mio USD) 0.000317 0.000325 0.000287 0.000096
NOx, Intensity per sales (t/mio USD) 0.004928 0.004862 0.004987 0.004981
Particulates, Intensity per sales (t/mio USD) 0.001150 0.001231 0.001228 0.000272
Total GHG per sales (tCO2e per mio USD)Total GHG per associate (tCO2e per associate)Total GHG per production (tCO2e per metric ton produced)
25
20
15
10
5
02016 2017 2018 2019
22.8 22.1 20.9 18.99.53 9.08 8.75 8.828.27 8.25 8.28 9.01
GHG emissions, total Scope 1 & Scope 2 (ktCO2e)GHG balance: emissions – forestry offsets (ktCO2e)
1000
900
8002016 2017 2018 2019
973
908
935
863
933
878
897
867

Novartis Environmental Sustainability and Occupational Health and Safety Data Supplement 201918
Section 7
Waste and materialsTargets 2019 Achievements
2025• Eliminate polyvinyl chloride (PVC)
in pack aging
• Waste disposal reduced by half
9.6% reduction in total waste disposal (not recycled) vs. 2018
19.7% reduction in total waste disposal (not recycled) vs. 2016 baseline (13 301 metric tons)
2030• Plastic neutral
• All new products meet sustainable design principles
We used about 31 000 metric tons of plastic for primary and secondary packaging for our prod-ucts. We are currently developing a strategy to ensure we minimize our use of plastic and that the weight of any plastic packaging disposed is approximately the same as the weight recov-ered from recycling
Highlights 2019
• One additional Novartis site eliminated PVC in secondary and tertiary packaging leaving eight sites still using PVC.
• The optimization of in-house waste treatment technology (e.g., incinerators) has enabled Novartis to reduce the amount of waste sent off-site for disposal.
• Novartis launched a program to eliminate 17 types of single-use plastic across the organization.

Novartis Environmental Sustainability and Occupational Health and Safety Data Supplement 2019 19
306-1 Water discharge by quality and destination
Novartis monitors water consumption by source and water discharge by destination on a quar-terly basis. With regards to the quality of water discharged, Novartis reports total effluent load using the standard chemical oxygen demand (COD) and total suspended solids (TSS) param-eters, as well as nitrogen and phosphate loads. These releases are not considered to be materi-al and have not been included as part of our ES Strategy.
The amounts reported in the table are the pollu-tant loads that finally reach surface water bod-ies. In cases where discharged wastewater is treated off-site, for example in public wastewater treatment plants, the specific removal efficiency of such treatment is considered for the amounts reported.
Unit: metric ton (t) 2016 2017 2018 2019
Total Suspended Solids (TSS) load 360.9 358.7 238.5 198.3
Chemical Oxygen Demand (COD) load 2 761.0 2 658.9 2 051.4 1 842.3
Nitrogen load 258.6 246.5 197.0 207.5
Phosphate load 47.9 41.4 40.0 34.7
306-2 Waste by type and disposal method
Novartis classifies waste by type and accord-ing to the disposal routes: recycling, treatment, incineration with and without energy recovery, and landfill.
Our aim is to use materials as efficiently as pos-sible and to manufacture our products in a way that conserves natural resources. Our waste management approach is based on the princi-ples of prevention, reuse, recycling, and energy
recovery as opposed to disposal and landfilling. Ultimately, we aspire to establish closed mate-rial loops for our major materials. By reducing the amount of waste we generate and decreas-ing the associated financial burdens on both site-operating budgets and long-term company liabilities, we will be able to invest more in sci-ence and innovation.
Total non-hazardous waste (1 000 t)Total hazardous waste (1 000 t)
120
100
80
60
40
20
02016 2017 2018 2019
104.1 102.8 104.9 100.070.6 68.1 69.7 70.6
Hazardous waste disposal, not recycled (1 000 t)Non-hazardous waste disposal, not recycled (1 000 t)
80
70
60
50
40
30
20
10
02016 2017 2018 2019
53.6 48.1 47.3 41.2
13.912.7 12.6
12.9

Novartis Environmental Sustainability and Occupational Health and Safety Data Supplement 201920
Unit: metric ton (t) 2016 2017 2018 2019
Hazardous waste, recycling 50 505 54 711 57 545 58 751
Hazardous waste, treatment 4 366 4 943 4 519 3 985
Hazardous waste, incineration 49 206 43 129 42 789 37 249
Hazardous waste, landfill 0 0 0 0
Recycling percentage hazardous waste 48.5 % 53.2 % 54.9 % 58.8 %
Non-hazardous waste, recycling 56 739 55 367 57 167 57 720
Non-hazardous waste, treatment 600 290 226 404
Non-hazardous waste, incineration 9 166 8 686 8 135 8 428
Non-hazardous waste, landfill 4 110 3 742 4 196 4 081
Recycling percentage non-hazardous waste 80.4 % 81.3 % 82.0 % 81.7 %
Waste disposal (total waste not recycled) 67 448 60 791 59 866 54 147
Waste disposal, intensity per sales (t/mio USD) 1.58 1.44 1.34 1.14
306-3 Significant spills
No significant spills (resulting in liabilities) were reported in 2019.
307-1 Non-compliance with environmental laws and regulations
In 2019, no significant environmental fines were reported (less than USD 10 000).
301 Materials
To support our ambition to eliminate PVC in all packaging and reduce waste disposal by 50% (vs. 2016) by 2025, we continue to increase ma-terial efficiency. We collect data on our use of raw materials but we do not report on material types, their sources or the percentage of renew-able content because several thousands of ma-terials are involved.
We do our best to use recycled materials wher-ever possible. We favor raw materials with a re-
duced environmental footprint (i.e. materials that are less hazardous or that generate less envi-ronmental impact during production) and favor materials from renewable sources if technically feasible and economically viable. For instance, the majority of the solvents we use are input materials we recycle within our operations for reuse; the rest is recycled by contractors for third-party users.
Hazardous waste recyclingHazardous waste treatmentHazardous waste incinerationHazardous waste landfill (0%)
58.8 %
4 %
37.3 %
Non-hazardous waste recyclingNon-hazardous waste treatmentNon-hazardous waste incinerationNon-hazardous waste landfill
81.7 %
0.6 %11.9 %
5.8 %
Novartis Environmental Sustainability and Occupational Health and Safety Data Supplement 2019 21
Section 8
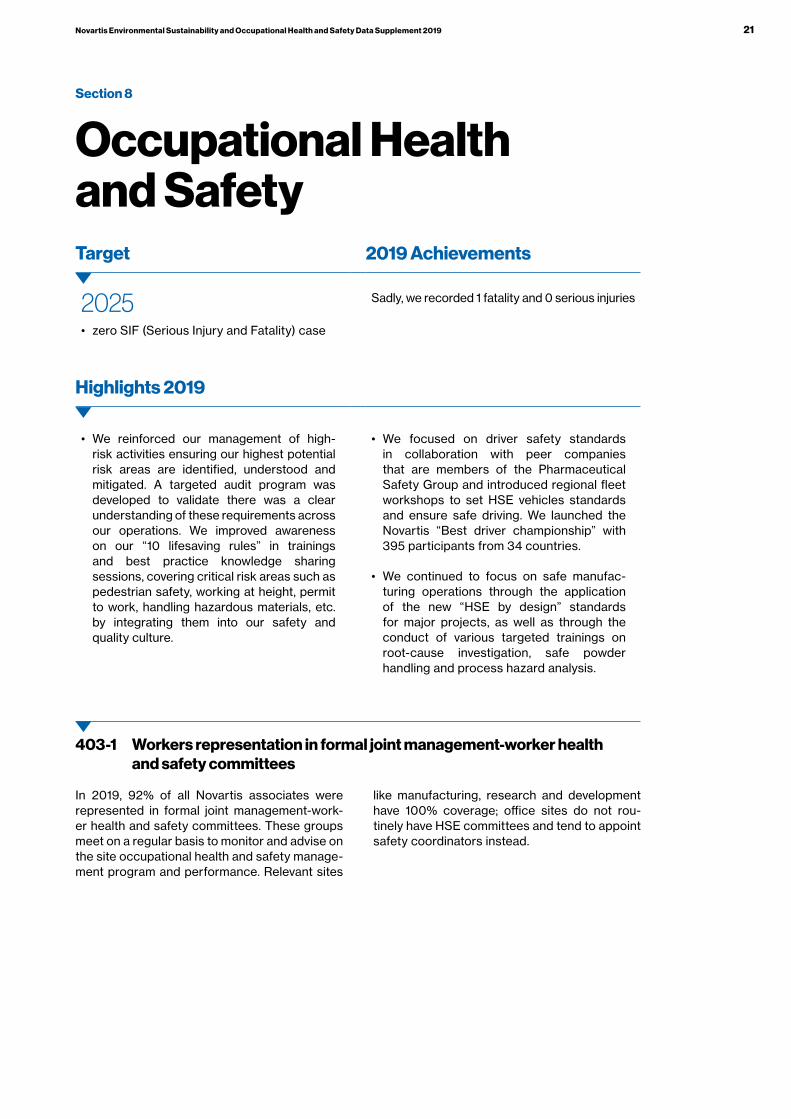
Occupational Health and SafetyTarget 2019 Achievements
2025• zero SIF (Serious Injury and Fatality) case
Sadly, we recorded 1 fatality and 0 serious injuries
Highlights 2019
• We reinforced our management of high-risk activities ensuring our highest potential risk areas are identified, understood and mitigated. A targeted audit program was developed to validate there was a clear understanding of these requirements across our operations. We improved awareness on our “10 lifesaving rules” in trainings and best practice knowledge sharing sessions, covering critical risk areas such as pedestrian safety, working at height, permit to work, handling hazardous materials, etc. by integrating them into our safety and quality culture.
• We focused on driver safety standards in collaboration with peer companies that are members of the Pharmaceutical Safety Group and introduced regional fleet workshops to set HSE vehicles standards and ensure safe driving. We launched the Novartis “Best driver championship” with 395 participants from 34 countries.
• We continued to focus on safe manu fac-turing operations through the application of the new “HSE by design” standards for major projects, as well as through the conduct of various targeted trainings on root-cause investigation, safe powder handling and process hazard analysis.
403-1 Workers representation in formal joint management-worker health and safety committees
In 2019, 92% of all Novartis associates were represented in formal joint management-work-er health and safety committees. These groups meet on a regular basis to monitor and advise on the site occupational health and safety manage-ment program and performance. Relevant sites
like manufacturing, research and development have 100% coverage; office sites do not rou-tinely have HSE committees and tend to appoint safety coordinators instead.

Novartis Environmental Sustainability and Occupational Health and Safety Data Supplement 201922
403-2 Types of injury and rates of injury, occupational diseases, lost days, and absenteeism, and number of work-related fatalities
Novartis is committed to providing all workers with a safe workplace. We continuously seek innovative, sustainable strategies and systems to strengthen our commitment to occupational health and safety, and we proactively foster and encourage a culture of safe behavior and on-site health promotion.
Novartis reports work-related injuries and illnesses for company associates, third-party personnel (TPP) and contractors from all our sites and operations around the world. We in-clude associates and TPP cases into two key performance indicators calculated per 200 000 hours worked: Lost-Time Injury and Illness Rate (LTIR) and Total Recordable Case Rate (TRCR). These indicators enable to compare the perfor-mance of units and the performance of coun-tries. The TRCR includes work-related injuries with or without lost time, work-related illness
with or without lost time, work-related loss of consciousness and work-related fatality. The LTIR only includes work-related cases with lost time.
Beyond Novartis associates and TPP, we recog-nize our responsibility to promote the health and safety of contractors. Contractors are individu-als employed by companies undertaking work for Novartis within the terms of a service agree-ment. In contrast with TPP, contractors receive day-to-day work assignments from their com-panies’ management and are hired to complete a job on their own. Novartis only reports health and safety data from contractors who regularly work at a Novartis site, such as cleaning, cater-ing, security, engineering and maintenance per-sonnel. These contractors, known as “fixed” or “nested” contractors, work a minimum of one month per year for Novartis.
2016 2017 2018 2019
Lost Time Injury and Illness Rate (LTIR, per 200 000 hours worked)1 0.08 0.12 0.16 0.18
Total Recordable Case Rate (TRCR, per 200 000 hours worked)1,2 0.31 0.37 0.39 0.36
Associates Serious Injury and Fatality cases 1 1† 2 1†
TPP Serious Injury and Fatality cases 1 0 0 0
Contractors Serious Injury and Fatality cases 2 0 1 0
1 Data includes Novartis associates and third party personnel managed by Novartis associates2 Includes all work-related injury and illness, whether leading to lost time or not† Indicates a fatal case
In 2017, Novartis HSE discontinued the LTIR and TRCR targets to focus on the prevention of Serious Incidents and Fatalities (SIF) by im-plementing a comprehensive program that tar-gets high-risk activities and by sharing lessons learned across the organization. A SIF case is defined as a work-related incident that results
in a serious injury or even death. Reporting of SIF and SIF potential cases is an integral part of our HSE plan. In 2019, we recorded 0 serious injuries and sadly 1 fatal car accident.

Novartis Environmental Sustainability and Occupational Health and Safety Data Supplement 2019 23
Rigorous technical standards, reinforced by en-gineering solutions, ensure that workplaces are safe for Novartis associates as well as third-par-ty personnel and contractors. The REEP pro-gram (Risk based Evaluation of Exposure Pro-cess) is a methodical approach to evaluate, mitigate and document all exposure risks from hazardous substances across our operations. We expect to complete this program by 2020. In addition, our occupational medicine department delivers programs to maintain health, reduce
absenteeism, and enhance associates’ ability to return to work after injury or illness. A significant number of sites have introduced safety culture initiatives to complement existing measures for continuous improvement of safety management at sites. Local management teams undertake a number of measures to promote safety aware-ness, including on-site walkthrough inspections by senior managers with a focus on the man-agement of high-risk activities, associated risk exposures and their safety controls.
2019
Novartis Associates
LTIR Novartis associates 0.18
TRCR Novartis associates 0.36
Hours worked by Novartis associates 207 902 534 h
Novartis associates work-related fatalities 1
Number of work-related injuries without lost time 180
Number of work-related injuries with lost time 183
Injury lost time 2 449 d
Number of work-related illnesses without lost time 10
Number of work-related illnesses with lost time 2
Illness lost time 60 d
2019
Third Party Personnel TPP
LTIR TPP 0.22
TRCR TPP 0.35
Hours worked by TPP 17 947 158 h
TPP work-related injuries without lost time
11
TPP work-related injuries with lost time
20
TPP work-related illnesses without lost time
0
TPP work-related illnesses with lost time
0
TPP work-related fatalities 0
2019
Contractors
LTIR Contractors 0.34
TRCR Contractors 0.49
Hours worked by Contractors 33 213 418 h
Contractor work-related injuries without lost time
25
Contractor work-related injuries with lost time
56
Contractor work-related illnesses without lost time
0
Contractor work-related illnesses with lost time
0
Contractor work-related fatalities 0

Novartis Environmental Sustainability and Occupational Health and Safety Data Supplement 201924
403-3 Workers with high incidence or high risk of diseases related to their occupation
We take a precautionary approach to minimizing health and safety hazards as well as environ-mental impacts across our operations. HSE as-pects and hazards are identified for relevant op-erations and activities through targeted analysis, inspections or studies that take into account the business context and the local environment; or are identified through incident and near-miss re-porting. HSE risks are assessed taking into ac-counts credible worst-case impacts and consid-ering potential frequency, severity and the level of risk control. They are managed proactively through appropriate preventive and contingency measures to ensure safe operations.
HSE competence and qualifications for po-sitions with HSE responsibilities are ensured through appropriate recruitment, training and development. We deliver regular HSE training to staff to embed good HSE practices, e.g., with our “10 lifesaving rules” to reinforce our safety and quality culture. Every associate can report an incident or near-miss using our internal re-
porting platform – all entries are reviewed by an HSE professional to ensure appropriate re-sponse and sharing of lessons learned.
We provide our workers with safe working con-ditions, and strive to protect them from poten-tial health hazards and injuries. Where hazards cannot be completely controlled, Personal pro-tective equipment is provided with appropriate training on its use. Medical surveillance pro-grams are in place when associates are at risk of exposure to certain hazards such as noise. All Novartis associates and third-party personnel are trained and expected to adhere to the health and safety requirements outlined in the Novartis Code of Conduct and the Novartis Global HSE Policy. In addition, contractors are in scope of our Serious Injury and Fatality prevention pro-gram. They are selected and evaluated on their safety performance, and we have an operating guideline on contractor safety management which is integrated into selection and contract activities.
403-4 Health and safety topics covered in formal agreements with trade unions
Clinics are established on Novartis sites where there is clear value to do so, focusing on qual-ity, reliability and efficiency of services. Legal requirements, size, headcount, operations and risks (including emergency responses) as well as additional business needs are assessed in the process. They provide convenient medical services to workers and support HSE teams with job hazard analysis and workplace health risk as-sessments. In addition, they support the reduc-tion of sickness absence and staff turnover, and increase associate satisfaction by contributing to a healthy, safe and attractive work experience.
Our health promotion focus includes healthy liv-ing and screening activities, as well as support to associates within our affiliates who suffer from chronic illnesses. Novartis believes it is impor-tant to ensure active care management, which includes providing support to associates so they can return to work and perform in an environ-ment that enables them to contribute optimally after an absence due to an illness or injury. In addition, Novartis locations are asked to provide their associates with access to an Employee Assistance Program (EAP) offering psychologi-cal, social, legal and financial support services. In many locations – through the EAP or other ser-vices – we offer independent counseling ser vices and helplines to support associates in coping with stress, depression and anxiety.