
NOV. 2012 GLOBAL ECONOMICS & CAPITAL … ECONOMICS & CAPITAL MARKET COMMENTARY ... the consequence...
12
GLOBAL ECONOMICS & CAPITAL MARKET COMMENTARY www.winslowevanscrocker.com ::: [email protected] ::: (800) 556-8600 Member FINRA/NYSE Arca/SIPC • Accounts are carried by Pershing, LLC, Member FINRA/NYSE/SIPC The information contained herein, including any expression of opinion, has been obtained from, or is based upon, sources believed to be reliable, but is not guaranteed as to accuracy or completeness. This is not intended to be an offer to buy or sell or a solicitation of an offer to buy or sell the securities, if any referred to herein. Women Business Enterprise (WBE) certified through Supplier Diversity Office FKA: SOMWBA GLOBAL ECONOMICS Douglas E. White, CFA Chief Investment Officer Sr. Vice President (617) 896-3518 [email protected] Rand Folta, CFA Executive Vice President (617) 896-3590 [email protected] INSTITUTIONAL TRADING Fixed Income Nomi Caperton Managing Director (617) 896-3526 [email protected] David Strimaitis Managing Director (617) 896-3577 [email protected] Equity John Bridges Managing Director (617) 896-3524 [email protected] William Kleinfeld Managing Director (617) 297-2155 [email protected] SETTLEMENT AND TRADING OASYS: WYNS MPID: WYNS DTC: 0443 Clearing: Pershing, LLC. WINSLOW, EVANS & CROCKER 175 Federal Street, 6th Floor Boston, MA 02110 Phone: (617) 896-3500 Member: ARCA/FINRA/SIPC 1 NOV. 2012 Overview In this commentary, there are three themes that I want to review and reinforce today and which I consider to be fundamental to our continued bullish bias for equities: I. The near term reduction of tail risk, or non-economic event risk, the consequence of pro active OECD central bank moves in combination with Emerging Market fiscal and mon- etary policy easing. II. The “coiled spring” effect caused by the dramatic level of capital underinvestment by US corporations which, we be- lieve, will soon lead to a flood of corporate spending. III. The growing signs of economic “Green Shoots” in China which, in the short term, will ease fears of further global weakening. Also, if managed properly, China’s monetary and fiscal policy decisions could help ease the inevitable but difficult transition from an investment-led to a consumer-led economy. As we examine the time series data that underscore these themes we will also point out, as we have done all this year, the unusual “gaps” that have opened up between series of data that normally closely correlate. These “gaps” can provide insights for thematic investment opportunities.
-
Upload
truongcong -
Category
Documents
-
view
215 -
download
3
Transcript of NOV. 2012 GLOBAL ECONOMICS & CAPITAL … ECONOMICS & CAPITAL MARKET COMMENTARY ... the consequence...
GLOBAL ECONOMICS & CAPITAL MARKET COMMENTARY
www.winslowevanscrocker.com ::: [email protected] ::: (800) 556-8600Member FINRA/NYSE Arca/SIPC • Accounts are carried by Pershing, LLC, Member FINRA/NYSE/SIPC
The information contained herein, including any expression of opinion, has been obtained from, or is based upon, sources believed to be reliable, but is not guaranteed as to accuracy or completeness. This is not intended to be an offer to buy or sell or a solicitation of an offer to buy or sell the securities, if any referred to herein.
Women Business Enterprise (WBE) certified through Supplier Diversity Office FKA: SOMWBA
Global EconomicsDouglas E. White, CFA Chief Investment OfficerSr. Vice President (617) 896-3518 [email protected] Folta, CFAExecutive Vice President (617) 896-3590 [email protected]
insTiTUTional TRaDinGFixed IncomeNomi CapertonManaging Director(617) 896-3526 [email protected] Strimaitis Managing Director (617) 896-3577 [email protected]
Equity John Bridges Managing Director (617) 896-3524 [email protected] KleinfeldManaging Director(617) 297-2155 [email protected]
sETTlEmEnT anD TRaDinGOASYS: WYNSMPID: WYNSDTC: 0443Clearing: Pershing, LLC.
WinsloW, Evans & cRockER175 Federal Street, 6th FloorBoston, MA 02110Phone: (617) 896-3500Member: ARCA/FINRA/SIPC
1
NOV. 2012
OverviewIn this commentary, there are three themes that I want to review and reinforce today and which I consider to be fundamental to our continued bullish bias for equities:
I. The near term reduction of tail risk, or non-economic event risk, the consequence of pro active OECD central bank moves in combination with Emerging Market fiscal and mon-etary policy easing.
II. The “coiled spring” effect caused by the dramatic level of capital underinvestment by US corporations which, we be-lieve, will soon lead to a flood of corporate spending.
III. The growing signs of economic “Green Shoots” in China which, in the short term, will ease fears of further global weakening. Also, if managed properly, China’s monetary and fiscal policy decisions could help ease the inevitable but difficult transition from an investment-led to a consumer-led economy.
As we examine the time series data that underscore these themes we will also point out, as we have done all this year, the unusual “gaps” that have opened up between series of data that normally closely correlate. These “gaps” can provide insights for thematic investment opportunities.

www.winslowevanscrocker.com ::: [email protected] ::: (800) 556-8600
GLOBAL ECONOMIC COMMENTARY NOV. 2012
2
CHARTS 1-4. Chart #1 represents the relative value between the S&P500 forward earnings yield to the 10 Year US Treasury. Based on this metric, the markets continue to remain very inexpensive relative to fixed income. At this point in time, however, the risk that appears to keep this valuation gap from closing seems to rest primarily with the outlook for corporate earnings and revenues rather than non-economic tail events. In Chart #2 you can see that the weekly and monthly financial stress indexes, a measure of non-economic tail risks, are at post recession lows. Looking at one of the components of the stress indexes, the 2 Year Swap Spreads in Chart #3, you can see that for both the US and Europe, they con-tinue to tighten. Chart #4 underscores an unusual divergence between the US Swap Spread levels, in red, and the volatility indicator for the S&P500, the VIX, in blue. This divergence, we believe, highlights that the market concern is being driven by worries about corporate earnings and revenues rather than tail risk events. The presence of this divergence is often a good buying opportunity.
1
3
2
4

www.winslowevanscrocker.com ::: [email protected] ::: (800) 556-8600
GLOBAL ECONOMIC COMMENTARY NOV. 2012
3
CHARTS 5-7. A similar diver-gence that reinforces this theme can be seen between the 2 Year Swap Spreads and the CBOE Put/Call ratio in Chart #5. In Chart #6 we have plotted the US 2 Year Swap Spreads against the S&P500 going back 25 years and, as you can see in the yellow circles, whenever the spreads have been persistently low the market has followed with a strong, multi-year run. Currently, the 2 Year Swap Spreads are at their lowest level in this 25 year time span. Another indicator of where the market currently resides in a traditional cycle can be seen in Chart #7 where we have plotted a liquidity ratio (money of zero maturity + money market funds/market cap) against the mar-ket. You can see that this ratio, in blue, moves in the oppo-site direction of the markets. Although not at a peak, this ratio, highlighted in the yellow circle, is currently very elevated and, we believe, indicating that at the very worst the markets are not about to enter a severe correction.
5
6
7

www.winslowevanscrocker.com ::: [email protected] ::: (800) 556-8600
GLOBAL ECONOMIC COMMENTARY NOV. 2012
4
CHARTS 8-11. There remain, however, some serious short term concerns over corporate earnings and, in particular, revenues. As can be seen on the top half of Charts #8 and #9, the 12 month for-ward earnings and revenue estimates have been declining. The bottom half of both charts shows that although revisions remain negative, they are much less negative than a few month back. With head-lines dominated by concerns over the US fiscal cliff, the growing recession in Europe and declining Chinese economic growth CEO’s have been aggressively reducing their forward looking guidance. In Chart #10 the blue line shows the negative to positive ratio for earnings guidance back on the 23rd of October as being approximately 4:1 (left hand scale). Since then that ratio has exploded to a record high of over 4.8:1, the weakest showing since 2001, as seen in Chart #11. Because there is a fairly meaningful correlation to trailing S&P500 earnings this implies a risk of continued near term negative revisions.
8
10
9
11

www.winslowevanscrocker.com ::: [email protected] ::: (800) 556-8600
GLOBAL ECONOMIC COMMENTARY NOV. 2012
5
CHART 12. On a more bullish note, however, there is also a very strong correlation between S&P500 forward earnings and the NIPA profits account as shown on Chart #12. This is a bottoms-up versus top-down comparison and is, longer term, bullish for S&P500 earnings.
CHART 13. There is also a strong correlation between the year over year % growth in S&P500 earnings to the ISM Manufacturing New Orders survey as shown in Chart #13. After having spent the July through August months below the expansion threshold of 50, it has since bounced back nicely in the past two months to 52.3 and 54.2. This correlation is also very strong with a lead time of approximately 6 months. If our scenario of a strong pick up in corporate spending should unfold next year this will obvi-ously be bullish for earnings.
12
13

www.winslowevanscrocker.com ::: [email protected] ::: (800) 556-8600
GLOBAL ECONOMIC COMMENTARY NOV. 2012
6
CHARTS 14-16. The collapse in corporate capital investing can be seen in Chart #14 which shows the % YoY change, in blue, of durable goods orders (ex defense and aircraft) along with shipments, in orange. What leads to the notion that there is a high level of pent up demand can be illustrated on Charts #15 and #16 where you can see that the gap between corporate prof-its and durable goods orders has never been wider; that corporate free cash flow (Chart #16) is near record highs; and, that corporate leverage is near record lows.
14
15
16

www.winslowevanscrocker.com ::: [email protected] ::: (800) 556-8600
GLOBAL ECONOMIC COMMENTARY NOV. 2012
7
CHARTS 17-20. This gap is also illustrated by the disconnect between capital investment after de-preciation and capacity utilization in Chart #17. The time period since 2008 is the only one on record where net fixed investments have been negative. Much of the reason for this can be seen in the busi-ness sentiment indicators, Chart #18, which has been in a free fall for most of 2012. It is interesting to note, though, that the relative performance of cyclical stocks, which should be a major beneficiary of increased capital spending, has bottomed as the US economic surprise index has moved into positive territory, Chart #19. Chart #20 summarizes some of the early cyclical industries that should benefit from an increase in corporate spending.
17
19
18
20

www.winslowevanscrocker.com ::: [email protected] ::: (800) 556-8600
GLOBAL ECONOMIC COMMENTARY NOV. 2012
8
CHARTS 21-23. Before moving on to China it is worth observ-ing that many of the leading indicators that we have been following for the housing market over the past year continue to reach new post recession highs, a sharp contrast to the capital expenditure picture, and point to further strengthening. The prospective buyer index, in blue on Chart #21, has reached highs last seen in 2006 and points to growing strength in new home sales (orange line). The National Association of Home Builders Index (NAHB) is back to 2007 levels, Chart #22, and also points to contin-ued strength in housing starts which, as seen in last month’s data, were 100,000 better than expected at 872,000. This bull-ishness is buttressed by a five year high for the banker’s sur-vey on Chart #23.
21
22
23
www.winslowevanscrocker.com ::: [email protected] ::: (800) 556-8600
GLOBAL ECONOMIC COMMENTARY NOV. 2012
9
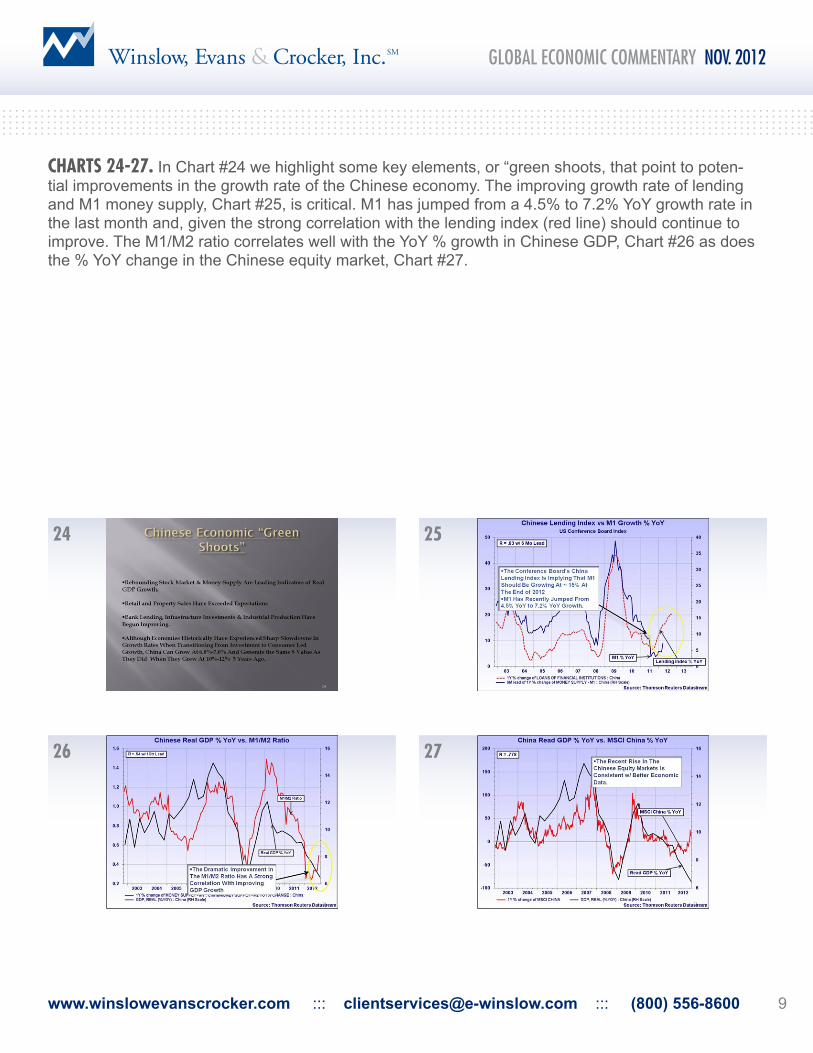
CHARTS 24-27. In Chart #24 we highlight some key elements, or “green shoots, that point to poten-tial improvements in the growth rate of the Chinese economy. The improving growth rate of lending and M1 money supply, Chart #25, is critical. M1 has jumped from a 4.5% to 7.2% YoY growth rate in the last month and, given the strong correlation with the lending index (red line) should continue to improve. The M1/M2 ratio correlates well with the YoY % growth in Chinese GDP, Chart #26 as does the % YoY change in the Chinese equity market, Chart #27.
24
26
25
27

www.winslowevanscrocker.com ::: [email protected] ::: (800) 556-8600
GLOBAL ECONOMIC COMMENTARY NOV. 2012
10
CHARTS 28-29. Both of these indicators imply a bottoming in the GDP growth rates. The strongest correlation, however, can be found in the relative performance of the Chinese equity markets to world markets and GDP growth shown in Charts #28 and #29. The strong relative outperformance over the past several months implies stronger GDP growth over the next few quarters.
28
29

www.winslowevanscrocker.com ::: [email protected] ::: (800) 556-8600
GLOBAL ECONOMIC COMMENTARY NOV. 2012
11
CHARTS 30-33. The traditional leading economic indicators put out by the US Conference Board, Chart #30, appear to have recently troughed as Chinese GDP came in at 2.2% on a month/month basis which was 0.2% better than expectations. The LEI data put out by the Chinese National Bureau of Statistics, Chart #31, also appears to have bottomed and, over the past three years, has had a very strong correlation to GDP growth. One caveat, however, is that this indicator has not had a good record over longer periods. On Chart #32 are a couple of individual indicators that we follow that also appear to have troughed, electricity production and rail freight volume with the latter having recently turned back up. Export orders in September, Chart #33, were unexpectedly strong while the surveys for new export orders, both NBS and HSBC/Markit, while remaining below 50, have turned back up.
30
32
31
33

www.winslowevanscrocker.com ::: [email protected] ::: (800) 556-8600
GLOBAL ECONOMIC COMMENTARY NOV. 2012
12
CHARTS 34-36. Retail sales at 14.2% YoY were above expec-tations, Chart # 34 and, most importantly, the New Orders Survey from both NBS and HSBC/Markit have returned or exceeded the 50 level, Chart #35. Finally, the Chinese Economic Surprise Index has recently turned positive, Chart #36 orange line, which also correlates well with the relative performance of Chinese equi-ties to world markets.
In summary, synchronized action by the world’s central banks in combination with loos-ening emerging market fiscal policy appears to have reduced tail risk events as indicated by the financial stress indices. The historic capital underinvest-ment by US businesses during a period of record high levels of corporate profits and liquidity set up the potential for a strong period of corporate spend-ing next year which should re-invigorate earnings growth. Finally, the concerns reflected in the declining sentiment surveys, China’s growth issues for exam-ple, appear to be bottoming out and resolving themselves more quickly than had been anticipat-ed as indicated by the positive turn in the various economic surprise indices.
34
35
36