NOTES ABOUT COMPANIES’ CONTRIBUTION TO THE … Futuro_Companies contribution... · Some members...
20
INSTITUCIÓN FUTURO | C/ Pérez Goyena 30. 31620 Huarte (Navarra) Spain | T +34 948 337 900 | [email protected] | www.ifuturo.org Some members of society have had traditionally a bad image of businessmen and businesses. Nowadays, this negative perception is still extended among many of them. This belief has been forged with the contribution of many different agents such as humourists like Chumy Chumez, Quino or Forges who showed businessmen as humans dressed up in suits with top hats and smoking big cigars, only worried about making more money. In fact, everyone can realise that this stereotyped cartoon is far away from reality. If you take a look to the country’s reality, 93% of the companies have less than 10 employees so that image of a person who is obsessed with profits and does not care about employees not fit the businessman prototype. As the economic crisis has led to a higher level of unemployment, society has started to be aware of the importance of companies in creating new jobs although many people insist on using the term entrepreneur rather than businessman because of its negative connotations. Furthermore, while in Europe every country intends to promote a skill called entrepreneurial spirit among students, in Spain it has been changed for autonomy and personal initiative. This brief summary done by Institución Futuro tries to cast some light about citizens’ opinion about companies as well as the benefits of their contributions to society always backed up by data. In order to avoid all kind of demagogy, official statistics have been used from a variety of sources like OECD, Eurostat, the Spanish Tax Agency, the National Institute of Statistics… always making comparisons between Spain and other countries around it. In this edition: 1 Business influence in Society: citizen’s opinion 2 What are private businesses contributions to society? 2. 1. Social security contributions gross and net wages 2.2. Other Taxes 2.3. Worker Training Investment 2.4. Sponsorship investment 3 Conclusion NOTES ABOUT COMPANIES’ CONTRIBUTION TO THE ECONOMY: AN INTERNATIONAL COMPARISON INSTITUCIÓN FUTURO BRIEFINGS | OCTOBER 2013 INSTITUCIÓN FUTURO is an independent non-profit organization that designs and promotes a better future for the social society in Navarre through the development of its companies. We analyze public policies and present innovative proposals and ideas through our networks, research reports and activities to those agents who are able to implement them. 0. Introduction
Transcript of NOTES ABOUT COMPANIES’ CONTRIBUTION TO THE … Futuro_Companies contribution... · Some members...

INSTITUCIÓN FUTURO | C/ Pérez Goyena 30. 31620 Huarte (Navarra) Spain | T +34 948 337 900 | [email protected] | www.ifuturo.org
Some members of society have had traditionally a bad image of businessmen and businesses. Nowadays, this negative perception is still extended among many of them. This belief has been forged with the contribution of many different agents such as humourists like Chumy Chumez, Quino or Forges who showed businessmen as humans dressed up in suits with top hats and smoking big cigars, only worried about making more money.
In fact, everyone can realise that this stereotyped cartoon is far away from reality. If you take a look to the country’s reality, 93% of the companies have less than 10 employees so that image of a person who is obsessed with profits and does not care about employees not fit the businessman prototype. As the economic crisis has led to a higher level of unemployment, society has started to be aware of the importance of companies in creating new jobs although many people insist on using the term entrepreneur rather than businessman because of its negative connotations. Furthermore, while in Europe every country intends to promote a skill called entrepreneurial spirit among students, in Spain it has been changed for autonomy and personal initiative. This brief summary done by Institución Futuro tries to cast some light about citizens’ opinion about companies as well as the benefits of their contributions to society always backed up by data. In order to avoid all kind of demagogy, official statistics have been used from a variety of sources like OECD, Eurostat, the Spanish Tax Agency, the National Institute of Statistics… always making comparisons between Spain and other countries around it.
In this edition: 1 Business influence in Society:
citizen’s opinion
2 What are private businesses
contributions to society?
2. 1. Social security contributions
gross and net wages
2.2. Other Taxes
2.3. Worker Training Investment
2.4. Sponsorship investment
3 Conclusion
NOTES ABOUT COMPANIES’ CONTRIBUTION TO THE ECONOMY: AN INTERNATIONAL COMPARISON
INSTITUCIÓN FUTURO BRIEFINGS | OCTOBER 2013
INSTITUCIÓN FUTURO is an independent non-profit organization that designs and promotes a better future for the social society in Navarre through the development of its companies. We analyze public policies and present innovative proposals and ideas through our networks, research reports and activities to those agents who are able to implement them.
0. Introduction

INSTITUCIÓN FUTURO | C/ Pérez Goyena 30. 31620 Huarte (Navarra) Spain | T +34 948 337 900 | [email protected] | www.ifuturo.org
PAGE 2 NOTES ABOUT COMPANIES’ CONTRIBUTION TO THE ECONOMY
43% of Spanish citizens think businesses generate negative effects.
1. Business influence in society: citizens' opinion
As it has been previously mentioned, some members of society have a bad image of companies and this fact can be inferred from different specific actions that can be seen on a daily basis. The questions that have to be answered are: how negative this image is and what it is the percentage of the whole population with that opinion. In order to respond to them, data from the Flash Eurobarometer 363 made by the European Commission have been analysed. In that survey citizens were asked about their opinions according to different aspects of the influence of businesses in society. In the next few pages, main results are shown.
When Spanish citizens are asked if in general terms businesses have positive or negative effects in society, 43% of them answered they have negative ones.

INSTITUCIÓN FUTURO | C/ Pérez Goyena 30. 31620 Huarte (Navarra) | T 948 337 900 | [email protected] | www.ifuturo.org
PAGE 3 NOTES ABOUT COMPANY’S CONTRIBUTION TO THE ECONOMY
Asked about the main positive effects generated by businesses, results are as shown: only 55% of Spanish citizens mentioned job creation as a positive effect, something shocking if we take under consideration the current crisis and the 6 million unemployed. 27% think businesses contribute to economic growth and astonishingly only 21% of them mentioned tax contributions as a positive effect. Only 9% of the respondents consider that businesses support materially and financially to the people in their communities; the lowest percentage of the entire EU.
Note: Choose maximum 3 answers of a fixed list. Source: “How companies influence our society: citizen´s view”, in Flash Eurobarometer 363. EUROPEAN COMMISSION (2013). Link: http://ec.europa.eu/public_opinion/flash/fl_363_en.pdf (*)
GRAPHIC 2. FROM THE FOLLOWING LIST WHICH IS/ARE, IN YOUR OPINION THE MAIN POSITIVE EFFECTS OF COMPANIES ON YOUR COUNTRY’S SOCIETY?

INSTITUCIÓN FUTURO | C/ Pérez Goyena 30. 31620 Huarte (Navarra) Spain | T +34 948 337 900 | [email protected] | www.ifuturo.org
PAGE 4 NOTES ABOUT COMPANIES’ CONTRIBUTION TO THE ECONOMY
However, as questions became more specific distinguishing by industry and size, citizen’s opinion about companies changed in a positive way. Citizens think that agro-food related companies make a great deal of effort in order to contribute to society (76%) but that construction firms (30%), financial entities and banks (17%, the lowest percentage of all the countries compared on the survey) scarcely do it. When size of companies is taken into account, 79% of Spanish citizens think that SME’s make efforts to benefit society, one of the highest percentages of the entire EU.
GRAPHIC 3. FOR EACH OF THE FOLLOWING TYPE OF COMPANIES, DO YOU THINK THAT THEY MAKE EFFORTS TO BEHAVE RESPONSIBLY TOWARDS SOCIETY IN (OUR COUNTRY)?
Note: Respondents have to answer yes from a fixed list of industries. The table shows the percentage of “yes” in answers. Source: “How companies influence our society: citizen´s view”, in Flash Eurobarometer 363. EUROPEAN COMMISSION (2013). Link: http://ec.europa.eu/public_opinion/flash/fl_363_en.pdf (*)

INSTITUCIÓN FUTURO | C/ Pérez Goyena 30. 31620 Huarte (Navarra) | T 948 337 900 | [email protected] | www.ifuturo.org
PAGE 5 NOTES ABOUT COMPANY’S CONTRIBUTION TO THE ECONOMY
In general, Spanish citizens do not know about the contributions of companies to society
In answer to the question: who should be in charge of forcing changes in businesses?, a vast majority of Spanish citizens answered that citizens themselves with their purchasing decisions and those who manage companies should be the ones in charge of it. In conclusion, despite the fact that some Spanish citizens answered that businesses impact in society is negative (43%), they also consider that SME’s (79%) and especially the agro-food industry (76%) are making efforts to be socially more responsible. However, a great deal of them (55%, the highest rate in the EU), do not know but want to know what companies do to behave more responsible towards society, even in the businesses they work for.
Let’s talk about some of the benefits companies provide to society: creating jobs, paying taxes, providing training for workers and sponsoring.
GRAPHIC 4. DO YOU HAVE ANY INFORMATION ON WHAT COMPANIES DO TO BEHAVE MORE RESPONSIBLE TOWARDS SOCIETY?
Source: “How companies influence our society: citizen´s view”, in Flash Eurobarometer 363. EUROPEAN COMMISSION (2013). Link: http://ec.europa.eu/public_opinion/flash/fl_363_en.pdf (*)
INSTITUCIÓN FUTURO | C/ Pérez Goyena 30. 31620 Huarte (Navarra) Spain | T +34 948 337 900 | [email protected] | www.ifuturo.org
PAGE 6 NOTES ABOUT COMPANIES’ CONTRIBUTION TO THE ECONOMY
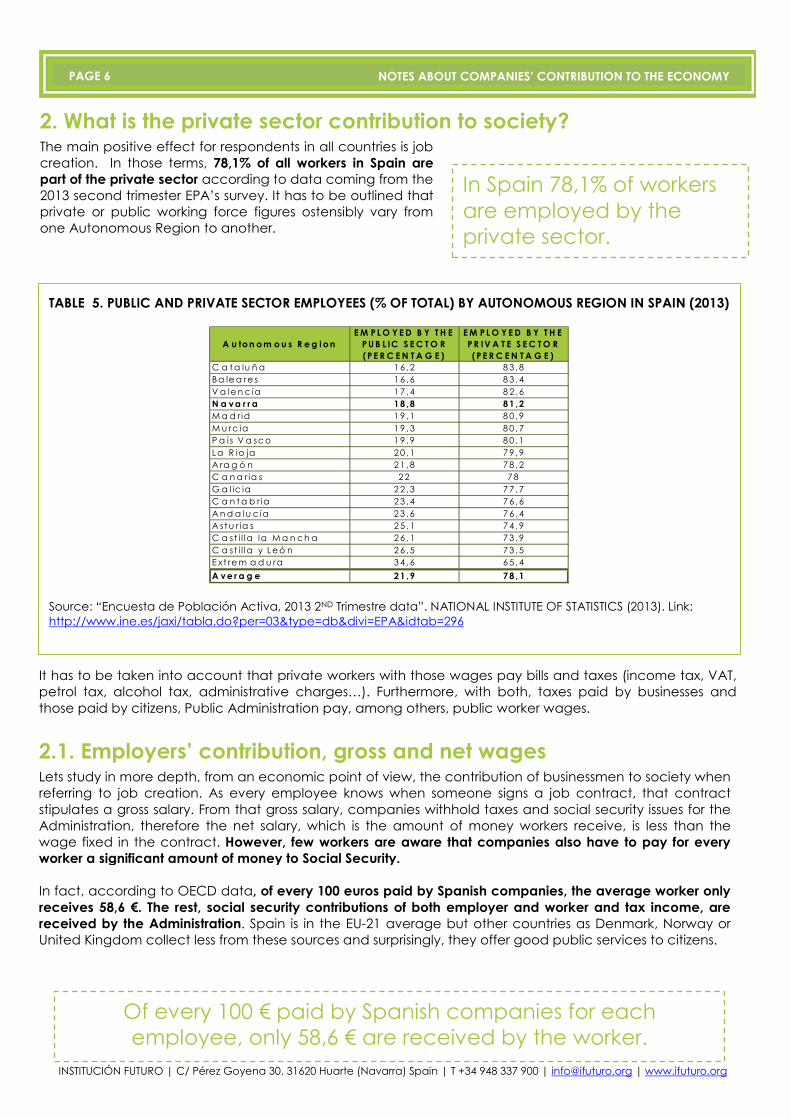
2. What is the private sector contribution to society? The main positive effect for respondents in all countries is job creation. In those terms, 78,1% of all workers in Spain are part of the private sector according to data coming from the 2013 second trimester EPA’s survey. It has to be outlined that private or public working force figures ostensibly vary from one Autonomous Region to another.
TABLE 5. PUBLIC AND PRIVATE SECTOR EMPLOYEES (% OF TOTAL) BY AUTONOMOUS REGION IN SPAIN (2013)
A u to n o m o u s R e g i o n
E M P L O Y E D B Y T H E
P U B L IC S E C T O R
(P E R C E N T A G E )
E M P L O Y E D B Y T H E
P R IV A T E S E C T O R
(P E R C E N T A G E )
C a t a lu ñ a 1 6 ,2 8 3 ,8Ba le a re s 1 6 ,6 8 3 ,4V a le n c ia 1 7 ,4 8 2 ,6N a v a r r a 1 8 ,8 8 1 ,2
M a d rid 1 9 ,1 8 0 ,9M u rc ia 1 9 ,3 8 0 ,7P a ís V a sc o 1 9 ,9 8 0 ,1La R io ja 2 0 ,1 7 9 ,9A ra g ó n 2 1 ,8 7 8 ,2C a n a r ia s 2 2 7 8G a l ic ia 2 2 ,3 7 7 ,7C a n t a b r ia 2 3 ,4 7 6 ,6A n d a lu c ía 2 3 ,6 7 6 ,4A st u r ia s 2 5 ,1 7 4 ,9C a st i l la la M a n c h a 2 6 ,1 7 3 ,9C a st i l la y Le ó n 2 6 ,5 7 3 ,5E xt re m a d u ra 3 4 ,6 6 5 ,4
A v e r a g e 2 1 ,9 7 8 ,1 Source: “Encuesta de Población Activa, 2013 2ND Trimestre data”. NATIONAL INSTITUTE OF STATISTICS (2013). Link: http://www.ine.es/jaxi/tabla.do?per=03&type=db&divi=EPA&idtab=296
In Spain 78,1% of workers are employed by the private sector.
It has to be taken into account that private workers with those wages pay bills and taxes (income tax, VAT, petrol tax, alcohol tax, administrative charges…). Furthermore, with both, taxes paid by businesses and those paid by citizens, Public Administration pay, among others, public worker wages.
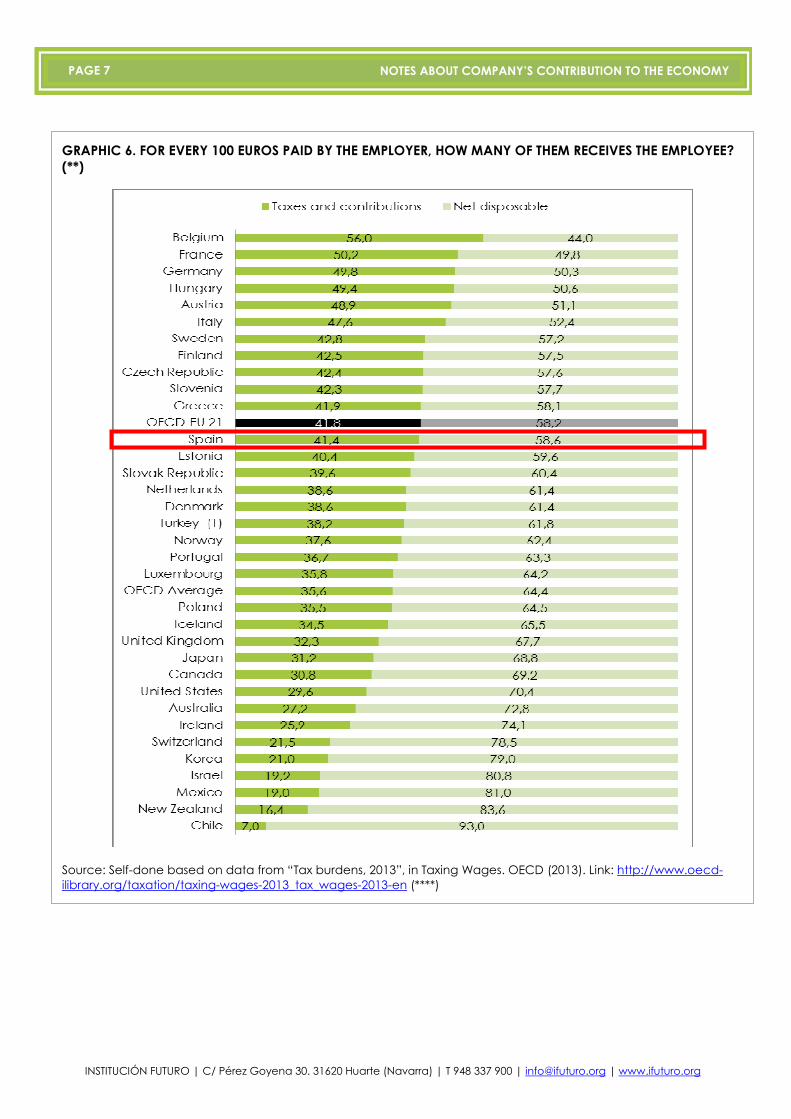
2.1. Employers’ contribution, gross and net wages Lets study in more depth, from an economic point of view, the contribution of businessmen to society when referring to job creation. As every employee knows when someone signs a job contract, that contract stipulates a gross salary. From that gross salary, companies withhold taxes and social security issues for the Administration, therefore the net salary, which is the amount of money workers receive, is less than the wage fixed in the contract. However, few workers are aware that companies also have to pay for every worker a significant amount of money to Social Security. In fact, according to OECD data, of every 100 euros paid by Spanish companies, the average worker only receives 58,6 €. The rest, social security contributions of both employer and worker and tax income, are received by the Administration. Spain is in the EU-21 average but other countries as Denmark, Norway or United Kingdom collect less from these sources and surprisingly, they offer good public services to citizens.
Of every 100 € paid by Spanish companies for each employee, only 58,6 € are received by the worker.
INSTITUCIÓN FUTURO | C/ Pérez Goyena 30. 31620 Huarte (Navarra) | T 948 337 900 | [email protected] | www.ifuturo.org
PAGE 7 NOTES ABOUT COMPANY’S CONTRIBUTION TO THE ECONOMY
GRAPHIC 6. FOR EVERY 100 EUROS PAID BY THE EMPLOYER, HOW MANY OF THEM RECEIVES THE EMPLOYEE? (**)
Source: Self-done based on data from “Tax burdens, 2013”, in Taxing Wages. OECD (2013). Link: http://www.oecd-ilibrary.org/taxation/taxing-wages-2013_tax_wages-2013-en (****)

INSTITUCIÓN FUTURO | C/ Pérez Goyena 30. 31620 Huarte (Navarra) Spain | T +34 948 337 900 | [email protected] | www.ifuturo.org
PAGE 8 NOTES ABOUT COMPANIES’ CONTRIBUTION TO THE ECONOMY
Going a little bit further in the analysis and studying separately those contributions known by workers (social security and income tax that the worker has to pay and the company withhold) and those that companes pay directly to the Administration, people can realise that the distribution of those wage costs widely vary from country to country. In Spain social security contributions are high for companies and low for employees and the income tax is above the average.
GRAPHIC 7. TOTAL WAGE COSTS DISTRIBUTION (**)
Source: Self-done based on data from “Tax burdens, 2013”, in Taxing Wages. OECD (2013). Link: http://www.oecd-ilibrary.org/taxation/taxing-wages-2013_tax_wages-2013-en (****)

INSTITUCIÓN FUTURO | C/ Pérez Goyena 30. 31620 Huarte (Navarra) | T 948 337 900 | [email protected] | www.ifuturo.org
PAGE 9 NOTES ABOUT COMPANY’S CONTRIBUTION TO THE ECONOMY
Focusing on what companies pay directly to the Social Security Fund for each worker (around 30% of the gross salary), everyone can realise that is significantly above the OECD average.
GRAPHIC 8. EMPLOYER SOCIAL SECURITY CONTRIBUTIONS (**)
Source: Self-done based on data from “Tax burdens, 2013”, in Taxing Wages. OECD (2013). Link: http://www.oecd-ilibrary.org/taxation/taxing-wages-2013_tax_wages-2013-en (****)
Therefore, when comparing Spanish wage costs with those of other countries, mandatory contributions to the Social Security Fund cannot be neglected. For instance, in countries like Denmark or Chile companies do not pay social security contributions whereas in Spain that contribution, as previously mentioned, is around 30% of the gross wage. Nevertheless, low or inexistent contributions do not mean lower wage costs because they also depend on the country’s salary level. Taking a look to the Danish case, companies do not pay contributions to the Social Security Fund, but wages and income taxes for workers are much higher than in Spain. On the contrary, in Chile there are low wages and no contributions.
INSTITUCIÓN FUTURO | C/ Pérez Goyena 30. 31620 Huarte (Navarra) Spain | T +34 948 337 900 | [email protected] | www.ifuturo.org
PAGE 10 NOTES ABOUT COMPANIES’ CONTRIBUTION TO THE ECONOMY
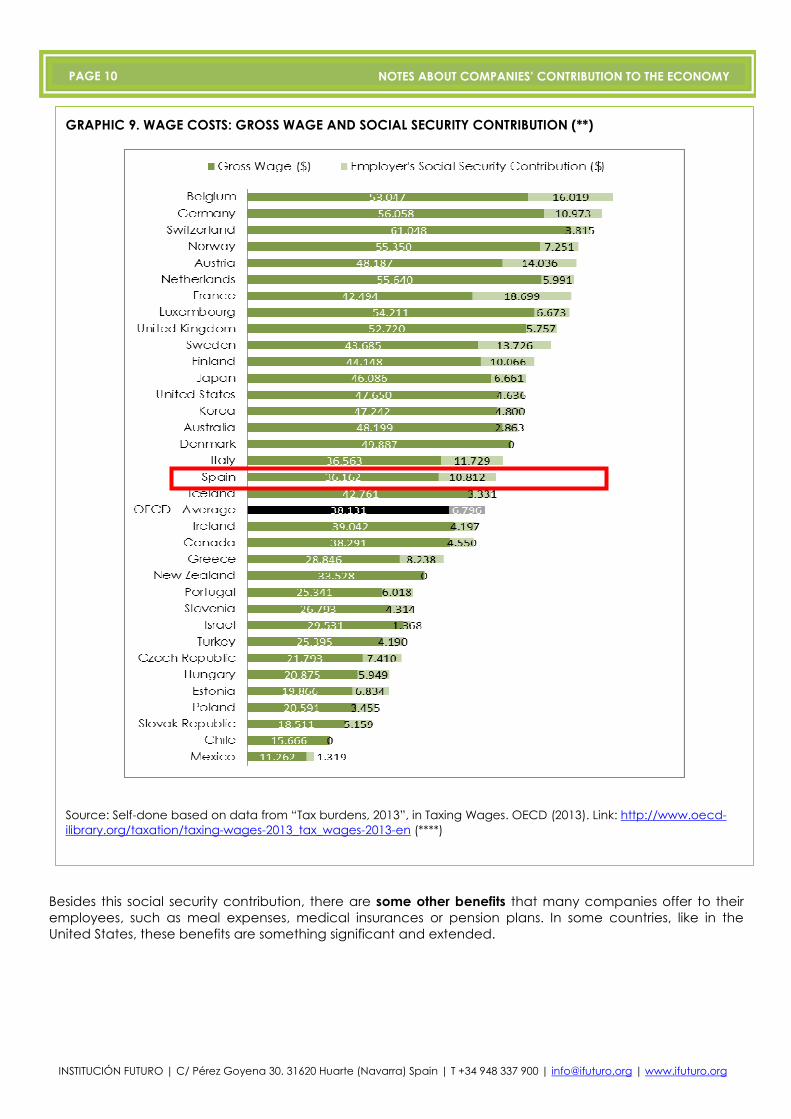
Besides this social security contribution, there are some other benefits that many companies offer to their employees, such as meal expenses, medical insurances or pension plans. In some countries, like in the United States, these benefits are something significant and extended.
GRAPHIC 9. WAGE COSTS: GROSS WAGE AND SOCIAL SECURITY CONTRIBUTION (**)
Source: Self-done based on data from “Tax burdens, 2013”, in Taxing Wages. OECD (2013). Link: http://www.oecd-ilibrary.org/taxation/taxing-wages-2013_tax_wages-2013-en (****)

INSTITUCIÓN FUTURO | C/ Pérez Goyena 30. 31620 Huarte (Navarra) | T 948 337 900 | [email protected] | www.ifuturo.org
PAGE 11 NOTES ABOUT COMPANY’S CONTRIBUTION TO THE ECONOMY
In the same way, companies pay other taxes like the corporate tax that also contribute to public funding. In Spain the corporate tax rate is 30% for big companies and 25% for SME’s. If we take a look to the same rates in other European countries, it can be seen that the Spanish maximum rate (30%) is ranked number 4 between the highest in the EU. Nevertheless, in order to be able to correctly compare them, it should be taken into account tax exemptions and deductions that each country permits to know the effective corporate tax rate. According to the Spanish Tax Agency, the effective corporate tax rate for 2012 was 19,3% (Provisional data).(1)
2.2. Other taxes
______________ (1) Source: “Informe Anual de Recaudación Tributaria 2012”. SPANISH TAX AGENCY (2012). Link: http://www.agenciatributaria.es/static_files/AEAT/Estudios/Estadisticas/Informes_Estadisticos/Informes_Anuales_de_Recaudacion_Tributaria/Ejercicio_2012/IART_12.pdf

INSTITUCIÓN FUTURO | C/ Pérez Goyena 30. 31620 Huarte (Navarra) Spain | T +34 948 337 900 | [email protected] | www.ifuturo.org
PAGE 12 NOTES ABOUT COMPANIES’ CONTRIBUTION TO THE ECONOMY
According to international data from a report of the Institute of International and European Affairs (IEA) that uses figures from the report Doing Business 2011 made by the World Bank, Spain is ranked number 5 tied with Netherlands among the highest when talking about effective corporate tax rates within the EU.
GRAPHIC 10. EFFECTIVE CORPORATE TAX WITHIN THE EU
Source: “Effective EU corporate tax rates”. Institute of International and European Affairs (IEA), (2011). Link: (http://www.iiea.com/blogosphere/effective-eu-corporate-tax-rates

INSTITUCIÓN FUTURO | C/ Pérez Goyena 30. 31620 Huarte (Navarra) | T 948 337 900 | [email protected] | www.ifuturo.org
PAGE 13 NOTES ABOUT COMPANY’S CONTRIBUTION TO THE ECONOMY
TABLE 11. VAT rates in EU Countries
Country Super Reduced
RateReduced Rate Standard Rate
Hungary - 5/18 27Denmark - - 25Croatia - 5/10 25Sw eden - 6/12 25Romania 5/9 24Finland - 10/14 24Greece - 6,5/13 23Ireland 4,8 9/13,5 23Poland 5/8 23Portugal - 6/13 23Slovenia - 9,5 22Belgium - 6/12 21Czech Republic - 15 21Spain 4 10 21
Italy 4 10 21Latvia - 12 21Lithuania - 5/9 21Netherlands - 6 21Bulgaria - 9 20Estonia - 9 20Austria - 10 20Slovakia - 10 20United Kingdom - 5 20France 2,1 5,5/7 19,6Germany - 7 19Cyprus - 5/8 18Malta - 5/7 18Luxembourg 3 6/12 15
Source: “VAT Rates Applied in the Member States of the European Union”. EUROPEAN COMMISSION (2013). Link: http://ec.europa.eu/taxation_customs/resources/documents/taxation/vat/how_vat_works/rates/vat_rates_en.pdf
In terms of VAT Spain, with a 21% maximum VAT rate, is on the EU average and it is one of the few countries that has a super reduced VAT for some goods and services.
Additionally to all these taxes, other ones have to be added to those paid by companies to the Administration: property taxes, ownership transfer tax, tax on dividends, yield tax, capital gain tax, financial transaction tax, as well as household refuse tax, road taxes and some others of less significance.

INSTITUCIÓN FUTURO | C/ Pérez Goyena 30. 31620 Huarte (Navarra) Spain | T +34 948 337 900 | [email protected] | www.ifuturo.org
PAGE 14 NOTES ABOUT COMPANIES’ CONTRIBUTION TO THE ECONOMY
In sum, taking into account all the previous variables mentioned, this would be the position of Spain:
TABLE 12. RANKING WAGE COSTS DISTRIBUTION (**)
Ranking Country
Employer 's
Socia l Secur i ty
Contr ibution
Country
Employee's
Socia l Secur i ty
Contr ibution
CountryEmployee's
Income TaxCountry Disposable
1 F rance 30,6% Slovenia 19,0% Denmark 36,2% Chile 93,0%
2 Estonia 25,6% Germany 17,3% Iceland 26,8% N ew Zealand 83,6%
3 Czech Republic 25,4% Poland 15,3% Belgium 22,1% Mexico 81,0%
4 Italy 24,3% Hungary 14,4% Australia 21,6% Israel 80,8%
5 Sweden 23,9% Austria 14,0% N orway 19,1% Korea 79,0%
6 Belgium 23,2% N etherlands 13,9% F in land 17,7% Switzerland 78,5%
7 Spain 23,0% Turkey 12,9% N ew Zealand 16,4% Ireland 74,1%
8 Austria 22,6% Greece 12,8% Italy 16,1% Australia 72,8%
9 Greece 22,2% Japan 12,0% Germany 16,0% United States 70,4%
10 Hungary 22,2% Luxembourg 11,0% United States 15,6% Canada 69,2%
11 Slovak Republic 21,8% Belgium 10,8% N etherlands 14,9% Japan 68,8%
12 P ortugal 19,2% Slovak Republic 10,5% Media UE21 14,1% United Kingdom 67,7%
13 F in land 18,6% F rance 9,5% United Kingdom 14,0% Iceland 65,5%
14 Media UE21 18,3% Media UE21 9,2% Luxembourg 13,8% P oland 64,5%
15 Germany 16,4% Portugal 8,9% Canada 13,6% Luxembourg 64,2%
16 Media OCDE 15,2% United Kingdom 8,5% Sweden 13,6% OECD - Average 63,3%
17 P oland 14,4% Media OCDE 8,4% Spain 13,5% P ortugal 63,3%
18 Turkey 14,2% Czech Republic 8,2% Ireland 13,4% N orway 62,4%
19 Slovenia 13,9% Korea 7,4% Media OCDE 13,1% Turkey 61,8%
20 Japan 12,6% Israel 7,3% H ungary 12,8% N etherlands 61,4%
21 N orway 11,6% Italy 7,2% Estonia 12,7% Denmark 61,1%
22 Luxembourg 11,0% Chile 7,0% Austria 12,3% Slovak Republic 60,4%
23 Canada 10,6% N orway 6,9% Turkey 11,1% Estonia 59,6%
24 Mexico 10,5% Canada 6,6% F rance 10,2% Spain 58,6%
25 United Kingdom 9,8% F in land 6,2% Switzerland 9,7% Media UE21 58,1%
26 N etherlands 9,7% Switzerland 5,9% Slovenia 9,4% Greece 58,1%
27 Ireland 9,7% Sweden 5,3% Czech Republic 8,8% Slovenia 57,7%
28 Korea 9,2% United States 5,1% P ortugal 8,7% Czech Republic 57,6%
29 United States 8,9% Spain 4,9% Israel 7,5% F in land 57,5%
30 Iceland 7,2% Ireland 2,9% Slovak Republic 7,4% Sweden 57,2%
31 Switzerland 5,9% Denmark 2,7% Mexico 7,3% Italy 52,4%
32 Australia 5,6% Estonia 2,1% Greece 6,9% Austria 51,1%
33 Israel 4,4% Mexico 1,2% Japan 6,6% H ungary 50,6%
34 Chile 0,0% Iceland 0,4% P oland 5,8% Germany 50,3%
35 N ew Zealand 0,0% N ew Zealand 0,0% Korea 4,4% F rance 49,8%
36 Denmark 0,0% Australia 0,0% Chile 0,0% Belgium 44,0%
Source: Self-done based on data from “Tax burdens, 2013”, in Taxing Wages. OECD (2013). Link: http://www.oecd-ilibrary.org/taxation/taxing-wages-2013_tax_wages-2013-en (****)

INSTITUCIÓN FUTURO | C/ Pérez Goyena 30. 31620 Huarte (Navarra) | T 948 337 900 | [email protected] | www.ifuturo.org
PAGE 15 NOTES ABOUT COMPANY’S CONTRIBUTION TO THE ECONOMY
TABLE 13. RANKING OF THE MAIN CONTRIBUTIONS AND TAXES PAID BY COMPANIES (**)
Ranking Country
Employer's Social
Security
Contribution (%
Gross Wage)
CountryEffective Corporate
Tax RateCountry Standard VAT
1 France 44,0% United Kingdom 23,2% Hungary 27,0%
2 Estonia 34,4% Germany 22,9% Denmark 25,0%
3 Czech Republic 34,0% Italy 22,8% Sweden 25,0%
4 Italy 32,1% Netherlands 20,9% Finland 24,0%
5 Sweden 31,4% Spain 20,9% Greece 23,0%
6 Belgium 30,2% Poland 17,7% Ireland 23,0%
7 Spain 29,9% Hungary 16,7% Poland 23,0%
8 Austria 29,1% Sweden 16,4% Portugal 23,0%
9 Greece 28,6% Finland 15,9% Slovenia 22,0%
10 Hungary 28,5% Austria 15,7% Media UE21 21,6%
11 Slovak Republic 27,9% Portugal 14,9% Belgium 21,0%
12 Portugal 23,8% Slovenia 14,8% Czech Republic 21,0%
13 Media UE21 23,5% Media UE21 14,1% Italy 21,0%
14 Finland 22,8% Greece 13,9% Netherlands 21,0%
15 Germany 19,6% Ireland 11,9% Spain 21,0%
16 Poland 16,8% France 8,2% Austria 20,0%
17 Slovenia 16,1% Estonia 8,0% Estonia 20,0%
18 Luxembourg 12,3% Czech Republic 7,4% Slovak Republic 20,0%
19 United Kingdom 10,9% Denmark 7,4% United Kingdom 20,0%
20 Netherlands 10,8% Slovak Republic 7,0% France 19,6%
21 Ireland 10,8% Belgium 4,8% Germany 19,0%
22 Denmark 0,0% Luxembourg 4,1% Luxembourg 15,0% Sources: Self-done based on data from: “Tax burdens, 2013”, in Taxing Wages. OECD (2013). Link: http://www.oecd-ilibrary.org/taxation/taxing-wages-2013_tax_wages-2013-en (****); “Effective EU corporate tax rates” Institute of International and European Affairs (IEA), (2011). Link: (http://www.iiea.com/blogosphere/effective-eu-corporate-tax-rates: “VAT Rates Applied in the Member States of the European Union”. EUROPEAN COMMISSION (2013). Link: http://ec.europa.eu/taxation_customs/resources/documents/taxation/vat/how_vat_works/rates/vat_rates_en.pdf
From all the facts that have been seen throughout this document, it can be concluded that companies largely contribute to support the public sector and to fund all the public services which benefit every citizen by paying taxes, contributions and wages.

INSTITUCIÓN FUTURO | C/ Pérez Goyena 30. 31620 Huarte (Navarra) Spain | T +34 948 337 900 | [email protected] | www.ifuturo.org
PAGE 16 NOTES ABOUT COMPANIES’ CONTRIBUTION TO THE ECONOMY
2.3. Investment in workers’ training
Companies also use some funds to invest in providing training to their workers and this benefit both the companies and employees. First ones benefit from the fact that their workers will be more qualified and the employees benefit from being more employable. If we take a look to the percentage of companies which do this kind of investment, we can see that 75% of Spanish companies do it, high above the EU-27 average.
GRAPHIC 14. COMPANIES PROVIDING TRAINING TO THEIR EMPLOYEES (%)
Source: “Continuing vocational training statistics”. EUROSTAT (2013). Link: http://epp.eurostat.ec.europa.eu/statistics_explained/index.php/Continuing_vocational_training_statistics#Further_Eurostat_information
75% of Spanish companies provide training for their workers.

INSTITUCIÓN FUTURO | C/ Pérez Goyena 30. 31620 Huarte (Navarra) | T 948 337 900 | [email protected] | www.ifuturo.org
PAGE 17 NOTES ABOUT COMPANY’S CONTRIBUTION TO THE ECONOMY
This training has of course a cost for companies that according to EU 2010 statistics varies from 0,8% to 2,5% of the labour costs. Training costs in Spain are in the 1,6% labour costs average.
GRAPHIC 15. TRAINING COSTS (% OF ALL TOTAL LABOUR COSTS)
Source: “Continuing vocational training statistics”. EUROSTAT (2013). Link: http://epp.eurostat.ec.europa.eu/statistics_explained/index.php/Continuing_vocational_training_statistics#Further_Eurostat_information
Training costs represent 1,6% of labour costs for Spanish companies.

INSTITUCIÓN FUTURO | C/ Pérez Goyena 30. 31620 Huarte (Navarra) Spain | T +34 948 337 900 | [email protected] | www.ifuturo.org
PAGE 18 NOTES ABOUT COMPANIES’ CONTRIBUTION TO THE ECONOMY
2.4. Sponsorship Investment
Many companies fund different NGOs. These funding decisions depend on their affinities with those NGOs. In recent years, either for marketing purposes or for social awareness, Corporate Social Responsibility has become a common practice within companies. It is difficult to quantify the amount of money funded by sponsorship due to the many different causes and entities involved. United States has good data statistics but is very difficult to find these data for the European market. According to a recent studio done by IEG (US consultancy specialized in studying companies’ sponsorship http://www.sponsorship.com), the total world expenditure during 2012 was around 51.100 million of dollars, 28% of these funds have been invested in Europe (14.500 million). These figures have been rising over the years and the 2013 estimate seem to be even better despite the crisis.
GRAPHIC 16. SPONSORSHIP INVESTMENT IN THE WORLD
Source: “2013 Sponsorship Outlook: Spending Increase Is Double-edged Sword”. IEG, LLC (2013). Link: http://www.sponsorship.com/iegsr/2013/01/07/2013-Sponsorship-Outlook--Spending-Increase-Is-Dou.aspx
GRAPHIC 17. SPONSORSHIP INVESTMENT BY REGIONS
Source: “2013 Sponsorship Outlook: Spending Increase Is Double-edged Sword”. IEG, LLC (2013). Link: http://www.sponsorship.com/iegsr/2013/01/07/2013-Sponsorship-Outlook--Spending-Increase-Is-Dou.aspx

INSTITUCIÓN FUTURO | C/ Pérez Goyena 30. 31620 Huarte (Navarra) | T 948 337 900 | [email protected] | www.ifuturo.org
PAGE 19 NOTES ABOUT COMPANY’S CONTRIBUTION TO THE ECONOMY
Sponsorship distribution is mainly focused in sport related activities. In United States, the distribution is the following one:
GRAPHIC 18. US SPONSORSHIP DISTRIBUTION (2013 ESTIMATE)
Source: “2013 Sponsorship Outlook: Spending Increase Is Double-edged Sword”. IEG, LLC (2013). Link: http://www.sponsorship.com/iegsr/2013/01/07/2013-Sponsorship-Outlook--Spending-Increase-Is-Dou.aspx
All this funds, beyond any doubt, help disadvantaged people and support cultural, artistic and sport activities, all of them contributing to employment and a better economic and social environment.
3. Conclusion
Even though the economic crisis is increasing the feeling that companies and businesses in general are sources of wealth and that they are necessary for society, there is still a lack of information about their real contributions to it. In Spain, some sectors of society are still doubtful about the benefits companies bring to society, disregarding the fact that not only generate they employment but they also pay taxes which fund the whole public sector. This public sector provides with services to the entire population and employs 22% of it. Besides, they invest in worker training, promoting future employability among their employees and they sponsor different activities such as sportive, cultural or cooperative ones. Some of them could not be done without those funds. Without businesses and jobs the current welfare society as it is known these days would disappear. It is responsibility of each and all of us to ensure that companies are able to generate jobs and benefits for society.
Without businesses and jobs the current welfare society as we know it these days would collapse.

INSTITUCIÓN FUTURO | C/ Pérez Goyena 30. 31620 Huarte (Navarra) Spain | T +34 948 337 900 | [email protected] | www.ifuturo.org
PAGE 20 NOTES ABOUT COMPANIES’ CONTRIBUTION TO THE ECONOMY
Finally, taking a look back to wages, do not forget from now on that company’s labour expenditure is significantly higher than the money perceived by employees. In Spain, the employer has to pay 1,71€ for each euro received by the employee.
GRAPHIC 19. FOR EACH EURO PERCEIVED BY AN EMPLOYEE, HOW MUCH DOES THE EMPLOYER HAVE TO PAY? (*)
Source: Self-done based on data from “Tax burdens, 2013”, in Taxing Wages. OECD (2013). Link: http://www.oecd-
EXPLANATORY NOTES OF THIS EDITION: (*) Eurobarometer 363 is based on a survey realized by TNS Political & Social network within the 27 countries members of the EU and also in Croatia, Israel, Turkey, Brazil, United States, China and India between October the 22nd and November the 23rd 2012. (**) All calculations have been done for a single, average wage contributor without children. (***) “Average worker”: worker from the private sector whose wage incomes are equal to the average wage incomes of workers of that sector. For further details, look up in “Methodology and limitations” of the report “Tax burdens, 2013”, in Taxing Wages. OECD (2013) http://dx.doi.org/10.1787/tax_wages-2013-43-en (****) For further details, look up in “Methodology and limitations” of the report “Tax burdens, 2013”, in Taxing Wages. OECD (2013) http://dx.doi.org/10.1787/tax_wages-2013-43-en