Renaissance Element in Hamlet. Introduction Renaissance. Renaissance persons quality.

NORTH WEST SHELF RENAISSANCE SOUTH MULTI CLIENT
MARINE SEISMIC SURVEYS
ENVIRONMENT PLAN SUMMARY
TGS-NOPEC Geophysical Company Pty Ltd
October 2016
Rev 1

TGS NWSR South MC MSS - Environment Plan
Document Title: TGS North West Shelf Renaissance South Multi Client Marine Seismic Surveys Environment Plan Summary
Revision Status: 1
DISTRIBUTION LIST
Copies To:
01 TGS - Document Control
External 02 National Offshore Petroleum Safety and Environmental Management Authority (NOPSEMA)
DOCUMENT REVISION HISTORY
Rev Description Date Prepared by Reviewed Approved
0 Submission to NOPSEMA September 2016 Scope Resources TGS
1 Revised with NOPSEMA feedback
October 2016 Scope Resources TGS
PREPARED BY: Scope Resources (WA) Pty Ltd

TGS NWSR South MC MSS - Environment Plan Summary
Rev 1 Page i
TABLE OF CONTENTS 1. INTRODUCTION ....................................................................................................................... 6
1.1 LOCATION OF THE ACTIVITY ..................................................................................................................... 6
1.2 TIMING OF THE ACTIVITY ......................................................................................................................... 1
2. DESCRIPTION OF THE ACTIVITY ................................................................................................ 2
2.1 SEISMIC PROGRAMME ............................................................................................................................. 2
2.1.1 Survey Parameters ................................................................................................................................. 2
2.2 SURVEY VESSELS ...................................................................................................................................... 2
2.2.1 Seismic Survey Vessels ........................................................................................................................... 2
2.2.2 Support Vessel........................................................................................................................................ 2
3. DESCRIPTION OF THE ENVIRONMENT ..................................................................................... 3
3.1 Regard for EPBC Act ................................................................................................................................. 3
3.2 Management Areas ................................................................................................................................. 3
3.3 REGIONAL SETTING .................................................................................................................................. 5
3.4 South-West Marine Region ...................................................................................................................... 5
3.5 The North-West Marine Region ............................................................................................................... 5
3.6 Key Ecological Features ............................................................................................................................ 7
3.7 Protected Marine Fauna ........................................................................................................................ 10
3.7.1.1 Humpback Whales ............................................................................................................................... 14
3.7.1.2 Pygmy Blue Whale................................................................................................................................ 16
3.7.2 Dugong ................................................................................................................................................. 17
3.7.3 Pinnipeds .............................................................................................................................................. 17
3.7.4 Marine Reptiles .................................................................................................................................... 17
3.7.5 Sharks and Ray-finned Fishes ............................................................................................................... 20
3.7.6 Seabirds and Shorebirds ....................................................................................................................... 21
3.8 SOCIO-ECONOMIC ENVIRONMENT ........................................................................................................ 22
3.8.1 Commercial Fisheries ........................................................................................................................... 22
3.8.2 State Managed Fisheries ...................................................................................................................... 22
3.8.2.1 Abrolhos Islands and Mid-West Trawl Managed Fishery ..................................................................... 22
3.8.2.2 Gascoyne Demersal Scalefish Fishery .................................................................................................. 22
3.8.2.3 Mackerel Managed Fishery .................................................................................................................. 23
3.8.2.4 North Coast Crab Fishery ..................................................................................................................... 23
3.8.2.5 North Coast Prawn Managed Fisheries ................................................................................................ 23
Nickol Bay Prawn Managed Fishery (NBPMF) ...................................................................................................... 23
Onslow Prawn Managed Fishery (OPMF) ............................................................................................................ 23
3.8.2.6 Octopus Fishery .................................................................................................................................... 23
3.8.2.7 Pearl Oyster Managed Fishery ............................................................................................................. 24
3.8.2.8 North Coast Demersal Fisheries ........................................................................................................... 24
3.8.2.8.1 Pilbara Demersal Scalefish Fisheries ................................................................................................ 24
Pilbara Fish Trawl (Interim) Managed Fishery (PFTIMF) ...................................................................................... 24
Pilbara Trap Managed Fishery (PTMF) ................................................................................................................. 25
Pilbara Line Fishery (PLF) ..................................................................................................................................... 25
3.8.2.9 West Coast Deep Sea Crustacean Managed Fishery ............................................................................ 25

TGS NWSR South MC MSS - Environment Plan Summary
Rev 1 Page ii
3.8.2.10 West Coast Demersal Scalefish (Interim) Managed Fishery ............................................................ 25
3.8.2.11 West Coast Rock Lobster Managed Fishery ..................................................................................... 25
3.8.3 Australian Commonwealth Administered Fisheries ............................................................................. 26
3.8.3.1 North West Slope Trawl Fishery ........................................................................................................... 26
3.8.3.2 Western Deepwater Trawl Fishery ....................................................................................................... 26
3.8.3.3 Western Tuna and Billfish Fishery ........................................................................................................ 26
3.8.3.4 Western Skipjack Fishery ..................................................................................................................... 26
3.8.3.5 Southern Bluefin Tuna Fishery ............................................................................................................. 26
3.8.4 Petroleum Exploration and Production................................................................................................ 26
3.8.5 Commercial Shipping ........................................................................................................................... 27
3.8.6 Tourism and Recreation ....................................................................................................................... 27
3.8.7 Defence Activities ................................................................................................................................. 27
3.8.8 Cultural Heritage .................................................................................................................................. 27
3.8.9 Heritage Places ..................................................................................................................................... 27
3.8.10 Commonwealth Marine Reserves ........................................................................................................ 28
3.8.10.1 IUCN Principles ................................................................................................................................. 28
3.8.11 State Marine Parks and Reserves ......................................................................................................... 30
3.8.12 Other Sensitive Areas ........................................................................................................................... 31
3.8.12.1 World Heritage Areas ....................................................................................................................... 31
3.8.12.2 Ramsar Wetlands ............................................................................................................................. 31
3.8.12.3 Glomar Shoals .................................................................................................................................. 31
4. ENVIRONMENTAL RISK ASSESSMENT..................................................................................... 32
4.1 Environmental Risk Assessment Methodology ...................................................................................... 32
4.1.1 Decision Making Framework ................................................................................................................ 32
4.2 Risk Evaluation ...................................................................................................................................... 35
4.2.1 Demonstration of ALARP ...................................................................................................................... 35
4.2.2 Demonstration of Acceptability ........................................................................................................... 36
5. ENVIRONMENTAL RISK EVALUATION ..................................................................................... 37
5.1 Environmental Aspects .......................................................................................................................... 37
5.2 Environmental Impacts .......................................................................................................................... 37
6. ASSESSMENT OF ENVIRONMENTAL IMPACTS AND RISKS ...................................................... 45
6.1 Noise Emissions from Non-seismic Sources ............................................................................................ 45
6.2 Light Generation .................................................................................................................................... 45
6.3 Interaction with Commercial or Recreational Fishers, Shipping and Petroleum Service Vessels ............ 46
6.4 Ballast Water Discharge, and Biofouling of Vessel Hull, Other Niches and Immersible Equipment ........ 48
6.5 Sewage, Grey Water and Putrescible Wastes ......................................................................................... 50
6.6 Underwater Noise Emissions from Discharge of Acoustic Source ........................................................... 50
6.6.1 Acoustic Modelling ............................................................................................................................... 51
6.6.2 Exposure Criteria .................................................................................................................................. 54
6.6.3 Potential Environmental Impacts ......................................................................................................... 56
6.6.3.1 Disturbance to Planktonic Organisms .................................................................................................. 57
6.6.3.2 Benthic Invertebrates ........................................................................................................................... 58
6.6.3.3 Disturbance to Fish............................................................................................................................... 65

TGS NWSR South MC MSS - Environment Plan Summary
Rev 1 Page iii
6.6.3.4 Sharks ................................................................................................................................................... 70
6.6.3.5 Dugongs................................................................................................................................................ 71
6.6.3.6 Marine Turtles ...................................................................................................................................... 71
6.6.3.7 Avifauna ............................................................................................................................................... 73
6.6.3.8 Disturbance to Pinnipeds ..................................................................................................................... 73
6.6.3.9 Disturbance to Cetaceans (Baleen whales) .......................................................................................... 74
6.6.3.10 Disturbance to Cetaceans (Toothed Whales) ................................................................................... 75
6.6.3.12 Simultaneous Operations and Cumulative Impacts ......................................................................... 79
6.6.3.13 Impacts to Commonwealth Marine Reserves .................................................................................. 82
6.7 Collision between Vessels / Towed Array and Marine Fauna ................................................................. 83
6.8 Vessel Anchoring, Grounding or Equipment Dragging and loss .............................................................. 84
6.9 Accidental Release of Hazardous or Non-hazardous Materials .............................................................. 85
6.10 Vessel topside hydrocarbon spills .......................................................................................................... 85
6.11 Hydrocarbon Release Caused by Transfer Spill or Vessel Collision ......................................................... 86
7. IMPLEMENTATION STRATEGY .............................................................................................. 101
7.1 ongoing monitoring ............................................................................................................................. 101
7.1.1 Pre-survey planning ........................................................................................................................... 101
7.2 Oil Pollution Emergency Plan ............................................................................................................... 102
7.2.1 Drills and Training .............................................................................................................................. 102
7.2.2 Initial Actions ...................................................................................................................................... 102
Commonwealth Waters ..................................................................................................................................... 103
State Waters ...................................................................................................................................................... 103
7.2.3 Monitoring ......................................................................................................................................... 103
7.3 Environment Plan REVISION and Resubmission ................................................................................... 104
7.3.1 Risk Assessment Process .................................................................................................................... 104
8. REPORTING ARRANGEMENTS .............................................................................................. 104
8.1 DETAILS OF TITLEHOLDER AND LIAiSON PERSON ................................................................................. 105
9. CONSULTATION PLAN .......................................................................................................... 105
9.1 Phase 1 - Preparatory Consultation...................................................................................................... 105
9.1.1 Phase I - Update ................................................................................................................................. 106
9.1.2 Stakeholder Responses ...................................................................................................................... 106
9.2 Phase 2 - Pre-survey Consultation ........................................................................................................ 107
9.3 Phase 3 – Ongoing Consultation .......................................................................................................... 107
9.3.1 Regular Updates ................................................................................................................................. 107
9.4 PHASE 4 – POST SURVEY NOTIFICATION .............................................................................................. 108
10. REFERENCES ..................................................................................................................... 123
APPENDIX A– SUMMARY OF POTENTIAL ENVIRONMENTAL IMPACTS AND RISKS TO
COMMONWEALTH MARINE RESERVES....................................................................................... 134

TGS NWSR South MC MSS - Environment Plan Summary
Rev 1 Page iv
LIST OF FIGURES
Figure 3.1 – Management Areas within the NWSR South MC MSS Operational Area .............................................. 4
Figure 3.2– Key Ecological Features ........................................................................................................................... 9
Figure 3.3- Migration area (north and south) for the humpback whale (Megaptera novaeangliae) ...................... 14
Figure 3.4- Migration area (north and south) and foraging area (known and possible) for the pygmy blue whale
(Balaenoptera musculus brevicauda) ....................................................................................................................... 16
Figure 3.5- Foraging (high density prey) and foraging areas for the whale shark (Rhincodon typus) ...................... 20
Figure 3.6 - Commonwealth Marine Reserves within the vicinity of the NWSR South MC MSS polygon ............... 29
Figure 3.7- State Marine Parks and Reserves ........................................................................................................... 30
Figure 4.1 - Key Steps used for Risk Assessment ..................................................................................................... 32
Figure 4.2 - Risk Related Decision Making Framework ............................................................................................ 33
Figure 6.1- Noise decay curves for a number of different seismic airgun sources in Australian waters ................. 52
Figure 6.2 - Proportion of marine mammal sightings occurring within specified distances of the airguns during
seismic surveys. ........................................................................................................................................................ 76
Figure 6.3 – Flatback turtle internesting tracks off Barrow Island ........................................................................... 77
Figure 6.4 – Flatback turtle internesting tracks off the mainland ............................................................................ 77
Figure 6.5 – ADIOS2 modelling ZPI for 32 km spill radius for the NWSR South MC MSS Operational Area ............ 89
LIST OF TABLES
Table 1.1 – Distances from the operational area to sensitive environments and shorelines .................................... 1
Table 2.1- NWSR South MC MSS acquisition parameters .......................................................................................... 2
Table 3.1 – Threatened and Migratory Species that may occur within and around the Operational Area ............. 10
Table 3.2 - NWSR South MC MSS polygon Management Areas vs. humpback whale migration phases ................ 15
Table 3.3 - Summary of marine turtle ecology on the North West Shelf ................................................................. 19
Table 3.4 - Seabird BIA location and timings ............................................................................................................ 21
Table 3.5 – Commonwealth Marine Reserves overlapping or adjacent to the NWSR South operational area ....... 28
Table 3.6 – State Marine Parks and Reserves adjacent to the NWSR South operational area ................................ 30
Table 4.1- Generic Environmental Risk Assessment Matrix ..................................................................................... 35
Table 4.2 - Residual risk levels and associated decision making tools and principles.............................................. 36
Table 4.3 - Acceptability criteria .............................................................................................................................. 36
Table 5.1 -Environmental Risk Evaluation Summary for NWSR South MC MSS ...................................................... 38
Table 5.2 -Environmental Risk Evaluation Summary for NWSR South MC MSS ...................................................... 39
Table 6.1- Horizontal received levels (SPL and SEL) to 10 km .................................................................................. 54
Table 6.2- Received levels (SEL and SPLpeak) vertically below the array to 200 m water depth ............................ 54
Table 6.3- Summary of final NOAA threshold levels for TTS and PTS onset for LF, MF and HF cetaceans .............. 55
Table 6.4- Proposed sound levels for mortality and impairment in fish and turtles ............................................... 55
Table 6.5- Predicted vertical SELss and number of shots to exceed SELcum exposure guidelines in water depths from
~50–200 m ............................................................................................................................................................... 56
Table 6.6- Predicted horizontal SELss and number of shots to exceed SELcum exposure guidelines ..................... 56
Table 6.7- Observed seismic noise pathological effects on fish eggs and larvae ..................................................... 57
Table 6.8- Summary of impacts of seismic airguns on marine invertebrates based on literature reviews ............. 59
Table 6.9- Impacts of explosives on a number of bivalve molluscs ......................................................................... 62
Table 6.10- Impacts of seismic airguns on a number of bivalve molluscs ............................................................... 63
Table 6.11– Estimated sound levels for various locations relative to the NWSR South MC MSS operational area 69
Table 6.12 - Results of airgun exposure to marine turtles ....................................................................................... 73
Table 6.13 - Sounds produced by baleen whales that may be encountered during the NWSR South MC MSS ...... 74
Table 6.14- ADIOS2 Spill Modelling Results for a 220m3 Diesel Spill ....................................................................... 88

TGS NWSR South MC MSS - Environment Plan Summary
Rev 1 Page v
Table 6.15- Summary of Sensitivities that may be impacted based on ADIOS modelling ....................................... 89
Table 6.16- Summary of Potential Impacts from a Large Diesel Spill ...................................................................... 94
Table 9.1 –Summary of Stakeholder Responses and Commitments ..................................................................... 109

TGS NWSR South MC MSS - Environment Plan Summary
Rev 0 Page 6
1. INTRODUCTION TGS-NOPEC Geophysical Company Pty Ltd (TGS) proposes to acquire multi-client (MC) two-dimensional (2D) and three-dimensional (3D) marine seismic surveys (MSS), within the North West Shelf Region (NWSR) South MC MSS operational area, in waters offshore from Western Australia (WA; see Figure 1.1). The NWSR South MC MSS
operational area is comprised of a polygon that covers a total area of 302, 052 km2. The NWSR South MC MSS operational area was originally part of a larger proposed Environment Plan (EP) that extended into the waters off the Northern Territory, but has subsequently been separated into individual EPs. As such, some figures within this Summary may reference the original larger polygon. The Environment Plan (EP) has the objective of covering MC 2D and 3D MSS over specific petroleum titles and adjacent vacant acreage for the NWSR South MC MSS polygon throughout a period of five years. The scope of the EP covers all seismic data acquisition activities (including line run-ins and run-outs and line turns) and normal vessel movements and operations (survey and support vessels) within petroleum titles (Exploration Permits, Production Licences, and Retention Leases), acreage release areas and adjacent open acreage within the boundaries of the operational area. It does not cover the transit of the survey or support vessels to and from the survey location. This EP also covers deployment and retrieval of all components of the towed seismic array (acoustic source, streamers and associated equipment—vanes, tail buoys, birds etc.) and all emergency response activities associated with the activity. 1.1 LOCATION OF THE ACTIVITY The NWSR South MC MSS operational area lies entirely in Commonwealth waters, mainly within the North-west Marine Region (NWMR), and extending slightly into the South-west Marine Region (SWMR). Water depths in the
operational area range from 25 m to >5,000 m (see Figure 1.1 and 1.2), however the seismic array will not be operated in waters shallower than 50 m. The operational area extends from Kalbarri northwards to the waters off Port Hedland. Distances to sensitive environments and shorelines are presented in Table 1.1. TGS shall apply to the National Offshore Petroleum Titles Administrator (NOPTA) for appropriate Access Authorities and/or Special Prospecting Authorities prior to activities commencing.
Figure 1.1 – Location of NWSR South polygon showing bathymetry

TGS NWSR South MC MSS - Environment Plan Summary
Rev 0 Page 7
Figure 1.2 - Location map NWSR South MC MSS polygon

TGS NWSR South MC MSS - Environment Plan Summary
Rev 0 Page 1
Table 1.1 – Distances from the operational area to sensitive environments and shorelines
Sensitive Environment Distance from operational area
North Island (Abrolhos) 50 km
Kalbarri 55 km
Zuyptorf Cliffs 50 km
Shark Bay World Heritage Area 7 km
Carnarvon 91 km
Dirk Hartog Island 13 km
Dorre Island 34 km
Ningaloo 35 km
Ningaloo World Heritage Area 20 km
Ningaloo State Marine Park 28 km
North West Cape 34 km
Bessieres Islands 7 km
Barrow Island 25 km
Thevenard Island 17 km
Muiron Islands 25 km
Montebello Islands 25 km
Legendre Island (Dampier Archipelago) 25 km
Port Hedland 65 km
1.2 TIMING OF THE ACTIVITY The NWSR South MC MSS EP is designed to cover a period of five years. The timing of commencement and duration of individual surveys to be acquired within the NWSR South MC MSS operational area have not yet been determined. However, the commencement of each survey will depend on fair sea state conditions suitable for marine seismic acquisition, the availability of a survey vessel for conducting the survey, client data schedule requirements and granting of approvals from the appropriate government bodies. As far as practicable, every effort will be made to avoid undertaking seismic acquisition in the biologically important areas (BIA) for various species including humpback and blue pygmy whales, whale sharks and flatback turtles during peak migration and nesting periods.

TGS NWSR South MC MSS - Environment Plan Summary
Rev 1 Page 2
2. DESCRIPTION OF THE ACTIVITY 2.1 SEISMIC PROGRAMME 2.1.1 Survey Parameters The proposed marine seismic surveys will be typical 2D and 3D surveys similar to most others conducted in Australian marine waters (in terms of technical methods and procedures). No unique or unusual equipment or operations are proposed. Surveys will be conducted using a purpose-built seismic survey vessel that will traverse a series of pre-determined
sail lines within the operational area at a speed of 4.5 knots. As the vessels travel along the survey lines a series of noise pulses (no less than every 5 seconds) will be directed down through the water column and seabed. The released sound is attenuated and reflected at geological boundaries and the reflected signals are detected using sensitive microphones arranged along a number of hydrophone cables (streamers) towed behind the survey vessel(s). The reflected sound is recorded, then processed to provide information about the structure and composition of geological formations below the seabed in an attempt to identify hydrocarbon reservoirs.
A summary of the seismic survey parameters is provided in Table 2.1. The acoustic source tow depth will be 7.0 m. The streamer tow depth may vary between 8–30 m. Steamers will be towed at a depth that will not allow them to be closer than 10 m from the seabed. There will be no seismic data acquisition (i.e. shotpoints) in water depths shallower than 50 m across all of the NWSR South MC MSS operational area.
Table 2.1- NWSR South MC MSS acquisition parameters
Parameter Value
3D MSS 2D MSS
No. of streamers 12 - 14 (solid) 1 (solid)
Streamer length 8,100 m 10,000 m
Streamer spacing 100–150 m -
Streamer depth 8–30 m 8–30 m
Size of acoustic source 4,120 cui 4,120 cui
Operating pressure 2,000 psi 2,000 psi
Source interval 25 m 25 m
Source depth 7.0 m (+/-1 m) 7.0 m (+/-1 m)
Source peak positive SPL 260 dB re 1µPa (at 1 m) 260 dB re 1µPa (at 1 m)
Source SEL 235 dB re 1µPa2.s (at 1 m) 235 dB re 1µPa2.s (at 1 m)
Frequency range 1–200 Hz 1–200 Hz
2.2 SURVEY VESSELS 2.2.1 Seismic Survey Vessels All surveys will be conducted using a purpose-built seismic survey vessel. Any survey vessel(s) used will have all necessary certification/registration and be fully compliant with all relevant MARPOL and SOLAS convention requirements specific for the vessels’ size and purpose. The seismic survey vessels will have an implemented and tested Shipboard Oil Pollution Emergency Plan (SOPEP), in accordance with Regulation 37 of Annex I of MARPOL 73/78. The use of helicopters may be required for the transfer of personnel to and from the survey vessel. 2.2.2 Support Vessel During the surveys, it is possible that the survey vessel will be refuelled at sea using a support vessel, either within or immediately adjacent to the survey area. At sea refuelling will only take place during daylight hours and will not take place within a distance of 25 km (at a minimum) from any emergent land or shallow water features (<20 m water depth). A support/chase vessel may also be utilised to re-supply the survey vessel with other logistical supplies, accompany the survey vessel to maintain a safe distance between the towed array and other vessels, and manage interactions with shipping and fishing activities, if required. Support vessels will have an implemented and tested SOPEP (if over 400GRT) or equivalent.

TGS NWSR South MC MSS - Environment Plan Summary
Rev 1 Page 3
3. DESCRIPTION OF THE ENVIRONMENT 3.1 REGARD FOR EPBC ACT Under streamlining arrangements, impacts on the following matters protected under Part 3 of the Environment Protection and Biodiversity Conservation Act 1999 (EPBC Act) are now assessed through NOPSEMA:
World Heritage properties
National Heritage places
wetlands of international importance
listed threatened species and ecological communities
listed migratory species
Commonwealth marine area. TGS shall have regard to all matters pertaining to the above by ensuring that activities are managed to an ALARP and acceptable level through a robust evaluation process and the implementation of identified control measures. 3.2 MANAGEMENT AREAS The NWSR South MC MSS operational area is divided into Management Areas to reflect nominal boundaries for spatial and temporal variations for seismic acquisition within specified distances of particular sensitivities (e.g. humpback whale migration BIA) and to assist with the planning of individual surveys (Figure 3.1).
Area A (Inshore) extends westwards from the eastern margin of the polygon, to the edge of the pygmy blue whale migration BIA.
Area B (midshore) follows the identified BIA for the pygmy blue whale. o Area B is further divided into two subsections, B1 and B2 reflecting environmental sensitivities
such as BIAs for humpback whales.
Area C (offshore) extends from the western edge of the pygmy blue whale BIA to the western boundary of the NWSR South MC MSS polygon.
These Management Areas are referred to in relation to the implementation of various control measures presented in this Summary.

TGS NWSR South MC MSS - Environment Plan Summary
Rev 0 Page 4
Figure 3.1 – Management Areas within the NWSR South MC MSS Operational Area

TGS NWSR South MC MSS - Environment Plan Summary
Rev 0 Page 5
3.3 REGIONAL SETTING The NWSR South MC MSS operational area covers a large area of Commonwealth waters off WA, incorporating sections of the NWMR and SWMR. Based on the IMCRA Provincial Bioregions which are based on fish, benthic habitat and oceanographic data, there are eight bioregions overlapped:
South-west Marine Region o Central Western Province o Southwest Shelf Transition
North-west Marine Region o Northwest Transition o Northwest province o Northwest Shelf Province o Central Western Transition o Central Western Shelf Transition o Central Western Shelf Province.
3.4 SOUTH-WEST MARINE REGION The operational area overlaps the most northern area of the SWMR which has a climate consistent with warm dry summers and cool wet winters. The three dominant currents are the Leeuwin Current, the Leeuwin Undercurrent (LUC) and the Capes Current which are believed to increase productivity in the SWMR through the mixing of transported nutrients. Sediments within the shelf are predominately sand with surface sediments comprised mainly of bioclasts (skeletal remains of organisms). The continental shelf within this region is complex, comprising of offshore ridges, near-shore limestone ridges, depressions and inshore pinnacles up to 20 m tall. The continental slope in this region is steep and muddy, and includes more submarine canyons than anywhere else in Australia (DEWHA 2008b). The continental rise and abyssal plains account for a large area of the region and are comprised of mud sediments found at depths >4,000 m. Coral communities, including patch or fringing reefs occur in shallow water, sub-tidal environments of the SWMR as well as around intertidal areas adjacent to islands and other emergent features (DEWHA 2007). The coral reefs of the Abrolhos Islands which support substantial populations of finfish including large species such as baldchin groper
and coral trout as well as sharks, are located 45 km from the NWSR South operational area. Further offshore in the Central Western Province, demersal slope fish assemblages are characterised by high species diversity. Scientists have described 480 species of demersal fish that inhabit the slope, of which 31 are considered endemic. Below 400 m water depth, demersal fish communities are characterised by a diverse assemblage where relatively small, benthic species (grenadiers, dogfish and cucumber fish) dominate. In the SWMR, western rock lobsters (WRL; Panulirus cygnus) can be found north of Cape Leeuwin to a depth of 150 m but move between marine environments during the course of their life cycle (DSEWPaC 2012b; DEWR 2006). During the inshore reef period, the WRL are important prey for a range of commercial and recreational species, such as octopus, cuttlefish, baldchin groper, blue groper, dhufish, pink snapper, wirrah cod, breaksea cod and Australian sea lions (DSEWPaC 2012b; DEWR 2006). 3.5 THE NORTH-WEST MARINE REGION The NWMR extends from offshore of Kalbarri to the Western Australian/Northern Territory border and is distinguished by its predominantly wide continental shelf, very high tidal regimes (especially in the north), very high cyclone incidence, unique current systems, and warm low-nutrient surface waters. The region supports high species-richness of tropical Indo-west Pacific biota, but low levels of endemism (DSEWPaC 2012d). The NWSR South MC MSS will be subject to an arid (mainly summer rain) subtropical climate with tropical cyclone activity from December to March (BoM 2000, Pearce et al. 2003). Currents within the Region include: the South Equatorial Current; the Indonesian Throughflow; the Eastern Gyral Current; and the Leeuwin Current (DEWHA 2007). Seasonal surface currents in the region are the Ningaloo Current, the Holloway Current, the Shark Bay Outflow and the Capes Current (DEWHA 2008a). The mean rate of ocean currents throughout the year is usually less than 0.5 knots (Skewes et al. 1999).
TGS NWSR South MC MSS - Environment Plan Summary
Rev 0 Page 6
Astronomical tides on the NWMR are semi-diurnal and generally quite large. Tidal ranges increase in amplitude from
north to south, corresponding with the increasing width of the shelf and range from 2 m at Exmouth to ~10 m near Broome. Tidal amplitude from south to north is most marked north of the Montebello Islands, where the width of the continental shelf increases significantly (Heyward et al. 2000). The NWMR is composed primarily of continental slope and continental shelf. Overall, the region is relatively shallow, with water depths of less than 200 metres over more than 40% of its area. Extensive carbonate banks and coral reefs are important focal points for biodiversity in the region. There are a number of islands and reefs within the NWMR, all of which are located outside the NWSR South operational area (distances are provided in Table 1.1). Rankin Bank and Glomar Shoals are drowned reefs of higher productivity in the region, associated with larger commercial fish species, but are contained within exclusion zones. The NWMR has high species diversity, but fewer endemic species than are present in cooler and more temperate waters. High species richness may be associated with the diversity of habitats available including hard seafloor areas, submerged cliffs and coral reefs of the Kimberley, and atolls and reefs on the edge of the shelf. These habitats support a high diversity of benthic filter-feeders and producers. Soft bottom substrates include areas of sandy seafloor that support seagrass habitat along the Pilbara coast, muddy substrates on the slope, as well as the deep waters of the Cuvier Abyssal Plain and the Argo Abyssal Plain, which support sparsely distributed sessile organisms such as filter-feeding and deposit-feeding species. Seagrass beds are said to provide critical habitats for fish and dugongs and are important for sustaining many of the fish populations of the NWSR (DEWHA 2007). Seagrasses are predominantly found in WA State waters inshore of the operational area around the reefs and islands such as Montebello’s, Barrow Island, Ningaloo, Shark Bay and Dampier Archipelago (Geoscience 2002; Kirkman 1997). Similarly macroalgae occurs predominantly in the intertidal and shallow sub-tidal waters on hard substrates, inshore of the operational area. The sandy substrates on the shelf are thought to support low density benthic communities of bryozoans, molluscs and echinoids. Sponge diversity between reefs is not uncommon in the NWMR; sponges have larvae that do not move very far, and settle out of the water column quickly, resulting in minimal larval exchange and high population differentiation (DEWHA 2007, 2008a). Some sponge species and filter-feeding communities found in deeper waters offshore from the Ningaloo Reef appear to be significantly different to those of the Dampier Archipelago and Abrolhos Islands, indicating that the Commonwealth waters have some areas of potentially high and unique sponge biodiversity (Rees et al. 2004). Coral communities are identified at Shark Bay, particularly the eastern shores of Bernier, Dorre and Dirk Hartog Islands due to shelter, and water with relatively small salinity and temperature fluctuations. Ningaloo Reef supports variable lagoonal, intertidal and subtidal coral communities along its length with the most diverse coral communities in the shallow relatively clear water, high energy environment of the fringing barrier reef and low energy lagoonal areas to the west of North West Cape (CALM 2005). Coral diversity reduces with increasing depth, and corals are uncommon at depths greater than 40 m (Waples & Hollander 2008). The offshore Pilbara region contains numerous small coastal islands in addition to larger archipelago; many which are surrounded by shallow waters with small barrier and fringing reefs that support coral communities. Key areas recognised for coral communities in this bioregion include the Dampier Archipelago, Montebello, Lowendal and Barrow Islands. Coral distribution near the mainland is restricted by lack of light due to natural turbidity. Multi-specific, synchronous spawning (mass spawning) of scleractinian corals has been recorded in the Dampier Archipelago, at Ningaloo Reef, and at other reefs in the region. Mass spawning occurs around the third quarter of the moon (i.e. 7–9 nights after the full moon) on neap, nocturnal ebb tides in March and April each year. Surveys undertaken by Chevron (Chevron 2010) for the Gorgon gas pipeline identified high profile reefs to the west of Barrow island in ~ 40 -50 m, but observed that they were too deep to support well-developed benthic primary producer assemblages. Instead they supported filter-feeding invertebrates including sponges, gorgonians, black corals, sea whips, ascidians and bryozoans. These reefs are not overlapped by the operational area, but supports the data on Rankin Bank and Glomar Shoal indicating that within the Pilbara offshore waters, there is limited habitat to support site-attached species in waters deeper than 40 m. The NWMR is thought to contain a high diversity of crustaceans across a range of habitats, from intertidal sites to the deeper waters of the slope and the abyss. Dominant species groups include copepods, prawns, scampi and crabs.

TGS NWSR South MC MSS - Environment Plan Summary
Rev 0 Page 7
Approximately 81 different species of cephalopod are believed to occur in the NWMR, five of which may be endemic as they have only been recorded from one location or are thought to have a very restricted distribution (DEWHA 2008a). The NWMR supports a diverse assemblage of fish, particularly in shallow water near the mainland and around islands. Most fish have tropical distributions and are well-distributed throughout the Indo-west Pacific region. Pelagic fish are highly mobile and have a wide geographic distribution (DEWHA 2008a). Shoreline habitats within the NWMR include sandy beaches, mangroves, and intertidal rocky shores. 3.6 KEY ECOLOGICAL FEATURES Nine Key Ecological Features (KEFs) overlap the NWSR South MC MSS operational area as identified by the search of the Department of Environment’s Protected Matters Search Tool (PMST) database:
Ancient coastline at 90–120 m depth Escarpment with their varying elevation and prominence create topographic complexity, such as the exposure of rocky substrate (Williams et al. 2010). These assist in increasing benthic biodiversity (DSEWPaC 2012a).
Ancient coastline at 125 m depth contour
Ancient submerged coastline provides areas of hard substrate and may contribute to higher diversity and enhanced species richness relative to soft sediment habitat. Enhanced productivity may attract larger marine life such as whale sharks and large pelagic fish (DEWHA 2007) and humpback whales appear to migrate along the ancient coastline (DNP 2013).
Canyons linking the Cuvier Abyssal Plain and the Cape Range Peninsula
Upwellings, created by strong internal tides at the canyon heads assist with creating conditions for enhanced productivity. These canyons are believed to support the productivity and species richness of Ningaloo Reef (Brewer et al. 2007). The hard substrates of the canyons’ sides provide habitat for deepwater snappers and other species and aggregations of whale sharks, manta rays, humpback whales, sea snakes, sharks, large predatory fish and seabirds are known to occur in this area (Sleeman et al. 2007).
Continental Slope Demersal Fish Communities
The continental slope demersal fish communities are a rich assemblage of some 500 fish species, 76 of which are endemic to the bioregion
Demersal slope and associated fish communities of the Central Western Province
The western demersal slope provides an important habitat for demersal fish communities, with a high level of diversity and endemism. Scientists identified 480 species of fish that inhabit the slope of this region, 31 of which are endemic to the region.
Glomar Shoals The Glomar Shoals are a submerged feature located 100 km north of Dampier on the Rowley Shelf in a high energy environment subject to strong currents. They lie at a
depth of 30–77 m and consist of a high percentage of marine derived sediments with high carbonate content including gravels of weathered coralline algae and shells (Falkner et al. 2009; McLaughlin &Young 1985). The Glomar Shoals are regionally important for their high biological diversity and high localised productivity. They are an important habitat for commercial and recreational fish species such as Rankin cod, brown striped snapper, red emperor, crimson snapper, bream and yellow-spotted triggerfish (Falkner et al. 2009).
Exmouth Plateau It is an important sea-floor feature that modifies the flow of deep waters and has been identified as a site where internal waves are generated by internal tides, giving rise to the most dynamic and unique oceanographic feature in the Region. The plateau also receives settling detritus and other matter from the pelagic environment.
Perth Canyon and adjacent shelf break, and other west coast canyons
The west coast systems of canyons includes the Geographe, Busselton, Pelsart, Geraldton, Wallaby, Houtman and Murchison canyons and Australia’s largest ocean canyon, the Perth Canyon (DEWR 2006). Canyons are known to be associated with higher productivity and species diversity than surrounding slope areas of similar depth or distance offshore (DSEWPaC 2012b, DEWR 2006). Canyon features are important feeding and breeding areas for a variety of fish species and marine mammals.
Western rock lobster This species is the dominant large benthic invertebrate in the region. The lobster plays an important trophic role in many of the inshore ecosystems of the SWMR. Western rock lobsters are an important part of the food web on the inner shelf, particularly as juveniles (DSEWPaC 2012b).
Four KEFs are adjacent to the NWSR South MC MSS polygon: Commonwealth marine environment within and adjacent to the west coast inshore lagoons
A chain of inshore lagoons running parallel to the coast are sheltered from exposure to the ocean by a distinct north-south oriented limestone barrier reef system and provides shallow-water reef habitats for many assemblages and extensive beds of macroalgae and seagrass. Associated with increased productivity and many important species, as well recruitment of the commercially and recreationally important western rock

TGS NWSR South MC MSS - Environment Plan Summary
Rev 0 Page 8
lobster, dhufish, pink snapper, breaksea cod, baldchin and blue groper, abalone and many reef species. Migratory species (such as herring, garfish, tailor and Australian salmon) visit the area annually.
Commonwealth marine environment surrounding the Houtman Abrolhos Islands
The Houtman Abrolhos Islands and surrounding reefs (a complex of 122 islands and reefs) support a unique mix of tropical and temperate species, resulting from the southward transport of species by the Leeuwin Current over thousands of years. The Houtman Abrolhos Islands are the largest seabird breeding station in the eastern Indian Ocean. They support more than one million pairs of breeding seabirds (DSEWPaC 2012b).
Commonwealth waters adjacent to Ningaloo Reef
Ningaloo Reef is globally significant as the only extensive coral reef in the world that fringes the west coast of a continent and as a seasonal aggregation site for whale sharks. The Australian Commonwealth waters adjacent to Ningaloo Reef and associated canyons and plateau are interconnected and support the high productivity and species richness. The Ningaloo Reef system supports aggregations and migration pathways of whale sharks, manta rays, humpback whales, sea snakes, sharks, large predatory fish and seabirds (Donovan et al. 2008, Gunn et al. 1999, Waples & Hollander 2008).
Wallaby Saddle.
The Wallaby Saddle is an important seafloor feature, and it is associated with enhanced biological productivity in an area of generally low productivity. The saddle is shallower than adjoining abyss areas to the north and south and is the site of upwellings of deeper, more nutrient-rich waters. Aggregations of sperm whales are thought to occur on the Wallaby Saddle and feed on aggregations of small pelagic fish.

TGS NWSR South MC MSS - Environment Plan Summary
Rev 0 Page 9
Figure 3.2– Key Ecological Features
*NB: only the lower polygon is the NWSR South operational area and the subject of this Summary

TGS NWSR South MC MSS - Environment Plan Summary
Rev 1 Page 10
3.7 PROTECTED MARINE FAUNA The operational area and surrounding waters supports numerous listed threatened and migratory species as listed under the EPBC Act:
Table 3.1 – Threatened and Migratory Species that may occur within and around the Operational Area
Species Common name Protection
status Threatened
status Migratory
status
Cetaceans (Whales and Dolphins)
Balaenoptera acutorostrata Minke Whale Cetacean - -
Balaenoptera bonaerensis Antarctic Minke Whale, Dark-shoulder Minke Whale
Cetacean - Migratory
Balaenoptera borealis Sei Whale Cetacean Vulnerable Migratory
Balaenoptera edeni Bryde's Whale Cetacean Migratory
Balaenoptera musculus Blue Whale Cetacean Endangered Migratory
Balaenoptera physalus Fin Whale Cetacean Vulnerable Migratory
Delphinus delphis Common Dolphin, Short-beaked Common Dolphin
Cetacean - -
Eubalaena australis Southern Right Whale Cetacean Endangered Migratory
Feresa attenuata Pygmy Killer Whale Cetacean - -
Globicephala macrorhynchus
Short-finned Pilot Whale Cetacean - -
Globicephala melas Long-finned Pilot Whale Cetacean - -
Grampus griseus Risso's Dolphin, Grampus Cetacean - -
Indopacetus pacificus Longman's Beaked Whale Cetacean - -
Kogia breviceps Pygmy Sperm Whale Cetacean - -
Kogia simus Dwarf Sperm Whale Cetacean - -
Lagenodelphis hosei Fraser's Dolphin, Sarawak Dolphin
Cetacean - -
Lagenorhynchus obscurus Dusky Dolphin Cetacean - Migratory
Megaptera novaeangliae Humpback Whale Cetacean Vulnerable Migratory
Mesoplodon densirostris Blainville's Beaked Whale, Dense-beaked Whale
Cetacean - -
Mesoplodon ginkgodens Gingko-toothed Beaked Whale, Gingko-toothed Whale
Cetacean - -
Mesoplodon grayi Gray's Beaked Whale, Scamperdown Whale
Cetacean - -
Orcinus orca Killer Whale, Orca Cetacean - Migratory
Peponocephala electra Melon-headed Whale Cetacean - -
Physeter macrocephalus Sperm Whale Cetacean - Migratory
Pseudorca crassidens False Killer Whale Cetacean - -
Sousa chinensis Indo-Pacific Humpback Dolphin Cetacean - Migratory
Stenella attenuata Spotted Dolphin, Pantropical Spotted Dolphin
Cetacean - -
Stenella coeruleoalba Striped Dolphin, Euphrosyne Dolphin
Cetacean - -
Stenella longirostris Long-snouted Spinner Dolphin Cetacean - -
Steno bredanensis Rough-toothed Dolphin Cetacean - -
Tursiops aduncus Indian Ocean Bottlenose Dolphin, Spotted Bottlenose Dolphin
Cetacean - -
Tursiops aduncus (Arafura/Timor Sea populations)
Spotted Bottlenose Dolphin (Arafura/Timor Sea populations)
Cetacean - Migratory
Tursiops truncatus s. str. Bottlenose Dolphin Cetacean - -
Ziphius cavirostris Cuvier's Beaked Whale, Goose-beaked Whale
Cetacean - -
Pinniped

TGS NWSR South MC MSS - Environment Plan Summary
Rev 1 Page 11
Species Common name Protection
status Threatened
status Migratory
status
Neophonca cinerea Australian Sea-lion Listed Marine Vulnerable -
Sirenia
Dugong dugon Dugong Listed Marine - -
Fish
Acentronura australe Southern Pygmy Pipehorse Listed Marine - -
Acentronura larsonae Helen's Pygmy Pipehorse Listed Marine - -
Bulbonaricus brauni Braun's Pughead Pipefish, Pug-headed Pipefish
Listed Marine - -
Campichthys galei Gale's Pipefish Listed Marine - -
Campichthys tricarinatus Three-keel Pipefish Listed Marine - -
Choeroichthys brachysoma Pacific Short-bodied Pipefish, Short-bodied Pipefish
Listed Marine - -
Choeroichthys latispinosus Muiron Island Pipefish Listed Marine - -
Choeroichthys suillus Pig-snouted Pipefish Listed Marine - -
Corythoichthys flavofasciatus
Reticulate Pipefish, Yellow-banded Pipefish, Network Pipefish
Listed Marine - -
Cosmocampus banneri Roughridge Pipefish Listed Marine - -
Doryrhamphus dactyliophorus
Banded Pipefish, Ringed Pipefish Listed Marine - -
Doryrhamphus excisus Bluestripe Pipefish, Indian Blue-stripe Pipefish, Pacific Blue-stripe Pipefish
Listed Marine - -
Doryrhamphus janssi Cleaner Pipefish, Janss' Pipefish Listed Marine - -
Doryrhamphus multiannulatus
Many-banded Pipefish Listed Marine - -
Doryrhamphus negrosensis Flagtail Pipefish, Masthead Island Pipefish
Listed Marine - -
Festucalex cinctus Girdled Pipefish Listed Marine - -
Festucalex scalaris Ladder Pipefish Listed Marine - -
Filicampus tigris Tiger Pipefish Listed Marine - -
Halicampus brocki Brock's Pipefish Listed Marine - -
Halicampus grayi Mud Pipefish, Gray's Pipefish Listed Marine - -
Halicampus nitidus Glittering Pipefish Listed Marine - -
Halicampus spinirostris Spiny-snout Pipefish Listed Marine - -
Haliichthys taeniophorus Ribboned Pipehorse, Ribboned Seadragon
Listed Marine - -
Hippichthys penicillus Beady Pipefish, Steep-nosed Pipefish
Listed Marine - -
Hippocampus angustus Western Spiny Seahorse, Narrow-bellied Seahorse
Listed Marine - -
Hippocampus breviceps Short-head Seahorse, Short-snouted Seahorse
Listed Marine - -
Hippocampus histrix Spiny Seahorse, Thorny Seahorse Listed Marine - -
Hippocampus kuda Spotted Seahorse, Yellow Seahorse
Listed Marine - -
Hippocampus planifrons Flat-face Seahorse Listed Marine - -
Hippocampus subelongatis West Australian Seahorse Listed Marine - -
Hippocampus spinosissimus Hedgehog Seahorse [66239] Listed Marine - -
Lissocampus fatiloquus Prophet's Pipefish [66250] Listed Marine - -
Maroubra perserrata Sawtooth Pipefish Listed Marine - -
Micrognathus micronotopterus
Tidepool Pipefish [66255] Listed Marine - -
Mitotichthys meraculus Western Crested Pipefish Listed Marine - -
Nannocampus subosseus Bonyhead Pipefish Listed Marine - -
Phycodurus eques Leafy Seadragon Listed Marine - -

TGS NWSR South MC MSS - Environment Plan Summary
Rev 1 Page 12
Species Common name Protection
status Threatened
status Migratory
status
Phyllopteryx taeniolatus Common Seadragon, Weedy Seadragon
Listed Marine - -
Phoxocampus belcheri Black Rock Pipefish Listed Marine - -
Pugnaso curtirostris Pugnose pipefish Listed Marine - -
Solegnathus hardwickii Pallid Pipehorse, Hardwick's Pipehorse
Listed Marine - -
Solegnathus lettiensis Gunther's Pipehorse, Indonesian Pipefish
Listed Marine - -
Solenostomus cyanopterus Robust Ghostpipefish, Blue-finned Ghost Pipefish
Listed Marine - -
Solenostomus paegnius Rough-snout Ghost Pipefish Listed Marine - -
Stigmatopora argus Spotted Pipefish, Gulf Pipefish Listed Marine - -
Stigmatopora nigra Widebody Pipefish, Wide-bodied Pipefish, Black Pipefish
Listed Marine - -
Syngnathoides biaculeatus Double-end Pipehorse, Double-ended Pipehorse, Alligator Pipefish
Listed Marine - -
Trachyrhamphus bicoarctatus
Bentstick Pipefish, Bend Stick Pipefish, Shorttailed Pipefish
Listed Marine - -
Trachyrhamphus longirostris
Straightstick Pipefish, Long-nosed Pipefish, Straight Stick Pipefish
Listed Marine - -
Urocampus carinirostris Hairy Pipefish Listed Marine - -
Vanacampus maragitifer Mother-of-pearl Pipefish Listed Marine - -
Marine Reptiles (Sea Snakes and Turtles)
Acalyptophis peronii Horned Seasnake Listed Marine - -
Aipysurus apraefrontalis Short-nosed Seasnake Listed Marine Critically
Endangered -
Aipysurus duboisii Dubois' Seasnake Listed Marine - -
Aipysurus eydouxii Spine-tailed Seasnake Listed Marine - -
Aipysurus laevis Olive Seasnake Listed Marine - -
Aipysurus pooleorum Shark Bay Seasnake Listed Marine - -
Aipysurus tenuis Brown-lined Seasnake Listed Marine - -
Astrotia stokesii Stokes' Seasnake Listed Marine - -
Caretta caretta Loggerhead Turtle Listed Marine Endangered Migratory
Chelonia mydas Green Turtle Listed Marine Vulnerable Migratory
Dermochelys coriacea Leatherback Turtle Listed Marine Endangered Migratory
Disteira kingii Spectacled Seasnake Listed Marine - -
Disteira major Olive-headed Seasnake Listed Marine - -
Emydocephalus annulatus Turtle-headed Seasnake Listed Marine - -
Ephalophis greyi North-western Mangrove Seasnake
Listed Marine - -
Eretmochelys imbricata Hawksbill Turtle Listed Marine Vulnerable Migratory
Hydrelaps darwiniensis Black-ringed Seasnake Listed Marine - -
Hydrophis czeblukovi Fine-spined Seasnake Listed Marine - -
Hydrophis elegans Elegant Seasnake Listed Marine - -
Hydrophis mcdowelli null Listed Marine - -
Hydrophis ornatus Spotted Seasnake, Ornate Seasnake
Listed Marine - -
Natator depressus Flatback Turtle Listed Marine Vulnerable Migratory
Pelamis platurus Yellow-bellied Seasnake Listed Marine - -
Seabirds and Shorebirds
Anous stolidus Common noddy Listed Marine Migratory
Anous tenuirostris melanops
Australian Lesser Noddy Listed Marine Vulnerable -

TGS NWSR South MC MSS - Environment Plan Summary
Rev 1 Page 13
Species Common name Protection
status Threatened
status Migratory
status
Apus pacificus Fork-tailed Swift Listed Marine - Migratory
Ardea alba Great Egret, White Egret Listed Marine - Migratory
Calonectris leucomelas/ Puffinus leucomelas
Streaked Shearwater Listed Marine - Migratory
Catharacta skua Great Skua Listed Marine - -
Diomedea amsterdamensis Amsterdam Albatross Listed Marine Endangered Migratory
Diomedea dabbenena Tristan Albatross Listed Marine Endangered Migratory
Diomedea epomophora (senso stricto)
Southern Royal Albatross Listed Marine Vulnerable Migratory
Diomedea exulans (sensu lato)
Wandering Albatross Listed Marine Vulnerable Migratory
Fregata ariel Lesser Frigatebird Listed Marine - Migratory
Haliaeetus leucogaster White-bellied sea eagle Listed
Terrestrial - Migratory
Larus novaehollandiae Silver gull Listed Marine - -
Macronectes giganteus Southern Giant-Petrel Listed Marine Endangered Migratory
Macronectes halli Northern Giant-Petrel Listed Marine Vulnerable Migratory
Pandion haliaetus Osprey Listed Marine - -
Pterodroma macroptera Great-winged Petrel Listed Marine - -
Pterodroma mollis Soft-plumaged Petrel Listed Marine Vulnerable -
Puffinus assimilis Little Shearwater Listed Marine - -
Puffinus carneipes Flesh-footed Shearwater, Fleshy-footed Shearwater
Listed Marine - Migratory
Rostratula benghalensis / Australis (sensu lato)
Painted snipe Listed
Wetlands Endangered Migratory
Sterna anaethetus Bridled Tern Listed Marine - Migratory
Sterna bengalensis Lesser Crested Tern Listed Marine - Migratory
Sterna caspia Caspian Tern Listed Marine - Migratory
Sterna dougallii Roseate Tern Listed Marine - Migratory
Sterna fuscata Sooty Tern Listed Marine - -
Sula dactylatra Masked Booby Listed Marine - Migratory
Sula leucogaster Brown Booby Listed Marine - Migratory
Thalassarche carteri Indian Yellow-nosed Albatross Listed Marine Vulnerable Migratory
Thalassarche cauta (sensu stricto)
Shy Albatross, Tasmanian Shy Albatross
Listed Marine Vulnerable Migratory
Thalassarche impavida Campbell Albatross Listed Marine Vulnerable Migratory
Thalassarche melanophris Black-browed Albatross Listed Marine Vulnerable Migratory
Thalassarche steadi White-capped Albatross Listed Marine Vulnerable Migratory
Sharks and Rays
Carcharias taurus Grey Nurse Shark (west coast population)
Vulnerable -
Carcharodon carcharias Great White Shark Vulnerable Migratory
Isurus oxyrinchus Shortfin Mako, Mako Shark - Migratory
Isurus paucus Longfin Mako - Migratory
Lamna nasus Porbeagle, Mackerel Shark - Migratory
Manta birostris Giant Manta Ray - Migratory
Prisitis clavata Dwarf Sawfish, Queensland Sawfish
Vulnerable -
Rhincodon typus Whale Shark Vulnerable Migratory
The NWSR South MC MSS operational area is not considered a habitat that is critical to the survival of any listed species. Similarly, there are no EPBC Act-listed threatened ecological communities within the vicinity.

TGS NWSR South MC MSS - Environment Plan Summary
Rev 1 Page 14
3.7.1.1 Humpback Whales Humpback whales are listed as Vulnerable and Migratory under the EPBC Act and due to increasing numbers have recently been removed from the threatened species list under the WA Wildlife Conservation Act 1950. They are the most commonly sighted whale in northern WA waters. A review of the conservation status of the humpback whale considered it to be of ‘Least Concern’. The Action Plan for Australian Mammals 2012 by Woinarski et al., 2014, and a recent paper from Bejder et al., 2015 recommend that humpback whales no longer meet any criteria for listing as threatened under the EPBC Act. After feeding in Antarctic waters during the summer months (Bannister and Hedley 2001), the species has been observed seasonally to complete their northern migration in the Camden Sound area of the west Kimberley (Jenner et al. 2001), which is over 500 km northeast of the NWSR South MC MSS operational area. The NWSR South operational area overlaps the migration BIA only, with the identified resting BIA in Exmouth Gulf and Shark Bay more than 25 km from the polygon boundary. The recently released Approved Conservation Advice for Megaptera novaeangliae (humpback whale)’ (2015) identifies that the humpback whale migration pathway is within the continental shelf boundary or 200 m bathymetry along the WA coastline (DoE 2015). This route is fully contained within Management Areas A1 and B1 and does not overlap Management Area B2.
Figure 3.3- Migration area (north and south) for the humpback whale (Megaptera novaeangliae)
Source: Modified from DoE (2014b)
Although not acknowledged by the Conservation Advice, aerial surveys by Jenner and Jenner (2010) and Salgado-Kent et al. (2012) indicate that in waters adjacent to the North West Cape individuals are recorded to ~ 1,200 m contour which equates to ~ 80 km from North West Cape and so overlaps Management Area B2. The majority however, are within the 250-300 m contour (Jenner and Jenner 2010; Salgado-Kent 2012) which is ~ 30 km off the point and not overlapped by the operational area at all. It is anticipated that individuals may be encountered in deeper waters, possibly out to the ~1,200 m contour, but these are not anticipated in great numbers. Double et al. (2012) confirmed that migrating whales tend to travel within 50 km of the coast between North West Cape and Camden Sound, and frequently in very shallow water (most medians <40 m). This pattern is similar to the south-bound migration data, with the exception that the whales did not migrate into deeper waters off the western side of the Dampier Peninsula (Double et al. 2010, as cited in Double et al. 2012). The migration in the region is broadly characterised by three distinct directional phases:

TGS NWSR South MC MSS - Environment Plan Summary
Rev 1 Page 15
north-bound phase - starts in April, peaks in July and tapers off by August; around the Port Hedland area, northerly migrating humpback whale numbers peak during late July/early August (Jenner et al. 2001).
transitional phase - peak numbers expected between late August and early September
south-bound phase - usually occurring between late August and early September; although smaller numbers may occur until November (this phase of migration is segmented by 2–3 week delay in appearance of peak numbers of cow/calf pods after the main migratory body has passed).
These dates are further refined in Table 3.2, which indicates northern and southern migration times along the coastline, as sourced from Jenner et al (2001) and in relation to the NWSR South Management Areas.
Table 3.2 - NWSR South MC MSS polygon Management Areas vs. humpback whale migration phases
Location Management
Area Northbound Phase Southbound Phase
South West N/A June Late Oct – Early Nov
Perth Basin to Jurien N/A Mid – Late June Mid October
Jurien Bay to Carnarvon B1 Early to mid-July Late September
Carnarvon to Pt Cloates B1 Mid-Late July Mid-September
Exmouth Gulf Adj B2 Late July Mid-September
Montebello Islands A1 Late July Early September
Dampier Archipelago Islands A1 Late July – early August Late August – Early September
Dampier to Broome A1 Late July – early August Late August – Early September
Source: Jenner et al (2001).
These dates are consistent with findings from Salgado-Kent et al. (2012) who found peak numbers off the North West Cape for north and south bound animals was late-July to late August. However, the times during which humpback whales pass through a specific area along their migratory route varies
slightly each year by 3–4 weeks (Chittleborough 1965). Thus, given the uncertainty surrounding precise timing of migration, and based on information outlined above from various studies, the following conservative peak migration periods through the NWSR South MC MSS operational area have been identified:
Management Area A1 o Northerly - between 15 July and 15 August o Southerly - between 15 August and 30 September
Management Area B1 o Northerly - between 15 June and 15 August o Southerly - between 1 September and 15 October.

TGS NWSR South MC MSS - Environment Plan Summary
Rev 1 Page 16
3.7.1.2 Pygmy Blue Whale The NWSR South MC MSS operational area overlaps with the pygmy blue whale BIAs, including the known distribution/migratory pathway and a possible foraging BIA (Figure 3.4).
Figure 3.4- Migration area (north and south) and foraging area (known and possible) for the pygmy blue whale
(Balaenoptera musculus brevicauda) Source: Modified from DoE (2015a)
In the NWMR, pygmy blue whales migrate along the 500–1,000 m depth contour on the edge of the slope and are likely to be feeding on ephemeral krill aggregations (DoE 2015a, DEWHA 2007). The majority of the migration BIA is over 110 km wide where it overlaps the NWSR South operational area and therefore is not considered a narrow migratory corridor. McCauley and Jenner (2010) presented passive acoustic information collected during the pygmy blue whales’ annual transit past the Montebello Islands and identified:
a northerly pulse of animals (extended pulse in comparison to the southerly migrating animals) transiting through the area from late March to early August, with the highest densities of detections, and with peak migration period occurring during the months of June and July
a pulse of southerly transiting whales passing through the area from early October to late November, with the highest densities of detections, and a peak migration period occurring from early November to early December.
Based on the information above and other data presented by Double et al (2014) the peak pygmy blue whale migration times for the NWSR South operational area are as follows:
Management Area B1 o Peak northern migration - 1 May to 15 July o Peak southern migration - 1 November to 31 December
Management Area B2 o Peak northern migration - 15 May to 30 July o Peak southern migration - 15 October to 15 December.
TGS NWSR South MC MSS - Environment Plan Summary
Rev 1 Page 17
Based on limited knowledge of distribution and abundance, critical habitats are not defined for pygmy blue whales in Australia (DoE 2015a) with calving believed to occur in tropical waters in winter from May to June. Recognised foraging areas for the pygmy blue whale in WA are located in the Perth Canyon and in Geographe Bay, and possible foraging areas were identified recently off Exmouth and Scott Reef. However, the basis for the possible pygmy blue whale foraging area off Exmouth (i.e. in the NWMR South MC MSS operational area) is based on limited direct or indirect evidence (DoE 2015a), which contradicts scientific data confirming that low productivity levels occur in this area (Double et al. 2014). Alternatively, it is likely that the observed high density of pygmy blue whales off Exmouth and the North West Cape results from spatial constraints as the migratory pathway converges around the peninsula corner, rather than foraging activities (Double et al. 2014). Other whale species Although there are no recognised BIA within the operational area, other whale and dolphin species that may occur in the region, or migrate thought it, include:
southern right whale,
Brydes whale,
fin whales,
sei whales,
dwarf and Antarctic minke whales. However, it is unlikely they will be encountered in significant numbers. Oceanic dolphins Species known to occur in the NWS include the common, bottlenose and Risso’s dolphins. The bottlenose dolphin is coastal, estuarine, pelagic and oceanic in nature. Common dolphins are recorded in all Australian waters and are not thought to be migratory. Risso’s dolphin is distributed through all oceans, occurs inshore and offshore, but is generally considered pelagic and oceanic. The NWSR South MC MSS operational area does not contain any significant or critical habitat or feeding grounds for these dolphin species (DSEWPAC 2012). The bottlenose dolphin, spotted bottlenose and Indo-Pacific humpback dolphin occur in the shallow waters and known to occur near Barrow Island. Common, spinner and striped dolphins are also abundant in the waters around Barrow Island but their distribution is generally oceanic. There are no BIA for any dolphin species overlapping the NWSR South MC MSS polygon. Killer whales Killer whales are the largest member of the dolphin family and is probably the most cosmopolitan of all cetaceans seen in any marine region. Off Australia, killer whales are most often seen along the continental slope and on the shelf, particularly near seal colonies. No BIA for killer whales exists within or adjacent to the operational area. However, the species is known to occur in the region, and rare and infrequent observations of killer whales may occur within the operational area. 3.7.2 Dugong Dugongs generally occur in shallow tropical waters (less than 5 m deep) and where there are extensive seagrass meadows. Calving occurs in shallow waters <1 m deep between August and September, although some may calve as late as December. The Exmouth Gulf and Ningaloo Reef are recognised BIA for foraging and nursing, while the internal waters of Shark Bay are recognised as high density foraging areas. It is not anticipated that dugongs will be encountered in large numbers, as surveys are generally restricted to deeper waters and more than 30 km offshore from recognised dugong BIA. 3.7.3 Pinnipeds The BIA for foraging male and female Australian sea lions is limited to the waters around the Houtman Abrolhos
Islands, 50 km from the operational area. No Australian sea lion BIA overlaps with the NWSR South MC MSS operational area, however Australian sea lions have been recorded at Shark Bay (DoE 2014m). Subsequently, individuals may be encountered during the survey on a rare and infrequent basis, but given the distance from any known BIA, the numbers are not expected to be significant. 3.7.4 Marine Reptiles

TGS NWSR South MC MSS - Environment Plan Summary
Rev 1 Page 18
Five species of marine turtle may occur within or adjacent to the NWSR South MC MSS operational area: the leatherback, loggerhead, flatback, green and hawksbill turtle. Implementation of the EP and its control measures will ensure that impacts to marine turtles are minimised and meet the objectives and actions outlined within the Recovery Plan for Marine Turtles in Australia (EA 2003). A summary of turtle activities in the region is presented in Table 3.3. Marine turtles may be present in the inshore regions of the NWSR South MC MSS operational area, particularly flatback, green turtles, loggerhead and hawksbill. The foraging BIA for three species overlaps the operational area in two places:
green turtle BIA overlaps a 6 km x 1 km section; a seismic vessel travelling at 4.5 knots will transit this area in less than one (1) hour.
hawksbill turtle BIA overlaps a 30 km x 8 km off Thevenard Island and a seismic vessel may undertake a
required survey in the area within 8 hours.
reduced internesting buffer BIA for flatback turtles overlaps the polygon by an area similar to that of the hawksbill turtle.
Subsequently, it is not anticipated that large numbers of green, hawksbill or flatback turtles will be encountered in the NWSR South MC MSS operational area. Sea snakes are widespread through the waters of the NWS in offshore and near-shore habitats. They can be highly mobile and cover large distances or they may be restricted to relatively shallow waters and some species must
return to land to eat and rest. Given the water depths (25 m to >5,000 m) and distance offshore, is unlikely that sea snakes will be encountered during individual surveys undertaken within the NWSR South MC MSS polygon.

TGS NWSR South MC MSS - Environment Plan Summary
Rev 1 Page 19
Table 3.3 - Summary of marine turtle ecology on the North West Shelf
Species Flatback turtle Green turtle Hawksbill turtle Loggerhead turtle Leatherback turtle*
Ne
stin
g
Season Summer Summer Year Round Summer Summer
Commences December November Year Round November Mid December
Peaks January Jan - Feb Oct - Jan Late Dec - Early Jan January
Finishes Feb March Year Round March Mid-February
Internesting Buffer
80 km (proposed 20 km)
20 km 20 km 20 km -
Hatching season late January
(6 weeks incubation) January
(64 days incubation) year round late December
uncertain (60-94 days incubation based
on 3 observations)
Important Rookeries/
Foraging Areas
No Nesting areas in or adjacent to operational area. Internesting buffer BIA along coastal areas and islands between Thevenard Island and Port Hedland Islands of the Dampier Archipelago Inshore areas of the Kimberley Thevenard Island Barrow Island Montebello Islands Varanus Islands Lowendal Islands coastal areas around Port Hedland along Eighty mile beach
No Nesting areas in or adjacent to operational area. Internesting BIA mostly adjacent to operational area with very minor overlap near the Montebello Islands. Lacepede Islands; Some Islands of the Dampier Archipelago (west of the Burrup Peninsula; Barrow Island; Montebello Islands; North West Cape; Muiron Islands; and Smaller Rookeries closer to the Kimberley.
No Nesting areas in or adjacent to operational area. Internesting BIA mostly adjacent to operational area with small overlap near the Thevenard Island. Rosemary Island within the Dampier Archipelago; Varanus Island in the Lowendal group; and some islands in the Montebello group.
No Nesting areas in or adjacent to operational area. Dirk Hartog Island; Gnarloo & Ningaloo Coast to the NWC; and Muiron Islands in the north
*There are no confirmed leatherback turtle nesting sites in Western Australia. Scattered nesting occurs in southern Queensland and Northern Territory.

TGS NWSR South MC MSS - Environment Plan Summary
Rev 1 Page 20
3.7.5 Sharks and Ray-finned Fishes Although there are no known aggregation sites for sharks in the operational area, various species such as the great white, grey nurse, short and long fin mako sharks may be present. Various species of pipefishes and seahorses (Family Syngnathidae) are known to occur in the NWS, however, most prefer complex shallow water habitats, including seagrass and reef, which are found in the shallower waters outside the operational area. Dwarf, Freshwater and Green sawfish are generally restricted to shallow coastal embayments and estuaries and so unlikely to be encountered within the offshore marine environment of the NWSR South MC MSS operational area. A foraging BIA for the whale shark overlaps the NWSR South MC MSS operational area (Figure 3.5) and it is possible that whale sharks may be encountered during individual surveys undertaken within Management Area A1. A conservative peak migration period for whale sharks through Management Area A1 is 1 August–31 October. The majority of the migration corridor is over 75 km wide and is not considered ‘restricted’. However, the corridor
narrows to 30 km wide to the northwest of Montebello Islands through to North West Cape. Due to the low numbers of the animals and their irregular movements, it is not expected that whale sharks will be encountered in significant numbers, and those individuals that are encountered are likely to be transient.
Figure 3.5- Foraging (high density prey) and foraging areas for the whale shark (Rhincodon typus)
Source: Modified from DoE (2014ab)

TGS NWSR South MC MSS - Environment Plan Summary
Rev 1 Page 21
3.7.6 Seabirds and Shorebirds Marine waters and coastal habitat within and adjacent to the NWSR South MC MSS operational area contain important shorebird and seabird habitats, including offshore islands, sandy beaches, tidal flats, mangroves and coastal and pelagic waters. A search of the DoE PMST listed 33 species of avifauna that may occur in the operational area: 13 are listed Threatened species and 25 are Migratory species. A search for BIAs near the operational area was undertaken and indicated in the table below.
Table 3.4 - Seabird BIA location and timings
Species BIA Location Management
Area Peak times Activity
Overlaps polygon
Wedgetail shearwater
Pilbara: Dampier Archipelago, Passage Island,
Montebello Islands, Lowendal Islands off Barrow Island and islands off Onslow
A1, B2 Mid Aug to April Foraging and
Breeding yes
Shark Bay: Freycinet Estuary B1 Mid-August to
Mid-May Foraging
100km buffer yes
Roseate tern Dampier Archipelago, Lowendall Is, Frazer I, Bedout Island
A1, B2 Mid-March to July
Foraging 20km buffer
yes
Koks I, Mary Anne I and Meade I. B1 no
Lesser crested tern
Islands off Dirk Hartog. B1 March to June
Foraging 20km buffer
no
Bedout Island, Lowendal Islands, Thevenard Island and
A1 yes
Lesser Frigatebird
Bedout Island March to
September Foraging
100km buffer yes
Fairy Tern Shark Bay: incl. Koks, Bernier and Dirk Hartog Islands:
Mainland: Lake MacLeod and Low Point. Pilbara coast: incl. Dampier Archipelago
and Barrow Island.
A1, B1, B2 July to late September
Breeding with 5km foraging
buffer no
Brown booby Bedout Island Feb to Oct Breeding Yes

TGS NWSR South MC MSS - Environment Plan Summary
Rev 1 Page 22
3.8 SOCIO-ECONOMIC ENVIRONMENT 3.8.1 Commercial Fisheries State fisheries that may operate in the NWSR South MC MSS operational area include:
Abrolhos Islands and Mid-West Trawl Limited Entry Fishery (Note: was closed in 2012)*
Gascoyne Demersal Scalefish Fishery (GDSF)
Mackerel Managed Fishery (MMF)
North Coast Crab Fishery
North Coast Prawn Managed Fisheries o Broome Prawn Management Fishery (BPMF) o Nickol Bay Prawn Managed Fishery (NBPMF) o Onslow Prawn Managed Fishery (OPMF)
North Coast Demersal Fisheries o Northern Demersal Scalefish Managed Fishery (NDSF) o Pilbara Demersal Scalefish Managed fishery (PDSMF)
Pilbara Fish Trawl (Interim) Managed Fishery (PFTIMF) Pilbara Trap Managed Fishery (PTMF) Pilbara Line Fishery (PLF)
Octopus Fishery
Pearl Oyster Managed Fishery (POMF)
Shark Bay Prawn Fishery (SBP)*
Shark Bay Scallop Fishery (SBS)*
West Coast Deep Sea Crustacean Managed Fishery (WCDSCF)
West Coast Demersal Scalefish (Interim) Managed Fishery (WCDSIMF)
West Coast Rock Lobster Managed Fishery (WCRLF)
*Note: fishing effort does not overlap the NWSR South MC MSS polygon (Fletcher and Santoro 2013) and so are not included in further assessment. Australian Commonwealth fisheries are managed by AFMA, and those that operate in the NWSR South MC MSS operational area include:
North West Slope Trawl Fishery (NWST)
Southern Bluefin Tuna Fishery (SBTF)
Western Deepwater Trawl Fishery (WDTF)
Western Skipjack Fishery (WSF)
Western Tuna and Billfish Fishery (WTBF). There is no aquaculture activity within the NWSR South MC MSS operational area. All relevant fisheries and licence holders have been contacted as part of the stakeholder consultation process as outlined in Section 8. 3.8.2 State Managed Fisheries 3.8.2.1 Abrolhos Islands and Mid-West Trawl Managed Fishery The AIMWTMF is based on the take of saucer scallops, with a small component targeting the western king prawn in the Port Gregory area. AIMWTMF operate between 27°51´ south latitude and 29°03´ south latitude on the landward side of the 200 m isobath. No scallop fishing occurred in this fishery during 2012 because the annual scallop survey showed scallop abundance below the limit level to commence fishing. The NWSR South MC MSS operational area overlaps the AIMWTMF area; however it is not a historical fishing area. 3.8.2.2 Gascoyne Demersal Scalefish Fishery The GDSF includes both commercial and recreational (line) fishing for demersal scalefish species in the continental shelf waters of the Gascoyne. Commercial vessels historically focused on the pink snapper (Pagrus auratus) oceanic stock. GDSF licensed vessels fish year-round with mechanised handlines, and target a number of demersal species such as snappers, cods and perch (Fletcher and Santoro 2013).

TGS NWSR South MC MSS - Environment Plan Summary
Rev 1 Page 23
The GDSF operates in the waters of the Indian Ocean and Shark Bay between latitudes 23◦07’30”S and 26°30’S. There were 55 licenses in the 2013 season, with 16 vessels actively fishing a total of 748 days. The NSWR MC MSS operational area overlaps the GDSF. Therefore, it is possible that vessels fishing in the extent of the GDSF could operate in the vicinity of surveys undertaken within Management Areas B1 and C1. 3.8.2.3 Mackerel Managed Fishery The MMF uses near-surface trolling gear from small vessels in coastal areas around reefs, shoals and headlands to target Spanish mackerel (Scomberomorus commerson). Jig fishing is also used to capture grey mackerel (S. semifasciatus), with other species from the genera Scomberomorus, Grammatorcynus and Acanthocybium also contributing to commercial catches. Permit holders may only fish for mackerel by trolling or hand-line. The fishery extends from the West Coast Bioregion to the WA/NT border, with most effort and catches recorded north of Geraldton, especially from the Kimberley and Pilbara coasts. The fishery is divided into three Areas: Area 1 Kimberley (121°E to WA/NT border); Area 2 Pilbara (114°E to 121°E); and Area 3 Gascoyne (27°S to 114°E) and West Coast (Cape Leeuwin to 27°S). There are currently 50 licences in the fishery with 15, 15 and 20 licences in Areas 1, 2 and 3 (respectively), with the combined quota allocations being consolidated onto 14 boats operating within the fishery (Fletcher and Santoro 2014). The total catch for 2013 was 277.2 t and within the acceptable catch range for the MMF. The majority of catch is taken in Area 1 Kimberley, reflecting the tropical distribution of mackerel species. Catch from Area 2 Pilbara in 2013 was 99.0 t, and Area 3 Gascoyne/West Coast was 33.8 t (Fletcher and Santoro (eds.) 2014). Areas 2 and 3 of the fishery overlaps the NWSR South MC MSS operational area, and it is possible that fishing operations will occur in the vicinity of seismic vessels. Fishing effort within Area 2 is mainly to the north of Exmouth Gulf and centres around surrounding islands, reefs, shoals or headlands. Fishing in Area 3 centres around Shark Bay and north of the Abrohlos Islands. 3.8.2.4 North Coast Crab Fishery The blue swimmer crab (Portunus armatus) is found along the entire WA coast and in a wide range of inshore and continental shelf areas, from the inter-tidal zone to at least 50 m in depth. However, the majority of the commercially and recreationally-fished stocks are concentrated in the coastal embayments and estuaries between Geographe Bay in the south west and Nickol Bay in the north. Crabbing activity along the Pilbara coast is centred largely on the in-shore waters from Onslow through to Port Hedland, with most commercial and recreational activity occurring in and around Nickol Bay. Although Management Area A1 of the NWSR MC MSS operational area overlaps the fishery management area, fishing does not occur in the area 3.8.2.5 North Coast Prawn Managed Fisheries Nickol Bay Prawn Managed Fishery (NBPMF) The NBPMF primarily targets banana prawns (Penaeus merguiensis). The boundaries of the NBPMF are all the waters between of the Indian Ocean between 116°45’E and 120°E on the landward side of the 200 m isobaths. The NBMF incorporates the Nickol Bay, and extended Nickol Bay, Depuch and De Grey size-managed, fishing grounds that are confined to the coastal waters of the Pilbara. In 2013, the season extended from 18 March to 19 October with a total catch of 106 t of mostly banana prawns (Fletcher and Santoro 2014). Six boats fished for the season. Onslow Prawn Managed Fishery (OPMF) The OPMF targets western king prawns (Penaeus latisulcatus), brown tiger prawns (Penaeus esculentus), and endeavour prawns (Metapenaeus sp.). The boundaries of the OPMF are all in WA waters between the Exmouth Prawn Fishery and the Nickol Bay Prawn Fishery, and east of 114º39.9' on the landward side of the 200 m depth isobaths. The fleet is composed of trawlers up to 23 m in length. Fishing effort is primarily restricted to shallow waters. In 2013, 0.5 tonne of prawns were retained. The fishing season extended from 8 April through 19 October. 3.8.2.6 Octopus Fishery Octopus are caught commercially within various fisheries in the SWMR. However, within the NWSR South MC MSS operational area, octopus are mostly a by-product of the WCRLF. The Developing Octopus Fishery is now the major octopus fishery in the region. Octopus caught in the WCRLF are restricted to the boundaries of that fishery, while

TGS NWSR South MC MSS - Environment Plan Summary
Rev 1 Page 24
octopus caught in the Developing Octopus Fishery are limited to the boundaries of the developmental fishery, which is an area bounded by the Kalbarri Cliffs (26o30’S) in the north and Esperance in the south. Octopus potting occurs around sand areas around robust limestone reef habitats covered with coralline and macro-algae, and seagrass areas. Subsequently, these are limited to shallower waters within the fishing areas. 3.8.2.7 Pearl Oyster Managed Fishery The WA pearl oyster fishery is the only remaining significant wild-stock fishery for pearl oysters in the world. It is a quota-based, dive fishery operating in shallow coastal waters along the NWS (Fletcher and Santoro 2014). The harvest method is drift . The species targeted is the Indo-Pacific, silver-lipped pearl oyster (Pinctada maxima). P. maxima is widespread in the Indo-West Pacific. In WA, the species has been recorded as far south as Dirk Hartog Island in Shark Bay, but it is not commercially fished south of North West Cape (Fletcher et al. 2006). Pearl oyster species are also harvested from WA waters in small quantities for aquaculture purposes. These species include P. margaritifera, P. albina, P. fucata, Pteria penguin and Pteria fulcata (DoF 2006). Pinctada species are mostly found on the sea floor in shelly, rocky gravel areas and reef environments that provide crevices and substrates for their byssus threads to attach, including live and dead coral. Some individuals have been found on sandy bottoms (Southgate 2008). Individuals are mostly found in shallow waters of the littoral and sub-littoral zone, on occasion reaching the maximal recorded depths of 100–120 m (Southgate 2008). The DoF Ecologically Sustainability Development (ESD) Report for the Pearl Oyster Fishery in 2006 states that pearl oysters are known to occur in water depths of 0–50 m off the coast of WA. In WA, the reproductive season begins September/October and continues through to April/May, with two distinct spawning peaks. Although there is variability from month to month, there is a primary spawning period occurring from October to December with a smaller secondary spawning in February and March (Fletcher et al 2006). During the last decade the total number of oysters fished annually from the main fishing grounds of the Pearl Oyster Fishery (Zone 2/3) has remained stable, varying by less than 10% around a mean catch of 476,560 pearl oysters (DoF 2006). Generally, pearl divers are not allowed to collect pearl oysters unless they are a minimum size of 120 mm in shell length. However, for the 2012 and 2013 fishing seasons, pearl divers were permitted to take a sustainable amount of pearl oysters of a size no less than 100 mm, on a trial basis and for research purposes (Fletcher and Santoro 2014). The NWSR South MC MSS operational area is only located in Fishing Zone 1 of the POMF. Yet in 2013, catch was only taken in Zones 2 and 3 and with a total of five vessels. Zone 1, which extends from North West Cape to Point Thouin (west of Port Hedland) has been closed to fishing since 2009. The boundary of Management Area A1 lies to the west of Cape Thouin and only overlaps pearl oyster fishing grounds in Fishing Zone 1. 3.8.2.8 North Coast Demersal Fisheries The NDSF and PFTIMF operate in the northern bioregion and target various tropical, demersal fish species such as snappers, emperors, bream and cod. The NDSF is not overlapped by the NWSR South MC MSS operational area and is not discussed further. 3.8.2.8.1 Pilbara Demersal Scalefish Fisheries The Pilbara Demersal Scalefish Fisheries include the PFTIMF, PTMF and PLF. These fisheries collectively use a combination of vessels, effort allocations (time), gear limits, plus spatial zones (including extensive trawl closures) as management measures. The PFTIMF lands the largest component of the catch of demersal finfish in the Pilbara (and North Coast Bioregion), targeting all the main demersal species, with smaller subsets of species taken by the
PTMF and fewer still by the PLF. In 2012, 13 vessels were operating in the Pilbara Demersal Scalefish Fishery (Fletcher and Santoro 2013). Species targettedinclude snappers, emperors, cods Pilbara Fish Trawl (Interim) Managed Fishery (PFTIMF) The PFTIMF is situated in the Pilbara region in the north west of Australia. It occupies the waters north of latitude 21°35’S and between longitudes 114°9’36”E and 120°E. The fishery is seaward of the 50 m isobath and landward of the 200 m isobath (Fletcher and Santoro 2013). The fishery consists of two zones: Zone 1 in the south-west of the fishery (which is closed to trawling); and Zone 2 in the north, which consists of six management areas. There were 11 permits for the fishery in 2013, with the combined effort allocations being consolidated over time onto three full-time vessels (Fletcher and Santoro 2014). Part of the NWSR South MC MSS operational area overlaps Areas 1 and 2 of Zone 2 of the PFTIMF.

TGS NWSR South MC MSS - Environment Plan Summary
Rev 1 Page 25
Pilbara Trap Managed Fishery (PTMF) The PTMF lies north of latitude 21°44’S and between longitudes 114°9.6‘E and 120°00‘E on the landward side of a boundary approximating the 200 m isobath and seaward of a line generally following the 30 m isobath (Fletcher and Santoro 2014). There are 11 permits for the PTMF, with the combined effort allocations being consolidated over time onto three, full-time vessels, which have no seasonal restrictions. In 2013, major species taken by the trap fishery were red emperor, crimson snapper, blue-spotted emperor, Rankin cod, goldband snapper and spangled emperor (Fletcher and Santoro 2013). The NWSR South MC MSS operational area overlaps the PTMF in waters less than 200 m which is a small portion of the entire operational area and limited to Management Area A1. Pilbara Line Fishery (PLF) The PLF licences are permitted to operate anywhere within "Pilbara waters". This means all waters bounded by a line commencing at the intersection of 21°56’S latitude and the high water mark on the western side of the North-west Cape on the mainland of WA, then west along the parallel to the intersection of 21°56’S latitude and the boundary of the Australian Fishing Zone (AFZ) and north to longitude 120°E (DoF 2012). The PLF is managed under the Prohibition on Fishing by Line from Fishing Boats (Pilbara Waters) Order, 2006. Nine fishing boat licenses are exempted from this prohibition for any nominated five-month block period within the year. The NWSR South MC MSS operational area overlaps a portion of the western half of the PLF. 3.8.2.9 West Coast Deep Sea Crustacean Managed Fishery The boundaries of this fishery include all waters north of latitude 34°24’S (Cape Leeuwin) and west of the Northern Territory border, as well as on the seaward side of the 150 m isobath out to the extent of the AFZ. The fishery is divided into five zones, and the NWSR South MSS operational area overlaps Zones 1, 2 and 3. The WCDSCF targets crystal (snow) crabs (Chaceon albus), giant (king) crabs (Pseudocarcinus gigas) and champagne (spiny) crabs (Hypothalassia acerba) using baited pots operated in a long-line formation in the shelf edge waters (>150 m) of the West Coast. The WCDSCF is a quota based ‘pot’ fishery that operates mainly in depths of 500–800 m. No fishing is permitted in depths <150 m, with the only allowable method for capture being baited pots (‘traps’). These are operated in ‘long-lines’, which have between 80 and 180 pots attached to a main line marked by a float at each end (Fletcher and Santoro 2013). There were three vessels operating in 2013 (Fletcher and Santoro 2014). The NWSR South MC MSS operational area overlaps the WCDSCF. Optimal fishing effort occurs in deep offshore waters between 500 and 1,000 m, on the continental shelf slope and the Exmouth Plateau. 3.8.2.10 West Coast Demersal Scalefish (Interim) Managed Fishery The West Coast Demersal Scalefish Resource comprises inshore and offshore suites of demersal scalefish species that are exploited by different commercial fisheries and recreational and charter fishers in the West Coast Bioregion. The West Coast Inshore Demersal suite occurs in waters 20–250 m deep with approximately 100 species caught. The most important species are the WA dhufish and pink snapper along with other species including redthroat emperor, bight redfish and baldchin groper. The West Coast Offshore Demersal suite, which occurs in waters >250 m deep, includes eightbar grouper, hapuku, blue-eye trevally and ruby snapper. The commercial fishery is managed as the WCDSIMF and is a hand-line and drop-line fishery. It encompasses the waters of the Indian Ocean just south of Shark Bay (at 26°30’S) to just east of Augusta (at 115°30’E) and extends seaward to the 200 nmi boundary of the AFZ. In 2013, 44 boats fished in the WCDSIMF: 12 vessels fished in the Kalbarri Area; 36 in the Mid-west; 8 in the South-west; and 13 in the Offshore Area. The NWSR South MC MSS operational areas overlaps the WCDSIMF area. 3.8.2.11 West Coast Rock Lobster Managed Fishery The WCRLF targets the western rock lobster, on the west coast of WA between Shark Bay and Cape Leeuwin, using baited traps (i.e. pots) between 21°44´ to 34°24´S. The fishery is managed in three zones: Zone A Abrolhos Islands,

TGS NWSR South MC MSS - Environment Plan Summary
Rev 1 Page 26
Zone B north of latitude 30° S excluding the Abrolhos Islands; and Zone C south of latitude 30° S. From 2011-13, 74 vessels fished for lobster in Zone A, 67 vessels fished in Zone B and 132 vessels fished in Zone C (Fletcher and Santoro 2014). With annual production historically averaging about 11,000 t, this has been Australia’s most valuable single species. The NWSR South MC MSS operational area overlaps Zone A. In 2012/13, 74 vessels fished in Zone A. 3.8.3 Australian Commonwealth Administered Fisheries 3.8.3.1 North West Slope Trawl Fishery The NWSTF operates off north-western Australia from 114°E to 125°E, roughly between the 200 m isobath and the outer boundary of the AFZ. The NWSTF has traditionally targeted scampi and deep water prawns. However, in recent years, Australian scampi has been the main target of the fishery. Fishing for scampi occurs over soft, muddy sediments or sandy habitats, typically at depths of 350–600 m on the continental slope (Georgeson et al. 2014). Demersal trawl gear is used in the NWSTF. Whilst there are seven fishing permits in the NWSTF only one vessel was active in the fishery in 2012–2013 with the majority of fishing activity near the Rowley Shoals and Scott Reef.
3.8.3.2 Western Deepwater Trawl Fishery The WDTF operations in WA extend from 115°08’ E in the south to 114° E in the north. The fishery catches more than 50 species in waters exceeding 200 m depth and in habitats ranging from temperate-subtropical in the southern region to tropical in the north region. Catches in the WDTF were historically dominated by six main commercial finfish species: orange roughy (Hoplostethus atlanticus); oreos (Oreosomatidae); boarfish (Pentacerotidae); eteline snapper (Lutjanidae: Etelinae); apsiline snapper (Ludjanidae: Apsilinae); and sea bream (Lethrinidae). Between 2000 and 2005, deepwater bugs emerged as the most important target species. However, there has been a large reduction in effort and catch over the past three years (Georgeson et al. 2014). The NWSR South MC MSS operational area overlaps the WDTF current fishing area. 3.8.3.3 Western Tuna and Billfish Fishery The WTBF extends from Cape York westwards around the Northern Territory and WA coast and across to the GAB, out to the limit of the AFZ. The fishery includes additional areas around Cocos and Christmas Islands, and primarily targets broadbill swordfish (Xiphias gladius), yellowfin tuna (Thunnus albacares), big-eye tuna (T. obesus) and albacore tuna (T. alalunga). In 2012–2013, 95 permits were issued, and two vessels operated. The majority of catch and effort in the WTBF occurs in Commonwealth waters off the central west coast of WA. During the 2012–2013 season, fishing effort was restricted to areas south of Geraldton (30°S) and north of the Rowley Shoals (15°S) in the NWMR (Georgeson et al. 2014). Seven vessels were active in the 2012/13 season. The NWSR South MC MSS polygon overlaps the WTBF current fishing area.
3.8.3.4 Western Skipjack Fishery The WSTF is not active in continental shelf waters of the Exmouth Plateau. In recent years, activities in the WSTF have largely been confined to waters in the GAB and north-east of Eden in New South Wales (Woodhams et al. 2013). No Australian vessels were active in either zone (Western or Eastern) of the WSF during the 2012–13 fishing season (Georgeson et al. 2014). The NWSR South MC MSS operational area overlaps the fishery, but it does not overlap the current catch and effort fishing areas of the WSTF. 3.8.3.5 Southern Bluefin Tuna Fishery Mainly from December to April, the SBTF targets juvenile southern bluefin tuna (2–3 years old) in the GAB using purse-seine gear. These operations are concentrated in shelf and upper slope waters of the eastern GAB, with the maximum fishing intensity in 2013 concentrated on a relatively small area just north of the shelf break (Georgeson et al. 2014). Throughout the rest of its range, southern bluefin tuna is targeted by pelagic longliners, with the focus being on domestic longliners operating along Australia’s east coast. Activities in the SBTF are primarily confined to the waters off southern Australia (such as the GAB) with smaller areas along the south east coastline, such as northeast of Eden in New South Wales (Georgeson et al. 2014). Therefore activity in these fisheries does not overlap the NWSR South MC MSS operational area. 3.8.4 Petroleum Exploration and Production

TGS NWSR South MC MSS - Environment Plan Summary
Rev 1 Page 27
Within the NWSR South MC MSS operational area there are various emergent infrastructure. Vessels shall not enter a FPSO petroleum safety zone. 3.8.5 Commercial Shipping Within the NWMR there is significant commercial shipping activity, much of which is associated with mining and oil and gas industries, as well as commercial shipping fairways in and out of local ports such as Dampier, Karratha and Port Hedland. 3.8.6 Tourism and Recreation The Gascoyne and Pilbara coasts are popular visitor destinations, with diving, snorkelling, fishing and boating activities taking place. The majority of tourism and recreation activities are confined to coastal areas and islands, with limited boat charters to the offshore islands in the area. Recreational fishing activities are concentrated around key population centres, with a seasonal peak in activity during the dry season in the north between winter months April/May to September/October. Further south, peak periods are from August to November (Fletcher and Santoro 2013).
At its closest point, the NWSR South operational area is located 60 km from the Abrolhos Islands and Kalbarri, 100
km from Carnarvon, 40 km from Coral Bay and Ningaloo Coast and 25 km from Montebello Islands. At this distance from the mainland, recreational fishing activities are not expected to be significant in the operational area. However,
where the operational area is adjacent to Pilbara Islands (i.e. Bessieres 7 km) and Port Hedland and the coastline
to its west (7 km), some interaction may be possible. Occasional recreational fishing occurs at Glomar Shoal and Rankin Bank, however, due to the distance from land it is very sporadic and short in duration. 3.8.7 Defence Activities The RAAF Learmonth Airspace components are adjacent to the eastern boundary of the operational area. The Department of Defence was identified as a stakeholder and contacted regarding proposed surveys in the region. 3.8.8 Cultural Heritage There are no known Native Title Determinations for the waters and seabed within or immediately adjacent to the NWSR South MC MSS operational area. A search of the National Shipwrecks Database (DoE 2014l) indicated 13 historic shipwrecks within the operational area. There are numerous others adjacent to the area and closer to shallower waters and emergent features. The wreck sites of HMAS Sydney II and HSK Kormoran are located within the NWSR South operational area, Management Area C1, however both wreck sites have a protected or no-entry zone with a radius of 800 m around the location (DoE 2014i). 3.8.9 Heritage Places There are no places listed on the World, National and Commonwealth Heritage List within the NWSR South MC MSS operational area (DoE 2014b).
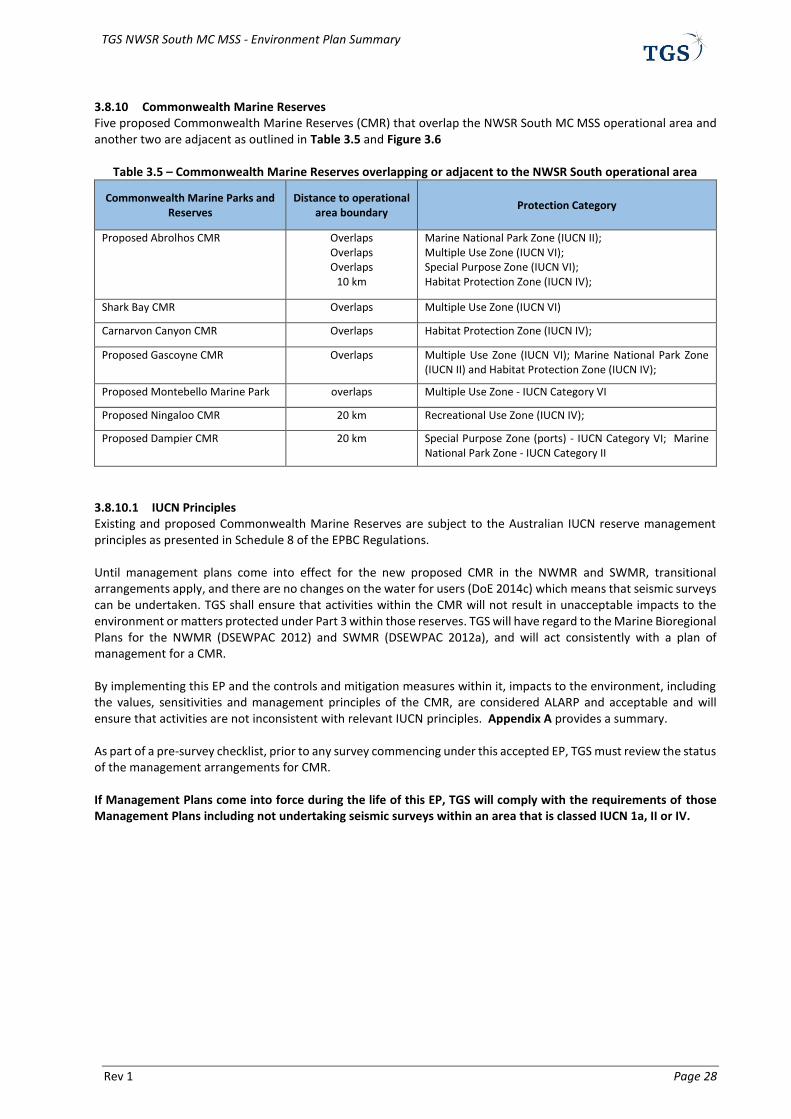
TGS NWSR South MC MSS - Environment Plan Summary
Rev 1 Page 28
3.8.10 Commonwealth Marine Reserves Five proposed Commonwealth Marine Reserves (CMR) that overlap the NWSR South MC MSS operational area and another two are adjacent as outlined in Table 3.5 and Figure 3.6
Table 3.5 – Commonwealth Marine Reserves overlapping or adjacent to the NWSR South operational area
3.8.10.1 IUCN Principles Existing and proposed Commonwealth Marine Reserves are subject to the Australian IUCN reserve management principles as presented in Schedule 8 of the EPBC Regulations. Until management plans come into effect for the new proposed CMR in the NWMR and SWMR, transitional arrangements apply, and there are no changes on the water for users (DoE 2014c) which means that seismic surveys can be undertaken. TGS shall ensure that activities within the CMR will not result in unacceptable impacts to the environment or matters protected under Part 3 within those reserves. TGS will have regard to the Marine Bioregional Plans for the NWMR (DSEWPAC 2012) and SWMR (DSEWPAC 2012a), and will act consistently with a plan of management for a CMR. By implementing this EP and the controls and mitigation measures within it, impacts to the environment, including the values, sensitivities and management principles of the CMR, are considered ALARP and acceptable and will ensure that activities are not inconsistent with relevant IUCN principles. Appendix A provides a summary. As part of a pre-survey checklist, prior to any survey commencing under this accepted EP, TGS must review the status of the management arrangements for CMR. If Management Plans come into force during the life of this EP, TGS will comply with the requirements of those Management Plans including not undertaking seismic surveys within an area that is classed IUCN 1a, II or IV.
Commonwealth Marine Parks and Reserves
Distance to operational area boundary
Protection Category
Proposed Abrolhos CMR
Overlaps Overlaps Overlaps
10 km
Marine National Park Zone (IUCN II); Multiple Use Zone (IUCN VI); Special Purpose Zone (IUCN VI); Habitat Protection Zone (IUCN IV);
Shark Bay CMR Overlaps Multiple Use Zone (IUCN VI)
Carnarvon Canyon CMR Overlaps Habitat Protection Zone (IUCN IV);
Proposed Gascoyne CMR Overlaps Multiple Use Zone (IUCN VI); Marine National Park Zone (IUCN II) and Habitat Protection Zone (IUCN IV);
Proposed Montebello Marine Park overlaps Multiple Use Zone - IUCN Category VI
Proposed Ningaloo CMR 20 km Recreational Use Zone (IUCN IV);
Proposed Dampier CMR 20 km Special Purpose Zone (ports) - IUCN Category VI; Marine National Park Zone - IUCN Category II

TGS NWSR South MC MSS - Environment Plan Summary
Rev 1 Page 29
Figure 3.6 - Commonwealth Marine Reserves within the vicinity of the NWSR South MC MSS polygon

TGS NWSR South MC MSS - Environment Plan Summary
Rev 1 Page 30
3.8.11 State Marine Parks and Reserves Table 3.6 and Figure 3.7 outlines the State Marine Parks and Reserves adjacent to the operational area.
Table 3.6 – State Marine Parks and Reserves adjacent to the NWSR South operational area
Each marine park has a management plan that contains strategies to protect the high value assets in the park, as well as permitted activities tables. These tables provide explicit regulatory management. Marine nature reserves are ‘no-take' areas created primarily for conservation and scientific research and are designed to protect a particular significant ecosystem or habitat. Low-impact tourism may be permitted, but no recreational or commercial fishing, aquaculture, pearling, petroleum drilling or production is allowed. Marine management areas provide an integrated management structure over areas that have high conservation value and intensive multiple-use. By implementing this EP and the controls and mitigation measures within it, impacts to the environment, including the values, sensitivities and management principles of the Marine Parks and Reserves, are considered ALARP and acceptable.
Figure 3.7- State Marine Parks and Reserves
State Marine Parks and Reserves Distance to operational area boundary
Protection Category
Shark Bay Marine Park 50 km Marine Park
Ningaloo Marine Park 35 km Marine Park
Muiron Islands Marine Management Area 25 km Marine Park
Barrow Island Marine Management Area 25 km Marine Park
Barrow Island Marine Park 25 km Marine Park
Montebello Islands Marine Park 25 km A class reserve
Proposed Dampier Archipelago Marine Park (West and East) 10 km Marine Park

TGS NWSR South MC MSS - Environment Plan Summary
Rev 1 Page 31
3.8.12 Other Sensitive Areas 3.8.12.1 World Heritage Areas There are no World Heritage Areas (WHA) or Ramsar Wetlands of International Importance located within the operational area or immediately adjacent. The nearest are the Ningaloo Coast WHA and the Shark Bay WHA. At the
closest points, the eastern boundary of the operational area is located 20 km from the boundary of the Ningaloo
Coast WHA, and 7 km from the boundary of the Shark Bay WHA offshore from Dirk Hartog Island. 3.8.12.2 Ramsar Wetlands There is one Ramsar Wetland of International Importance adjacent to operational area: Eighty Mile Beach. At its
closest point, the western end of the Eighty Mile Beach is 150 km from the eastern boundary of the NWSR South operational area and unlikely to be affected by the activity. 3.8.12.3 Glomar Shoals Glomar Shoals is a KEF within the NWS and is partly overlapped by the NWSR South operational area. They are a
submerged littoral feature 26–70 m below the present sea level and are located 100 km north of Dampier on the Rowley Shelf (Falkner et al. 2009). They are regionally important for their high biological diversity and high localised productivity, and attract a number of commercial and recreational fish species, such as Rankin cod, brown striped snapper, red emperor, crimson snapper, bream and yellow-spotted triggerfish (DEWHA 2007).

TGS NWSR South MC MSS - Environment Plan Summary
Rev 1 Page 32
4. ENVIRONMENTAL RISK ASSESSMENT 4.1 ENVIRONMENTAL RISK ASSESSMENT METHODOLOGY An Environmental Risk Assessment (ERA) of the NWSR South MC MSS has been undertaken to understand and manage the environmental risks associated with the activity to a level that minimises impacts on the environment and meets the objectives of the proposed survey. The ERA methodology applied is consistent with the Australian/New Zealand Standard AS/NZS ISO 31000:2009 Risk management–Principles and guidelines, Handbook HB 203:2012 Managing environment-related risk, and Handbook HB 89-2012 Risk management - Guidelines on risk assessment techniques. The risk assessment has been undertaken to identify the sources of risk (aspects) and potential environmental impacts associated with the activity and to assign a level of significance or risk to each impact. This subsequently assists in prioritising mitigation measures to ensure that the environmental impacts are managed to ALARP. The risk has been measured in terms of likelihood and consequence, where consequence is defined as the outcome or impact of an event, and likelihood as a description of the probability or frequency of the identified consequence occurring. The key steps used for the risk assessment are shown in Figure 4.1.
Figure 4.1 - Key Steps used for Risk Assessment
The environmental risks associated with the proposed seismic survey operations have been assessed by a methodology that:
identifies the activities and the environmental aspects associated with them;
identifies the values/attributes at risk within and adjacent to the NWSR South MC MSS operational area;
defines the potential environmental effects of the activities;
identifies the likelihood of occurrence and potential consequences; and
determines overall environmental risk levels using a likelihood and consequence matrix.
4.1.1 Decision Making Framework Determining whether risks have been reduced to as low as reasonable practicable (ALARP) requires an understanding of the nature and cause of the risk to be avoided and the sacrifice (in terms of safety, time, effort and cost) involved in avoiding that risk. The hierarchy of decision tools used in this case (from lowest risk to highest risk)
Risk identification
Risk analysis
Establishing the context
Risk evaluation
Risk treatment
Co
mm
un
icat
ion
an
d c
on
sult
atio
n
Mo
nito
ring an
d re
view
Risk assessment
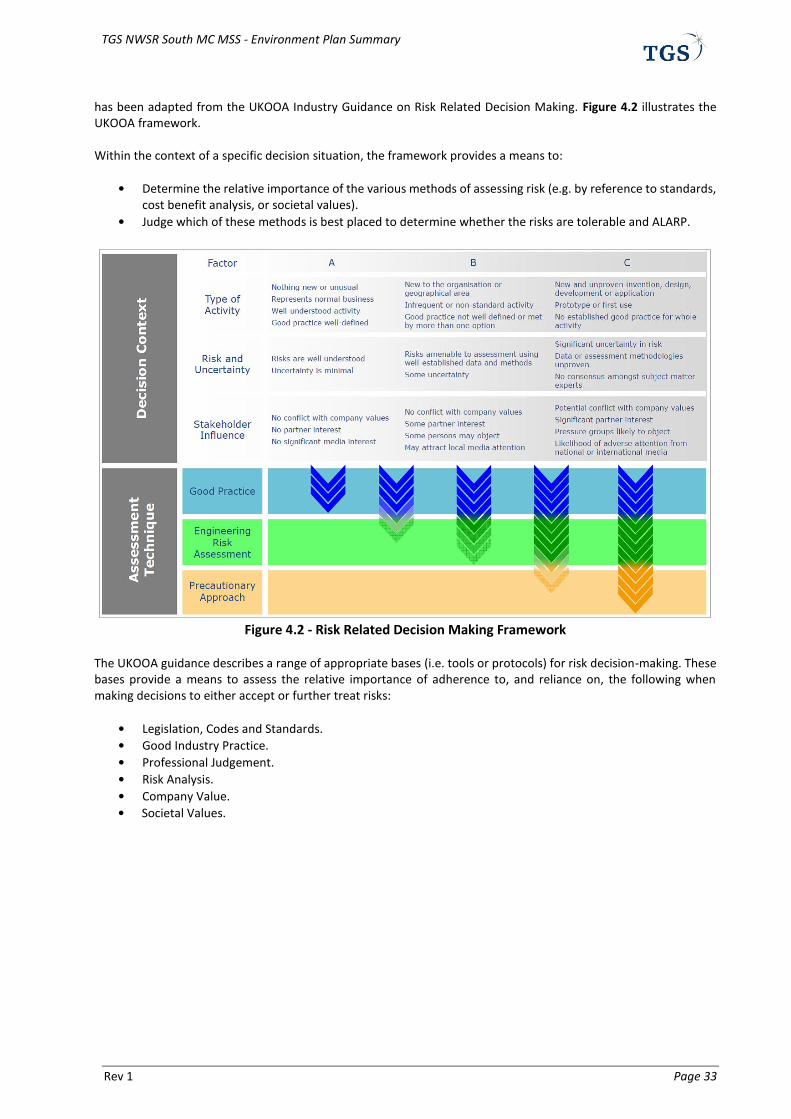
TGS NWSR South MC MSS - Environment Plan Summary
Rev 1 Page 33
has been adapted from the UKOOA Industry Guidance on Risk Related Decision Making. Figure 4.2 illustrates the UKOOA framework. Within the context of a specific decision situation, the framework provides a means to:
• Determine the relative importance of the various methods of assessing risk (e.g. by reference to standards, cost benefit analysis, or societal values).
• Judge which of these methods is best placed to determine whether the risks are tolerable and ALARP.
Figure 4.2 - Risk Related Decision Making Framework
The UKOOA guidance describes a range of appropriate bases (i.e. tools or protocols) for risk decision-making. These bases provide a means to assess the relative importance of adherence to, and reliance on, the following when making decisions to either accept or further treat risks:
• Legislation, Codes and Standards.
• Good Industry Practice.
• Professional Judgement.
• Risk Analysis.
• Company Value.
• Societal Values.

TGS NWSR South MC MSS - Environment Plan Summary
Rev 1 Page 34
Table 4.1 shows the overall environmental risk assessment matrix (also referred to as an event potential matrix)
that compares the likelihood and consequences of potential environmental impacts arising from the NWSR South MC MSS and assigns a level of risk.

TGS NWSR South MC MSS - Environment Plan Summary
Rev 1 Page 35
Table 4.1- Generic Environmental Risk Assessment Matrix
LIKELIHOOD LEVEL
CO
NSE
QU
ENC
E LE
VEL
Remote Highly
Unlikely Unlikely Possible Likely Highly Likely
Catastrophic 2 2 1 1 1 1
Massive 3 2 2 1 1 1
Major 3 3 2 2 1 1
Moderate 4 3 3 2 2 1
Minor 4 4 3 3 2 2
Slight 4 4 4 3 3 2
Operational Risk Levels Risk Level 1: SEVERE risk, apply strict Precautionary Principle. Risk Level 2: HIGH risk, apply industry best practice to reduce to ALARP. Risk Level 3: MEDIUM risk, apply standard cost-benefit approach to reduce risk to ALARP. Risk Level 4: LOW risk, apply normal business management practice to avoid impact. 4.2 RISK EVALUATION Environmental risks cover a wider range of issues, multiple species, persistence, reversibility, resilience, cumulative effects and variability in severity. The degree of environmental risk and the corresponding threshold for acceptability has been adapted to include principles of ecological sustainability (given as an objective in the Environment Regulations and defined in the EPBC Act), the Precautionary Principle and the corresponding environmental risk threshold decision-making principles used to determine acceptability. 4.2.1 Demonstration of ALARP As outlined in Table 4.2, impacts and risks are reduced to ALARP where:
The residual risk is LOW: o good industry practice or comparable standards have been applied to control the risk, because any
further effort towards risk reduction is not reasonably practicable without sacrifices grossly disproportionate to the benefit gained.
The residual risk is MEDIUM or HIGH: o good industry practice is applied for the situation/ risk; or o alternatives have been identified and the control measures selected to reduce the impacts and
risks to ALARP. This may require assessment of Company and industry benchmarking, review of local and international codes and standards, consultation with stakeholders etc.

TGS NWSR South MC MSS - Environment Plan Summary
Rev 1 Page 36
MEDIUM / HIGH
ALARP Zone
4.2.2 Demonstration of Acceptability The following process has been applied to demonstrate acceptability (as illustrated in Table 4.3):
LOW residual risks are ‘Broadly Acceptable’, if they meet legislative requirements, industry codes and standards, regulator expectations, the TGS Environmental Policy and industry guidelines.
MEDIUM and HIGH residual risks are ‘Broadly Acceptable’ if ALARP can be demonstrated using good industry practice, risk based analysis, if societal concerns are accounted for and the alternative control measures are disproportionate to the benefit gained.
SEVERE residual risks are ‘Intolerable’ and therefore ‘Unacceptable’. Risks will require further investigation and mitigation to reduce the risk to a lower and more acceptable level. If after further investigation the risk remains in the severe category, the risk requires appropriate business sign-off to accept the risk.
Table 4.2 - Residual risk levels and associated decision making tools and principles
Residual Risk Level Environmental Threshold
Decision Making Tools Environmental Decision Principles
LOW Broadly Acceptable Zone
No substantial risk (i.e. negligible risk) of harm to species or communities
Comparison to codes and standards, good oilfield practice and professional judgement are used to assess risk acceptability
If the environmental risk of the hazard has been found to be ‘Broadly Acceptable’ and the control measures are consistent with applicable standards and good industry practice then no further action is required to reduce the risk further. However, if a control measure that would further reduce the impact or risk is readily available, and the cost of implementation is not disproportionate to the benefit gained, then it is considered ‘reasonably practicable’ and should be implemented.
Likely to cause, or substantial risk of causing serious harm to non-listed species or communities
Risk based analysis are used in addition to comparison to codes and standards, good oilfield practice and professional judgement to assess risk acceptability.
An iterative process to identify alternative / additional control mechanisms has been conducted to reduce the risk to the ‘Broadly Acceptable’ zone. However, if the risk cannot be reasonably reduced to the ‘Broadly Acceptable’ zone without grossly disproportionate sacrifice; then the mitigated environmental risk is considered to be ALARP.
SEVERE Intolerable Zone
Likely to cause, or substantial risk of causing significant impact to protected species or communities
All of above decision making tools apply plus consideration of company values and societal values
If the environmental impact or risk has been found to fall within this zone then the activity should not be carried out. Work to reduce the level of risk should be assessed against the Precautionary Principle with the burden of proof requiring demonstration that the risk has been reduced to the ALARP Zone before the activity can be commenced.
Table 4.3 - Acceptability criteria
Criteria Question Acceptability demonstrated
Policy compliance Is the proposed management of the impact or risk aligned with the TGS Environmental Policy?
The impact or risk must be compliant with the objectives of the company policies.
Management System compliance
Is the proposed management of the impact or risk aligned with the TGS Management System?
Where specific TGS procedures and work instructions are in place for management of the impact or risk in question, acceptability is demonstrated.
Social acceptability Have stakeholders raised any concerns about activity impacts or risks, and if so, are measures in place to manage those concerns?
Stakeholder concerns must have been adequately addressed and closed out.
Laws and standards
Is the impact or risk being managed in accordance with existing Australian or international laws or standards, such as EPBC Policy Statements, MARPOL, AMSA Marine Orders, Marine Notices etc.?
Compliance with specific laws or standards is demonstrated.
Industry best practice Is the impact or risk being managed in line with industry best practice, such as APPEA Code of Environmental Practice, IAGC guidelines etc.?
Management of the impact or risk complies with relevant industry best practice.
Environmental context
Is the impact or risk being managed pursuant to the nature of the receiving environment (e.g. sensitive or unique environmental features generally require more management measures to protect them than environments widely represented in a region)?
The proposed impact or risk controls, EPO and EPS must be consistent with the nature of the receiving environment.
Environmentally Sustainable Development (ESD) Principles
Does the proposed impact or risk comply with the APPEA Principles of Conduct (APPEA 2003), which includes that ESD principles be integrated into company decision-making.
The NWSR South MC MSS is consistent with the APPEA Principles of Conduct.
ALARP Are there any further reasonable and practicable controls that can be implemented to further reduce the impact or risk?
There is a consensus that residual risk has been demonstrated to be ALARP.

TGS NWSR South MC MSS - Environment Plan Summary
Rev 1 Page 37
5. ENVIRONMENTAL RISK EVALUATION The risks identified during the ERA process (including Decision Type, residual risk level and acceptability of residual risk; refer Table 5.1) have been divided into two broad categories: Planned (routine and non-routine) and Unplanned (accidents or incidents) activities. Both of these categories have then been further divided into impact assessment groupings based on stressor type (e.g. noise, equipment loss, etc.).
5.1 ENVIRONMENTAL ASPECTS A summary of the key sources of environmental risk (aspects) for the proposed activity include:
Vessel noise emissions (non-seismic);
light generation from vessels;
interactions with stakeholders, including commercial fishing and shipping;
discharge of underwater seismic pulses;
discharge of ballast water and vessel biological fouling (biofouling);
interactions of vessels with marine fauna;
routine discharge of wastewater and waste to the ocean from survey and support vessels;
anchoring or grounding of vessels used for the activity;
dragging or loss of streamers and associated equipment; and
accidental discharge of hydrocarbons and chemicals to the ocean from survey and support vessels.
5.2 ENVIRONMENTAL IMPACTS A summary of the potential environmental impacts associated with the sources of environmental risk listed above include:
disturbance to marine fauna including cetaceans, whale sharks, turtles and fish;
disturbance to the seabed and benthic habitats and communities;
introduction of invasive marine species as a result of ballast water discharge and vessel biological fouling;
marine pollution from routine discharges including sewage water, bilge water and other solid wastes;
marine pollution from accidental discharges including hydrocarbon spills and hazardous materials;
disturbance to social and community values due to interactions with commercial fishing vessels, shipping and defence activities.
A summary of the control measures to be implemented is provided in Table 5.2. Please note that although a control measure may be listed only once against a particular risk, it may be a measure that will reduce impact or risk for other aspects also. For example fauna interaction measures will reduce impacts from vessel noise as well as possible vessel strike.

TGS NWSR South MC MSS - Environment Plan
Rev 1 Page 38
Table 5.1 -Environmental Risk Evaluation Summary for NWSR South MC MSS
Aspect Source of Risk Key Potential Environmental Impacts
Risk Rating Acceptability
of Residual Risk Consequence Likelihood
Residual Risk
Physical presence
PLANNED (ROUTINE AND NON-ROUTINE) ACTIVITIES
Vessel noise emissions (excluding seismic acoustic emissions) and Helicopter noise emissions
Short-term localised disturbance to marine fauna, such as alteration of behaviours and localised displacement
Slight Unlikely Low Broadly
Acceptable
Vessel light emissions Short-term localised disturbance to marine fauna, such as alteration of behaviours and localised displacement
Slight Highly
Unlikely Low
Broadly Acceptable
Interaction with commercial fisheries
Disruption to fishing vessels Potential direct and indirect noise impacts on target species Restriction of access to fishing grounds, loss/damage to gear Recreational take of finfish
Minor Possible Medium Acceptable
if ALARP
Interaction with commercial vessels/ shipping
Temporary disruption / exclusion of shipping traffic Minor Possible Medium Acceptable
if ALARP
Interaction with defence activities
Temporary disruption of aircraft activities in military exercise areas from helicopter operations
Slight Remote Low Broadly
Acceptable
Biofouling of vessel hull, other niches and immersible equipment
Introduction and establishment of IMS and displacement of native marine species
Slight Highly
Unlikely Low
Broadly Acceptable
Seismic acoustic emissions
Underwater noise emissions from discharge of acoustic source during standard operating period
Disturbance to marine fauna, particularly whales, marine turtles and whale sharks, involving potential physiological and behavioural effects
Slight Unlikely Low Broadly
Acceptable
Underwater noise emissions from discharge of acoustic source during sensitive operating period
Disturbance to marine fauna, particularly whales, marine turtles and whale sharks, involving potential physiological and behavioural effects
Minor Possible Medium Acceptable
if ALARP
Routine discharges
Discharge of ballast water
Introduction and establishment of IMS and displacement of native marine species
Slight Highly
Unlikely Low
Broadly Acceptable
Discharge of bilge water, sewage, grey water and food wastes
Localised eutrophication of the water column; and localised adverse effect to marine biota
Slight Unlikely Low Broadly
Acceptable
UNPLANNED ACTIVITIES (ACCIDENTS / INCIDENTS)
Physical presence of support vessel, survey vessel and towed array
Collision between vessels / towed array and marine fauna
Injury or fatality to protected marine fauna (cetaceans, marine turtles, whale sharks
Minor Highly
Unlikely Low
Broadly Acceptable
Vessel grounding Localised physical damage to benthic habitats Slight Highly
Unlikely Low
Broadly Acceptable
Deployment and retrieval of anchors
Localised physical damage to benthic habitats Slight Highly
Unlikely Low
Broadly Acceptable
Equipment dragging or loss Localised physical damage to benthic habitats Slight Unlikely Low Broadly
Acceptable
Waste management
Accidental release of hazardous or non-hazardous waste
Pollution and contamination of the environment and secondary impacts of marine fauna (e.g. ingestion, entanglement)
Slight Unlikely Low Broadly
Acceptable
Hydrocarbon spill
Minor Hydrocarbon release caused by topsides (vessel) loss of containment
Localised and temporary reduction in water quality due to hydrocarbon contamination
Slight Unlikely Low Broadly
Acceptable
Hydrocarbon release during refueling
Toxic effects on marine fauna and flora Localised and temporary reduction in water quality. Direct and indirect effects on commercial and recreational fisheries
Minor Unlikely Medium Acceptable
if ALARP
Hydrocarbon release caused by loss of structural integrity from vessel collision between survey vessel and third-party vessel
Toxic effects on marine fauna and flora Localised and temporary reduction in water quality. Direct and indirect effects on commercial and recreational fisheries
Moderate Highly
Unlikely Medium
Acceptable if ALARP

TGS NWSR South MC MSS - Environment Plan
Rev 1 Page 39
Table 5.2 -Environmental Risk Evaluation Summary for NWSR South MC MSS
Potential Impacts and Risks
Control Measures
Short-term localised disturbance to marine fauna, such as alteration of behaviours and localised displacement as a result of vessel noise emissions (excluding seismic acoustic emissions) and Helicopter noise emissions
Interaction between vessels (not including a vessel that is towing or retrieving/deploying a seismic array) and cetaceans within the operational area will be consistent with EPBC Regulations 2000 – Part 8 Division 8.1 (Regulation 8.05) – Interacting with cetaceans:
the vessel will not travel at speeds greater than 6 knots within 300 m of a whale or 150 m of a dolphin (caution zone) ; and
will not drift or knowingly approach closer than 100 m for a whale, or 50 m for a dolphin (with the exception of cetaceans bow riding).
Interaction between helicopters and cetaceans within the operational area will be consistent with EPBC Regulations 2000 – Part 8 Division 8.1 (Regulation 8.07) – Interacting with cetaceans:
A person will not operate a helicopter at a height lower than 1 650 feet or within a horizontal radius of 500m of a cetacean; or
approach a cetacean from head on.
Interaction between vessels (not including a vessel that is towing or retrieving/deploying a seismic array) and cetaceans, within the operational area will be consistent with EPBC Regulations 2000 – Part 8 Division 8.1 (Regulation 8.06) – Interacting with calves, which requires:
vessel will not knowingly approach closer than 300 m to a calf (whale or dolphin) (the caution zone)
If a calf appears in the caution zone, then: o The vessel must be immediately stopped; and o Must either:
Turn off the vessel’s engines; or Disengage the gears; or Withdraw the vessel from the caution zone at a constant speed of less than 6 knots.
Interaction between vessels and whale sharks within the operational area will be consistent with Whale Shark Management (program 57) (DPaW 2013): vessels will not knowingly approach closer than 400 m of a whale shark.
Interaction between vessels (not including a vessel that is towing or retrieving/deploying a seismic array) and turtles within the operational area will be consistent with the vessel fauna interaction procedure flowchart: the vessel will not travel at speeds greater than 6 knots within 300 m of a turtle
Short-term localised disturbance to marine fauna, such as alteration of behaviours and localised displacement due to light emissions
Operations of the vessels must comply with:
International Regulations for Preventing Collisions at Sea 1972 (COLREG) (Marine Order 30) Marine order 21 (Safety of navigation and emergency procedures).
No discharge of seismic source outside NWSR South MC MSS operational area.
Vessels shall go no closer than 20 km from recognised flatback turtle nesting BIA (as identified on the DoE website) between 1 December and 28 February.
Disruption to fishing vessels Potential direct and indirect noise impacts on target species Restriction of access to fishing grounds, loss/damage to gear Temporary disruption / exclusion of shipping traffic Temporary disruption of aircraft activities in military exercise areas from helicopter operations
Operations of the survey vessel must comply with the following:
International Regulations for Preventing Collisions at Sea 1972 (COLREG);
Standards of Training, Certification & Watchkeeping (STCW) Convention; and
Navigation Act 2012;
standards for watchkeeping.
Provision of activity details to relevant stakeholders prior to a survey commencing.
Approximately every 6 months TGS shall ensure:
Regular updates are provided to stakeholders approximately
identified stakeholders are still relevant and correct, and also identify new stakeholders.
In relation to seismic acquisition near Glomar Shoal, the following control measures must be implemented:
Seismic acquisition shall not occur within the exclusion zone around Glomar Shoal (being the 50 m isobath +1 km).
No infill activities or 2D lines of the same survey may cross over each other within the Glomar Shoal KEF boundary.
Introduction and establishment of IMS and displacement of native marine species
no discharge of high-risk ballast water within Australian territorial seas (within 12 nautical miles of WA coastline) including any ports. immersible equipment and the survey vessel hull, sea chests and other niches must be ‘clean’ before the survey vessel enters WA waters and ports.
high risk exchanges be conducted as far as possible away from shore and in water at least 200 m deep.
Vessels will have had a recent dry dock, IMS inspection or antifoulant application prior to mobilising to Australian waters.

TGS NWSR South MC MSS - Environment Plan
Rev 1 Page 40
Disturbance to marine fauna, particularly whales, marine turtles and whale sharks, involving potential physiological and behavioural effects
Policy 2.1, Part A commitments – at all times: Operation of the seismic source at all times during the survey must comply with all requirements of the EPBC Act Policy Statement 2.1 - Interactions between offshore seismic activities and whales Part A Standard Management Procedures (DEWHA 2008c), including:
precaution zones (Observation zone 3 km+; Low power zone: 2 km; and Shut-down zone: 500 m)
night-time and low visibility procedures.
Policy 2.1, Part B commitments – at all times: Operation of the seismic source within the operational area at all times will comply with the following EPBC Act Policy Statement 2.1 Part B Additional Management Procedures:
One (1) dedicated Marine Fauna Observer (MFO) on the survey vessel for duration of the survey
Pre-survey research (e.g. desktop review of best available, updated scientific data any suitable additional controls) to determine likelihood of encountering whales, inform on-going improvement and assess if increased precaution zones or other adaptive management measures are required to be implemented to ensure impacts are ALARP and acceptable.
Humpback and Pygmy blue whale specific: Operation of the seismic source within the BIAs during the peak periods for:
pygmy blue whales in: o Management Area B1 (1 May - 15 July and 1 November - 31 December) o Management Area B2 (15 May - 30 July and 15 October - 15 December)
humpback whales in: o Management Area A1 or B1 (1 June–31 October) o 100 km from the identified BIA as it extends into Management Areas B2 (1 June–31 October)
must comply with the following EPBC Act Policy Statement 2.1 Part B Additional Management Procedures:
application of increased precaution zones (Observation zone: >3 km; Shut-down zone: 2 km)
application of an increased Pre Start-up Visual Observation of 45 minutes, rather than 30 minutes.
limiting initiation of softstart procedures to conditions that allow visual inspection of the precaution zone. If the observed density of whales in the area is higher than expected from pre-survey research (i.e. three or more
whale-instigated power-downs or shut-downs occur within preceding 24 hours), then: • all night-time operations shall cease in this location. • at this point, if less than three whale-instigated power-downs or shut-downs occurred within the
preceding 24 hours, night-time operations can re-commence in this location, as per EPBC Act Policy Statement 2.1 Part B.
Humpback whale specific - exclusion No seismic acquisition shall occur within the identified humpback migratory pathway BIA in:
Management Area A1 between 15 July–30 September
Management Area B1 between 15 June–15 August and 1 September–15 October or
Within Management Area B2, within an 85 km radius from the northern most point of North West Cape (21o47.13S; 114o9.89E) between 15 June – 15 October
All whales – Adaptive Management Measures for In-Field Operations If the observed density of whales in the area is higher than expected from pre-survey research (i.e. three or more whale-instigated power-downs, shut-downs or sightings in the precaution zone occur within 24 hours), then:
• soft start procedures will be limited to conditions with good visibility. • increased precaution zones (Observation zone >3 km; Shut-down zone 2 km) will be applied. • pre Start-up Visual Observation will be increased to 45 minutes. • all night-time operations shall cease in this location.
At this point, if less than three whale-instigated power-downs, shut-downs or sightings in the precaution zone occurred within the preceding 24 hours, standard management measures and night-time operations can re-commence in this location, as per EPBC Act Policy Statement 2.1 Part A.
All whales – Adaptive Management Measures for In-Field Operations If more than one (1) power-down, shut-down or sighting in the precaution zone is experienced each day over three (3) consecutive days and thus indicating trend, it is reasonable to presume that the likelihood of encountering whales has increased (as per EPBC Act Policy Statement 2.1 Part B.6) and as such TGS shall:
• undertake a dynamic risk assessment to determine if further mitigation is required (e.g. extra MFO, moving location or ceasing operations), and;
• contact the DoE for their advice.
Detailed reports of all marine fauna sightings (cetaceans, whale sharks, turtles, dugong and pinnipeds) and interactions will be recorded and reported, via the Annual Report (if relevant) and the Post-survey Environmental Review Report and using the Cetacean Sightings Application (CSA - Version 3 - BETA) (http://data.marinemammals.gov.au/csa/ ).
No discharge of seismic source within 20 km from recognised flatback turtle nesting BIA (as identified from the National Conservation Values Atlas (NCVA)) between 1 December and 1 March.

TGS NWSR South MC MSS - Environment Plan
Rev 1 Page 41
Operation of the seismic source within the BIAs (as identified from the NCVA) during the following sensitive periods:
whale shark migration BIA (1 August – 31 October)
green turtle internesting BIA (1 Nov – 31 March)
hawksbill turtle internesting BIA (1 Oct – 31 Jan) must comply with the modified requirements of the EPBC Act Policy Statement 2.1 (adapted to whale sharks and flatback, green, and hawksbill turtles) including:
precaution zones (Observation zone: 3 km+; Low power zone: 2 km; and Shut-down zone: 500 m)
implementation of the following basic procedures: pre start-up visual observation, soft start, start-up delay, operations, power-down and stop work
night-time and low visibility procedures.
No discharge of the seismic source will occur outside of the NWSR South MC MSS operational area.
Survey vessel personnel (marine and seismic) provided with pre-survey induction on EPBC Act Policy Statement 2.1 requirements and protected fauna.
Only appropriately experienced MFOs (as determined by a review of their CVs in the project proposal submitted by the provider) will be contracted to undertake the NWSR South MC MSS.
TGS will not acquire data simultaneously within 50 km of another vessel that is also acquiring data. TGS shall search the NOPSEMA website, and consult with geophysical companies and/or titleholders to determine the presence of other seismic operations overlapping the polygon.
TGS will undertake pre-survey planning to review current information to try and avoid recognised BIA during sensitive periods, and to determine level of mitigation to be implemented.
The largest sound source that TGS will use for any survey within the operational area will have a capacity no greater than 4,120 cui, which will produce an equivalent 0-peak SPL of no higher than 260.2 dB re 1µPa (at 1 m).
Seismic acquisition will not occur in waters shallower than 50 m.
Use of sources with lower total capacity for acquisition in water depths <150 m:
No acquisition with the 4,120 cui array in water depths <150 m;
3,060 cui array used for acquisition in water depths from 150 m to 120 m.
2,680 cui array used for acquisition in water depths from 120 m to 100 m.
1,940 cui array used for acquisition in water depths from 100 m to 70 m.
1,420 cui array used for acquisition in water depths from 70 m to 50 m.
TGS will not undertake a seismic survey less than one month after a survey has been undertaken over the same area.
For 3D surveys in waters <150 m, the racetrack method must be used. For 2D surveys in waters <150 m, if adjacent 2D survey lines are less than or equal to 1.5 km apart, alternate lines will be acquired such that there is more than 1.5 km between adjacent lines.
a period of no less than 5 days must occur before infill activities can occur, or 2D lines can cross each other in waters shallower than 150 m. (except where exclusion areas already exist)
If it is identified that GIS data, nautical charts or equivalent are not accurate and that as a result certain control measures cannot be complied with, a vessel will be used to identify any raised topographic features and/or the 50 m contour, and sail lines will be modified if necessary to ensure the relevant control measures can be maintained.
No seismic acquisition will occur within 400 m (or as dictated by SSV process) of the 50 m contour around any raised topographical features such as shoals, reefs or pinnacles. Exception is Glomar Shoal where the following control measures must be implemented:
Seismic acquisition shall not occur within the exclusion zone around Glomar Shoal (being the 50 m isobath +1 km).
No infill activities or 2D lines of the same survey may cross over each other within the Glomar Shoal KEF boundary.
In order to further verify the accuracy of the predicted received sound levels both vertically below and horizontally from the array, in-field sound source verification will be undertaken/ validated by an expert, independent third party organisation, such as CMST. If as a result of the sound source verification process measured levels are higher than predicted levels, adaptive management measures as outlined in the EP will be implemented.

TGS NWSR South MC MSS - Environment Plan
Rev 1 Page 42
Localised eutrophication of the water column; and localised adverse effect to marine biota
Sewage discharges from seismic vessel must comply with the requirements of:
MARPOL Annex IV – Sewage
Protection of the Sea (Prevention of Pollution from Ships) Act 1983 - Section 26D
Marine Order 96 (Marine pollution prevention — sewage) 2013 Comminuted and disinfected sewage using an IMO approved / MARPOL compliant sewage treatment plant (International Sewage Pollution Prevention Certificate [ISPPC]) can be discharged if:
the vessel is >3 nm from nearest land; and
sewage originating from holding tanks is discharged at a moderate rate (as defined in Marine Order 96) while the vessel is proceeding en route at a speed not less than 4 knots
Sewage that is not comminuted or disinfected can be discharged if:
the vessel is >12 nm from nearest land; and sewage originating from holding tanks is discharged at a moderate rate (as defined in Marine Order 96) while the vessel is proceeding en route at a speed not less than 4 knots.
Food waste discharges from seismic vessel must comply with the requirements of:
MARPOL Annex V – Garbage
Protection of the Sea (Prevention of Pollution from Ships) Act 1983 - Section 26F
Marine Order 95 (Marine pollution prevention - garbage) 2013 Food wastes can be discharged from the survey and chase vessel if:
it is comminuted or ground to a particle size <25 mm
the vessel is moving faster than 4 kn
the discharge takes place as far as practicable from the nearest land, but in any case, ≥3 nm from the nearest land
Food wastes that are not comminuted or ground can be discharged for the survey and chase vessel if:
the vessel is moving faster than 4 kn
the discharge takes place as far as practicable from the nearest land, but in any case, ≥12 nm from the nearest land.
Bilge water discharges (machinery space bilges) from seismic vessel must comply with the requirements of:
MARPOL Annex I - Oil
Protection of the Sea (Prevention of Pollution from Ships) Act 1983 - Section 9 Bilge water discharges can occur only if:
the vessel has a IMO approved / MARPOL compliant oily water separator (International Oil Pollution Prevention Certificate [IOPPC])
the vessel is proceeding en route (i.e. is not stationary); and
oil content less than 15 parts per million (ppm); and
oil discharge monitoring and control system and oil filtering equipment are operating If the above cannot be met, oil must be retained aboard for onshore disposal Bilge water contaminated with chemicals must be contained and disposed of onshore, except if the chemical is demonstrated to have a low toxicity (as determined by the relevant Material Safety Data Sheet [MSDS]). Discharges of bilge water will be recorded in the survey and support vessel engine room logs.
Injury or fatality to protected marine fauna (cetaceans, marine turtles, whale sharks)
Implementation of interaction procedures as outlined previously in this table
Streamer tail buoys fitted with appropriate turtle guards or be of an improved design such as PartnerPlast.
localised physical damage to benthic habitats and communities from vessel grounding, anchoring, dragging or loss of the streamer and associated equipment
Vessels will use approved navigation systems and depth sounders.
Streamer equipped with pressure-activated, self-inflating buoys designed to bring the equipment to the surface if lost accidentally.
Steamers will be towed at a depth that will not allow them to be closer than 10 m from the seabed.
Steamer and associated equipment shall be checked/inspected during deployment.
Adherence to relevant shipboard safety procedures:
Master Standing Orders/Night Order Book Operational Procedures.
Vessel Grounding Operational Procedures.
Navigational Instructions Including Duties of the Officer On Watch Operational Procedures Workboat/Streamer Section Change operational procedures.
Lost towed equipment will be relocated and recovered where safe and practicable to do so.
Anchoring will not occur within the NWSR South MC MSS operational area except in the event of an emergency.
Any incidents of vessel anchoring, vessel grounding or loss of streamer or associated equipment shall be reported to NOPSEMA.
Procedures developed and implemented for lifting activities and streamer deployment/retrieval.
Equipment deployment/retrieval carried out during appropriate weather conditions only, as defined in seismic contractor procedures. Appropriate storage of equipment on board.
Tail buoys fitted with GPS.

TGS NWSR South MC MSS - Environment Plan
Rev 1 Page 43
Streamers fitted with streamer recovery devices (SRDs).
All lifting to be load rated as appropriate for the working load.
Vessels will use approved navigation systems and depth sounders.
Streamer equipped with pressure-activated, self-inflating buoys designed to bring the equipment to the surface if lost accidentally.
Steamers will be towed at a depth that will not allow them to be closer than 10 m from the seabed.
Solid or gel-filled streamers shall be used.
accidental release of hazardous or non-hazardous material to the sea from the survey and support vessels resulting in
Pollution and contamination of the environment and secondary impacts of marine fauna (e.g. ingestion, entanglement) Hydrocarbon spill resulting in Toxic effects on marine fauna and flora Localised and temporary reduction in water quality. Direct and indirect effects on commercial and recreational fisheries
Handling of hazardous and non-hazardous wastes will comply with relevant legislation and ensure:
No discharge of plastics or plastic products of any kind
No discharge of domestic wastes or maintenance wastes
All waste receptacles covered with tightly fitting, secure lids to prevent any solid wastes from blowing overboard
All solid, liquid and hazardous wastes (other than bilge water, sewage and food wastes) will be incinerated or compacted (if possible) and stored in designated areas and sent ashore for recycling, disposal or treatment
Any hydrocarbon storage on deck must be designed and maintained to have at least one barrier (i.e. form of bunding) to contain and prevent deck spills entering the marine environment. This can include containment lips on deck (primary bunding) and/or secondary containment measures (bunding, containment pallet, transport packs, absorbent pad barriers) in place. Correct segregation of solid and hazardous wastes.
Vessels >400 GT must have a Shipboard Oil Pollution Emergency Plan (SOPEP) in place Vessels <400 GT that do not have a SOPEP will have a TGS approved spill management plan or equivalent.
Incinerators used are compliant with MARPOL and IMO requirements.
Spill response bins/kits will be located in close proximity to hydrocarbon storage areas for prompt response in the event of a spill or leak. The kits will be checked for their adequacy and replenished as necessary prior to the commencement of activities and on a regular basis thereafter.
SOPEP / OPEP: In the event of any fuel or oil spills to sea SOPEP / OPEP procedures will be followed for notification and consultation with AMSA and DoT, to ensure prompt and appropriate mobilisation of NATPLAN or WestPlan-MOP / WA DoT OSCP as appropriate.
The survey vessel must have a valid International Oil Pollution Prevention Certificate (IOPPC]) applicable to vessel class.
Storage:
Any hydrocarbon storage on deck of the survey vessel must be designed and maintained to have at least one barrier (i.e. form of bunding) to contain and prevent deck spills entering the sea. This can include containment lips on deck (primary bunding) and/or secondary containment measures (bunding, containment pallet, transport packs, absorbent pad barriers) in place.
Equipment:
Equipment located on deck utilising hydrocarbons (e.g. cranes, winches or other hydraulic equipment) will have as a minimum primary bunding (i.e. deck edge lips or up-stands) to prevent loss of hydrocarbons to the sea
Equipment located on deck utilising hydrocarbons (e.g. cranes, winches or other hydraulic equipment) will be maintained to reduce risk of loss of hydrocarbon containment to the sea. Ongoing maintenance will be accordance with the planned maintenance system (PMS) for the survey vessel.
Spill Response Readiness:
An OPEP drill, appropriate to the response arrangements and nature and scale of the activity, will be conducted in Australian waters prior to the commencement of the survey and tested at least annually.
Response arrangements will be tested if they are significantly amended
All drill tests will be recorded and reviewed as part of the ongoing monitoring and improvement of emergency control measures.
Reporting:
When a fuel/oil spill to sea occurs the survey vessel Master will inform the RCC Australia using a POLREP form (AMSA 197 [MO 91/2]. RCC Australia, in turn, will notify AMSA and/or WA DoT.
Any diesel spills to sea >80 L will be reported to NOPSEMA
A written record of the notification to NOPSEMA must be given to the Department of the responsible State Minister (DoT, DMP, DPaW and/or DER) (see Section 7.4).

TGS NWSR South MC MSS - Environment Plan
Rev 1 Page 44
Refuelling at sea will be subject to the TGS and vessel owners standard operating procedures, plus the following additional measures:
AMSA will be notified prior to any refueling taking place;
at sea refueling will not take place within a distance of 25 km of any emergent land or shallow water features (20 m or less depth);
refueling of vessels will be undertaken under favourable wind and sea conditions as determined by the vessel Masters;
refueling will take place during daylight hours only;
all valves and flexible transfer hoses checked for integrity prior to use and certified; and
dry break couplings (or similar) in place for all flexible hydrocarbon transfer hoses.
Spill monitoring:
In the event of a major diesel spill from the survey vessel to the sea, TGS will implement relevant Type I “Operational Monitoring” implemented for spill surveillance and tracking
If there is a likelihood of a diesel spill impacting any protected areas (e.g. Eighty Mile Beach, Rowley Shoals) TGS will work with the relevant stakeholders to develop and implement appropriate Type II “Scientific Monitoring” to understand the effects of the spill and any response activities on the marine environment.
Stakeholder consultation:
Pre-survey consultation with AMSA and WA DoT to ensure agreement in place for SOPEP interface with NATPLAN, WestPlan-MOP and WA DoT OSCP
Consultation in the event of a major diesel spill - relevant stakeholders (apart from Combat Agencies) will be contacted in the event of a large diesel spill occurring in the operational area.
Financial Assurances:
TGS has financial assurance in place to cover the cost of environmental monitoring or clean-up post spill.

TGS NWSR South MC MSS - Environment Plan
Rev 1 Page 45
6. ASSESSMENT OF ENVIRONMENTAL IMPACTS AND RISKS This section briefly describes the potential risks and impacts that could occur as a result of the proposed activity. Section 4 details the risk assessment and Section 5 summarises the control measures that will be implemented to minimise impacts to receptors described herein.
6.1 NOISE EMISSIONS FROM NON-SEISMIC SOURCES Description of Risk Noise emitted from the survey vessel and support vessel (i.e. engines, propellers, hull flow noise – excluding noise generated by the seismic acoustic source) or from helicopter operations, could cause potential short-term, localised disturbance to marine fauna, such as alteration of behaviour and localised displacement. Potential Environmental Impacts During the survey, underwater noise will be generated from the survey vessel and support vessel(s). Studies of underwater noise associated with petroleum operations have generally reported that the main source of noise relates to the use of thrusters to maintain vessel position, rather than cruising. Noise characteristics and levels vary considerably between vessel types, size, speed and the particular activity being conducted. When idle or moving between sites, vessels generally emit low-level noise. Tugboats, crewboats, supply ships, and many research vessels in the 50–100 m size class typically have broadband source levels in the 165–180 dB re 1μPa range (Gotz et al 2009). In comparison, underwater noise levels generated by fishing trawlers can peak at around 175 dB re 1μPa, and large ships can produce levels exceeding 190 dB re 1μPa (Gotz et al 2009). These levels are significantly lower than the seismic source noise levels discussed in Section 5.3.5. Underwater noise generated by the presence of the survey vessel may result in incidental changes in behaviour of marine fauna (primarily cetaceans, whale sharks and marine turtles), such as disturbance, avoidance or attraction. The recommended RMS SPL threshold (Southall et al. 2007) that could result in possible avoidance is 120 dB re 1μPa at 1 m. The type of noise is not different to that emitted by the commercial shipping traffic and fishing vessels operating in these areas. The intensity of sound travelling from a source in the air (e.g. helicopter) to a receiver underwater depends on source altitude and lateral distance, receiver depth, water depth, and other variables. Richardson et al. (1995) reports figures for a Bell 214 helicopter (stated to be one of the noisiest) being audible in air for four minutes before it passed over underwater hydrophones, but detectable underwater for only 38 seconds at 3 m depth and 11 seconds at 18 m depth. The maximum received level was 109 dB re 1uPa. Noise from helicopters is transient and within the bounds of ambient noise conditions. 6.2 LIGHT GENERATION Description of Risk Lighting on both the survey and support vessels has the potential to create light pollution which may subsequently affect some marine species, primarily seabirds and turtles. Potential Environmental Impacts Behavioural responses to light can alter foraging and breeding activity in turtles, seabirds, fish and dolphins, conferring competitive advantage to some species and reducing reproductive success and/or survival in others. In turtles, light pollution reaching nesting beaches is widely considered detrimental, owing to its ability to alter important nocturnal activities including choice of nesting sites and orientation/navigation to the sea by post-nesting females and hatchlings (Witherington and Martin 2003). However, Pendoley (2005) noted that onshore light influences hatchling orientation more than offshore light, since an offshore light will assist in attracting hatchlings in the direction of the ocean whilst they are traversing the beach. Once in the ocean, hatchlings are thought to remain close to the surface, orient by wave fronts and swim into deep offshore waters for several days to escape the more predator-filled shallow inshore waters. During this period, light spill from coastal port infrastructure and ships may ‘entrap’ hatchling swimming behaviour, reducing the success of their

TGS NWSR South MC MSS - Environment Plan
Rev 1 Page 46
seaward dispersion and potentially increasing their exposure to predation via silhouetting (Salmon et al. 1992). As mitigation against lighting impacts from vessels, the WA Environmental Protection Authority (EPA) recommends a darkness zone within at least 1.5 km of a significant nesting beach should be maintained (EPA 2010). The closest turtle nesting BIA site is located on Thevenard Islalthough it is recognised that nesting beaches are present on smaller islands such as Serrurier, which is 10 km from the operational area. Other significant turtle nesting BIA sites are located on Dirk Hartog Island, the Ningaloo Coastline,
operational area. The flatback internesting buffer BIA overlaps the length of the southern edge of Management Area A1, and so during breeding seasons, there may be a greater chance of encountering individuals. Furthermore, very small overlaps exist for the foraging area for all turtles extending out from De Grey River, for the internesting BIA for the Hawksbill off Thevenard Island and internesting BIA for the Green turtle off Montebello Islands. Owing to their migratory habits, all five species of turtle have the potential to be present throughout the operational area and further offshore. Seabirds may be attracted to vessel lights at night, which may cause disorientation. This may be particularly prevalent in nesting birds close to rookeries. It is possible that seabirds may fly over the NWSR South MC MSS operational area. The potential impacts to other marine fauna of light emissions from seismic vessels is expected to be restricted to localised attraction, temporary disorientation and increased predation, and as such, any impacts arising from light emissions are considered to be minor and localised to a small proportion of the population. 6.3 INTERACTION WITH COMMERCIAL OR RECREATIONAL FISHERS, SHIPPING AND PETROLEUM SERVICE VESSELS Description of Risk There are a number of commercial fisheries operating within the area of the NWSR South MC MSS operational area. Additionally, there is significant commercial shipping activity, much of which is associated with the oil and gas industry. There is the possibility that fishing, diving and commercial activities will be disrupted by the physical presence of the seismic and support vessel. Noise effects on diving is covered in a later section. Potential Environmental Impacts Commercial and Recreational Fisheries Disruption to commercial fisheries in the area could result from:
restriction of access to fishing grounds due to vessel movements and operations
restriction of access due to diesel spill (covered in Section 6.11)
loss of fishing gear e.g. buoyed fish traps.
Five Commonwealth-managed fisheries and 16 State-managed fisheries have zones that overlap the NWSR South MC MSS operational area. Potential consequences to commercial fisheries will be a temporary loss of access to fishing grounds when the survey vessel is in the operational area, which could result in reduced catches and income. In particular, the WCDSF, WCRLF, POMF, PLF, PFTIMF, PTMF, GDSF, MMF, WDTF, WTBF and octopus fishery may be actively fishing in the operational polygon Fishing may be increased around Glomar Shoals, although no seismic activity shall occur over the shoals or in the waters immediately adjacent. Shipping Within the NWSR operational area, there is significant commercial shipping activity, including that associated with the oil and gas industry. Within the NWS, the AMSA introduced a network of commercial shipping fairways to reduce the risk of vessel collisions with offshore infrastructure. A number of these shipping lanes are located within the NWSR South MC MSS operational area with increased activity out of Port Hedland and Karratha.

TGS NWSR South MC MSS - Environment Plan
Rev 1 Page 47
There will be a need to be active and maintain clear and effective communication with all vessels within the vicinity of the survey vessel whilst the towed array is deployed and normal seismic acquisition operations are underway. There may be a considerable speed differences between commercial shipping and the survey vessel, especially whilst the latter is conducting operations. Any avoiding or diversionary action required by a non-survey related commercial vessel will have to be taken without compromising navigational safety, and as such, the survey vessel Master will establi sh communications early with any potential vessel that may be approaching. The highest potential risk will be during slow speed turning of the survey vessel during line changes, or when it is moving perpendicular to the normal passage of commercial shipping. The survey vessel(s) and towed array represent a potential navigational hazard, and other vessels will need to avoid the seismic vessel to prevent collisions, entanglement of streamers and other incidents. Loss of equipment may interfere with shipping activity. Defence Activities There is the potential for the activities of helicopters to interfere with training flights and military exercises within the R859A, R859B, R859C, R860A, R860B, R860C, R861A, R861B, R862A, R862B Ranges, if the survey period coincides with planned aerial military exercise activities. The Department of Defence also made it known that unexploded ordnances may be present on and in the sea floor where activities may be undertaken. Recreational and Pearl Diving Divers exposed to high levels of underwater sound can suffer from dizziness, hearing damage or other injuries to other sensitive organs, depending on the frequency and intensity of the sound. The human auditory system is significantly less-sensitive underwater than in air and is further degraded if diving equipment obstructs the ears or face (e.g. diving with a hood or full facemask). Underwater auditory threshold curves indicate that the human auditory system is most sensitive to waterborne sound at frequencies between 400 Hz to 1 kHz (Parvin et al. (as cited in Anthony et al. 2009), and these frequencies have the greatest potential for damage. In general, within this frequency band, underwater hearing is 35–40 dB less sensitive than in air. Parvin et al. (as cited in Anthony et al. 2009) further developed the weighting scale to enable the allowable level of noise underwater to be assessed and directly compared to air levels. Based on this scale, at 200 Hz, the weighting applied is 52.8 dB, and at 100 Hz, the weighting applied is 61 dB. The NSWR South MC MSS acoustic source will have maximum frequency level of 200 Hz. Within literature (all as cited in Ainslie, 2008), there is some variation in acceptable received levels for divers:
NATO military divers: 177 dB (<250 Hz)
Recreational divers: 154 dB (600–2,500 Hz)
DMAC commercial diver guidelines: 191 dB
Parvin et al: 176 dB (500–2500 Hz). Recreational diving is common along the coastline and islands adjacent to the survey area and is generally restricted to waters less than 40 m, which is the prescribed depth limit for recreational divers (World Recreational Scuba Training Council). Favoured diving areas such as Ningaloo, Montebello Islands (also potentially for commercial pearl diving) or Dampier Archipelago are more than 20 km from the operational area, at which point received sound levels are anticipated to be <150 dB re 1uPa2.s. Thevenard Island (~16 km) is the closest to the operational area. Although not a
favoured diving location, at this distance, seismic noise will be 148 dB re 1uPa2.s, which is less than noise associated with many powerboats (Anthony et al. 2009) and less than the levels suggested to be the limits for recreational diving, as outlined above. Radford et al. (as cited in Anthony et al. 2009) measured the transmitted noise levels from three types of underwater breathing apparatus: a self-contained underwater breathing apparatus (SCUBA); semi-closed circuit re-breather (SCR); and a closed-circuit re-breather (CCR) systems. SCUBA produced the most noise, followed by SCR and CCR (161, 131 and 108 dB re.1 Pu @ 1m, respectively), with much of the noise occurring at low frequencies (<200 Hz).

TGS NWSR South MC MSS - Environment Plan
Rev 1 Page 48
The following control measures will be implemented to manage interaction with marine users:
Three weeks notifcation to relevant stakeholders prior to commencing an individual survey with detailed information for the proposed activity (including timing, duration and locations etc.).
7– 10 day forecast for WCRLF and the octopus fishery to minimise against pot entanglement.
7– 10 day forecast for Recfishwest and relevant local fishing organisations/ groups (e.g. charter companies and fishing clubs) prior to activities occurring adjacent to Glomar Shoal
Once in the field, the survey vessel shall contact other vessels (where required) to prevent disturbance or avoid interaction within the operational area.
a risk assessment shall be undertaken and SIMOPS plan developed with dive operators if seismic acquisition activities occur within 10 km of diving operations.
See Section 9 for further details on the stakeholder consultation process. 6.4 BALLAST WATER DISCHARGE, AND BIOFOULING OF VESSEL HULL, OTHER NICHES AND IMMERSIBLE
EQUIPMENT Description of Risk Invasive Marine Species (IMS) are marine plants or animals that have been introduced into a region beyond their natural range and have the ability to survive, reproduce and establish founder populations. Species of concern vary between regions depending on various environmental factors such as water temperature, salinity, nutrient levels and habitat type. Key vectors requiring management include:
discharge of high risk ballast water taken up at international or domestic sources;
biofouling on vessel hulls and other external niches (e.g. propulsion units, steering gear and thruster tunnels);
biofouling of vessel internal niches (e.g. sea chests, strainers, seawater pipe work, anchor cable lockers and bilge spaces etc.); and
biofouling on equipment that routinely becomes immersed in water. Once introduced, IMS can cause serious environmental, social and economic impacts through predation or displacement of native species. Following their establishment, eradication of IMS populations is often impossible, limiting management options to on-going control or impact minimisation. These direct or indirect impacts also have the potential to threaten a range of sectors including:
commercial fisheries and aquaculture;
tourism industry;
human health;
shipping; and
infrastructure Potential Environmental Impacts Ballast Water Ballast water which may potentially harbour invasive marine species can be released by seismic and support vessels during marine seismic surveys. The Department of Agriculture (DAFF) is the lead agency for management of ballast water from international vessels. DAFF introduced the mandatory Australian Ballast Water Management Requirements (DAFF 2013) that are enforced under the Quarantine Act 1908. Under these arrangements, all vessels that have travelled from international waters are obligated to assess and manage their ballast water in accordance with the AQIS requirements. These arrangements prohibit the discharge of high-risk ballast water within Australian territorial seas (within 12 nmi of Australian territories) including Australian ports. It is also recommended by AQIS that full ballast, high risk exchanges be conducted as far as possible away from shore and in water at least 200 m deep.

TGS NWSR South MC MSS - Environment Plan
Rev 1 Page 49
Biofouling Biofouling on vessel hulls and other external niche areas, on internal niches, and on equipment routinely immersed in water, all pose a potential risk of introducing IMS into Australia. Under the National Biofouling Management Guidance for the Petroleum Production and Exploration Industry (Commonwealth of Australia 2009), a risk assessment approach is recommended to manage biofouling. The potential biofouling risk presented by the survey and support vessels within the NWSR South MC MSS operational area will relate to the length of time that these vessels were operating in Australian waters or operating outside Australian waters, the location of the surveys, the length of time spent at these location(s) and whether the vessels have undergone hull inspections, cleaning and application of new antifoulant coating prior to operating in Australian waters.

TGS NWSR South MC MSS - Environment Plan
Rev 1 Page 50
6.5 SEWAGE, GREY WATER AND PUTRESCIBLE WASTES Description of Risk During surveys in the NWSR South MC MSS operational area, the survey and support vessel will routinely discharge (on a daily basis) relatively small volumes of sewage and food wastes to the ocean in accordance with the requirements of the MARPOL 73/78 Convention (as implemented in Commonwealth waters by the Protection of the Sea (Prevention of Pollution from Ships) Act 1983. Additionally, the survey and support vessel may need to discharge bilge water during the survey. Routine discharges of bilge water, sewage and food wastes from the survey vessel and support vessel may cause a localised reduction in water quality. Potential Environmental Impacts The total nutrient loading from vessel operations during surveys in the NWSR South MC MSS operational area will be insignificant in comparison to the natural daily nutrient flux that occurs in marine waters within the region. No significant impacts are anticipated because of the minor quantities involved, localised area of impact, high level of dilution into deep oceanic waters and high biodegradability/low persistence of the wastes. Bilge tanks receive fluids from many parts of the vessel. Bilge water can contain water, oil, detergents, solvents, chemicals, particles and other liquids, solids or chemicals. Treatment of bilge water will be conducted using an oily water separator. However, if not treated prior to discharge there would be potential for a negligible and localised increase in nutrient concentrations. 6.6 UNDERWATER NOISE EMISSIONS FROM DISCHARGE OF ACOUSTIC SOURCE Description of Risk
The NWSR South MC MSS will utilise an acoustic source with a maximum capacity of 4,120 cui and will produce far-field source peak SPL in the order of 260 dB re 1μPa@1 m in the vertically downward direction, at frequencies extending
up to 200 Hz. The primary environmental risk from seismic surveys is sound emissions caused by the discharge of underwater seismic pulses. The level of impact to marine fauna depends on multiple factors, such as sound intensity and duration, distance from the source, fauna species and the mitigation measures employed. Potential impacts range from mortality or acute damage from close exposure to high sound levels, to various behavioural responses such as area avoidance (McCauley 1994). Source Clarification The assessment of impacts and risks from discharge of underwater seismic pulses is based on information sourced from a number of publications in the scientific literature. It is important to note that it is sometimes difficult to interpret studies on the effects of underwater sound on marine fauna because authors often do not provide enough information, including received sound levels, source sound levels and specific characteristics of the sound. It is prudent to point out that there is presently confusion in some quarters caused by incorrectly associating the biological effects of high explosives with those of other types of underwater sound sources. High explosives produce a shock wave in the water that is subtly different to that of a sound wave produced by most underwater sources (including seismic sources), but vastly different in its biological implications. Shock waves produce severe pathological effects at considerable ranges, which vary depending on charge size, and physical or biological factors. Airguns do not produce shock waves, and the effects described for high explosives do not apply to them. For example, Larson (1985) concluded from experiments with caged fish that mortality from shock waves only occurs when two criteria are met simultaneously:
peak pressure is ≥ 2.75 x 10⁵ Pa
rise time and decay time is ≤ 1 ms. Airguns do not meet these criteria and do not cause shock waves.

TGS NWSR South MC MSS - Environment Plan
Rev 1 Page 51
6.6.1 Acoustic Modelling Received energy is attenuated due to spreading and absorption and can be shown as RL – SL-TL (where RL= received level; SL = source level; and TL= transmission loss). In general, sound attenuation in the ocean can be divided into three effects:
sound absorption in the water;
boundary losses from surface and bottom interactions; and
geometrical/spreading losses. Losses due to absorption and boundary losses are minimal and not taken into account in the EP modelling. Sound pressure decreases rapidly as the distance from the source increases. Sound will decay rapidly in shallow water environments and will transmit over greater distances in deeper environments. The sound exposure levels are greatest directly underneath the source with rapid decay horizontally from the source. Geometric losses As the pressure wave propagates from the source, it will initially spread equally in all directions resulting in free-field spherical spreading (20 log[R], (where R = range distance) (Wisløff et al. 2014; Urick 1983). In a perfect shallow duct (i.e. a uniformly dense water column between a seabed and surface that provides perfectly reflective boundaries), the spreading would be cylindrical and thus follow a relatively slow rate of decay (10 1og[R]). However, the seabed and surface are not perfect reflectors, resulting in energy losses from the water column as the sound propagates along the duct. This type of propagation is termed ‘modified cylindrical spreading’ and its attenuation rate is often modelled by adopting a 15 log[R] rate of decay with distance. Various studies demonstrate this variation in geometrical spreading formulas:
Marsh and Schulkin (1962) proposed a spherical spreading decay rate at short ranges, a cylindrical spreading rate at long ranges, and a 15 log[R] loss at intermediate ranges.
Hermannsen et al. (2015) showed linear regressions based on actual recordings indicated transmission loss coefficients between 16 and 19 dB per 10-fold increase in distance.
Handegard et al. (2013) showed that the simple spherical-spreading geometrical loss model artificially elevated levels close to the source, and that actual received levels were much lower.
It is not unreasonable to assume spherical spreading loss to a point 1.5 times the water depth; modified cylindrical spreading loss between 1.5 and four times the water depth; and cylindrical spreading loss for long ranges being greater than four times the water depth. Horizontal Propagation For horizontal sound transmission, only source levels in the horizontal plane are of importance. Numerous studies including Urick (1983), Duncan and Parsons (2011) and Hovem et al. (2012) indicate that the customary formula to express TL, being TL=Nlog10(r), is too simplistic and misleading especially in shallow waters. Consequently, variations to this basic equation have been developed and are more representative of actual TL is shallow waters. Three such models include those developed by Urick (1983), Hermannsen et al. (2015) and Hovem et al. (2012).
Urick: TL= [10log10(rh)]+[10log10(rt)]+[(@+@L)rh]
Hovem: 20log(rt)+10log(r/rt).
Hermannsen: 18log(R) The above three formula all validate each other, and indicate that for a 3120 cui source in 50 m of water a horizontal separation of 225 m will ensure that received levels will be below threshold levels of 220 dB SPL. However, based on modelling undertaken by third parties (such as CMST) for other projects, or as validated by ground truthing, these numbers are high and very conservative.

TGS NWSR South MC MSS - Environment Plan
Rev 1 Page 52
CMST undertook horizontal modelling for the TGS Nerites project, which used a comparable 4,100 cui source with a back-calculated source SEL of 235 dB. Results indicated that within 200 m received SEL was ~180 dB; within 1 km ~169 dB; 2 km ~163 dB; and within 10 km ~151 dB. These losses are equal or higher than a 20log(r) transmission loss out to 10 km. These results are also comparable to CMST modelling undertaken for the PGS Forge project being undertaken in waters 40-461 m water depth. A 4,130 cui array with a maximum SEL of 229 dB re 1µPa2.s was modelled and indicated that levels were reduced to ~200 dB SPL (~175 dB SEL) within 1 km of the source and SPL ~150 dB (125 dB SEL) within 10 km. Three ground-truthing reports also support that the transmission losses calculated with the above formula are overly conservative:
Santos: in waters ~150 m deep off Tasmania indicates a straight spherical spreading equation of 20log(r) is appropriate.
Pegasus Basin by Anadarko (Gardline 2014): the application of spherical spreading underestimated losses and is closer to a geometrical spreading function reaching 25log(r).
Data loggers placed in waters between 30 m and 160 m deep in the Otway Basin (McCauley 2005) found that the curve of best fit to account for transmission loss was close to 24log(r).
McCauley (2005) presented data from five other sets of received seismic surveys and results again indicate that even to 10 km a geometrical spreading equation of at least 20log(r) is appropriate.
Consequently, TGS believe that the application of the modified cylindrical formulas as outlined previously are overly conservative and that transmission losses are likely to be between 20log(r) and 25log(r) close to the source and even out to distances of 10 km.
Based on empirical measurements of a number of seismic airgun sources in western and southern Australian waters (Figure 6.1), including data discussed above for the Otway Basin, the sound pulses from the 4,120 cui airgun array
described in this EP are expected to decrease to SEL in the order of ~172 dB re 1µPa2.s within 1 km of the source, 168 dB re 1µPa2.s within 2 km, and ~154 dB re 1µPa2.s within 10 km dependent on the sound propagation characteristics of the area. Note that received SEL quoted above includes an additional 5 dB to account for possible variation, after which they are converted to SPL by adding 25 dB and so are conservative. Data presented in Figure 6.1 are for seismic operations with a variety of depths (~15 m to >2,000 m), substrates and array sizes, and as with other readings, received levels approximate a 20log(r) geometrical spreading.
Figure 6.1- Noise decay curves for a number of different seismic airgun sources in Australian waters
All air gun measures where received levels for a given survey have been averaged in log spaced range bins and presented
as the mean value/bin + 95% confidence limit. The black curves are arrays or single air guns of <1000 cui capacity; the red
curve is array of 1000-2000 cui; the blue curves 2000-3000 cui; magenta curves 3000-4000 cui; and green 4000-5000 cui.
Source: Searcher 2015

TGS NWSR South MC MSS - Environment Plan
Rev 1 Page 53
Consequently, based on third party modelling and ground truthing results, TGS believe it is reasonable to apply spherical spreading to at least 10 km from the source. However to be conservative, TGS will apply spherical spreading to determine horizontal received levels and buffer zones to 2 km beyond which received levels will be as per the comparative CMST measured data indicated in Figure 6.1. Note that the CMST results used are based on the highest received numbers being those for the 3,000-4,000 cui source as opposed to the 4,000-5,000 cui source. Table 6.1 shows the SPL and SEL values for the 4,120 cui source out to 10 km that was used as a guide to assess possible impacts from received noise levels.

TGS NWSR South MC MSS - Environment Plan
Rev 1 Page 54
Table 6.1- Horizontal received levels (SPL and SEL) to 10 km
Distance from Source (m)
Transmission loss (dB)
SEL (dB re 1µPa2.s)1
SPLpeak (dB re 1 μPa)2
50 * 34 201 226
100 * 40 195 220
225 * 47 188 213
400 * 52 183 208
500 * 54 181 206
1,000 * 60 175 200
2,000 * 66 169 194
3,000 ^ - 165 190
5,000 ^ - 160 185
7,000 ^ - 157 182
10,000 ^ - 155 180 * = spherical spreading 20log(r) ^ = as per CMST measured data and ground truthing 1 Based on 235 dB SEL source level; from CMST (2016) 2 Based on 260 dB SPLpeak source level; from CMST (2016)
Vertical Modelling As outlined previously, is it reasonable to assume that spherical spreading, being 20log(r), can be applied to ascertain transmission loss directly under a source. To account for increased levels associated with seabed reflectivity, 4.1 dB is added to results for account for possible variation. TGS had third-party, independent sound propagation modelling conducted by CMST for the 4,120 cui array. The results indicate that the use of 20log(r) +4.1 dB was consistent with their results and thus appropriate basis for calculating received levels directly under the source as provided in Table 6.2.
Table 6.2- Received levels (SEL and SPLpeak) vertically below the array to 200 m water depth
Water depth (m)1
Calculated RL
SEL (dB re 1 µPa2.s)
SPLpeak (dB re 1 µPa)
45 (38) 206.8 231.3
50 (43) 205.7 230.2
53 (46) 205.1 229.6
60 (53) 203.9 228.4
75 (68) 201.7 226.2
100 (93) 199.0 223.5
125 (118) 197.0 221.5
150 (143) 195.3 219.8
175 (168) 193.9 218.4
200 (193) 192.7 217.2
6.6.2 Exposure Criteria Hearing loss may be temporary (temporary threshold shifts (TTS)) or permanent (permanent threshold shifts (PTS)) depending on the length and intensity of exposure to a noise. Table 6.3 shows threshold levels for TTS and PTS-onset for low-frequency (LF) cetaceans (e.g. baleen whales), mid-frequency (MF) cetaceans (e.g. dolphins, toothed whales, beaked whales, bottlenose whales) and high-frequency (HF) cetaceans (e.g. true porpoises, pygmy and dwarf sperm whales, cephalorhynchid dolphins, Peale’s dolphin and hourglass dolphin) for impulsive sources of noise such as seismic airgun arrays (NOAA 2016).

TGS NWSR South MC MSS - Environment Plan
Rev 1 Page 55
Table 6.3- Summary of final NOAA threshold levels for TTS and PTS onset for LF, MF and HF cetaceans
Hearing group PTS onset thresholds
(received levels) Weighted TTS onset
threshold (SELcum)
LF Cetaceans 219 dBpeak
183 dB SELcum 179 dB
MF Cetaceans 230 dBpeak
185 dB SELcum 178 dB
HF Cetaceans 202 dBpeak
155 dB SELcum 153 dB
Source: NOAA (2016).
Proposed minimum levels that may result in recoverable injury or mortality and potential mortal injury in fish, turtles, eggs and larvae, are outlined in Table 6.4 below. These levels have been developed based on impulsive sounds (i.e. pile driving or explosives) as Popper et al. (2014) state there are no quantified data for seismic airguns.
Table 6.4- Proposed sound levels for mortality and impairment in fish and turtles
Type of animal Mortality or potential
mortal injury
Impairment
Recoverable injury TTS
Fish: no swim bladder >219 dB SELcum or
>213 dBpeak
>220 dBpeak^
>216 dB SELcum or >213 dBpeak
>220 dBpeak^
>186 dB SELcum
176 – 180 dB SELss*
205-210 dBpeak*
Fish: swim bladder but not involved in hearing
>210 dB SELcum or >207 dBpeak
>220 dBpeak^
>203 dB SELcum or >207 dBpeak
>220 dBpeak^
>186 dB SELcum
176 – 180 dB SELss*
205-210 dBpeak*
Fish: swim bladder involved in hearing >207 dB SELcum or
>207 dBpeak
>220 dBpeak^
>203 dB SELcum or >207 dBpeak
>220 dBpeak^
>186 dB SELcum
176 – 180 dB SELss*
205-210 dBpeak*
Sea turtles >210 dB SELcum or
>207 dBpeak - -
Eggs and larvae >210 dB SELcum or
>207 dBpeak - -
dBpeak (dB re 1 µPa); SELcum (dB re 1 µPa2.s) Source: Popper et al. (2014); * Popper and Hastings (2009); ^ various references as cited within this EP
Threshold levels are based on information presented by Popper et al (2014) which are centred on pile-driving levels, as well as research specifically on seismic operations (CSAS 2006). These exposure criteria and threshold levels are used to determine potential impacts on sensitivities and to assist in the development of control measures to ensure impacts are reduced to ALARP and acceptable levels. Cumulative SEL If an animal is exposed to repeated pulses from a seismic airgun, effects may be a function of the energy in all the sound events accumulated over time (Popper et al 2014). SELcum is the linear summation of the individual sound events (SELss) over the time period of interest. Using the equation SELcum = SELss+10log10(N), Tables 6.5 and 6.6 show the received SEL vertically below the source at the seabed from single pulses (or “strikes” – SELss) for the 4,120 cui array from 50–200 m depths, and the received SEL horizontal to the source to 1 km and the number of shots it would take to exceed the SELcum as presented in Table 6.4.

TGS NWSR South MC MSS - Environment Plan
Rev 1 Page 56
Table 6.5- Predicted vertical SELss and number of shots to exceed SELcum exposure guidelines in water depths from ~50–200 m
Depth below the source
(m) SELss
1
No. shots to exceed SELcum1
exposure guidelines
>203 dB >207 dB
45 207 1 1
50 206 1 2
60 204 1 2
75 202 2 3
100 199 3 6
125 197 4 10
150 195 6 16
175 194 8 20
200 193 10 25 Note: 1 SELss and SELcum in dB re 1 µPa2.s based on worst case scenario of static source and static receptor.
Table 6.6- Predicted horizontal SELss and number of shots to exceed SELcum exposure guidelines
Horizontal distance (m)
SELss1
No. shots to exceed SELcum1
exposure guidelines
>203 dB >207 dB
50 201 1 4
100 195 7 16
225 188 32 80
400 183 100 252
500 181 159 400
1,000 175 >600 >1,500 Note: 1 SELss and SELcum in dB re 1 µPa2.s based on worst case scenario of static source and static receptor.
The above approach of using cumulative received SEL is based on an assumption that all shots along a line section are acquired at the same instant, which is obviously not the case. With a moving source, this will never occur, and as the source moves, the received levels at a single point on the seabed will continually reduce. Thus, the potential for marine fauna, such as fish, to recover from a temporary threshold shift (TTS) or recoverable injury, either between shots or between lines, is not taken into account. The US National Marine Fisheries Service (NMFS) applies a “resetting” of SELcum after 12 hours of non-exposure (Stadler and Woodbury, 2009). The SELcum for a fish during a pile driving operation is reset to 0 for the next set of exposures, if there is a 12-hour period between the end of one pile driving operation and the start of the next. 6.6.3 Potential Environmental Impacts Studies relating to the environmental effect of marine seismic surveys have largely focused on the potential effects to fish stocks and marine mammals from the sound waves associated with the seismic energy source. Concerns included:
pathological effects (lethal and sub-lethal injuries) – immediate and delayed mortality and physiological effects to nearby marine organisms
behavioural change to populations
disruptions to feeding, mating, breeding or nursery activities of marine organisms in such a way as to affect the survival or abundance of populations
disruptions to the abundance and behaviour of prey species for marine mammals, seabirds and fish
changed behaviour or breeding patterns of commercially-targeted, marine species, either directly or indirectly and in such a way that commercial or recreational fishing activities are compromised.
The response of marine fauna to marine seismic survey sounds will generally range from no effect to various behavioural changes. Immediate chronic effects are likely to be restricted to very short ranges and high sound intensities and are

TGS NWSR South MC MSS - Environment Plan
Rev 1 Page 57
unlikely to occur for the majority of species, as most free-swimming animals will avoid areas in which chronic effects may occur. Site-attached species associated with benthic communities may be at greater risk of negative impacts. 6.6.3.1 Disturbance to Planktonic Organisms Except for fish eggs, larvae and other minute planktonic organisms within a few metres of an airgun, no planktonic organisms are likely to be affected significantly by acoustic source discharges. Data presented in McCauley (1994) indicate that the range of chronic effects on fish eggs and larvae is likely to be restricted to less than approximately 2 m. Calculations indicate that less than 0.02% of plankton in an area would be affected, assuming that plankton are uniformly distributed, single gun array, 18.75 m shot point interval, maximum range of pathological effect 2 m. Data presented in Popper et al. (2014) indicate that eggs and larvae in very close proximity (<5 m) are likely to suffer mortality and tissue damage. Even with this increased radius, percentage of plankton affected would still be very minor, and the effects from the seismic discharge is insignificant compared with the size of the planktonic population in a survey area or natural mortality rates for planktonic organisms. Currently, there is little understanding of spawning areas and durations for most key indicator species in the NWMR or NMR. The Glomar Shoals are located within a survey exclusion zone and has been identified as a potential area important for spawning events, due to its high species diversity and supposed productivity. However, this has not been confirmed by DoF, and there are currently no fishing exclusion zones around this area. The Glomar Shoals have also been described as a high-energy environment subject to strong sea-floor currents (Falkner et al. 2009). Consequently, the potential impacts of seismic operations on fish eggs and larvae at Glomar Shoals would be low to negligible when compared with the size of the planktonic population in the survey area, the duration of the survey (short-term) and the inherently high natural mortality rates for planktonic organisms. Sætre & Ona (1996) calculated that under the ‘worst case’ scenario, the number of larvae killed during a typical seismic survey was 0.45% of the total population. For a number of fish species, natural mortality is estimated at 5–15% per day. Consequently, seismic-created mortality is so low that it can be considered to have inconsequential impact on recruitment to the populations. The pelagic phase of a pearl oysters lifecycle lasts for 28–35 days, after which they become a benthic sedentary bottom-dweller. It is during the pelagic phase that they are more likely to be impacted by seismic surveys. Peak spawning periods are during October to December and February to March. Sound exposure guidelines published by Popper et al. in 2014 indicated that for eggs and larvae, SELcum levels >210 dB or >207 dBpeak may incur mortality or potential mortal injury while animals nearby have a moderate risk of recoverable injury or TTS. However, these predictions are based on work by Bolle et al. (2012) on pile driving signals. More relevant studies (Table 6.7) using seismic sources indicate that levels required to result in injury are higher than those presented by Popper et al. (2014).
Table 6.7- Observed seismic noise pathological effects on fish eggs and larvae
Species Source Source level (dB re 1 µPa @ 1m)
Distance from source (m)
Exposure level (dB re 1 µPa)
Observed effect Reference
Cod (larvae 5 days) Single airgun 250 1 250 Delamination of the
retina Matishov (1992)
Cod (larvae 2-10 days)
Single airgun 222 1 222 No injuries detected Dalen and
Knutsen (1986) 10 202 No injuries detected
Fish eggs (Anchovy)
Single airgun 230 (estimated)
1 230 7.8% of eggs injured relative to control
Kostyvchenko (1973)
10 210 No injuries detected
Fish eggs (Red Mullet)
1 230 No injuries detected
10 210 No injuries detected
Dungeness Crab (larvae)
Seven acoustic source
244 (estimated
1 233.5 No significant difference in survival
rate relative to controls
Pearson et al. (1994)
3 230.9
10 222.5

TGS NWSR South MC MSS - Environment Plan
Rev 1 Page 58
6.6.3.2 Benthic Invertebrates Based on the consideration of anatomical features related to hearing mechanisms and a review of available studies, McCauley (1994) postulated that the mechano-sensory system of many invertebrates may only perceive the sound of airgun ‘shots’ close to a seismic source, possibly less than 20 m from an array, thus implying that surveys must be run in very shallow water to have an effect. This research further suggested zones of effect for invertebrates:
• Audible zone – approximately 20 m from the source array
• Response zone – approximately 10 m from the source array
• Pathological zone – approximately 2 m from the source array. Few marine invertebrates have sensory organs that can perceive sound pressure, but many have organs or elaborate arrays of tactile ‘hairs’ that are sensitive to hydro-acoustic disturbances (McCauley 1994). These sensory hairs or organs are collectively known as mechanoreceptors, and crustaceans are particularly well-endowed with them. Close to a seismic source, the mechano-sensory system of many benthic crustaceans will perceive the ‘sound’ of airgun pulses, but for most species, such stimulation would only occur within the near-field or closer, perhaps within distances of several metres from the source (McCauley 1994). Decapod crustaceans have a variety of external and internal sensory receptors that are potentially responsive to sound and vibration. Many of these resemble vertebrate receptors that respond to hydrodynamic stimulation, particle motion and possibly pressure. However, the exoskeleton and body plan of aquatic decapods are more capable of responding to particle displacement components of an impinging sound field than pressure changes. The limited acoustic sensitivity of decapods is also related to their lack of any gas-filled spaces, such as those associated with pressure detection in fishes. However, many decapods have extensive arrays of hair-like receptors both outside and inside their exoskeleton that most probably respond to water or substrate-borne displacements. They also have many proprioceptive organs that may perceive vibrations (Christian et al. 2003). In an extensive and thorough review, Moriyasu et al. (2004) provided a summary of impacts of seismic airguns on marine invertebrates based on literature reviews. They concluded that “very limited numbers of experiments were scientifically and reasonably conducted”, but the results of nine quantitative studies showed five cases of immediate (lethal or physical) impacts of seismic airguns on invertebrate species and four cases of no impacts (see Table 5.9). One study showed physiological impacts, and another showed no physiological impact. Three cases showed behavioural impacts, and one study showed no impact on behaviour. Moriyasu et al. (2004) concluded that:
“Squid (McCauley et al. 2000a) and crab behaviour (Christian et al. 2003) have been studied by direct observation. Pre- and post- seismic airguns comparisons of catch rates were made by La Bella et al. (1996) and Christian et al. (2003) on various invertebrate species. The quantitative and anecdotal aspects of all other studies were inadequate for assessing the effects of ...... seismic airguns on invertebrates. In addition, in-depth analyses on physiological changes in animals exposed to seismic airguns are quasi-absent.”
This review (Moriyasu et al. 2004) made the comment that the papers by La Bella et al. (1996), McCauley et al. (2003) and Christian et al. (2003) provided the most detailed and useful information on the possible impacts of seismic airguns on invertebrates among the documents they examined.

TGS NWSR South MC MSS - Environment Plan
Rev 1 Page 59
Table 6.8- Summary of impacts of seismic airguns on marine invertebrates based on literature reviews
Lethal / physical Physiological /
pathological Behavioural Catch rate
Negative impacts observed
Loligo vulgaris Chionoecetes opilio (eggs) Chlamys islandicus Sea urchins Architeuthis dux
Bolinus brandaris Alloteuthis sublata Sepioteuthis australs Architeuthis dux
Bolinus brandaris
No impacts observed
Chionoecetes opilio Mytilus edulis Gammarus locusta Crangon crangon
Chionoecetes opilio Chionoecetes opilio
Crangon crangon Penaeus blebejus Nephrops norvegicus Illes coindetti Squilla mantis Paphia aurea Anadara inaequivalvis
La Bella et al. (1996; as cited in Moriyasu et al. 2004) reported that no apparent changes in trawl catches were found in short-finned squid (Illex coindetti) nor in Norway lobster (Nephrops norvegicus) in the area prospected one day before exposure to sound source levels of 210 dB re 1μPa at 1 m (corresponding to levels of 149 dB re 1μPa at animal location). The same authors reported that no apparent catch reductions in mantis shrimp (Squilla mantis) caught by gill nets, and in golden carpet shell (Paphia aurea), inaequivalvis ark shell (Anadara inaequivalvis) and purple die murex (Bolinus brandaris) caught by a hydraulic clam dredge in the area prospected one and two days before exposed to the same sound level mentioned above. However, purple die murex caught by gillnet showed a significant difference in catch rate. Based on the results of catch comparison of this species between hydraulic dredge and gill nets, the author concluded that this was a change in behavioural reaction to seismic guns rather than immediate mortality (La Bella et al. 1996; as cited in Moriyasu et al. 2004). Caged squid (Sepioteuthis australis) subjected to an individual operating airgun showed behavioural changes and avoidance (McCauley et al. 2003; cited in Moriyasu et al. 2004 as McCauley et al. 2000a). They found an alarm response at 156–161 dB re1μPa, and a strong startle response at 174 dB re 1μPa involving ink ejection and rapid swimming. The caged squid also moved to the sound shadowed area of the cage. The authors suggested thresholds for affecting squid’s behaviour are at 161–166 dB re 1 μPa. After being exposed to sound levels of 197–237 dB from an acoustic source, Christian et al. (2003; as cited in Moriyasu et al. 2004) did not detect any effects on the behaviour of snow crab (Chionoecetes opilio) placed in cages and put on the ocean bottom at a depth of 50 m. Additionally, this study found no effects on catch rate of snow crab by comparing pre- and post-seismic testing. The catch rates were even higher in post-seismic fishing than pre-seismic fishing. The authors concluded that this was likely due to physical, biological or behavioural factors unrelated to the seismic source. The same study also examined a series of morphological and physiological characteristics, i.e. haemolymph, hepatopancreas, heart, heads (statocysts, green glands, and brains), gills and gonads. They did not find significant effects on the physiological components of tested animals, but they noted that embryonic development of external eggs may be delayed after being exposed to seismic airguns (Christian et al. 2003; as cited in Moriyasu et al. 2004). A number of studies examined the potential effects of seismic surveys on catch levels in fisheries targeting benthic crustaceans, such as prawns and rock lobster. Andriguetto-Filho et al. (2005) investigated the effect of seismic surveys on prawn fisheries in relatively shallow waters (2–15 m) in Camamu Bay, north-western Brazil. Catch rates of various shrimp species were measured before and after use of a four-airgun array with a source peak pressure of 196 dB re 1μPa at 1 m. Catch rates were found to be unaffected. The experiment was undertaken over a period of a few days, whereby in-migration would not be a confounding factor. It was also noted that the authors conducted histopathological studies on gonadal and hepatopancreatic tissues, and there was no damage that could be associated with sound exposure. This study did not detect any significant deleterious impacts from seismic airgun noise on various penaeid species, suggesting that prawn stocks are resilient to the disturbance by airguns under the experimental conditions applied. This study is supported by pilot observations carried out by the DFO on commercially-important, northern shrimp (Pandulus borealis), in which no “flight or fright” reactions were found in animals exposed to relatively high sound levels in the laboratory (DFO 2008). Thus, although crustaceans can be expected to detect the particle motion component of

TGS NWSR South MC MSS - Environment Plan
Rev 1 Page 60
sound as revealed by sensitive electrophysiological or other techniques, this does not mean that they would be impacted and subsequently move away from a seismic operation, thereby causing ramifications for catchability. Parry and Gason (2006) investigated the effect of seismic airgun discharges on southern rock lobster (Jasus edwardsii), via statistical analysis of the coincidence between seismic surveys and changes in commercial catch rates in western Victoria between 1978 and 2004. There was no evidence that catch rates of rock lobsters were affected by seismic surveys in the weeks or years following the surveys. However, most seismic surveys occurred in deep water, where impacts were expected to be minimal. The apparent lack of impact from seismic surveys on catch rates of rock lobsters is consistent with the limited information available on the physiological effects of seismic surveys on invertebrates, including rock lobsters (Parry and Gason 2006). The majority of benthic crustaceans, such as prawns or crabs, will only exhibit a behavioural response to airgun pulses at very close ranges, which means that only surveys in very shallow water will have any potential effect. A conservative figure for the minimum depth for a response would be at 15 m from the array (McCauley 1994). Any disturbance to benthic crustaceans immediately beneath an acoustic source would be very short-lived, as they would be only exposed to one or two pulses before the source moves out of erythe potential range within which any disturbance may occur.
Sound detection capabilities of bivalve molluscs Little is known about sound detection in invertebrates. However, many species have mechano-sensory structures that have some resemblance to vertebrate ears. Many molluscs, including bivalves, possess statocysts, which are organs that assist the organism in maintaining balance and orientation in its immediate environment. Statocysts are fluid-filled, capsule-like sensory organs, usually including ciliated hair cells and containing a single dense body (statolith) or a number of smaller ones (statoconia). The statolith and/or statoconia interact with the cilia lining the capsule, probably (as has been shown in gastropods and cephalopods) conveying information about orientation to the organism. They may also enable the animals to detect low-frequency pressure waves in sediment, either in the pore-water or as vibrational signals associated with movements of sediment particles (Wethey and Woodin 2005). Additionally, proprioception (the sensing of movement of bodily tissue by acoustic energy) may be involved in the detection of sound in invertebrates, including bivalves (McCauley and Kent 2008). It has been postulated that statocyst organs may be receptive to the particle acceleration component of a sound wave, possibly in the far-field (Hawkins and Myrberg 1983; cited in McCauley 1994). Franzen (1995) showed that tellinid bivalves (Macoma balthica) are sensitive to frequencies in the range of 50–200 Hz, which corresponds to shear-wave vibrations that propagate along the sediment surface. A study on the ox-heart clam (Glossus humanus) demonstrated sensitivity to vibrations and hypothesized as related to sensing breaking waves on the incoming tide, allowing the clam to move with the tide (Frings 1964; cited in McCauley and Kent 2008). Donax variabilis, a coquina clam, responds to pressure signals in the range of 20 Pa, or a sound pressure level of 140 dB (Ellers 1995). In at least one other bivalve species, response to sound was evident by changes in aggregations. Low frequency sound (30–130 Hz) has been demonstrated as an effective control measure for zebra mussel fouling (Donskoy and Ludyanskiy 1996). Beyond the zones of impact outlined by McCauley (1994), no information is available concerning the distances over which bivalve molluscs may be able to detect either the pressure or particle motion components of a sound wave, particularly for animals suspended in mid-water. Wethey and Woodin (2005) concluded that coquina clams could probably detect defecation signals generated by a polychaete worm at a distance of 60 cm in sediment. Effects of airgun noise emissions on bivalve molluscs Based on a number of previous papers, including a comprehensive literature review (Moriyasu et al. 2004), the effects of underwater noise from seismic airguns on molluscs are very limited. Earlier studies examined the impacts of explosives used as a sound source in seismic refraction surveys on a number of bivalve molluscs, including the pearl oyster (P. maxima) and the American oyster (Crassostrea virginica). Seismic airguns cause less impacts on benthic invertebrates than explosives and generate a lower maximum pressure. Seismic airguns cause a lower rate of pressure change, and thus chronic effects (particularly for organisms with gas-filled internal organs such as swim bladders) are only likely impacted at very close distances (within a few metres) of an acoustic source. No bivalve molluscs possess gas-filled internal organs that would make them more susceptible to chronic effects from underwater noise sources. It is necessary to emphasise that the use of explosives produces a shock

TGS NWSR South MC MSS - Environment Plan
Rev 1 Page 61
wave that is subtly different to that of a sound wave, as produced by most underwater sources (including airguns), and is vastly different in its biological implications. Shock waves produce severe pathological effects at considerable ranges, which vary depending on charge size, and physical or biological factors. Airguns do not produce shock waves and the effects described for high explosives do not apply to them. The literature suggests that invertebrates, which typically do not contain gas spaces, appear to be remarkably resilient to underwater explosions (Keevin and Hempen 1997). A review of recent studies (Parry et al. 2002) suggested that molluscs are at risk of damage from seismic airgun noise only when they are closer than 1–2 m. However, previous studies have also suggested that most effects on invertebrates without gas-filled cavities are likely to be too subtle to be measured in the field (Parry and Gason 2006). There are only a handful of studies that examined the potential effects of seismic airgun noise on bivalve molluscs. A summary of the results of these studies, which involved the blue mussel (Mytilus edulis), the Iceland scallop (Chlamys islandicus), a venerid clam (Paphia aurea), the arc clam (Anadara inaequivalvis), the commercial scallop (Pecten fumatus), and the sea scallop (Placopecten magellanicus) is presented in Table 6.10. Although studies have not necessarily looked at the effects of seismic on the pearl oyster directly, it is apparent that several species of bivalve, including two oyster species, are remarkably resilient to the shock waves created by the detonation of high explosives underwater (see Table 6.9). One study that examined the effects of underwater explosions on the pearl oyster (LeProvost et al. 1986), found that no mortality occurred in the exposed animals over a 13-week period and at a minimum exposure range of 1 m from the blast centre.
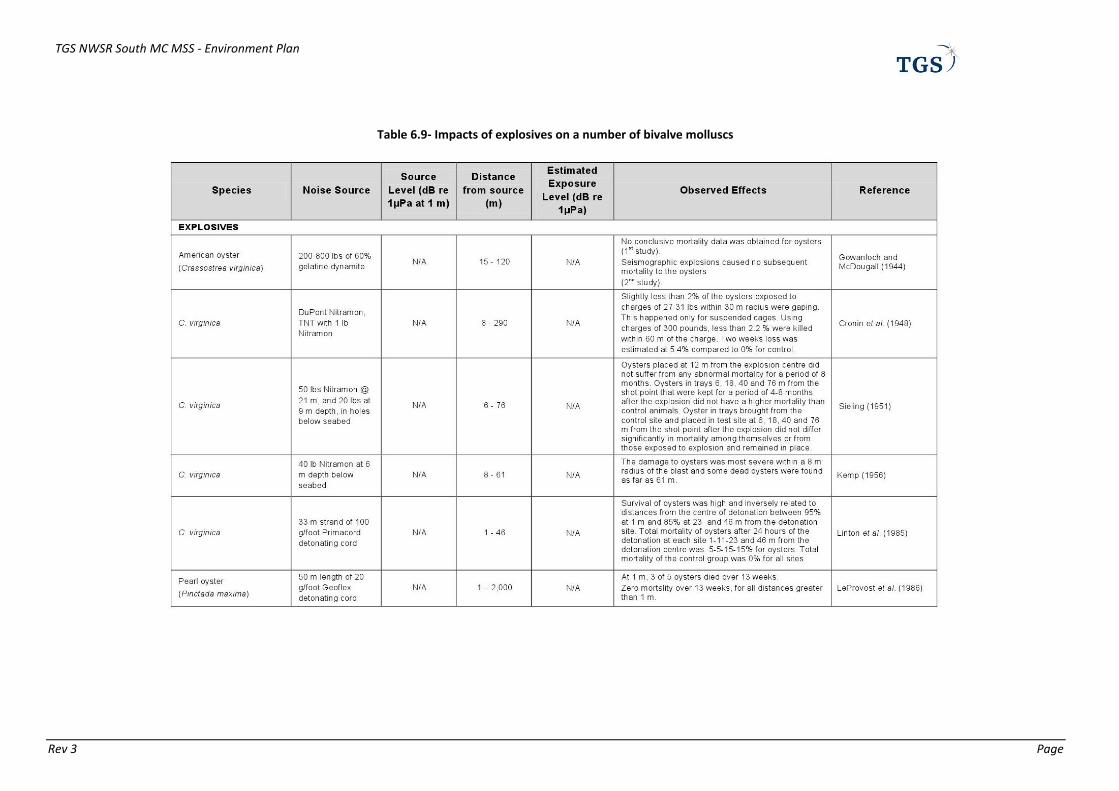
TGS NWSR South MC MSS - Environment Plan
Rev 3 Page
Table 6.9- Impacts of explosives on a number of bivalve molluscs

TGS NWSR South MC MSS - Environment Plan
Rev 3 Page
Table 6.10- Impacts of seismic airguns on a number of bivalve molluscs

TGS NWSR MC MSS - Environment Plan Summary
Rev 1 Page 64
As previously stated, seismic airguns cause less impacts on benthic invertebrates than explosives, and it is likely that bivalves, such as P. maxima, would have to be within a very close range of an acoustic source to experience pathological damage or mortality. It is difficult to determine what this distance may be, but the available evidence would suggest something in the order of less than 1–2 m. It is even harder to determine at what distances from an acoustic source sub-lethal effects (such as morphological, biochemical and physiological changes being indicators of some level of stress in an animal) could occur. Again, there are limited studies done specifically on the pearl oyster, and so conclusions must be drawn from studies done on similar bivalve species. La Bella et al. (1996) examined biochemical indicators of stress in bivalves exposed to seismic airgun noise and found that hydrocortisone, glucose and lactate levels between test and control animals were significantly different (P >0.05) in the venerid clam Paphia aurea, showing an evidence of stress caused by acoustic noise. This was at a minimum exposure range of 7.5 m. In the past, commercial scallop fishermen have expressed concerns about the potential impacts of seismic surveys on their catch levels. In a study off the Isle of Man, Brand and Wilson (1996) assessed the effect of seismic surveys in the field by comparing long-term catch-per-unit-effort (CPUE) of commercial scallops with CPUE following a seismic survey. They found no evidence that seismic surveys had affected CPUE of scallops and attributed a decline in scallop CPUE coincident with a 3D seismic survey to two years of poor recruitment prior to the seismic survey. Similarly, in the Bass Strait scallop fishermen expressed concern that seismic acquisition might kill scallops (Pecten fumatus), weaken their adductor muscles (indicating sub-lethal effects) or increase the mortality of larval scallops. In a study conducted by the Victorian Marine and Freshwater Research Institute (MAFRI), the effects of seismic airgun noise were measured by comparing the mortality and adductor muscle strength of scallops deployed in an area exposed to passes of a survey vessel towing an operating 24-airgun array, with those in a control area 20 km away from the test area (Parry et al. 2002). The effects of seismic testing on plankton, including larval scallops, were measured by comparing plankton communities immediately behind the seismic vessel with those sampled before and 2 km distant from the seismic testing. This study found that the mortality rate and adductor muscle strength of scallops suspended in the water column and exposed to the operating airgun array at a minimum distance of 11.7 m was not significantly different from the controls. Similarly, there was no major difference in the abundance of plankton (including bivalve larvae) behind the seismic survey vessel from their abundance before the passage of the vessel or 2 km distant from the vessel. High levels of variability in plankton communities meant that only large changes would have been detected, but the available literature suggests that effects on plankton are confined to ranges within 5 m of airguns (Parry et al. 2002). A more recent study conducted by the Tasmanian Aquaculture and Fisheries Institute (TAFI) assessed the immediate impact of seismic surveys on adult commercial scallops (P. fumatus) in the Bass Strait (Harrington et al. 2010). As a response from concerned scallop fishermen, TAFI was commissioned by AFMA to undertake a ‘before and after’ study of the effects of the seismic survey on the target species. The study that examined the short-term effects of seismic acquisition on health and abundance of adult scallops. The health parameters considered were gonad and meat condition to represent sub-lethal impacts and was based on a 3-month seismic acquisition programme using a 4,130 cui seismic source. The study found no change in the condition or abundance of live scallops in the impacted site compared to a control site, with gonad condition, meat size and meat texture remaining relatively unchanged. There was also no observable change in the size frequency distribution of scallops in the impacted and semi-impacted sites following the seismic survey. The conclusion was that no short-term (<2 months) impacts on the survival of adult commercial scallops were detected after the seismic survey. Based on the available information, significant impacts on bivalve molluscs, such as the pearl oyster, from airgun noise emissions will only occur within very short distances from the source. A conservative estimate for a minimum distance beyond which significant effects are unlikely, is approximately 10 m, but this will depend on the source dynamics and propagation characteristics of the area.

TGS NWSR MC MSS - Environment Plan Summary
Rev 1 Page 65
Australian Pearl Oysters The pelagic phase of a pearl oysters lifecycle lasts for 28–35 days, after which they become a benthic sedentary bottom-dweller. Losses in the water column during the planktonic stage are extremely high, and < 1% of the fertilised eggs survive the veliger stage (PPA 2008). During the pelagic phase, they are more likely to be impacted by seismic surveys. Peak spawning periods are from October to December and February to March. An assessment of the disturbance to planktonic organisms was undertaken in the previous section. The DoF ESD Report for the Pearl Oyster Fishery in 2006 stated that pearl oysters are known to occur in water depths of 0–50 m off the coast of WA. However, correspondence with the Pearl Producers Association (PPA) indicate that pearls, and so larval broodstock, occur as far out as the 100 m contour. This appears to be an overly conservative limit. Email correspondence with Dr Hart (DoF as recalled in personal email via PPA) indicated that a document called ‘Pearl Ecology’ (Southgate and Lucas 2008) is the source of both the PPA and DoF rationale for the 100 m distribution limit. The document (pg 59) stated “The individuals are typically found in shallow waters of littoral and sublittoral zones occasionally reaching the maximal recorded depths of 100-120m,” while on pg 313, it states ‘some early reports from the Sulu Islands in the Philippines suggested that maxima live as deep as 120 m’. However, this latter statement is based on observations from 1930 in the Philippines and so not contemporary nor local. The paper titled ‘Transport and recruitment of silver-lip pearl oyster larvae on Australia’s north west shelf’ (Condie et al. 2006) specifically looked at recruitment at Eighty Mile Beach and was written by respected authors from CSIRO Marine Division and WA Fisheries and Marine Research Laboratories. Results indicated that spawning in the Eighty Mile Beach region was concentrated between the 8–15 m depth, with potential smaller contributions from further northeast. These spawning events were likely to lead to successful recruitment along to the southwest, suggesting that the main pearl oyster producing populations are likely to be self-seeding. These also feed larvae into
neighbouring shallow waters and deeper waters to the west (20 m). High numbers of Mother of Pearl in deeper
waters (30 m) appear to be the result of larvae transported from inshore populations. However, spawning in these
deeper waters (30 m) contributed little to the recruitment in the inshore populations. Although there is some uncertainty in relation to the modelling used for the study and so there may be some variation in the results, the authors made the following very definitive statement: ‘the results of the model suggest that the long-standing hypothesis within the pearling industry, namely that deeper ‘unfished’ stocks are a broodstock source for commercially fished inshore stock is not likely to be true. The inshore stocks appear to be self-sustaining, and may even be providing larvae to deeper stocks.” 6.6.3.3 Disturbance to Fish Fishes like other vertebrates have two inner ears within similar structure. The basic mechanism for transduction of sound into electrical signals is the sensory hair cell. Significantly, high intensity sounds are able to fatigue, damage or kill these cells resulting in temporary or permanent haring loss. Fish however, unlike other tetrapods, are able to keep adding sensory hair cells throughout their lives. In addition, there is evidence (as cited in Popper and Hastings 2009) that cells damaged as a result of exposure to sound can be replaced. The majority of fish species detect sounds from below 50 Hz up to 500–1,500 Hz. A smaller number of species can detect sounds to over 3 kHz, while a very few species can detect sounds to well over 100 kHz. Fishes with the narrower bandwidth of hearing are often referred to as ‘hearing specialists’, whilst fishes with the broader hearing range are often called ‘hearing generalists’. The critical issue for understanding whether an anthropogenic sound affects hearing is whether it is within the hearing frequency range of a fish and loud enough to be detectable above threshold. For the sake of this EP, it is assumed that all fishes have hearing within the 0–200 Hz and can perceive the seismic source. Potential impacts on fish species related to the operation of survey acoustic sources include behavioural avoidance of seismic sound sources, TTS, chronic trauma or mortality. Indirect effects may include reduced catches resulting from changes in feeding behaviour and vertical/horizontal distribution (Skalski et al. 1992). Behavioural responses to sounds are variable but may include:
leaving the area of the noise source (i.e. avoidance; Skalski et al. 1992, Wardle et al. 2001)
startle/alarm responses (Pearson et al. 1992, Wardle et al. 2001)

TGS NWSR MC MSS - Environment Plan Summary
Rev 1 Page 66
spatial changes in schooling behaviour/swimming patterns (Slotte et al. 2004, Woodside 2007)
changes in depth/vertical distribution (Pearson et al. 1992, Slotte et al. 2004, Woodside 2007). These effects are expected to be short-lived, with duration of effect less than or equal to the duration of exposure, and are expected to vary between species and individuals. These responses are dependent on the properties of received sound (DFO 2004). The ecological significance of such effects is expected to be low, except where they influence reproductive activity. For some fish, strong ‘startle’ responses have been observed at sound levels of 200–205 dB re 1µPa, indicating that sounds at or above this level may cause fish to move away from the vessel. Except for directly under a sound source,
sound levels of this level are likely to occur 100–300 m from an acoustic source. Based on this, an approximate range of 200 m is given as the minimum distance at which fish may move away from an operating array and below which physical effects may occur (McCauley 1994). More recent studies (McCauley et al. 2003) found that active
avoidance may occur in some fish species at sound levels of 161–168 dB re 1µPa rms, which corresponds to a distance of many kilometres from the survey vessel. These latter levels are more consistent with results from a study by Woodside at Scott Reef (2007). The threshold of received SEL that could result in various behavioural effects in fish (Woodside 2007):
avoidance at >140 dB re 1µPa2.s (pelagic species and the more nomadic demersal species)
startle/alarm at >160 dB re 1µPa2.s (species with limited home ranges or site-attached and/or territorial strategies)
fright/flight at >180 dB re 1µPa2.s (species with limited home ranges or site-attached and/or territorial strategies).
Available evidence suggested that behavioural changes for some fish species were no more than a nuisance factor, and that within a few seconds, they continued their previous activity. The temporary, short-range displacement of pelagic or migratory fish populations may have insignificant repercussions at a population level (McCauley 1994). Woodside’s Maxima 3D studies investigated coral reef-associated fish communities at Scott Reef and found no detectable effects on spatial patterns of richness, abundance and diversity following the survey (Woodside 2007; Miller & Cripps 2013). Wardle et al (2001 as cited in Popper and Hastings 2009) found that fish and invertebrate on a rocky reef in Scotland only showed minor behavioural responses to an airgun with a measured peak level of 210 dB re uPa at 16 m and 195 re uPa at 109 m. They also noted no permanent changes in the reef fish or invertebrates behaviours throughout the study, that no animals left the reef, and no observed damage. Based on existing information, impacts on fish populations (as opposed to individuals) resulting from seismic survey noise are likely to be restricted to the following:
surveys that take place over protracted periods close to areas important for the purposes of feeding, spawning or breeding
surveys that take place over protracted periods close to areas that constitute narrow, restricted migratory paths
populations that cannot move away from operating arrays (e.g., site-attached reef species that experience short ranges and high sound intensities).
The potential effects of marine seismic surveys have been summarised as part of a detailed environmental assessment of geophysical exploration for mineral resources on the Gulf of Mexico outer continental shelf (MMS 2004). This assessment concluded that negligible to potentially adverse effects on fish may occur from seismic surveys. However, these effects were not considered biologically significant due to the following factors:
seismic survey noise may disturb fish and may produce temporary or permanent hearing impairment in some individuals, but it is unlikely to cause death or life-threatening injury;
seismic surveys are not expected to cause long term or permanent displacement of any listed species from critical/preferred habitat; and
seismic surveys are not expected to result in destruction or adverse modification of critical or essential fish habitat.

TGS NWSR MC MSS - Environment Plan Summary
Rev 1 Page 67
Fish populations can be impacted if behavioural responses result in deflection from migration paths or disturbance of spawning, thereby affecting recruitment of fish stocks. The major performance measures for the fish stocks in the Pilbara demersal fisheries relate to breeding stock levels of the long-lived and short-lived finfish indicator species. The target spawning biomass is 40% of the level when catch was first recorded, and the limit level is 30% of the initial spawning biomass. An age-based stock assessment model for red emperor and Rankin cod (longer lived indicator species) indicated that spawning biomass of both these species were >40%, indicating satisfactory breeding stock levels (Fletcher and Santoro 2013). Therefore, considering the distribution range of key species in this area, adequate spawning biomass levels and that migratory routes are not restricted, the impact on fish populations is considered to be low. Short-term effects on commercial and recreational catches may occur within and around the operational area. Sound effects on fish catches are somewhat equivocal because of the lack of determination between natural movements and changes in fish. However, one comprehensive study by Engås et al. (1996) observed cod and haddock moving back within an area 3–5 days after shooting. Similarly, Slotte et al. (2004) observed westward movement of large masses of blue whiting and herring towards and into the survey area 3–4 days after seismic shooting, indicating that migrations proceeded as normal soon after a seismic survey. Therefore, any disruptions would likely be short-term and during the course of the survey, with conditions returning to ‘normal’ levels soon after. The level and duration of exposure that causes TTS varies widely and can be affected by factors such as repetition rate of the sound, pressure level, frequency, duration, health of the organisms and many other factors. By definition, hearing recovers after TTS. The extent (how many dB of hearing loss) and duration of the TTS may continue from minutes to days after the end of exposure. Based on various studies, including investigations on the effects of seismic on fishes at Scott Reef (Woodside 2007), the following threshold received SELs could result in various sub-lethal and/or physiological effects:
onset of short-term reversible loss in hearing sensitivity (TTS) SELcum at >180 dB re 1µPa2.s
onset of long-term loss in hearing sensitivity (TTS/PTS) SELcum at >187 dB re 1µPa2.s
TTS onset but no injury to non-auditory tissues to 1 kg sized fish at >200 dB re 1µPa2.s. Following exposure to emissions from the Maxima 3D seismic survey with a 2,055 cui array at Scott Reef, a study of auditory brainstem response (ABR) in four species of tropical reef fishes showed that none of the four species, including the pinecone soldierfish (a hearing specialist) experienced any hearing sensitivity loss (i.e. TTS) following exposure to cumulative SEL up to 190 dB re 1 μPa2.s (Hastings et al. 2008). These numbers are similar to sound exposure guidelines proposed in Popper et al. (2014), which indicated that TTS may occur at SELcum levels >186 dB re 1µPa2.s, while other studies (Popper and Hastings 2009; Song et al. 2008)) indicate that TTS may occur at levels as high as SPLpeak 205-210 dB re 1µPa. Assessment of chronic effects of airgun sounds on fish species have usually involved exposure of captive or caged fish to nearby sound sources. Studies with caged fish (Kosheleva 1992, McCauley et al. 2003) showed that some caged fish were unable to swim away from the noise source and suffered physiological damage to eyes and hearing. Popper et al. (2014) proposed minimum levels that may result in recoverable injury or mortality and potential mortal injury in fish, turtles, eggs and larvae. For fish with swim bladders this is 207 dBpeak. These levels have been developed based on impulsive sounds (i.e. pile driving or explosives) as Popper et al. (2014) state there are no quantified data for seismic airguns. The material used to inform the guidelines is limited to those publications that provide full background information including measured sound exposure levels, received levels, controls, and appropriate experimental design. However, numerous studies have been undertaken and although not all may be quantifiable, many do identify SPLpeak and received levels that indicate that criteria cited by Popper et al. (2014) in relation to fish are conservative. Popper et al. (2014) themselves acknowledge that ratings for effects in their paper are highly subjective and are not hard and fast, being presented as a basis for discussion. The Canadian Science Advisory Secretariat (CSAS 2006) undertook a literature review of 23 experimental and opportunistic studies on the effects of seismic energy on fish. They recognised that the comparison of received sound levels was most useful and made every effort to calculate these levels if not provided. From these reviews of seismic specific data the following levels were identified for various effects (levels are reported in SPL dB re 1 μPa):
Mortality >220 dB

TGS NWSR MC MSS - Environment Plan Summary
Rev 1 Page 68
Physical damage (swim bladders, ablated ears): 208 to 246 dB (NB - of the seven studies reviewed in relation to physical damage, six indicated levels above 212 dB. The lowest level of 208 dB was actually discounted from the final results of the experiment as the dislocated tissue was likely unrelated to airgun pressure)
Hearing loss: 205-210 dB
No hearing loss: 205 -210 dB
No physical damage: 142 – 240 dB
Physiological effects: 194 - 210 dB
Behavioural: 148 – 218 dB There are no documented cases of fish mortality from exposure to seismic airgun noise under field-operating conditions (DFO 2004). This is supported by findings by Popper et al. 2007 ; Hastings et al. 2008 ; McCauley and Kent 2012 (as cited in Popper et al. 2015), who found no mortality in fish with swim bladders: data from exposure to impulsive sources suggest that airgun effects would be greater in fish with a swim bladder than in fish without a swim bladder. The CSAS review (CSAS 2006) noted that there was no clear demonstration of mortality of fish even within 2 m of the array, and that those mortalities that did occur were not significantly different from mortalities in control fish. Furthermore, they noted that the majority of sub-lethal physical effects (swim-bladder damage, ablated ear cells etc.) occurred upon exposure within 5 m of the source. Wardle et al. (2001 as cited in Popper and Hastings 2009; Landro and Amundsen 2011; CSAS 2006) found that fish and invertebrates on a rocky reef in Scotland showed only minor behavioural responses to an airgun with a measured SPLpeak of 210 dB re µPa while Popper and Hastings (2009) indicated that TTS as opposed to injury could occur within 205-210 dBpeak. This is supported by experiments by Song et al. (2008 and emulating studies done by Popper et al. (2005) on three species of freshwater fish who found that there was no damage to sensory organs in fish exposed to SPLpeak 205 to 209 dB, but that they did experience TTS. Ruggerone et al. (2008) reported no effects on body tissue in yearling Coho salmon exposed to SPLpeak of 208 dB while Turnpenny and Nedwell (1994 cited in Tenara Environmental 2011) identified internal injuries at SPLpeak 220 dB with mortality not until SPLpeak 230-240 dB. In relation to cumulative impacts, studies by Halverson et al. (2011a, b) and Casper et al. (2011) on the effects of
pile driving on physiological effects of various species indicate that SELcum below 207 dB will not result in the onset of injury, and that SELcum as high as 210 dB produces some physiological effects that were considered inconsequential. Casper et al. (2012) observed no mortality of fish exposed to SELcum 217 dB, and displayed evidence of recovery over time. Furthermore, fish exposed to SELcum 210 dB sustained minimal injuries that were not significantly different from the control fish. Casper et al. (2012) and Halverson et al. (2012) proposed an SELcum of 210 dB as the threshold level for the onset of recoverable injury as opposed to mortality. In the worst case scenario of a fish directly underneath a shotpoint in 50 m water depth, received SELss are predicted to be ~206 dB re 1 µPa2.s and it would require two shots to reach an SELcum of 207 dB; and ~4 shots to reach an SELcum of 210 dB. With a moving source, this will not occur. Again, it must be recognised that thresholds proposed by Popper et al. (2014), Halverson et al. (2012) and Casper et al. (2012) are for pile-driving, and it is still not clear which aspects of intense sound result in physiological onset. It is likely that the rise time may be of consequence, and thus, signals with slower rise times (i.e. a seismic source approaching an area) may have higher onset levels; whereas sounds with a faster onset (i.e. from explosives) may have lower onset criteria (BOEM 2014). This is supported by Larson (1985 cited in Tenara Environmental 2011) who stated that death of adults can occur during rapid rises in pressure over times less than 1 ms, with peak pressures greater than 229 dB. The 4,120 cui array proposed for use for surveys within the NWSR South MC MSS operational area is predicted to produce sound pressures of SPLpeak ~230 dB only at ~42.5 m directly below the array but will have longer rise times, and therefore is probably below levels that could cause mortality. As indicated by research based on seismic operations as opposed to pile driving, the levels proposed by Popper et al. (2014) for fish are not definitive and conservative: Received SPL that may result in TTS may be in the order of 205-210 dB, while levels required to result in permanent injury or potential mortality are likely to be >220 dB. Predictions of received levels in both horizontal and vertical planes at distance from source indicate received levels >220 dB SPLpeak may occur within ~100 m of the source horizontally or in water depths of <150 m vertically below the array. Fish species diversity and abundance has been shown to be positively correlated with habitat complexity, with more complex habitats such as coral reefs, typically hosting higher species richness than simpler habitats such as bare

TGS NWSR MC MSS - Environment Plan Summary
Rev 1 Page 69
sand or unconsolidated muddy sediments (Gratwicke and Speight 2005). Available information indicates that there is limited habitat in waters deeper than 50 m that supports site-attached fish species. In fact, coral diversity reduces with increasing depth, and corals are uncommon at depths greater than 40 m (Waples & Hollander 2008). Similarly, seagrasses and macroalgae generally need light and so are limited to shallower waters to ~ 20m depth (DEC 2007a; URS 2010; CVX 2010). The majority of the waters within the NWSR South operational area are deeper than 100 m. Waters between 100 and 50 m are only found in Management Areas A1 and B1 (with the majority in B1 >75 m). The majority of the benthos within the operational area is sand/mud containing limited infauna. The area has been the subject of intense trawling by the PTIMF and as a result benthic communities associated with waters deeper than 50 m have been affected, thereby potentially destroying any habitat at this depth that could support site-attached fish. Therefore, in open waters, fish and other marine fauna have the ability to move away from increase noise levels and are unlikely to be significantly affected by seismic sound exposure. It is recognised that within the operational area there may be elevated structures such as Glomar Shoal or Rankin Bank. Based on surveys undertaken by Woodside and presented as part of the North West Atlas (www.northwestatlas.org ) fish abundance is greatest in shallower waters, on shoal rims with increased gradient, associated with hard and soft corals, and generally in waters less than 40 m deep. Although site-attached species are likely to be associated with the shallower reef communities of the KEF (<40 m), little data exists that provides definitive information on site-attached fish species abundance relative to depth on either Glomar Shoal or Rankin Bank, with available information focussed on commercial pelagic and demersal species. Although the Montebello CMR description states that pinnacle features are present, there is no indication of the location or further description of these features. However, it is reasonable to assume that they would be similar to other raised topographical features such as Glomar Shoals and high profile reefs to the west of Barrow Island (outside the operational area). The Montebello CMR has no other shallow water habitats containing values or sensitivities that may be affected by seismic operations. The south-eastern part of the operational area overlaps the Ancient coastline at 90-120 m depth KEF, and north-eastern part of the operational area overlaps the Ancient coastline at 125 m depth KEF. Both of these KEF encompass terraces and steps that echo sea level increases across the area from the Halocene. The resulting escarpments, with their varying elevation and prominence, create topographic complexity, such as with the exposure of rocky substrate, and assist in increasing benthic biodiversity. Where the ancient submerged coastline provides areas of hard substrate, it may contribute to higher diversity and enhanced species richness relative to soft sediment habitat. These include sponges, corals, crinoids, molluscs, echinoderms and other benthic invertebrate representative of hard substrate fauna in the bioregion. Additionally, these areas may provide suitable habitat for assemblages of demersal fish, including site-attached species. Received SEL and SPL Vertically Below the Array Use of the 4,120 cui array is predicted to result in received levels at the seabed (vertically below the array) that exceed this 220 dBpeak SPL threshold for all water depths shallow than ~150 m. To ensure received levels directly below the source are less than 220 dB, TGS commit to the following reduced source sizes:
the 4,120 cui array will only be used for acquisition in water depths >150 m;
the 3,060 cui array will be used for all acquisition in water depths between 150 m and 120 m;
the 2,680 cui array will be used for all acquisition in water depths between 120 m and 100 m;
the 1,940 cui array will be used for all acquisition in water depths between 100 m and 70 m; and
the 1,420 cui array will be used for all acquisition in water depths between 70 m and 50 m. Implementation of these control measures will ensure that waters of the operational area that have been identified as potential habitat for site-attached fish assemblages in water depths from 50 m to 200 m (i.e. the ancient coastline KEF at 125 m; and the ancient coastline KEF at 90-120 m) will not be exposed to received levels at the seabed that exceed an SPLpeak of 220 dB. Received SEL and SPL Horizontally at Various Sensitivities Table 6.11 shows expected SEL and SPL (based on the 4,120 cui array) at various locations where sensitivities may be located adjacent to the NWSR South MC MSS operational area. Table 6.11– Estimated sound levels for various locations relative to the NWSR South MC MSS operational area

TGS NWSR MC MSS - Environment Plan Summary
Rev 1 Page 70
Location
Distance between sensitive environment boundary and seismic acquisition area
Distance(m) Estimated SEL (dB re1µPa2.s)
Estimated SPL (dB re1 µPa)
Shark Bay WHA 7 km 157 182
Ningaloo WHA 20 km <150 <180
Barrow/Montebello Marine Park 20 km <150 <180
Glomar Shoal (50 m isobath) 1 km 175 200
Most levels are below those that may induce temporary threshold shifts (TTS) in fishes found at these locations. Although Glomar Shoal is recognised for its free-swimming species, for site-attached species that may be present in waters shallower than the 50 m isobath, the predicted received SEL is 175 dB re 1 µPa2.s and SPL is 200 dB re 1 µPa which are below levels that may induce injury in fishes. Conditions that could result in fish being trapped (site-attached species) and unable to move more than a few metres from the noise source are unlikely within the operational area as surveys will not occur in waters that support significant areas of hard substrate and benthic habitat, such as coral reefs, macroalgae or seagrass, that in turn may support site-attached species, as no seismic acquisition shall occur in the following locations:
water depths shallower than 50 m across all of the NWSR South MC MSS operational area;
within 1 km from the 50 m contour around the Glomar Shoal, thus ensuring minimum depths will be ~53 m; and
within 400 m of the 50 m contour around a shoal, pinnacle or emergent topographical feature. In this region, with the exception of isolated topographical features such as Glomar Shoal and Rankin Bank and the ancient coastline KEF, there is limited habitat that may support site-attached fish species. Although unlikely, it is recognised that some site-attached individuals may be found in waters deeper than 50 m. However, as the numbers are anticipated to be very low, the area has been the subject of trawling and species of the region are not considered unique, any impairment impacts (recoverable injury and TTS) would likely be limited to individuals and have minimal impacts at a population level. As outlined previously, levels of SPL 207 dB purported by Popper et al. (2014) to result in injury are based on pile driving and likely very conservative. Other studies indicate that a received SPL of 210 dB may result in only TTS. 6.6.3.4 Sharks Limited research has been conducted on shark responses to marine seismic surveys. Myrberg (2001) stated that sharks differ from bony fish in that they have no accessory organs of hearing (such as a swim bladder) and therefore are unlikely to respond to acoustical pressure. The study also suggested that the lateral line system does not respond to normal acoustical stimuli, and is unable to detect sound-induced water displacements beyond a few body lengths, even with large sound intensities (Myrberg 2001). Other reports indicated that sharks are highly sensitive to sound between approximately 40 and 800 Hz, which overlaps with seismic sound frequencies. Klimley and Myrberg (1979) established that an individual shark will suddenly turn and withdraw from a sound source of high intensity (more than 20 dB re 1μPa above broadband ambient SPL) when approaching within 10 m of the sound source. The available evidence indicates that sharks will generally avoid seismic sources, and the likely impacts on sharks are expected to be limited to short-term behavioural responses, possibly including avoidance of the operating acoustic source. It is highly unlikely that the underwater noise emissions from the acoustic source would cause any pathological effects (lethal and sub-lethal injuries), with no immediate and delayed mortality and physiological effects on grey nurse or white sharks. Whale sharks It is expected that the potential effects to whale sharks associated with acoustic noise will be the same as for other pelagic fish species, resulting in minor and temporary behavioural change (such as avoidance). Although there are no known studies on the auditory bandwidth for whale sharks, their hearing sensitivity is likely similar to that of other sharks. As such, the large hearing structure of the whale shark will be most responsive to long-wave, low-frequency sound (Myberg 2001) in the range of 20 and 800 Hz.

TGS NWSR MC MSS - Environment Plan Summary
Rev 1 Page 71
While the Whale Shark Recovery Plan (2005-2010; DEH 2005a) identified numerous possible threats to whale sharks, those applicable to seismic surveys within the NWSR South MC MSS operational area include pollution and marine debris, or interference. Acoustic damage was not identified. A foraging BIA for the whale shark overlaps the NWSR South MC MSS operational area and it is possible that whale sharks may be encountered during individual surveys undertaken within Management Areas A1, particularly during the spring months of August through to October. However, any impacts from the seismic acoustic source will likely be temporary and infrequent. 6.6.3.5 Dugongs The northwest Report Card does not rate seismic exploration as an area of concern to dugongs. Dugongs are believed to have acute hearing within narrow sound thresholds (Lawler et al. 2002) ranging from 1–8 kHz (Wursig et al. 2002), which are higher than the frequencies of the survey (1–200 Hz). Thus, dugongs are anticipated to have a low sensitivity to seismic shots. Combined with the fact that dugongs generally remain in very shallow waters, it is very unlikely that seismic activity will have a negative impact on dugongs. The closest dugong BIAs (foraging) are located in the enclosed waters of Shark Bay and the Ningaloo coastline and Exmouth Bay, more than 25 km from the operational area. 6.6.3.6 Marine Turtles It has been speculated that migrating turtles may use various acoustic cues and that acoustic disturbances might interfere with their navigational ability (McCauley 1994). The auditory sensitivity of marine turtles is reported to be centred in the 400–1,000 Hz range, with a rapid drop-off in noise perception on either side of this range (Richardson et al. 1995). This auditory range matches their vocalisation abilities, which are also in the low frequency range (100– 700 Hz). Electrophysiological responses, specifically auditory evoked potentials (AEPs), are the most widely accepted technique for measuring hearing in situations in which normal behavioural testing is impractical. AEP studies on hearing have been conducted on various species and stages of life, and indicated that the best hearing range for marine turtles is in the range 100–700 Hz, which overlaps with the frequency range of maximum energy in the horizontally propagating component of a seismic array ‘shot’ (McCauley 1994). Bartol et al. (1999 as cited in BOEM) found that juvenile loggerhead turtles detect sounds in the low frequency range, between 250–1,000 Hz, with the most sensitive around the 250 Hz. Bartol and Ketten (2006) ) studied hatchling and juvenile loggerhead and juvenile green turtles, and found that juvenile turtles responded to 100–400 Hz. In that study, all turtles responded to sounds in the low frequency range from 100–900 Hz. However, hatchling loggerheads had the greatest range of hearing (100–900 Hz), while the larger juveniles responded to a much narrower range (100–400 Hz). Hearing sensitivity of green turtles also varied with size: smaller green turtles had a broader range of hearing (100–800 Hz) than that the larger subjects (100–500 Hz). Piniak et al. (2012) found that leatherback sea turtle hatchlings are able to detect sounds between 50 and 1,200 Hz, with maximum sensitivity between 100 and 400 Hz. Like other species of marine turtle, they appeared to have a relatively narrow, low-frequency range of hearing sensitivity. Lavender et al. (2014) detected no significant differences in behaviour-derived auditory thresholds or AEP-derived auditory thresholds between post-hatchling and juvenile loggerhead turtles. Marine turtles reside in different acoustic environments for each life history stage and may have different hearing capacity throughout ontogeny. However, research indicated that hearing frequency range (50–1,100 Hz) and highest sensitivity (100–400 Hz) were consistent, indicating that that post-hatchling and juvenile loggerhead sea turtles are low-frequency specialists, exhibiting little differences in threshold sensitivity and frequency bandwidth despite residence in acoustically distinct environments throughout ontogeny. Consequently, the effects of seismic sounds on marine turtle hatchlings are anticipated to be similar to those of juveniles and adults. Surveys in shallow waters (<15 m) near nesting beaches may expose both mating and internesting females as well as hatchlings to increased sound levels. Mating turtles and internesting females are not thought to favour deeper waters (>15 m), and while the air gun discharges may be audible in the deeper water, it is unlikely that the received sound levels would be of sufficient intensity to cause a startle response in the animals (Pendoley 1997). There will be no seismic data acquisition (i.e. shotpoints) in water depths shallower than 50 m across all of the NWSR South MC MSS operational area.

TGS NWSR MC MSS - Environment Plan Summary
Rev 1 Page 72
Similarly, Pendoley (1997) believed that it was unlikely that the noise associated with seismic discharges would override the biologically imprinted drive in turtle hatchlings to complete the initial 24-hour 'swim frenzy' that takes them out to sea as quickly as possible. At most, the sound may cause the hatchlings to deviate from their course to sea. Given the very high mortality rate in hatchlings, it is unlikely the effects of seismic discharge on them would be measurable (Pendoley 1997). Observations of turtle behaviour were made during a seismic survey in North West Shelf and showed no signs of panic or distress in the turtles in the vicinity of the vessel during discharge of the air guns. The observed behaviour consisted of either 'steady swimming' or 'diving' to avoid the vessel. Despite some variation in test results, the hearing ranges overlap the frequency range of maximum energy in the horizontally propagating component of a seismic array ‘shot’ (McCauley 1994). Studies indicated that marine turtles
may begin to show behavioural responses to an approaching seismic array at received sound levels of 166 dB re 1 µPa (rms), and avoidance at around 175 dB re 1 µPa (rms; McCauley et al. 2003). Using the overly conservative numbers presented in Table 2.5 this corresponded to behavioural changes at more than 10 km, and avoidance between 7-10 km. However, more realistic received levels as based on ground truthing and external modelling as presented in Table 2.4 indicates that behavioural changes would occur ~2 km, and avoidance < 1 km. Eckart et al. (2004) used GPS and Time Depth Recorders (TDR) to track movement and behaviour of two leatherback turtles exposed to seismic source noise. They found no change in behaviour or movement from previous turtles that were not exposed to seismic survey noise. Weir (2007) carried out observations from on-board a seismic survey vessel during a 10-month 3D survey offshore from West Africa. She concluded that: “..There was indication that turtles occurred closer to the source during guns-off than full-array, with double the sighting rate during guns-off in all distance bands within 1,000 m of the array.” The reduction in number of turtles observed within 1,000 m during operation of a full airgun array (Weir 2007) is reasonably consistent with the observations of McCauley et al. (2003), which indicated a behavioural response threshold of approximately 166 dB re 1 μPa (rms). Marine turtles may possibly be exposed to noise levels sufficient to cause physical damage if acoustic sources start suddenly with turtles nearby (less than 500 m, although likely to be less as this distance is based on conservative modelling). In circumstances where arrays are already operating (i.e. as a vessel moves along an acquisition line), individuals would be expected to implement avoidance measures before entering ranges at which physical damage might take place. Based on current information, it would appear that significant impacts on marine turtle populations resulting from seismic survey noise are likely to be restricted to:
short ranges and high sound intensities (perhaps less than 500 m range from source)
surveys that take place over protracted periods close to areas important for feeding, breeding and nesting
surveys that take place over protracted periods close to areas that constitute narrow, restricted migratory paths.
From airgun exposure tests on a caged green turtle and loggerhead turtle (see Table 5.13) that were extrapolated to response levels for a typical airgun array operating at full power in 100 m water depth, McCauley et al. (2003) concluded that turtles would, in general, probably show behavioural responses at 2 km and avoidance behaviour at 1 km from such operations. However, they also noted that such rules of thumb for acoustic sources with frequencies within the range of turtle hearing (<1 kHz) cannot be reliably applied to shallow coastal waters near reefs, islands and nesting beaches, where transmission losses are typically much greater than in deeper, open water areas.

TGS NWSR MC MSS - Environment Plan Summary
Rev 1 Page 73
Table 6.12 - Results of airgun exposure to marine turtles
Species Received level
(dB re 1 µPa rms) Effect Source
Loggerhead turtle 175-176 Avoidance response O’Hara and Wilcox (1990)
One green and one loggerhead turtle
166
Noticeable increase in swimming behaviour, presumed avoidance response
McCauley et al. (2003)
One green and one loggerhead turtle
175 Behaviour becomes increasingly erratic, presumed alarm response
McCauley et al. (2003)
There is no evidence implying that turtles actively avoid or are attracted to close-range (less than 500 m) encounters with operating airgun arrays. However, Moein et al. (1994) tested if hearing sensitivity of caged loggerhead turtles altered after exposure to several hundred pulses within 30–65 m of a single airgun (pulse numbers and received sound levels not stated). Hearing was tested before, within a day, then two weeks after exposure. Approximately 50% of the exposed individuals indicated altered hearing sensitivity when tested within a day of their exposure, but compared to the pre-exposure tests, none provided any sign of altered hearing two weeks later. 6.6.3.7 Avifauna Seismic noise is not anticipated to have a direct effect on avifauna, due to the method of the activity and that birds and vessels are transient. Only those bird species that plunge dive such as boobies or terns could be exposed to underwater noise, although little or no impact is expected. Stemp (1985 as cited in LGL 2012) conducted observations on the effects of seismic exploration on seabirds, and did not observe any negative effects. Lacroix et al. (2003 as cited in LGL 2012) investigated the effect of nearshore seismic surveys on moulting long-tailed ducks in the Beaufort Sea, Alaska, and also failed to detect any negative effects. Furthermore they noted that seismic activity did not appear to change the diving intensity of the ducks significantly. However, avifauna may be affected indirectly in the following ways:
Localised, temporary displacement
Modified prey abundance
Disturbance to breeding birds
Chance injury or mortality
6.6.3.8 Disturbance to Pinnipeds Australian sea lions are otariids (sea lions and fur seals). Based on a review by NOAA (2016), the functional hearing range of otariid pinnipeds has been estimated as 100 Hz to 40 kHz. Underwater audiograms for some sea lions and fur seals indicate that their greatest sensitivity lies in the range 2–32 kHz, and these pinnipeds are therefore likely to be less sensitive to low frequency (<1 kHz) sounds than to higher frequency (>1 kHz) sounds. The low frequency sounds (10–300 Hz) produced by seismic airgun arrays appear to fall below the range of otariid pinniped greatest hearing sensitivity (McCauley 1994). This interpretation must be treated with caution, as little data exist for low frequency thresholds and hearing sensitivities of Australian pinnipeds. However, it is recognised that seismic activity will only be a threat to pinnipeds if it takes place close to critical habitats (Shaughnessy 1999). The closest Australia sea lion BIA is over 50 km away near the Abrolhos Islands. The acoustic source proposed for the NWSR South MC MSS will produce pulses across a frequency range of 0–200 Hz, i.e. largely below the functional hearing range of otariids such as the Australian sea lion, which are better adapted to detecting higher frequency underwater sounds. Richardson et al. (1995) reported that an airgun caused an initial startle reaction among South African fur seals, but was ineffective in scaring them away from fishing gear (Anonymous 1975a; cited in Richardson et al. 1995). Gray seals exposed to noise from airguns reportedly did not react strongly (J. Parsons, in G.D. Greene et al. 1985; cited in Richardson et al. 1995). Seals in both water and air sometimes tolerate strong noise pulses from non-explosive and explosive scaring devices, especially if attracted to the area for feeding or reproduction (Richardson et al. 1995). Thus, Richardson et al. (1995) concluded that “we might expect seals to be rather tolerant of, or habituate to, repeated underwater sounds from distant seismic sources, at least when the animals are strongly attracted to an area.”

TGS NWSR MC MSS - Environment Plan Summary
Rev 1 Page 74
In a 1996–97 open-water seismic programme, monitoring studies conducted in the Alaskan Beaufort Sea indicated that seals (mainly ringed seals) usually tolerated strong sound pulses from nearby seismic vessels (Richardson 1999). Only a minority of the seals within a few hundred metres showed evidence of localised avoidance, and any effects on seal behaviour were not very consistent or conspicuous (Richardson 1999). During discharge of a full seismic array, it was measured that there was a partial avoidance zone of Arctic seals from the vessel at distances under 150 m, with the seals not moving farther than 250 m from the vessel (Harris et al. 2001). Based on the limited data on pinnipeds in water exposed to multiple pulses, Southall et al. (2007) found that
exposures in the 150–180 dB re 1 μPa range (rms values over the pulse duration) generally have limited potential to induce avoidance behaviour in pinnipeds. Received levels exceeding 190 dB re 1 μPa were determined by Southall et al. (2007) to be likely to elicit responses, at least in some ringed seals, which are phociids with hearing sensitivities from 75 Hz to 100 KHz (Harris et al. 2001; Blackwell et al. 2004b; Miller et al. 2005; cited in Southall et al. 2007). For
the 4,120 cui proposed for the NWSR South MC MSS, SPL >190 dB re 1 μPa could only occur within 3 km of the operating acoustic source. In the case of pinnipeds exposed to sequences of airgun pulses from an approaching seismic vessel, most animals may show little avoidance unless the received levels are high enough for mild TTS to occur. Southall et al. (2007) proposed injury (i.e. TTS onset) criteria for pinnipeds (in water) of 218 dB re 1 µPa (SPL) or an SEL of 186 dB re 1 µPa2. SPLs/SELs of these magnitudes would only be experienced at close range (e.g. < ~200 m) from an operating array of the size proposed for the NSWR South MC MSS. The noise created during seismic surveys is generally considered to be outside of the hearing range of Australian sea lions, and is therefore not considered to be a great source of disturbance. Furthermore, the species is mobile and can exhibit avoidance behaviour if disturbed. 6.6.3.9 Disturbance to Cetaceans (Baleen whales) Baleen whales produce a rich and complex range of underwater sounds, ranging from about 12 Hz to 8 kHz but with the most common frequencies below 1 kHz (McCauley 1994). Combined with studies of their hearing structures, scientific evidence suggests that their hearing is also best adapted for low frequency sound (McCauley 1994; Richardson et al. 1995). Baleen whales make individual sounds that may last for up to 16 seconds (Richardson et al. 1995), and humpback whales are known to “sing” for longer periods. These sounds are thought to be used in social interactions and communication between individuals and groups. Richardson et al. (1995) summarised published baleen whale sound characteristics. Table 6.13 lists the estimated source levels, frequency ranges and dominant frequencies of baleen whale calls for species that may be encountered during the proposed survey. It can be seen that some species produce quite high sound levels. Likewise, McCauley et al. (2003) reported humpback whale song components reaching 192 dB re 1µPa (p-p), as well as levels of 180–190 dB re 1µPa (p-p) for humpback pectoral fin slapping and breaching sounds. Physical damage to the auditory system of low and mid-frequency cetaceans may occur at noise levels of about 219–240 dB re 1µPa (SPLpeak) (Gausland 2000; NOAA 2016), which is equivalent to a distance of about <50 m from the energy source. Because of the efficient swimming abilities of marine mammals and their avoidance of either the vessel or the acoustic source, it is highly unlikely that any marine mammals will be exposed to levels likely to cause pathological damage (McCauley 1994).
Table 6.13 - Sounds produced by baleen whales that may be encountered during the NWSR South MC MSS
Species Frequency (Hz) Dominant frequency (Hz) Estimated source level
(dB re 1µPa.m)
Blue 12-31,000 16-25
6,000–8,000 130–188
Humpback 25–8,200 25–4,000 144–192
Minke 60-20,000 60-12,000 151-175
Bryde’s 70–950 700-900 152-174
Noise associated with seismic arrays used during seismic surveys can cause behavioural changes in whales (McCauley 1994). Behavioural responses to airgun noise include swimming away from the source, rapid swimming on the surface and breaching (McCauley et al. 2000). The level of noise at which a response is elicited varies between species and between individuals within a species (Richardson et al. 1995). Stone (2003) suggested that different groups of cetaceans adopted different strategies for responding to acoustic disturbance from seismic surveys, with

TGS NWSR MC MSS - Environment Plan Summary
Rev 1 Page 75
baleen and killer whales displaying localised avoidance, pilot whales showing few effects and sperm whales showing no observed effects. Richardson et al. (1995) notes that: “Baleen whales seem quite tolerant of low and moderate level noise pulses from distant seismic surveys. They usually continue their normal activities when exposed to pulses with received levels as high as 150 dB re 1µPa (rms), and sometimes even higher”. A comprehensive study carried out by McCauley et al. (2000) monitored the effects of 3D seismic survey noise on humpback whales in the Exmouth Gulf, WA. Data were collected with aerial surveys, vessels and acoustic recordings, the results of which had the following conclusions:
No significant or large-range displacement observed, but rather localised speed and course changes at 3–4 km away from operating vessels, at which received levels were approximately 157–164 dB re 1µPa (rms), thus indicating that potential impacts associated with the seismic survey were confined to a short period and small range displacement.
At 157–164 dB re 1μPa (rms), humpback whales generally avoided the operating seismic vessel, however resting cow/calf pods showed avoidance at lower levels (a mean sound level 140 dB re 1μPa (rms) and a mean standoff range at 143 dB re 1μPa (rms)).
In close proximity (within 100 m), received levels were estimated at 192 dB re 1µPa (p-p), and humpback whales were observed at the surface, likely utilising the ‘sound shadow’ near the surface and avoiding the majority of sound energy projected downward.
Baleen whales are generally observed avoiding operating seismic vessels over distances that are highly variable between and within species. This avoidance behaviour represents only a minor effect on either the individual or the species, unless avoidance results in displacement of whales from nursery, resting or feeding areas, at an important period for the species. The NWSR South MC MSS operational area and adjacent waters do not overlap with known critical habitats (feeding, breeding, calving, resting aggregation, narrow/restricted migratory pathway) for any cetacean species, including the humpback or pygmy blue whale. 6.6.3.10 Disturbance to Cetaceans (Toothed Whales) Toothed whales produce a wide range of whistles, pulsed sounds and echolocation clicks. The frequency range of toothed whale sounds excluding echo location clicks are mostly <20 kHz with most of the energy typically around 10 kHz, although some calls may be as low as 100–900 Hz. Source levels range from 100–180 dB re 1 µPa (Richardson et al. 1995). Other than echolocation clicks, the sounds produced are very complex in many species and used for communication between members of a pod in socialising and coordinating feeding activities. For toothed whales that are exposed to single short pulses, the TTS threshold appears to be a function of the energy content of the pulse (Finneran et al. 2002). In their review, Gordon et al. (2004) considered the potential for TTS
and concluded that the threshold was 195 dB re 1 µPa SPLpeak. This is consistent with the review and calculations by Richardson and Moulton (2006), who considered the TTS threshold to be 192–202 dB re 1 μPa. Southall et al. (2007) identified a threshold level of 195 dBpeak which, based on conservative modelling results, is ~ 2km from the seismic source to be used in the NWSR South MSS. These results are reasonably consistent with the value presented by DEWHA (2008b) of SEL 186 dB re 1 μPa2.s. which are restricted to a radius of ~ 400 m around the seismic acoustic source. Therefore, the potential for TTS is very low, as it would require a high frequency cetacean to be <2 km from the acoustic source and remain within this range as the vessel traversed a distance of 4–5 knots. There is little systematic data on the behavioural response of toothed whales to seismic surveys. Richardson et al. (1995) reported that sperm whales reacted by moving away from surveys and ceased calling even at great distances from a survey. However, in a 2003 study (Jochens and Biggs 2003), two controlled exposure experiments were carried out (including one with three simultaneously tagged whales) to monitor the response of sperm whales to seismic source. The whales were exposed to a maximum received level of 148 dB re 1µPa. There was no indication that the whales showed horizontal avoidance of the seismic vessel, nor was there any detected change in feeding rates of the tagged sperm whales. Smaller toothed cetaceans have poor hearing in the low frequency range of acoustic source noise (10–300 Hz), and seismic operators sometimes report dolphins and other small toothed whales near operating acoustic sources. However, there is a component of seismic pulses in the higher spectrum, and in general most toothed whales do show some limited avoidance of operating seismic vessels. Goold (1996) studied the effects of 3D seismic surveys on common dolphins in the Irish Sea. The results indicated that there was a local displacement of dolphins around

TGS NWSR MC MSS - Environment Plan Summary
Rev 1 Page 76
the seismic operation. This observation is consistent with data compiled by Stone (2003) from marine mammal observers aboard seismic vessels in the North Sea that shows small toothed whale species tend to move away from operating airguns (see Figure 6.2).
Source: Stone (2003)
Figure 6.2 - Proportion of marine mammal sightings occurring within specified distances of the airguns during seismic surveys.
The hearing capability of larger toothed whales (such as the killer whale) is unknown, but it is possible that they can hear better in the lower frequencies than the smaller toothed cetaceans. If this is the case, in lieu of any other information, their reactions to seismic survey vessels may be akin to those of the baleen whales. It is considered that the potential adverse effect on toothed whales would only occur if the whale is within close range (i.e., less than a few hundred metres). 6.6.3.11 Overlap with Critical Marine Fauna Habitat and Peak Periods of Activity The NWSR South MC MSS operational area overlaps the following BIA as identified in the DoE National Conservation Values Atlas (DoE 2015b):
flatback turtle internesting buffer
green and hawksbill foraging and internesting buffer
humpback whale migration route
pygmy blue whale distribution and possible foraging
whale shark foraging/migration. As the survey activities covered under the scope of this EP may take up to five years to complete, it is possible that some acquisition may coincide with either migration paths or internesting for the flatback turtles. As far as practicable, TGS will plan survey timing to avoid BIAs during sensitive peak migration and internesting periods. Cetaceans and whale sharks will be transient and able to move around and away from the survey vessel and acoustic source, as the operational area does not overlap any critical habitat (e.g. breeding, calving, etc.) or narrow migration corridors. Marine Turtles Flatback Turtles Studies were undertaken by Whitlock et al. (2014) on the internesting behaviours of the flatback turtles in the Pilbara region from four main rookeries: Thevenard Island, Barrow Island and two locations north of Port Hedland. Results indicated that internesting turtles on Thevenard Island had a mean maximum displacement distance away from the nesting beach of 25.7 ± 11.9 km (range = 6.2−42.5). Only one turtle spent an internesting period looping to the north of the island reaching a maximum displacement of 24.4 km from its prior nesting site. All others were
spent moving south and along the mainland coast with a maximum movement of 42 km or circling the island and remaining entirely within a 10 km radius of the nesting beach. Similar patterns were seen with internesting turtles in Barrow Island. These results are shown in Figure 6.3. Turtles on the mainland showed similar distances travelled, with the majority of individuals staying within 10 km of the nesting site. Turtles that did travel greater distances remained along the shoreline, sometimes travelling to other nesting beaches. This is indicated in Figure 6.4.

TGS NWSR MC MSS - Environment Plan Summary
Rev 1 Page 77
Figure 6.3 – Flatback turtle internesting tracks off Barrow Island
Figure 6.4 – Flatback turtle internesting tracks off the mainland Overall, the study indicated that at each rookery, some flatback turtles remained <10 km from the nesting beach; some turtles from offshore island rookeries moved up to 62.1 km towards the Australian mainland coast, and other turtles from a mainland rookery moved adjacent to the coast, up to 56.6 km away from the nesting beach. Whitlock et al. (2014) identified consistencies across all four rookeries, including a core nearshore (<10 km) internesting distribution pattern and note that boundary specific protection measures around this core area would effectively encompass a large proportion of the internesting population. This information is further supported by studies undertaken by Pendoley, which indicated that flatback turtles nesting at Barrow Island are routinely using the nearshore habitats of the mainland coast 50–60 km to the south‐east of Barrow Island during their internesting period. Flatback turtles nesting at Mundabullangana and Cemetery Beach, Port Hedland, remained within 20 km of their mainland nesting rookeries. The same study also identified that hatchlings of most marine turtle species have an oceanic development phase, whereas hatchling, post hatchling and juvenile flatback turtles remain in near shore foraging habitats.

TGS NWSR MC MSS - Environment Plan Summary
Rev 1 Page 78
It is apparent that most individuals stay within 10 km of the nesting beaches, while the greater distances are travelled between islands and the mainland or along the coast, with which the NWSR South MC MSS operational area does not overlap. Other Turtle Species The overlap of the foraging and internesting buffers, which are conservative for the hawksbill and green turtles, are very minor and it is likely that observations of marine turtles in the outer limits will be rare and infrequent, for the
reasons as outlined above. Furthermore, the largest internesting BIA overlap is 8 km, for the hawksbill turtle, which breeds year-round and cannot be temporally avoided. Cetaceans Humpback Whales Various control measures shall be in place in relation to humpback whales as follows:
Exclusion zones covering: o BIA in Management Area A1 between 15 July–30 September o BIA in Management Area B1 between 15 June–15 August and 1 September–15 October o Management Area B2, within an 85 km radius from the northern most point of North West Cape
(21o47.13S; 114o9.89E) between 15 June – 15 October
Part B Management measures for the dates 1 June–31 October covering: o Management Areas A1 and B1 o Management Area B2 in waters 100 km beyond the identified BIA
Adaptive management measures at all times and locations Exclusion zones are based on the identified BIA as presented in the updated Conservation Advice (DoE 2015c) and supported by Jenner et al. (2001) and Double et al. (2010; 2012). With the exception of the waters adjacent to the Ningaloo coast, the width of the migration BIA through Management Areas B1 and A1 is generally wide being between ~ 60 km and 150 km wide and so is not considered a restricted corridor. Furthermore, the operational area is not immediately adjacent to a resting area with at least a 20 km buffer. The humpback whale recovery plan (DEC 2005d) defined the habitat critical to the survival of humpback whales: ‘For the purpose of this plan, habitat important (and potentially critical) to the survival of humpback whales is defined as those areas known to seasonally support significant aggregations of whales, and those ecosystem processes on which humpback whales rely – in particular known calving, resting and feeding areas, and certain sections of the migratory pathways……Along parts of the migratory route there are narrow corridors and bottlenecks resulting from physical and other barriers where the majority of the population passes close to shore (i.e. within 30km of the coastline). These habitat areas are important during the time of migration and include: Western Australia – Geraldton/Abrolhos Islands, and Point Cloates to North West Cape.” Although most studies indicate that migrating whales stay close to the shoreline, it is acknowledged that individuals may extend into deeper waters, ~ 70-80 km, beyond the identified BIA and into Management Area B2 adjacent to the North West Cape as they converge to move around the point. The figures presented in Jenner and Jenner (2010) and Salgado-Kent et al. (2012) clearly show that the majority of individuals were close to shore, typically in waters less than 300 m, with numbers decreasing further away. No others studies currently indicate that individuals occur in moderate to high numbers outside the identified BIA or areas identified by TGS to be within the exclusion zones. The likelihood of encountering humpback whales more than 60 -100 km from the identified migration corridor is low. At 100 km from the identified BIA, received noise levels are less than 164 dB re 1 µPa2 s and below levels that may cause injury, TTS or even behavioural changes. Dates for the application of Part B measures, being 1 June to 31 October is overly conservative and takes into account possible variations in timings of migrations and includes north and south bound animals and the southbound cows/calf peak. Pygmy Blue Whales The pygmy blue whale migration corridor overlaps Management Areas B1 and B2 and is over 110 km wide. Subsequently, this is not considered a narrow or restricted corridor, and temporal exclusions will not be applied. Double et al. (2014) acknowledged that in WA, pygmy blue whales migrate through an “area that contains the majority of Australia’s gas resources and in which production and development is ongoing”. Whilst anthropogenic noise may alter blue whale behaviour, it is unlikely to pose a conservation risk unless it causes population level

TGS NWSR MC MSS - Environment Plan Summary
Rev 1 Page 79
consequences such as changes in growth, reproduction and survival of individuals. Elevated ambient noise has been responsible for abandonment or avoidance of critical habitat by a number of cetacean species. Critical habitat includes habitat used to meet essential life cycle requirements such as foraging and breeding.” Based on limited knowledge of distribution and abundance, critical habitats are not defined for pygmy blue whales in Australia (DoE 2015a). Foraging BIAs for pygmy blue whale are considered important for the species’ survival, as they contain highly productive resources for the species (DoE 2015a). Recognised foraging areas for the pygmy blue whale in WA are located in the Perth Canyon and in Geographe Bay, with possible foraging areas off Exmouth and Scott Reef. However, the pygmy blue whale foraging area off Exmouth (i.e. in the operational area) is based on limited direct and indirect evidence. In contrast, scientific data confirmed low productivity levels in this area, and researchers suggested alternatively that the observed high density of pygmy blue whales may result from spatial constraints, as the migratory pathway converges around the peninsula corner (Double et al. 2014). The DoE NES guidelines (DoE 2014h) list the significant impact criteria for Endangered and Migratory species as: An action is likely to have a significant impact on a critically endangered or endangered species if there is a real chance or possibility that it will:
lead to a long-term decrease in the size of a population
reduce the area of occupancy of the species
fragment an existing population into two or more populations
adversely affect habitat critical to the survival of a species
disrupt the breeding cycle of a population
modify, destroy, remove, isolate or decrease the availability or quality of habitat to the extent that the species is likely to decline
result in invasive species that are harmful to a critically endangered or endangered species becoming established in the endangered or critically endangered species’ habitat
introduce disease that may cause the species to decline, or
interfere with the recovery of the species. An action is likely to have a significant impact on a migratory species if there is a real chance or possibility that it will:
substantially modify (including by fragmenting, altering fire regimes, altering nutrient cycles or altering hydrological cycles), destroy or isolate an area of important habitat for a migratory species
result in an invasive species that is harmful to the migratory species becoming established in an area of important habitat for the migratory species, or
seriously disrupt the lifecycle (breeding, feeding, migration or resting behaviour) of an ecologically significant proportion of the population of a migratory species.
There is no “real chance or possibility” that the NWSR South MC MSS will result in any significant impact outcomes for humpback or pygmy blue whales, based on the significant impact criteria for Endangered or Migratory species identified above, particularly with the application of proposed mitigation measures 6.6.3.12 Simultaneous Operations and Cumulative Impacts A key initial step in the strategic business planning of MC MSS companies like TGS involves obtaining environmental approval with the view of marketing readiness to the petroleum block titleholder. Hence, the MC MSS company business model relies on securing a petroleum block titleholder client to purchase the data prior to its acquisition. It would be unnecessary for a petroleum block titleholder to obtain data from more than one seismic survey of the title, which in turn would render mobilisation of multiple surveys highly unlikely and commercially non-viable, irrespective of whether environmental approval had been obtained for more than one survey over the same area. Subsequently, although multiple seismic surveys are proposed, not all will go ahead as block titleholders will allocate work to one seismic company only. As such, there are three possible scenarios when surveys may overlap:
a 3D survey being undertaken after an initial 2D survey
shooting over open acreage that another survey has covered
overlapping sail lines within the same survey as a result of undertaking ‘infill’ activities or 2D lines crossing each other.

TGS NWSR MC MSS - Environment Plan Summary
Rev 1 Page 80
If a 3D MSS was to be undertaken after a 2D MSS, it would generally be months between the surveys, at which point cumulative impacts would be negligible. Shooting over open acreage would only ever occur if it was adjacent to an existing titleholder who had commissioned TGS to undertake a survey. The chances of two seismic companies targeting the same open acreage is unlikely. Overlapping sail lines during a survey will only occur as a result of:
the requirement to ‘infill’ a line because acquisition was stopped due to either technical problems or shutdowns due to megafauna
during a 2D MSS in which single lines cross each other. The infill of lines is a standard operational procedure and will only incur a minor overlap of the line as the vessel re-aligns itself. Without infill activity, seismic surveys would be incomplete, the data often rendered worthless and client contract requirements not fulfilled. If a vessel ceased operations in an area for a time, it would generally be hours before the infill activities could re-commence, as (at the very least) the vessel needs time to turn around and commence required soft start procedures. TGS cannot commit to a minimum timeframe associated with returning to undertake infill activities, but it is anticipated that it will be at least three hours before the return would occur. Usually, a sail line will be completed, and the infills are left to the end of a survey, once seismic data has been partially processed and all infill locations located. During 2D MSS, a single seismic cable is towed behind the survey vessel together with a single sound source. Data acquisition lines are typically kilometres apart on a relatively sparsely spaced grid of lines and usually over a large area. Lines within this grid may cross each other, thus resulting in the same area being surveyed twice and subject to repeat exposure. However, in this scenario, it will be hours if not days and possibly weeks, before the sound source crosses back over an already-completed sail line. Furthermore, as shotpoints are more than 18.75 m apart, it is extremely unlikely that they will occur exactly over each other. Again, TGS cannot commit to a minimum timeframe before lines may cross, but when taking into consideration that a line must be completed, the vessel turn and then recommence, even if two lines cross each other immediately, it would be at least three hours in between. The majority of the waters within the NWSR South operational area are deep. Waters between 50 and 100 m are limited to Management Areas A1 and B1, and with the exception of limited topographical features such as Glomar Shoals, are dominated by sandy substrate supporting benthic communities of bryozoans, molluscs and echinoids. Coral diversity reduces with increasing depth, and corals are uncommon at depths greater than 40 m (Waples & Hollander 2008). The waters have been the subject of intense trawling. Consequently, the operational area is not recognised for its coral communities or site-attached species. Waters less than 100 m may receive SPLpeak levels greater than 207 dB, which Popper et al. (2014) state may result in injury or potential mortality. However there is limited habitat at these depths that may support site-attached species. Furthermore, results from seismic-specific studies, as opposed to those related to pile-driving, indicates that threshold levels that may result in biological effects are actually much higher than those proposed by Popper et al. (2014) and that impacts may be limited to TTS only. The NMFS recognised that there is a “resetting” of SELcum to 0 after 12 hours of non-exposure (Stadler and Woodbury, 2009 as cited in Halverson et al 2012). This “resetting” was specific for recovery from temporary effects to the hearing of exposed fish, not barotrauma. Popper et al. (2014) indicate that hearing levels of fish with TTS recovered within 18–24 hours. Studies done by Casper et al. (2012; 2013) looked at recovery in salmon from barotrauma (injury as opposed to TTS) as a result of being exposed to SELcum 217 dB, and identified that injuries decreased significantly between 2 and 5 days after exposure, but with no significant difference in the number of injuries between 5 and 10 days. Furthermore Casper et al. (2012), state the data support the hypothesis that one or two mild injuries resulting from pile driving exposure are unlikely to affect the survival of the exposed animals. With control measures in place, being no acquisition in waters shallower than 50 m; no seismic activity within 400 m of a 50 m contour around raised topographic features; and no acquisition with 1 km of the 50 m contour around Glomar shoal, the maximum received SELss at locations (based on horizontal modelling) that may support site attached species (being waters shallower than 40 m) is SEL 185 dB re 1uPa2.s which may result in TTS (being SELcum 186 dB) as reported by Popper et al. (2014). However as discussed earlier these threshold levels are likely high and

TGS NWSR MC MSS - Environment Plan Summary
Rev 1 Page 81
overly conservative, and so with a moving vessel it is considered that the potential for TTS to site attached species is minimal. In 50 m water the SELss will be ~ 190 dB (based on vertical results) and require more than 20 shots over the same receiving location (i.e. site-attached fish) to result in recoverable injury as purported by Popper et al. (2014). Longer exposures require longer durations to recover (Finneran et al. 2010). As the vessel and sound source is moving, exposures will be minimal to fixed points. In seismic surveys, there would typically be days between infill activities or overlapping of 2D sail lines, although an absolute worst case scenario may be a few hours. As the survey vessel is constantly moving and the seismic array is an impulsive rather than continuous noise, it is reasonable to assume that recovery from TTS will occur in a shorter timeframe and so a period of 24 hours would be an acceptable ‘resetting’ period. The operational area overlaps waters between 50 m and 150 m within the proposed Montebello CMR, which is a Multiple Use Zone (IUCN VI). The values and sensitivities associated with the CMR include foraging areas for birds, whale sharks and turtles, and migratory route for humpback whales. Although it contains examples of habitats and communities of the Northwest Shelf Province including pinnacles, the CMR is not recognised for its coral communities or site-attached species, which are likely associated with shallower State waters more than 20 km away. Although megafauna (e.g. cetaceans, turtles and whale sharks) could be present in the area, with proposed mitigation in place (e.g. exclusion zones, shut-down zones, MFO etc.), it is not anticipated that marine megafauna will be in close proximity and therefore will not be subject to adverse impacts from seismic sound exposure. As outlined previously, invertebrates are unlikely to experience negative effects unless within very close proximity to the source (<10 m). Pelagic and demersal fish can move away from the source. There will be no negative effects at a population level, and likely no more than TTS or behavioural changes to a few individuals, based on the following:
minimal time that the acoustic source will be over any particular site;
all animal tissues, if damaged, start to recover as soon as the stimulus is removed;
it will likely be hours before the sound source overlaps the exact same area again;
any areas that may experience repeat exposure would be very small and localised;
the operational area is not known to have site-attached species associated with it and so fish can swim away; and
marine megafauna (such as cetaceans, whale sharks or turtles) are free-swimming, and with the minimal period that a source will overlap the same area, are unlikely to be adversely impacted.
Two-dimensional surveys and infill are very common and necessary techniques, without which MSS could not occur and titleholders would not be able to gain meaningful data. Any areas that may experience repeat exposure will be very small and localised. Due to the depths and very short timeframe that an organism may experience repeat exposure, any effects that are likely to occur will be temporary and possibly no more than TTS or a short-term behavioural responses. Consequently, the costs associated with not performing these standard practices, or by placing an extended time limit on returning to the exact same area (not associated with site-attached species and not waters around Glomar Shoal) are grossly disproportionate to the environmental benefit. TGS will commit to not undertaking a survey within one month of another survey over the same area. Based on anticipated received SEL, a one-month hiatus is considered more than enough to allow recovery, particularly for site-attached species or sedentary sensitivities and values. Nevertheless, it is possible that other MSS may occur simultaneously in the vicinity of a NWSR South MC MSS. This could result in cumulative impacts on matters of National Environmental Significance (NES), such as whales, turtles and whale sharks. This sub-section assessed the potential cumulative impacts that the survey may have if it coincides with other seismic surveys in the same area. The cumulative impacts from seismic impulses within the marine environment are difficult to quantify because the acquisition of seismic data requires the temporary creation of sound pressure waves (airgun-derived) that dissipate and soon disappear when the sound energy source is stopped. Unlike other activities that can result in the creation of contaminants and noxious materials (e.g. drill cuttings), there is no bioaccumulation of sound pressure within

TGS NWSR MC MSS - Environment Plan Summary
Rev 1 Page 82
the food chain. Nonetheless, there may be a temporary additive effect if sounds from one activity coincide and overlap spatially and temporally with another concurrent activity. However, this “added sound” will disappear once one of the sound-generating sources stops or passes out of the area of concern. A review of seismic-related literature revealed no documented instances of the negative effects of cumulative seismic energy source on any marine organism. In the event that the timing of any proposed seismic survey overlaps the TGS NWSR South MC MSS, the survey vessels will ensure a minimum distance of 50 km is maintained during full seismic acquisition to minimise potential cumulative impacts on marine fauna and to minimise noise interference that may affect seismic data quality. The Programmatic Environmental Assessment of Arctic Ocean OCS Seismic Surveys (2006) established pro-active measures for simultaneous seismic surveys with a minimum spacing of 24 km (15 nmi) between seismic source vessels (BOEM 2014). More recently (on 27 February 2014), the Bureau of Ocean Energy Management (BOEM) published a final environmental review of geological and geophysical survey activities off the mid and South Atlantic coast. The environmental impact statement from this review included a recommendation of a 40 km geographic separation distance between the sources of simultaneous seismic surveys. This will minimise the impacts to marine life by providing a ‘corridor’ between vessels that is below 160 dB (recognised behavioural limit) and approaching ambient levels such that marine fauna may pass through rather than traveling larger distances to go around the survey vessels. The report indicated a typical radius for a 160-dB threshold for a large airgun array was no more than 10 km (BOEM 2014). Consequently, the implementation of a 50-km geographic spacing between survey vessels working simultaneously is a very conservative approach, as this would leave a potential 30 km ‘corridor’ between vessels, rather than the 10 km ‘corridor’ as stated in the BOEM environmental review (BOEM 2014). Noise decay curves for seismic airguns in Australian waters (McCauley 2009) indicated that the 160 dB threshold is
2 km. This is supported by research by McCauley (1993, 2003), and noise modelling undertaken by TGS for two vessels with a sound source of 4,100 cui (243 dBpeak) within the GAB (Koessler and Duncan 2014). The combined SELs from two sources 30 km (closer than proposed 50 km) apart was 3 dB higher in the area between the sources than those at the same range from a single source. Regardless, maximum increase in received SELs likely to occur midway between two vessels operating at the same time and only 30 km apart (much closer than proposed 50 km) did not exceed 160 dB re 1 μPa2s. Thus, levels reported were below thresholds known to cause behavioural responses for cetaceans (McCauley et al. 2003, Richardson et al. 1995, Nedwell et al. 2004), whale sharks (Myberg as cited on the ‘shark info’ website) and marine turtles (McCauley et al. 2003). Pelagic fish may exhibit avoidance behaviour. In summary, a 50 km separation distance is a conservative approach and acceptable between any survey vessels undertaking full acquisition activities simultaneously (including TGS and non-TGS vessels) within the NWSR South MC MSS operational area. It is expected that SELs associated with the simultaneous acquisition activities will have attenuated well below known, behavioural avoidance response levels for marine fauna at the closest distance to concurrent surveys. Consequently, concurrent seismic exploration activities are unlikely to result in a significant impacts to matters of NES. Prior to commencement of the NWSR South MC MSS, TGS will check the NOPSEMA website to determine if any further seismic surveys not mentioned above may potentially occur in the area. TGS will consult with other geophysical companies operating in Australian waters, and/or titleholders of petroleum titles adjacent to the polygon, to ascertain if there are any other seismic surveys proposed for areas adjacent to the survey area and over the same time period. With the development and implementation of both Part A Standard Management Procedures and Part B Additional Management Procedures (see below), cumulative impacts would be reduced to negligible levels. Furthermore, once a survey is complete, any resonant noise within the operational area or surrounding marine environment would diminish. Following this, the potential effects from increased sound exposure to marine mammals and fauna would cease, and animals would most likely return to preferred habitat. 6.6.3.13 Impacts to Commonwealth Marine Reserves Underwater sound emissions have the potential to impact the conservation values of various CMR and/or be inconsistent with IUCN management principles. The potential environmental risks and impacts to each CMR associated with undertaking seismic surveys has been evaluated and presented in Appendix L. By implementing this EP and the controls and mitigation measures within it, impacts to the environment, including the values, sensitivities
TGS NWSR MC MSS - Environment Plan Summary
Rev 1 Page 83
and management principles of the CMR’s, are considered ALARP and acceptable and will ensure that activities are not inconsistent with relevant IUCN principles. If Management Plans come into force during the life of this EP, TGS will comply with the requirements of the plan including not undertaking seismic surveys within an area that is classed IUCN 1a, II or IV if applicable. 6.7 COLLISION BETWEEN VESSELS / TOWED ARRAY AND MARINE FAUNA Description of Risk The survey and support vessels may present a potential physical hazard (e.g. animal displacement or vessel strike) to marine fauna including cetaceans, turtles, whale sharks and dugongs. Additionally, the tail buoys that are attached to the end of seismic streamers can represent an entanglement risk for turtles. Potential Environmental Impacts The impact from vessel interactions with marine fauna can be as minimal as behavioural changes to severe impacts, such as mortality resulting from vessel strikes. Vessel collisions contribute to the mortality of marine fauna, notably turtles (Lutcavage et al. 1997; Hazel and Gyuris 2006; Hazel et al. 2007) and large cetaceans (Knowlton and Kraus 2001; Laist et al. 2001; Jensen and Silber 2003). Stranding records for Queensland indicate that 14% of dead marine turtles had been struck by vessels (Hazel and Gyuris 2006). These records are largely from populated areas of the state and comprise an unknown proportion of the total mortality. A report on vessel strikes in Queensland (DoE 2007) indicated that “both commercial and recreational boats have been responsible for striking marine animals. Recreational vessels, however, account for 96.9% and commercial vessels only 0.001% of registered vessels in Queensland in 2003”. Marine seismic surveys involve thpaths. The timing and location of surveys within the NWSR South MC MSS operational area may coincide with sensitive periods such as humpback whale, pygmy blue whale and whale shark migrations and turtles internesting periods. Given the susceptibility of cetaceans, turtles and whale sharks to vessel strike, only potential impacts on these have been considered. Other fauna such as birds, fish and sea snakes are likely to avoid vessels operating in the area and so are considered at low risk of potential strike. Cetaceans The likelihood of vessel/whale collision being lethal is influenced by vessel speed: the greater the speed at impact, the greater the risk of mortality (Laist et al. 2001, Jensen and Silber 2003). Vanderlaan and Taggart (2007) found that the chance of lethal injury to a large whale as a result of a vessel strike increases from about 20% at 8.6 knots to 80% at 15 knots. During seismic data acquisition, the survey vessel will be moving at a speed of ~4 knots. Turtles Marine turtles on the sea surface or in shallow coastal waters have been observed to avoid approaching vessels by typically moving away from the vessels track (Hazel et al. 2007). Hazel et al. (2007) suggested this observed avoidance behaviour is based primarily on visual cues (although these authors acknowledged that vessel noise is within range of turtle hearing). The success of this behaviour in avoiding a vessel strike is largely dependent on the speed of the approaching vessel (rather than vessel type) and the prevailing water clarity. While the potential for vessel strikes at various speeds has not been quantified, the success of avoidance behaviour is a factor of the response time available (i.e. visual observation distance/vessel speed). Hazel et al. (2007) suggested that higher vessel speed is more likely to cause impacts particularly in shallow waters where turtles are abundant. Thus, there is less opportunity for turtles to avoid vessels travelling at higher speeds in turbid waters. While vessel speed is a significant factor, vessel draft may also contribute to the risk of vessel strikes, as vessels with less draft provide a greater clearance distance between the turtle and the vessel. In the event of a collision, the turtle’s carapace provides a level of protection from serious injury, although the type and severity of the injuries would be dependent on the force of the collision and structure of the vessel and whether the animal is struck by the hull or propellers. Turtle entrapment with streamer tail buoys can lead to mortalities (Ketos Ecology 2007, 2009). Dugongs
adjacent to the Ningaloo coast and in waters over 500 m deep. Dugongs are thought to move and forage along the Pilbara coast. However, there will be no seismic data acquisition (i.e. shotpoints) in water depths shallower than

TGS NWSR MC MSS - Environment Plan Summary
Rev 1 Page 84
50 m across all of the NWSR South MC MSS operational area, and survey vessels will not enter known aggregation areas. Whale Sharks Although the whale shark's skin is thicker and tougher than any other shark species, the species may be behaviourally vulnerable to boat strike. They spend a significant amount of their time close to the surface of the water (DEH 2005a; Norman 1999), and several sharks bear scars that have probably been caused by boat contact (DEH 2005a). There have been several reports of whale sharks being impaled on the bows of larger ships in other regions (Norman 1999). DPaW developed a code of conduct for commercial vessels engaged in whale shark watching to minimise the risk of disturbance to normal whale shark behaviour and boat strike. These measures have been used to develop minimum requirements for vessels within the NWSR South MC MSS operational area: vessels shall not approach closer than 400 m from a whale shark. 6.8 VESSEL ANCHORING, GROUNDING OR EQUIPMENT DRAGGING AND LOSS Description of Risk The accidental dragging or loss of seismic streamer equipment, vessel grounding or use of anchors has the potential to cause minor physical damage to benthic habitats and biological communities. Potential Environmental Impacts The potential and significance of impacts caused by vessel grounding, anchoring or loss of equipment is in part dependent on the type of receiving environment. Soft sediment benthic areas relatively devoid of sensitive habitats and consisting of sandy /silt substrate is the predominant benthic receiving environment within, and adjacent to, the NWSR South MC MSS operational area. With the exception of Glomar Shoals and Rankin Bank, the surveys will generally be operating at depths and distances from emergent land, that preclude any possible contact, i.e. vessel is at least 7 km from nearest emergent land and in minimum 50 m water depth. The Department of Defence also made it known that unexploded ordnances may be present on and in the sea floor where activities may be undertaken, and so there is the risk of detonation. Due to the depths and method of surveys, this risk has been assessed as not credible. Equipment dragging and Loss In the unlikely event of damage to or loss of a seismic streamer, potential environmental effects will be limited to physical impacts on benthic communities arising from the cable and associated equipment sinking to the seabed. Seismic streamers and vanes are fitted with pressure-activated, self-inflating buoys that are designed to bring the equipment to the surface if lost accidentally during a survey. As the equipment sinks it passes a certain water depth at which point the buoys inflate and bring the equipment back to the surface where it can be retrieved by the seismic or support vessels Dragging of the streamer along the seabed may result in localised physical disturbance of substrates, benthic habitats and communities. The streamer tow depth will be between 8–30 m. Steamers will be towed at a depth that will not allow them to be closer than 10 m from the seabed. Various petroleum infrastructure such as platforms and FPSO units are present within the NWSR South MC MSS operational area, particularly within Management Areas A1 and B2. Steaming too close to an emergent structure could result in streamer entanglement, damage or loss. Anchoring The size of the anchor and chain and the frequency of anchoring will affect any potential damage. The majority of the benthos in the operational area is sand/mud/silt. Anchoring in these habitats typically causes minimal disruption to the soft sediment, and given the widely distributed benthic flora and fauna found within these areas, would have a minimal to negligible impact to the benthic communities. Anchoring is not a planned activity and would only
occur in emergency circumstances and due to depths within the operational area (25–5,700 m), anchoring is not always possible. Vessels are fitted with highly sophisticated position fixing equipment, and all measures will be taken to avoid areas of sensitive habitats such as corals, seagrasses and macroalgal beds. Vessel Grounding
TGS NWSR MC MSS - Environment Plan Summary
Rev 1 Page 85
Vessel impact and grounding has the potential to damage living resources, cause fracturing, reef rock displacement, and sediment production. These are caused by vessel contact with the ocean bottom, by prop wash and cable dragging during attempts by operators and/or salvagers to re-float the vessels, and by subsequent movement of destabilised substrates (Gittings et al. 1993). Vessel grounding also has the potential to result in the loss of containment of hydrocarbons such as fuels and oils from vessels that may also adversely affect aquatic marine life. The potential for the survey and support vessel to become grounded while working within the NWSR South MC MSS operational area is unlikely due to the absence of shallow waters (<20 m water depth) and any emergent features within or immediately adjacent to the area. Rankin Bank is the exception with its minimum depth of ~18m. However, typical survey vessels used by TGS have a draft of approximately 6.5 m and any support vessels are expected to have a shallower draft than this. At this depth, the draft of the seismic vessel is still well clear of the bottom. Whilst the vessels are in transit to/from a survey area there is the possibility of grounding in shallow waters in the vicinity of coastal islands. However, the scope of this EP does not cover transfer of the survey or support vessels to and from the survey area. 6.9 ACCIDENTAL RELEASE OF HAZARDOUS OR NON-HAZARDOUS MATERIALS Description of Risk The survey and support vessels will store and use a variety of hazardous materials such as paints, cleaning chemicals and batteries. Vessels will also produce a variety of other non-hazardous solid and liquid wastes, including packaging and domestic wastes, such as aluminium cans, bottles, paper and cardboard. Potential Environmental Impacts Hazardous materials have the potential to adversely impact the marine environment if accidentally released in significant quantities. The potential effects include a reduction in water quality and toxic effects on marine flora and fauna. Chemicals e.g. solvents and detergents, will typically be stored in small containers of 5-25 litre capacity and stored / used in internal areas where any leak or spill would be retained on board and cleaned up in accordance with the Shipboard Oil Pollution Emergency Plan (SOPEP) and associated spill clean-up procedures. Some spills may occur when small containers of chemicals are being used in open areas, where there is a risk of some entering the sea if spilled. The realistic worst case volume would be 25 L. Non-hazardous materials could potentially impact the marine environment if accidentally released in significant quantities resulting in a reduction in water quality and physical impacts on marine fauna, such as becoming entangled in waste plastics. 6.10 VESSEL TOPSIDE HYDROCARBON SPILLS Description of Risk The survey and support vessels store and use small quantities of lubricating oils and hydraulic fluid, which have the potential to spill if not appropriately managed. Hydraulic fluid may also potentially be spilled from a leak in hoses or lines on hydraulic equipment such as cranes or winches. Potential Environmental Impacts The size of potential spills to deck of these substances are likely to be between 50 and 200 L (0.05 m³ and 0.2 m³) based on expected volumes of fluids available on deck typically stored in 50 to 200 L steel drums. Storage of these substances aboard the survey vessel would typically be within a designated storage room or a contained (bunded) area on deck. Volumes of hydrocarbons greater than 200 L (0.2 m³) such as main engine lubricating oils, waste engine oil and hydraulic fluid would normally be stored below decks in designated storage tanks and do not represent a direct hazard for deck spills unless smaller volumes are being used on deck directly from a container. Secondary containment measures (i.e. bunds, containment lips, or absorbent booming) will be applied to the storage of drums or containers that are present on deck to prevent direct discharge to the marine environment. In the event of an accidental spill or leaking container, it is most likely that spilled material will be contained aboard (e.g. via use of scupper plugs) and recovered with minimal risk of material entering the marine environment through overboard drains or scuppers. For a spill on deck to result in a release to the marine environment, there would need

TGS NWSR MC MSS - Environment Plan Summary
Rev 1 Page 86
to be an un-confined spill, which was subsequently allowed to flow overboard and since use of oils or other chemicals on deck would be confined within areas with deck combing or bunds, this is highly unlikely to occur. Spills or leaks from hydraulic hoses on cranes, winches or other hydraulically operated equipment are also possible, but typically involve only very small volumes of fluid loss (less than 1 L) and are typically contained within a bund or drip tray under the equipment mounted on deck. A burst hydraulic hose on an extended crane could potentially result in hydraulic fluid being sprayed in a fine jet out over the water however, this would only result in a small volume (less than 1 L to approximately 25 L) before the problem was noticed, equipment shut down and the leak stopped. In the event a loss to sea does occur, impacts to the marine environment would be minimal, due to the small potential volumes released, and the fact that spilt hydrocarbons will rapidly evaporate, disperse and weather. 6.11 ;HYDROCARBON RELEASE CAUSED BY TRANSFER SPILL OR VESSEL COLLISION Description of Risk The hazards associated with fuel and oil spills during a survey within the NWSR South MC MSS operational area (that are considered most credible) are:
loss of up to 3,091 litres (~3 m3) of diesel during refuelling operations, as a result of hose failure; and
loss of diesel (up to 220 m3) from a ruptured fuel storage tank, resulting from vessel collision. Potential Environmental Impacts The accidental discharge of diesel has the potential to cause toxic effects on marine fauna and flora and a localised reduction in water quality. Potentially affected biota includes seabirds, cetaceans, turtles and whale sharks that may come into contact with a surface hydrocarbon slicks. If surface slicks or entrained diesel were to contact shallow waters or emergent features adjacent to the operational area, then a range of benthic habitats and communities could be at risk of impacts. Commercial fishing activities and shipping in the area could also be impacted in the event of a major diesel spill. Assessment of Likelihood
In an ERA, the likelihood component of the assessment is a function of the event occurring and subsequently affecting a sensitive resource (i.e. having an impact). For a hydrocarbon spill, the likelihood is a combination of:
the probability of a spill occurring, and the volume of that spill at source (primary risk); and
the probability of a spill reaching a sensitive part of the environment (secondary risk). According to DNV (2011), frequency of spills exceeding 1 tn (per year) can be broken down into eight different accident types. Of all possible accident types, annual spill frequencies are dominated by transfer (19.9%), drift grounding (21.6%) and powered grounding (19.1%), whilst the spill frequency for vessel collisions is 11.6%. Therefore, transfer spills have a much greater potential to cause large spills than do vessel collisions. Vessel collision spill risk levels from the proposed survey are no different from those presented by any other routine shipping operating in waters off the north-west Australian coastline. Based on a review of the Australian Transport Safety Bureau’s marine safety database (http://www.atsb.gov.au/publications/safety-investigation-reports.aspx?Mode=Marine), there are no recorded instances of collisions, grounding or sinking of a seismic vessel or its support vessels in Australian waters in at least the last 30 years. Although there is commercial fishery and shipping activity in some areas of the NWSR South MC MSS operational area, a collision between the survey vessel(s) and another vessel unconnected with the activity is unlikely, given the comprehensive control and mitigation measures in place to manage the risk of vessel collisions (see Section 5.3.3). However, a possibility remains of a collision occurring between the survey vessel(s) and the support vessel during occasions when the vessels are manoeuvring close to each other. There is no possibility of the survey or support vessels grounding within, or immediately adjacent to the NWSR South MC MSS operational area, given the water depths in the operational area (30 m to 5,700 m) and the absence of any shallow water or emergent features (noting a 500 m exclusion zone will be implemented around one FPSO).

TGS NWSR MC MSS - Environment Plan Summary
Rev 1 Page 87
Assessment of Consequence
The realistic worst case volume of diesel spilled during refuelling operations is 3,091 litres (3m3), arising from the total loss of the contents of the transfer hose (e.g. 5” hose of 244 m length) during refuelling. Dry break couplings would prevent any more than the hose volume being spilled in the event of hose failure. In reality, a more likely scenario is a pin hole leak or a large hole in the hose (from abrasion or mechanical damage), resulting in a highly visible sheen on the sea surface enabling action to be take to stop the leak (by the operation supervisor(s)) before more than a few litres had been spilled. The Polar Duchess typically uses both Marine Gas Oil (MGO) and Heavy Fuel Oil (HFO). However, given the more persistant nature of HFO in the marine environment compared to MGO, TGS have committed to only using MGO for surveys within the NWSR South MC MSS operational area. MGO is a light petroleum distillate that, given the high energy and warm water environment that prevails in the proposed area of operations, is expected to undergo rapid dispersion and evaporation. The largest fuel oil tank is inside of the hull of the Polar Duchess, with void tanks on either side, thus reducing the likelihood of rupture in the event of a vessel-to-vessel collision. The central tank has a maximum capacity of 244 m3 (see tank plan in Appendix B). The tanks are never filled to 100% capacity. It is the vessel owners policy that the tanks will only be filled to 90% capacity. Therefore, in the very unlikely (improbable) event of a ruptured fuel tank
as a result of collision, the maximum spill size possible would be in the order of 220 m3 of MGO. However, this could only occur in the event of a rupture of the vessels’ largest MGO tanks and complete loss of all of its contents and the volume of the fuel lost to the marine environment would be expected to be less than the total capacity of the tank due to:
if the tank was holed below the water line, then it would only leak down to a level equivalent to the water line, and
emergency procedures would be carried out to transfer the contents of the tank to other MGO tanks onboard the vessel.
It should be noted that while it is not expected that the full volume would be released to the marine environment, the full tank capacity (i.e. 220 m3) was used as the volume to represent an overly conservative and therefore worst case scenario in the spill risk assessment. Diesel characteristics
AMOSC (2011) categorises MGO as a Group II hydrocarbon, which generally is a mixture of volatile and persistent
hydrocarbons, with a low percentage of volatile C4 to C10 hydrocarbons (6%) and a greater proportion of
moderate to very low volatile C11 to C20 hydrocarbons (89%). In the marine environment, a small residual volume (5%) of the total quantity of MGO spilt may remain after the volatilisation and solubilisation processes associated with weathering. The heavier (low volatile) components of the oil have a tendency to entrain into the upper water column due to wind-generated waves, but can subsequently resurface if wind waves abate. Subsequently, diesel is expected to evaporate rapidly, depending on prevailing conditions, with further evaporation slowing over time. A total of 95% of the hydrocarbon is available to evaporate over time. The remaining proportion (<5%) would not evaporate under the environmental conditions in the offshore region and may persist in the marine environment for an extended period, until biodegradation occurs. Given the high energy and warm water environment that prevails in the NWSR South MC MSS operational area, diesel is expected to:
undergo rapid dispersion and evaporation;
spread rapidly in the direction of prevailing wind and current;
evaporate rapidly from the sea surface (under calm conditions this will be the dominant process removing oil from the marine environment).
Spill Modelling The following spill scenarios were assessed:
220 m3 surface discharge of MGO over a six hour period resulting from a vessel collision.
3 m3 instantaneous surface discharge of MGO as a result of a refueling incident.

TGS NWSR MC MSS - Environment Plan Summary
Rev 1 Page 88
In the unlikely (improbable) event of a ruptured fuel tank as a result of collision, an ADIOS2 (Automated Data Inquiry for Oil Spills) model was run using the worst-case scenario for an oil spill of MGO from the largest tank at maximum capacity of 220 m3 (90% full). Due to the large area and varying environmental parameters (e.g. surface water temperature, wind speed and direction and current speed and direction), the NWSR South MC MSS polygon was divided into three sections:
Section 1: Kalbarri to Shark Bay
Section 2: Shark bay to Exmouth
Section 3: Exmouth to Eighty Mile Beach. The model was run for both a summer and winter release scenarios with the application of appropriate sea surface temperature, wind speeds and current for summer and winter periods. Results are outlined in Table 6.14.
Table 6.14- ADIOS2 Spill Modelling Results for a 220m3 Diesel Spill
Summer Winter
Sect
ion
1
99% of a slick may disperse and evaporate within about 12 hours of the spill in 8.5 m/s strong warm winds, and conservative current speed of 0.3m/s.
A surface slick is calculated to travel a maximum distance of 24 km within 12 hrs. Therefore the ZPI for an oil spill resulting from a vessel collision could have a potential radius of 24 km (see Figure 5.4).
After 12 hours, dispersion is likely to account for 76% of the
loss, and evaporation 23%.
99% of the slick will either disperse or evaporate within about 17 hours of the spill in 7 m/s winds, cooler airs, and conservative current speed of 0.3m/s.
A surface slick is calculated to travel a maximum distance of 31.2 km within 17 hrs. Therefore, the ZPI for an oil spill occurring during the winter could have a potential radius of 32 km.
During winter, after 17 hours, dispersion is likely to account
for 72% of the loss, and evaporation 27%. Evaporation is less due to the cooler temperatures.
Sect
ion
2
99% of a slick may disperse and evaporate within about 12 hours of the spill in 8 m/s warm air and sea conditions.
A surface slick is calculated to travel a maximum distance of
27.5 km within 12 hrs. Therefore the ZPI for an oil spill resulting from a vessel collision could have a potential radius of 28 km (see Figure 5.4).
After 12 hours, dispersion is likely to account for 73% of the
loss, and evaporation 26%.
99% of the slick will either disperse or evaporate within about 17 hours of the spill in 7 m/s winds, cooler airs, and conservative current speed of 0.3m/s.
A surface slick is calculated to travel a maximum distance of 31.2 km within 17 hrs. Therefore, the ZPI for an oil spill occurring during the winter could have a potential radius of 32 km.
After 17 hours, dispersion is likely to account for 72% of the
loss, and evaporation 27%. Evaporation is less due to the cooler temperatures
Sect
ion
3
99% of a slick may disperse and evaporate within about 17 hours of the spill in 7 m/s, warm air and sea conditions.
A surface slick is calculated to travel a maximum distance of 31 km within 17 hrs. Therefore the ZPI for an oil spill resulting from a vessel collision could have a potential radius of 31 km (see Figure 5.4).
After 17 hours, dispersion is likely to account for 68% of the
loss, and evaporation 32%. Both dispersion and evaporation will be enhanced due to the warm prevailing air and sea temperatures within the NWS region.
99% of the slick will either disperse or evaporate within about 14 hours of the spill in 8 m/s winds, mild air and sea conditions – based on an oil budget graph calculated using the ADIOS2 weathering model.
A surface slick is calculated to travel a maximum distance of 28 km within 14 hrs. Therefore, the ZPI for an oil spill occurring during the winter could have a potential radius of 28 km.
During winter, after 14 hours, dispersion is likely to account
for 79% of the loss, and evaporation 21%. Evaporation is less due to the cooler temperatures.
The ZPI as a result of 3m3 refuelling incident was much smaller than that of the 220m3 spill and ranged from a
14 km to 18 km. As no refuelling will occur within 25 km from emergent land, the remainder of this section focuses on the impacts associated with the larger spill. Sensitivities that may be affected
Figure 6.5 shows only the maximum potential radius which is 32 km while 6.15 outlines what sensitivities may be impacted by the spills as determined from the ADIOS modelling.

TGS NWSR MC MSS - Environment Plan Summary
Rev 1 Page 89
Figure 6.5 – ADIOS2 modelling ZPI for 32 km spill radius for the NWSR South MC MSS Operational Area
Table 6.15- Summary of Sensitivities that may be impacted based on ADIOS modelling
Emergent Features or Sensitive Receptors
Sensitivities Summer
ZPI Winter
ZPI
Section 1 24km 32km
Proposed Abrolhos CMR Examples of the deeper ecosystems of the Central Western Transition provincial bioregion
Key ecological features: Wallaby Saddle - a unique seafloor feature that supports aggregations of baitfish and attracts large pelagic predators including sperm whale
YES YES
Commonwealth marine environment surrounding the Houtman Abrolhos Island - KEF
X YES
Abrolhos Islands Emergent land X X
Shark Bay World Heritage Area including:
Zuytdorp Cliffs
Dirk Hartog Island
Shark Bay Marine Reserve – Multiple Use Zone
BIA for nesting/internesting of loggerhead turtles
BIA for foraging dugong
BIA for breeding of roseate tern, fairy tern and wedge-tailed shearwater
BIA for migrating humpback whales
YES YES
Proposed Shark Bay CMR YES YES
Shark Bay Marine Reserve YES YES
Dorre Island Nature Reserve X X
Western Rock Lobster KEF This species is the dominant large benthic invertebrate in the region and important commercial fishery
YES YES
Western demersal slope and associated fish communities KEF
Provides an important habitat for demersal fish communities, with a high level of diversity and endemism.
YES YES
Wallaby Saddle KEF it is associated with enhanced biological productivity in an area of generally low productivity. May have aggregations of sperm whales
YES YES
Ancient coastline at 90-120m depth KEF
Increased benthic diversity YES YES

TGS NWSR MC MSS - Environment Plan Summary
Rev 1 Page 90
Emergent Features or Sensitive Receptors
Sensitivities Summer
ZPI Winter
ZPI
Perth Canyon and adjacent shelf break, and other west coast canyon KEF
Canyon features are important feeding and breeding areas for a variety of fish species and marine mammals
YES YES
Commonwealth marine environment within and adjacent to the west coast inshore lagoons
Sheltered lagoons provide shallow-water reef habitats for many extensive beds of macroalgae (principally Ecklonia sp.) and seagrass which provide habitat for commercial fish sp.
X X
Section 2 28 km 32 km
Ningaloo World Heritage Area
Ningaloo Marine Reserve – Recreational Use Zone
Commonwealth Heritage Site
BIA for nesting/internesting of loggerhead and hawksbill turtles
BIA for foraging and nursing area for dugong
BIA for breeding of roseate tern, fairy tern and wedge-tailed shearwater
BIA for migrating humpback whales
YES YES
Proposed Ningaloo CMR YES YES
Commonwealth waters adjacent to Ningaloo Reef - KEF
YES YES
Ningaloo Marine Park YES YES
Cape Range National Park X X
Jurabi Coastal Park X X
Muiron Islands BIA for migrating humpback whales
BIA for nesting/internesting green and loggerhead turtle
BIA for nesting/internesting and foraging of hawksbill turtle
YES YES
Muiron Islands MMA YES YES
Muiron Islands NR YES YES
Proposed Carnarvon Canyon CMR
Central Western Transition provincial bioregion ecosystem examples are found here, which are characteristic of the biogeographic faunal transition between tropical and temperate species
YES YES
Proposed Gascoyne CMR Important foraging area for seabirds, turtles and whale shark.
Contains 3 x KEF YES YES
Canyons linking the Cuvier Abyssal Plain and the Cape Range Peninsula - KEF
These canyons are believed to support the productivity and species richness of Ningaloo Reef. Provides habitat for snapper and aggregations of marine fauna are known to occur
YES YES
Exmouth Plateau - KEF It is an important sea-floor feature that modifies the flow of deep
waters. YES YES
Section 3 31 km 28 km
Flat Island Flatback and loggerhead turtle nesting area YES YES
Serrurier Island NR Green turtle nesting area YES YES
Bessieres Island NR Wedgetail shearwater nesting YES YES
Mackerel Islands including Thevenard, Ashburton, Rosily and Tortoise Islands
BIA for migrating humpback whales
Thevenard Island Nature Reserve
BIA for nesting/internesting hawksbill turtle
YES YES
Thevenard Island NR YES YES
Barrow Island MP BIA for breeding of wedge-tailed shearwater, fairy tern and roseate tern
BIA for migrating humpback whales
BIA for nesting/internesting and foraging green turtle
BIA for nesting/internesting and foraging of hawksbill turtle
YES YES
Boodie, Double Middle Islands NR
YES YES
Montebello Islands Montebello Marine Reserve – Multiple Use Zone
BIA for breeding of wedge-tailed shearwater, fairy tern and roseate tern
BIA for migrating humpback whales
BIA for nesting/internesting and foraging hawksbill and green turtle
BIA for internesting and mating flatback turtle
BIA for nesting/internesting loggerhead turtle
YES YES
Montebello Islands MP YES YES
Montebello Islands Conservation Park YES YES

TGS NWSR MC MSS - Environment Plan Summary
Rev 1 Page 91
Emergent Features or Sensitive Receptors
Sensitivities Summer
ZPI Winter
ZPI
Proposed Montebello CMR
Foraging areas adjacent to important breeding areas for migratory seabirds
Foraging areas for vulnerable and migratory whale sharks
Foraging areas and adjacent to important nesting sites for marine turtles
shallow shelf environments with depths ranging from 15 metres to 150 m
YES YES
Dampier Archipelago including Rosemary, Goodwyn and Legendre Islands
Dampier Marine Reserve - Marine National Park Zone
BIA for breeding of wedge-tailed shearwater, fairy tern and roseate tern
BIA for migrating humpback whales
BIA for nesting/internesting and foraging green turtle
BIA for internesting and mating flatback turtle
BIA for nesting/internesting and foraging of hawksbill turtle
BIA for nesting/internesting loggerhead turtle
YES YES
Proposed Dampier Archipelago CMR
Foraging areas adjacent to important breeding areas for migratory seabirds
Foraging areas adjacent to important nesting sites for marine turtles
Includes part of the migratory pathway of the protected humpback whale
The reserve provides a high level of protection for offshore shelf habitats adjacent to the Dampier Archipelago
YES YES
Proposed Dampier Archipelago Marine Park
YES YES
Proposed Regnard MMA X X
Mainland near Cape Thouin/ Mundabullangana/Cowrie Beach
BIA for Flatback Turtles and wedgetail shearwater YES X
Proposed Eighty Mile Beach CMR Eighty Mile Beach Ramsar Site
The waters off Eighty Mile Beach are important for a number of species including dugongs, humpback whales, sawfish and migratory seabirds.
It is a listed Ramsar Wetland of International Importance
X X
Continental Slope Demersal Fish Communities - KEF
Rich assemblage of ~ 500 fish species and high endemicity YES YES
Ancient coastline at 125 m depth contour - KEF
contribute to higher diversity and enhanced species richness
facilitate increased availability of nutrients off the Pilbara
enhanced productivity may attract larger marine life such as whale sharks and large pelagic fish
humpback whales appear to migrate along the ancient coastline
YES YES
Glomar Shoal - KEF high biological diversity and high localised productivity
Important fishing grounds YES YES
The environmental sensitivities and values most at risk from a large diesel spill are benthic habitats and communities associated with shallow subtidal and intertidal waters surrounding shallow shoals, reefs, and islands including:
coral reefs;
seagrasses;
sandy beaches;
mangroves;
commercial fishing; and
recreational fishing, aquaculture and marine-based tourism. The emergent lands that may be contacted by a hydrocarbon spill are outlined above. Protected marine fauna at risk within or adjacent to the operational area as a result of a 220 m3 release of marine diesel includes:
cetaceans;
whale sharks;
dugongs;
turtles; and
Seabirds.

TGS NWSR MC MSS - Environment Plan Summary
Rev 1 Page 92
In the open ocean habitat, any spilled diesel would be subject to rapid dispersal, weathering, evaporative losses and dispersion throughout the water column.
Diesel may make contact with the western edge of Dirk Hartog Island. Due to its proximity, contact would take 6 hours in summer at which point 52% of the hydrocarbon could be remaining. However, the receiving environment is comprised of high cliff face and is very energetic environment. Cape Inscription on the north of Dirk Hartog, a heritage place and known loggerhead nesting beach, is 21 km from the operational area and may have diesel
contact within 10 hours, resulting in 10% diesel remaining in summer and 18% in winter. Based on modelling
results, diesel is unlikely to enter Shark Bay in summer. However in winter, some may enter within 14 hours, at which stage there would be less than 6% diesel remaining. At its closest point near Point Cloates, the Ningaloo coast mainland as well as the outer edge of the fringing coral
reef, is 33 km from the edge of the operational area. At this distance, it is predicted that no diesel will reach these sensitive areas. Diesel will however enter the proposed Commonwealth Marine Reserve and World Heritage Area as these are only 20 km from the edge of the operational area. At this distance it is possible, for both winter and
summer scenarios, that diesel could enter the areas an 10 hours with 12% remaining. Some diesel may also enter
state waters and the recognised high prey density BIA for whale sharks as its boundary is 28 km from the operational area. At this distance no contact is expected in summer, but during winter diesel may enter the waters within 15 hours but <6% shall remain on the surface with 67% dispersed and 27% evaporated. No diesel is anticipated to enter Exmouth Gulf. Due to their distance from a potential spill location (25 km) contact with Muiron Islands, Barrow Island, Montebello Islands and Dampier Archipelago would take at least 13 hours at which time most of the toxicity associated with the diesel would have dissipated. After 13 hours in summer conditions, 60% has dispersed, 32% has evaporated and that only 8% remains on the surface. In winter, 77% has dispersed, 21% has evaporated and that 2% remains on the surface. Subsequently, effects on these islands would be minimal. Other Islands within the Pilbara region are much closer though including:
Contact with Bessieres (7 km away) may occur within 3 hours in winter at which point 78% of the diesel remains on the surface, while in summer 80% remains.
Contact with Serrurier Island (10 km away) may occur within 5 hours in summer at which point 70% of the diesel remains on the surface, while in winter 64% remains.
Contact with Thevenard Island (16 km away) may occur within 8.5 hours in summer at which point 34% of the diesel remains on the surface, while in winter 22% remains.
Subsequently, shoreline accumulation may occur on these islands and others between the operational area and the mainland.
The mouth of the Ashburton River on the mainland is 31 km from the operational area and so may experience
minor contact in a summer spill scenario with only 1% diesel remaining in the water. Various shoals and banks off the mainland near the Ashburton River may also experience small quantities of diesel in summer, but it is
anticipated only 8% diesel would remain on the surface with 60% dispersed and 32% evaporated. As activities are limited to waters deeper than 25 m, the operational area, at its closest, is 28 km from the mainland
near Port Hedland. As such, for a summer spill scenario it will take at 15 hours for diesel to reach the mainland and there will be only 3% remaining on the surface with 65% dispersed and 32% evaporated. In winter, less than 1% is anticipated to remain in the water. Assessment of Consequences
Shorelines are potentially at risk from surface diesel slicks or entrained hydrocarbons. Entrained hydrocarbons may pose different risks to habitats and fauna compared to a surface slick. MGO contains heavy (low volatile) components of which it is estimated <5% may physically entrain into the water column due to wave and wind action. Due to this dilution of entrained oil in the water column compared to a surface slick, toxic impacts are likely to be less. Entrainment associated with diesel will generally be limited to the top few metres of the water column (depending on conditions). Subsequently, benthic environments in deeper waters are not affected.

TGS NWSR MC MSS - Environment Plan Summary
Rev 1 Page 93
As diesel is less viscous or sticky when compared to black oils, the diesel tends to penetrate porous sediments quickly but also tends to be washed off quickly by waves and tidal flushing. Diesel oil is readily and completely degraded by naturally occurring microbes in approximately two months (NOAA 2012). Shorelines exposed to diesel in Norway resulted in a thickness of 1-10 mm on shore following a diesel spill. Following clean up however, no significant difference between contaminated and reference uncontaminated locations were found (SINTEF 2006). A summary of the potential impacts of both surface slicks and entrained oil, are outlined in Table 6.16. Although the amount of entrained oil to be generated is minimal and so its effects negligible, an overview is provided. Overall, the impact of surface and/or entrained hydrocarbons on protected areas is considered medium; however the nature of diesel in the marine environment is highly evaporative and dispersive and is not expected to persist for more than 17 hours.

TGS NWSR MC MSS - Environment Plan Summary
Rev 1 Page 94
Table 6.16- Summary of Potential Impacts from a Large Diesel Spill
Receptor Potential Exposure Potential Impacts
Marine Fauna
Cetaceans
Marine mammals are highly mobile and anecdotal evidence indicates whales and dolphins may be able to detect and avoid surface slicks. EPBC listed species 34 cetacean species were identified by the
DoE PMST as potentially occurring in the
operational area. Of these, four are listed as threatened BIA The operational area overlaps the BIA (migration north and south) for both the humpback whale and pygmy blue whale, and a possible foraging BIA for pygmy blue whales. Planning will be undertaken to try and avoid these peak sensitive periods, but it is possible that activities will overlap. Pygmy blue whales may feed opportunistically during the migration.
Marine mammals that have direct physical contact with surface slicks and entrained oil from surface fouling or through ingestion of hydrocarbons and/or inhalation of toxic vapours may experience irritation of sensitive membranes such as the eyes, mouth, digestive and respiratory tracts and organs, impairment of the immune system or neurological damage (Etkins 1997). Marine mammals are generally able to metabolise and excrete limited amounts of hydrocarbons, but acute or chronic exposure poses greater toxicological risks (Grant and Ross 2002). Such impacts may include changes in behaviour and reduced activity, including inflammation of the mucous membranes, lung congestion, pneumonia, liver disorders, and neurological damage (Geraci and St. Aubin 1990). Surfacing within a hydrocarbon slick may lead to a toxic level of exposure. However, cetaceans have a thickened epidermis that greatly reduces the likelihood of hydrocarbon toxicity from skin contact with oiled waters (Geraci 1990; O’Shea and Aguilar 2001). For surface oil, inhalation of vapours at the water’s surface and ingestion of hydrocarbons during feeding (in particular, surface skimming baleen whales) are more likely pathways of exposure (National Marine Fisheries Service 2008). The concentration of entrained hydrocarbons will be less in comparison to surface slicks due to the effects of dilution with sea water and inability for some hydrocarbon residues to entrain. This behaviour of entrained diesel combined with a thick epidermis layer means cetaceans are unlikely to be affected greatly from skin contact with entrained hydrocarbons. Pygmy blue whales Pygmy blue whales that are feeding opportunistically during migration may be exposed to surface slicks or entrained oil. Humpback whales Humpback whales migrating north at the start of the northbound season may be exposed to surface diesel slicks. A low number of transient individuals may be present within the area affected by a spill.
Humpback and pygmy blue whales are pelagic gulp feeders and therefore are unlikely to ingest large quantities of surface hydrocarbons, although they may be prone to ingesting smaller amounts of entrained oil. Low numbers of humpback and pygmy blue whales may encounter surface slicks and entrained oil. The potential consequences of contact are minor (as assessed above).
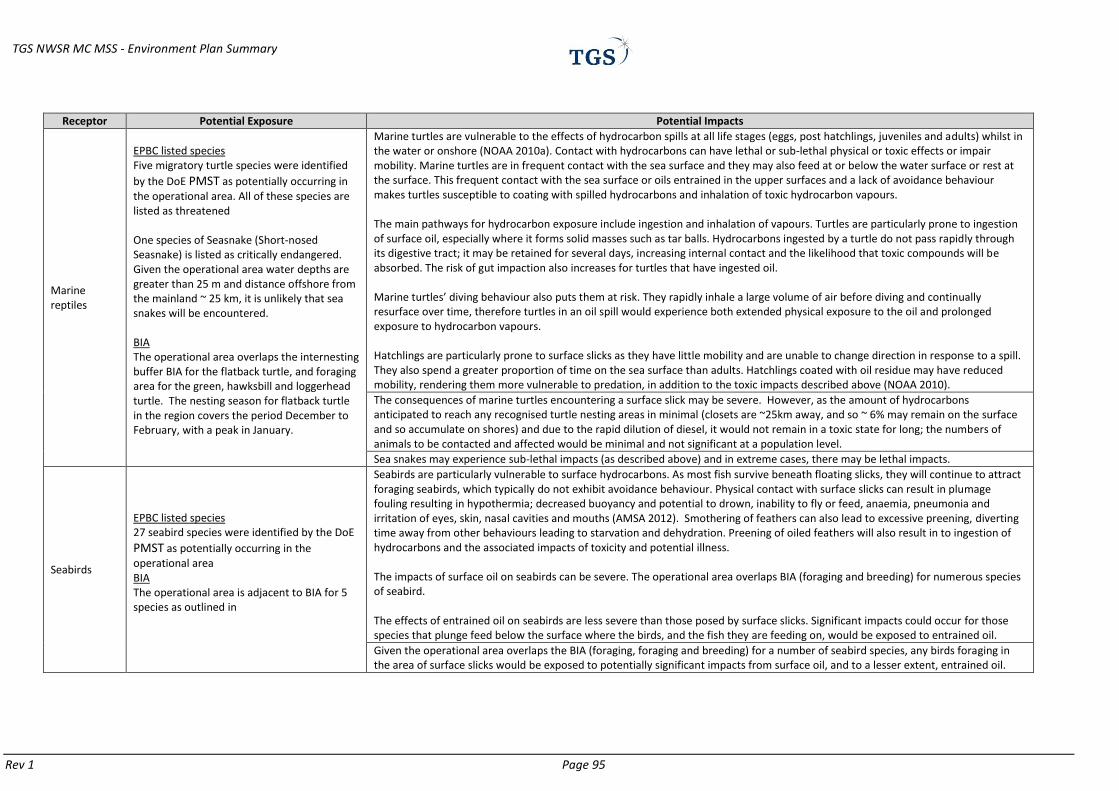
TGS NWSR MC MSS - Environment Plan Summary
Rev 1 Page 95
Receptor Potential Exposure Potential Impacts
Marine reptiles
EPBC listed species Five migratory turtle species were identified
by the DoE PMST as potentially occurring in the operational area. All of these species are listed as threatened One species of Seasnake (Short-nosed Seasnake) is listed as critically endangered. Given the operational area water depths are greater than 25 m and distance offshore from the mainland ~ 25 km, it is unlikely that sea snakes will be encountered. BIA The operational area overlaps the internesting buffer BIA for the flatback turtle, and foraging area for the green, hawksbill and loggerhead turtle. The nesting season for flatback turtle in the region covers the period December to February, with a peak in January.
Marine turtles are vulnerable to the effects of hydrocarbon spills at all life stages (eggs, post hatchlings, juveniles and adults) whilst in the water or onshore (NOAA 2010a). Contact with hydrocarbons can have lethal or sub-lethal physical or toxic effects or impair mobility. Marine turtles are in frequent contact with the sea surface and they may also feed at or below the water surface or rest at the surface. This frequent contact with the sea surface or oils entrained in the upper surfaces and a lack of avoidance behaviour makes turtles susceptible to coating with spilled hydrocarbons and inhalation of toxic hydrocarbon vapours. The main pathways for hydrocarbon exposure include ingestion and inhalation of vapours. Turtles are particularly prone to ingestion of surface oil, especially where it forms solid masses such as tar balls. Hydrocarbons ingested by a turtle do not pass rapidly through its digestive tract; it may be retained for several days, increasing internal contact and the likelihood that toxic compounds will be absorbed. The risk of gut impaction also increases for turtles that have ingested oil. Marine turtles’ diving behaviour also puts them at risk. They rapidly inhale a large volume of air before diving and continually resurface over time, therefore turtles in an oil spill would experience both extended physical exposure to the oil and prolonged exposure to hydrocarbon vapours. Hatchlings are particularly prone to surface slicks as they have little mobility and are unable to change direction in response to a spill. They also spend a greater proportion of time on the sea surface than adults. Hatchlings coated with oil residue may have reduced mobility, rendering them more vulnerable to predation, in addition to the toxic impacts described above (NOAA 2010).
The consequences of marine turtles encountering a surface slick may be severe. However, as the amount of hydrocarbons anticipated to reach any recognised turtle nesting areas in minimal (closets are ~25km away, and so ~ 6% may remain on the surface and so accumulate on shores) and due to the rapid dilution of diesel, it would not remain in a toxic state for long; the numbers of animals to be contacted and affected would be minimal and not significant at a population level.
Sea snakes may experience sub-lethal impacts (as described above) and in extreme cases, there may be lethal impacts.
Seabirds
EPBC listed species 27 seabird species were identified by the DoE
PMST as potentially occurring in the operational area BIA The operational area is adjacent to BIA for 5 species as outlined in
Seabirds are particularly vulnerable to surface hydrocarbons. As most fish survive beneath floating slicks, they will continue to attract foraging seabirds, which typically do not exhibit avoidance behaviour. Physical contact with surface slicks can result in plumage fouling resulting in hypothermia; decreased buoyancy and potential to drown, inability to fly or feed, anaemia, pneumonia and irritation of eyes, skin, nasal cavities and mouths (AMSA 2012). Smothering of feathers can also lead to excessive preening, diverting time away from other behaviours leading to starvation and dehydration. Preening of oiled feathers will also result in to ingestion of hydrocarbons and the associated impacts of toxicity and potential illness. The impacts of surface oil on seabirds can be severe. The operational area overlaps BIA (foraging and breeding) for numerous species of seabird. The effects of entrained oil on seabirds are less severe than those posed by surface slicks. Significant impacts could occur for those species that plunge feed below the surface where the birds, and the fish they are feeding on, would be exposed to entrained oil.
Given the operational area overlaps the BIA (foraging, foraging and breeding) for a number of seabird species, any birds foraging in the area of surface slicks would be exposed to potentially significant impacts from surface oil, and to a lesser extent, entrained oil.

TGS NWSR MC MSS - Environment Plan Summary
Rev 1 Page 96
Receptor Potential Exposure Potential Impacts
However, given the rapid breakdown of the hydrocarbons, impacts are not expected to be significant at a population level, although they would be increased if a large spill coincided with a period when birds were provisioning young.
Sharks and bony fish
EPBC listed species Four threatened species of shark, and six migratory species of sharks and rays were
identified by the DoE PMST as potentially
occurring in the operational area, as well as a range of syngnathid fish species. The Dwarf sawfish, although not identified in
the DoE PMST, may be present in the areas close to Eighty Mile beach. BIA The operational area overlaps the migratory BIA (foraging) for the whale shark and is also adjacent to a high density prey foraging BIA.
Since fish and sharks do not generally break the sea surface and surface diesel slicks are expected to have dispersed with ~1% remaining 12 and 17 hours, impacts are expected to be minimal. Whale sharks often feed on dense aggregations of prey (e.g. krill, bait fish) close to the sea surface (Colman 1997) and could therefore come into contact with surface diesel slicks. The BIA for the migration route of whale sharks overlaps the seismic survey area and subsequently individuals may be present. The high density prey BIA adjacent to Ningaloo reef may be impacted in winter when whale sharks are known to aggregate in the area. However, it is anticipated that <6% hydrocarbons will remain on the surface by the time it enters the area after 15 hours. Hydrocarbon droplets can physically affect sharks and fish exposed for an extended duration (weeks to months). Smothering through coating of gills can lead to the lethal and sub-lethal effects of reduced oxygen exchange, and coating of body surfaces may lead to increased incidence of irritation and infection. Fish may also ingest hydrocarbon droplets or contaminated food leading to reduced growth, and hydrocarbon tainting of their flesh, making them unfit for human consumption. There is potential for localised mortality of fish eggs and larva due to reduced water quality and toxicity. Effects will be greatest in the upper 10 m of the water column and areas close to the spill source where hydrocarbon concentrations are likely to be highest.
Due to the low probability of contact with surface oil, the impact of surface oil on sharks and fish will be negligible. Although entrained hydrocarbons can have negative impacts on fish and fish eggs/larvae, considering the volume of entrained hydrocarbons potentially encountered the low persistence of diesel and the large extent of suitable marine habitat, the impact on populations is considered low.
Dugongs
Dugongs are located in near shore waters only. A foraging BIA is located within Exmouth Gulf and to along the western edge of the Ningaloo coast
Dugongs have smooth skin surfaces and are less likely to suffer from skin adherence. Oil tends to stick to the pelage or rough areas of an animal’s skin. If surfacing in slicks with the head out to breathe, dugongs may foul these sensory hairs and also get oil in their eyes. This could cause inflammation and infections, and affecting their ability to feed and breed. There has been little research on the effects of oil on the dugong, but it is thought they could suffer "lipid pneumonia" if they inhale oil droplets and oil vapour when they surface through oil slicks to breathe. Dugongs may also suffer from long term chronic effects such as liver problems if they consume oil droplets or oil-affected sea grasses. Depending upon the amount and composition of the ingested oil, the effects could range from acute, to subtle, to progressive organ damage. Aromatics and other low molecular weight hydrocarbons can be absorbed from the intestine and transported via the bloodstream to various target organs within the dugong. (AMSA 2014)
Dugongs are confined to very shallow waters. A BIA is present and may be impacted in winter. However, it is anticipated that <6% hydrocarbons will remain on the surface by the time it enters the BIA after 15 hours.
Pinnipeds The operational area does not overlap any recognised BIA and numbers present are expected to be low, but male sea lions could
Australian sea lions are particularly vulnerable to surface hydrocarbons. As most fish survive beneath floating slicks, they will continue to attract foraging sea lions. Direct contact with surface hydrocarbons can lead to irritation of skin and eyes. Smothering can lead to reduced water proofing of the sea lions fur leading to hypothermia. Smothering of the fur can also lead to excessive cleaning,

TGS NWSR MC MSS - Environment Plan Summary
Rev 1 Page 97
Receptor Potential Exposure Potential Impacts
be present in the waters around the Abrolhos islands year-round
diverting time away from other behaviours leading to starvation and dehydration. Cleaning of oiled fur will also result in ingestion of hydrocarbons and the associated impacts of toxicity and potential illness. Entrained oil does not pose the same high risk of smothering as surface slicks, reducing the amount of hydrocarbons ingested through cleaning. Australian sea lions may still encounter entrained hydrocarbons while swimming in the water column leading to irritation of skin and eyes, and also lower level ingestion and associated toxic effects.
Based on the ADIOS modelling, a diesel spill is not anticipated to reach the Abrolhos islands or the identified BIA for sea lions. As the majority of the survey is in waters well to the north of their recognised aggregation sites, impact upon the sea lions is considered low on a population level.
Crustaceans All substrates and habitats. Most at risk in shallow waters.
Crustaceans are less at risk of being affected by an oil spill as the diesel fuel would form a surface slick and routes of exposure to organisms living in the water column or on the ocean floor would be limited. However, these animals can be affected in some circumstances when oil spills enter shallow or confined waters. There are increased risks to some species and life stages in shallow near shore waters such as seagrass and mangrove habitats. These foreshores are believed to function as essential feeding and "nursery" breeding grounds for many crustaceans.
Plankton The elevated concentrations of dissolved aromatic hydrocarbons associated with surface diesel slicks would likely be acutely toxic to pelagic organisms present in surface waters in the area of a major diesel spill. The elevated concentrations of dissolved aromatic hydrocarbons associated with surface diesel slicks would likely be acutely toxic to pelagic organisms present in surface waters in the area of a major diesel spill.
Marine habitats
Sandy beaches
Sandy beaches have a relatively low biodiversity although they do provide important habitats for nesting turtle, breeding and foraging seabirds, and shorebirds. They also provide habitat for polychaetes, molluscs, marine crustaceans, semi-terrestrial crustaceans and insects. The sandy beaches on many of the Pilbara coast islands are an active nesting location for numerous species of turtles and birds
Surface hydrocarbons may accumulate on sandy beaches, impacting the area by physically smothering the habitat. This may have sub-lethal or lethal impacts on intertidal macrofauna/infauna. Stranded oil may have toxic effects on invertebrates with knock on impacts on the shorebirds that forage upon them. As hydrocarbons disperse, the intertidal communities would be expected to recover. The sandy beaches on Pilbara islands and mainland are active nesting locations for numerous species of turtles, but particularly the flatback and green turtles. Oiling of gravid adult females or hatchlings in near-shore waters or while traversing inter-tidal or high tide shoreline areas is potentially possible. Given turtles nest above the high-water mark, however, buried eggs are unlikely to be directly exposed to any hydrocarbons (NOAA 2010b).
Modelling indicates that a surface slicks will travel ~24 to 32 km. The majority of Pilbara islands supporting nesting beaches are at least 25 km from the operational area and so will not be greatly affected as by the time the slick reaches that distance it has mostly evaporated or dispersed (<6% remaining in worst case scenario) and also the toxicity levels have declined markedly. Bessieres, Serrurier and Thevenard Islands which are ~7 to 16 km from the boundary of operational area, may be affected as hydrocarbons are predicted to arrive there between 3 and 8 hours of a spill.
Intertidal and submerged coral reefs
There are pockets of intertidal and subtidal reefs fringing Ningaloo and various islands of the Pilbara region that may be impacted by surface and entrained hydrocarbons. There is also potential for shoreline accumulation of hydrocarbons at any of these locations.
Physical coating by surface slicks and exposure to water soluble hydrocarbon fractions (toxic effects) may cause sub-lethal or lethal impacts to certain sensitive biota, particularly, sessile coral species. The most vulnerable coral colonies to direct contact with surface slicks would be those close to the shoreline or periodically exposed at spring low tides (NOAA 2010b) such the tidally exposed reef flat habitat that and shallow lagoon and outer reef slope coral habitats of Imperieuse Island. Impacts to corals will depend on species’ tolerance as well as exposure concentrations and length of exposure.
Surface hydrocarbons may make contact with intertidal reefs should reef features become emergent, for example during low tide.

TGS NWSR MC MSS - Environment Plan Summary
Rev 1 Page 98
Receptor Potential Exposure Potential Impacts
Bessieres Islands would experience the most impact as only 7km from the operational area. The likelihood of exposure at Ningaloo or Barrow/Montebello is low considering the distance from a potential spill location (over 25 km from operational area)
Impacts of contact with surface oil can include impaired feeding, fertilisation, larval settlement and metamorphosis, larval and tissue death and decreased growth rates (Villanueva et al. 2008). Surface oil also has the potential to impact reef fauna (turtles, sea birds) as outlined above. Below a depth of 3-4 m, coral colonies associated with submerged reefs would be separated from surface slicks by the overlying waters. Thus, the likelihood of surface oil contacting submerged reefs and shoals is low. Physical effects from entrained oil have the potential to coat contacted coral reefs. The phenomena of smothering of exposed coral surfaces or polyps by oil spills has only been reported where very large oil spill quantities, or very sticky oil slicks, have been encountered. Response to hydrocarbon exposure can include impaired feeding, fertilisation, larval settlement and metamorphosis, larval and tissue death and decreased growth rates (Villanueva et al. 2008). There may be increased mortality of early life stages, particularly in coral larvae as the reproductive life stages of corals are reported to be more susceptible to hydrocarbon toxicity (Negri and Heyward 2000). Submerged reefs may be subject to contact with dispersed hydrocarbon droplets (entrained oil) introduced into the water column by wave action on surface slicks (NOAA 2010b).
Surface slicks may contact with intertidal reefs, particularly around islands pf the Pilbara region. However, based on modelling, contact with Ningaloo, Dampier Archipelago or Barrow/Montebello’s is considered low. Below a depth of 3-4 m, coral colonies associated with submerged reefs would be separated from surface slicks by the overlying waters. Thus, the likelihood of surface oil contacting submerged reefs and shoals (such as Glomar or Rankin) is low. While entrained hydrocarbons can have negative impacts on intertidal and subtidal reefs, given the distance between the potential spill locations and the closest reefs, concentrations of entrained oil is expected to be low.
Seagrasses and Macroalgae
Seagrasses are predominantly found in WA State waters, the majority in depths of up to 10 m. Limited seagrass patches are found in or adjacent to the operational area, but extensive meadows exist within Shark Bay. Macroalgae occurs predominantly in the intertidal and shallow sub-tidal waters on hard substrates throughout the islands of the Pilbara region and Shark Bay. See Section 3.4.7
Seagrasses and macroalgae could be vulnerable to oil slicks when exposed at low tide and also by providing a barrier to sunlight required for photosynthesis. Seagrass patches associated with the shallow reef habitats may also be exposed to entrained hydrocarbons and exhibit toxicity effects. Seagrass and macroalgae could be vulnerable to hydrocarbons. Diesel is not anticipated to enter Shark Bay or Exmouth Gulf. No areas within the ZPI that could potentially be impacted upon have been identified as being of particular biological importance.
Sponges Limited to hard substrate mostly in waters >10m. Known to occur in Rowley Shoals and Little Turtle Island
Small particles and emulsions (generally associated with ‘heavier’ oils) may be ingested or block the feeding mechanisms of invertebrates such as oysters, starfish, sponges and corals. These particles also may have toxic components, so the effects can be physical, chemical or both. Sponges are not expected to be affected by oil spills as they are found in submerged waters, usually at depths greater than 10m.
Mangroves The closest mangroves are located ~ 25 km from the operational area on Barrow and
The impacts of surface hydrocarbons on mangroves include damage as a result of smothering of lenticels (mangrove breathing pores) on pneumatophores or prop roots, or by the loss of leaves (defoliation) due to chemical burning. It is also known that mangroves take

TGS NWSR MC MSS - Environment Plan Summary
Rev 1 Page 99
Receptor Potential Exposure Potential Impacts
Montebello Islands and the mainland. See Section 3.4.9
up hydrocarbons from contact with leaves, roots or sediments, and it is suspected that this uptake causes defoliation through leaf damage and tree death (Wardrop et al. 1987). Entrained hydrocarbons contain contaminants that may become persistent in the sediments (e.g. trace metals, PAHs), leading to direct effects on mangroves due to direct uptake, or indirect effects due to impacts on benthic infauna and thus leading to reduced rates of bioturbation and subsequent oxygen stress on the plants root systems
Contact with hydrocarbons can have severe consequences on mangrove communities. The closest recognised mangrove communities are on Barrow and Montebello Islands and Ashburton Delta, all of which are ~ 25 km from the operational boundary. At this distance, a worst case scenario spill in summer would mean that stands could be receive diesel in ~13 hours at which time ~6% would remain on the surface
Socio-economic
Commercial fisheries & aquaculture
The operational area overlaps a number of commercial fisheries. There could be both direct and indirect impacts on these fisheries in the unlikely event of a large diesel spill occurring within the operational areas.
Surface hydrocarbons will have negligible impacts on fish (see ‘Fish’ above) but exclusion zones surrounding a spill can directly impact fisheries by restricting access for fishermen, leading to financial losses. Other impacts can occur via oiling of vessel hulls, trap gear (traps, buoys, lines) and divers POMF) if the equipment is deployed or retrieved through surface slicks. Entrained hydrocarbons can have toxic effects on fish and fish spawning (as outlined in ‘Sharks and bony fish’ above) reducing catch rates and rendering fish unsafe for consumption, leading to financial losses.
The impact of restricted access for fishermen is considered low as surface diesel slicks would only persist for periods up to ~17 hours. Entrained oil may reduce catch rates and impact on the quality of the fish caught, rendering them unfit for human consumption. The effects could be medium to long-term.
The operational area does not overlap with aquaculture facilities.
The nearest aquaculture facilities (pearl farms) are located at the Montebello Islands and Dampier Archipelago ~25 km from the operational area. The furthest a diesel spill will travel is 32 km. Effects on these islands would be minimal due to the highly dispersive nature of diesel, which dilutes toxic components to levels unlikely to cause any effect on immobile organisms.
Shipping
There are several commercial shipping routes that overlap the operational area, with a moderate to high frequency of vessel traffic (see Section 3.4.5).
Exclusion zones surrounding a spill will reduce access for vessels. Some vessels would have to take large detours leading to potential delays.
As several shipping routes overlap operational area, there are potential impacts to commercial shipping.
Petroleum industry
The operational area overlaps several FPSO and platforms and is adjacent to production facilities on Thevenard and barrow Island
Exclusion zones surrounding a spill may impact vessels trying to access petroleum infrastructure. Some vessels would have to take large detours leading to potential delays. Surface diesel itself would not affect the infrastructure.
Marine tourism and recreation
Zuytdorp Cliffs, Shark Bay, Ningaloo, Pilbara region islands, Dampier Archipelago, Glomar Shoals, Eighty Mile Beach
Exclusion zones surrounding spills will reduce access for recreational fishing and snorkelling/diving on emergent and intertidal reefs. Stranding of oil on sandy beaches or the impacts on reefs (described above) may impact some tourism activities.

TGS NWSR MC MSS - Environment Plan Summary
Rev 1 Page 100
Receptor Potential Exposure Potential Impacts
The west coast from Kalbarri to Port Hedland and including areas of Shark Bay, Ningaloo Reef and islands off the Pilbara coast are popular tourism destinations. However, as the operational area is more than 25 km from the coastline at its nearest point (35 from Ningaloo), tourism activities are unlikely to be affected as it is anticipated minimal diesel would remain on the surface by the time it reached tourist areas (~6%). Some diving charter and fishing vessels venture to the Glomar Shoals and Pilbara Islands, and if a spill was to reach these emergent areas, tourism may be affected.
Marine Parks and reserves and KEFs
Muiron Islands Marine Management Area Barrow Islands Marine Management Area Barrow Island Marine Park Montebello Islands Marine Park Glomar Shoals Ningaloo Marine Park and Muiron Island Management Area
The modelling suggest that the furthest a diesel spill may travel is 32 km and hence may overlap marine parks, reserves and KEFs. Impacts to the Glomar shoals from diesel are not expected due to the water depth at which it is situated (~25-70 m). Diesel may contact the north and western edge of the Montebello/Barrow Islands. The islands have macro-algal dominated limestone reefs, mangrove stands and sandy beached supporting turtle nesting. Water quality is generally pristine and may be affected temporarily. At ~25 km from the operational area, they will not be greatly affected as by the time the slick reaches that distance it has mostly evaporated or dispersed (<6% remaining in worst case scenario) and the toxicity levels have declined markedly.
Shark Bay WHA
Shark Bay WHA including Dorre and Dirk Hartog Islands. Turtles, Humpback whales, nesting birds, seagrass and macroalgae, fisheries, and tourism.
Diesel may contact the western edge of Dirk Hartog Island and the southern point only of Dorre Island. The northern point of Dirk Hartog island contains Cape Inscription (Heritage Place) and is a known loggerhead turtle nesting area. Shark Bay contains seagrass and macroalgal beds. Dorre Island is a recognised breeding location for the fairy tern and wedgetail shearwater. The waters of the Bay are a recognised resting ground for humpback whales. The area is important tourist area and contains Shark Bay fisheries. See Section 3.7.11.2 and 3.7.12.1. No impacts with mangroves is predicted. In a winter spill scenario, diesel may turn the northern point of Dirk Hartog Island and enter into the waters of Shark Bay. However, based on modelling this would be ~15 hours after the incident and diesel is anticipated to be at very low levels at <6% remaining on the surface. The marine environment adjacent to Shark Bay is very high energy environment in which diesel would undergo rapid dispersal. This scenario is very unlikely based on anticipated current and wind directions and that the spill would have to be directly opposite Cape Inscription. If diesel was to enter the Bay itself, limited amounts would be available to the environment, and would not be considered toxic.
Ningaloo WHA
Coral reefs, turtles, humpback whales, dugongs, whale sharks, nesting birds, seagrass and macroalgae, fisheries, and tourism.
It is not anticipated that a diesel spill will make contact with Ningaloo coast mainland but may enter the waters around it, which are part of the WHA. These waters are known BIA for humpback whales (restricted corridor), whale shark high density prey, marine turtles internesting buffers, and roseate tern, little tern and wedge-tail shearwater foraging areas. Dugongs are also know, closer to the shore in shallower waters Potential impacts on these are outlined in the sections above. Based on modelling, there would be <12% diesel remaining on the surface when it enters the waters of the WHA, with ~63% dispersed and 25% evaporated. Water quality is generally pristine and may be affected temporarily. Shallowest waters at this point are 80 m and are beyond the probable depth that surface diesel would disperse/entrain so there would be no anticipated impacts to the seabed. Entrained and dissolved diesel would likely be at non-detectable levels and the most volatile and toxic components (BTEX) would have evaporated at the surface.

TGS NWSR South MC MSS - Environment Plan Summary
Rev 1 Page 101
7. IMPLEMENTATION STRATEGY Any seismic survey carried out under the NWSR South MC MSS EP will be in accordance with the NOPSEMA- accepted EP, applicable legislation and under the framework of the TGS Environment Policy and HSE Management System. To ensure TGS’s environmental management standards and performance outcomes are achieved, all contractors will be required to comply with all relevant TGS’s HSE systems/policies and standards. A series of work instructions, procedures and plans will be used for surveys undertaken within the operational area to ensure that appropriate management measures are applied, and identified environmental impacts and risks are continually reduced to ALARP. 7.1 ONGOING MONITORING Environmental performance of all proposed surveys within the NWSR South MC MSS operational area will be reviewed in a number of ways. These reviews are undertaken to ensure that:
all significant environmental aspects of the activity are covered in the EP
that environmental management measures (including TGS’s environmental management framework) to achieve EPO and EPS are being implemented, reviewed and where necessary amended
identification of potential non-conformances and opportunities for continuous improvement
that all EPO and EPS have been met before completing the activity
that all environmental commitments contained in the Environmental Commitments Register (ECR) have been fulfilled.
The following arrangements will be established to review environmental performance of the activity:
A summary of the EPO, EPS and MC for the activity (ECR) will be distributed aboard the survey vessel(s). These will be monitored on a regular basis for each phase, by the SEA via mechanisms such as audits and inspections.
An inspection(s) of the vessels will be carried out before or during each phase of the activity to ensure that procedures and equipment for managing routine discharges and emissions are in place to ensure compliance with the EP.
An inspection(s) of the vessels will be carried out annually or with every new contractor (whichever is more frequent) to ensure that contractor HSE management systems are in accordance with all relevant requirements of TGS’s environmental management framework and HSE management system.
A test of the oil spill emergency response arrangements will be conducted during the mobilisation phase of the survey (unless a test has already been undertaken in Australian waters within a month prior to mobilisation) to ensure vessel SOPEP is current and applicable.
Any non-conformances shall be reported, tracked and closed-out in accordance with the EP. The collection of data from audits, inspections and response tests will form the basis of demonstration that the EPO and EPS are being met, that specified mitigation measures are in place to manage environmental risks, and that they remain working, and contribute to continually reducing risks and impacts to ALARP. TGS Management will review environmental performance, including the implementation strategy, upon completion of each phase of the activity. As part of each review, any new developments in the scientific understanding and knowledge of relevant impact and risks will be reviewed. The results of the review and any identified improvements or recommendations will be incorporated into processes and procedures for future surveys to help facilitate continuous improvement. 7.1.1 Pre-survey planning Prior to individual surveys, TGS shall undertake pre-survey planning that will review and consider the following at a minimum:
existing information in relation to any component of the receiving environment described in the EP
Biologically Important Areas
information from previous surveys on whale migration routes and frequency of sightings
available scientific literature
TGS NWSR South MC MSS - Environment Plan Summary
Rev 1 Page 102
new issues raised by stakeholders
Commonwealth Marine Reserves status (including any changes in status) and relevant IUCN principles
potential for cumulative impacts from past or proposed surveys (if known)
assessing the use of the lowest possible source based on the geological and geophysical objectives of each individual survey.
If new information regarding the receiving environment relevant to the NWSR South MC MSS is present, then an internal risk assessment will be conducted. If sighting data are available from previous TGS surveys, or new information regarding whale migration periods is available, the information will be used in planning the timing of individual surveys within the NWSR South MC MSS operational area. Non-conformances from audits, inspections or response testing shall be tracked and monitored until closed. TGS employees and contractors are required to report all environmental incidents and any non-conformance with an EPO or EPS detailed in the EP. An internal risk assessment will be carried out where non-conformances suggest that specified mitigation measures no longer adequately demonstrate that the activity is managed to ALARP or where new developments in the scientific understanding and knowledge of impacts and risks is present. Any inadequacies and opportunities for improvements will be amended via a Management of Change to ensure that environmental impact and risks of the activity are continually identified and reduced to a level that is ALARP and acceptable. 7.2 OIL POLLUTION EMERGENCY PLAN The OPEP for seismic surveys undertaken within the NWSR South MC MSS operational area comprises:
Survey or support vessel(s) > 400T SOPEP - deals with spills which are either contained on the vessel or which can be dealt with from / by the vessel.
Survey or support vessel(s) < 400T spill management plan - deals with spills which are either contained on the vessel or which can be dealt with from / by the vessel.
National Plan for Maritime Environmental Emergencies (NATPLAN): Australian Maritime Safety Authority (AMSA) - is the Jurisdictional Authority (JA) and Control Agency (CA) for spills from vessel which affect Commonwealth waters, i.e. outside of 3 nm from the coast (AMSA 2014).
WA State Emergency Management Plan for Marine Oil Pollution (WestPlan-MOP) and Department of Transport (DoT) Oil Spill Contingency Plan (OSCP) - deals with spills from the vessels which affect WA State waters.
7.2.1 Drills and Training A drill test of the oil spill emergency response arrangements (OPEP) will be conducted during the mobilisation phase prior to commencement of operations for a survey. A Standard Operating Procedure (SOP) for the seismic survey vessel(s) is to undertake a minimum of four scheduled drills per annum. Support vessel SOPEP/spill management plans will also be tested during the mobilisation phase as part of the OPEP. As required under 14(8C)(b), response arrangements shall be tested if they are significantly amended.
All drill tests will be recorded and reviewed after each drill as part of the ongoing monitoring and improvement of emergency control measures.
The objective of testing is to:
ensure that the vessel SOPEP is current and applicable (including contact details) for dealing with a spill specific to the nature and location associated with an individual survey conducted within the NWSR South MC MSS operational area
ensure type 1 ‘operational monitoring’ such as spill surveillance and tracking, specific to the nature and location associated with an individual survey conducted within the NWSR South MC MSS operational area, is appropriate, understood and practiced.
In compliance with Regulation 14(4) and 14(5) a designated Oil Pollution Prevention Team (OPPT) will be trained to ensure they are familiar with their tasks and the equipment in the event of an oil spill. Implementation and testing of the OPEP will enable TGS to demonstrate that environmental risks from fuel and oil spills during the proposed survey have been reduced to ALARP. 7.2.2 Initial Actions

TGS NWSR South MC MSS - Environment Plan Summary
Rev 1 Page 103
The vessel master will initiate the vessel SOPEP/ spill management plan and first strike actions as outlined within it. Due to the nature and scale of the activity, credible spill scenarios and characteristics of diesel, the preferred strategy for diesel spills will be to allow small spills to disperse and evaporate naturally, and monitor the position and trajectory of any surface slicks. Commonwealth Waters For Commonwealth waters, initial actions will be undertaken by the survey vessel(s) with subsequent actions determined in consultation with the regulatory authorities (AMSA) under NATPLAN, having regard to the potential impacts posed by the spill. AMSA is the responsible Combat Agency (CA) for oil spills from vessels within the Commonwealth jurisdiction and will respond in accordance with its Marine Pollution Response Plan as approved by the AMSA Executive. Upon notification of an incident, AMSA will assume control of the incident (AMSA 2014). State Waters If surface slicks appear likely to enter WA State waters then subsequent actions will be determined in consultation with the DoT under WestPlan–MOP and the OSCP. The DoT is the designated Hazard Management Agency (HMA) for oil spills from vessels within the WA State jurisdiction. The DoT response network is comprised of two spate units:
Maritime Environmental Emergency Response (MEER)
State Response Team (SRT).
7.2.3 Monitoring In the event of an accidental event that resulted in a diesel spill to open waters, TGS would be responsible for undertaking Type I “Operational Monitoring” that would have the primary objective of spill surveillance and tracking. This monitoring will be implemented to:
determine the extent and character of a spill
track the movement and trajectory of surface diesel slick
identify areas/ resources potentially affected by surface slicks
determine sea conditions/ other constraints. This Type I monitoring will be restricted to daylight hours only, when surface slicks will be visible from the vessel. The information gathered from this monitoring will be passed on to AMSA, via the POLREP form, but also via ongoing SITREP reports following the initial spill notification to RCC Australia. ADIOS2 spill modelling indicates that surface slicks, and possibly entrained oil, from an MGO spill of 220 m3 may contact Shark Bay World Heritage Area, Ningaloo World Heritage Area and various islands of the Pilbara coast. If this scenario occurs, TGS will work with the relevant stakeholders to develop and implement appropriate Type II “Scientific Monitoring” to understand the effects of the spill and any response activities on the marine environment. This scientific monitoring will have a focus on relevant environmental and social values and sensitive receptors. This scientific monitoring will focus on a number of key environmental and social values and sensitive receptors, including (but not limited to):
sediment and water quality, particularly for the pristine waters of the Ningaloo and Shark Bay WHA and Montebello Islands
benthic primary producer habitat (BPPH): o coral reef communities o macroalgal and seagrass communities o mangrove communities
rocky shore/intertidal reef platform communities
intertidal sand/mudflat communities
subtidal soft-bottom communities
megafauna
finfish
benthic invertebrates
commercial and recreational fishing
tourism.

TGS NWSR South MC MSS - Environment Plan Summary
Rev 1 Page 104
The scientific monitoring program will be developed to ensure that it is sufficient to inform any remediation activities, particularly with respect to shoreline environments. Long-term management key performance indicators (KPIs) exist for the Ningaloo WHA and Montebello/Barrow Islands, but not for Shark Bay WHA (CALM 1996). A full list of KPIs, values and objectives is provided within the EP and monitoring programs shall have regard for them. 7.3 ENVIRONMENT PLAN REVISION AND RESUBMISSION As required under Regulation 17 of the Environment Regulations, TGS will submit a revision of this EP to NOPSEMA if any of the following criteria are met:
The commencement of any new activity, or any significant modification, change, or new stage of an existing activity, not provided for in this EP.
The occurrence of any: o significant new environmental impact or risk o series of new environmental impacts or risks o significant increase in an existing environmental impact or risk o series of increases in existing environmental impacts or risks.
Any significant change to the receiving physical, biological or socio-economic environment within, or immediately adjacent to, the NWSR South MC MSS operational area.
The identification of any: o KEF not already described in this EP o threatened species of cetacean, marine reptile, sharks and ray-finned fish and seabirds not already
described in this EP o critical habitat/BIA for threatened species not already described in this EP, which has spatial
overlap with the NWSR South MC MSS operational area.
Internal risk assessment results during pre-survey planning suggest that the residual risk ranking for any part of the activity, has increased.
A risk assessment will be undertaken for all changes in scope to assess potential impacts of the change. If the change meets any of the criteria detailed above, a revision/resubmission of the EP will occur, and the proposed change to the activity will not commence until the revised EP has been accepted by NOPSEMA. 7.3.1 Risk Assessment Process An internal risk assessment will be carried out if:
non-conformances suggest that specified mitigation measures no longer adequately demonstrate that the activity is managed to ALARP
new developments in the scientific understanding of impacts and risks suggest that risks and impact are no longer acceptable
on receipt of any stakeholder claim or concern received before or during the activity
new information becomes available relevant to a proposed survey as a result of pre-survey planning, or
for changes to scope.
8. REPORTING ARRANGEMENTS The following reporting arrangements are in place:
MFO Final Report on the conduct of the survey, and any marine fauna sightings/interactions (including any whale-instigated shut-downs of the acoustic source) will be provided to DoE.
An annual report to NOPSEMA that will comprise a review of achievement of the EPO and EPS for that year to determine if they have been met.
Reporting of environmental incidents to NOPSEMA, according to the requirements of Regulation 26(4) of the Environment Regulations, and in accordance with NOPSEMA guidance on notification and reporting of environmental incidents
NOPSEMA will be notified of all recordable environmental incidents, according to the requirements of Regulation 26B, as soon as practicable but not later than 15 days after the end of the calendar month.
Any oil pollution incidents in WA State waters will be reported immediately to the WA Department of Transport Oil Spill Response Coordination (OSRC)

TGS NWSR South MC MSS - Environment Plan Summary
Rev 1 Page 105
Any oil pollution incidents in Commonwealth waters will be reported to AMSA
Any oil pollution incidents in port will be reported immediately to the relevant port authority 8.1 DETAILS OF TITLEHOLDER AND LIAISON PERSON As required under Regulation 15, details for TGS as both the Titleholder and nominated liaison person (the same person) are as follows: Contact: Tanya Johnstone Name: TGS Geophysical Company Pty Ltd (TGS) Business address: Ground Floor
1110 Hay Street West Perth, WA 6005
Telephone: 9480 0022 Email address: [email protected] ACN/ABN: 07 150 424
9. CONSULTATION PLAN The stakeholder consultation has, and will continue, to be undertaken in phases as described below:
Phase 1: Preparatory Consultation: o Stakeholders notified of the proposed NWSR South MC MSS polygon.
Phase 2: Pre-survey Consultation: o Stakeholders notified of individual surveys, including location within the NWSR South MC MSS
polygon, timing and duration.
Phase 3: Ongoing Consultation: o Includes complying with requests from stakeholders for additional information, survey updates,
etc.
Phase 4: Post-survey Notifications: o Includes complying with requests from stakeholders for notification of the completion of individual
surveys. 9.1 PHASE 1 - PREPARATORY CONSULTATION The following stakeholders including fisheries bodies and organisations, and State and Commonwealth government departments, were originally informed of the survey, via letters or emails sent on 5th September 2014 as part of Phase 1: Preparatory Consultation. Note that initial notification was for the larger polygon that extended into Northern Territory waters before it was separated into individual EP’s. Notifications were via mail or email.
A Raptis & Sons
Austral Fisheries
Australian Customs Services (Coastwatch)
Australian Fisheries Management Authority (AFMA)
Australian Hydrographic Service (AHS)
Australian Longline Pty Ltd & Petuna Sealord
Australian Maritime Safety Authority (AMSA)
Australian Southern Bluefin Tuna Industry Association (ASBTIA)
Border Protection Command (BPC)
Broome Fishing Club
Centre for Whale Research (CWR)
Commonwealth Fisheries Association (CFA)
Department of Defence (DoD)
Department of the Environment (DoE)
Geraldton Fishermen’s Co-operative Ltd
Geraldton Professional Fishermen’s Association (GPFA)
Kalbarri Professional Fishermen’s Association
Kimberley Professional Fishermen’s Association (KPFA)
Northern Territory Seafood Council (NTSC)
Mary Island Fishing Club (Derby)
MG Kailis Group
Northern Fishing Companies Association (NFCA)

TGS NWSR South MC MSS - Environment Plan Summary
Rev 1 Page 106
Northern Prawn Fishery (Qld) Trawl Association Inc.
Northern Territory Department of Mines and Energy
Northern Territory Department of Primary Industry and Fisheries
Northern Territory Trawler Owners Association
Northern Territory Seafood Council (NTSC)
Northern Wildcatch Seafood Australia (NWSA)
NPF Industry Pty Ltd
Pearl Producers Association (PPA)
Recfishwest
Tuna West Indian Ocean Tuna Association
United Mid West Professional Fishermen’s Association (UMWPFA)
WA Department of Fisheries (DoF)
WA Department of Mines and Petroleum (DMP)
WA Department of Transport (DoT)
Western Rock Lobster Council (WRLC)
WA Seafood Exporters
Western Australian Fishing Industry Council (WAFIC)
WestMore Seafoods. Additionally, entities or individuals currently holding licences for the following WA State-managed commercial fisheries have been contacted and informed of the proposed operations:
Abrolhos Island and Mid-West Trawl Managed Fishery (AIMWTMF)
Broome Prawn Managed Fishery (BPMF)
Gascoyne Demersal Scalefish Fishery (GDS)
Mackerel Managed Fishery (MMF)
Northern Demersal Scalefish Managed Fishery (NDSF)
Octopus Fisheries
Pilbara Fish Trawl (Interim) Managed Fishery (PTIMF)
Pilbara Trap Fishery (PTF)
Pilbara Line Fishery (PLF)
Shark Bay Blue Swimmer Crab Fishery
Shark Bay Prawn Fishery (SBPF)
Shark Bay Scallop Fishery (SBSF)
West Coast Demersal Scalefish (Interim) Managed Fishery (WCDSIMF)
West Coast Deep Sea Crustacean Managed Fishery (WCDSCF). Note that it is not possible to obtain a list of licence holders in the Pearl Oyster Managed Fishery (POMF) (including pearl farms in the Montebello Islands) from DoF as this fishery is administered under the WA Pearling Act 1990, rather than under the WA Fish Resources Management Act 1994. DoF advised that the best way to contact individual licence holders in the POMF was via the peak industry body for this fishery – the Pearl Producers Association (PPA). PPA supported this advice. Entities or individuals currently holding licences for Northern Territory managed commercial fisheries, cannot be contacted individually, and have been informed of the proposed operations via the Northern Territory Seafood Council (NTSC). 9.1.1 Phase I - Update As a result of variations to the NWSR operational area, stakeholders were sent update information on the 18th December 2014 or 9th January 2015. A further update was sent to all stakeholders on 18th November 2015 regarding the re-submission of the NWSR South MC MSS EP. Any new stakeholders identified during the process were sent ‘new stakeholder’ letters. 9.1.2 Stakeholder Responses A summary of key issues and concerns raised by stakeholders, an assessment of merit, and TGS’ response is provided in Table 9.1. Read receipts’ have been received from numerous stakeholders that were contacted via email including Recfishwest, IFAW, Customs, AFMA and various commercial fishers.

TGS NWSR South MC MSS - Environment Plan Summary
Rev 1 Page 107
Please note that the information presented is correct as the time of the EP submission to NOPSEMA for assessment. 9.2 PHASE 2 - PRE-SURVEY CONSULTATION TGS are mindful of identifying new stakeholders and of affording as long a notification period as possible in relation to proposed surveys. As such, as far in advance as possible, TGS shall notify relevant stakeholders of a potential survey that may affect their interests or activities. Unfortunately not all information (vessels, timing, duration, exact location) may be finalised months in advance; however as soon as final details are known these shall be communicated with the relevant stakeholders. Subsequently, as soon as a survey is considered likely to occur, TGS will notify relevant stakeholders with the information that is available: at a minimum the likely timeframe and location of the survey. This will give stakeholders an opportunity to identify a narrowed timeframe and location than that previously supplied as part of the EP notification and the greater NWSR South polygon. Stakeholders will be offered the opportunity for face-to face meetings at this point. As more details become available, TGS shall supply updates to relevant stakeholders. The end result, is that information may be supplied to stakeholders as part of a staged process. It is anticipated that by approximately three (3) weeks prior to commencing any survey within the NWSR South MC MSS operational area, TGS will have contacted relevant stakeholders to provide information for the proposed activity, including:
The size, location and geographical coordinates for the survey
The timing and duration
Parameters for the towed seismic array (acoustic source and streamer spread),
Details of the survey and support vessels
An offer of daily forecasts to all relevant stakeholders
Contact details of where to submit a concern
Overview of potential risks and impact At any point during this notification process, stakeholders will have a further opportunity to raise with TGS any specific concerns or issues regarding the proposed survey. These will be assessed as outlined below. 9.3 PHASE 3 – ONGOING CONSULTATION Consultation with relevant stakeholders will be ongoing while the NWSR South MC MSS EP is valid. TGS will comply with requests by stakeholders for additional information and requests for updates during individual surveys undertaken within the NWSR South MC MSS operational area. Significant changes to scope will trigger a revision of the EP. As required under sub regulation 16(b), TGS shall assess the merits of any new claims or objections made by a relevant stakeholder whereby they believe the activity may have adverse impacts upon their interest or activities. If the claim has merit, where appropriate, TGS shall modify management of the activity. The assessment will be done using the methodology outlined for the internal risk assessment. If the claim has merit, where appropriate, TGS shall modify management of the activity and notify the relevant stakeholder. If the outcome of the assessment of merit of a claim or objection received during a survey suggests that impacts and risks are new or significantly increased (if the residual risk ranking has changed) then this will trigger a revision to the EP given that under subregulation 8(1) it is an offence for a titleholder to continue if a new impact or risk, or increase in the impact or risk, is not provided for in the EP in force. Notification to stakeholders of significant new or increased risks will be issued prior to submission of the revised EP as part of a new consultation process for the revised EP. 9.3.1 Regular Updates TGS shall ensure that approximately every six (6) months all stakeholders have been provided with an update of activities associated with the NWSR South EP, including completed surveys and potential new locations for surveys (if known). As part of this process, TGS shall check that identified stakeholders are still relevant and correct, and also identify new stakeholders (via organisational bodies such as AFMA, AMSA, DoF, lessons learnt etc.). This action will ensure that stakeholders have a greater opportunity to identify areas of concern, and minimise the chances of being ‘surprised’ if a shorter timeframe for notification occurs as a result of a survey being finalised with minimum lead-in time. Stakeholders will be offered the opportunity for face-to-face meetings.

TGS NWSR South MC MSS - Environment Plan Summary
Rev 1 Page 108
Updates may be a stand-alone notice or part of a notification associated with a survey. 9.4 PHASE 4 – POST SURVEY NOTIFICATION On completion of individual surveys, notification will be sent to the relevant stakeholders or those that request post survey notification.

TGS NWSR South MC MSS - Environment Plan Summary
Rev 1 Page 109
Table 9.1 –Summary of Stakeholder Responses and Commitments
Stakeholder Consultation Stakeholder feedback TGS assessment on feedback and response
AFMA
Email 6/9/2014
Email 23/09/2014 – Recommended that TGS consult with the stakeholders associated with all the fisheries in the area. These can be identified via the Australian Marine Spatial Information System (AMSIS) website tool. They provided a link to contacts for the relevant fisheries here. AFMA also requested to be kept informed of any changes.
Fisheries stakeholder groups have been contacted.
Email 19/12/2014
Email 10/02/2014-
Apologies for delayed reply. Continue to consult with stakeholders. Please keep AFMA informed of any changes
No response required
AHO
Email 19/12/2014
Email 23/12/2014: Apologised for delay in response. Noted changes and NtoM will be issued on prior advice of survey start dates
TGS shall notify AHO prior to commencement of each individual survey
Email 18/11/2015
25/11/2015: Survey is noted. Please provide details at least three weeks prior to commencement of survey so that a temp NTM’ may be issued.
No response required
AMSA
Email 6/9/2014
8/9/2014: Request for ArcGIS shapefile.
12/9/2014: GIS files supplied to AMSA
Email 6/9/2014
26/09/2014: AMSA is concerned that such a broad area may dilute nautical safety advice for specific areas. AMSA notes that prior to commencing any survey within the extensive proposed Survey area AMSA will be provided with detailed information for the proposed activity incl the size, location and coordinates for the survey area, timing and duration, parameters for the towed seismic array (airgun array and streamer spread), and details of the survey and support vessels. At this point AMSA will have a further opportunity to raise any specific concerns or issues regarding the proposed survey. AMSA appreciates your agreement to such regular consultation during the validity of the EP. A vessel traffic plot is attached for your information. Please note that a very large volume of high net worth national and international cargo traffic will be experienced through the majority of the proposed survey area. You will also note that the operational area overlaps a number of declared, charted and highly used major shipping fairways. Given the length of tow, guard/support vessels in cooperation with each survey vessel will need to be active and maintain exceptional communications with all commercial shipping in the survey area noting there will be a considerable speed difference between commercial shipping and the survey vessel whilst the latter is conducting operations.
2/10/2014: TGS sent email to AMSA saying that the nautical advice and AIS data chart has been received. TGS will adhere to the requests outlined below and will maintain communications with AMSA throughout the duration of the NWSR MC MSS activity. TGS shall undertake the following: Notify AMSA at least 3 weeks prior to commencing activities to supply all relevant details for the proposed survey. Vessel Masters shall ensure communication protocols are implemented in alignment with minimum safety requirements with commercial vessels. Seismic vessels will display appropriate day shapes, lights and streamers, reflective tail buoys, to indicate the vessel is towing and is therefore restricted in her ability to manoeuvre. Visual and radar watches will be maintained on the bridge at all times. AMSA RCC shall be contacted to ensure Auscoast warnings are broadcast

TGS NWSR South MC MSS - Environment Plan Summary
Rev 1 Page 110
Stakeholder Consultation Stakeholder feedback TGS assessment on feedback and response
Any related avoiding action by commercial shipping, should it be necessary, should not increase and/or compound the navigational risk to other shipping in the vicinity and hence it is highly recommended, where possible, that survey lines are planned to minimise this interaction with commercial shipping. Extra caution must be exercised for the run lines that cross, and are nearly perpendicular to, the expected shipping tracks. Seismic vessels must display appropriate day shapes, lights and streamers, reflective tail buoys, to indicate the vessel is towing and is therefore restricted in her ability to manoeuvre. Visual and radar watches must be maintained on the bridge at all times. Please ensure AMSA’s RCC is contacted through [email protected] for Auscoast warning broadcasts before operations commence. AMSA’s RCC will require the vessels details and area of operation and need to be advised when the survey starts and ends. Additionally, the Australian Hydrographic Service must be contacted through [email protected] no less than 2 working weeks before the survey commences for the promulgation of related Notices to Mariners (NtM). At the conclusion of the survey, please be in touch to comment on the operations and the interaction with commercial shipping at the time of the survey (i.e. any lessons learned).
AHS shall be contacted at least 2 week prior to commencing activities to issue NtoM. TGS note AMSAs recommendation to plan surveys to minimise interaction with commercial vessels. TGS shall liaise with AMSA at the conclusion of surveys to provide feedback.
Email 19/12/2014
19/12/2014: Meredith requested updated ESRI GIS files
20/01.2015: Meredith responded with thanks and that the files were fine and that AMSA would respond during the week
20/01/2015: latest GIS files sent to Meredith, with an apology for the delay and explaining that TGS had been tweaking the final polygons
23/1/2015: Meredith Clark sent through same advice as Alec Millet as outlined below in advice on 23/12/2014.
TGS responses are as described above in relation to initial advice in 3b
23/12/2014: Alec Millett Thank you for your recent correspondence dated 19th December, 2014 that is well noted. Please find attached an updated, in terms of traffic patterns, trackplot showing the previous survey area. I understand Meredith Clarke from this office has requested a supply of the2 x TGS survey polygons in shapefile format to further refine this chartlet. Irrespective of the split in polygons, the total area, and proposed duration, is extensive and will require additional safety liaison with AMSA during the (numerous) discrete data collection phases over the duration of this survey being a consequence
TGS responses are as described above in relation to initial advice in 3b

TGS NWSR South MC MSS - Environment Plan Summary
Rev 1 Page 111
Stakeholder Consultation Stakeholder feedback TGS assessment on feedback and response
of the entire planned area being covered by a single EP. To this end, the previous correspondence of 2nd October, 2014 (*) is extant in that (inter alia):...previous email of 26/9/2014 copied into email (*) email date stated in incorrect – initial email was dated 26/9/2014.
Email 18/11/2015
30/11/2015: Thank you notifying AMSA on the EP re-submission to NOPSEMA for the North-west Shelf Renaissance South Multi-client Marine Seismic Survey. The attached file shows traffic plots for the area. It should be noted that heavy traffic will be encountered throughout the operation area due to the North-west Shipping Fairways and traffic transiting from / to South-east Asia and the West Australian Coast. The survey vessel will need to be active and maintain exceptional communications with all commercial shipping, should they be encountered, in the survey area noting there will be a considerable speed difference between commercial shipping and the survey vessel whilst the latter is conducting operations. The seismic vessel must display appropriate day shapes, lights and streamers, reflective tail buoys, to indicate the vessel is towing and is therefore restricted in her ability to manoeuvre. Visual and radar watches must be maintained on the bridge at all times. Please ensure AMSA’s Rescue Co-ordination Centre (RCC) is contacted through [email protected] for AUSCOAST warning broadcasts before operations commence. AMSA’s RCC will require the vessels details and area of operation and need to be advised when the survey starts and ends. Additionally, the Australian Hydrographic Service must be contacted through [email protected] no less than two working weeks before operations commence for the promulgation of related Notices To Mariners (NTM).
14/12/15: TGS thanked AMSA for their response and revised traffic plot and acknowledged AMSA’s note about heavy traffic encountered in the proposed operational area. TGS confirmed that every effort will be made to adhere to AMSA’s requests, particularly regarding survey communications, speed, watches and continual contact with AMSA’s Rescue Coordination Centre and Australian Hydrographic Service. TGS also reminded AMSA that prior to any survey commencing, TGS will provide detailed information about survey parameters.
Border
Protection Command
Email 6/9/2014
3/10/2014 Email: Australian Customs and Border Protection have received your EP in relation to the proposed works. In relation to the proposed plan are you able to advise; - Number of seismic vessels intended to undertake this project, - If they will be foreign vessels / crews and require importation and inwards clearance, - If the support vessels will be sourced from the domestic industry or similarly require importation, - Approximate timeframe for commencement / completion of the project. Any information you can supply us with will allow us to supply our arrival requirements for consideration in your EP.
22/01/2015 Email: TGS responded to BPC apologising for the delay in response with the following information: - It is likely only one vessel at a time will undertake each survey - It is likely the vessels will be from overseas with both foreign and domestic crew - Support vessels are probably domestic; and - the timeframe is unknown at this stage TGS stated that as soon as more details are confirmed regarding vessels to be used, origins of vessel and crew and start and finish dates for each survey, the BPC would be contacted again.

TGS NWSR South MC MSS - Environment Plan Summary
Rev 1 Page 112
Stakeholder Consultation Stakeholder feedback TGS assessment on feedback and response
Email 18/11/2015
23/11/2015: Thank you for your email. Maritime Border Command (MBC) has no comment at this point in time; however, we appreciate being kept informed of any further developments.
No response required
Cape Conservation
Group
Email 6/9/2014
11/9/2014 Email: CCG requested: Could you please send us further information on: • Survey timing in relation to migrations (north and south) or pygmy blue and humpback whales/ whale sharks and marine turtle mating/nesting/hatching • Mitigation measures you have in place for whales/ whale sharks/ dolphins and marine turtles • How you will address cumulative impacts 27/10/2014: Thank you for your response. Does this mean we do not have the opportunity to comment before approval? We would still like the opportunity to review this plan in regards to the requested items when we are able to do so. 4/11/2014: Thanks Vanessa it will be nice to review the EP prior to submission. I notice this is a very large survey and we are most interested in the section near the Ningaloo Coast World Heritage Area, including the timing for this area. Will that information be available in the EP?
15/09/2014 – TGS considers the CCG to be a stakeholder whose interest may be affected. As such, TGS assess their request as being valid and will supply the information when available and risks assessments are completed. TGS responded stating that The EP is currently being developed and that as soon as the impact assessment has been finished and mitigation measures proposed we will forward this information onto your organisation so that you can make an informed judgement. If you require anything else, please do not hesitate to let us know. 28/10/2014: TGS responded stating that once the risk assessment for the NWS Renaissance EP has been completed and the mitigation and management measures has been approved by our client TGS, we will send you the information you have requested below. Please note, due to the size of the proposed operational area it may be some weeks before this information is available. We will endeavour to provide you with the information requested prior to the EP being submitted to NOPSEMA for approval. We are also required to include all correspondence from stakeholders when we submit our EP, and we will continue to respond to any stakeholders concerns after the EP is approved as part of our ongoing consultation process. 7/11/2014: TGS responded stating that due to commercial confidentiality they are unable to pass on the full EP, however a summary will be available on the NOPSEMA website. Furthermore, TGS shall contact CGG closer to the date of undertaking the survey with greater details. 22/1/2015: TGS responded to these queries along with those of the 7/1/2015. See below for response overview

TGS NWSR South MC MSS - Environment Plan Summary
Rev 1 Page 113
Stakeholder Consultation Stakeholder feedback TGS assessment on feedback and response
Email 19/12/2014
7/1/2014:Thank-you for notification about your proposed North West Shelf Renaissance MC MSS. Cape Conservation Group Inc (CCG) holds great interest in this activity. We have some further questions; 1. How will you will take into account the migration of protected species such as the Humpback and Pygmy Blue whales? 2. What actions will be taken in regards to assessing potential cumulative impacts? 3. Will there be any access to the North West Cape? 4. Have you consulted the Ningaloo Coast World Heritage Advisory Committee? I'm currently not in Exmouth and am using my work email - please use this email until further notice. 20/01/2015: CCG clarified that their request was regarding if vessels would be accessing Exmouth Gulf
TGS considers the CCG to be a stakeholder whose interest may be affected. As such, TGS assess their request as being valid and will supply the information when available and risks assessments are completed. This information was not previously supplied (in relation to Sept/Oct request as the project was placed on hold for an extended period. 12/01/2015: Hi Jacqueline, Thank you for your email regarding the proposed NWSR seismic survey. We are currently working with TGS do develop a response for your queries, but I was wondering if you could please clarify further question 3: 'Will there be any access to the North West Cape?' 20/01/2015: TGS replied saying thanks for clarification and formal response will be coming soon. 22/01/2015: The TGS reply addresses Jack Hines queries from both 11/9/2014 and 7/1/2014. TGS replied to CCG stating that they utilised various sources of information to ascertain the diversity, distribution, abundance, seasonality, nesting etc. of cetaceans, whale sharks and turtles. This information is then utilised to plan activities in such a way as to minimise potential risks or impacts to the receiving environment, including humpback and pygmy blue whales as well as whale sharks and marine turtles. TGS shall as far as practicable plan surveys to avoid sensitivities and utilise EPBC policy part A at all times and certain part B where applicable. Similar mitigation measures shall be employed for other marine fauna such as whale sharks, marine turtles and dolphins. TGS have assessed potential cumulative impacts by:
Reviewing seismic operations to occur in the region
Reviewing available scientific information and modelling
Reviewing TGS modelling undertaken to assess cumulative impacts in the Great Australian Bight.

TGS NWSR South MC MSS - Environment Plan Summary
Rev 1 Page 114
Stakeholder Consultation Stakeholder feedback TGS assessment on feedback and response
There will be no access to the WHA or the waters within Exmouth Gulf and that all crew changes and refuelling will happen in port or commonwealth waters. TGS have not consulted with the Ningaloo Coast WH Advisory Committee as activities are at least 20 km away from the boundary of the WHA. TGS apologised for the delay in response to the first request of information, but the plan had been put on hold while the survey parameters were finalised, and that hopefully this reply covered both queries.
PPA Email
6/9/2014
Letter 17/09/2014 via Brett McCallum – Acknowledged receipt of the NWS Renaissance MC MSS EP stakeholder letter. PPA advised TGS that the region off Eighty Mile Beach is the last remaining sustainable commercial pearl oyster fishery in the world and there are no alternatives for the industry to rely on should the stocks off Eighty Mile Beach prove unreliable. PPA’s view is that operational arrangements can be agreed between the two industries to manage potential impacts of seismic surveys on pearl oyster fishing activities and divers. PPA concerns expressed in the correspondence are as follows: •the impact of seismic survey activity on pearl oyster stocks, especially the larvae phase, recruitment to the fishery and the quality of the pearl oysters post seismic activity as pearl oyster stocks that feed the fishery may exist out to the 100m depth contour and maybe beyond; •Minimising interaction between seismic survey activity and diving activities which are contained to 35m for safety requirements; •That there is a lack of information regarding the effects of seismic activity on the different stages of pearls, and that although this has been acknowledged by other seismic operators their EPs cannot provide information that resolves the concerns. •concern in relation to the lack of survey data and research studies to assess seabed habitat in the deeper water areas offshore from Eighty Mile Beach for pearl oyster dependence, plus research studies to provide a better understanding of the impact of seismic airgun noise on pearl oysters, their eggs, larvae and the associated food web, particularly given the increasing offshore petroleum industry activity in the region. PPA informed TGS that there was a recent meeting held in Perth to progress a cooperative approach to the research attended by industry, DoF, APPEA and scientists who agreed that the published science ‘left a lot to be desired’. PPA
TGS Recognises PPA as a relevant person and their concerns. *NB initial NWSR polygon covered the entire NWS and so the waters off 80 mile beach. This area was subsequently excised and covered under a different EP – NWSR South MC MSS EP. Information below is copied from that EP TGS Response: Email has been sent (29/09/2014) requesting meeting with PPA to discuss. No response from PPA. TGS Response: Telephoned (01/10/2014) to organise meeting with Brett McCullum but he was unavailable to speak. Meeting held with PPA 6/09/2014. Meeting discussed the region in general but focussed on activities adjacent to Eighty Mile Beach, which is covered under a separate EP.

TGS NWSR South MC MSS - Environment Plan Summary
Rev 1 Page 115
Stakeholder Consultation Stakeholder feedback TGS assessment on feedback and response
appreciates all efforts but notes that the research is still outstanding whole at the same time seismic surveys continue at the risk of the pearling industry. PPA cannot support the proposal.
Email 03/10/2014: PPA responded that they were keen to meet regarding the seismic survey
Meeting organised and held with PPA on 6/10/2014
Minutes of meeting
Email 13/10/2014: PPA had comments/corrections on minutes Minutes were altered accordingly and emailed back to PPA and TGS.
Meeting
06/10/2014: meeting held with PPA, TGS and Scope. BM comments as follows:
Eighty Mile beach is critical for pearl oyster fishery and one of the last remaining fishing areas in the world. They supply pearls and mother of pearls worldwide.
Main concern is that there is a lack of scientific evidence either supporting or refuting the impacts of seismic on oyster pearls.
Concedes that there may be no affect but the risk is too high and the scientific data is not available.
Has been campaigning for over a year to get APPEA, IAGC and fishing community to instigate a scientific review of existing data to come up with common and acceptable pool of knowledge, and identify gaps that require further research. No action yet and is a slow moving process.
PPA wish O&G industry to take responsibility for the research since it is they who must prove it is an acceptable impact.
PPA are only just starting to get a say in the O&G process since the NOPSEMA regime has taken over.
Provided information on diving times and locations
PPA preferred position is that all seismic activity stops at the 100m mark and requested that TGS limit their survey to this point.
At this stage all times are sensitive as, due to the lack of scientific knowledge, no one is sure what can be affected by seismic.
Currently diving activities to 35m and TGS want to go to 30m.
BM confident that logistics can be worked out so the seismic can work around the diving.
Paspaley are the only group diving and they are there only 2 week of the month on the neap tides.
Vessel master can work out what times the divers will be there and seismic operations can look at occurring in the non-neap periods.
BM provided contact details for Paspaley so TGS can liaise directly with him closer to the time to work out dates and timing.
BM suggests that TGS write to PPA with a formal request and then they will, in the first instance, liaise with Paspaley.
TGS considered PPA objection and subsequently decreased the size of the polygon and committed to using 2D only in certain areas to minimise intensity. Seismic acquisition will only occur to 50 m contour in waters adjacent to Eighty Mile Beach New polygon and maps produced. TGS recognise there is a paucity of information, but based on available literature, believe significant impacts would only occur within very short distances -TGS supplied PPA with references to studies of impacts on bivalves. TGS will liaise PPA and Paspaley pearls to coordinate activities to ensure diver safety

TGS NWSR South MC MSS - Environment Plan Summary
Rev 1 Page 116
Stakeholder Consultation Stakeholder feedback TGS assessment on feedback and response
PPA can’t respond to some suggested alternatives provided by TGS but, are keen to see all options.
Letter 22/10/2014
Email and letter 02/11/2014: Response to updated polygon.
PPA note that TGS considered the PPA request to limit activity to waters deeper than 100m, TGS to survey in waters mostly deeper than 50m, and that TGS acknowledge there is a paucity of information. PPA appreciates the efforts, but research data remains outstanding.
PPA of the view that the risk to the industry remains high and unacceptable
PPA will continue to express to NOPSEMA and public their concerns.
PPA cannot support the proposal PPA notified TGS of new CEO for PPA – Aaron Irving
TGS note the continued concern of the PPA. TGS will maintain ongoing consultation with the PPA. Contact details updated to reflect Aaron Irving as new CEO 12/1/2015: TGS responded to PPA stating that although TGS stand by the scientific data presented in previous correspondence which indicates that beyond the immediate vicinity seismic activity has minimal effect on pearl oysters, as a result of discussions with the PPA and prospective clients, TGS shall not undertake seismic acquisition within waters in the < 100m bathymetry contour in zone 2 off eighty mile beach. 11/2/2015: TGS advised PPA that seismic off 80 mile beach
would again be the subject of an EP and included into NWSR
South EP. NO RESPONSE RECEIVED
20/7/2015: TGS advised PPA that seismic activities would NOT be occurring off 80 mile beach and is no longer included in NWSR South EP. NO RESPONSE RECEIVED
Email 18/11/2015
24/11/2015: Would you be able to provide information that would provide a better idea of where your proposed seismic operations will be situated? It is difficult for the PPA to gauge the nature and extent of seismic impacts on Pearling operations and pearling resources, with a spatial depiction of an operational area that covers a multitude of acreages over an area in the vicinity of ~1000s km2 (Geraldton to 80MB).
30/11/2015: TGS acknowledged that the information provided at this early stage is a high-level overview of the proposed activities. Prior to commencing any individual survey, TGS reminded PPA that more information will be provided for the proposed activity, including the size, location and geographical coordinates for the survey area, timing and duration, parameters for the towed seismic array (acoustic source array and streamer spread), and details of the survey and support vessels. Stakeholder consultation will be on-going, and as such, there will be further opportunities to raise with TGS any specific concerns or issues that PPA may have regarding a proposed survey.
28/1/2016: TGS recognised that previous information may not have been sufficient for the PPA to make an informed decision and so provided further information. TGS provided

TGS NWSR South MC MSS - Environment Plan Summary
Rev 1 Page 117
Stakeholder Consultation Stakeholder feedback TGS assessment on feedback and response
clarity on the location of the operational area, minimum water depths and their understanding of current pearling operations and that they believe it will not physically impact on PPA activities. TGS also provided further information (which has all been previously supplied in earlier correspondence) on current understanding of oyster recruitment processes and that based on the evidence that surveys will have limited impact on pearling operations or spawning. TGS once again stated that they are willing to have face-to-face meetings
Dept of Defence
Email 6/9/2014
14/11/2014 Email: Defence has reviewed the information relating to the North West Shelf Renaissance Multiclient Environment Plan and has no objection. Defence advises that the area under consideration is located within Darwin Air Weapons Range (R225 and R228) within the Northern Australian Exercise Area, Curtin Air Weapons Range (R811) offshore Derby, and Learmonth Air Weapons Range (R861) offshore Exmouth. Defence requires a minimum of 14 days notification should any aviation activities be contemplated. Notification will need to be provided to the Joint Airspace Control Cell, which can be contacted on 1800 652 222, or [email protected] Defence wishes to remind TGS at this point that unexploded ordnance (UXO) may be present on and in the sea floor in the area that the proposed activities will be undertaken. TGS must, therefore, inform itself as to the risks associated with conducting survey activities in the area (for example, the detonation of UXO). Additionally, TGS is advised that: • all exploration activities in the area are conducted at its own risk; and • the Commonwealth of Australia, represented by the Department of Defence, takes no responsibility for: o reporting the location and type of UXO that may be in the areas; o identifying or removing any UXO from these areas; and o any loss or damage suffered or incurred by TGS or any third party arising out of, or directly related to, UXO in the area. The Australian Hydrographic Service (AHS) will require advanced notification of any seismic surveys and infrastructure developments. This information will need to be furnished to AHS with a minimum of three weeks’ notice prior to actual
TGS note that in relation to the NWSR South MSS that the polygon overlaps the Learmonth Air Weapons Range (R861) offshore Exmouth only. TGS shall notify the DoD at least 14 days prior to any aviation activities commencing in the area that may overlap the airspace TGS note that UXO may be present in the area and have made themselves aware of the risks. The AHS shall be contacted at least 3 weeks prior to commencing activities for each survey.

TGS NWSR South MC MSS - Environment Plan Summary
Rev 1 Page 118
Stakeholder Consultation Stakeholder feedback TGS assessment on feedback and response
commencement. This information is critical to maritime safety, and should be provided to reduce negative impacts on other maritime users. The AHS can be contacted directly through the Manager Nautical Assessment and Maintenance, Mr Mark Bolger, on (02) 4223 6590 and/or at the address listed on the website, http://www.hydro.gov.au/aboutus/contact.htm.
Email 19/12/2014
4/1/2015 Email: Please be advised your email was received and forwarded for action/response as required.
No response required
28/01/2015: Email: Defence advises there is no change from advice given on 14/11/2014
No response required
3/02/2015: Email - Further to my email of 28 January, we have just received additional information relating to Defence operations in the area of the proposed marine seismic survey. This email should be considered Defence's response and the previous email disregarded. I apologise for any inconvenience this change may cause. Due to the timing and location of the proposed marine seismic survey it is likely it will coincide with a major Defence exercise scheduled during July 2015. This exercise will include a large number of Naval vessels in the area covered by the northern polygon. Activities may include live firings (both surface and air), sonar operations and personnel recovery exercises. There is limited scope to adjust the proposed exercise plan, due to the extended planning lead times associated and the limited window for execution. Local deconfliction may be possible but is likely to be problematic given the number of US and Australian vessels and aircraft participating. Any issues may be mitigated by you avoiding the area during the exercise. It is noted that the cross over between the proposed start time of the survey and the Defence exercise is limited. Other exercises will also occur in this area over the proposed time frame for the survey. The scope and scale of these exercises is not yet
known.
Advice related to Northern polygon and is not in the scope of this EP. TGS responded requesting further details on exact areas being overlapped.
TGS shall ensure dates of possible conflict are noted within the EP and the areas shall be avoided. Defence shall be notified/contacted prior to commencing activities to check for possible changes/updates to their exercises.
IFAW
Email 6/9/2014
2/10/2014 Email: requested GIS files 2/10/2014: GIS files forwarded to IFAW
Email 11/18/2015
23/11/2015: Without more specific information about timescales, particularly when operations will be taking place in specific locations, it is impossible for IFAW to give feedback regarding the potential impact in our interest in seeing marine life protected from impacts of seismic exploration. The likelihood and scale of impact will likely vary significantly for different species depending on timing and location. Therefore, until such time as that information is provided, IFAW does not consider that we have been provided sufficient information as required by the Environment Regulations. IFAW does not consider provision of such information after the submission of an EP to NOPSEMA to be adequate. Such details should be available
24/11/2015: TGS informed IFAW that the EP is still being prepared and has not been submitted to NOPSEMA for assessment. TGS also provided a high-level overview of the proposed activities and reminded IFAW that prior to commencing any individual survey within the operational area, TGS will contact IFAW again with detailed information for the proposed activity, including the size, location and geographical coordinates for the survey area, timing and duration, parameters for the towed seismic array (acoustic

TGS NWSR South MC MSS - Environment Plan Summary
Rev 1 Page 119
Stakeholder Consultation Stakeholder feedback TGS assessment on feedback and response
before an EP is submitted for assessment. At this time, I do not consider it a good use of IFAW’s resources to attempt to provide feedback without that information.
source and streamer spread), as well as details of the survey and support vessels.
1/12/2015: Thanks Michelle, IFAW is grateful to TGS for the high-level overview. However as stated previously, IFAW does not consider it acceptable for details of individual surveys, including details such as timing and duration to only be determined and provided to stakeholders after an EP has been accepted. Providing details after an EP has been accepted is in no way commensurate to ensuring these details and any feedback related to them can be fully considered in the assessment process by NOPSEMA. Therefore IFAW is not satisfied with the response from TGS and will remain of the opinion that we have not been provided sufficient information until such a time as those details can be provided.
28/1/2016: TGS recognise that earlier information may not have been adequate for the stakeholder to make an informed decision and so supplied further information. TGS stated that as timings and locations of megafauna migrations etc. are well documented and supported by evidence, that it was possible to undertake a comprehensive risk assessment to cater for all possible scenarios. TGS provided a copy of the proposed mitigation measures that showed physical and temporal exclusions and management measures. TGS stated that once the EP was accepted and control measures finalised, IFAW would be notified. Again, TGS offered to meet with IFAW.
Recfishwest Email
6/9/2014 Email 6/9/2014 – an out of office response No response required
Dept of Fisheries
(DoF)
Online submission 5/9/2014
Automated response received stating that our Unique identifier was 50 and a response will be processed usually within 10 days. No further information was received from DoF
No response required
Email 19/12/2014
Email 22/12/2014: Please be advised that the Department has an online submission form for Seismic Survey proposals: http://www.fish.wa.gov.au/Sustainability-and-Environment/Aquatic-Biodiversity/Pages/Environmental-Assessment.aspx. Please resubmit through this form.
TGS resubmitted request via online submissions portal
Letter 7/1/2015: DoF can only provide advice 6 months in advance. Size and shape of polygon is too large to DoF to assess impacts. Further refinement is required including start and finish dates and spatial extents of individual surveys. DoF cannot support the current proposal and wish NOPSEMA to be made aware of the stance. They will provide targeted advice when the scope is refined.
TGS shall comply with this request and supply greater detail as soon as available.
Email 18/11/2015
9/12/2015: Thank you for your submission number 101 dated 19 November 2015 requesting comments on the proposed North West Shelf Renaissance South Multiclient Marine Seismic Survey to be undertaken between 01 January 2016 and 01 January 2021. The Department of Fisheries (Department) considers itself a ‘relevant person’ for the proposed activity, and therefore provides the following advice. Fish and fishers are regularly impacts by environmental, social and commercial drivers, and this can result in significant changes to the fishing industry over relatively short
15/12/15: TGS acknowledged the Department’s concerns regarding the proposed activities and informed that individual surveys will not be determined until after EP acceptance. TGS also informed the Department that prior to commencing a survey, TGS will contact the Department again and provide detailed information about the survey parameters. As stakeholder consultation will be on-going,

TGS NWSR South MC MSS - Environment Plan Summary
Rev 1 Page 120
Stakeholder Consultation Stakeholder feedback TGS assessment on feedback and response
timescales. For this reason the Department’s policy is to only provide detailed advice on petroleum activities commencing within six months. In most circumstances where the spatial and temporal extent of seismic surveys is not explicit, the Department provides some general information to proponents, including potentially affected fishers and key spawning species. This approach recognised the need for certainty and forward planning in the oil and gas industry, and allows for the Environment Plan (EP) to be submitted with regard for genuine logistical constraints that can limit petroleum activities, and particularly seismic surveys. However, in this instance the Department does not believe that TGS have provided sufficient information to allow us to assess the potential impacts of the North West Shelf Renaissance South Multiclient Marine Seismic Survey proposal on Department or stakeholder interests, functions or activities. The spatial and temporal scope of this proposal is too large and the Department is unable to provide any meaningful advice. Further refinement of the proposal to include start and finish dates and confirmed spatial extent for each individual component of the overall activity will allow the Department and its stakeholders to provide appropriate advice. Accordingly, the Department cannot support the current proposal and requests that this position is communicated to the regulator (National Offshore Petroleum Safety and Environmental Management Authority – NOSPEMA). The regulator should also be advised that the Department and its stakeholders will provide targeted advice and comment as we have for previous seismic survey proposals as the scope of this proposal is further refined. For information on our consultation requirements please refer to our guidance statement “Guidance statement on undertaking seismic surveys in Western Australian waters” available from the Department’s website at http://www.fish.wa.gov.au/Sustainability-and-Environment/Aquatic-Biodiversity/Pages/Environmental-Assessment.aspx.
TGS welcomed opportunities for the Department to provide advice or comments to TGS.
DMP Email
6/9/2014
19/9/2014 Email: DMP notes that this EP will be assessed under OPGGSA. DMP acknowledges that prior to commencing any survey, TGS will provide activity specific details to relevant stakeholders for review. DMP requests that future correspondence is sent to the Petroleum Environment Branch email address: [email protected] in accordance with DMP’s Consultation Guidance Note. DMP will provide feedback when activity specific details are received for each survey, however as a general comment, DMP recommends that TGS consider key periods of biological significance when planning the timing of surveys and where possible plan the timing to minimise environmental impacts.
TGS shall ensure that future correspondence is sent to [email protected] TGS shall send through survey specific details to DMP at least 3 weeks prior to activities commencing. TGS acknowledges DMPs request to consider biological sensitivities when planning surveys.

TGS NWSR South MC MSS - Environment Plan Summary
Rev 1 Page 121
Stakeholder Consultation Stakeholder feedback TGS assessment on feedback and response
DoT
Email 6/9/2014
8/9/2014 Email: received with thanks No response required
Email 19/1/2015
15/01/2015 Email: DoT requested confirmation as to whether survey work is to be undertaken in State waters? If so they may need to issue temporary notice to mariners.
15/01/2015: TGS responded stating that no activities would occur in state water, however a diesel spill could. Requested whether DoT want to be part of the OPEP process or whether seismic was still considered a low concern. No response to date.
15/01/2015 27/01/2015: DoT responded with thanks for the update and to please keep them involved in the OPEP process
TGS shall send a copy of the final OPEP to DoT
Email 18/11/2015
23/11/2015: Thank you for your email below and attached correspondence. Please accept this email and receipt of the correspondence described below.
No response required
Western Rock Lobster
Council
Email 6/9/2014
Email 6/9/2014: out of office reply No response required.
DoE Email
6/9/2014 Email 6/9/2014: Stated that DoE are no longer a relevant agency to contact anymore No response required.
Chaceon Pty Ltd
Email 18/11/2015
19/11/2015: In regard to your notification yes it will affect our fishing operations based out of Carnarvon ranging from Exmouth in the north to Kalbarri in the south. We have fixed fishing gear with surface floats following the shelf contours from depths of 600 meters to 900 meters in depth. Apart from fouling both our operations we are concerned with the affect acoustic pinging will have on the deep sea crabs we catch. We would request consultation before any of this goes ahead.
24/11/2015: TGS acknowledged Chaceon’s request for further consultation prior to the commencement of any activities within the NWSR South polygon, as well as their concerns that the activity could potentially impact their fishing activities. TGS informed Chaceon that the EP is still being prepared and has not been submitted to NOPSEMA for assessment. TGS acknowledged that the information provided is a high-level overview of the proposed activities. Furthermore, prior to commencing any individual survey within the NWSR South MC MSS polygon, TGS will contact Chaceon again and provide detailed information for the proposed activity. Stakeholder consultation will be on-going, and as such, there will be further opportunities for Chaceon to raise with TGS any specific concerns or issues regarding a proposed survey. TGS also noted Chaceon’s concerns regarding the impacts of the acoustic source on the deep sea crustaceans. Once the EP is finalised, TGS may provide Chaceon with a summary of the risk assessment undertaken on the impacts of the acoustic source on benthic organisms. TGS are happy to

TGS NWSR South MC MSS - Environment Plan Summary
Rev 1 Page 122
Stakeholder Consultation Stakeholder feedback TGS assessment on feedback and response
provide further information and is also available for face-to-face meetings.
28/1/2015: Although TGS believe they addressed Chaceons query adequately and committed to contacting them prior to activities commencing, further correspondence was sent to provide greater information. TGS stated they would make every effort to avoid their pots and that regular communications would be undertaken. TGS requested if Chaceon could supply contacts and time intervals for updates. In relation to noise impacts, TGS provided details of studies that looked at impacts of noise on decapods. TGS offered to have face-to-face meetings.
Fat Marine Pty Ltd
Email 18/11/2015
20/11/2015: These planned activities will definitely have substantial adverse impacts upon Fat Marine's commercial operations and therefore affect all the livelihoods involved in Fat Marine's operations
30/11/2015: TGS thanked Fat Marine for their response to the stakeholder update letter and advised that prior to commencing any individual survey, TGS will contact Fat Marine to provide detailed information for the proposed activity. Stakeholder consultation will be on-going, and as such, there will be further opportunities to raise with TGS any specific concerns or issues regarding a proposed survey. TGS acknowledged Fat Marine’s claim that the proposed seismic surveys may potentially have an adverse impact on Fat Marine’s commercial operations. TGS assured Fat Marine that they have made every effort to reduce potential impacts to commercial fisheries to as low as reasonably practicable. Furthermore, for TGS to adequately assess the merits of Fat Marine’s claims, TGS requested that Fat Marine please provide specific details of their concerns and issues regarding the individual surveys within the NWSR South MC MSS operational area. No response received

TGS NWSR South MC MSS - Environment Plan Summary
Rev 1 Page 123
10. REFERENCES AMSA (2003a). Oil Spill Management Handbook. Australian Maritime Safety Authority, Canberra. 115 pp. AMSA (2003b). Oil Spill Management Background Paper. Australian Maritime Safety Authority, Canberra. 31 pp. AMSA (2012). Advisory Note for Offshore Petroleum Industry Consultation With Respect to Oil Spill Contingency
Plans. Australian Maritime Safety Authority, Canberra. 4 pp. AMSA (2013). Map Products, Shipping Fairways. Australian Government Maritime Safety Authority. Australia.
Accessed September 2014. https://www.operations.amsa.gov.au/Spatial/DataServices/MapProduct AMSA (2014). National Plan for Maritime Environmental Emergencies. Australian Maritime Safety Authority.
Australian Government. Canberra. Australia. http://www.amsa.gov.au/forms-and-publications/Publications/national_plan.pdf AMSIS (2014). Australian Marine Spatial Information System, Australian Maritime Boundaries Map. Geosciences
Australia. Accessed December 2014. http://www.ga.gov.au/imf-amsis2/MaritimeBoundaries/ Andriguetto-Filho, JM, Ostrensky, A, Pie, MR, Silva, UA, and Boeger, WA (2005). Evaluating the impact of seismic
prospecting on artisanal shrimp fisheries. Continental Shelf Research, 25(14): 1720-1727. APPEA (2003). APPEA Principles of Conduct. APPEA, the voice of Australia’s oil and gas industry. Canberra,
Australia. http://www.appea.com.au/about-appea/principles-of-conduct/ Baker C, Potter A, Tran M & Heap AD (2008). Sedimentology and Geomorphology of the North West Marine
Region of Australia, GeoScience Australia, Canberra. Bamford, M., Watkins, D., Bancroft, W., Tischler, G. and Wahl, J. (2008). Migratory Shorebirds of the East Asian
– Australasian Flyway: population estimates and internationally important sites. Wetlands International – Oceania. Canberra, Australia.
Bannister JL and Hedley SL (2001). Southern hemisphere Group IV Humpback whales: their status from recent aerial survey. Memoirs of the Queensland Museum, 47 (2): 587-598.
Bannister JL, Kemper CM and Warneke RM (1996). The Action Plan for Australian Cetaceans. Wildlife Australia, Endangered Species Program, Project No. 380. Australian Nature Conservation Agency, Canberra, Australia. 272 pp.
http://www.environment.gov.au/coasts/publications/cetaceans-action-plan/pubs/whaleplan.pdf Brand, AR, Wilson, UAW 1996. Seismic Surveys and Scallop Fisheries. Unpublished Report on the Impact of a
Seismic Survey on the 1994 Isle of Man Queen Scallop Fishery. Port Erin Marine Laboratory, University of Liverpool, Port Erin, Isle of Man.
Brewer DT, Lyne V, Skewes TD and Rothlisberg P (2007). Trophic Systems of the North West Marine Region. Report to Department of the Environment and Water Resources. CSIRO Cleveland. 156 pp.
http://www.environment.gov.au/coasts/mbp/publications/north-west/pubs/nw-trophicsystems.pdf BOEM (2014). Proposed Geological and Geophysical Activities, Mid-Atlantic and South Planning Areas, Final
Programmatic Environmental Impact Statement. U.S. Department of the Interior Bureau of Ocean Energy Management Gulf of Mexico OCS Region. New Orleans.
BoM (2014). Climate Averages. Internet database accessed at http://www.bom.gov.au. Bureau of Meteorology. http://www.bom.gov.au/cyclone/history/wa/pthed.shtml
CALM (1996). Shark Bay Reserves Management Plan 1996-2006. Management Plan 34. Dept Conservation and Land Management. 114pp.
CALM (2005). Management Plan for the Ningaloo Marine Park and Muiron Islands Marine Management Area 2005-2015. Management Plan 52. Dept Conservation and Land Management. 115pp.
CALM 2005a. Indicative Management Plan for the Proposed Dampier Archipelago Marine Park and Cape Preston Marine Management Area. Department of Conservation and Land Management and Marine Parks and Reserves Authority, Perth, Western Australia
CSAS Canadian Science Advisory Secretariat (2006). Effects of Seismic Energy on Fish: A Literature Review. Research Document 2006/092. Department of Fisheries and Oceans. 72 pp.
Casper BC, Popper AN, Matthews F, Carlson TJ, Halvorsen MB (2012) Recovery of barotrauma injuries in Chinook salmon, Oncorhynchus tshawytscha from exposure to pile driving sound. PLoS ONE 7(6):e39593. doi: 10.1371/journal.pone.0039593

TGS NWSR South MC MSS - Environment Plan Summary
Rev 1 Page 124
Casper BM, Halvorsen MB, Matthews F, Carlson TJ, Popper AN (2013) Recovery of Barotrauma Injuries Resulting from Exposure to Pile Driving Sound in Two Sizes of Hybrid Striped Bass. PLoS ONE 8(9): e73844. doi:10.1371/journal.pone.0073844
Chevron Australia (2008). Gorgon Gas Development Revised and Expanded Proposal Public Environmental Review. Chevron Australia, Perth, Western Australia.
Chevron (2010). Draft Environmental Impact Statement/ Environmental Review and the Management Programme for the Proposed Wheatstone Project. Technical Appendices N3 to N10. (541pp
Chidlow J, Gaughan D and McAuley RB (2006) Identification of Western Australian Grey Nurse Shark aggregation sites. Final report to the Australian Government, Department of the Environment and Heritage. Fisheries research report No. 155. Department of Fisheries, Western Australia, 48p.
Chittleborough RG (1965). Dynamics of two populations of the humpback whale, Megaptera novaengliae (Borowski). Australian Journal of Marine Freshwater Research 16: 33–128.
Christian JR, Mathieu A, Thompson DH, White D, and Buchanan R (2003). Effect of Seismic Energy on Snow Crab (Chionoecetes opilio). Report No. SA694 to the Canadian National Energy Board (Calgary, Alberta) by LGL Ltd (King City, Ontario) and Oceans Ltd (St John's, Newfoundland). 106 pp.
http://dsp-psd.psc.gc.ca/Collection/NE23-122-2003E.pdf Cogger HG (1975) Sea Snakes of Australia and New Guinea. In: WA Dunson (ed) The Biology of Sea Snakes.
University Park Press, Baltimore. pp.59-139. Colman J (1997). Whale Shark Interaction Management with Particular Reference to Ningaloo Marine Park, –
1997 - 2007. Western Australian Wildlife Management Program No.27. WA Department of Conservation and Land Management (CALM). Perth.
Commonwealth of Australia (2009). National Biofouling Management Guidance for the Petroleum Production and Exploration Industry. National System for the Prevention and Management of Marine Pest Incursions. Commonwealth of Australia, April 2009. 60 pp.
http://www.marinepests.gov.au/__data/assets/pdf_file/0009/1120131/Biofouling_guidance_petroleum.pdf
Condie, S.A., Mansbridge, J.V., Hart, A. M. and Andrewartha, J.R. (2006) Transport and recruitment of silver-lip pearl oyster larvae on Australia’s North West shelf. Journal of Shellfish Research, Vol. 25, No. 1, 179–185. 8pp.
Crone, TJ, Tolstoy, M and H Carton (2014). Estimating shallow water sound power levels and mitigation radii for the
R/V Marcus G. Langseth using an 8 km long MCS streamer. Geochemistry, Geophysics, Geosystems, 15: 3793–3807.
Cronin, LE, Tiller, RE, Hammer, RC, Olson, RM, Beaven, GF, and Coker, CM (eds.) 1948. Effects of underwater explosions on oysters, crabs and fish: a preliminary report. Publication No. 70, Chesapeake Biological Laboratory, Solomons Island, Maryland. 43 pp.
Dalen J and Knutsen GM (1986). Scaring effects in fish and harmful effects on egg, larvae and fry by offshore seismic. In: Merklinger, HM (ed.), Progress in Underwater Acoustics, Ass. Symposium on Underwater Acoustics, Halifax, Nova Scotia (1986). Plenum Publishing Corporation, New York.
DAFF (2013). Australian Ballast Water Management Requirements. Version 5 – September 2013. Commonwealth Department of Agriculture. 13 pp.
DEC (2007). Management Plan for the Montebello/Barrow Islands Marine Conservation Reserves 2007-2017. Management Plan No 56. WA Department of Environment and Conservation. 135 pp.
DEC (2011). Proposed Eighty Mile Beach Marine Park, Indicative Management Plan 2011. WA Department of Environment and Conservation. 95 pp.
DEH (2005a). Whale Shark (Rhincodon typus) Recovery Plan Issues Paper. Commonwealth Department of Environment and Heritage. 26 pp.
DEH (2005b). Australian National Guidelines for Whale and Dolphin Watching. Commonwealth Department of the Environment, Water, Heritage and the Arts. 20 pp.
http://www.environment.gov.au/coasts/publications/pubs/whale-watching-guidelines-2005.pdf DEH (2005c) Blue, Fin and Sei Whale Recovery Plan 2005 - 2010. Department of the Environment and Heritage.
Canberra. DEH (2005d) Humpback Whale Recovery Plan 2005 - 2010. Department of the Environment and Heritage.
Canberra.

TGS NWSR South MC MSS - Environment Plan Summary
Rev 1 Page 125
DEWHA (2007). A Characterisation of the Marine Environment of the North-west Marine Region - A summary of an expert workshop convened in Perth, Western Australia, 5-6 September 2007. Prepared by the North-west Marine Bioregional Planning section, Marine and Biodiversity Division, Department of the Environment, Water, Heritage and the Arts. 47 pp.
http://www.environment.gov.au/coasts/mbp/publications/north-west/pubs/characterisation-workshop-report.pdf
DEWHA (2008a). The North-west Marine Bioregional Plan: Bioregional Profile. A Description of the Ecosystems, Conservation Values and Uses of the North-west Marine Region. Australian Government Department of the Environment, Water, Heritage and the Arts. Canberra. 288 pp.
http://www.environment.gov.au/coasts/mbp/publications/north-west/pubs/bioregional-profile.pdf DEWHA (2008b). The South-west Marine Bioregional Plan: Bioregional Profile. A Description of the Ecosystems,
Conservation Values and Uses of the South-west Marine Region. Australian Government Department of the Environment, Water, Heritage and the Arts. Canberra. 208 pp
DEWHA (2008c). Background Paper to EPBC Act Policy Statement 2.1 – Interaction between offshore seismic exploration and whales September 2008. Australian Government Department of the Environment, Water, Heritage and the Arts. Canberra. 7 pp.
http://www.environment.gov.au/epbc/publications/pubs/seismic-whales-background.pdf DEWHA (2008d). EPBC Act Policy Statement 2.1 – Interaction between offshore seismic exploration and whales
September 2008. Australian Government Department of the Environment, Water, Heritage and the Arts. Canberra. 14 pp.
http://www.environment.gov.au/epbc/publications/pubs/seismic-whales.pdf DEWHA (2009). Assessment of the Mackerel Managed Fishery November 2009. Australian Government
Department of the Environment, Water, Heritage and the Arts. Canberra. DFO (2004). Review of Scientific Information on Impacts of Seismic Sound on Fish, Invertebrates, Marine Turtles
and Marine Mammals. Canadian Science Advisory Secretariat (CSAS), Habitat Status Report 2004/002, Department of Fisheries and Oceans (DFO), Canada. 15 pp.
http://www.dfo-mpo.gc.ca/csas/Csas/status/2004/HSR2004_002_e.pdf DMP (2012). Consultation Guidance Note, For the Offshore Petroleum and Greenhouse Gas Storage
(Environment) Regulations 2009). Compiled by the Environment Division. Department of Mines and Petroleum. East Perth. Western Australia. http://www.dmp.wa.gov.au/documents/ENV-PEB-176.pdf
DNP (2013). North-west Commonwealth Marine Reserves Network Management Plan 2014-24. Director of National Parks, Canberra..
DNV (2011). Assessment of the Risk of Pollution from Marine Oil Spills in Australian Ports and Waters. Final Report for the Australian Maritime Safety Authority. Det Norske Veritas, Report No. PP002916. 50 pp.
DoE (2015a). Conservation Management Plan for the Blue Whale: A Recovery Plan under the Environment Protection and Biodiversity Conservation Act 1999 (2015–2025). Department of the Environment, Commonwealth of Australia, Canberra, ACT.
DoE (2015b). National Conservation Values Atlas. MWSR South operational area MC MSS survey area. Commonwealth Department of the Environment, online database. http://www.environment.gov.au/webgis-framework/apps/ncva/ncva.jsf
DoE (2015c). Conservation Advice. Megaptera novaeangliae humpback whale. Department of the Environment, Commonwealth of Australia, Canberra, ACT. 14 pp.
DoE (2014a). EPBC Act Protected Matters Reports. Commonwealth Department of the Environment. http://www.environment.gov.au/webgis-framework/apps/pmst/pmst-coordinate.jsf
DoE (2014c). Historic shipwrecks laws. Department of the Environment, Online. Accessed September 2014. http://www.environment.gov.au/topics/heritage/historic-shipwrecks/historic-shipwrecks-laws
DoE (2014d). Australian national shipwreck database. Department of the Environment, Online database. https://apps5a.ris.environment.gov.au/shipwreck/public/wreck/search.do DoE (2014e). Australian Heritage Database. Department of the Environment. Online database. Accessed
September 2014. http://www.environment.gov.au/cgi-bin/ahdb/search.pl DoE (2014f). North-west Commonwealth Marine Reserves Network, Commonwealth Marine Reserves.
Department of the Environment. Accessed September 2014. http://www.environment.gov.au/marinereserves DoE (2014g). Marine Species Conservation. Department of the Environment. Accessed September 2014.

TGS NWSR South MC MSS - Environment Plan Summary
Rev 1 Page 126
http://www.environment.gov.au/marine/marine-species DoF (2012). State of the Fisheries and Aquatic Resources Report 2011/12. Fletcher, W.J. and Santoro, K. (eds.).
Department of Fisheries, Western Australia. 376 pp. DoF (2012a). Exploring the Houtman Abrolhos Islands. Department of Fisheries, Western Australia. 92 pp. Donskoy, DM and Ludyanskiy, ML 1996. Low Frequency Sound as a Control Measure for Zebra Mussel Fouling.
In: Proceedings of The Fifth International Zebra Mussel and Other Aquatic Nuisance Organisms Conference, Toronto, Canada, February 1995. pp. 103-108.
DoT (2012). Industry Consultation Guidelines (For the Offshore Petroleum and Greenhouse Gas Storage (Environment) Regulations 2009). WA Department of Transport, Perth. 2 pp.
Double MC, Gales N, Jenner KCS and Jenner M-NM (2010). Satellite tracking of south-bound female humpback whales in the Kimberley region of Western Australia. Australian Marine mammal centre, Kingston.
Double MC, Jenner KCS, Jenner M-NM, Ball I, Laverick S and Gales N (2012). Satellite tracking of pygmy blue whales (Balaenoptera musculus brevicauda) off Western Australia, Australian Marine Mammal Centre, Kingston.
Double MC, Andrews-Goff V, Jenner KCS, Jenner M-N and Laverick SM (2014) Migratory Movements of Pygmy Blue Whales (Balaenoptera musculus brevicauda) between Australia and Indonesia as Revealed by Satellite Telemetry. PLoS ONE 9(4): e93578. doi:10.1371/journal.pone.0093578.
DPaW 2013, Whale shark management with particular Reference to Ningaloo Marine Park, Wildlife management program no.57, Department of Parks and Wildlife, Perth, Western Australia.
DPI (2002) Technical Appendix 2. Coral Bay Boating Facility Marine Water and Sediment Quality. Prepared by DAL Science and Engineering Pty Ltd. 14 pp
DSEWPaC (2011). Species Group Report Card - reptiles. Supporting the draft marine bioregional plan for the North-west Marine Region. Department of Sustainability Environment, Water, Population and Communities. Commonwealth of Australia. Canberra.
DSEWPaC (2012). Marine bioregional plan for the North-west Marine Region. Department of Sustainability Environment, Water, Population and Communities. Commonwealth of Australia. Canberra.
DSEWPaC (2012a). Commonwealth marine environment report card. Supporting the bioregional plan for the South-west Marine Region. Australian Government, Canberra.
DSEWPaC (2012b). Marine bioregional plan for the South-west Marine Region. Department of Sustainability Environment, Water, Population and Communities. Australian Government. Canberra.
DSEWPaC (2012d). Commonwealth marine environment report card. Supporting the bioregional plan for the North-west Marine Region. Australian Government, Canberra
DSEWPaC (2013). Recovery Plan for the White Shark (Carcharodon carcharias). Department of Sustainability Environment, Water, Population and Communities. Commonwealth of Australia. Canberra. 56 pp.
EA (2003). Recovery Plan for Marine Turtles in Australia. Environment Australia, Canberra. 49 pp. Eckert, S. A., Dolar, L. L., Kooyman, G. L., Perrin, W. and Rahman, A. (2002) “Movements of Whale Sharks
(Rhincodon typus) in South-east Asian waters as determined by satellite telemetry”. Journal of the Zoological Society of London, Vol. 257, pp. 111-115.
EGFC (2014). Exmouth Game Fishing Club. Online http://www.egfc.com.au/ Ellers, O (1995). Discrimination among wave-generated sounds by a swash-riding clam. Biological Bulletin 189: 128-137. Environmental Protection Authority (EPA) (2010). Environmental Assessment Guideline No. 5 for Protecting
Marine Turtles from Light Impacts. [Online]. Available from: http://www.dmp.wa.gov.au/documents/Turtle_Lighting_impacts_EPA_Guideline_5.pdf
Environmental Protection Authority (EPA) (2001). Guidance Statement No. 1. Guidance Statement for Protection of Tropical Arid Zone Mangroves Along the Pilbara Coastline. EPA. 27 pp.
Environmental Resources Management Australia (2015). EP Summary for Cygnus 3D Marine Seismic Survey 2015 – 2017 Rev 1. Polarcus. 66 pp.
Etkins, D.S. 1997. The impacts of oil spills on marine mammals. OSIR Report – Special Report. OSIR. Falkner I, Whiteway T, Preslawski R & AD Heap (2009). Review of ten key ecological features (key ecological
features) in the Northwest Marine Region, Record 2009/13, Geoscience Australia, Canberra. Findlay K, Bannister JL, Cerchio S, Jackson J, Loo J, Paton D, et al. (2009). Allocations of catches of humpback
whales (1904–1973) for the IWC comprehensive assessment of Southern Hemisphere humpback whales. Report of an IWC intersessional email group.

TGS NWSR South MC MSS - Environment Plan Summary
Rev 1 Page 127
Finneran JJ, Schlundt CE, Dear R, Carder CA and Ridgway SH (2002). Temporary shift in masked hearing thresholds in odontocetes after exposure to single underwater impulses from a seismic watergun. Journal of the Acoustical Society of America, 111 (6): 2929-2940.
Fletcher and Santoro (eds) (2013). State of the Fisheries and Aquatic Resources Report 2012/13. Fletcher, W.J. and Santoro, K. (eds.). Department of Fisheries, Western Australia. 376 pp.
Fletcher, W.J. and Santoro, K. (eds.). (2014). Status Reports of the Fisheries and Aquatic Resources of Western Australia 2013/14: The State of the Fisheries. Department of Fisheries, Western Australia. 366 pp.
Fletcher, W., Friedman, K., Weir, V., McCrea, J. and Clark, R. (1996) Pearl Oyster Fishery, Published by the Department of Fisheries, Western Australia. ESD Report Series No. 5, January 2006. 88pp.
Franzen, N 1995. Shear wave detection by Macoma balthica. Abstract, 23rd Benthic Ecology Meeting, New Brunswick, New Jersey, 1995
Gausland I (2000). Impact of seismic surveys on marine life. SPE 61127. SPE International Conference on Health, Safety and the Environment in Oil and Gas Exploration and Production. 26-28 June 2000. 4 pp.
http://www.dcenr.gov.ie/NR/rdonlyres/A646A3B5-C825-42B8-80FA-3AA264EBA72A/0/SEASubmApp3TLEpaper.pdf
Georgeson, L, Stobutzki, I & Curtotti, R (eds) 2014, Fishery status reports 2013–14, Australian Bureau of Agricultural and Resource Economics and Sciences, Canberra. 485 pp.
Geoscience Australia (2002). Australia’s Maritime Zones, The Australian Map Series Edition 2. Commonwealth of Australia. http://www.ga.gov.au/image_cache/GA3746.pdf. Accessed December 2014.
Geraci JR and St Aubin DJ 1990. Sea mammals and oil: confronting the risks. Academic Press, San Diego, USA. 259pp.
Gittings SR, Bright TJ and Hagman DK (1993). The M/V Wellwood and other large vessel groundings: coral reef damage and recovery, pp. 174–180. In: Global Aspects of Coral Reefs: Health, Hazards, and History. Rosenstiel School of Marine and Atmospheric Science, Univ of Miami. 420 pp.
Goold JC (1996). Acoustic assessment of populations of common dolphin Delphinus delphis in conjunction with seismic surveying. Journal of the Marine Biological Association UK, 76: 811-820.
Gordon JG, Gillespie D, Potter J, Frantzis A, Simmonds MP, Swift R and Thompson D (2004). A review of the effects of seismic surveys on marine mammals. Marine Technology Society Journal, 37 (4): 16-34.
http://www.pelagosinstitute.gr/en/pelagos/pdfs/Gordon%20et%20al.%202004,%20Review%20of%20Seismic%20Surveys%20Effects.pdf
Gotz T, Hastie G., Hatch, L.T., Raustein, O., Southall, B.L. & Tasker, M (2009) Overview of the impacts of anthropogenic underwater sound in the marine environment. OSPAR Commission, London
Gowanloch, JN and McDougall, JE 1944. Louisiana experiments pave ways for expanded oil research. Louisiana Conservationist 3: 3-6.
Griffith JK 2004. Scleractinian corals collected during 1998 from the Dampier Archipelago, Western Australia. Records of the Western Australian Museum Supplement No. 66: 101–120 Hale, J. and Butcher, R., 2009, Ecological Character Description of the Eighty-mile Beach Ramsar Site, Report to
the Department of Environment and Conservation, Perth, Western Australia. 103 pp Harrington, JJ, MacAllistar, J and Semmens, JM 2010. Assessing the immediate impact of seismic surveys on
adult commercial scallops (Pecten fumatus) in Bass Strait. Tasmanian Aquaculture and Fisheries Institute, University of Tasmania, November 2010.
Harris, RE, Miller GW and Richardson, WJ (2001). Seal responses to airgun sounds during summer seismic surveys in the Alaskan Beaufort Sea. Marine Mammal Science, 17(4): 795-812.
Hawkins, AD, and Myrberg, AA, Jr 1983. Hearing and sound communication under water. In: Bioacoustics, A Comparative Approach, ed. Lewis, B. Academic Press, Sydney. pp. 347-405. International Conference on Health, Safety and Environment, New Orleans, Louisiana, 9-12 June, pp. 227238.
Hazel J and Gyuris E (2006). Vessel-related mortality of sea turtles in Queensland, Australia. Wildlife Research, 33: 149–154.
Hazel J, Lawler IR, Marsh H and Robson S (2007). Vessel speed increases collision risk for the green turtle Chelonia mydas. Endangered Species Research, 3: 105–113.
Heyward AJ, Revill and Sherwood CR (2000). Review of the Research and Data Relevant to Marine Environmental Management of Australia’s North West Shelf. Report to the Western Australian Department of Environmental Protection by the Australian Institute of Marine Science (AIMS) and CSIRO Marine Research.

TGS NWSR South MC MSS - Environment Plan Summary
Rev 1 Page 128
Huisman JM and Borowitzka MA (2003). The Marine Benthic Flora and Fauna of the Dampier Archipelago Murdoch University Perth.
IUCN (2013). The IUCN Red List of Threatened Species. International Union for Conservation of Nature and Natural Resources. Online. http://www.iucnredlist.org/
IWC (2006). Report of the Workshop on the Comprehensive Assessment of Southern Hemisphere Humpback Whales. International Whaling Commission Paper SC/58/Rep5 presented to the IWC Scientific Committee, June 2006, St Kitts and Nevis, WI.
Jenner C, and Jenner M (2010). Field Report A Description of Humpback Whale and other Mega fauna Distribution and Abundance in the Western Pilbara Using Aerial Surveys – 2009/2010. Centre for Whale Research. Fremantle. 46 pp.
Jenner C, Jenner M and McCabe KA (2001). Geographical and Temporal Movements of Humpback Whales in Western Australian Waters. APPEA Journal 41 (2001): 749-765.
http://www.cwr.org.au/publications/appea2001.pdf Jensen AS and Silber GK (2003). Large whale ship strike database. U.S. Department of Commerce. National
Oceanic and Atmospheric Administration. Technical Memorandum NMFS-OPR-25. 37 pp. Jochens AE, and Biggs DC (2003). Sperm Whale Seismic Study in the Gulf of Mexico. US Minerals Management
Service OCS Study 2003-069. Report published by US Department of Minerals Management Service OCS Region, New Orleans. 135 pp.
http://www.gomr.mms.gov/PI/PDFImages/ESPIS/2/3041.pdf Johnstone RE, Burbidge AH and Darnell JC (2013) Birds of the Pilbara region, including sea and offshore islands,
Western AustraliaL distributions, status and historical changes. Records of WA Museam, Supplement 78: 343-441.
Kemp, RJ 1956. Do seismographic explosions affect marine life? Texas Game and Fish 14:11-13. Keevin, TM and Hempen GL 1997. The environmental effects of underwater explosions with methods to mitigate
impacts. US Army Corps of Engineers Report. St. Louis District, p. 41. Kendrick GA, Huisman JM and Walker DI 1990. Benthic Macroalgae of Shark Bay, Western Australia. Botanica
Marina 33: 47–54 Kendrick, G.A. Walker, D.I. and A.J. McComb 1988. Changes in distribution of macro-algal epiphytes on stems of
the seagrass Amphibolis antarctica along a salinity gradient in Shark Bay, Western Australia. Phycologia 27: 201-208
Ketos Ecology (2007). Reducing the fatal entrapment of marine turtles in towed seismic survey equipment. Ketos Ecology Report. 11 pp.
http://www.ketosecology.co.uk/KE2007.pdf Ketos Ecology (2009). ‘Turtle Guards’: A method to reduce the marine turtle mortality occurring in certain
seismic survey equipment Ketos Ecology report, 14 pp. http://www.ketosecology.co.uk/Turtle-Gards.htm Kirkman H (1997). Seagrasses of Australia, Australia: State of the Environment Technical paper Series (Estuaries
and the Sea), Department of the Environment, Canberra. 36 pp. Klimley AP and Myrberg Jr AA (1979). Acoustic stimuli underlying withdrawal from a sound source by adult lemon
sharks, Negaprion brevirostris (Poey). Bulletin of Marine Science, 29: 447–458. Knowlton AR and Kraus SD (2001). Mortality and serious injury of northern right whales (Eubalaena glacialis) in
the western North Atlantic Ocean. Journal of Cetacean Research and Management Special Issue, 2: 193-208.
Koessler, M. and Duncan, A. (2014). Underwater sound modelling for prediction of combined received sound exposure levels from two seismic survey vessels operating in the Great Australian Bight. Prepared for TGS NOPEC Geophysical Company Pty Ltd. Centre for Marine Science and Technology, Curtin University. August 2014.
Kosheleva V (1992). The impact of airguns used in marine seismic explorations on organisms living in the Barents Sea. Fisheries and Offshore Petroleum Exploitation 2nd International Conference, Bergen Norway, 6th – 8th April 1992.
Kostyvchenko LP (1973). Effect of elastic waves generated in marine seismic prospecting on fish eggs in the Black Sea. Hydrobiological Journal, 9 (5): 72-75.
La Bella G, Cannata S, Froglia C, Modica A, Ratti S and Rivas G (1996). First assessment of effects of air-gun seismic shooting on marine resources in the Central Adriatic Sea. Society of Petroleum Engineers.

TGS NWSR South MC MSS - Environment Plan Summary
Rev 1 Page 129
International Conference on Health, Safety and Environment, New Orleans, Louisiana, 9-12 June, pp. 227-238.
Laist DW, Knowlton AR, Mead JG, Collet AS and Podesta M (2001). Collision between ships and whales. Marine Mammal Science, 17: 35-75.
Larson (1985). Cited in: Turnpenny, AWH, and Nedwell, JR (1994). The Effects on Marine Fish, Diving Mammals and Birds of Underwater Sound Generated by Seismic Surveys. Consultancy Report to UKOOA by Fawley Aquatic Research Laboratories Ltd FCR 089/94. 50 pp.
Lawler, I., H. Marsh, B. McDonald, T. Stokes. 2002. "Dugongs in the Great Barrier Reef" (On-line pdf). Accessed September 19, 2009 at http://rrrc.org.au//wp-content/uploads/2014/03/04-2002-Dugongs-in-the-Great-Barrier-Reef.pdf
LeProvost, Semeniuk and Chalmers 1986. Harriet Field - The Effect of Underwater Seismic Explosions on Pearl Oysters. Report to Apache Energy Ltd; ref: no. H62; document no. EAA-60-RU-002.
Limpus CJ & MacLachlin N (1994). The Conservation Status of the Leatherback Turtle, Dermochelys coriacea, in Australia. In: James, R, ed. Proceedings of the Australian Marine Turtle Conservation Workshop, Gold Coast 14-17 November 1990. Page(s) 63-67. Queensland Department of Environment and Heritage. Canberra: ANCA
Limpus, CJ (2007). A Biological Review of Australian Marine Turtles. 5. Flatback Turtle Natator depressus (Garmin). Queensland Environmental Protection Agency.
Limpus, CJ (2008a). A Biological Review of Australian Marine Turtles. 1. Loggerhead Turtle Caretta (Linnaeus). Queensland Environmental Protection Agency.
Limpus, CJ (2008b). A Biological Review of Australian Marine Turtles. 2. Green Turtle Chelonia mydas (Linnaeus). Queensland Environmental Protection Agency.
Limpus, CJ (2009a). A Biological Review of Australian Marine Turtles. 3. Hawksbill Turtle Eretmochelys imbricata (Linnaeus). Queensland Environmental Protection Agency.
Limpus, CJ (2009b). A Biological Review of Australian Marine Turtles. 6. Leatherback Turtle Dermochelys coriacea (Vandelli). Queensland Environmental Protection Agency, January 2009.
Linton, TL, Landry, AM, Buckner, J, and Berry, RL 1985. Effects upon selected marine organisms of explosives used for sound production in geophysical exploration. Texas Journal of Science 37: 341–353.
Lutcavage ME, Plotkin P, Witherington B and Lutz PL (1997). Human impacts on sea turtle survival. In: Lutz PL, Musick JA (eds.) The biology of sea turtles, Vol I. CRC Press, Boca Raton, FL, pp. 387–409.
Matishov GG (1992). The reaction of bottom-fish larvae to airgun pulses in the context of the vulnerable Barents Sea ecosystem. Fisheries and Offshore Petroleum Exploitation 2nd International Conference, Bergen Norway, 6th – 8th April 1992.
McAuley, R. 2004. Western Australian Grey Nurse Shark Pop Up Archival Tag Project. Final Report to Department of Environment and Heritage. 55pp
McCauley RD (1994). The environmental implications of offshore oil and gas development in Australia – seismic surveys. In: Swan, J.M., Neff, J.M. and Young, P.C. (eds.), Environmental Implications of Offshore Oil and Gas Development in Australia - The Findings of an Independent Scientific Review, pp. 123-207. Australian Petroleum Exploration Association, Sydney. pp. 19-21.
McCauley, RD and Salgado Kent, CP 2008. Pile driving underwater noise assessment, proposed Bell Bay pulp mill wharf development. Report prepared for Gunns Limited. Centre for Marine Science and Technology, Curtin University, June 2008. CMST Report 2008-27. 39 pp.
McCauley RD, Fewtrell J, Duncan A, Jenner KCS, Jenner M-NM, Penrose JD, Prince RIT, Adhitya A, Murdoch J, and McCabe K (2000). Marine seismic surveys: analysis and propagation of air-gun signals; and effects of exposure on humpback whales, sea turtles, fishes and squid. Curtin University Centre for Marine Science and Technology (CMST) Report R99-15 for the Australian Petroleum Production and Exploration Association (APPEA). Published in: Environmental Implications of Offshore Oil and Gas Development in Australia: Further Research, APPEA, 2003, 520 pp.
http://cmst.curtin.edu.au/publicat/index.html McCauley RD and Jenner C (2010) Migratory patterns and estimated population size of pygmy blue whales
(Balaenoptera musculus brevicauda) traversing the Western Australian coast based on passive acoustics. Paper SC/62/SH26 presented to the IWC Scientific Committee.
McCook L J, Klumpp DW, McKinnon AD 1995. Seagrass communities in Exmouth Gulf, Western Australia. A preliminary survey. Journal of the Royal Society of Western Australia 78: 81–87

TGS NWSR South MC MSS - Environment Plan Summary
Rev 1 Page 130
McKinnon D, Meekan M, Stevens J and Koslow T (2002). WA-271-P biological/physical oceanographic and whale shark movement study: RV Cape Ferguson Cruise 2982, 2-24 April 2002. AIMS final Report produced for Woodside Energy Limited.
McLaughlin, MG and Young, RJ (1985). Sedimentary provinces of the fishing grounds of the North West Shelf of Australia: grain-size frequency analysis of surficial sediments. Australian Journal of Marine and Freshwater Research. Vol 36 671-681 pp.
Meekan MG and Radford B (2010). Migration patterns of Whale Sharks: A summary of 15 satellite tag tracks from 2005 to 2008. Report produced for Woodside Energy Ltd. Australian Institute of Marine Science, Perth. 21 pp.
http://www.woodside.com.au/Our-business/Browse/EIS/27%20Meekan%20and%20Radford%202010.PDF
MMS (2004). Geological and Geophysical Exploration for Mineral Resources on the Gulf of Mexico Outer Continental Shelf. Final Programmatic Environmental Assessment. U.S. Department of the Interior Minerals Management Service, Gulf of Mexico OCS Region. MMS Report 2004-054, July 2004, 487 pp.
http://www.gomr.mms.gov/PDFs/2004/2004-054.pdf Moein SE, Musick JA and Lenhardt ML (1994). Auditory behavior of the loggerhead sea turtle (Caretta caretta).
In: Bjorndal, KA, Bolten, AB, Johnson, DA and Eliazar, PJ (compilers), Proceedings of 14th Annual Sea Turtle Symposium on Sea Turtle Biology and Conservation. NOAA Technical Memorandum NMFS-SEFSC-351. 323 pp.
http://www.sefsc.noaa.gov/PDFdocs/TM_351_Bjorndal_etal_14.pdf Moriyasu M, Allain R, Benhalima K and Claytor R (2004). Effects of seismic and marine noise on invertebrates: A
literature Review. Canadian Science Advisory Secretariat research document; 2004/126. Fisheries and Oceans Canada. 50 pp.
http://www.dfo-mpo.gc.ca/Library/317113.pdf Myrberg Jr AA (2001). The acoustical biology of elasmobranchs. Environmental Biology of Fishes, 60: 31-45. Negri, A.P. and Heyward, A.J. 2000. Inhibition of fertilization and larval metamorphosis of the coral Acropora
millepora (Ehrenberg, 1834) by petroleum products. Marine Pollution Bulletin 41(7-12): 420-427. NOAA (2010a). Oil and Sea Turtles: biology planning and response, US Department of Commerce, National
Oceanic and Atmospheric Administration, National Ocean Service, Office of Response and Restoration, 116 pp.
NOAA (2010b). Oil spills in coral reefs: planning and response considerations, US Department of Commerce, National Oceanic and Atmospheric Administration, National Ocean Service, Office of Response and Restoration, 84 pp.
NOAA (2012). Small diesel spills (500-500 gallons), Office of response and restoration. http://response.restoration.noaa.gov/oil-and-chemical-spills/oil-spills/resources/small-diesel-
spills.html NOAA (2013). Draft Guidance for Assessing the Effects of Anthropogenic Sound on Marine Mammals. Acoustic
Threshold Levels for Onset of Permanent and Temporary Threshold Shifts. National Oceanic and Atmospheric Administration, draft 23 December 2013. 83 pp.
Noad MJ and Cato DH (2001). A combined acoustic and visual survey of humpback whales off southeast Queensland. Memoirs of the Queensland Museum 47(2): 507–523.
NOPSEMA (2014). Environment Plan Content Requirements. Guidance Note N-04750-GN1344 Revision 0, February 2014. National Offshore Petroleum Safety and Environmental Management Authority.
http://www.nopsema.gov.au/assets/document/N-04700-GL0931-Environment-Plan-Preparation-Interim-Guideline.pdf
Norman BM (1999). Aspects of the biology and ecotourism industry of the Whale Shark Rhincodon typus in north-western Australia. MSc thesis, Murdoch University, Western Australia.
OGUK (2014). Guidance on Risk Related Decision Making. Issue 2 OGUK. O’Hara J and Wilcox R (1990). Avoidance responses of loggerhead turtles, Caretta, to low frequency sound.
Copeia, 1990 (2): 564-567. O’Shea T.J. and Aguilar A (2001) Cetacea and Sirenia. In: Ecotoxicology of Wild Mammals, eds. : Shore R.F and
Rattner B.A., pp 427 –496.

TGS NWSR South MC MSS - Environment Plan Summary
Rev 1 Page 131
Otway NM, & PC Parker (2000) The Biology, Ecology, Distribution, Abundance and Identification of Marine Protected Areas for the Conservation of Threatened Grey Nurse Sharks in South-east Australian Waters. NSW Fisheries Office of Conservation
Parry GD and Gason A (2006). The effect of seismic surveys on catch rates of rock lobsters in western Victoria, Australia. Fisheries Research, 79: 272–284.
Parry, GD, Heislers, S, Werner, GF, Asplin, MD, Gason, A 2002. Assessment of Environmental Effects of Seismic Testing on Scallop Fisheries in Bass Strait. Marine and Freshwater Resources Institute Report No. 50. Marine and Freshwater Resources Institute, Queenscliff, Victoria.
Paterson R, Paterson P, Cato DH (1994). The status of humpback whales Megaptera novaeangliae in East Australia thirty years after whaling. Biological Conservation 70:135–42.
Pearce A, Buchan S, Chiffings T, D’Adamo N, Fandry C, Fearns P, Mills D, Phillips R and Simpson C (2003). A review of the oceanography of the Dampier Archipelago, Western Australia. In: Wells, FE, Walker, DI and Jones, DS (eds.). The Marine Flora and Fauna of Dampier, Western Australia. Western Australian Museum, Perth. 38 pp.
Pearson WH, Skalski JR, Sulkin SD and Malme CI (1994). Effects of seismic energy release on the survival of zoeal larvae of Dungeness crab (Cancer magister). Marine Environmental Research, 38: 93-113.
Pendoley K (1997). Sea Turtles and Management of Marine Seismic Programmes in Western Australia. PESA Journal 1997 No. 25 pp.8-15.
Pendoley KL (2005). Sea Turtles and the Environmental Management of Industrial Activities in North West Western Australia, PhD Thesis, Murdoch University, Australia. 310pp.
Peverell SC (2005) Distribution of sawfishes (Pristidae) in the Queensland Gulf of Carpentaria, Australia, with notes on sawfish ecology, Environmental Biology of Fishes, vol. 73, pp. 391–402.
PGS (2015). Forge Multi-Client 3D Marine Seismic Survey. Environment Plan Summary. Accessed June 2016 NOPSEMA website
Pollard, DA MP Lincoln-Smith & A.K. Smith (1996) The biology and conservation of the grey nurse shark (Carcharias taurus Rafinesque 1810) in New South Wales, Australia. Aquatic Conservation: Marine and Freshwater Ecosystems. 6.
Popper A, Hawkins A, Fay R, Mann D, Bartol S, Carlson T, Coombs S, Ellison W, Gentry R, Halvorsen M, Løkkeborg S, Rogers P, Southall B, Zeddies D, Tavolga W. (2014) ASA S3/SC1.4 TR-2014 Sound Exposure Guidelines for Fishes and Sea Turtles: A Technical Report prepared by ANSI-Accredited Standards Committee S3/SC1 and registered with ANSI. Part of the series Springer Briefs in Oceanography pp 15-16
Popper A. N., Smith M. E., Cott P. A., Hanna B. W., MacGillivray A. O., Austin M. E., and Mann D. A. (2005). “Effects of exposure to seismic airgun use on hearing of three fish species,” J. Acoust. Soc. Am.
Popper, A. N. and M. C. Hastings. 2009. The effects of human-generated sound on fish. Integrative Zoology 4:43-52.
Prince RT (1993). Western Australian Marine Turtle Conservation Project: An Outline of Scope and Invitation to Participate. In: Marine Turtle Newsletter. No. 60. pp 8-14.
Prince RIT (1994). The Flatback turtle (Natator depressus) in Western Australia: New Information from the Western Australian marine Turtle Project. From: Proceedings of the Australian Marine Turtle Conservation Workshop. Sea World Nara Resort, Gold coast. November 1990.
Richardson WJ (ed.) (1999). Marine mammal and acoustical monitoring of Western Geophysical's open-water seismic program in the Alaskan Beaufort Sea, 1998. LGL Rep. TA2230-3. Rep. From LGL Ltd., King City, Ont., and Greeneridge Sciences Inc., Santa Barbara, CA, for Western Geophysical, Houston, TX, and NMFS., Anchorage, AK, and Silver Spring, MD. 390p.
Richardson WJ, Greene Jr C, Malme CI and Thomson DH (1995). Marine Mammals and Noise. Academic Press, Sydney. 576 pp.
Richardson WJ and Moulton V (2006). DRAFT Environmental Assessment of a Planned Low-Energy Marine Seismic Survey by the Scripps Institution of Oceanography in the South Pacific Ocean, December 2006–January 2007, Appendix A. prepared for Scripps Institution of Oceanography and National Science Foundation, Division of Ocean Sciences by LGL Limited, LGL Report TA4301-1. 137 pp.
http://www.nsf.gov/geo/oce/pubs/scripps_seismic_southpac_dec2006_EA.pdf Salgado-Kent, C., Jenner, C., Jenner, M., Bouchet, P. and Rexstad, E. (2012). Southern Hemisphere Breeding Stock
D humpback whale population estimates from North West Cape, Western Australia. J. CETACEAN RES. MANAGE. 12(1): 29–38, 2012

TGS NWSR South MC MSS - Environment Plan Summary
Rev 1 Page 132
Salmon M (2003). Artificial night lighting and sea turtles. Biologist, 50(4): 163-168. Salmon M, Wyneken J, Fritz E and Lucas M (1992). Sea finding by hatchling sea turtles: Role of brightness,
silhouette and beach slope as orientation cues. Behaviour, 122(1-2): 1992. Schaffelke B, McCook LJ, Klumpp DW and McKinnon AD (1996). Seagrasses and seaweeds (macroalgae) in
Exmouth Gulf: their distribution and importance in primary production. AIMS Western Australian Research Activities, 1994-1996. Australian Institute of Marine Science.
Seagrass Watch (2014). The Kimberley’s. http://www.seagrasswatch.org/WA.html. Accessed 22 January 2014. Searcher Seismic (2016). Bilby 2D Phase 3 Multi-Client Marine Seismic Survey, 2016. Environment Plan
Summary. Revsion 2. Doc No. AU15—EP-SUM. Semeniuk, V. (1997) Selection of Mangrove Stands for Conservation in the Pilbara Region of Western Australia
– A Discussion (Unpublished). Shaughnessy, PD (1999). The Action Plan for Australian Seals. Environment Australia. Canberra, ACT. 62 pp.
http://www.environment.gov.au/resource/action-plan-australian-seals Shirihai H and Jarrett B (2006) Whales, Dolphins and Seals A Field Guide to the Marine Mammals of the World.
A&C Black Publishers. London. Shotton R ed. (2003). Deep Sea 2003: Conference on the Governance and Management of Deep-sea Fisheries.
Part 2: Conference poster papers and workshop papers. Marine Resource Service, Fishery Resources Division, FAO Fisheries Department. http://www.fao.org/docrep/009/a0337e/A0337E00.htm#TOC
Sieling, FW 1951. Experiments on the effects of seismographic exploration on oysters in the Barataria Bay region, 1949-1950. Texas A. & M. Research Foundation, Project 9.
SINTEF (2006). Short state-of-the-art report on oil spills in ice-infested waters. SINTEF. Joint Industry Group - Chevron, ConocoPhilips, Shell, Total and Statoil. Norway.
Skalski, JR, Pearson, WH and Malme, CI (1992). Effects of sounds from a geophysical survey device on catch-per-unit-effort in a hook-and line fishery for rockfish (Sebastes sp.). Canadian Journal of Fisheries and Aquatic Sciences 49: 1357-1365.
Skewes TD, Dennis DM, Jacobs DR, Gordon SR, Taranto TJ, Haywood M, Pitcher CR, Smith GP, Milton D and Poiner IR (1999). Survey and stock size estimates of the shallow reef (0-15m deep) and shoal area (15-50m deep) marine resources and habitat mapping within the Timor Sea MOU74 box. Volume 2: Habitat mapping and coral dieback, CSIRO. 65 pp. http://www.environment.gov.au/coasts/mpa/ashmore/volume-2/index.html
Sleeman JC, Meekan MG, Wilson SG, Jenner CKS, Jenner M-N, Boggs GS, Steinberg CC and Bradshaw CJA (2007). Biophysical correlates of relative abundances of marine megafauna at Ningaloo Reef, Western Australia. Journal of Freshwater Research Vol.58 608-623 pp.
Slotte, A, Hansen, K, Dalen, J and Ona, E (2004). Acoustic mapping of pelagic fish distribution and abundance in relation to a seismic shooting area off the Norwegian west coast. Fisheries Research 67: 143-150.
Song, J., Mann, D., Cott, P., Hanna, W. and Popper, A (2008). The inner ears of Northern Canadian freshwater fishes following exposure to seismic air gun sounds. J. Acoust. Soc. Am. 124 _2_, August 2008.
Southall, B.L., Bowles, A.E., Ellison, W.T., Finneran, J.T., Gentry, R.L., Greene Jr., C.R., Kastak, D., Ketten, D.R., Miller, J.H., Nachtigall, P.E., Richardson, W.J., Thomas, J.A. and Tyack, P.L. 2007. Marine Mammal Noise Exposure Criteria: Initial Scientific Recommendations, Aquatic Mammals 33: 411- 521.
Southgate, P.C. and Lucas J.S. (2008) (eds.). The Pearl Oyster, England. 598 pp. Stone C (2003). The effects of seismic activity on marine mammals in UK waters, 1998-2000. Joint Nature
Conservation Committee Report No. 323. January 2003. 78 pp. http://www.jncc.gov.uk/pdf/jncc323.pdf Storr GM, Smith LA and Johnstone RE (1986). Snakes of Western Australia. Western Australian Museum. Perth.
5 pp. Tenara Environmental (2011). A review of effects of seismic testing on marine fish and fisheries as applied to
the DCCPP 3D seismic project. Prepared for Pacific Gas and Electric Co. ESLO2011-031.6 Rev. 11/29/2011.
TSSC (2015). Approved Conservation Advice for Megaptera novaeangliae (humpback whale). Threatened Species Scientific Committee, Department of the Environment, Commonwealth of Australia, Canberra, ACT. 1 October 2015. Available at http://www.environment.gov.au/cgi-bin/sprat/public/publicspecies.pl?taxon_id=38.

TGS NWSR South MC MSS - Environment Plan Summary
Rev 1 Page 133
UKOOA (1999). Industry Guidelines on a Framework for Risk Related Decision Support. Report #EHS08. Oil & Gas UK, formerly the United Kingdom Offshore Operators Association (UKOOA).
URS (2010). Report Macedon Gas Development Subtidal Marine Ecology Survey. Prepared for BHP Billiton Petroleum Pty Ltd. URS. East Perth. Australia. http://www.epa.wa.gov.au/epadoclib/1360EPS/AppendixCMacedonSubtidalMarineEcologySurveyReport26Mar2010.pdf
van Keulen M, Langdon MW (2011). Ningaloo Collaboration Cluster: Biodiversity and ecology of the Ningaloo Reef lagoon. Ningaloo Collaboration Cluster Final Report No. 1c
Vanderlaan, ASM, Taggart, CM. 2007. Vessel Collisions with Whales: The Probability of Lethal Injury Based on Vessel Speed. Marine Mammal Science, Volume 23, Issue 1.
WAGFA (2014). Western Australian Game Fishing Association. Online http://www.wagfa.asn.au/ Walker DI 1989. Seagrass in Shark Bay – the foundations of an ecosystem. In: Seagrasses: A Treatise on the
Biology of Seagrass with Special Reference to the Australian Region, eds. A W D Larkum, A J McComb, S A Shepherd, Elsevier, Amsterdam, pp.182-210
Waples K & Hollander E 2008. Ningaloo Research Progress Report: Discovering Ningaloo – latest findings and their implications for management. Ningaloo Research Coordinating Committee, Department of Environment and Conservation, WA
Wardle, CS, Carter TJ, Urquhart, GG, Johnstone, ADF, Ziolkowski, AM, Hampson, G and Mackie, D (2001). Effects of seismic air guns on marine fish. Continental Shelf Research 21: 1005-1027.
Wells FE, Walker DI & Jones DS (eds.) 2003. The marine flora and fauna of Dampier, Western Australia. Western Australian Museum, Perth, Western Australia
Wethey, D. S., and S. A. Woodin. 2005. Infaunal hydraulics generate pore-water pressure signals. Biol. Bull. 209: 139–145, doi:10.2307/3593131
Weir C (2007). Observations of marine turtles in relation to seismic airgun sound off Angola. Marine Turtle Newsletter 116: 17-20.Wethey, DS, and Woodin, SA 2005. Infaunal hydraulics generate porewater pressure signals. Biological Bulletin 209: 139-145.
Whittock, P. A., Pendoley, K. L. and Hamann M. (2014) Inter-nesting distribution of flatback turtles Natator depressus and industrial development in Western Australia. ENDANGERED SPECIES RESEARCH, Vol. 26: 25–38, 2014. 14 pp.
Wilson SG, Polovina JJ, Stewart BS and Meekan MG (2006). Movements of whale sharks (Rhincodon typus) tagged at Ningaloo Reef, Western Australia. Marine Biology. Vol. 148 pp. 1157-1166.
Wilson SG, Taylor JG and Pearce AF (2001). The seasonal aggregation of whale sharks at Ningaloo Reef, WA: Migrations, currents and the El Nino/Southern Oscillation. Environmental Biology of Fish Vol. 61 No.1 1-11 pp.
Witherington BE and Martin RE (2003). Understanding, Assessing, and Resolving Light-Pollution Problems on Sea Turtle Nesting Beaches. Third Edition. Florida Marine Research Institute (FMRI) Technical Report TR-2: 73. Florida Department of Environmental Protection.
Woodhams J, Vieira S and Stobutzki I (eds.) (2012). Fishery status reports 2011, Australian Bureau of Agricultural and Resource Economics and Sciences, Canberra. 465 pp.
Woodhams, J, Vieira, S & Stobutzki, I (eds.) 2013, Fishery status reports 2012, Australian Bureau of Agricultural and Resource Economics and Sciences, Canberra.
Woodside (2007). Environmental Protection Statement - Maxima 3D Marine Seismic Survey, Scott Reef. Woodside Energy Ltd, April 2007. Unpublished report, 418 pp. www.woodside.com.au/Our+Business/Development/Browse/Browse+Archived+Documents.htm
Wursig, B., J. Thewissen, W. Perrin. 2002. Encyclopaedia of Marine Mammals, Vol. 1, 2nd Edition. San Diego: Gulf Professional Publishing. Accessed October 2014 at: http://books.google.ca/books?id=RsEKkDNF5f4C&printsec=frontcover&source=gbs_navlinks_s#v=onepage&q=Communication%20dugongs&f=false

TGS NWSR South MC MSS - Environment Plan Summary
Rev 1 Page 134
APPENDIX A– SUMMARY OF POTENTIAL ENVIRONMENTAL IMPACTS AND RISKS TO COMMONWEALTH MARINE RESERVES
By implementing the EP and the controls and mitigation measures within it, impacts to the environment,
including the values, sensitivities and management principles of the below mentioned CMR, are considered
ALARP and acceptable and will ensure that activities are not inconsistent with relevant IUCN principles. If
Management Plans come into force during the life of this EP, TGS will comply with the requirements of the plan
including not undertaking seismic surveys within an area that is classed IUCN 1a, II or IV.
Montebello CMR
IUCN VI - Multiple Use Zone
Major conservation values
Foraging areas adjacent to important breeding areas for migratory seabirds
Foraging areas for vulnerable and migratory whale sharks
Foraging areas and adjacent to important nesting sites for marine turtles
Includes part of the migratory pathway of the protected humpback whale
The Reserve includes shallow shelf environments with depths ranging from 15 metres to 150 metres and provides protection for shelf and slope habitats, as well as pinnacle and terrace seafloor features
Examples of the seafloor habitats and communities of the Northwest Shelf Province provincial bioregions as well as the Pilbara (offshore) meso-scale bioregion
One key heritage feature for the region: Wreck of the ‘Trial’
One key ecological feature for the region: ancient coastline (a unique seafloor feature that provides areas of enhanced biological productivity) is represented in this reserve.
Potential Environmental Impacts and Risks Evaluated
Impacts to avifauna have been assessed in the EP and summarised in Section 6.6.3.7
Impacts to whale sharks have been assessed the EP and summarised in Section 6.6.3.4
Impacts to sea turtles have been assessed in the EP and summarised in Sections 6.6.3.6
Impacts to Humpback whales have been assessed in the EP and summarised in Sections 6.6.3.9
Impacts to benthic habitats potentially supporting sensitivities have been assessed in the EP and summarised in Sections 6.6.3.3
The Ancient coastline at 125 m depth contour KEF has only a minor overlap of the CMR (~0.04%) and is located at depths ~125m.
The wreck ‘Trial’ is located outside the operational area.

TGS NWSR South MC MSS - Environment Plan Summary
Rev 1 Page 135
Abrolhos CMR
Marine National Park Zone - IUCN Category II
Habitat Protection Zone - IUCN Category VI
Multiple Use Zone - IUCN Category VI Special Purpose Zone - IUCN Category VI
Major conservation values
Important foraging areas for the: o threatened Australian lesser noddy o northernmost breeding colony of the threatened Australian sea lion o migratory common noddy, wedge-tailed shearwater, bridled tern, Caspian tern and roseate tern
Important migration habitat for the protected humpback whale
Second largest canyon on the west coast, the Houtman Canyon
Examples of the northernmost ecosystems of the Central Western Province and South-west Shelf Transition (including the Central West Coast meso-scale bioregion)
Examples of the deeper ecosystems of the Abrolhos Islands meso-scale bioregion
Examples of the shallower, southernmost ecosystems of the Central Western Shelf Province provincial bioregion including the Zuytdorp meso-scale bioregion
Examples of the deeper ecosystems of the Central Western Transition provincial bioregion
Examples of diversity of seafloor features including: southern most banks and shoals of the North-west region; deep holes and valleys; slope habitats; terrace and shelf environments
Key ecological features: o demersal slope and associated fish communities of the Central Western Province (communities with
high species diversity) o meso-scale eddies (high productivity, feeding aggregations) o west-coast canyons (high productivity, feeding aggregations) o western rock lobster habitat (species with an important ecological role
Potential Environmental Impacts and Risks Evaluated
Impacts to avifauna have been in the EP and summarised assessed in Section 6.6.3.7
The closest Australia sea lion BIA is over 50 km away near the Abrolhos Islands at which point received levels will be less than 155 dB SEL / 180 dB SPL. Impacts to pinnipeds have been assessed in the EP and summarised in Section 6.6.3.8
That part of the CMR overlapped by the humpback migration corridor and the operational area is minor. Impacts to Humpback whales have been assessed in the EP and summarised in Section 6.6.3.9
Deeper ecosystems and canyons, including those of Houtman Canyon and west-coast canyons, are deep and will only be subject to very low noise levels.
Impacts to benthic habitats potentially supporting sensitivities such as site attached fish have been assessed in the EP and summarised in Sections 6.6.3.3.
That part of the Abrolhos CMR that contains the Demersal Slope and Associated Communities KEF and Perth Canyon KEF, and overlapped by the operational area is limited to waters deeper than 1000m. Impacts to fish have been assessed in the EP and summarised in Section 6.6.3.3.
The operational area does not overlap the Wallaby Saddle KEF or Habitat Protection Area (IUCN IV). At its closest point is more than 23 km from it at which point noise levels will be < than 155 dB SEL / 180 dB SPL and below levels that may result in temporary or permanent injury to marine fauna.
Impacts to crustaceans such as western rock lobster have been assessed in the EP and summarised in Section 6.6.3.2
The operational area overlaps a proposed fish protection area (IUCN II) in waters between ~80-150 deep. The area is not recognised for any raised topographic features and so at this depth it is unlikely to contain benthic habitat that may support site-attached species. Impacts to benthic habitats potentially supporting sensitivities such as site attached fish have been assessed in the EP and summarised in Section 6.6.3.3

TGS NWSR South MC MSS - Environment Plan
Rev 1 Page 136
Shark Bay CMR
Multiple Use Zone (IUCN Category VI)
Major conservation values
Foraging areas adjacent to important breeding sites for several species of migratory seabirds
Includes part of the migratory pathway of protected humpback whales
Adjacent to the most significant nesting area for loggerhead turtles
Provides protection to shelf and slope habitats as well as a terrace feature
Examples of the shallower ecosystems of the Central Western Shelf Province and Central Western Transition provincial bioregions including the Zuytdorp meso-scale bioregion
The reserve also protects ecological connectivity between the inshore waters of the Shark Bay World Heritage Area and deeper waters
Potential Environmental Impacts and Risks Evaluated
Impacts to avifauna have been assessed in the EP and summarised in Section 6.6.3.7
Impacts to Humpback whales have been assessed in the EP and summarised in Section 6.6.3.9
Loggerhead BIA is not overlapped by the operational area and is more than 3 km away at which point received levels will be only be ~ 165dB SEL and 190 dB SPL. Impacts to sea turtles have been assessed in the EP and summarised in Section 6.6.3.6
Impacts to benthic habitats potentially supporting sensitivities such as site attached fish have been assessed in the EP and summarised in Sections 6.6.3.3. Water depths where the operational area overlaps the Shark Bay CMR are limited to waters deeper than 75 m.
Ecological connectivity relates to all parts of an ecosystem including water quality, benthic communities, plankton, fish, megafauna etc. Impacts to these receptors has been assessed in the EP and summarised throughout Section 6
Carnarvon CMR
Habitat Protection Zone (IUCN Category IV)
Major conservation values
The Carnarvon Canyon a single channel canyon with seabed features that include slope, continental rise and deep holes and valleys
The Carnarvon Canyon ranges in depth from 1,500–5,000 m, thereby providing habitat diversity for benthic and demersal species
Central Western Transition provincial bioregion ecosystem examples are found here, which are characteristic of the biogeographic faunal transition between tropical and temperate species
Potential Environmental Impacts and Risks Evaluated
The Carnarvon Canyon CMR is within waters deeper than 1,500 m. At these depths no discernible or lasting impacts to deep-water benthic communities are expected.
Impacts to benthic communities, plankton, fish, megafauna etc. have been assessed in the EP and summarised throughout Section 6

TGS NWSR South MC MSS - Environment Plan
Rev 1 Page 137
Gascoyne CMR
Multiple Use Zone (IUCN Category VI)
Habitat Protection Zone (IUCN Category IV)
Marine National Park Zone (IUCN Category II)
Major conservation values
Important foraging areas for: o migratory seabirds o the threatened and migratory hawksbills and flatback turtles o the vulnerable and migratory whale shark
The reserve provides a continuous connectivity corridor from shallow depths around 15 metres out to deep offshore waters on the abyssal plain at over 5,000 metres in depth
The reserve provides protection to many seafloor features including canyon, terrace, ridge, knolls, deep hole/valley and continental rise.
Examples of the ecosystems of the Central Western Shelf Transition, the Central Western Transition and the Northwest province provincial bioregions as well as the Ningaloo meso-scale bioregion
Three key ecological features for the region: o canyons on the slope between the Cuvier Abyssal Plain and the Cape Range Peninsula o Exmouth Plateau o continental slope demersal fish communities
The canyons are believed to be associated with the movement of nutrients from deep water over the Cuvier Abyssal Plain onto the slope where mixing with overlying water layers occurs at the canyon heads
The reserve therefore provides connectivity between the inshore waters of the existing Ningaloo Commonwealth marine park and the deeper waters of the area
Potential Environmental Impacts and Risks Evaluated
Impacts to avifauna have been assessed in the EP and summarised in Section 6.6.3.7 which indicated that birds may be affected slightly by seismic sounds
The operational area does not overlap the hawksbill or flatback BIA within the Gascoyne CMR. Impacts to sea turtles have been assessed in the EP and summarised in Section 6.6.3.6
The operational area does not overlap the identified whale shark foraging BIA and is more than 25 km from it, at which point noise levels will be reduced to less than 155 dB SEL and 180 dB SPL. Impacts to whale sharks have been assessed in the EP and summarised in Section 6.6.3.4
Those areas that are category IUCN II and IUCN IV are contained to waters deeper than 3000m. The IUCN category VI Multiple Use Zone is over 900 m where it overlaps the CMR.
The Exmouth Plateau KEF is in waters deeper than 1000 m. The KEF is an important seafloor feature that modifies flow and so will not be impacted by seismic activities.
That part of the Gascoyne CMR that contains the three KEF and overlapped by the NWSR South operational area are limited to waters deeper than 1000m. Impacts to fish have been assessed in the EP and summarised in Section 6.6.3.3 and other marine fauna such as whale sharks, cetaceans and seabirds throughout Section 6
As seismic acquisition is not a permanent activity as the vessel is moving through an area and the effects from noise cease as soon as the array is at distance or turned off, then by its very nature, the activity will not break the continuous connectivity between the shallower waters and deeper waters of the abyssal plain.
Ningaloo CMR
Recreational Use Zone (IUCN Category II)
Major conservation values
Important habitat (foraging areas) for vulnerable and migratory whale sharks;
Areas used for foraging by marine turtles adjacent to important nesting sites;
Part of the migratory pathway of the protected humpback whale;
Shallow shelf environments which provides protection for shelf and slope habitats, as well as pinnacle and terrace seafloor features; and
Seafloor habitats and communities of the Central Western Shelf Transition.
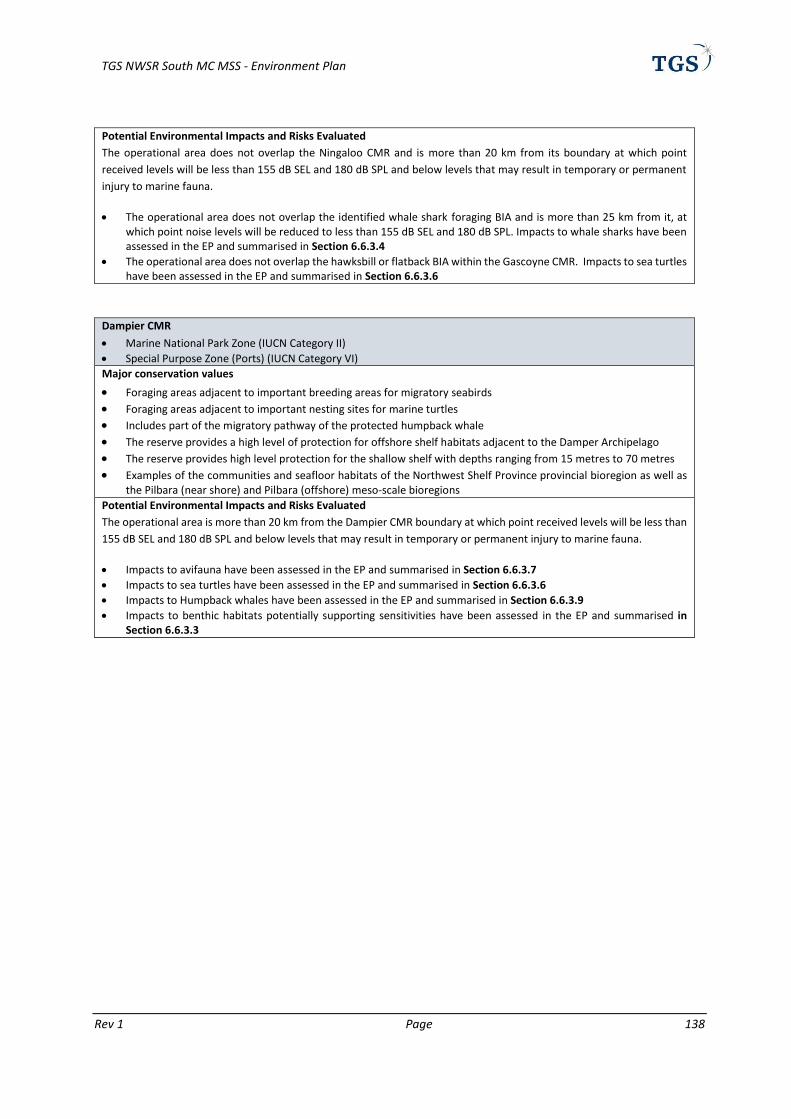
TGS NWSR South MC MSS - Environment Plan
Rev 1 Page 138
Potential Environmental Impacts and Risks Evaluated
The operational area does not overlap the Ningaloo CMR and is more than 20 km from its boundary at which point
received levels will be less than 155 dB SEL and 180 dB SPL and below levels that may result in temporary or permanent
injury to marine fauna.
The operational area does not overlap the identified whale shark foraging BIA and is more than 25 km from it, at which point noise levels will be reduced to less than 155 dB SEL and 180 dB SPL. Impacts to whale sharks have been assessed in the EP and summarised in Section 6.6.3.4
The operational area does not overlap the hawksbill or flatback BIA within the Gascoyne CMR. Impacts to sea turtles have been assessed in the EP and summarised in Section 6.6.3.6
Dampier CMR
Marine National Park Zone (IUCN Category II)
Special Purpose Zone (Ports) (IUCN Category VI)
Major conservation values
Foraging areas adjacent to important breeding areas for migratory seabirds
Foraging areas adjacent to important nesting sites for marine turtles
Includes part of the migratory pathway of the protected humpback whale
The reserve provides a high level of protection for offshore shelf habitats adjacent to the Damper Archipelago
The reserve provides high level protection for the shallow shelf with depths ranging from 15 metres to 70 metres
Examples of the communities and seafloor habitats of the Northwest Shelf Province provincial bioregion as well as the Pilbara (near shore) and Pilbara (offshore) meso-scale bioregions
Potential Environmental Impacts and Risks Evaluated
The operational area is more than 20 km from the Dampier CMR boundary at which point received levels will be less than
155 dB SEL and 180 dB SPL and below levels that may result in temporary or permanent injury to marine fauna.
Impacts to avifauna have been assessed in the EP and summarised in Section 6.6.3.7
Impacts to sea turtles have been assessed in the EP and summarised in Section 6.6.3.6
Impacts to Humpback whales have been assessed in the EP and summarised in Section 6.6.3.9
Impacts to benthic habitats potentially supporting sensitivities have been assessed in the EP and summarised in Section 6.6.3.3

TGS NWSR South MC MSS - Environment Plan
Rev 1 Page 139
Overview of main Control Measures to ensure that activities are not inconsistent with relevant IUCN principles.
Relevant IUCN Reserve Management Principles Survey Control Measures Abrolhos
CMR
Shark Bay
CMR
Carnarvon
Canyon
CMR
Gascoyne
Gulf CMR
Montebell
o CMR
Dampier
CMR
Ningaloo
CMR
Marine national park zone (category II) EP control measures consistent with IUCN Principles include
but are not limited to:
Vessel/fauna interaction procedures in place
All vessels will comply with MARPOL requirements, other
maritime law, utilise appropriate navigational aids and
safety procedures to minimise possibility of vessel
collision or grounding
All vessel discharges will be in accordance with MARPOL
and Biosecurity Act 2015
All vessels will have a Ballast Water Management Plan
Vessels will have had a recent dry dock, IMS inspection or
antifoulant application.
No anchoring or fishing will occur within the operational
area
Lost equipment will be relocated and recovered where
practicable to do so
EP contains OPEP and appropriate control measures for
hydrocarbon spills
Vessels have SOPEP or equivalent
Operational and scientific monitoring to be implemented
as required in the event of a spill
MGO only used
Requirements of the EPBC Act Policy Statement 2.1 will
be upheld, including (but not limited to):
o Pre start-up visual observations
o Soft start procedures
N/A N/A N/A N/A
3.02 Natural and scenic areas of national and
international significance should be protected for
spiritual, scientific, educational, recreational or
tourist purposes
3.03 Representative examples of physiographic
regions, biotic communities, genetic resources, and
native species should be perpetuated in as natural
a state as possible to provide ecological stability
and diversity.
3.04 Visitor use should be managed for
inspirational, educational, cultural and recreational
purposes at a level that will maintain the reserve or
zone in a natural or near natural state.
3.05 Management should seek to ensure that
exploitation or occupation inconsistent with these
principles does not occur
3.06 Respect should be maintained for the
ecological, geomorphic, sacred and aesthetic
attributes for which the reserve or zone was
assigned to this category.
Habitat/species management area (category IV)
N/A N/A N/A
5.02 Habitat conditions necessary to protect
significant species, groups or collections of species,
biotic communities or physical features of the
environment should be secured and maintained, if
necessary through specific human manipulations.

TGS NWSR South MC MSS - Environment Plan
Rev 1 Page 140
Relevant IUCN Reserve Management Principles Survey Control Measures Abrolhos
CMR
Shark Bay
CMR
Carnarvon
Canyon
CMR
Gascoyne
Gulf CMR
Montebell
o CMR
Dampier
CMR
Ningaloo
CMR
5.03 Scientific research and environmental
monitoring that contribute to reserve management
should be facilitated as primary activities associated
with sustainable resource management.
o Compliance and sighting reports
o Precaution zones: Observation Zone 3 km; Low-
power/power-down zone at 2 km; shut-down zone
500 m
o MFOs
o pre-survey research/planning
o Adaptive management measures
Temporal and spatial exclusion periods for humpback
whales and some turtle species
No seismic acquisition will occur:
o in water shallower than 50 m
o within 400 m from the 50 m contour around raised
topographic features
o within 50 km of another seismic vessel acquiring
data
TGS will not undertake a seismic survey less than one
month after a survey has been undertaken over the
same area.
Spatial and temporal limitations on survey lines crossing
to minimise cumulative impacts in more sensitive
environments
Infield verification to confirm appropriateness of
acoustic modeling
Pre-survey planning to check CMR status and whether
management plans have come into force.
If CMR Management Plans come into force during the
life of this EP, TGS will comply with the requirements of
the plan including not undertaking seismic surveys
within an area that is classed IUCN 1a, II or IV.
5.05 Management should seek to ensure that
exploitation or occupation inconsistent with these
principles does not occur.
5.06 People with rights or interests in the reserve or
zone should be entitled to benefits derived from
activities in the reserve or zone that are consistent
with these principles.
Managed resource protected area (category VI)
N/A N/A
7.01 The reserve or zone should be managed mainly
for the ecologically sustainable use of natural
ecosystems based on the following principles.
7.02 The biological diversity and other natural
values of the reserve or zone should be protected
and maintained in the long-term.
7.03 Management practices should be applied to
ensure ecologically sustainable use of the reserve
or zone.
7.04 Management of the reserve or zone should
contribute to regional and national development to
the extent that this is consistent with these
principles.

TGS NWSR South MC MSS - Environment Plan Summary
Rev 1 Page 141