
Norm Conformity across Societies - Max Weber … Conformity across Societies Moti Michaeliy& Daniel...
42
Norm Conformity across Societies Moti Michaeli y & Daniel Spiro z Abstract This paper studies the aggregate distribution of declared opin- ions and behavior when heterogeneous individuals make the trade- o/ between being true to their private opinions and conforming to a social norm. The model sheds light on how various sanction- ing regimes induce conformity and by whom, and on phenom- ena such as societal polarization and unimodal concentration. In strict societies, individuals will tend to either fully conform to the social norm or totally ignore it, while individuals in liberal societies will tend to compromise between these two extremes. Furthermore, the degree of strictness determines whether those who nearly agree with the norm or those who strongly disagree with it will conform. The degree of liberalism similarly deter- mines which individuals will compromise the most. A number of empirical predictions, and several methods of how to test them, are suggested. Keywords: Social pressure, Conformity, Liberal, Strict. JEL: D01, D30, D7, K42, Z1, Z12, Z13 We wish to thank Laurie Anderson, Florian Biermann, Brd Harstad, Sergiu Hart, John Hassler, Arie Kacowicz, Edwin Leuven, Andrea Mattozzi, Karine Nyborg, Andrew Oswald, Ignacio Palacios-Huerta, Alyson Price, Torsten Persson, Francesco Trebbi, Jrgen Weibull, Robert stling, two anonymous referees and seminar partic- ipants at the Hebrew University, the University of Oslo, Stockholm University and the Stockholm School of Economics for valuable comments. y Corresponding author. The European University Institute, Florence. E-mail : [email protected]. Tel. [+39] 055 4685 901. Postal address: Via della Piazzuola 43 I-50133 Firenze. z Department of Economics, University of Oslo, [email protected]. 1
Transcript of Norm Conformity across Societies - Max Weber … Conformity across Societies Moti Michaeliy& Daniel...

Norm Conformity across Societies∗
Moti Michaeli†& Daniel Spiro‡
Abstract
This paper studies the aggregate distribution of declared opin-ions and behavior when heterogeneous individuals make the trade-off between being true to their private opinions and conformingto a social norm. The model sheds light on how various sanction-ing regimes induce conformity and by whom, and on phenom-ena such as societal polarization and unimodal concentration. Instrict societies, individuals will tend to either fully conform tothe social norm or totally ignore it, while individuals in liberalsocieties will tend to compromise between these two extremes.Furthermore, the degree of strictness determines whether thosewho nearly agree with the norm or those who strongly disagreewith it will conform. The degree of liberalism similarly deter-mines which individuals will compromise the most. A number ofempirical predictions, and several methods of how to test them,are suggested.Keywords: Social pressure, Conformity, Liberal, Strict.JEL: D01, D30, D7, K42, Z1, Z12, Z13
∗We wish to thank Laurie Anderson, Florian Biermann, Bård Harstad, SergiuHart, John Hassler, Arie Kacowicz, Edwin Leuven, Andrea Mattozzi, Karine Nyborg,Andrew Oswald, Ignacio Palacios-Huerta, Alyson Price, Torsten Persson, FrancescoTrebbi, Jörgen Weibull, Robert Östling, two anonymous referees and seminar partic-ipants at the Hebrew University, the University of Oslo, Stockholm University andthe Stockholm School of Economics for valuable comments.†Corresponding author. The European University Institute, Florence. E-mail :
[email protected]. Tel. [+39] 055 4685 901. Postal address: Via della Piazzuola43 I-50133 Firenze.‡Department of Economics, University of Oslo, [email protected].
1
1 Introduction
It is by now well established that social norms, and social pressure toconform to these norms, influence individual decision making in a widespectrum of situations. In particular, imagine a controversial social orpolitical issue where there exists a social norm, that is, a consensualopinion or norm of behavior. Suppose now that each individual in societyhas some private opinion regarding this issue, and each needs to publiclydeclare her stance. An individual whose private opinion differs from thesocial norm will need to consider the trade-offbetween the social pressureof violating the norm and the psychological cost of stating an opiniondifferent to her private view. In many cases, such as at what age to bearchildren, howmuch alcohol to drink and to what extent to follow religiouscustoms, the individual can choose the extent of conformity to the normfrom a continuum. We analyze this basic trade-off in a heterogeneousagent framework and present the aggregate outcomes across societies.In particular, we examine the extent of conformity that one person
exhibits compared to that exhibited by another person with a differentprivate opinion. This analysis provides predictions for (i) which indi-viduals in society will conform more, (ii) which individuals in societywill make larger individual concessions, (iii) the distribution of statedopinions in society and (iv) which norms will be sustainable. We showthat although the problem faced by each individual is fairly simple, theoutcomes at the aggregate level are diverse, and we analyze how theseoutcomes depend on the underlying characteristics of society.In practice, societies differ not only in the general weight of social
pressure, but also in its curvature. That is, they differ in the way theysanction small deviations from the norm compared to large ones. Weshow that the curvature of social pressure has more intricate and possiblymore important effects than the general weight of pressure. Moreover,in order to connect the model’s results to outcomes across societies, anddrawing on observations of sanctioning in different societies and cultures(to be presented in the next section), we apply labels to the curvatureof social pressure: strict societies are those emphasizing full adherenceto the social norm, and hence they utilize concave social pressure; liberalsocieties are those allowing freedom of expression as long as it is nottoo extreme, and hence they utilize convex social pressure. Strictlyspeaking, these labels are not necessary for the formal analysis, but theyprove useful, as they highlight the consistency between the results of themodel and observations of actual societies.We find that in liberal societies, the convexity of social pressure fa-
cilitates a compromise mentality, where most individuals are compelledto adjust at least a little bit to the norm. Furthermore, the degree of
2

liberalism (i.e., the degree of convexity) plays an important role. Veryliberal societies will tend mainly to make those who privately detest thenorm adjust to it. This will create a society that looks polarized. Lessliberal societies will be more directed at getting moderates to conformand hence will look cohesive, with a concentration of stances around thenorm.Strictness, on the other hand, facilitates an all-or-nothing mentality,
since only full conformity counts. This may indeed lead to full confor-mity, but may also backfire so that some individuals do not concede atall. Moreover, the degree of strictness (i.e., the degree of concavity) isimportant in predicting who follows the norm. In very strict societies,the full conformers are those who nearly agree with the norm anyway,while those who strongly reject the norm privately, express their dissentpublicly as well. However, in less strict societies, paradoxically thosewho dislike the norm the most are the only ones upholding it, whilethose who basically agree with the norm privately, criticize it mildly inpublic. This creates a surprising result: an inversion of opinions.We also find that, in some cases, opposition to the norm will be more
extreme in strict societies than in liberal ones. This result is surprisingas it emerges even when sanctions are harsher in strict societies. It isdriven by the all-or-nothing behavior of individuals in strict societies,compared to the compromising behavior of individuals in liberal ones.This result is formalized into a testable prediction and we suggest somemethods and situations of social interaction in which this and a few otherpredictions can be tested.Another outcome that clearly separates liberal and strict societies
relates to the possible location of the norm. Letting the norm be theaverage declared opinion in society, we show that norms in liberal so-cieties are bound to be representative also of the private sentiments insociety, as the norm coincides with the average private opinion. In con-trast, strict societies may well maintain a biased social norm, centeredon a point that is far from the average private opinion. This impliesthat strict societies allow for multiple equilibria, while liberal societiesdo not. One interpretation of this result is that strictness is a tool formaintaining biased norms.The contribution of our paper lies in explaining different patterns
of norm conformity across societies. This requires modeling continuouschoice under various sanctioning regimes. Previous theoretical paperswith a similar individual trade-off usually model binary decisions (e.g.,Bénabou & Tirole 2011; Brock & Durlauf 2001; Lindbeck et al. 2003;Lopéz-Pintado &Watts 2008; Akerlof 1980; and Kuran 1995). Models ofcontinuous decisions usually assume quadratic utility functions (Kuran
3
and Sandholm 2008 and Manski and Mayshar 2003), thus limiting theirability to analyze how the sanctioning regime affects conformity. An-other type of model (see Bernheim 1994 and Bénabou and Tirole 2006)assumes an exogenous norm in a signaling game. There individuals arepunished or rewarded for their private preferences, instead of their dec-larations or actions as in our model. Finally, our paper is related to theworks of Eguia (2013) and Clark & Oswald (1998), who, although ana-lyzing different issues than we do, do concentrate on how the curvatureof preferences affects individual behavior.1
The next section motivates our labels by considering observations ofsanctioning across societies. The model is outlined in section 3. Section4 presents the main differences between liberal and strict societies andSections 5 and 6 analyze liberal and strict societies respectively in moredetail. Section 7 presents a number of testable model implications andsuggests some methods and data sources for carrying out these tests.Section 8 concludes. Proofs are covered in the appendix.
2 Social pressure across societies
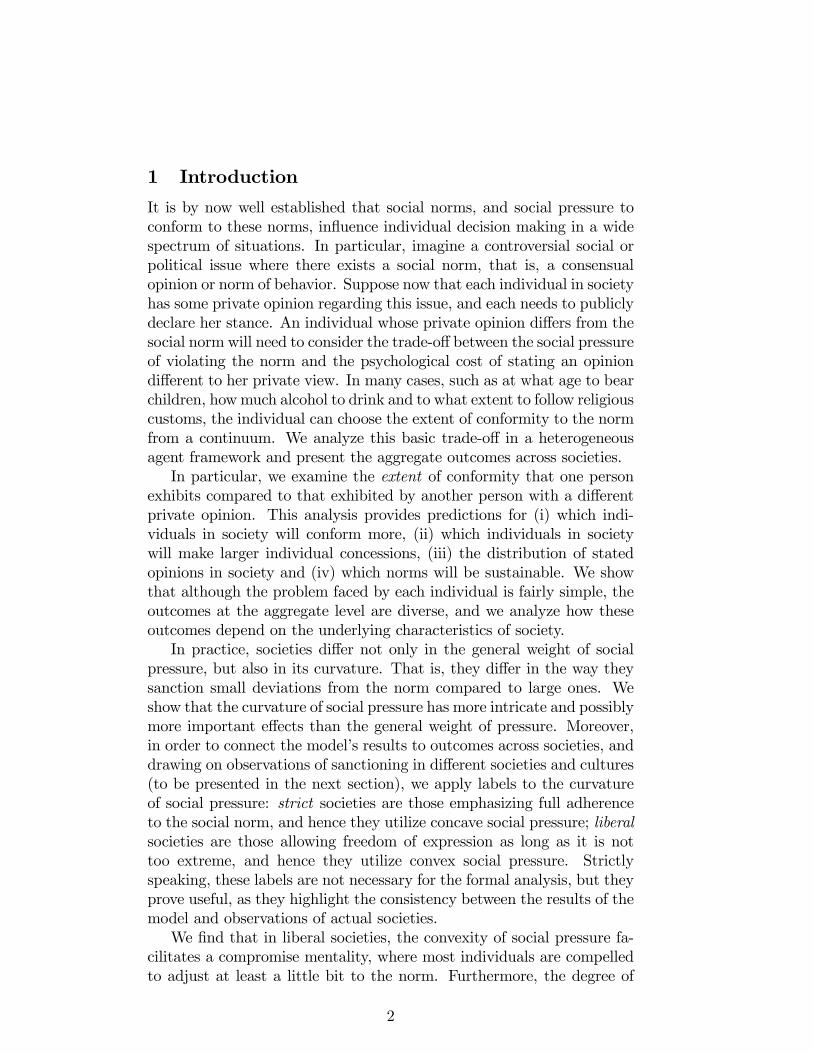
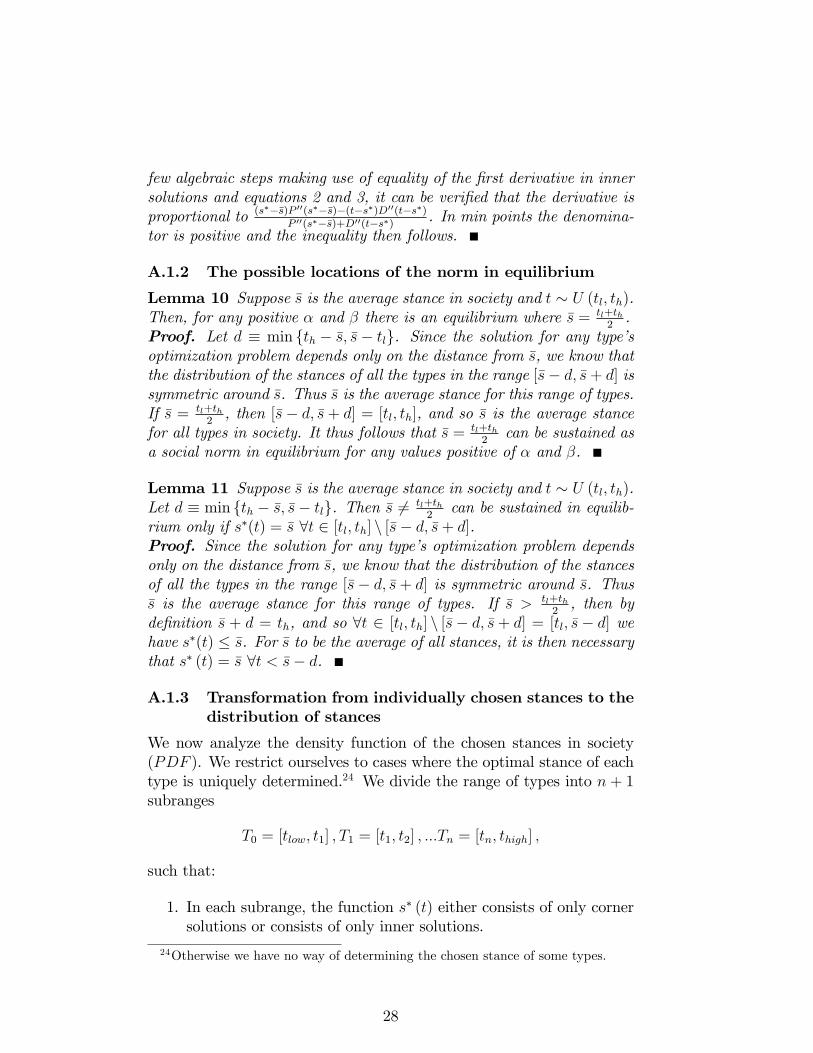
In this section we demonstrate that an important distinction between so-cieties concerns the relative strength of sanctions they impose on smallversus large deviations from the norm. One example comes from ex-periments using public goods games with punishment (Herrmann et al.2008). In these games participants punish others who contribute a differ-ent amount to a public good than they themselves do. The experimentalresults suggest that deviations are punished convexly in places such asCopenhagen, Bonn and Melbourne, while they are punished concavelyin places such as Riyadh and Muscat. Another detail to note in theresults is that for large deviations, heavier punishments were used inMelbourne compared to those used in either Riyadh or Muscat, whilefor small deviations the opposite applies. This pattern matches that ofthe stylized societies 2 (representing Muscat and Riyadh) and 3 (repre-senting Melbourne) in Figure 1.A more anecdotal demonstration of these points emerges from a crude
comparison of the sanctioning systems in the Israeli Jewish Ultraortho-dox community, or under the Taliban, with those of liberal West Euro-pean institutions.2 An important difference between the Taliban and theUltraorthodox sanctioning systems is that the Taliban use substantially
1In a subsequent paper, Michaeli & Spiro (2014), we study the conditions for thevery existence of an endogenous social norm when all individuals put pressure oneach other.
2This is to some extent a comparison of informal and formal sanctioning, but thepurpose here is to highlight that sanctioning systems vary in curvature.
4
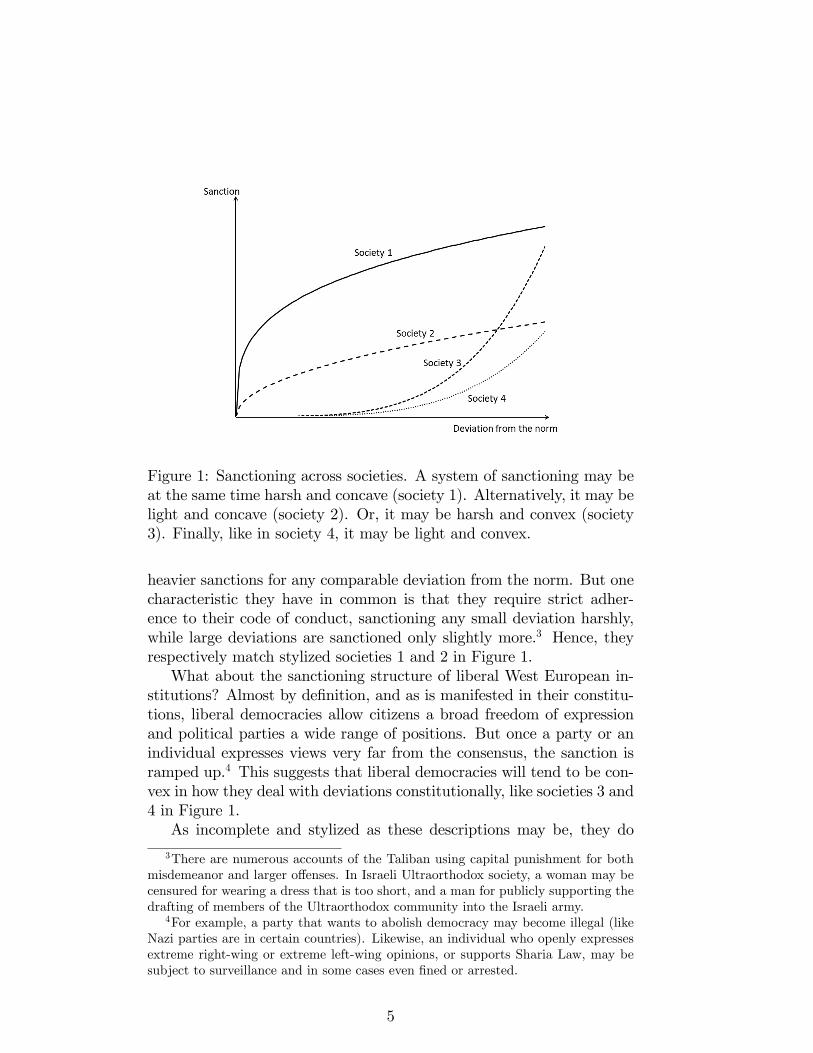
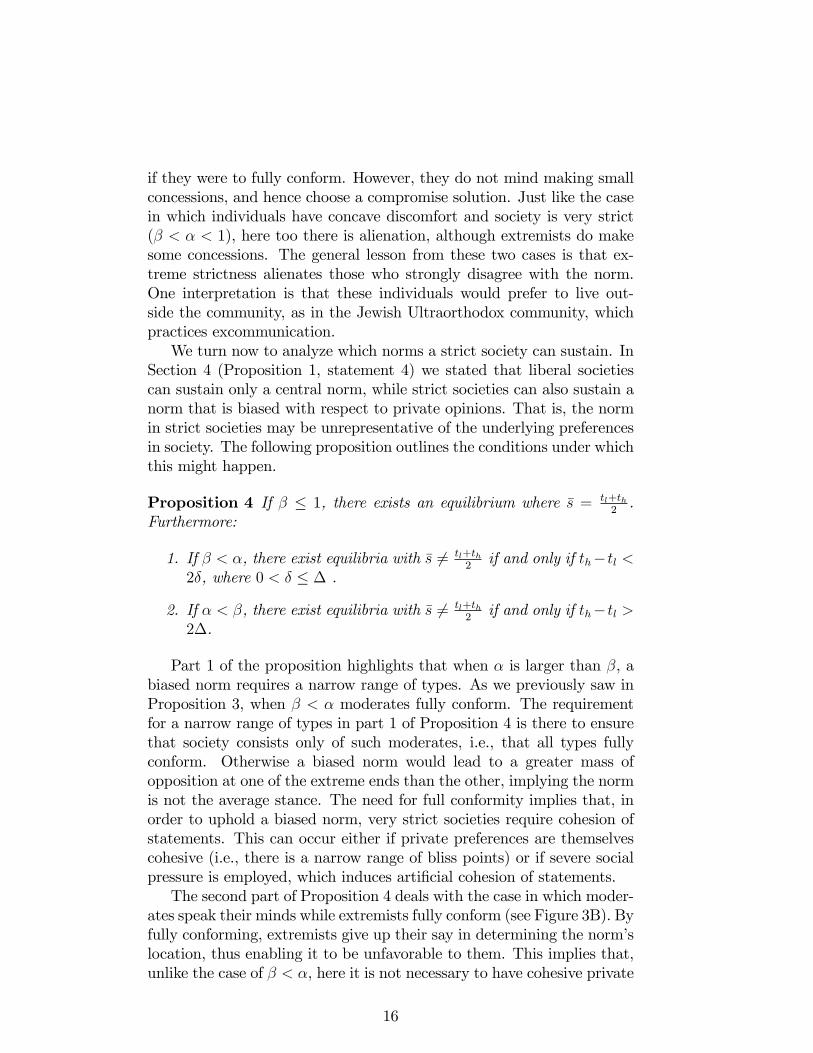
Figure 1: Sanctioning across societies. A system of sanctioning may beat the same time harsh and concave (society 1). Alternatively, it may belight and concave (society 2). Or, it may be harsh and convex (society3). Finally, like in society 4, it may be light and convex.
heavier sanctions for any comparable deviation from the norm. But onecharacteristic they have in common is that they require strict adher-ence to their code of conduct, sanctioning any small deviation harshly,while large deviations are sanctioned only slightly more.3 Hence, theyrespectively match stylized societies 1 and 2 in Figure 1.What about the sanctioning structure of liberal West European in-
stitutions? Almost by definition, and as is manifested in their constitu-tions, liberal democracies allow citizens a broad freedom of expressionand political parties a wide range of positions. But once a party or anindividual expresses views very far from the consensus, the sanction isramped up.4 This suggests that liberal democracies will tend to be con-vex in how they deal with deviations constitutionally, like societies 3 and4 in Figure 1.As incomplete and stylized as these descriptions may be, they do
3There are numerous accounts of the Taliban using capital punishment for bothmisdemeanor and larger offenses. In Israeli Ultraorthodox society, a woman may becensured for wearing a dress that is too short, and a man for publicly supporting thedrafting of members of the Ultraorthodox community into the Israeli army.
4For example, a party that wants to abolish democracy may become illegal (likeNazi parties are in certain countries). Likewise, an individual who openly expressesextreme right-wing or extreme left-wing opinions, or supports Sharia Law, may besubject to surveillance and in some cases even fined or arrested.
5
highlight that a sanctioning system should be represented by both itsgeneral harshness and its curvature. They also highlight that societiesoften considered to be strict are the ones using concave sanctioning,thus meticulously punishing minor deviations from the norm but notdistinguishing much between large and small wrongdoings. Similarly,liberal societies are those using convex sanctioning, in doing so allowingbroad freedom of speech around the norm.
3 The model
An individual is represented by a type t ∈ [tl, th] ⊂ R, which is a point onan axis of opinions. Let s be a point on that same axis, representing thepublicly declared stance of the individual (and thus a choice variable).The psychological cost of a type t who publicly declares a stance s isgiven by
D (s, t) = |s− t|α , α > 0.
D can be interpreted as the cognitive dissonance or inner discomfort feltby taking a stance that does not reflect the bliss point t.5 α captures howsensitive an individual is to small, relative to large, deviations from herbliss point, thus representing the curvature of inner discomfort. Whenα < 1, the inner discomfort is concave, representing a meticulous orperfectionist individual attitude; when α > 1 inner discomfort is con-vex, reflecting a flexibility with regard to small deviations from the blisspoint.6 An individual who takes s as a stance also feels social pressure
P (s, s̄) = K |s− s̄|β , β > 0.
Pressure arises when the stance deviates from s̄, which can be understoodas a social norm. Following the previous section, we use the labels liberalfor β > 1 and strict for β < 1. K represents the weight of social pressurerelative to the psychological cost. We will assume that the only differencebetween individuals in society concerns their bliss points (t), while α, βand K are the same for all members of society (but we will partly relaxthis assumption in Section 7). For conciseness we ignore the special caseof α = β throughout the paper as it yields no additional insights.
5We use power functions for brevity and in order to facilitate the interpretation,but nearly all upcoming results can be derived using general convex and concavefunctional forms.
6Theoretically we see no particular reason why a convex or concave psychologicalcost function would be more or less reasonable. While in previous theoretical researcha convex disutility is more common (e.g. Bernheim, 1994; Manski & Mayshar, 2003),some recent experimental research suggests concave preferences may be present inmany cases too (e.g. Kendall et al., 2015; Gino et al. 2010; Gneezy et al., 2013).
6

The total loss (or disutility) of an individual is the sum of the innerdiscomfort and the social pressure.
L (s, t) = D (s, t) + P (s, s̄) (1)
Seeking to minimize L (s, t), it is immediate that each individual willdeclare either her private bliss point t or the social norm s̄ (where bothare corner solutions), or alternatively choose a stance strictly in betweenthem (an inner solution). That is,
∀t, s∗ (t) ∈{
[s̄, t] , if s̄ ≤ t[t, s̄] , if t < s̄
,
where s∗ (t) is the stance that minimizes the loss for type t. In somecases it will be useful to compare the loss incurred by the individual inthe two corner solutions. This is a comparison of D (s̄, t) = |t− s̄|α andP (t, s̄) = K |t− s̄|β, which boils down to comparing |t− s̄| and K
1α−β .
Denoting ∆ ≡ K1
α−β is then useful for the presentation of some of theresults.To compare the extent of norm conformity of different individuals in
society, two different measures will be used.
Definition 1 The conformity of t is: − |s∗ (t)− s̄|.
This measure quantifies how close to the norm an individual’s stanceis. We will say that t conforms more than t′ if |s∗ (t)− s̄| ≤ |s∗ (t′)− s̄|.
Definition 2 The relative concession of t is: |t− s∗ (t)| / |t− s̄|.
This measure is meant to portray the step an individual takes towardsthe norm when declaring a stance, compared to the step she would take ifshe completely conformed to the norm.We say that t concedes relativelymore than t′ if |t− s∗ (t)| / |t− s̄| ≥ |t′ − s∗ (t′)| / |t′ − s̄|.The social norm s̄ is exogenous from the point of view of an indi-
vidual, but in equilibrium it will be endogenously determined by theaverage stated opinion.
s̄ = E [s∗ (t)]
We then say that society is in equilibrium if the distribution of stancesgiven a certain norm s̄ has this norm as its average stance. In order toobtain the distribution of stances we also need to specify a distributionof types, which we assume is uniform, t ∼ U [tl, th]. It should be noted,however, that all the results in the paper, except for those describingthe distribution of stances or the norm location, are independent of theunderlying distribution of types.
7

Taken as a whole, the above model provides a rich description of so-cieties (or cultures) in terms of their basic characteristics and outcomes.Each society has its own underlying characteristics consisting of the dis-tribution of private opinions (t), the curvature of social pressure (β),the curvature of the individual psychological cost (α) and the weightof pressure (K). In each society, we can then observe the behavior ofindividuals and aggregate outcomes in terms of: how conformity andconcession depend on each individual’s type; what the distribution ofpublic opinions is; and what norm the society sustains.
4 Main patterns in strict and liberal societies
The main differences in outcomes between liberal societies (β > 1) andstrict societies (β < 1) can be demonstrated using a baseline case ofα = 1.
Proposition 1 Suppose α = 1. Then:
1. Individual stances: If society is liberal, types close to the normspeak their minds (s∗ (t) = t) while types further away have innersolutions; if society is strict, types close to the norm fully conform(s∗ (t) = s̄) while types further away speak their minds.
2. Concession: If society is liberal, relative concession is weakly in-creasing in |t− s̄|; if society is strict, relative concession is weaklydecreasing in |t− s̄|.
3. Stance distribution: If society is liberal, the distribution of stancesis either uniform or bimodal; if society is strict, the distribution ofstances is unimodal.
4. Norm location: If society is liberal, s̄ = tl+th2; if society is strict,
any s̄ ∈{tl+th
2
}∪ [th −∆, tl + ∆] can be sustained.
With regard to liberal societies, the first statement of the propositionexpresses that moderates, who disagree only slightly with the norm, willspeak their minds, while extremists, whose private views are furtheraway from the norm, will moderate their public statements. This followsalmost directly from the fact that pressure is convex, implying lenientpressure on small norm deviations. The second statement reflects thislogic by saying that liberal societies achieve relatively large concessionsfrom extremists compared to moderates. Extremists will compromisejust as much as needed to reduce the most severe pressure and so willtend to bunch at a certain distance from the norm. As this happens on
8

both sides of the norm, the distribution will be bimodal (statement 3)and society will be polarized.7
Meanwhile, the meticulousness of strict societies discourages compro-mise —individuals will either speak their minds or completely conform(statement 1). Unlike liberal societies, strict societies will be particularlyeffective in getting full conformity from those who nearly agree with thenorm anyway, while essentially not affecting the declarations of thosewho strongly disagree with it. This implies relatively large concessionsby moderates (statement 2). The concentration of such people at thenorm creates a unimodal distribution of stances (statement 3). Thiswill be at the expense of the possible moderation of those who stronglydisagree with the norm, who will speak their minds openly. An inter-pretation of this is that strict societies alienate extremists. To createcohesion, the strict society will need to use heavy pressure (large K) toconvince extremists to fully align with the norm.Following the fourth statement regarding norm location, the model
predicts that liberal societies are bound to have norms that are repre-sentative of the actual private sentiments in society. The intuition forthis is that in liberal societies everyone chooses a stance on her side ofthe norm and nobody fully conforms. Thus, a biased norm will implytoo many declared stances on one side of the norm, preventing it frombeing the average stance. In contrast, in strict societies the norm maywell be biased with respect to private opinions, because strict societiescan induce the full conformity of an individual, and when this happensthe individual has no effect on the norm’s location (we elaborate on thisin Section 6).One interesting difference between the two kinds of societies is that
the most extreme deviation from the norm will often be more extremein strict societies than in liberal ones. This result is surprising as itcan occur even when pressure is higher in strict societies. To see this,consider the following simple example. Compare two societies, one strictand one liberal, such that in both societies tl = −1, th = 1 and s̄ = 0,and both have the same K < 1. First note that the pressure on anystance is at least as severe in the strict society as in the liberal one.Second, it is easy to show that the most extreme types, th, and tl, arespeaking their minds (|s| = 1) in the strict society, while choosing acompromise stance (|s| < 1) in the liberal one, provided that it is liberalenough (β > 1/K).8 In this case, the largest norm deviation will be
7If the distribution of types is too narrow to have extremists who compromise,the distribution of stances will be uniform.
8To see why s∗ (th) = th in the strict society, use part (1) of the proposition whilenoting that L (th, th) = K < 1 = L (0, th), which means that th prefers speaking her
9
observed in the strict society, even though it is harsher toward normbreakers.The statements of Proposition 1 need to be slightly refined when
considering α 6= 1. In the next two sections we show that it is the degreeof liberalism or strictness relative to the curvature of inner discomfortthat drives most of the results —that is, whether β or α is greater —andthat the relationship between the two provides additional insights.
5 Liberal societies
In this section we examine the case where β ≥ 1 while α may take anypositive value. In this case there is an inner solution for every type t ifα > 1 and a possibility for both inner and corner solutions if α ≤ 1. Theproperties of stances and conformity in liberal societies are summarizedin the following proposition.
Proposition 2 If β ≥ 1 then:
1. If β < α, then |s∗ (t)− s̄| is increasing and convex in |t− s̄| , i.e.,conformity is decreasing in |t− s̄|. Moreover, the relative conces-sion is decreasing in |t− s̄| and the distribution of s∗ is unimodal.
2. If 1 < α < β, then |s∗ (t)− s̄| is increasing and concave in |t− s̄| ,i.e., conformity is decreasing in |t− s̄|. Moreover, the relative con-cession is increasing in |t− s̄| and the distribution of s∗ is bimodal.
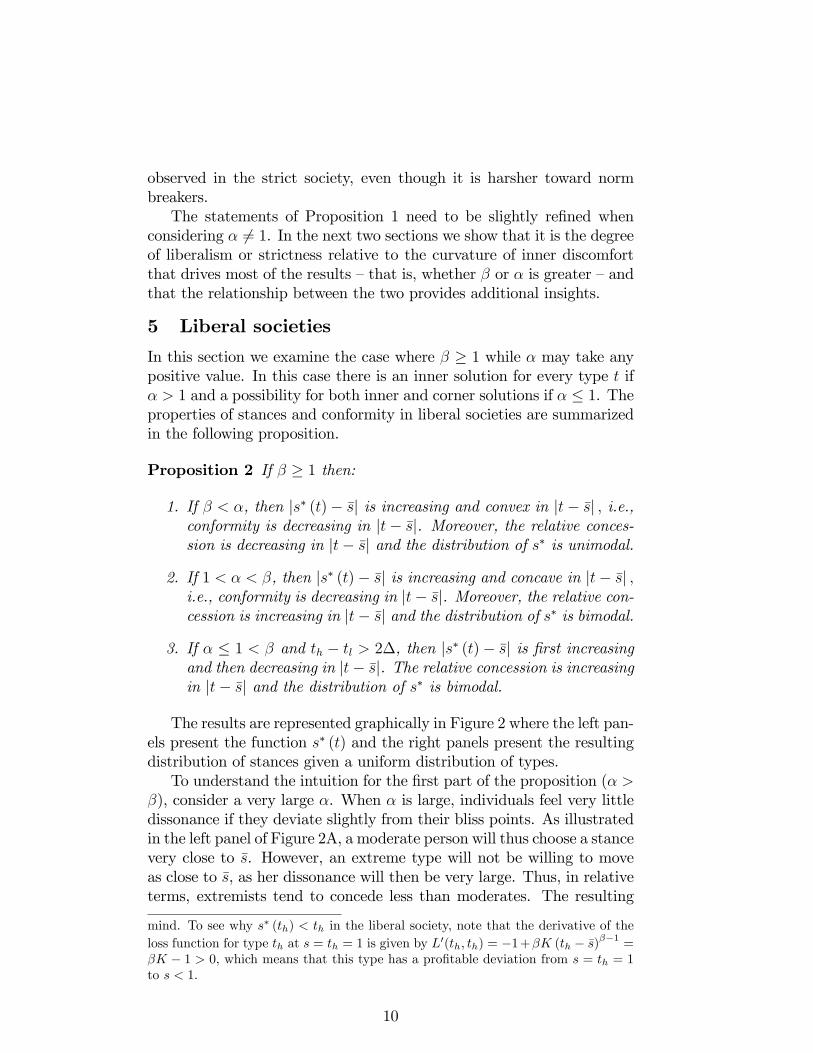
3. If α ≤ 1 < β and th − tl > 2∆, then |s∗ (t)− s̄| is first increasingand then decreasing in |t− s̄|. The relative concession is increasingin |t− s̄| and the distribution of s∗ is bimodal.
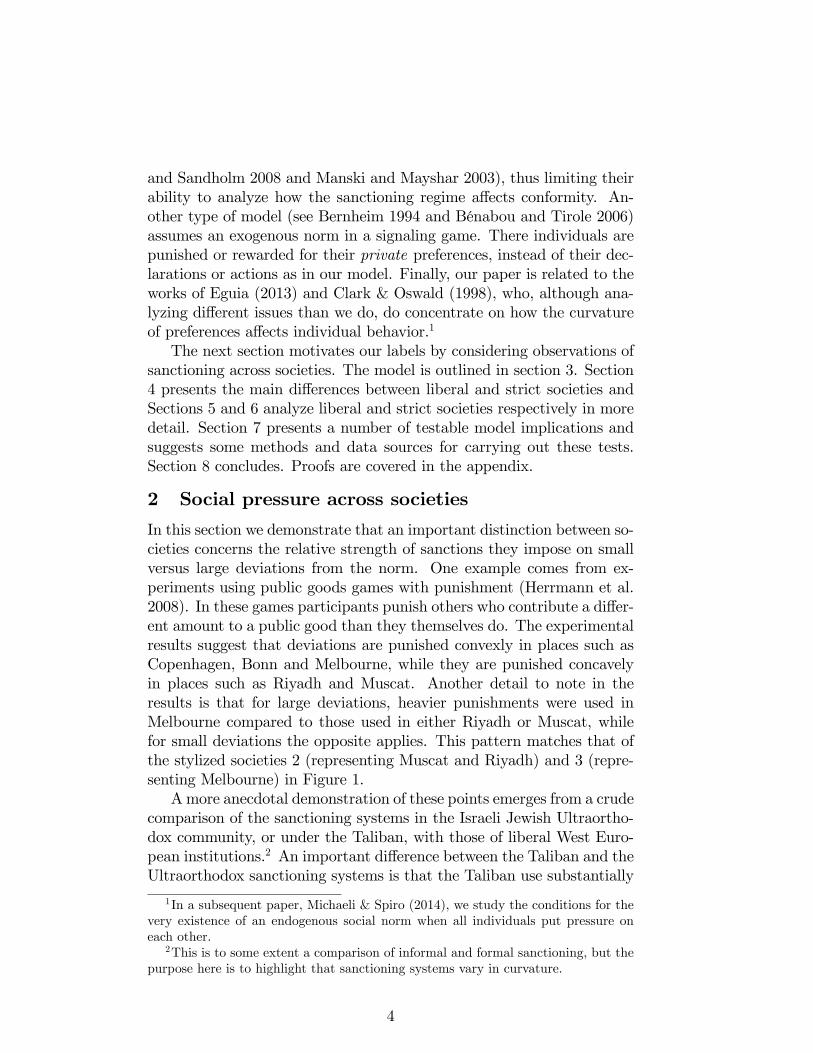
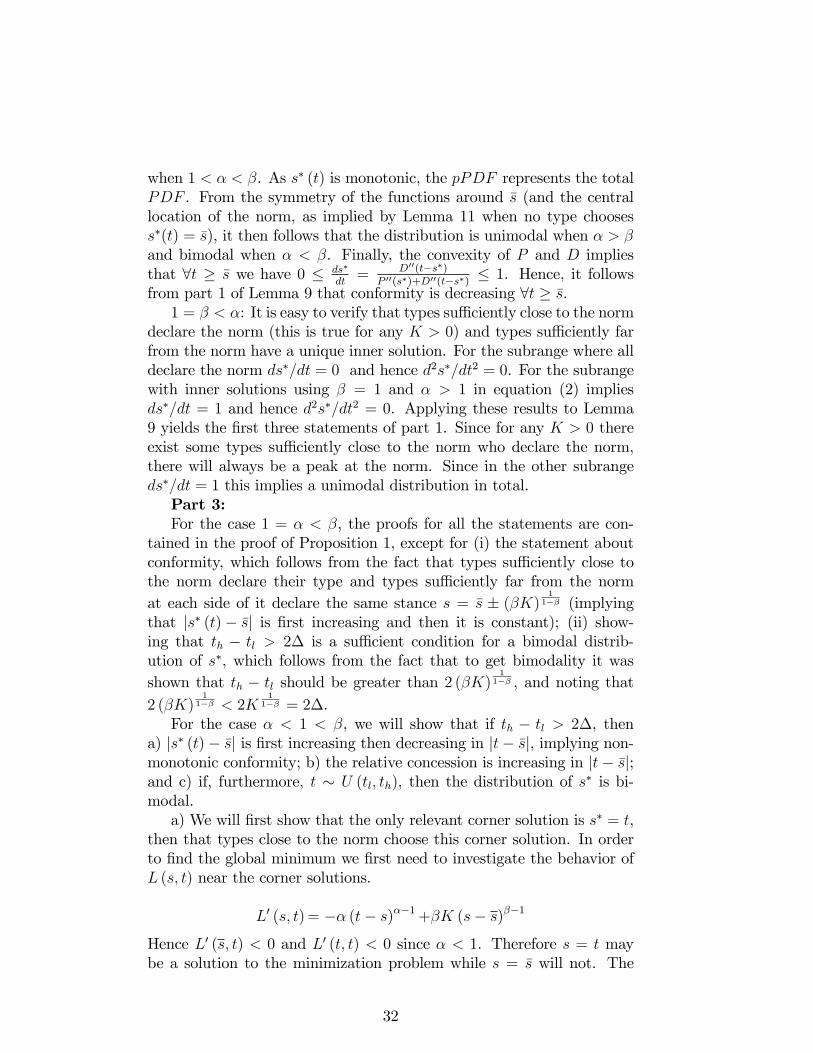
The results are represented graphically in Figure 2 where the left pan-els present the function s∗ (t) and the right panels present the resultingdistribution of stances given a uniform distribution of types.To understand the intuition for the first part of the proposition (α >
β), consider a very large α. When α is large, individuals feel very littledissonance if they deviate slightly from their bliss points. As illustratedin the left panel of Figure 2A, a moderate person will thus choose a stancevery close to s̄. However, an extreme type will not be willing to moveas close to s̄, as her dissonance will then be very large. Thus, in relativeterms, extremists tend to concede less than moderates. The resulting
mind. To see why s∗ (th) < th in the liberal society, note that the derivative of theloss function for type th at s = th = 1 is given by L′(th, th) = −1+βK (th − s̄)β−1
=βK − 1 > 0, which means that this type has a profitable deviation from s = th = 1to s < 1.
10

0 0.25 0.5 0.75 10
0.25
0.5
0.75
1
t
s*(t)
Stance per individual
0 0.25 0.5 0.75 1s
Num
ber o
f ind
ivid
uals
Distribution of stances
0 0.25 0.5 0.75 10
0.25
0.5
0.75
1
t
s*(t)
0 0.25 0.5 0.75 1s
Num
ber o
f ind
ivid
uals
0 0.25 0.5 0.75 10
0.25
0.5
0.75
1
t
s*(t)
0 0.25 0.5 0.75 1s
Num
ber o
f ind
ivid
uals
C:α<1<β
B: 1<α<β
A: 1<β<α
Figure 2: The left panels depict s∗ (t) (full line) and s = t (dashedline). The right panels depict the distribution of stances. In all graphst ∼ U (0, 1) and s̄ = .5. Panel A: K = 0.5, α = 2, β = 1.2. Panel B:K = 2, α = 1.1, β = 2. Panel C: K = 2, α = 0.85, β = 1.5.
11
distribution of stances (right panel) will therefore be a concentration ofstatements around the norm, created by the moderate types.To understand the intuition for the second and third parts of the
proposition (β > α), consider now a very large β. A large β impliesthat individuals feel very little pressure when they deviate a little froms̄, but the pressure rises steeply when the deviation from s̄ is large.Consequently, moderates will move only slightly from their bliss points,if at all (left panels of Figures 2B and 2C). Meanwhile, extreme types willtake large steps from their bliss points, due to the high social pressureon large deviations from the norm. The result will be a concentrationof extreme types at a certain distance from the norm on each side ofit and society will look polarized, as is illustrated in the right panels ofFigures 2B and 2C. The baseline case of α = 1 is a special case of this(see Proposition 1).There is, however, an important twist to liberal societies when inner
discomfort is concave (α < 1 < β). When individuals are sensitive tosmall deviations from their bliss points, they will tend to either speaktheir minds or, once they deviate from their bliss points, state almostanything that lowers social pressure. Since in liberal societies pressureis convex, moderate individuals will be under low pressure and hencenot make any concessions. Meanwhile, extremists would be under highpressure if they spoke their minds. Therefore, they will be forced toconcede, and as α < 1, these concessions will be quite extensive, implyingthat extremists will conform even more than some moderates —a patternthat may be called inversion of opinions.9 As a result, conformity willbe non-monotonic in the distance from the norm, as illustrated in theleft panel of Figure 2C.10
In the baseline case of Section 4 we saw that liberal societies aremainly effective in inducing conformity among extremists and that thisleads to a bimodal distribution of stances. The analysis in this sectionmakes an important refinement to these results. If the degree of liberal-ism is high (i.e., β > α), society is indeed mainly directed at inducingconformity by extremists, which leads to bimodality. On the other hand,a low degree of liberalism (i.e., β < α) induces conformity by moderates,leading to a unimodal concentration.
9In fact, we get inversion at two levels. Firstly, between extremists and moderates,the extremists conform more than some moderates. Secondly, within the group ofextremists, the most extreme conform more than the less extreme.10The third part of the proposition considers only the case where the distribution
of types is suffi ciently broad, th − tl > 2∆. If the distribution of types is too narrowto have extremists who compromise, the distribution of stances will be uniform.
12
6 Strict societies
In this section we examine the case where β ≤ 1 while α can take anypositive value. In this case, if α ≤ 1, any inner solution to the indi-vidual’s minimization problem is a maximum, implying that individualswill either fully conform or speak their minds. This is intuitive, as anindividual with concave discomfort in a strict society, who takes a stancein-between t and s̄, would feel both great inner discomfort and heavypressure. When α > 1, there is a possibility for both inner and cornersolutions. The properties of stances and conformity in a strict societyare summarized in the following proposition.11
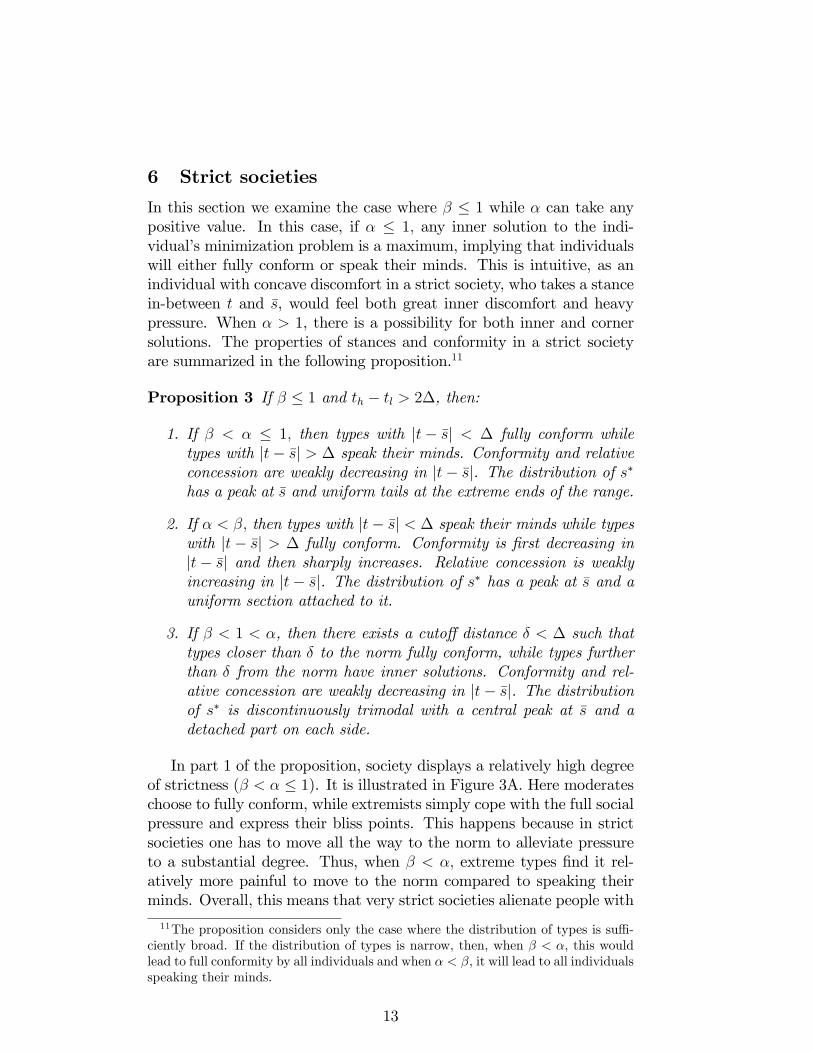
Proposition 3 If β ≤ 1 and th − tl > 2∆, then:
1. If β < α ≤ 1, then types with |t− s̄| < ∆ fully conform whiletypes with |t− s̄| > ∆ speak their minds. Conformity and relativeconcession are weakly decreasing in |t− s̄|. The distribution of s∗has a peak at s̄ and uniform tails at the extreme ends of the range.
2. If α < β, then types with |t− s̄| < ∆ speak their minds while typeswith |t− s̄| > ∆ fully conform. Conformity is first decreasing in|t− s̄| and then sharply increases. Relative concession is weaklyincreasing in |t− s̄|. The distribution of s∗ has a peak at s̄ and auniform section attached to it.
3. If β < 1 < α, then there exists a cutoff distance δ < ∆ such thattypes closer than δ to the norm fully conform, while types furtherthan δ from the norm have inner solutions. Conformity and rel-ative concession are weakly decreasing in |t− s̄|. The distributionof s∗ is discontinuously trimodal with a central peak at s̄ and adetached part on each side.
In part 1 of the proposition, society displays a relatively high degreeof strictness (β < α ≤ 1). It is illustrated in Figure 3A. Here moderateschoose to fully conform, while extremists simply cope with the full socialpressure and express their bliss points. This happens because in strictsocieties one has to move all the way to the norm to alleviate pressureto a substantial degree. Thus, when β < α, extreme types find it rel-atively more painful to move to the norm compared to speaking theirminds. Overall, this means that very strict societies alienate people with
11The proposition considers only the case where the distribution of types is suffi -ciently broad. If the distribution of types is narrow, then, when β < α, this wouldlead to full conformity by all individuals and when α < β, it will lead to all individualsspeaking their minds.
13

0 0.25 0.5 0.75 10
0.25
0.5
0.75
1
t
s*(t)
Stance per individual
0 0.25 0.5 0.75 1s
Num
ber o
f ind
ivid
uals
Distribution of stances
0 0.25 0.5 0.75 10
0.25
0.5
0.75
1
t
s*(t)
0 0.25 0.5 0.75 1s
Num
ber o
f ind
ivid
uals
0 0.25 0.5 0.75 10
0.25
0.5
0.75
1
t
s*(t)
0 0.25 0.5 0.75 1s
Num
ber o
f ind
ivid
uals
A:β<α≤1
B:α<β≤1
C:β<1<α
Figure 3: The left panels depict s∗ (t) (full line) and s = t (dashedline). The right panels depict the distribution of stances. In all graphst ∼ U (0, 1) and s̄ = .5. Panel A: K = 0.5, α = 0.85, β = 0.5. Panel B:K = 2, α = 0.5, β = 0.85. Panel C: K = 0.5, α = 1.25, β = 0.8.
14
opinions far from the norm, but compel those with opinions close to thenorm to fully conform.When society is strict to a lesser degree, so that β > α (part 2 of
Proposition 3), extreme types fully conform to the norm while moderatesspeak their minds. The intuition is that moderates are unwilling toconform as the psychological cost to them, of deviating from their blisspoint, is very concave. For extremists, however, not conforming willimply a great deal of social pressure. All in all, this kind of society willbe good at attracting extremists to the norm while “allowing”freedom ofexpression of those (suffi ciently) close to it.12 The observable outcomeof this case is a distribution that looks like a standard concentrationof individuals at and around the norm (right panel of Figure 3B). Butthere is an important twist. Here we get the pattern of inversion ofopinions, where those who despise the norm the most are the (only)ones conforming.By comparing part 1 and part 2 of the proposition, we see that
both kinds of strict society with concave discomfort have one thing incommon —they foster an all-or-nothing mentality, making each personeither conform fully or not at all. But the degree of strictness leads toan important refinement as it yields further predictions that are com-pletely opposite depending on whether β > α or β < α. Firstly, lessstrict societies (β > α) are predicted to induce extremists to conform,while stricter societies (β < α) are predicted to induce moderates toconform. Secondly, less strict societies are predicted to have a unimodalconcentration around the norm (right panel of Figure 3B), while strictersocieties are predicted to have a peak at the norm with detachment atthe extremes (right panel of Figure 3A).In the third part of the proposition, when α > 1, only large deviations
from the bliss point create inner discomfort. We then get a combina-tion of corner and inner solutions, where individuals with opinions farenough from the norm choose an inner solution, while moderates com-pletely conform to the norm. The right panel of Figure 3C illustratesthe resulting distribution of stances. The distribution has a peak at s̄and a detached part towards each of the extreme ends. The intuitionfor this is that, as society is strict, small deviations from the norm drawrelatively heavy pressure. When this is the case and individuals perceivesmall deviations from their bliss points as almost painless, moderates dobest by completely conforming to the social norm. In comparison, be-cause of the convexity of D, extremists would feel too much discomfort
12In fact, for any finite K, no matter how large, there will always be a group oftypes close to the norm who speak their minds. Hence, full conformity by all cannotbe attained here.
15
if they were to fully conform. However, they do not mind making smallconcessions, and hence choose a compromise solution. Just like the casein which individuals have concave discomfort and society is very strict(β < α < 1), here too there is alienation, although extremists do makesome concessions. The general lesson from these two cases is that ex-treme strictness alienates those who strongly disagree with the norm.One interpretation is that these individuals would prefer to live out-side the community, as in the Jewish Ultraorthodox community, whichpractices excommunication.We turn now to analyze which norms a strict society can sustain. In
Section 4 (Proposition 1, statement 4) we stated that liberal societiescan sustain only a central norm, while strict societies can also sustain anorm that is biased with respect to private opinions. That is, the normin strict societies may be unrepresentative of the underlying preferencesin society. The following proposition outlines the conditions under whichthis might happen.
Proposition 4 If β ≤ 1, there exists an equilibrium where s̄ = tl+th2.
Furthermore:
1. If β < α, there exist equilibria with s̄ 6= tl+th2if and only if th−tl <
2δ, where 0 < δ ≤ ∆ .
2. If α < β, there exist equilibria with s̄ 6= tl+th2if and only if th−tl >
2∆.
Part 1 of the proposition highlights that when α is larger than β, abiased norm requires a narrow range of types. As we previously saw inProposition 3, when β < α moderates fully conform. The requirementfor a narrow range of types in part 1 of Proposition 4 is there to ensurethat society consists only of such moderates, i.e., that all types fullyconform. Otherwise a biased norm would lead to a greater mass ofopposition at one of the extreme ends than the other, implying the normis not the average stance. The need for full conformity implies that, inorder to uphold a biased norm, very strict societies require cohesion ofstatements. This can occur either if private preferences are themselvescohesive (i.e., there is a narrow range of bliss points) or if severe socialpressure is employed, which induces artificial cohesion of statements.The second part of Proposition 4 deals with the case in which moder-
ates speak their minds while extremists fully conform (see Figure 3B). Byfully conforming, extremists give up their say in determining the norm’slocation, thus enabling it to be unfavorable to them. This implies that,unlike the case of β < α, here it is not necessary to have cohesive private
16

opinions in order to sustain a biased norm. In fact, a broader range oftypes enables a broader range of norms. This is so because the normhas to balance only the non-conforming statements expressed by thoseclose to it — individuals within distance ∆ from the norm. A broaderrange of types —i.e., less cohesive private opinions —enables the norm tobe located further away from the center of the type distribution withoutunbalancing these non-conforming statements.
7 Testable implications and further results
This section highlights some of the model predictions and presents sev-eral further results that can be empirically tested. Each subsection con-tains an empirical prediction, the intuition behind it and a description ofmethods and sources of data that can be used for testing it. In subsection7.1 we also present an illustrative test of the prediction in question. Thepredictions presented in subsections 7.1 to 7.3 are independent of thedistribution of types and hence do not require knowing it. They are alsoindependent of α and can therefore be tested even when α is unknownor heterogeneous in society. Section 7.4 presents a prediction that isdependent on the type distribution and on α and provides applicationswhere it may be tested.
7.1 The effect of β on full conformity and maximumnorm deviation
Throughout the paper, we have highlighted that strict societies tend tofacilitate the choice of corner solutions by the individual, while liberalsocieties tend to facilitate inner solutions. The following proposition canbe used to empirically test this claim. For that purpose, we denote bysh the stance that constitutes the maximal feasible deviation from thenorm (to the right).
Proposition 5 Suppose sh − s̄ = 1. Then the proportion of individualschoosing s ∈ {s̄, sh} is weakly decreasing in β.
By normalizing sh−s̄ to 1 we are essentially fixing the pressure on themaximal deviation to K. Hence, the proposition considers the pure ef-fect of a change in the curvature of pressure (β) on the statements madein equilibrium. It essentially says that, ceteris paribus, a stricter societywill show larger concentrations of stances at the edges of the distribution(at s̄ and at sh). The intuition for this is straightforward. When decreas-ing β, the social pressure at s̄ and sh is unchanged, while it increases atall intermediate stances. This means that full conformity and maximaldeviation become relatively more attractive, thus increasing the share
17

of individuals taking such stances. The result is independent of the t-distribution, α and K. Naturally, societies may differ with respect tothese parameters. However, as long as these parameters are either un-correlated with β or can be controlled for in a regression, the propositiongives a testable prediction.As an example, consider religious practice in relation to a religious
norm. The sixth wave of the World Value Survey (WVS) measurespublic support for statements such as: “the only acceptable religion ismy religion” (V154) and “people who belong to different religions areprobably just as moral as those who belong to mine” (V156).13 Thesupport for these statements can be thought of as measuring β. Forinstance, agreement with “the only acceptable religion is my religion”suggests an intolerance towards small deviations from one’s own religionor extent of religiosity — a small β. According to Proposition 5, thesmaller β is in a society, the larger should be the total share of individualseither fully adhering to the norm or maximally disobeying it. Thus,one can collect data on religious norms and religious practices acrosscountries and test the prediction using the proxy for β obtained fromthe WVS.As a rough illustration of how the test can be performed, consider
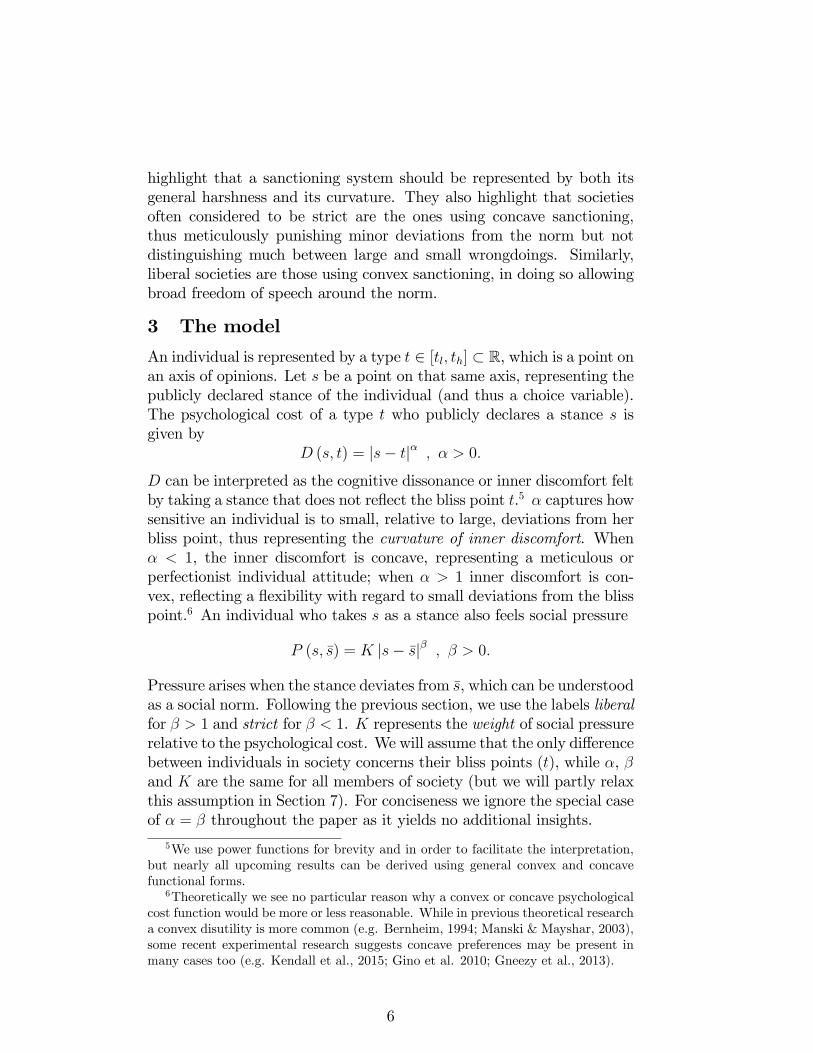
the answers to the WVS question (V146) “How often do you pray?”. InMuslim societies, the norm can be plausibly assumed to be five times aday, as this is the commandment stated in the Koran. In the WVS, thiswould be reported as the maximal frequency of praying (“several times aday”). The largest possible deviation from the norm is not to pray at all,which corresponds to answering “never, practically never”in the survey.Thus, testing our prediction using this question is straightforward. Ifthe prediction is correct, then β should be negatively correlated with theshare of individuals reporting either of these two extremes. Likewise, βshould be positively correlated with the share of individuals reportingintermediate frequencies of praying.The WVS includes 16 countries in which the major religion is Islam
and for which the necessary data is available (see the list and furtherdetails in the appendix). We ran a simple regression with no controlsto examine the fraction of people who report either the maximum orthe minimum frequency of prayers as a function of our proposed mea-sure of β.14 The left panel of Figure 4 displays the data and regression
13The WVS has been used extensively in the economics literature to measure cul-tural traits, values and norms. See Knack and Keefer (1997) for an early application.Like in the previous literature, we treat answers in the WVS as being truthful.14More precisely, our measure of β is the share of people who, with respect to the
statement “The only acceptable religion is mine”, answer “strongly disagree”, minus
18

graph. As predicted, the slope of the regression line is negative (it isalso statistically significant). This result is further corroborated by thepositive (and significant) correlations between our proxy for β and eachintermediate extent of prayer. One such example is depicted in the rightpanel of Figure 4. It shows that the share of individuals praying “oncea day” to “several times a week” is positively correlated with the βproxy.15 The results suggest that stricter societies are not necessarilymaking people behave more religiously in general, but are specificallyeffective in fostering corner solutions.16
As a simple robustness check, we used the answers to two additionalWVS questions as controls. We chose these specific controls in order toaddress concerns that our results might simply be driven by strict soci-eties being more religious and harsher toward religious deviations. Tomeasure the degree of religiosity, we used the share of individuals whodeclared they were religious (V147). This can be thought of as a proxyfor the location of the type distribution in religious space. The extent ofagreement with the statement “An essential characteristic of democracyis: Religious authorities ultimately interpret the laws” (V132) can bethought of as a proxy forK.17 All of the previous results were replicated.The regression tables are reported in the appendix. Given that the testsare based on cross country data using a small number of countries, theseresults should of course be interpreted with caution. Furthermore, theresults merely show correlations and do not establish causality. Prefer-ably, a more extensive test would use the proxy for β from the WVS inorder to test the prediction in a natural or a field experiment. Alterna-tively, it would be useful to control for religiosity and other factors on
the share answering “strongly agree”.15The WVS question on frequency of praying contains 10 possible answers, two of
which are “no answer”and “don’t know”. As for the other eight possible answers,we took the intermediate six, ranging from “once a day” to “less often than oncea year”, and divided them into three pairs of adjacent answers (corresponding toanswer codes 2-3, 4-5, 6-7). For each such pair we found a positive and significantslope for the fraction of people reporting an answer within the pair as a function ofour measure of β. Figure 4 (right) presents the regression graph for the first pair.The regression tables for all pairs can be found in the appendix.16The correlation between our measure of β and the share of people who report
the maximum frequency of praying (“several times a day”) is significantly negative,while the correlation between our measure of β and the share of people who reportthe minimum frequency of praying (“never, practically never”) is insignificant andvery close to zero. The former is thus in line with the model, while the latter neithercorroborates nor refutes it. The latter does, however, further corroborate that strict-ness, as we measure it, does not simply imply more praying in general, as otherwisethe share of those never praying should have been lower in stricter societies.17The scale goes from 1 (“Not an essential characteristic of democracy”) to 10
(“An essential characteristic of democracy”). We use the mean.
19

Figure 4: Data and estimated linear correlation between the proxy forβ from answers to WVS V154 (share of people answering “strongly dis-agree”minus share answering “strongly agree”) and reported extent ofpraying (WVS V146). The left panel displays the share of people pray-ing “several times a day”or “never, practically never”. The right paneldisplays the share of people praying “once a day”or “several times perweek”.
an individual level. The purpose here has mainly been to illustrate howthe model could be tested. However, at least as a first pass, we do findthe results to be a sign of the potency of the model to generate validpredictions.
7.2 The effect of K on full conformityAn implication of the model that follows directly from Propositions 2and 3 and their proofs is the following.
Proposition 6 An increase in K (weakly) increases the number of in-dividuals stating s̄ if and only if β ≤ 1.
The proposition predicts that increasing the weight of pressure shouldproduce a higher number of full conformers only in strict societies. Inliberal societies, such an increase may shift people in the direction ofthe norm, but will not induce full conformity. Here again, the tendencyof strict societies to facilitate the choice of corner solutions and thetendency of liberal societies to facilitate the choice of inner solutionsjointly determine the result.
20
To see how this prediction can be tested, consider the dictator game.Krupka and Weber (2013) measured the social appropriateness of divi-sions in the dictator game and found not only that an equal split is themost socially appropriate division (thus constituting a norm), but alsothat the social pressure on deviations from an equal split is concave.In light of Proposition 6, this suggests that, following an increase in theprominence of social pressure in the dictator game, we should observe anincrease in the number of individuals choosing an equal split. In order totest this prediction, one can manipulate the effect of K in the dictatorgame by conducting the same experiment, once under anonymity andonce under full transparency, and then observe how divisions changebetween the two settings. Alternatively, one can vary the perceivedprobability that subjects are observed by others.An alternative application would be to test the prediction on sensitive
issues such as sexual preference or political opinion. To do this, the firststep would be to elicit the perceived social appropriateness (i.e., the normand the curvature of social pressure) of certain preferences and opinionsusing the technique of Krupka and Weber (2013).18 The next step wouldbe to ask (a new set of) respondents to state their own preferences (s)while varying K across treatments. In order to vary K, one can usedifferent degrees of anonymity in the survey. One simple way to do thiswould be to use the randomized response technique. Here, respondentswould roll a die that decides whether they should answer truthfully oranswer randomly with the help of a new roll of the die.19 By varyingthe probability of having to give a truthful answer, the survey makercan vary K: a higher probability of having to answer truthfully impliesa higher K. The proposition then predicts that, as we increase K, weshould see a stronger effect of clustering at s̄ in groups and issues forwhich the initial step showed that β ≤ 1, compared to groups and issuesfor which β > 1.
18The problem of identifying norms and pressure in surveys has been that responsesmay be confounded by what the responders personally think is right and wrong. Toget a more direct measurement of collectively perceived appropriateness, Krupka andWeber (2013) ask individuals anonymously for the social appropriateness of differentbehaviors and reward them for matching the responses of others.19The randomized response technique (Warner, 1965) was devised in order to elicit
private information or attitudes on sensitive issues. In the original usage of thetechnique, subjects privately flip a coin before answering a binary question to whicha positive answer is regarded sensitive, and are instructed to answer “yes”if the coincomes up tails and truthfully if it comes up heads. This method does not enablethe experimenter to get data on the individual level, but aggregate distributions canbe easily elicited. It is straightforward to extend this technique in order to enablenon-binary responses by, for instance, using a die instead of a coin as we suggesthere.
21
7.3 The effect of β on small vs. large norm devia-tions
The two previous subsections dealt with the effect of pressure on thetendency to choose full conformity and maximum deviation from thenorm. This subsection deals with the effect of pressure on relativelysmall vs. relatively large deviations from the norm. As will be shown,these effects can be important from the point of view of a legislator.
Proposition 7 Let Slow denote the set of all observed stances in ]s̄, s̄+1]and let Shigh denote the set of all observed stances above s̄ + 1. Then,holding s̄ constant, |Slow| − |Shigh| weakly increases in β.
The proposition examines the distribution of stances to the right ofthe norm and compares the proportion of stances “close” to it (s ∈Slow) to the proportion “far” from it (s ∈ Shigh). An increase in βimplies that the pressure decreases in Slow while it increases in Shigh,leading individuals to have a higher tendency to choose stances in Slowand a lower tendency to choose stances in Shigh (so that |Slow| − |Shigh|increases). The cutoff between the two regions is at distance 1 from thenorm, so that s = s̄ + 1 is a “flexpoint”, around which the pressurefunction rotates as β increases.20
This result has important implications for legal sanctions. Enforcinglaws under a given budget constraint often implies a trade-off betweencatching small and large offenders. For example, if the police try tostop every driver they see exceeding the speed limit even slightly, thiswill tend to lower the probability of catching the very fast drivers. Inpractical terms, such a policy resembles a lowering of β. The testableprediction of the proposition is that such a change in enforcement willlead to a decrease in small deviations from the speed limit but an increasein large deviations.
7.4 Relative concession across individualsIn Definition 2 we introduced relative concession as a measure for thestep an individual takes towards the norm when declaring a stance, com-pared to the step she would take if she completely conformed. Part 2of Proposition 1 then states that, when α = 1, relative concession in-creases in |t− s̄| when pressure is convex and decreases in |t− s̄| when20Note that unlike Proposition 5, where we set sh−s̄ = 1 in order to fix the maximal
pressure, Proposition 7 has interesting implications when sh− s̄ > 1, so that changingβ affects pressure on small and large deviations differently. The flexpoint itself canbe generalized to any location. This requires a small manipulation of the pressurefunction to P = K (A (s− s̄))β , with s = s̄+ 1/A being the flexpoint.
22

pressure is concave. As the case of α = 1 may reasonably apply tosettings in which the cost of deviation is monetary, this result yields atestable prediction in the realm of tax evasion.The true income of all individuals is often unobservable. But for
those who are audited, the authorities usually conduct a thorough in-vestigation of the actual tax due. In terms of our model, the tax duecan be thought of as the value of t − s̄ (where s̄ can be set to zero,reflecting that all taxes should be paid). The tax an individual evadesis the equivalent of s − s̄ in the model. The relative concession thuscaptures the share of tax due that was actually paid by an individual( t−st−s̄). Hence, the prediction is that a convex sanctioning of tax evasionwill lead heavy debtors to pay a higher share of their taxes than smalldebtors. Concave sanctioning, on the other hand, will lead small debtorsto pay most of their taxes, while achieving low compliance among heavydebtors.21
The next corollary is a generalization of the result about relativeconcession to any value of α.
Corollary 8 The relative concession is increasing in |t− s̄| if and onlyif β > α.
This generalization follows directly from Propositions 2 and 3.22 Ifone has access to both the private (t) and the public (s) opinions of indi-viduals in a certain setting, this corollary can be tested as follows. First,standard methods of structural estimation enable one to jointly estimateα, β and K using our theoretical mapping from t to s∗(t;α, β,K). Thisallows inferring which of α and β is the greatest. Then, Corollary 8 canbe tested by examining changes in the relative concession of an individ-ual as a function of changes in s̄ (i.e., changes in the peer compositionaround her).To see how a test can be implemented, consider for instance students’
achievements in school, where the class composition can be expected to
21Note that, in practical enforcement of tax rules, there is a difference betweenthe auditing rule (which is based on the observed taxes paid) and the fine imposed(which is applied following an audit and is based on how much a person evaded).The expected fine for evading a certain amount of tax is a non-trivial combinationof the two parts. Most standard theoretical models abstract from this distinction(see Slemrod, 2001, or Slemrod and Yithaki, 2002, for an overview) and assumeindividuals have a perception of the expected fine for a given level of tax evasion.One may estimate this perception through a survey.22It can be generalized even further. With general functional forms, the con-
dition for decreasing relative concession is γP (x) ≡ −xP′′(x)
P ′(x) ||s∗(t)−s̄| > γD (x) ≡−xD
′′(x)D′(x) ||t−s∗(t)|. Here γF (x) is the Arrow-Pratt measure of relative risk aversion of
the function F (x).
23

determine whether a high or a low grade is considered normative. Inthe recent literature on peer effects in schools (see, e.g., Leuven et al,2010; Leuven & Rønning, forthcoming), pre-treatment test scores areused as a proxy for ability (i.e., t), while post-treatment test scores areused as a proxy for behavior (i.e., s). The empirically observed and thetheoretically predicted mapping from abilities to scores can then be usedto structurally estimate α, β and K, where the average post-treatmenttest score in a class forms the norm. Next, in a field experiment inthe spirit of Booij et al. (2015), students can be repeatedly assigned totutorial groups of different compositions (i.e., having different norms).One can then measure how close a student’s score in a certain class isto the average score in that same class. The test of the model wouldconsist in seeing whether this measure is changing, across classes andindividuals, in a way that is consistent with our predictions. Suppose,for example, that according to the structural estimation β > α, andconsider the distance between the pre-treatment score (t) of a low abilitystudent and the average score in her group (s̄). The corollary predictsthat this student should close a larger share of that distance when placedwith high ability peers compared to when placed with medium abilitypeers.23
8 Conclusion
This paper has presented a simple theory of how social pressure affectsthe distribution of stated opinions and visible actions across societies.The main message is that the curvature of social pressure, and how itrelates to the curvature of individuals’inner discomfort when deviatingfrom their bliss points, is important when considering individual confor-mity across societies. Drawing on observations of sanctioning in differentsocieties and cultures, both experimental and informal, we applied labelsto the curvature of social pressure in order to connect the results of themodel to outcomes across societies: strict societies are those emphasiz-ing complete adherence to their code of conduct, hence utilizing concavesocial pressure; liberal societies are those allowing freedom of expressionas long as it is not too extreme, hence utilizing convex social pressure.In liberal societies, the convexity of the social pressure naturally in-
23There are other relevant settings in which t and s can be observed and a similarapproach may be used. For instance, in a study of obesity, Carrell et al. (2011)distinguish between pre-treatment fitness (t) and post-treatment fitness (s), afterindividuals have been subjected to peer effects. Similarly, in law and economics it iscommon to use exogenous ideological scores as a proxy for judges’private politicalpreferences (see, for instance, Epstein et al. 2007), which can then be compared totheir rulings in court (s) when they are under pressure to make a unanimous decision(see Epstein et al. 2011 for evidence on collegial pressure in courts).
24

duces individuals to compromise between fully conforming and statingtheir private opinions in public. However, depending on the degree ofliberalism —the convexity —the distribution of declared stances will beeither a bimodal polarization or a unimodal concentration. In strictsocieties, the concavity of the social pressure discourages compromise.That is, it will tend to induce individuals to either completely conformor completely speak their minds. Depending on the degree of strictness,the conformists in society will be those whose private opinions are eitherquite close to the norm anyway or, rather surprisingly, quite far from it.The latter case displays inversion of opinions at the aggregate level ofsociety, as those who dislike the norm the most adhere to it more thanothers.Another prediction of the model is that liberal societies are bound to
have social norms that are representative of the average private opinionin society —biased norms cannot be sustained in equilibrium. This maybe linked to the informal observation that a liberal atmosphere oftencorrelates with democracy. The model further predicts an associationbetween strict societies and biased norms —only in strict societies is itpossible to sustain a biased norm.
References
[1] Akerlof, G. A. (1980). “A theory of social custom, of which un-employment may be one consequence”. The Quarterly Journal ofEconomics, Vol. 94, No. 4, pp.749-775.
[2] Bénabou, R., & Tirole, J. (2006), “Incentives and prosocial behav-ior,”American Economic Review, Vol. 96, No. 5, pp. 1652-1678.
[3] Bénabou, R., & Tirole, J. (2011), “Laws and norms”. National Bu-reau of Economic Research (No. w17579).
[4] Bernheim, D.B., (1994), “A Theory of Conformity”, Journal of Po-litical Economy, Vol. 102, No. 5, pp. 841-877.
[5] Brock, W.A., Durlauf, S.N., (2001), “Discrete Choice with SocialInteractions”, Review of Economic Studies Vol. 68, Iss. 2, pp. 235—260.
[6] Booij, A., Leuven, E., & Oosterbeek, H. (2015). “Ability peer ef-fects in university: Evidence from a randomized experiment”. IZADiscussion Paper No. 8769.
[7] Carrell, S. E., Hoekstra, M., & West, J. E. (2011). “Is poor fitnesscontagious?: Evidence from randomly assigned friends”. Journal ofPublic Economics, Vol. 95, No. 7, pp. 657-663.
[8] Clark, A. E., & Oswald, A. J. (1998). "Comparison-concave utilityand following behaviour in social and economic settings." Journalof Public Economics, Vol 70, Iss. 1. , pp 133-155.
25

[9] Eguia, J.X. (2013). "On the Spatial Representation of Decision Pro-files." Economic Theory, Vol. 52, Iss. 1, pp 103-128.
[10] Epstein, L., Martin, A. D., Segal, J. A., & Westerland, C. (2007).“The judicial common space”. Journal of Law, Economics, and Or-ganization, Vol. 23, No. 2, pp. 303-325.
[11] Epstein, L., W. M. Landes, and R. A. Posner (2011): “Why (andWhen) Judges Dissent: A Theoretical and Empirical Analysis,”Journal of Legal Analysis,Vol. 3, Iss. 1, pp. 101-137.
[12] Gino, F., Norton, M. I., & Ariely, D. (2010). "The Counterfeit SelfThe Deceptive Costs of Faking It." Psychological Science, Vol. 21,No. 5, pp. 712-720.
[13] Gneezy, U., Rockenbach, R., and Serra-Garcia, M. (2013), "Measur-ing lying aversion", Journal of Economic Behavior & Organization,Vol 93, pp. 293—300
[14] Herrmann, B., Thöni, C., & Gächter, S. (2008). "Antisocial Punish-ment across Societies." Science, Vol. 319, No. 5868, pp. 1362-1367.
[15] Kendall, C., Nannicini, T., & Trebbi, F. (2015). "How do votersrespond to information? Evidence from a randomized campaign",American Economic Review, Vol. 105, No. 1, pp. 322-353.
[16] Knack, S., & Keefer, P. (1997). “Does social capital have an eco-nomic payoff? A cross-country investigation”. The Quarterly jour-nal of economics, Vol. 112, No. 4, pp. 1251-1288.
[17] Krupka, E. L., & Weber, R. A. (2013). "Identifying social normsusing coordination games: Why does dictator game sharing vary?".Journal of the European Economic Association, Vol. 11, No. 3, pp.495-524.
[18] Kuran, T., (1995), “The Inevitability of Future Revolutionary Sur-prises,”The American Journal of Sociology, Vol. 100, No. 6, pp.1528-1551.
[19] Kuran, T., & Sandholm, W. H. (2008). "Cultural integration andits discontents". The Review of Economic Studies, Vol. 75, No. 1,pp. 201-228.
[20] Leuven, E., Oosterbeek, H., & Klaauw, B. (2010). “The Effect of Fi-nancial Rewards on Students’Achievement: Evidence from a Ran-domized Experiment”Journal of the European Economic Associa-tion, Vol. 8, No. 6, pp. 1243-1265.
[21] Leuven, E., & Rønning, M. (forthcoming). “Classroom grade com-position and pupil achievement”. Economic Journal
[22] Lindbeck, A., Nyberg, S. and Weibull, J. W. (2003), “Social normsand Welfare State Dynamics”, Journal of the European EconomicAssociation, Vol 1, Iss. 2-3, pp. 533—542.
[23] Lopez-Pintado, D., & Watts, D. J. (2008). “Social influence, binary
26
decisions and collective dynamics”. Rationality and Society, Vol. 20,No. 4, pp. 399-443.
[24] Manski, C.F.,Mayshar, J. (2003)“Private Incentives and Social In-teractions: Fertility Puzzles in Israel,”Journal of the European Eco-nomic Association, Vol. 1, No.1, pp. 181-211.
[25] Michaeli, M. & Spiro, D., (2014), “From Peer Pressure to BiasedNorms: Formation and collapse”, Dept. of Economics, University ofOslo WP series Memo 15/2014.
[26] Slemrod, J. (2001). ´´A general model of the behavioral responseto taxation”. International Tax and Public Finance, Vol. 8, No. 2,pp. 119-128.
[27] Slemrod, J., & Yitzhaki, S. (2002). “Tax avoidance, evasion, andadministration”. Handbook of public economics, Vol. 3, pp. 1423-1470.
[28] Warner, S. L. (1965). “Randomized response: A survey techniquefor eliminating evasive answer bias”. Journal of the American Sta-tistical Association, Vol. 60, No. 309, pp. 63-69.
A Appendix —Proofs and derivations
A.1 Some useful resultsA.1.1 Conformity and relative concession
Minimizing (1) and by way of the implicit function theorem, we get thefollowing derivatives of s∗(t):
ds∗
dt=
D′′ (t− s∗)P ′′ (s∗) +D′′ (t− s∗) (2)
d2s∗
dt2=
[D′′′ (t− s∗) (P ′′ (s∗))2 − P ′′′ (s∗) (D′′ (t− s∗))2]
(P ′′ (s∗) +D′′ (t− s∗))3 (3)
Lemma 9 For t ≥ s̄ :
1. Conformity is locally weakly decreasing in t if and only if ds∗
dt≥ 0.
2. In corner solutions, relative concession is locally constant. In innersolutions, relative concession is locally weakly increasing in t if andonly if (s∗ − s̄)P ′′ (s∗ − s̄) ≥ (t− s∗)D′′ (t− s∗).
Proof. 1) trivially follows from Definition 1. 2) In corner solutionss∗ (t) ∈ {s̄, t} which implies that, locally, relative concession is eitherequal to 1 or equal to 0. For inner solutions: By differentiating the ex-pression (in Definition 2) for relative concession w.r.t. t, performing a
27
few algebraic steps making use of equality of the first derivative in innersolutions and equations 2 and 3, it can be verified that the derivative isproportional to (s∗−s̄)P ′′(s∗−s̄)−(t−s∗)D′′(t−s∗)
P ′′(s∗−s̄)+D′′(t−s∗) . In min points the denomina-tor is positive and the inequality then follows.
A.1.2 The possible locations of the norm in equilibrium
Lemma 10 Suppose s̄ is the average stance in society and t ∼ U (tl, th).Then, for any positive α and β there is an equilibrium where s̄ = tl+th
2.
Proof. Let d ≡ min {th − s̄, s̄− tl}. Since the solution for any type’soptimization problem depends only on the distance from s̄, we know thatthe distribution of the stances of all the types in the range [s̄− d, s̄+ d] issymmetric around s̄. Thus s̄ is the average stance for this range of types.If s̄ = tl+th
2, then [s̄− d, s̄+ d] = [tl, th], and so s̄ is the average stance
for all types in society. It thus follows that s̄ = tl+th2can be sustained as
a social norm in equilibrium for any values positive of α and β.
Lemma 11 Suppose s̄ is the average stance in society and t ∼ U (tl, th).Let d ≡ min {th − s̄, s̄− tl}. Then s̄ 6= tl+th
2can be sustained in equilib-
rium only if s∗(t) = s̄ ∀t ∈ [tl, th] \ [s̄− d, s̄+ d].Proof. Since the solution for any type’s optimization problem dependsonly on the distance from s̄, we know that the distribution of the stancesof all the types in the range [s̄− d, s̄+ d] is symmetric around s̄. Thuss̄ is the average stance for this range of types. If s̄ > tl+th
2, then by
definition s̄ + d = th, and so ∀t ∈ [tl, th] \ [s̄− d, s̄+ d] = [tl, s̄− d] wehave s∗(t) ≤ s̄. For s̄ to be the average of all stances, it is then necessarythat s∗ (t) = s̄ ∀t < s̄− d.
A.1.3 Transformation from individually chosen stances to thedistribution of stances
We now analyze the density function of the chosen stances in society(PDF ). We restrict ourselves to cases where the optimal stance of eachtype is uniquely determined.24 We divide the range of types into n + 1subranges
T0 = [tlow, t1] , T1 = [t1, t2] , ...Tn = [tn, thigh] ,
such that:
1. In each subrange, the function s∗ (t) either consists of only cornersolutions or consists of only inner solutions.
24Otherwise we have no way of determining the chosen stance of some types.
28

2. In case of corner solutions we have either s∗ (t) = t ∀t ∈ Ti. ors∗ (t) = s̄ ∀t ∈ Ti.
3. In case of inner solutions, s∗ (t) is continuous and strictly monotonicin a subrange.
We now investigate separately the contribution of each such subrangeof types to the resultant PDF . The contribution of each such part iscalled a partial PDF , to be denoted pPDFTi, where
PDF =∑i
pPDFTi .
Inner solutions Here we investigate the properties of the pPDFTi(dropping the Ti index where possible) in subranges with inner solutions.Denote by s∗min the lowest stance taken by a type in the subrange (strictmonotonicity ensures that this type is unique). Let Mi(s̃
∗) be the massof types in Ti with stances in the range (s∗min, s̃
∗] for some s̃∗:
Mi(s̃∗)≡
s̃∗∫s∗min
pPDFTids =
t(s̃∗)∫ti
f (τ) dτ if s∗(t) is increasing in the subrange Ti
ti+1∫t(s̃∗)
f (τ) dτ if s∗(t) is decreasing in the subrange Ti
where t (s̃∗) ≡{t s.t. s∗ (t) = s̃∗} and f(t) is the density function of t.
If the distribution of types is uniform, i.e. f(t) = 1/ (th − tl), we get:
Mi(s̃∗) =
{ t(s̃∗)−tith−tl if s∗(t) is increasing in the subrange Ti
ti+1−t(s̃∗)th−tl if s∗(t) is decreasing in the subrange Ti
(4)
pPDFTi (s̃∗) =dMi(s̃
∗)
ds̃∗=
1
th − tl
∣∣∣∣ dtds∗ |s̃∗∣∣∣∣ (5)
Note that the last derivation is valid only if ds∗
dt|s̃∗ 6= 0 as otherwise dt
ds∗
is not defined. This is ensured under the strict monotonicity of s∗ (t).We then have, by using the implicit function theorem twice:
d (pPDF (s̃∗))
ds∗=
{ 1th−tl
d2tds∗2 |s̃∗ if
dtds∗ |s̃∗ > 0
− 1th−tl
d2tds∗2 |s̃∗if
dtds∗ |s̃∗ < 0
. (6)
29

In inner solutions, the following result then applies.25
Lemma 12 In inner solutions, the pPDF is locally strictly increasingat s∗ if d
2s∗
dt2is negative, and strictly decreasing at s∗ if d
2s∗
dt2is positive.
Proof. From equation 6, it follows that the pPDF is increasing if dtds∗
and d2tds∗2 have the same sign and decreasing if
dtds∗ and
d2tds∗2 have opposite
signs. We then use the fact that d2s∗
dt2< 0 if dt
ds∗ andd2tds∗2 have the same
sign, and d2s∗
dt2> 0 if dt
ds∗ andd2tds∗2 have opposite signs.
Corner solutions. There are two candidate corner solutions. Thefirst is s∗ (t) = t. In a subrange of these corner solutions, the pPDF issimply a uniform distribution with the trivial properties
pPDF (s̃∗) =1
th − tldt
ds∗|s̃∗ =
{ 1th−tl if s̃
∗ (t) = t
0 otherwised (pPDF )
ds= 0.
The other candidate corner solution is s∗ (t) = s̄. The solution of thisequation is independent of t, so in a subrange of these corner solutions,the pPDF is a degenerate single peak with a mass equalling the massof types within that subrange.
pPDFTi (s̃∗) =
{ ti+1−tith−tl if s
∗ = s̄
0 otherwise
A.2 Proof of Proposition 1For strict societies, the proofs of the first three statements are containedin the proof to part (1) of Proposition 3. As for the fourth statement,when s̄ ∈ [th −∆, tl + ∆] we get that max {th − s̄, s̄− tl} ≤ ∆, hence|t− s̄| < ∆ for every type. In the proof to part 1 of Proposition 3 weshow that when β < α, s∗ (t) = s̄ for every t such that |t− s̄| < ∆. Itthus follows that s∗ (t) = s̄ for all types, and so s̄ is the average of allstances, as required to constitute a norm. Lemma 10 states that s̄ = tl+th
2
can also be sustained in equilibrium, which concludes the proof.In liberal societies we have 1 = α < β. Solving for the range t > s̄ and
then using symmetry around s̄, it is easy to verify that types suffi cientlyclose to the norm declare their type, while types suffi ciently far from the
25Note that the previous expressions capture the “local”contribution to the PDF .E.g., there can be cases where a stance s is chosen (as a corner solution) by the typet = s and at the same time (as an inner solution) by a different type with t > s.In such a case these two types will belong to two separate subranges (Ti) hence willcontribute to two separate pPDF ′s.
30

norm have an inner solution s s.t. P ′(|s− s̄|) = 1 (= D′). This provesstatement (1). In the subrange where all declare their type, relativeconcession equals 0, and in the subrange where all declare the same innerstance it is increasing, as follows from Lemma 9 part (2) with P ′′ > 0and D′′ = 0 (use symmetry to see that it holds also for the range t < s̄).This proves statement (2). Before proving statement (3) we prove thefourth statement. By Lemma 10 we know that s̄ = tl+th
2can be sustained
in equilibrium. Thus, we only need to show that s̄ 6= tl+th2
cannot bean equilibrium. This follows directly from Lemma 11 and the fact thatno one chooses s∗ (t) = s̄. Finally, to see statement (3), note that thevalue of s s.t. P ′(|s− s̄|) = 1 is given by solving βK (s− s̄)β−1 = 1,which yields s − s̄ = (βK)
11−β . Given that s̄ = tl+th
2, we get that if
th − tl > 2 (βK)1
1−β then types at both edges of the distribution choosethe inner solutions s∗ = s̄ ± (βK)
11−β . These types form the modes of
a bimodal distribution while types closer to the norm form a uniformpart. If the range of types is smaller than 2 (βK)
11−β all types choose
s∗ (t) = t, implying a uniform distribution.�
A.3 Proof of Proposition 2Since the functions are symmetric around s̄, we present only the prooffor the range of t ≥ s̄.Parts 1 and 2:The minimization problem of type t is symmetric around s̄, so we
will present the first- and second-order conditions for an inner solutiononly for t ≥ s̄.
−α (t− s)α−1 + βK (s− s̄)β−1 = 0 (7)
(α− 1)α (t− s)α−2 + (β − 1) βK (s− s̄)β−2> 0 (8)
We perform the proof first for α, β > 1, and then for the special case of1 = β < α.
α, β > 1: That every t has a unique inner solution can be easilyverified using equations (7) and (8). The statements that |s∗ (t)− s̄|is increasing either convexly or concavely follow from applying the im-plicit function theorem twice to equation (7) to get ds∗/dt and d2s∗/dt2.Since all types have inner solutions, the statements regarding relativeconcession follow from restating the inequality in part 2 of Lemma 9 ex-plicitly for power functions, and substituting the FOC into it. Pluggingthe expressions for the derivatives of P and D into equation (3), we getthat d2s∗
dt2> 0 when α > β and d2s∗
dt2< 0 when 1 < α < β. Using the
derived expression for d2s∗/dt2 it then follows from Lemma 12 that thepPDF is decreasing in the distance to s̄ when α > β and increasing
31
when 1 < α < β. As s∗ (t) is monotonic, the pPDF represents the totalPDF . From the symmetry of the functions around s̄ (and the centrallocation of the norm, as implied by Lemma 11 when no type choosess∗(t) = s̄), it then follows that the distribution is unimodal when α > βand bimodal when α < β. Finally, the convexity of P and D impliesthat ∀t ≥ s̄ we have 0 ≤ ds∗
dt= D′′(t−s∗)
P ′′(s∗)+D′′(t−s∗) ≤ 1. Hence, it followsfrom part 1 of Lemma 9 that conformity is decreasing ∀t ≥ s̄.
1 = β < α: It is easy to verify that types suffi ciently close to the normdeclare the norm (this is true for any K > 0) and types suffi ciently farfrom the norm have a unique inner solution. For the subrange where alldeclare the norm ds∗/dt = 0 and hence d2s∗/dt2 = 0. For the subrangewith inner solutions using β = 1 and α > 1 in equation (2) impliesds∗/dt = 1 and hence d2s∗/dt2 = 0. Applying these results to Lemma9 yields the first three statements of part 1. Since for any K > 0 thereexist some types suffi ciently close to the norm who declare the norm,there will always be a peak at the norm. Since in the other subrangeds∗/dt = 1 this implies a unimodal distribution in total.Part 3:For the case 1 = α < β, the proofs for all the statements are con-
tained in the proof of Proposition 1, except for (i) the statement aboutconformity, which follows from the fact that types suffi ciently close tothe norm declare their type and types suffi ciently far from the normat each side of it declare the same stance s = s̄ ± (βK)
11−β (implying
that |s∗ (t)− s̄| is first increasing and then it is constant); (ii) show-ing that th − tl > 2∆ is a suffi cient condition for a bimodal distrib-ution of s∗, which follows from the fact that to get bimodality it wasshown that th − tl should be greater than 2 (βK)
11−β , and noting that
2 (βK)1
1−β < 2K1
1−β = 2∆.For the case α < 1 < β, we will show that if th − tl > 2∆, then
a) |s∗ (t)− s̄| is first increasing then decreasing in |t− s̄|, implying non-monotonic conformity; b) the relative concession is increasing in |t− s̄|;and c) if, furthermore, t ∼ U (tl, th), then the distribution of s∗ is bi-modal.a) We will first show that the only relevant corner solution is s∗ = t,
then that types close to the norm choose this corner solution. In orderto find the global minimum we first need to investigate the behavior ofL (s, t) near the corner solutions.
L′ (s, t) = −α (t− s)α−1 +βK (s− s)β−1
Hence L′ (s, t) < 0 and L′ (t, t) < 0 since α < 1. Therefore s = t maybe a solution to the minimization problem while s = s̄ will not. The
32

candidate solution s = t will now be compared to potential local minimain the range [s, t]. In inner solutions L′ (s, t) = 0 and hence we get
α (t− s)α−1 = βK (s− s)β−1⇒ (t− s)α−1 (s− s)1−β = Kβ/α
Define f (s) ≡ (t− s)α−1 (s− s)1−β. For the existence of an inner minpoint it is necessary that f (s) = βK/α for some s ∈]s, t[. Notice thatf(s) is strictly positive in ]s, t[, and that f(s)→∞ at both edges of therange (i.e. at s = s and at s = t). This means that f(s) has at leastone local minimum in ]s, t[. We now proceed to check whether this localminimum is unique:
f ′ (s) = (t− s)α−2 (s− s)−β [ (1− β) (t− s)− (α− 1) (s− s) ]
Since (t− s)α−2 (s− s)−β is strictly positive in ]s, t[, and [(1− β) (t− s)−(α− 1) (s− s)] is linear in s, negative at s = s and positive at s = t,f ′(s) = 0 exactly at one point at this range (i.e. a unique local minimumof f(s) in ]s, t[).From the continuity of f(s) we get that if the value of f(s) at this
local minimum is smaller than βK/α, then L(s, t) has exactly two ex-trema in the range ]s, t[. From the negative values of L′(s, t) at the edgesof this range we finally conclude that the first extremum (where f(s) isfalling) is a minimum point of L(s, t), and the second extremum (wheref(s) is rising) is a maximum point of L(s, t). The global minimum ofL(s, t) is therefore either this local minimum (i.e. an inner solution), ors = t (i.e. a corner solution). If however the value of f(s) at its localminimum point is larger than βK/α, then there is no local extremumto L(s, t) in the range ]s, t[, and therefore s = t is the solution to theminimization problem.Next we show that if th− tl > 2∆ then there exists a type who is far
enough from the norm to choose the inner solution. First, note that thedistance from the norm to the type who is the most remote from it islarger than ∆. Suppose this type is th.. Then, comparing only the twocorner solutions this type can choose, we get
L(s̄, th)− L(th, th) = |th − s̄|α −K |th − s̄|β ,
which is strictly negative when |th − s̄| > ∆ = K1
α−β and α < β. Thisimplies that th does not choose the corner solution of s̄, hence mustchoose an inner solution.Finally we show that if there exists any type t0 who chooses the inner
solution, then all types with t > t0 have an inner solution too. Then we
33

show that in the range of inner solutions s∗ (t) is decreasing in t. Firstnotice that f(s) is decreasing in t, so if there exists a local minimumof L(s, t0) for some t0, then there exists a local minimum of L(s, t) fort > t0 too. Also note that f(s) is decreasing in t with lim
t→∞f (s) =
0 < βK/α (for s ∈]s, t[), implying that an inner local minimum existsfor a suffi ciently large t. Second, if there is an inner solution to theminimization problem for some t0, then there is also an inner solutionto the minimization problem for t > t0. To see this let ∆L ≡ L(t, t) −L(s̃, t), where s̃ is the stance at which L(s, t) gets the local minimum.Type t prefers the inner solution to the corner solution if and only if ∆Lis positive. Thus we need to show that ∆L is negative for small enough|t− s̄| but is increasing in t (and so if ∆L is positive for t0 it is positivefor t > t0 too).
∆L= K (t− s)β −[(t− s̃)α +K (s̃− s)β
],
and since α < 1 ≤ β, for small enough |t− s̄| the dominant element is(t− s̃)α and so ∆L is negative (i.e., types close to the norm choose thecorner solution of s∗ = t). Differentiating ∆L with respect to t yields
∆L′t=Kβ (t− s)β−1−[α (t− s̃)α−1
(1− ds̃
dt
)+ βK (s̃− s)β−1 ds̃
dt
].
Using the first order condition
∆L′t =Kβ (t− s)β−1−[βK (s̃− s)β−1
(1− ds̃
dt
)+ βK (s̃− s)β−1 ds̃
dt
]=Kβ (t− s)β−1−βK (s̃− s)β−1> 0 when β > 1.
Differentiating once more
∆L′′t= Kβ (β − 1)
[(t− s)β−2 − βKds̃
dt(s̃− s)β−1
].
By equation 2 we have that ds̃dt
< 0 in an inner solution when D isconcave, and so ∆L′′t > 0. Hence ∆L is strictly increasing and strictlyconvex, implying that for a broad enough range of types, types suffi -ciently far from the norm have an inner solution. Moreover, at thissubrange of types, ds∗
dt< 0. This implies that s∗ is first increasing (in
the subrange of types with s∗ = t), and then decreasing (in the subrangeof types with inner solutions).b) By the definition of relative concession it equals 0 at the subrange
of types choosing s∗ = t, and then it rises at the cutoff where ∆L = 0,
34

and keeps rising as t increases (this follows from restating the inequalityin part 2 of Lemma 9 explicitly for power functions, and substitutingthe FOC in it).c) This implies that if the range of types is narrow, all types state
their type, creating a uniform distribution of stances. If the range oftypes is broad enough to include types with inner solutions, then on topof the uniform part there is a peak on each side of s̄ (since s̄ must equaltl+th
2, as implied by Lemma 11 when no type chooses s∗(t) = s̄). These
peaks are inside the uniform distribution. To see this, note that for thetype t who is just indifferent between the corner and inner solution, theinner solution would entail s∗ (t) ≤ t. Together with the previous resultthat ds
∗
dt< 0 we get that all types with inner solutions choose statements
within the bounds of the uniform part.To see the shape of the distribution of stances, note first that dt
ds∗ < 0
because ds∗
dt< 0. As for d2t
ds∗2 , we have:
d2t
ds∗2=
d
ds∗
(dt
ds∗
)=
(βK
α
) 1α−1 β − 1
α− 1
(β − 1
α− 1− 1
)(s∗ − s)
β−1α−1−2 .
Substituting t− s∗=(βKα
) 1α−1 (s∗ − s)
β−1α−1 in this expression we get that
d2t
ds∗2=
(β − 1) (t− s∗)(α− 1) (s∗ − s)2
(β − 1
α− 1− 1
).
Since both (β−1)(t−s∗)(α−1)(s∗−s)2 and
(β−1α−1− 1 = β−α
α−1
)are negative, we get that
d2tds∗2 > 0, which together with dt
ds∗ < 0 implies by the inverse functiontheorem that d2s∗
dt2> 0. Thus by Lemma 12 the pPDF for the inner
solutions is decreasing towards the edges.�
A.4 Proof of Proposition 3Parts 1 and 2The second-order condition (equation 8) is positive when α < β ≤ 1
or β < α ≤ 1, which implies that any inner extreme point is a max-imum. The corner solutions are then either L (s = s̄) = |t− s̄|α orL (s = t) = K |t− s̄|β. When β < α this implies that L (s = s̄) <
L (s = t) iff |t− s̄| < ∆ = K1
α−β , and so s∗ (t) = t iff |t− s̄| ≥ ∆, ands∗ (t) = s̄ iff |t− s̄| < ∆. This means that conformity is initially constantand then strictly decreasing, which altogether implies that conformity iseverywhere weakly decreasing in |t− s̄|. When α < β the converse holds,with s∗ (t) = t iff |t− s̄| < ∆, and s∗ (t) = s̄ iff |t− s̄| ≥ ∆, which meansthat conformity is initially decreasing in t but then sharply increases to
35
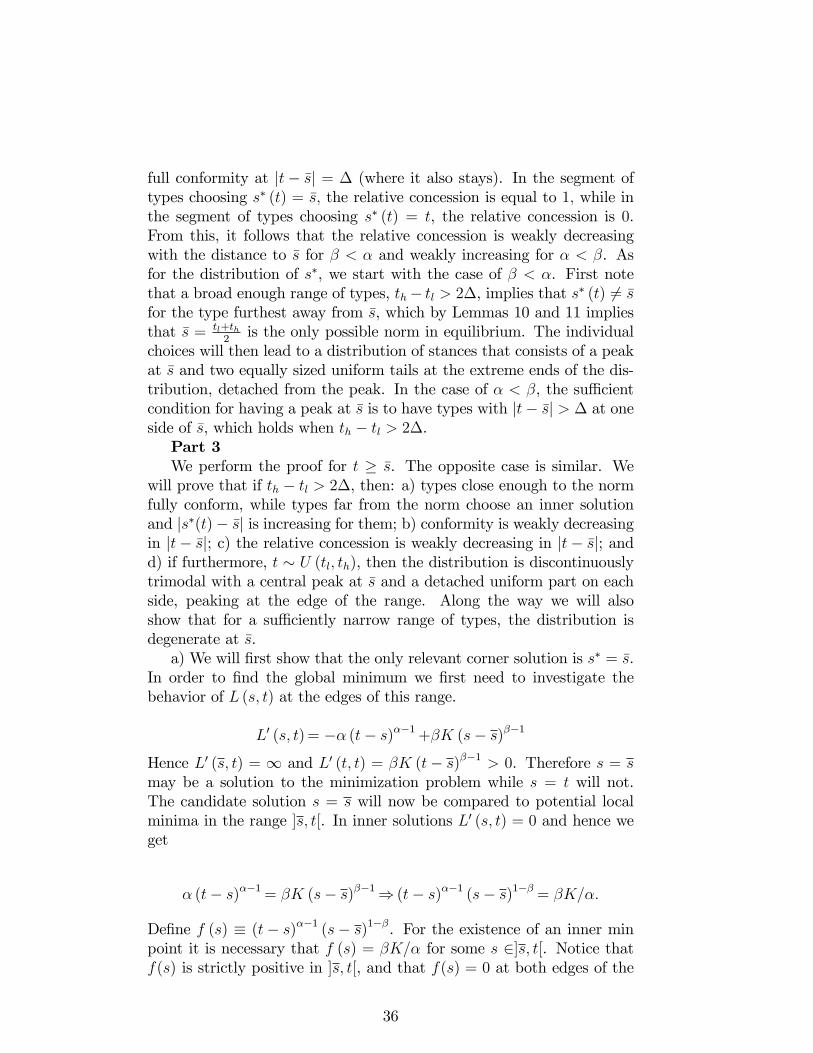
full conformity at |t− s̄| = ∆ (where it also stays). In the segment oftypes choosing s∗ (t) = s̄, the relative concession is equal to 1, while inthe segment of types choosing s∗ (t) = t, the relative concession is 0.From this, it follows that the relative concession is weakly decreasingwith the distance to s̄ for β < α and weakly increasing for α < β. Asfor the distribution of s∗, we start with the case of β < α. First notethat a broad enough range of types, th− tl > 2∆, implies that s∗ (t) 6= s̄for the type furthest away from s̄, which by Lemmas 10 and 11 impliesthat s̄ = tl+th
2is the only possible norm in equilibrium. The individual
choices will then lead to a distribution of stances that consists of a peakat s̄ and two equally sized uniform tails at the extreme ends of the dis-tribution, detached from the peak. In the case of α < β, the suffi cientcondition for having a peak at s̄ is to have types with |t− s̄| > ∆ at oneside of s̄, which holds when th − tl > 2∆.Part 3We perform the proof for t ≥ s̄. The opposite case is similar. We
will prove that if th − tl > 2∆, then: a) types close enough to the normfully conform, while types far from the norm choose an inner solutionand |s∗(t)− s̄| is increasing for them; b) conformity is weakly decreasingin |t− s̄|; c) the relative concession is weakly decreasing in |t− s̄|; andd) if furthermore, t ∼ U (tl, th), then the distribution is discontinuouslytrimodal with a central peak at s̄ and a detached uniform part on eachside, peaking at the edge of the range. Along the way we will alsoshow that for a suffi ciently narrow range of types, the distribution isdegenerate at s̄.a) We will first show that the only relevant corner solution is s∗ = s̄.
In order to find the global minimum we first need to investigate thebehavior of L (s, t) at the edges of this range.
L′ (s, t) = −α (t− s)α−1 +βK (s− s)β−1
Hence L′ (s, t) = ∞ and L′ (t, t) = βK (t− s)β−1 > 0. Therefore s = smay be a solution to the minimization problem while s = t will not.The candidate solution s = s will now be compared to potential localminima in the range ]s, t[. In inner solutions L′ (s, t) = 0 and hence weget
α (t− s)α−1 = βK (s− s)β−1⇒ (t− s)α−1 (s− s)1−β = βK/α.
Define f (s) ≡ (t− s)α−1 (s− s)1−β. For the existence of an inner minpoint it is necessary that f (s) = βK/α for some s ∈]s, t[. Notice thatf(s) is strictly positive in ]s, t[, and that f(s) = 0 at both edges of the
36

range (i.e. at s = s and at s = t). This means that f(s) has at leastone local maximum in ]s, t[. We now proceed to check whether this localmaximum is unique:
f ′ (s) = (t− s)α−2 (s− s)−β [ (1− β) (t− s)− (α− 1) (s− s) ]
Since (t− s)α−2 (s− s)−β is strictly positive in ]s, t[, and [(1− β) (t− s)−(α− 1) (s− s)] is linear in s, positive at s = s and negative at s = t,f ′(s) = 0 exactly at one point at this range (i.e. a unique local max-imum of f(s) in ]s, t[). From the continuity of f(s) we get that if thevalue of f(s) at this local maximum is greater than βK/α, then L(s, t)has exactly two extrema in the range ]s, t[. From the positive valuesof L′(s, t) at the edges of this range we finally conclude that the firstextremum (where f(s) is rising) is a maximum point of L(s, t), and thesecond extremum (where f(s) is falling) is a minimum point of L(s, t).The global minimum of L(s, t) is therefore either this local minimum(i.e. an inner solution), or s = s (i.e. a corner solution). If however thevalue of f(s) at its local maximum point is smaller than βK/α, thenthere is no local extremum to L(s, t) in the range ]s, t[, and therefores = s is the solution to the minimization problem.Next we show if th − tl > 2∆ then there exists a type who is far
enough from the norm to choose the inner solution. First, note that thedistance from the norm to the type who is the most remote from it islarger than ∆. Suppose this type is th.. Then, comparing only the twocorner solutions this type can choose, we get
L(s̄, th)− L(th, th) = |th − s̄|α −K |th − s̄|β ,
which is strictly positive when |th − s̄| > ∆ = K1
α−β and β < α. Thisimplies that th does not choose the corner solution of s̄, hence mustchoose an inner solution.Finally we show that if there exists any type t0 who chooses the inner
solution then all types with t > t0 have an inner solution. Then we showthat types close enough to the norm fully conform, and that in the rangeof inner solutions |s∗(t)− s̄| is increasing in t. First notice that f(s) isincreasing in t, so if there exists a local minimum of L(s, t0) for some t0,then there exists a local minimum of L(s, t) for t > t0 too. Also notethat f (s) is increasing in t with lim
t→∞f (s) = ∞ > βK/α (for s ∈]s, t[),
implying an inner local min point exists for a broad enough range oftypes. Second, if there is an inner solution to the minimization problemfor some t0 then there is also an inner solution to the minimizationproblem for t > t0. To see this let ∆L ≡ L(s̄, t) − L(s̃, t), where s̃ is
37

the stance at which L(s, t) gets the local minimum. Type t prefers theinner solution to the corner solution if and only if ∆L is positive. Thuswe need to show that ∆L is negative for small enough |t− s̄| but isincreasing in t (and so if ∆L is positive for t0 it is positive for t1 too).
∆L= (t− s)α−[(t− s̃)α +K (s̃− s)β
],
and since β ≤ 1 < α, for small enough |t− s̄| the dominant element isK (s̃− s)β and so∆L is negative (i.e., types close to the norm choose thecorner solution of s∗ = s). Differentiating ∆L with respect to t yields
∆L′t=α (t− s)α−1−[α (t− s̃)α−1
(1− ds̃
dt
)+ βK (s̃− s)β−1 ds̃
dt
].
Using the first order condition
∆L′t =α (t− s)α−1 −[α (t− s̃)α−1
(1− ds̃
dt
)+ α (t− s̃)α−1 ds̃
dt
]=α (t− s)α−1 − α (t− s̃)α−1 > 0.
Differentiating once more
∆L′′t = α (α− 1)[(t− s)α−2 − (1− ds̃/dt) (t− s̃)α−2] .
By equation 2 we have that ds̃dt
> 1 in an inner solution when P isconcave, and so ∆L′′t > 0. Hence ∆L is strictly increasing and strictlyconvex, implying that for a broad enough range of types (in particularlarger than 2∆, as shown above), types suffi ciently far from the normhave an inner solution where ds∗
dt> 1, and so |s∗(t)− s̄| is increasing in
t at the range of inner solutions.b) Looking at |s∗(t)− s̄| as |t− s̄| gradually increases, we first have
|s∗(t)− s̄| constant and equal to 0 in the range where s∗(t) = s∗. Thenat some point we reach the first type who chooses an inner solution,and so for her |s∗(t)− s̄| > 0, and afterwards |s∗(t)− s̄| was shown tokeep increasing. Therefore conformity is everywhere weakly decreasingin |t− s̄|.c) By the definition of relative concession it equals 1 at the range of
types choosing s∗ = s, and then it falls at the cutoff where ∆L = 0, andkeeps falling as t increases (this follows from restating the inequality inpart 2 of Lemma 9 explicitly for power functions, and substituting theFOC in it).d) If the range of types is narrow, all types state the norm, hence
follows a degenerate distribution at s. Otherwise, if the range of types
38

is broad enough (so that some have an inner solution), the resultingdistribution of stances has a peak at s = s with a tail at each side ofit. The tails will be of equal size because s∗ (t) 6= s̄ for the type furthestaway from s̄, which by Lemmas 10 and 11 implies that s̄ = tl+th
2, and so
the distribution of stances is symmetric. The tails are detached, since forthe type t who is indifferent to either the corner or the inner solution theinner solution s∗ is necessarily strictly greater than s̄ (because L′ (s̄, t) =∞ while L′ (s∗, t) = 0 in inner solutions).For the shape of these tails, note first that dt
ds∗ > 0 because ds∗
dt>
0. Moreover, d2tds∗2= (β−1)(t−s∗)
(α−1)(s∗−s)2(β−1α−1− 1)(see the proof of Proposition 2
part 3). Since both (β−1)(t−s∗)(α−1)(s∗−s)2 and
(β−1α−1− 1)are negative, we get that
d2tds∗2 > 0, which together with dt
ds∗ > 0 implies by the inverse functiontheorem that d2s∗
dt2< 0. Thus by Lemma 12 the pPDF for the inner
solutions is increasing towards the edges, which together with the peakat s implies a trimodal distribution of stances.�
A.5 Proof of Proposition 4Lemma 10 ensures that s̄ = tl+th
2is a possible equilibrium. Furthermore:
1) From parts (1) and (3) of Proposition 3 we know that if α ≤ 1then types with |t− s̄| ≤ ∆ fully conform and if 1 < α then there existsa cutoff distance δ < ∆ such that types with |t− s̄| ≤ δ fully conform.So if α ≤ 1 and th − tl < 2∆ or alternatively 1 < α and th − tl < 2δ,and if
∣∣s̄− tl+th2
∣∣ is small enough to ensure that the type furthest awayfrom s̄ is still within distance ∆ (in the case α ≤ 1) or δ (in the case1 < α) from s̄, then s∗ (t) = s̄ ∀t. In this case s̄ is obviously the averageof all stances and this concludes suffi ciency. To show necessity, we needto show that if α ≤ 1 and th − tl ≥ 2∆ or alternatively 1 < α andth − tl ≥ 2δ, there exist no equilibria with s̄ 6= th+tl
2. To see this, note
that s̄ 6= th+tl2
would imply that |t− s̄| > ∆ (in the case α ≤ 1) or|t− s̄| > δ (in the case 1 < α) for the type furthest away from s̄. Then,parts (1) and (3) of Proposition 3 imply that s∗ (t) 6= s̄ for that type,and by Lemma 11 s̄ 6= th+tl
2cannot be sustained in equilibrium.
2) From Proposition 3 part (2) we know that types with |t− s̄| < ∆choose s∗ = t, while types with |t− s̄| > ∆ choose s̄ as their stance(and therefore do not affect its location). If th − tl > 2∆, take anys̄ ∈ [tl + ∆, th −∆]. This implies that s̄ − tl > ∆ and th − s̄ > ∆,and so ensures that the whole uniform section of the stance distribution,[s̄−∆, s̄+ ∆] , is contained within [tl, th], with s̄ located at the centerof the uniform section, implying that it is the average stance. This con-cludes suffi ciency. Otherwise, suppose th−tl < 2∆. Then [tl + ∆, th −∆]is an empty set, therefore either s̄ > th − ∆ or s̄ < tl + ∆ (or both).
39
Suppose s̄ > th − ∆. Then d ≡ th − s̄ < ∆, and so s∗ (t) = t 6= s̄ fortypes with t ∈ [s̄−∆, s̄− d], which by Lemma 11 implies that s̄ can-not be sustained in equilibrium. A corresponding argument applies tos̄ < tl+∆. Repeating the same exercise for the case th− tl = 2∆ impliesthat s̄ = tl+th
2is the unique possible norm in this case. This concludes
necessity.�
A.6 Proof of Proposition 5sh = s̄ + 1 implies that P in the range ]s̄, s̄+ 1[ strictly decreases inβ while P at {s̄, s̄+ 1} is independent of β. Hence, a decrease of βimplies that any stance in ]s̄, s̄+ 1[ becomes less attractive, while theattractiveness of the stances s̄ and s̄+1, where pressure is fixed at 0 andK respectively, stays the same. Thus, for any given t, if s∗(t) ∈ {s̄, s̄+ 1}for β then s∗(t) ∈ {s̄, s̄+ 1} also for any β′ < β.
A.7 Proof of Proposition 7At any stance s > s̄, the pressure P = K(s − s̄)β strictly decreases inβ if s ∈]s̄, s̄ + 1[ and strictly increases in β if s > s̄ + 1, while stayingconstant at s = s̄ and s = s̄ + 1. Therefore, for any t > s̄, the functionL (s, t) (which t minimizes at [s̄, t] to get s∗(t)) decreases in β at therange ]s̄, s̄ + 1] and increases in β at the range s > s̄ + 1. Consideringnow the effect of increasing β, this implies that if before the increases∗(t) ∈ Slow =]s̄, s̄ + 1], then s∗(t) ∈ Slow also after the increase, andif s∗(t) ∈ Shigh after the increase, then s∗(t) ∈ Shigh also before it.Therefore, |Slow| is weakly greater after the increase, while |Shigh| isweakly smaller after the increase. Together with the fact that s∗(t) ≤ s̄for types with t ≤ s̄ (and so these types do not affect |Slow| and |Shigh|),we get that |Slow| − |Shigh| increases in β.�
A.8 Proof of Proposition 6If β > 1, then no one with t 6= s̄ chooses s̄ as her stance regardless ofthe value of K, as a small deviation toward t would reduce D withoutaffecting P . Thus, increasing K will not increase the number of individ-uals stating s̄. Suppose, however, that β ≤ 1, and consider an increasein K from some K1 to some K2 > K1. An increase in K implies that theloss in any possible stance except for s̄ increases, so anyone who choosess̄ under K1 also chooses it under K2. This implies that the number ofpeople stating s̄ will not decrease when K increases. Furthermore, ifth− tl > 2∆, then under K1 there are types who are indifferent betweenchoosing s̄ and choosing some different stance (see Proposition 3). Thesetypes will strictly prefer s̄ under K2, implying a strict increase in thenumber of people stating s̄ as K increases from K1 to K2.
40

A.9 Proof of Corollary 8Follows directly from propositions 2 and 3.
B Appendix: data and empirical details for Section7.1
The data was accessed in February 2015 fromwww.worldvaluessurvey.orgthrough their online analysis toolbox.
• Countries: Algeria, Azerbaijan, Palestine, Iraq, Kazakhstan, Jor-dan, Kyrgyzstan, Lebanon, Libya, Malaysia, Morocco, Pakistan,Tunisia, Turkey, Uzbekistan, Yemen. 16 countries in total. Eachquestion is answered by around 1000 individuals in each country.There are a few additional Muslim countries but they do not havedata on the praying variable.
• β proxy variable: The proxy for β was constructed using answersto question V154 measuring agreement with the statement “Theonly acceptable religion is my religion”. The measure was con-structed by taking the share strongly disagreeing minus the sharestrongly agreeing. This implies a high value will be the equivalentof a high β. Note that values can be negative. Plain “Agree”and“Disagree”were not used since it would be unclear how the ordi-nality in-between answers could be collapsed to a single measure(e.g., if 50% answer agree and 50% disagree, is that society moreor less strict than if 50% answer strongly agree and 50% answerstrongly disagree?).
• Religiosity variable (t-distribution): The share answering “Areligious person” to question V147. The other possible answersare “Not a religious person”, “Atheist”, “No answer”and “Don’tknow”.
• Harshness variable (K): Answers to question V132 “Democ-racy: Religious authorities interpret the laws”. The possible an-swers range from 1) “Not an essential characteristic of democracy”to 10) “An essential characteristic of democracy”. We used themean.
• Praying variable (s): V146, “How often do you pray?”. Apartfrom “Don’t know” and “No Answer” the alternatives were 1)“Several times a day”, 2) “Once a day”, 3) “Several times eachweek”, 4) “Only when attending religious services”, 5) “Only onspecial holy days”, 6) “Once a year”, 7) “Less often than once a
41

year”and 8) “Never, practically never”. In the regression table,the total share answering either 1 or 8 is defined as “Extremes”.The share answering 2 or 3 is defined as “Religious non-extremes”.The share answering 4 or 5 is defined as “Mid”. The share answer-ing 6 or 7 is defined as “Secular non-extremes”.
Table 1: Summary statistics
Variable Mean Min Maxβ proxy -45.2 -81.4 (Libya) 14.5 (Kazakhstan)Religiousity % 71.0 26.7 (Azerbaijan) 99.7 (Pakistan)Harshness 5.3 3.69 (Azerbaijan) 6.42 (Yemen)Praying: Extremes % 69.0 43.6 (Lebanon) 93.6 (Tunisia)Praying: Religious non-extremes % 14.8 1.2 (Tunisia) 41.9 (Lebanon)Praying: Mid % 9.6 1.5 (Jordan) 34.4 (Azerbaijan)Praying: Secular non-extremes % 5.4 1 (Jordan) 13.9 (Uzbekistan)Praying: Several times per day % 53.2 6.3 (Kazakhstan) 86.4 (Jordan)Pracying: Never, practically Never % 15.8 0.6 (Pakistan) 53.7 (Uzbekistan)
Table 2: Regression results
Extremes Extremes Religiousnon-extremes
Religiousnon-extremes
Mid Mid Secularnon-extremes
Secularnon-extremes
Intercept 45.5*** 57.2*** 23.1*** 2.98 23.2*** 38.5*** 9.0*** 3.5β proxy -0.53*** -0.58*** 0.19* 0.28** 0.30*** 0.22** 0.08** 0.12**Religiosity -0.27 0.43** -0.09 -0.04Harshness 0.80 -1.11 -2.31 1.92R2 0.66 0.72 0.19 0.51 0.65 0.74 0.26 0.37The dependent variable is indicated in the top of each column. 16observations. * p-value ≤ 10%, ** p-value ≤ 5%, *** p-value ≤ 1%.
42