Noriko Kawaguchi, Jason Shultz, Tyler Whale. Agenda 1) Industry Overview 2) General Information on...
27
Noriko Kawaguchi, Jason Shultz, Tyler Whale
-
Upload
silvester-stewart -
Category
Documents
-
view
214 -
download
0
Transcript of Noriko Kawaguchi, Jason Shultz, Tyler Whale. Agenda 1) Industry Overview 2) General Information on...

Noriko Kawaguchi, Jason Shultz, Tyler Whale

AgendaAgenda
1) Industry Overview2) General Information on Orchard3) Products and Services4) Marketing
Marketing Strategy Pricing Strategy Promotion Marketing budget
5) Financial6) Risk Analysis7) Recommendations8) Summary

OrchardOrchard
Founder:Established:Place:Type of Fruit: Apple and CherryType of Business: U-pick and Apple cider

Industry OverviewIndustry Overview
Apple Production World
Main Producer in the World---China, US, Turkey
Increasing Production Canada
Canada produces about 500 mt 2002
130 mt is imported in 2005
Decreasing production for past several years
Main producers in Ontario and BC
Small amount of production in Saskatchewan
Average farm-3.3 acres
0.5% of Canada’s fruit growing land

Industry OverviewIndustry Overview
Apple Consumption
World
Stagnant or declining
Canada
Apple consumption consists 20% of fruit
consumption
Increase in consumption (fresh fruit/processed)

Industry OverviewIndustry Overview
Saskatchewan’s Apple Market
130 mt imported into Canada
500 million kg produced in Canada(2002)
Saskatchewan’s demand: 17.6 million kg/yr
Petrofka Bridge Orchard’s projected yields
2007 2011 2016
Yield (kg) 5,182 44,886 95,568
0.05% 0.6%

Products and ServicesProducts and Services
Mission of Orchard Provide customers with high quality,
organically and locally grown fresh apples and apple cider
Provide opportunity to pick apples and enjoy the overall experience
Educate customers about apples
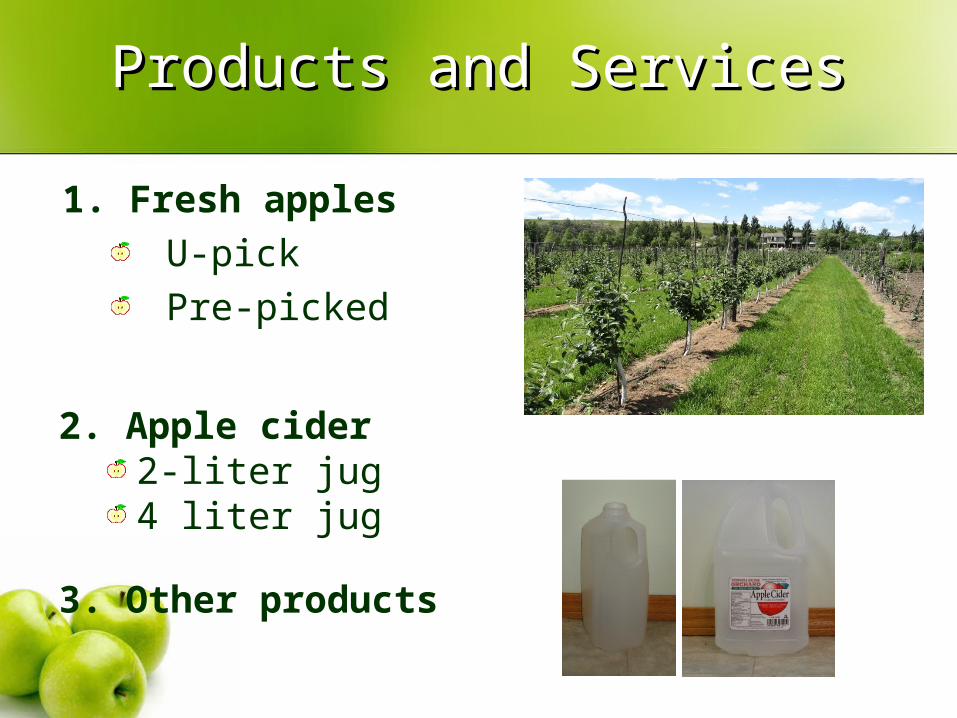
Products and ServicesProducts and Services
1. Fresh applesU-pickPre-picked
2. Apple cider2-liter jug4 liter jug
3. Other products
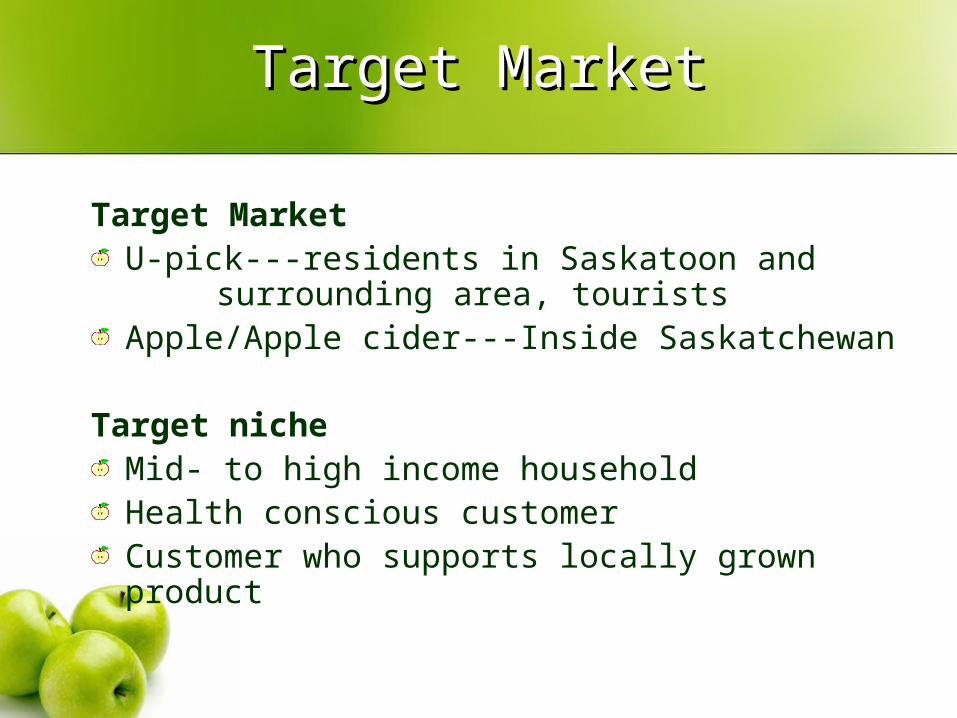
Target MarketTarget Market
Target MarketU-pick---residents in Saskatoon and surrounding area, touristsApple/Apple cider---Inside Saskatchewan
Target nicheMid- to high income householdHealth conscious customerCustomer who supports locally grown product

Market AnalysisMarket Analysis
Competitors 1.U-pick
Apple orchard (1) Berry/Fruit/vegetable farm(9)
• The Berry Barn• Moonlake Saskatoon Berry Farm
Open market for apple orchard
2. Fresh appleMany international and national
competitors
Market AnalysisMarket Analysis
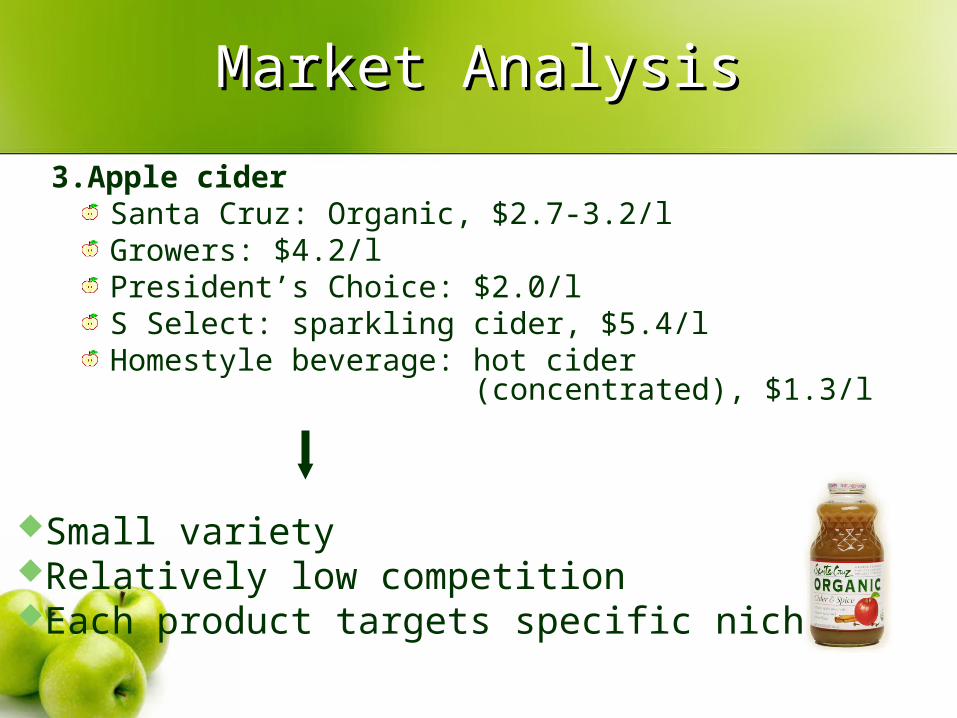
3.Apple ciderSanta Cruz: Organic, $2.7-3.2/lGrowers: $4.2/lPresident’s Choice: $2.0/lS Select: sparkling cider, $5.4/lHomestyle beverage: hot cider (concentrated), $1.3/l
Small varietyRelatively low competitionEach product targets specific niche
Distribution ChannelDistribution Channel
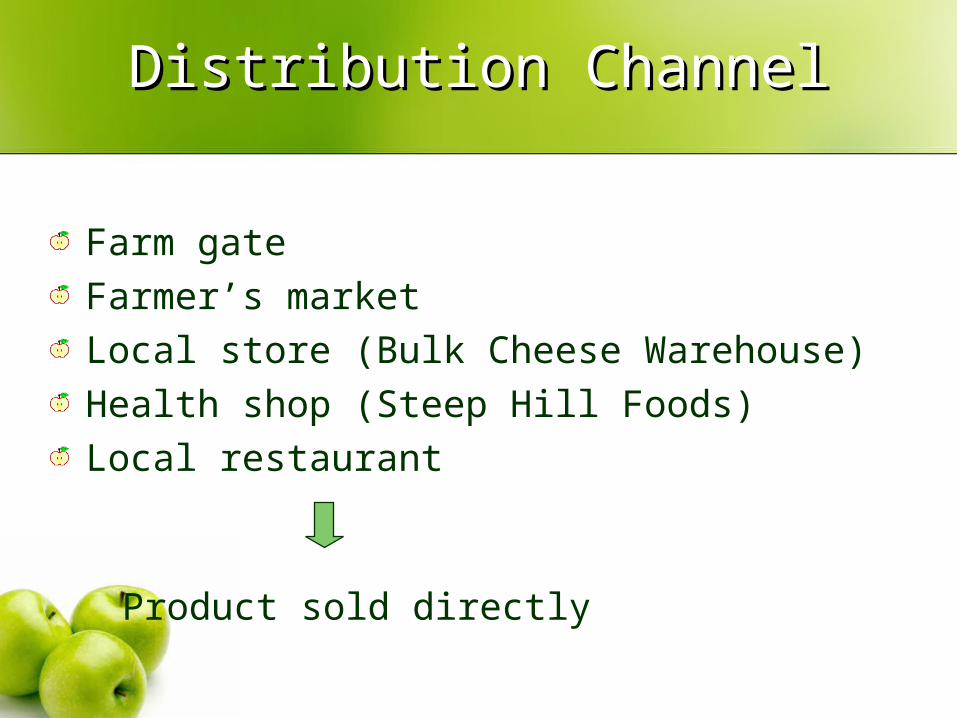
Farm gateFarmer’s marketLocal store (Bulk Cheese Warehouse)Health shop (Steep Hill Foods)Local restaurant
Product sold directly

Pricing strategyPricing strategy
Could charge premium for high quality organically and locally grown product depending on product
Different price for different distribution channels Penetration strategy for early stages

Pricing StrategyPricing Strategy
Product Price
Fresh Apples
U-pick Apples $2.20/kg
Farm-gate pre-picked $2.80/kg
Farmer’s Market $2.80/kg
Steep Hill Foods $2.60/kg
Apple Cider
2-litre jug $5/jug
4-litre jug $9/jug

PromotionPromotion
Advertising methodBillboard----road side, within SaskatoonBrochure---Independent, SFGA, Tourism SaskatchewanTV/Newspaper--- special interest stories, free paperCommunity newsletter adsWebsiteFarmers market
Marketing BudgetMarketing Budget
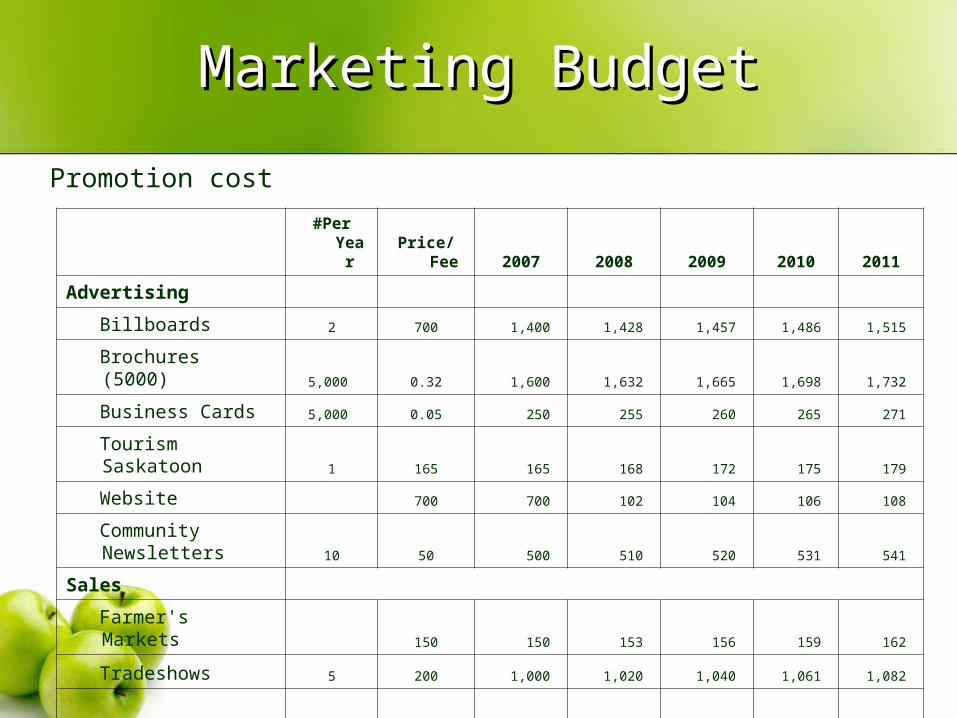
Promotion cost
#Per Year Price/Fee 2007 2008 2009 2010 2011
Advertising
Billboards 2 700 1,400 1,428 1,457 1,486 1,515
Brochures (5000) 5,000 0.32 1,600 1,632 1,665 1,698 1,732
Business Cards 5,000 0.05 250 255 260 265 271
Tourism Saskatoon 1 165 165 168 172 175 179
Website 700 700 102 104 106 108
Community Newsletters 10 50 500 510 520 531 541
Sales
Farmer's Markets 150 150 153 156 159 162
Tradeshows 5 200 1,000 1,020 1,040 1,061 1,082
Transportation/Deliveries 100 25 2,500 2,550 2,601 2,653 2,706
Office Supplies (phone etc.) 200 204 208 212 216
Total Marketing Expenses 8,465 8,022 8,183 8,346 8,513

FinancialFinancial
2007 2008 2009 2010 2011
Total U-pick (kg) 500 2,000 3,500 5,000 5,500
% U-pick 5.6% 12.0% 12.6% 13.5% 11.3%
Expected # Customers 100 400 700 1,000 1,100
Daily Customers 2 9 16 22 24
Assumptions

FinancialFinancial
Expected sales 2007 2008 2009 2010 2011
Fresh Apples per kg
U-pick $2.20 500 2,000 3,500 5,000 5,500
Farm Lane $2.80 500 2,000 3,500 5,000 5,500
Farmer's Market $2.80 500 2,000 3,500 5,000 5,500
Local Grocery Store $2.60 500 2,000 3,500 5,000 5,500
Cider per jug
2-litre $5 1,357 1,717 2,780 3,425 5,469
4-litre $9 678 859 1,390 1,712 2,735
Other Productsestimated sales proportional to the number of U-pick
customers

FinancialFinancial
Expected revenue
Fresh Apple 2007 2008 2009 2010 2011
U-pick $1,100 4,488 7,854 11,220 12,342
Farm Gate $1,400 5,712 9,996 14,280 15,708
Farmer's Market $1,400 5,712 9,996 14,280 15,708
Local Grocery Store $1,300 5,304 9,282 13,260 14,586
Cider
2 Liter $6,783 8,758 14,177 17,467 27,893
4 Liter $6,105 7,882 12,759 15,720 25,104
Other Produce/Products $1,000 4,000 7,000 10,000 11,000
Total Annual Sales $19,088 $41,855 $71,063 $96,227 $122,341
Risk AnalysisRisk Analysis
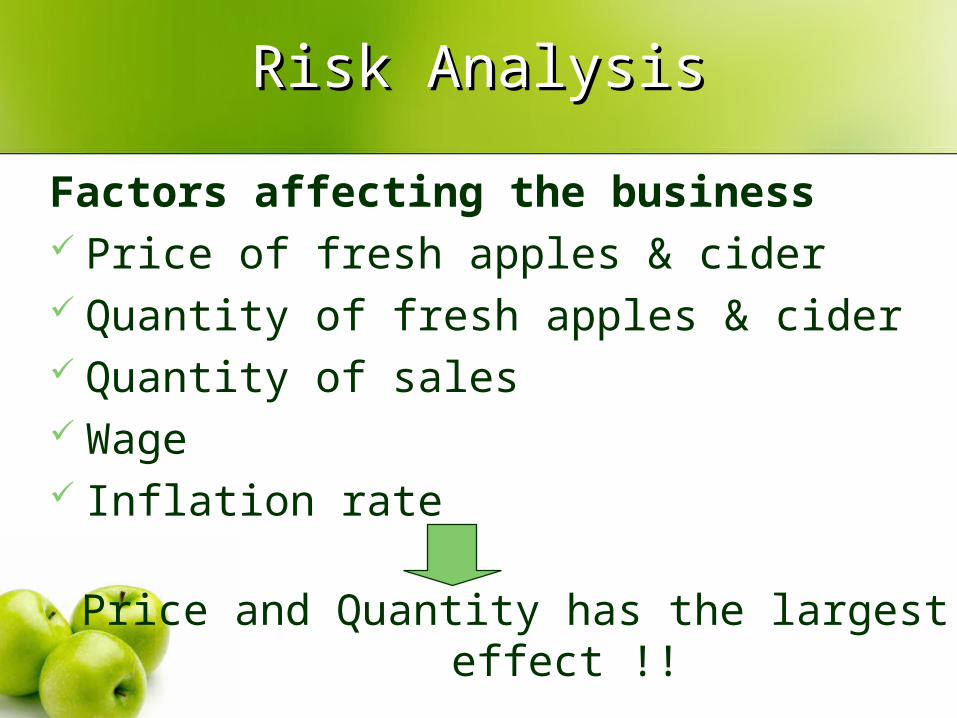
Factors affecting the business Price of fresh apples & cider Quantity of fresh apples & cider Quantity of sales Wage Inflation rate
Price and Quantity has the largest effect !!

Risk AnalysisRisk Analysis
Variables used in Scenario Analysis
unit Base caseWorst
case Best case
Variable
Inflation % 2 14.5 -20
Wage $/hour 9 20 8.05
Price fresh apple $/kg 2.2-2.8 0.71 4
cider $/ 2 liter 2.5 1.35 5
Quantity fresh apple %/kg 22.4%/2000 0%/0 100%/9000
cider# of 2 liter
jug 77.6%/1,357 0%/0 100%/3548

Risk AnalysisRisk Analysis
Scenario NPV IRRFirst year
Cash FlowsFirst year Net
Income
Fresh Base Case2,2644 to 120,742 21.6-28.4% 21,795-27,195
-42,475to -37,075
Worst Case -236487 0.0% 8,385 -55,885
Best Case 315,477 40.2% 37,995 -26,275
Cider(2 liter) Base Case -69,304 14.8% 16,153 -48,438
Worst Case -238,356 0.0% 7,992 -56,598
Best Case 268,359 37.4% 33,893 -30,698
Net Present Value and IRR
Risk AnalysisRisk Analysis
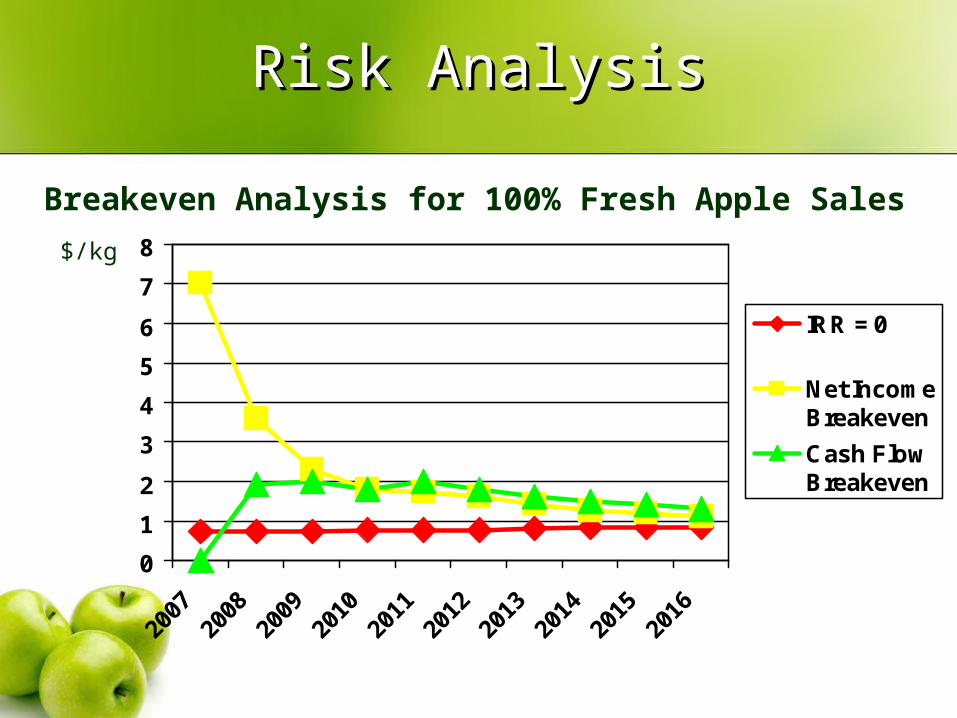
Breakeven Analysis for 100% Fresh Apple Sales
$/kg
0
1
2
3
4
5
6
7
8
2007
2008
2009
2010
2011
2012
2013
2014
2015
2016
IRR = 0
Net IncomeBreakeven
Cash FlowBreakeven

Risk AnalysisRisk Analysis
Breakeven Analysis for 100% Apple Cider Sales$/2 liter jug
02468
101214161820
2007
2008
2009
2010
2011
2012
2013
2014
2015
2016
IRR = 0
Net IncomeBreakeven
Cash FlowBreakeven
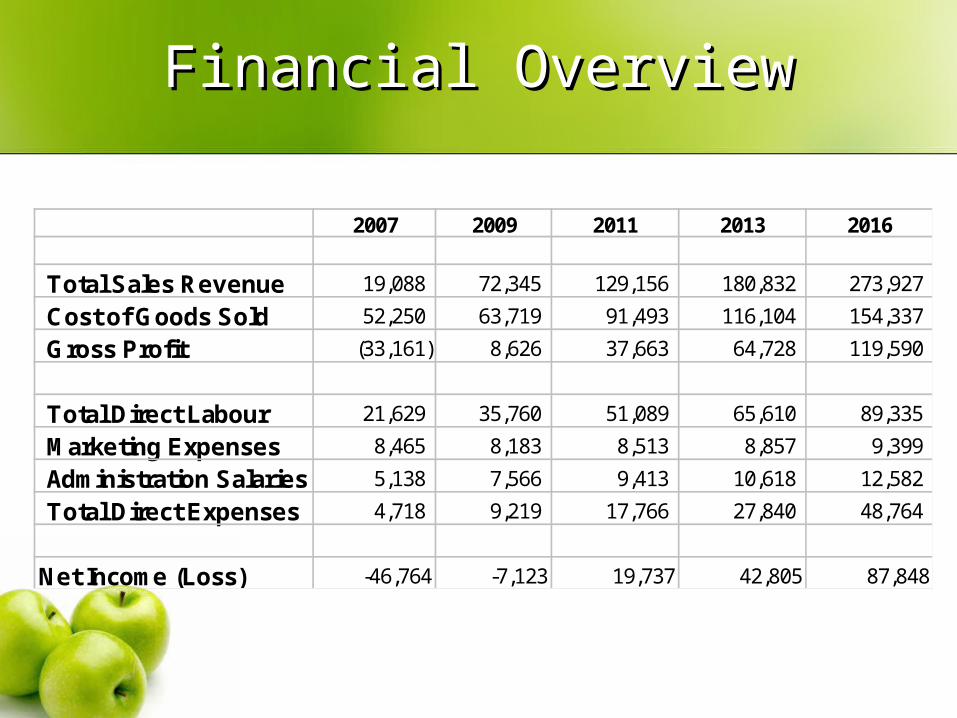
Financial OverviewFinancial Overview
2007 2009 2011 2013 2016
Total Sales Revenue 19,088 72,345 129,156 180,832 273,927
Cost of Goods Sold 52,250 63,719 91,493 116,104 154,337
Gross Profit (33,161) 8,626 37,663 64,728 119,590
Total Direct Labour 21,629 35,760 51,089 65,610 89,335
Marketing Expenses 8,465 8,183 8,513 8,857 9,399
Administration Salaries 5,138 7,566 9,413 10,618 12,582
Total Direct Expenses 4,718 9,219 17,766 27,840 48,764
Net Income (Loss) -46,764 -7,123 19,737 42,805 87,848

Recommendation & Recommendation & ImplementationImplementation
Focus on marketingStress Organically and Locally grown
Maximize fresh apple salesExpand orchard at 500 trees/yearBe conscious about consumer needsMaintain quality and positive experience…AND…
Thank you!Any questions?
MAKE SURE YOU HAVE FUN !!