Nontariff Barriers Alan V. Deardorff III. Regulation and...
28
Nontariff Barriers and Domestic Regulation Alan V. Deardorff University of Michigan I. Tariffs A. Market for Imports B. Domestic Market II. Nontariff Barriers III. Regulation and Related Government Policies in the GATT and WTO IV. Economics of Government Intervention A. Lessons from Economic Theory B. Simple Analytics of Domestic Policy C. Interaction with Trade This is a lecture given at the World Bank on April 6, 1999, to participants in a core course of the Economic Development Institute on “Global Integration and the New Trade Agenda.” I have more recently added textual material in addition to the pages of graphs and outlines in order to make it more self-explanatory. If you have questions about any of it, feel free to contact me at [email protected]. Alan V. Deardorff June 3, 1999 I. Tariffs The graph below shows the effects of a tariff on imports. The partial equilibrium model of the market for a country’s imports of a certain good assumes perfect competition, an upward sloping supply of imports, S m , from abroad, and a downward sloping demand for imports, D m , by the domestic economy. With free trade, a single price P m f equates supply and demand. A specific tariff, t, drives a wedge between the price paid by domestic importers, P m d , and the price received by foreign exporters, P m w on the world market.
Transcript of Nontariff Barriers Alan V. Deardorff III. Regulation and...
Nontariff Barriers and Domestic Regulation
Alan V. Deardorff
University of Michigan
I. Tariffs A. Market for Imports B. Domestic Market
II. Nontariff Barriers III. Regulation and Related Government Policies in the GATT and WTO IV. Economics of Government Intervention
A. Lessons from Economic Theory B. Simple Analytics of Domestic Policy C. Interaction with Trade
This is a lecture given at the World Bank on April 6, 1999, to participants in a core course of the Economic Development Institute on “Global Integration and the New Trade Agenda.” I have more recently added textual material in addition to the pages of graphs and outlines in order to make it more self-explanatory. If you have questions about any of it, feel free to contact me at [email protected]. Alan V. Deardorff June 3, 1999 I. Tariffs The graph below shows the effects of a tariff on imports. The partial equilibrium model of the market for a country’s imports of a certain good assumes perfect competition, an upward sloping supply of imports, Sm, from abroad, and a downward sloping demand for imports, Dm, by the domestic economy. With free trade, a single price Pm
f equates supply and demand. A specific tariff, t, drives a wedge between the price paid by domestic importers, Pm
d, and the price received by foreign exporters, Pm
w on the world market.

2
Effects of a Tariff on Imports
Sm = Supply of imports Dm = Demand for imports Pm
f = Free-trade price Pm
d = Domestic price of imports with tariff Pm
w = World price of imports with tariff Tariff: t = Pm
d − Pmw
The effects of the tariff are summarized below. It causes the quantity of imports both supplied and demanded to fall, the price paid by domestic importers to rise, and the price received by foreign exporters to fall. Effects on the welfare of these groups can be measured by the areas labeled a, b, c, and d in the figure, using the concepts of consumer and producer surplus. Since the supply and demand curves for trade are actually the excess supply and demand curves from the foreign and domestic economies respectively, the areas to their left represent the combined producer plus consumer surpluses in the market for the good.
Qmt Qm
f Qm
Import Market
Dm
Pmf
Pmd
Pmw
SmPm

3
Effects of a Tariff on Imports
Changes caused by tariff: ∆Qm < 0 Quantity of imports falls ∆Pm
d > 0 Domestic price of imports rises ∆Pm
w < 0 World price of imports falls a+b Domestic consumers-producers lose c+d Foreign producers-consumers lose a+c Domestic government gains revenue b+d World loses - “dead weight loss” Explanation: Domestic Producers and Consumers: Since the domestic price rises, domestic consumers lose and domestic producers gain from the tariff. Since consumers buy more than producers sell (the country imports), the loss is larger than the gain, and the net loss of the two together is the area a+b to the left of the import demand curve. Foreign Producers and Consumers: Since the world price falls, foreign consumers gain and foreign producers lose from the tariff. Since producers sell more than consumers buy (the world exports), the loss is again larger than the gain, and the net loss of the two together is area c+d to the left of the import supply curve.
dc
ba
Qmt Qm
f Qm
Import Market
Dm
Pmf
Pmd
Pmw
SmPm
4
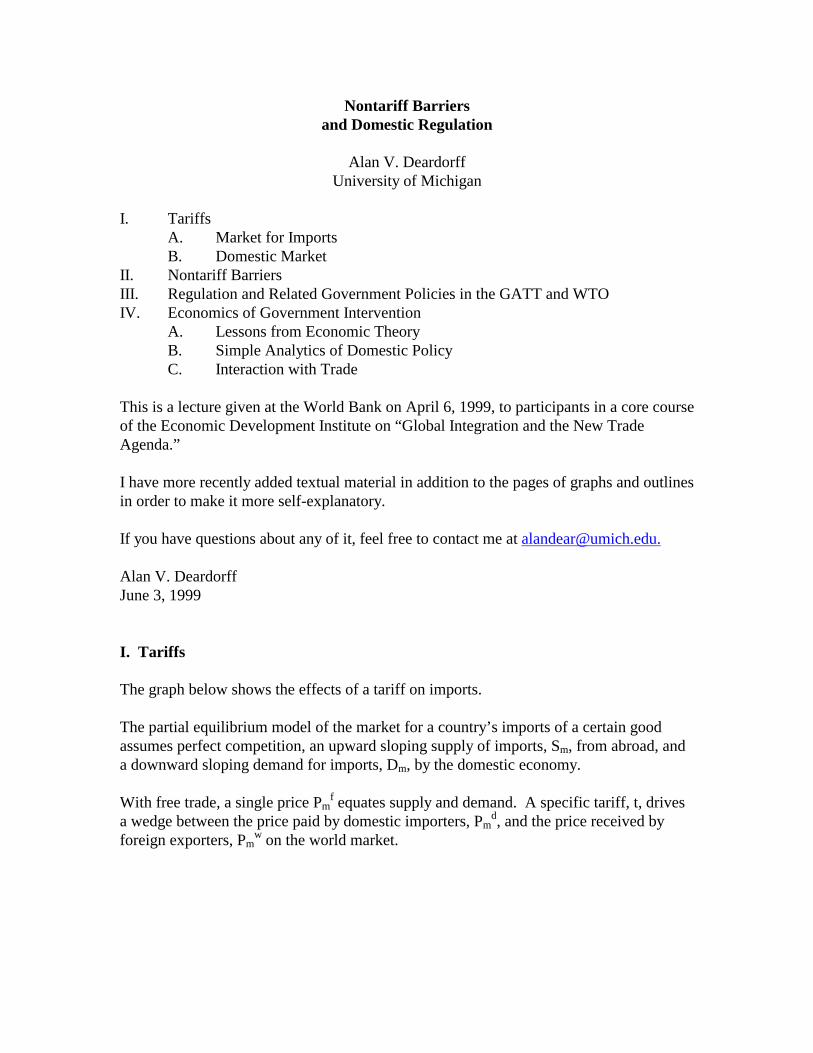
Domestic Government: It collects tariff revenue equal to the tariff, t, times the quantity of imports, Qm
t. This is area a+c. World: The effect on welfare of the world is the sum of these three effects: World
−(a+b) Domestic Prod+Cons −(c+d) Foreign Prod+Cons
+(a+c) Dom Govt = −(b+d)
Thus, the world as a whole loses from the tariff. This is called the Dead Weight Loss. In what sense does the world lose from a tariff? Since some gain (domestic producers, foreign consumers, domestic government), it does not mean that all lose. Instead, it means that: Those who gain from a tariff do not gain enough to be able to compensate the losers and
still remain better off. Does the importing country gain? It may: Domestic Country: Domestic
−(a+b) Domestic Prod+Cons +(a+c) Dom Govt
= + c − b This will be positive if c>b. Note that c>0 requires that the world price fall due to tariff.

5
Small Country Case: If a country’s demand for import of a good is small compared to the world market, as will normally be the case if the country itself is small, then the fall in the world price due to that country’s tariff will be negligible – essentially zero. (The supply curve for imports in this case is horizontal at a fixed world price.) In that case, the country must lose from the tariff, since area c is zero. Thus:
In a small country, producers and the government together do not gain enough from a tariff to compensate consumers of the good.
Effects of a Tariff in a Small Country
Changes caused by tariff: a+b Domestic consumers-producers lose a Domestic government gains revenue ___ b Domestic country loses
ba
Qmt Qm
f Qm
Import Market
Dm
Pmf
Pmd
=Pmw
Sm
Pm
6
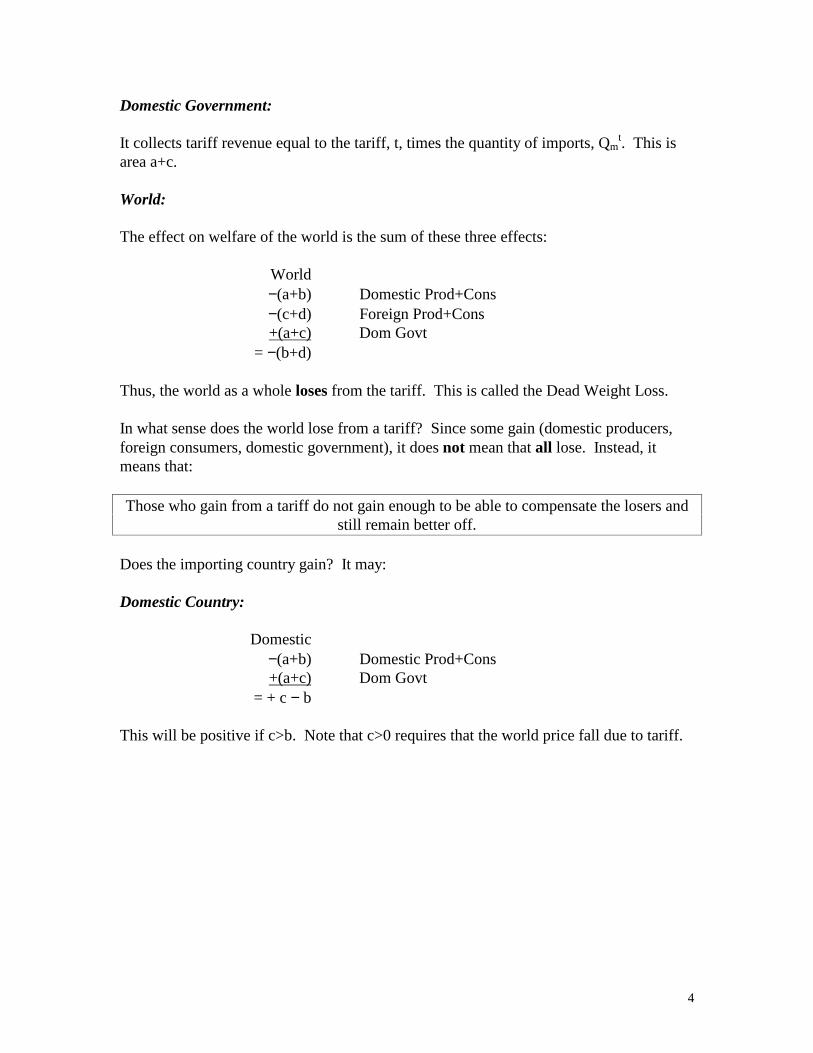
Large Country Case: If a country is large enough for its demand for the good to constitute a significant fraction of the world market, then its tariff may reduce the world price by enough to matter, as shown in the figures above and below. In that case, the tariff-levying country as a whole may (but need not) gain from the tariff. What matters is how much the world price falls. When a large country gains from a tariff, it is called:
• The “terms of trade” argument for a tariff – the terms of trade being the relative price of a country’s exports and imports – the gain coming from changing that relative price in the country’s favor
• The “monopoly” argument for a tariff – since the country is using its size in the world market much like a monopolist, to move price in its favor.
• The “optimal tariff” argument, since there exists a level of the tariff that maximizes the gain to the country. (Note: the optimal tariff of a small country is zero.)
In what sense may a large country gain from a tariff?
In a large country, a tariff may – if the world price falls enough – generate enough producer surplus and tariff revenue so that producers and the government could
compensate consumers for their loss. Note however that:
• The gain is not guaranteed. (Price may not fall enough.)
• Compensation may not be paid.
• The rest of the world is losing more than the country gains.
• Other countries may retaliate, igniting a trade war.
7
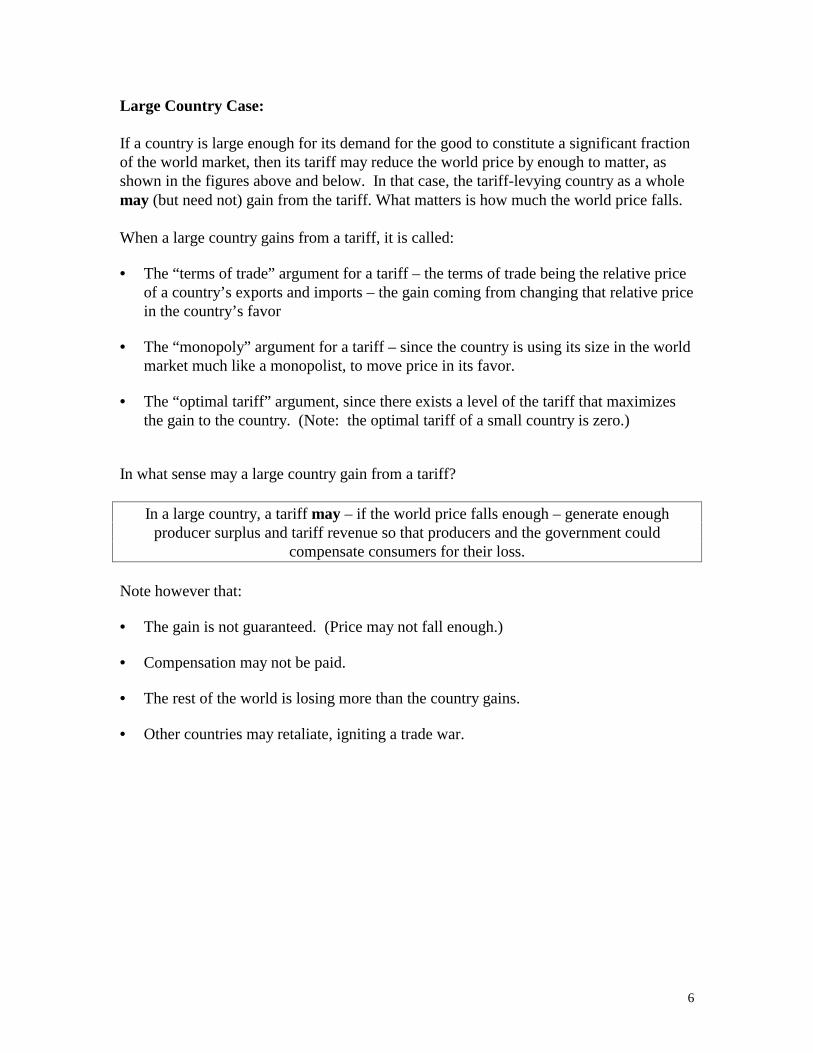
Domestic Market Effects of a Tariff: The effects on domestic producers and consumers can be decomposed by looking at their separate supply and demand curves, as in the figure below. Sd is the domestic supply curve for the good and Dd is the domestic demand curve for the good (all demand, not just for import). Pm
f is the world price of the good if the country does not levy a tariff, determined in the market for imports as discussed above. Assuming (as was not necessary above) that the good is homogeneous so that what is produced domestically is a perfect substitute for what is imported, the domestic price under free trade must also be Pm
f. Thus the quantities supplied and demanded by domestic producers and consumers under free trade are Sf and Df respectively. The tariff raises the domestic price of imports, and thus of domestically produced goods since they are perfect substitutes, to the level Pm
d determined above. As also discussed above, if the country is small, the tariff leaves the world price unchanged at Pm
f, but if the country is large, it lowers the world price to Pm
w. Both cases are considered in the same figure below (although this means that the size of the tariff for the two cases is implicitly different). In either case, the rise in the domestic price leads to an increase in supply from domestic producers to St and a decrease in domestic demand to Dt.

8
Effects of a Tariff on Imports
Changes in domestic market: ∆Sd>0 Domestic production rises ∆Dd<0 Domestic consumption falls ∆Pd>0 Domestic price rises +a Domestic producers gain −(a+b+c+d) Domestic consumers lose +c [+e] Government gains revenue −(b+d) [+e] Country loses - dead weight loss Explanation:
Domestic Suppliers: They gain from the rise in domestic price. Their gain is measured by the increase in producer surplus, which is the area to the left of the supply curve between the two prices, or area a. Domestic Demanders: Demanders lose from the rise in price, their loss measured by the decrease in consumer surplus, which is the area to the left of the demand curve, a+b+c+d. Government: The government collects tariff revenue equal to the difference between the new domestic price and the new world price of imports, which is Pm
f in the small country case and Pmw
Pmf
Sd
edcb
a
Dd
Domestic Market
DtStSf Df Qd
Pmw
Pmd
Pd

9
in the large country case. Thus the tariff revenue is measured by area c plus, in the large country case only, area e. The latter is shown in square brackets above and below. The Country; Domestic Country
+a Domestic Producers −(a+b+c+d) Domestic Demanders
+c [+e] Domestic Government = − (b+d) [+e]
In a small country, this must be negative, and the country loses form the tariff. In a large country, this can be positive or negative, depending on the size of e and therefore on how much the world price has fallen due to the tariff.

10
II. Nontariff Barriers A nontariff barrier (NTB) is any policy that restricts trade other than a simple tariff. In the graphs below the following NTBs are analyzed:
• Quota
• Variable Levy
• Voluntary Export Restraint
• Government Procurement Regulation
• Domestic Production Subsidy
Quota on Imports: A quota is a restriction on the quantity of trade, in this case imports. It may not be binding, if it is set above the level of free trade imports, in which case it has no effect at all if markets are competitive. A binding quota, however, requires that prices adjust so that the market will import only the restricted quantity in equilibrium. This requires that the domestic price of the imported good rise due to the quota, just as in the case of the tariff above. This raises the price of the import above its world price, and gives rise to “rents:” the profits that are made by whoever is lucky enough to import under the quota. They buy at the world price and sell at the higher domestic price. Administration of a Quota: Exactly how all of this is accomplished depends on how the quota is administered. Examples: • Import Licenses, Auctioned: Government sells the licenses, the market value of
which is the quota rent, and the government therefore gets the rents. • Import Rights Given to Domestic Residents: Those residents get the rents, except
for any bribes they may have paid to officials, who get the rest. • First-Come-First-Served: Country permits free imports until the quota is met, then
stops; rents go to winners of the race, but are largely dissipated by extra resources expended in trying to win (example of “rent seeking”).
• Import Rights Given to Foreigners: Foreigners get the rents. Analysis: The analysis of a quota, focusing on the import market as shown below, looks very similar to that for a tariff. The quota restricts the quantity of imports to Qm
q, which raises

11
the domestic price of imports to Pmq – the level at which demanders will settle for the
smaller quantity. In the large country case shown, the reduced quantity also requires that the world price of the imported good fall, so that foreign suppliers too are in equilibrium, at the lower world price Pm
w. The price difference, Pmq−Pm
q, is called the “tariff equivalent” of the quota. An easy way to think of the quota is as changing the country’s demand curve for imports. The demand curve becomes the dashed red line labeled Dm
q, which has a kink at Qmq.
Comparison to a Tariff: In the figure, the only difference from the case of the tariff is that the area a+c now measures the quota rents, not tariff revenue. Welfare effects are correspondingly altered, depending on who gets these rents. The more important difference between a tariff and a quota cannot be seen in this static figure, since it appears only when conditions change. As supply and/or demand curves shift over time or due to other policies, the quantity of imports remains fixed under the quota but changes under the tariff. In practical terms, this is likely to mean that in a growing market a quota will become increasingly restrictive over time, its tariff equivalent rising, unless the Qm
q is deliberately increased. Effects of a Quota on Imports
Dmq
Qmq Qm
f Qm
Import Market
Dm
Pmf
Pmd
Pmw
c
a
SmPm
12
Changes caused by quota:
Same as tariff except:
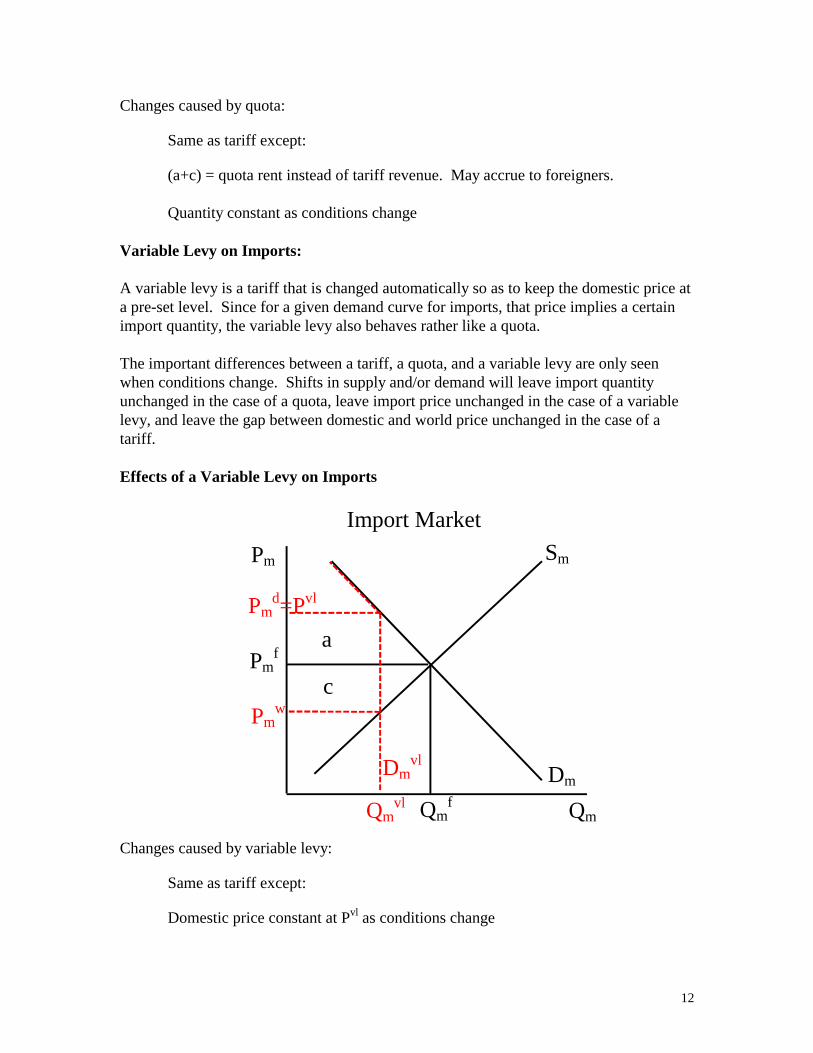
(a+c) = quota rent instead of tariff revenue. May accrue to foreigners. Quantity constant as conditions change Variable Levy on Imports: A variable levy is a tariff that is changed automatically so as to keep the domestic price at a pre-set level. Since for a given demand curve for imports, that price implies a certain import quantity, the variable levy also behaves rather like a quota. The important differences between a tariff, a quota, and a variable levy are only seen when conditions change. Shifts in supply and/or demand will leave import quantity unchanged in the case of a quota, leave import price unchanged in the case of a variable levy, and leave the gap between domestic and world price unchanged in the case of a tariff. Effects of a Variable Levy on Imports
Changes caused by variable levy:
Same as tariff except:
Domestic price constant at Pvl as conditions change
Dmvl
Qmvl Qm
f Qm
Import Market
Dm
Pmf
Pmd=Pvl
Pmw
c
a
SmPm
13
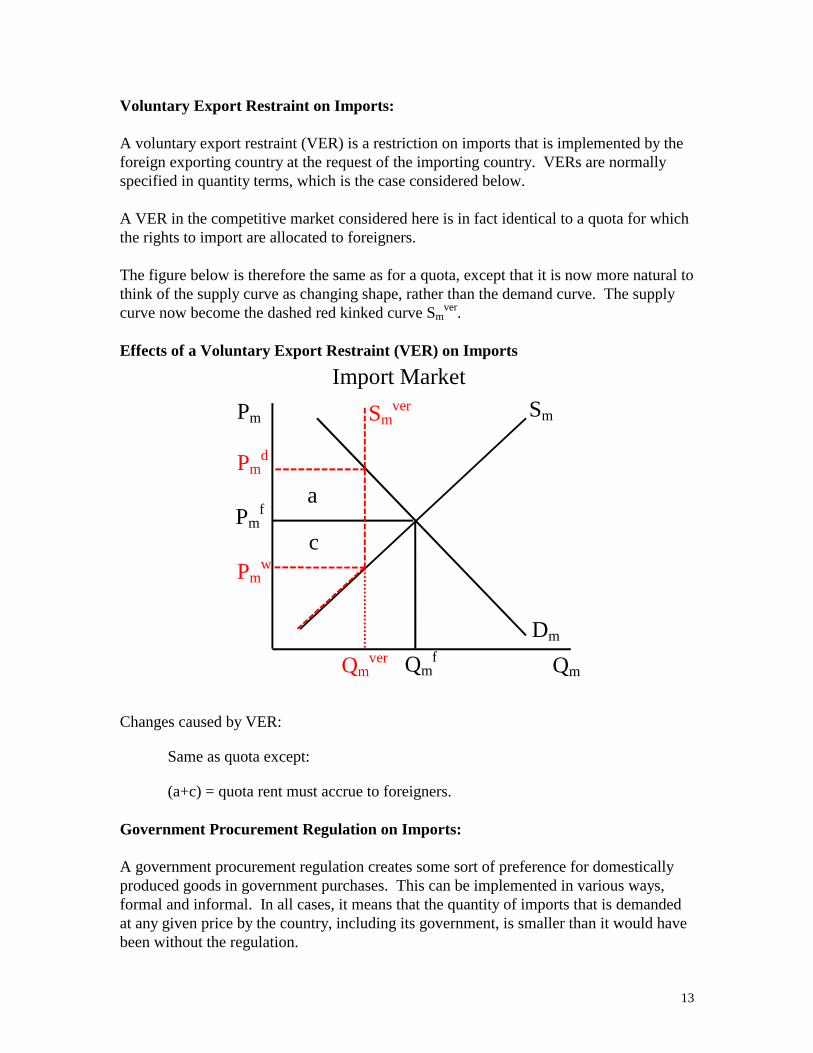
Voluntary Export Restraint on Imports: A voluntary export restraint (VER) is a restriction on imports that is implemented by the foreign exporting country at the request of the importing country. VERs are normally specified in quantity terms, which is the case considered below. A VER in the competitive market considered here is in fact identical to a quota for which the rights to import are allocated to foreigners. The figure below is therefore the same as for a quota, except that it is now more natural to think of the supply curve as changing shape, rather than the demand curve. The supply curve now become the dashed red kinked curve Sm
ver. Effects of a Voluntary Export Restraint (VER) on Imports
Changes caused by VER:
Same as quota except:
(a+c) = quota rent must accrue to foreigners. Government Procurement Regulation on Imports: A government procurement regulation creates some sort of preference for domestically produced goods in government purchases. This can be implemented in various ways, formal and informal. In all cases, it means that the quantity of imports that is demanded at any given price by the country, including its government, is smaller than it would have been without the regulation.
Qmver
Smver
Qmf Qm
Import Market
Dm
Pmf
Pmd
Pmw
c
a
SmPm

14
This can be illustrated as a leftward shift of the import demand curve, as to Dm
gov below. The exact nature of the shift from the free trade demand curve depends on how the regulation is structured, but that matters little for the results. The effect is to reduce the quantity of imports and also, if the country is large enough for the (foreign) import supply curve to have a positive slope as shown, for the price of imports to fall on both the world market and the domestic market. This last is an important difference compared to a tariff or quota: Demanders of imports other than the government benefit from a lower price (or if the country is small, at least do not suffer from a higher price). A tariff equivalent can be defined in this case as the tariff that would have reduced imports by the same amount as the regulation. It can be found from the free trade demand curve as shown, although finding it in observable data is much harder. However, it is not the case that the regulation is completely equivalent to that tariff, since the effect on domestic price is quite different. Effects of a Government Procurement Regulation on Imports
Changes caused by a government procurement regulation:
Similar to tariff except:
Domestic price falls.
Size of distortion difficult to observe.
Dmgov
Qmgov Qm
f Qm
Import Market
Dm
Pmf
(Pmd+TE)
Pmd
c
a
SmPm
15
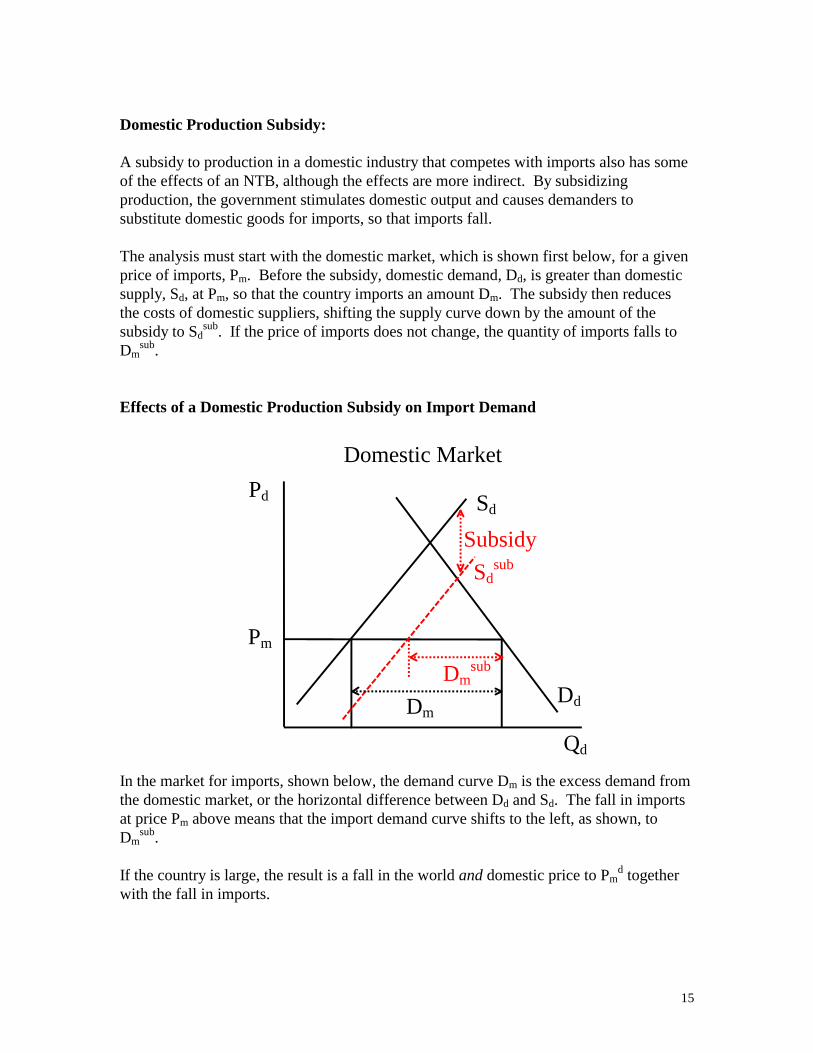
Domestic Production Subsidy: A subsidy to production in a domestic industry that competes with imports also has some of the effects of an NTB, although the effects are more indirect. By subsidizing production, the government stimulates domestic output and causes demanders to substitute domestic goods for imports, so that imports fall. The analysis must start with the domestic market, which is shown first below, for a given price of imports, Pm. Before the subsidy, domestic demand, Dd, is greater than domestic supply, Sd, at Pm, so that the country imports an amount Dm. The subsidy then reduces the costs of domestic suppliers, shifting the supply curve down by the amount of the subsidy to Sd
sub. If the price of imports does not change, the quantity of imports falls to Dm
sub. Effects of a Domestic Production Subsidy on Import Demand
In the market for imports, shown below, the demand curve Dm is the excess demand from the domestic market, or the horizontal difference between Dd and Sd. The fall in imports at price Pm above means that the import demand curve shifts to the left, as shown, to Dm
sub. If the country is large, the result is a fall in the world and domestic price to Pm
d together with the fall in imports.
Pm
Sdsub
Subsidy
Sd
Dd
Domestic Market
Dmsub
Dm
Qd
Pd
16
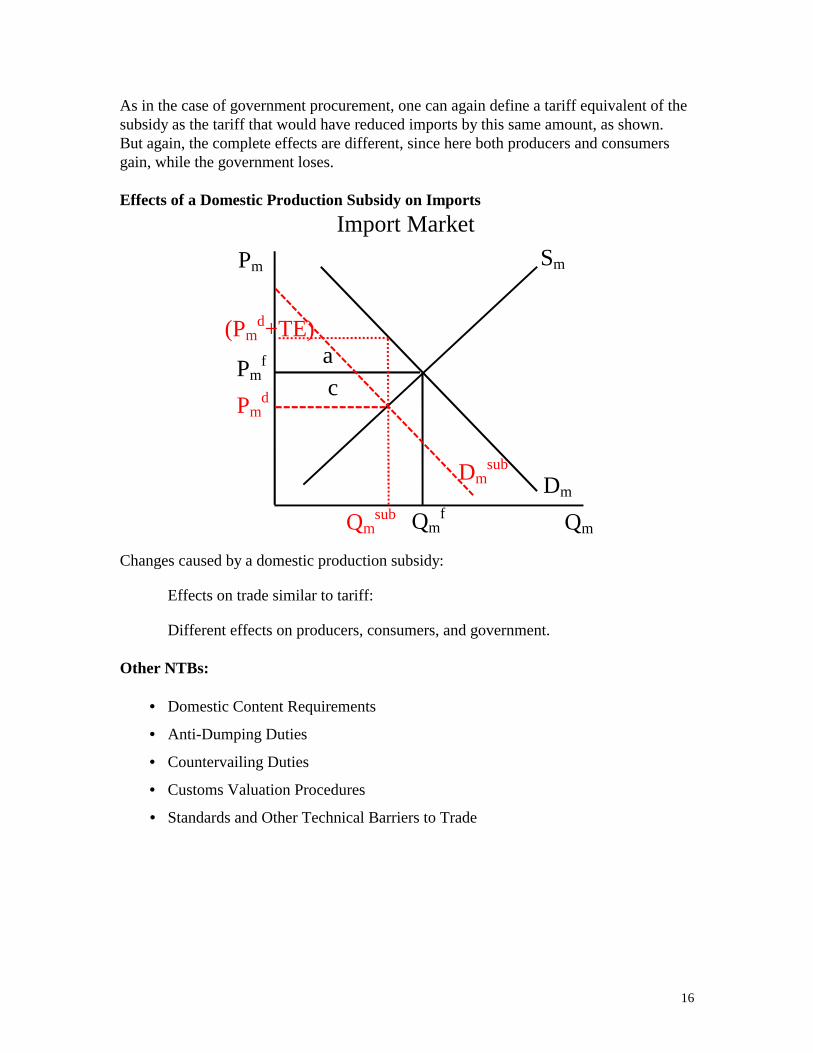
As in the case of government procurement, one can again define a tariff equivalent of the subsidy as the tariff that would have reduced imports by this same amount, as shown. But again, the complete effects are different, since here both producers and consumers gain, while the government loses. Effects of a Domestic Production Subsidy on Imports
Changes caused by a domestic production subsidy:
Effects on trade similar to tariff:
Different effects on producers, consumers, and government. Other NTBs:
• Domestic Content Requirements
• Anti-Dumping Duties
• Countervailing Duties
• Customs Valuation Procedures
• Standards and Other Technical Barriers to Trade
Dmsub
Qmsub Qm
f Qm
Import Market
Dm
Pmf
(Pmd+TE)
Pmd
ac
SmPm

17
III. Regulation and Related Government Policies, in the GATT and WTO GATT
• Started with only trade • Tariffs were high • Trade was small • Domestic policies seemed not to matter
Over Time
• Line between trade and domestic markets has blurred • Tariffs fell • Trade grew • Domestic policies became relatively more important • Domestic interest groups noticed trade • Tokyo Round extended GATT to domestic policies:
Government Procurement Standards
Recently • Other non-trade interest groups have noticed both the dangers and the
opportunities presented by trade:
Dangers: Trade rules will interfere with other objectives Opportunities: Trade institutions can be used to enforce solutions
Examples: Services Intellectual Property Environment Labor Standards
• Trade community noticed domestic policies Domestic policies could undermine trade Regulations could act as NTBs
Today – the World Trade Organization Expanded: Broader Scope: New Issues Greater Power: Dispute Settlement What Should (and Can) the WTO Do? Monitor Domestic Policies? Effects on Trade Effects on Other Countries Regulate Domestic Policies?
(Harder than regulating tariffs: Can’t “Just Say No”)
18
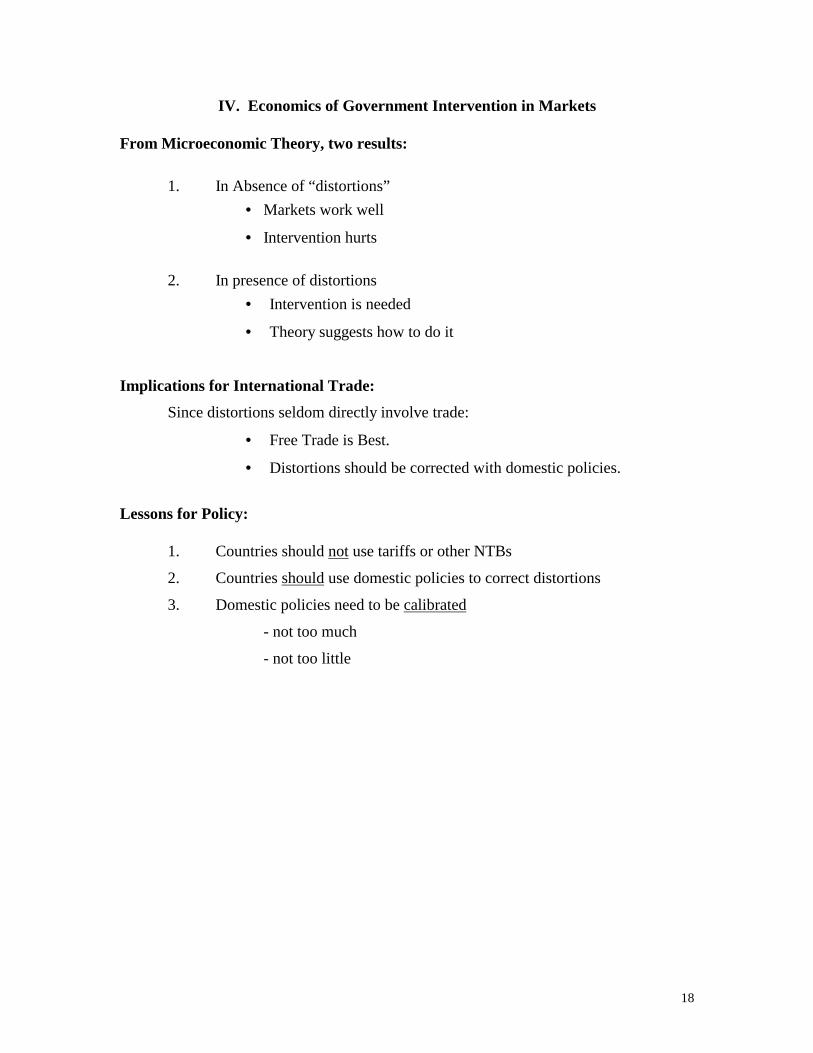
IV. Economics of Government Intervention in Markets From Microeconomic Theory, two results:
1. In Absence of “distortions”
• Markets work well
• Intervention hurts
2. In presence of distortions
• Intervention is needed
• Theory suggests how to do it
Implications for International Trade:
Since distortions seldom directly involve trade:
• Free Trade is Best.
• Distortions should be corrected with domestic policies.
Lessons for Policy:
1. Countries should not use tariffs or other NTBs
2. Countries should use domestic policies to correct distortions
3. Domestic policies need to be calibrated
- not too much
- not too little

19
The Simple Analytics of Domestic Policy:
Example: External Social Cost (=E) arising from production, such as pollution or threat to public safety.
Policies: Tax on production
Regulation of quantity produced
Cases to consider:
1. No trade, no distortion
2. No trade, distortion
3. Small open economy, no distortion
4. Large open economy, no distortion
5. Small open economy, distortion
Problem: Find optimal policies
Analysis: Will examine the domestic market for a good under the assumption of perfect competition. In the absence of the externality, the supply curve, S, measures (vertically) both the marginal private cost (MPC) and the marginal social cost (MSC) of producing the good. With the externality, MSC exceeds MPC by the amount of the externality, E. A tax on production drives a wedge between the price paid by demanders, Pd
t, and that received by suppliers, Ps
t, the difference being the tax. This causes changes in consumer and producer surplus and tax revenue, very similar to the tariff in the market for imports. By changing output, it also causes changes in the total external cost, when the externality is present.

20
Case 1: No Trade, No Distortion (E=0)
Qe = Market output Qopt = Optimal output
Qt = Output achieved by tax or regulation
In this case: • Market gets it right • Tax or regulation causes dead weight loss
Explanation: The market equilibrium at quantity Qe not only equates the quantities supplied and demanded, but also equates (since there is no externality) the marginal benefit and marginal cost of producing the good. This means that this output is optimal, since we cannot increase benefits further above costs by changing it. This can also be seen by checking the welfare effects of a production tax or regulation that reduces output to Qt. It turns out that the losses in consumer and producer surplus exceed the revenues from the tax (or rents from the regulation) by the triangle labeled Dead Weight Loss. Thus a policy that lowers output will lower national welfare. (A subsidy would do likewise.) The market gets it right.
Qt Qe=Qopt Q
Domestic Market
D=MB
Pe
Dead-weightloss from tax
Pdt
Pst
S=MPCP

21
Case 2: No Trade, Distortion = E > 0
• Market gets it wrong! • Tax CAN offset externality and get it right.
Problems with tax: Producers 1. Are hurt 2. Won’t cooperate (mislead) 3. Lobby against it
Explanation: With this negative externality, MSC is now greater than MPC and hence greater than MB at Qe, so that social cost can be reduced more than social benefit by reducing output. The optimum is where MSC=MB, at the intersection of the demand curve with the MSC curve (which lies a distance E above the supply curve). Now a tax (equal to E) is beneficial, because it reduces output to the optimal level. The welfare effects are the same as Case 1, except that now there is the additional benefit of the reduced externality. This is equal to E times the drop in output. In the figures, this is the area of the parallelogram between MSC, S, and the two outputs. It cancels out the Dead Weight Loss from before, and leaves the triangle of Net Gain from Tax that is shown.
=QtQopt Qe Q
Domestic Market
D=MB
Pe Net gainfrom tax
Pdt
Pst
MSC=MPC + ES=MPC
P

22
Case 2a: Same, but with regulation instead of tax
Government regulates output at Qr Suppliers get rents If Qr is right, net effect is same as tax But note incentives; Tax: Suppliers want it weaker Regulation: Suppliers want it stricter! Explanation: A regulation that limits output to Qopt accomplishes the same purpose as the tax and has the same positive effect on national welfare. However here the amount that the government would have collected in tax revenue goes instead to the producers as increased profits, or rent, from the regulation (their costs go down, while their price goes up). Comparison of Tax and Regulation: While the tax hurts producers and will be resisted by them, the regulation benefits producers and will be welcomed by them. (Both hurt consumers equally.) Therefore, in the interaction between the firms and the government, we can expect a regulation to be too restrictive, but a tax to be not restrictive enough.
=QrQopt Qe Q
Domestic Market
D=MB
Pe
Rents
Pdr
Psr
MSC=MPC + ES=MPC
P

23
Case 3: Open Economy Small Country No Distortion
• Free trade gets it right • Tariff causes dead weight loss
But note gain to suppliers Explanation: This just repeats what we saw before, that in a small open economy without distortions, a tariff reduces welfare. This says that free trade gets the levels of both production and consumption right, since it equates the marginal cost of production to the marginal benefit from consumption, and both also to the marginal cost of acquiring the good in trade, Pw.
Q
Domestic Market
D=MBPw
Pdt
Dead-weightloss from tariff
S=MPCP
24
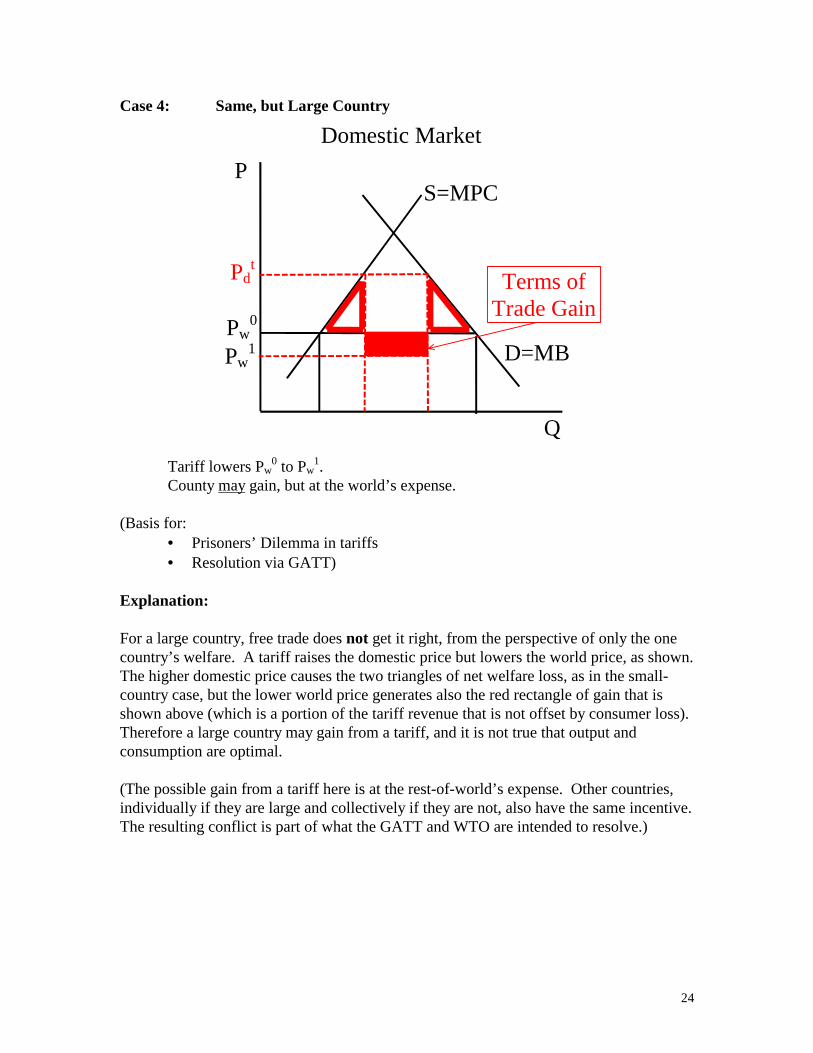
Case 4: Same, but Large Country
Tariff lowers Pw0 to Pw
1. County may gain, but at the world’s expense.
(Basis for:
• Prisoners’ Dilemma in tariffs • Resolution via GATT)
Explanation: For a large country, free trade does not get it right, from the perspective of only the one country’s welfare. A tariff raises the domestic price but lowers the world price, as shown. The higher domestic price causes the two triangles of net welfare loss, as in the small-country case, but the lower world price generates also the red rectangle of gain that is shown above (which is a portion of the tariff revenue that is not offset by consumer loss). Therefore a large country may gain from a tariff, and it is not true that output and consumption are optimal. (The possible gain from a tariff here is at the rest-of-world’s expense. Other countries, individually if they are large and collectively if they are not, also have the same incentive. The resulting conflict is part of what the GATT and WTO are intended to resolve.)
Q
Domestic Market
D=MBPw
0
Pdt
Terms ofTrade Gain
S=MPCP
Pw1
25
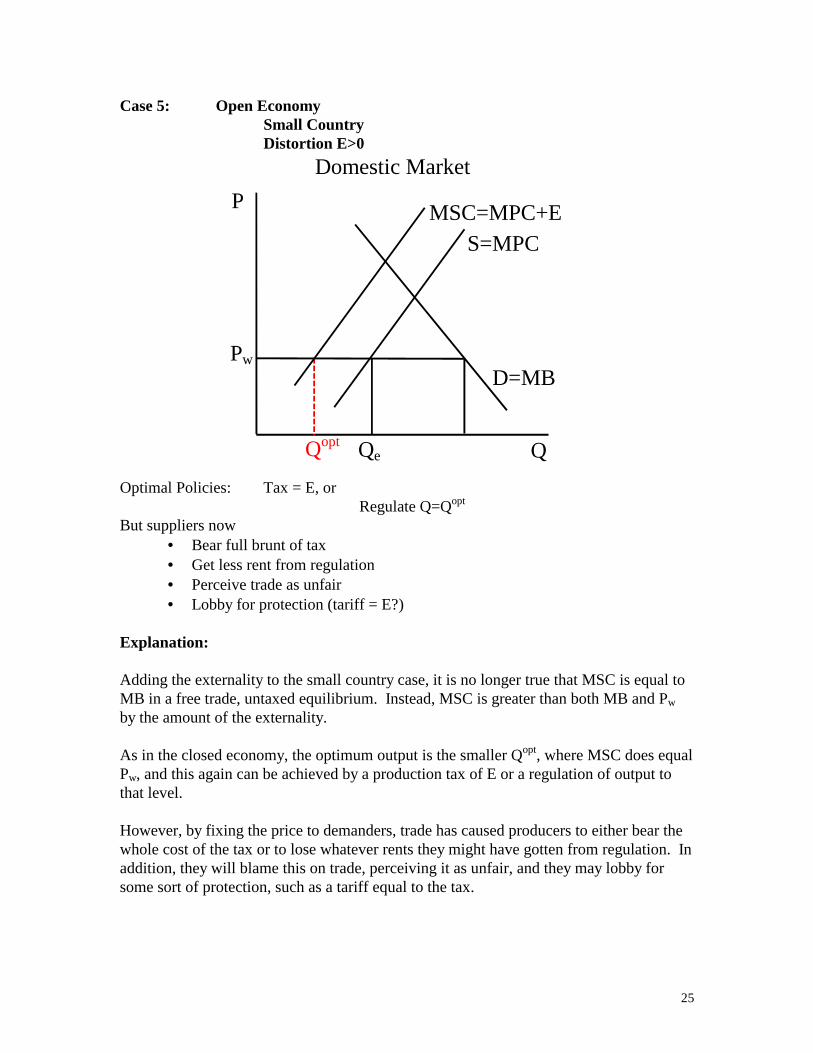
Case 5: Open Economy Small Country Distortion E>0
Optimal Policies: Tax = E, or Regulate Q=Qopt But suppliers now
• Bear full brunt of tax • Get less rent from regulation • Perceive trade as unfair • Lobby for protection (tariff = E?)
Explanation: Adding the externality to the small country case, it is no longer true that MSC is equal to MB in a free trade, untaxed equilibrium. Instead, MSC is greater than both MB and Pw by the amount of the externality. As in the closed economy, the optimum output is the smaller Qopt, where MSC does equal Pw, and this again can be achieved by a production tax of E or a regulation of output to that level. However, by fixing the price to demanders, trade has caused producers to either bear the whole cost of the tax or to lose whatever rents they might have gotten from regulation. In addition, they will blame this on trade, perceiving it as unfair, and they may lobby for some sort of protection, such as a tariff equal to the tax.
Qopt Qe Q
Domestic Market
D=MBPw
MSC=MPC+ES=MPC
P

26
Leveling the Playing Field: With a Tariff A tariff equal to the tax can be viewed as “leveling the playing field,” by subjecting the imports to the same requirement as domestic production. Analysis of that case (not done here) can easily show however that this negates any benefit from the tax in reducing the externality, and at the same time causes a dead weight loss by raising prices to demanders. With a Processing Requirement A more interesting case, however, is one in which instead of being taxed, producers are required to eliminate the externality by some sort of processing that raises their cost. By itself, this will have effects very similar to the tax considered above, if the processing cost, A, is equal to E. The supply curve shifts up due to the extra cost, the optimal level of output is reached, and domestic producers bear the entire cost. Now suppose that domestic producers lobby to have imports subject to the same processing requirement, again to level the playing field. If foreign production generates the same negative externality for the domestic country as domestic production, then this will work well, but for plausible externalities that seems unlikely. Assume instead the opposite extreme: that foreign production generates no externality for anyone. (Perhaps foreign production occurs in a location where pollution, if that is the problem, is more readily dissipated, for example.) Then the requirement that imports be processed adds to their cost without actually doing any good. This case is analyzed below. The domestic processing requirement shifts the supply curve up by the amount A=E, making it coincide with the MSC curve. At the same time, foreign costs are also increased by A, raising the price of imports from the world market to Pw+A. In the new equilibrium domestic output is the same as it was without any policy at all, while consumption and imports are both reduced.

27
Case 5a: Same, but with import processing
Result: Extra net resource cost of unnecessary import processing. Welfare Effects of the Processing Requirement: Domestic producers are now unaffected, since their cost and price have both risen by the same amount. Domestic consumers are worse off by their loss of consumer surplus. Part of that loss is payment for the elimination of the externality, which is a benefit and therefore cancels out. But the rest – the red areas in the figure below, are net losses for the country and the world. The triangle is the usual deadweight loss of raising the price to consumers above the true marginal cost. The rectangle is an additional cost in resources, wasted on processing imports that did not need it.
Q
Domestic Market
D=MB
Pw+A
Pw
MSC=MPC+E=MPC+A
S=MPC
P
ResourceCost
Dead-weightLoss

28
Other Issues:
1. Policy “harmonization”: To what extent is it helpful for domestic policies to be either the same or coordinated?
2. Will governments act for the best? Are the incentives confronting governments such that it is in their interest to select policies that will be optimal for the world? Or do they need to be restrained from using policies that will hurt each other?
3. Terms of Trade Effects: Domestic policies can change world prices in ways that benefit some countries and hurt others. To what extent do these price changes matter for policy choice, and how can these effects be neutralized by international institutions?