How important are tariffs and nontariff measures for ...cepr.org/sites/default/files/2486_MOHAN -...
36
How important are tariffs and nontariff measures for developing countries’ agricultural processed products exports? Sushil Mohan Abstract The paper analyses the trade barriers (tariffs and non-tariffs) that thwart diversification efforts of developing countries into exports of value-added agricultural processed products. It particularly examines the extent to which non-tariff measures act as market access barriers that constrain agricultural processed products exports from developing countries. The analysis shows that it is not the tariffs or tariffs escalation but the prevalence of non-tariff measures (including domestic non-tariff measures) that limit the ability of developing countries to increase their agricultural processed exports. This has important policy implications in terms of the emphasis that trade negotiators and policy planners should place on addressing non-tariff measures both in the domestic and foreign markets. JEL codes : F01, F10, F13, Q17, Q18 Keywords: agricultural processed products – developing countries – non-tariff measures – tariff escalation – value addition Dr. Sushil Mohan, Head of Economics, Business School, University of Brighton, UK. E-mail: [email protected] The author thanks Massimo Iafrate from the FAO Trade and Markets Division for assistance with data collection.
Transcript of How important are tariffs and nontariff measures for ...cepr.org/sites/default/files/2486_MOHAN -...
How important are tariffs and nontariff measures for developing countries’ agricultural
processed products exports?
Sushil Mohan
Abstract
The paper analyses the trade barriers (tariffs and non-tariffs) that thwart diversification efforts of
developing countries into exports of value-added agricultural processed products. It particularly
examines the extent to which non-tariff measures act as market access barriers that constrain
agricultural processed products exports from developing countries. The analysis shows that it is
not the tariffs or tariffs escalation but the prevalence of non-tariff measures (including domestic
non-tariff measures) that limit the ability of developing countries to increase their agricultural
processed exports. This has important policy implications in terms of the emphasis that trade
negotiators and policy planners should place on addressing non-tariff measures both in the
domestic and foreign markets.
JEL codes : F01, F10, F13, Q17, Q18
Keywords: agricultural processed products – developing countries – non-tariff measures – tariff
escalation – value addition
Dr. Sushil Mohan, Head of Economics, Business School, University of Brighton, UK. E-mail:
The author thanks Massimo Iafrate from the FAO Trade and Markets Division for assistance with data collection.
1
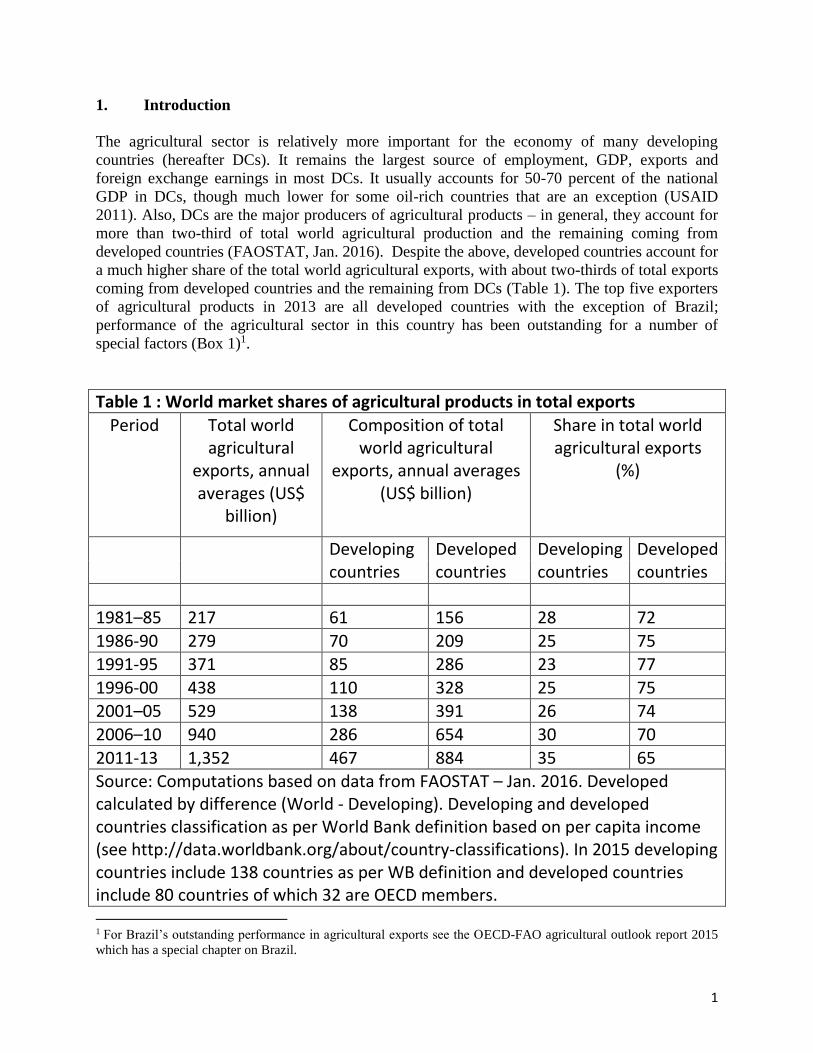
1. Introduction
The agricultural sector is relatively more important for the economy of many developing
countries (hereafter DCs). It remains the largest source of employment, GDP, exports and
foreign exchange earnings in most DCs. It usually accounts for 50-70 percent of the national
GDP in DCs, though much lower for some oil-rich countries that are an exception (USAID
2011). Also, DCs are the major producers of agricultural products – in general, they account for
more than two-third of total world agricultural production and the remaining coming from
developed countries (FAOSTAT, Jan. 2016). Despite the above, developed countries account for
a much higher share of the total world agricultural exports, with about two-thirds of total exports
coming from developed countries and the remaining from DCs (Table 1). The top five exporters
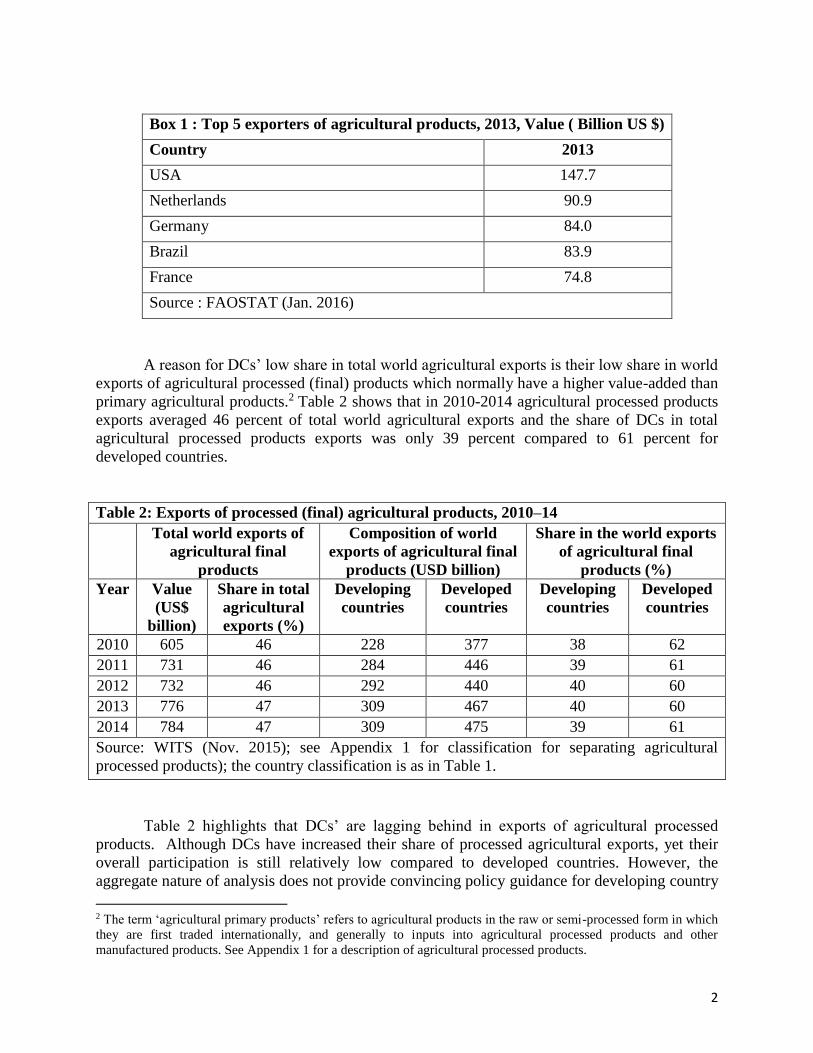
of agricultural products in 2013 are all developed countries with the exception of Brazil;
performance of the agricultural sector in this country has been outstanding for a number of
special factors (Box 1)1.
Table 1 : World market shares of agricultural products in total exports
Period Total world agricultural
exports, annual averages (US$
billion)
Composition of total world agricultural
exports, annual averages (US$ billion)
Share in total world agricultural exports
(%)
Developing countries
Developed countries
Developing countries
Developed countries
1981–85 217 61 156 28 72
1986-90 279 70 209 25 75 1991-95 371 85 286 23 77
1996-00 438 110 328 25 75 2001–05 529 138 391 26 74
2006–10 940 286 654 30 70
2011-13 1,352 467 884 35 65 Source: Computations based on data from FAOSTAT – Jan. 2016. Developed calculated by difference (World - Developing). Developing and developed countries classification as per World Bank definition based on per capita income (see http://data.worldbank.org/about/country-classifications). In 2015 developing countries include 138 countries as per WB definition and developed countries include 80 countries of which 32 are OECD members. 1 For Brazil’s outstanding performance in agricultural exports see the OECD-FAO agricultural outlook report 2015
which has a special chapter on Brazil.
2
Box 1 : Top 5 exporters of agricultural products, 2013, Value ( Billion US $)
Country 2013
USA 147.7
Netherlands 90.9
Germany 84.0
Brazil 83.9
France 74.8
Source : FAOSTAT (Jan. 2016)
A reason for DCs’ low share in total world agricultural exports is their low share in world
exports of agricultural processed (final) products which normally have a higher value-added than
primary agricultural products.2 Table 2 shows that in 2010-2014 agricultural processed products
exports averaged 46 percent of total world agricultural exports and the share of DCs in total
agricultural processed products exports was only 39 percent compared to 61 percent for
developed countries.
Table 2: Exports of processed (final) agricultural products, 2010–14
Total world exports of
agricultural final
products
Composition of world
exports of agricultural final
products (USD billion)
Share in the world exports
of agricultural final
products (%)
Year Value
(US$
billion)
Share in total
agricultural
exports (%)
Developing
countries
Developed
countries
Developing
countries
Developed
countries
2010 605 46 228 377 38 62
2011 731 46 284 446 39 61
2012 732 46 292 440 40 60
2013 776 47 309 467 40 60
2014 784 47 309 475 39 61
Source: WITS (Nov. 2015); see Appendix 1 for classification for separating agricultural
processed products); the country classification is as in Table 1.
Table 2 highlights that DCs’ are lagging behind in exports of agricultural processed
products. Although DCs have increased their share of processed agricultural exports, yet their
overall participation is still relatively low compared to developed countries. However, the
aggregate nature of analysis does not provide convincing policy guidance for developing country
2 The term ‘agricultural primary products’ refers to agricultural products in the raw or semi-processed form in which
they are first traded internationally, and generally to inputs into agricultural processed products and other
manufactured products. See Appendix 1 for a description of agricultural processed products.
3
policy makers. Therefore, this paper examines the developed and DCs’ share in world exports by
the level of processing at the disaggregated product level. The products chosen are
predominantly produced in DCs and are of particular export interest to them. These products are
vital foreign exchange earners for many DCs, at times, constituting more than 30 percent of their
total export earnings (Mohan 2007). This means that the benefits from increase in their exports
would largely accrue to DCs.
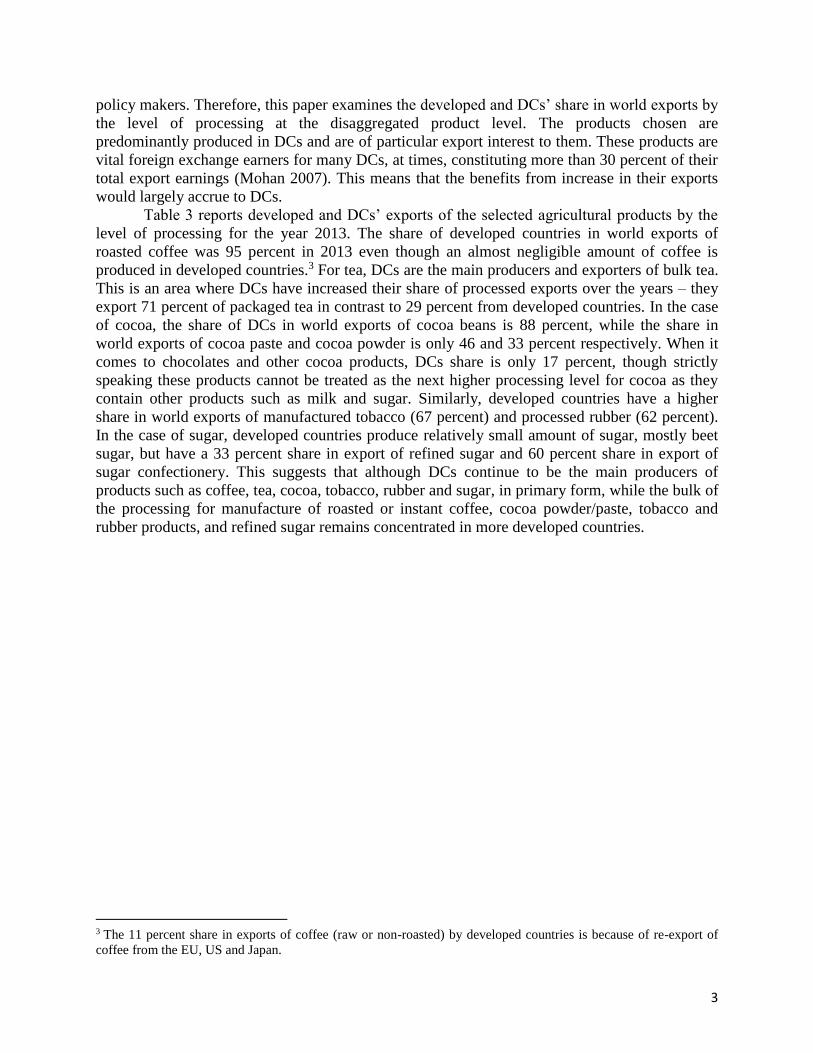
Table 3 reports developed and DCs’ exports of the selected agricultural products by the
level of processing for the year 2013. The share of developed countries in world exports of
roasted coffee was 95 percent in 2013 even though an almost negligible amount of coffee is
produced in developed countries.3 For tea, DCs are the main producers and exporters of bulk tea.
This is an area where DCs have increased their share of processed exports over the years – they
export 71 percent of packaged tea in contrast to 29 percent from developed countries. In the case
of cocoa, the share of DCs in world exports of cocoa beans is 88 percent, while the share in
world exports of cocoa paste and cocoa powder is only 46 and 33 percent respectively. When it
comes to chocolates and other cocoa products, DCs share is only 17 percent, though strictly
speaking these products cannot be treated as the next higher processing level for cocoa as they
contain other products such as milk and sugar. Similarly, developed countries have a higher
share in world exports of manufactured tobacco (67 percent) and processed rubber (62 percent).
In the case of sugar, developed countries produce relatively small amount of sugar, mostly beet
sugar, but have a 33 percent share in export of refined sugar and 60 percent share in export of
sugar confectionery. This suggests that although DCs continue to be the main producers of
products such as coffee, tea, cocoa, tobacco, rubber and sugar, in primary form, while the bulk of
the processing for manufacture of roasted or instant coffee, cocoa powder/paste, tobacco and
rubber products, and refined sugar remains concentrated in more developed countries.
3 The 11 percent share in exports of coffee (raw or non-roasted) by developed countries is because of re-export of
coffee from the EU, US and Japan.
Table 3: Composition of share in world exports of selected agricultural products, 2013
Broad Product
Group Processing Level Export (USD billion) % share in total exports
Developed
countries
Developing
countries Total Developed
countries
Developing
countries
Coffee Not roasted 1.92 15.64 17.56 11 89
Roasted 8.31 0.40 8.71 95 5
Black tea Bulk (in packages > 3kgs) 0.18 3.62 3.80 5 95
Packaged (in packages < 3 kgs) 0.46 1.10 1.56 29 71
Cocoa
Beans 0.89 6.36 7.25 12 88
Paste 1.29 1.11 2.40 54 46
Powder 1.99 0.96 2.95 67 33
Chocolate & cocoa productions 19.07 4.04 23.11 83 17
Tobacco Unmanufactured 3.56 8.81 12.37 29 71
Manufactured 16.01 7.89 23.90 67 33
Rubber Natural (including latex) 1.37 23.66 25.03 5 95
Rubber pastes 14.19 8.62 22.81 62 38
Sugar (cane and
beet)
Raw (in solid form) 0.31 14.39 14.70 2 98
Refined 4.51 8.99 13.50 33 67
Confectionery 5.95 4.01 9.96 60 40
Source: Computation based on UN COMTRADE trade data obtained from WITS (http://wits.worldbank.org/), accessed 28 Dec. 2015.
In this database, developing countries include 142 low and medium income countries and 51 developed high income countries.
5
The importance of encouraging DCs’ diversification into higher value-added production
has been long discussed in the literature and in international fora. The point that is made is that if
DCs specialise in exports of agricultural primary products, they are deprived of the income
advantages that global value chains enjoy, as well as of additional employment opportunities and
growth in value-added industries (Diaz-Bonilla and Reca 2000; Daviron and Ponte 2005). A
question relevant from a policy perspective is: why have DCs failed to capture a larger share of
world exports of agricultural processed products? The reasons for this can be many. The
underlying factors that exercise significant negative effects include the business climate, lagging
technology, limited production capacities and intrinsic supply-side constraints, all of which
contribute to curtailing the ability of DCs to diversify into processed product exports.4
However, tariffs and tariff escalation (TE) have been highlighted as market access
barriers that constitute additional constraints to diversification.5 Over the past half-century tariffs
on manufactured goods have dropped from averages of 40 percent to below four percent, while
agriculture tariffs remain high, with TE being systematically practiced in many countries and for
many agricultural products (Hoekman and Nicita 2011).6 In 2014 the MFN weighted average
(percent) tariff on food products was 14 percent while that of manufactures was 7 percent (WITS
Jan. 2016). This is of particular relevance to DCs that are the main producers and exporters of
agricultural products, as it produces a trade bias against all exporters of processed agricultural
products which can impact more severely on DCs. The increase in nominal and effective duties
from lower to higher stages of transformation discriminates against processed exports and creates
another obstacle to the expansion of value-addition in the DCs. Furthermore, studies show that
import demand elasticities normally increase with processing, so lowering agricultural tariffs
would have relatively larger trade effects on processed than on unprocessed products (Elamin
and Khaira 2004).
However, there are some that do not perceive TE as a major market access barrier as
various rounds of trade agreements have continued to lower tariffs including TE throughout the
world. It is felt that given the prevalence of other trade-distorting measures, commonly referred
as non-tariff measures (NTMs), TE does not appear to be a general problem across a wide range
of agricultural products and markets – therefore lately, the discussion on NTMs and assessing
their impact has gained prominence (Orden et al. 2012).7
The objective of this paper is to identify the extent to which tariffs, TE and NTMs
constitute market access barriers that thwart diversification efforts of DCs into value-added
agricultural processed exports. The analysis highlights that it is not tariffs or TE but the NTMs in
developed countries as well as in DCs’ themselves that limit DCs’ ability to diversify into
4 The supply-side constraints in DCs include the poor quality of infrastructure (roads, electricity, communications)
and institutions (legal, financial, regulatory), information bottlenecks, inadequate access to finance and governance
issues (see Moise et al. 2013). Some of these constraints are more severe for processed products compared to
agricultural primary products. 5 In agricultural trade, TE refers to zero or low tariff rates on primary products that increase with the degree of
processing of the products. 6 See also Balassa (1968), Golub and Finger (1979), Laird and Yeats (1987), Cobban (1988), Safadi and Yeats
(1993), OECD (1997), Burman et al. (2001), USDA (2001), Verkat (2001), Beghin and Aksoy (2003), Rae and
Josling (2003), Panagariya (2005), Sharma (2006), Doanh and Kee (2007), Wainio and Vanzetti (2008), Antimiani
et al. (2009), UNCTAD (2009), Laborde and Martin (2010). 7 The terms ‘non-tariff measure’ (NTM) and ‘non-tariff barrier’ (NTB) are often used interchangeably. The term
NTM simply identifies the measure whereas the term NTB indicates that the measure is trade-restricting. It is here
more appropriate to use the term NTM as the impact of the measure should not be presumed or anticipated prior to
the analysis.
6
processed agricultural exports. The paper is organised as follows: Section 2 presents tariffs and
TE applied on key agricultural exports of DCs and the implications for their exports of processed
agricultural products. Section 3 discusses NTMs including domestic NTMs and how these can
potentially inhibit processed exports from DCs. Section 4 concludes with policy implications.
2. Tariffs and tariff escalation
Applied MFN tariff averages in selected developed countries and DCs for various products at
different processing levels are shown in Table 4 (figures in parentheses in the table report bound
tariffs). Tariffs applied on the selected products are generally zero to low in all developed
countries, except for tobacco and chocolates/cocoa products and for tea and coffee for Japan.
Tariffs applied by DCs are generally high across all products and levels of processing. Average
applied rates range mostly between 10 and 30 percent, although in some cases substantially
lower or higher levels are observed. A possible explanation for the very high tariffs on tea and
coffee in India is the underlying rationale of protecting the domestic industry in east and south
India from competitive exporters like Indonesia, Sri Lanka, Brazil and Vietnam.
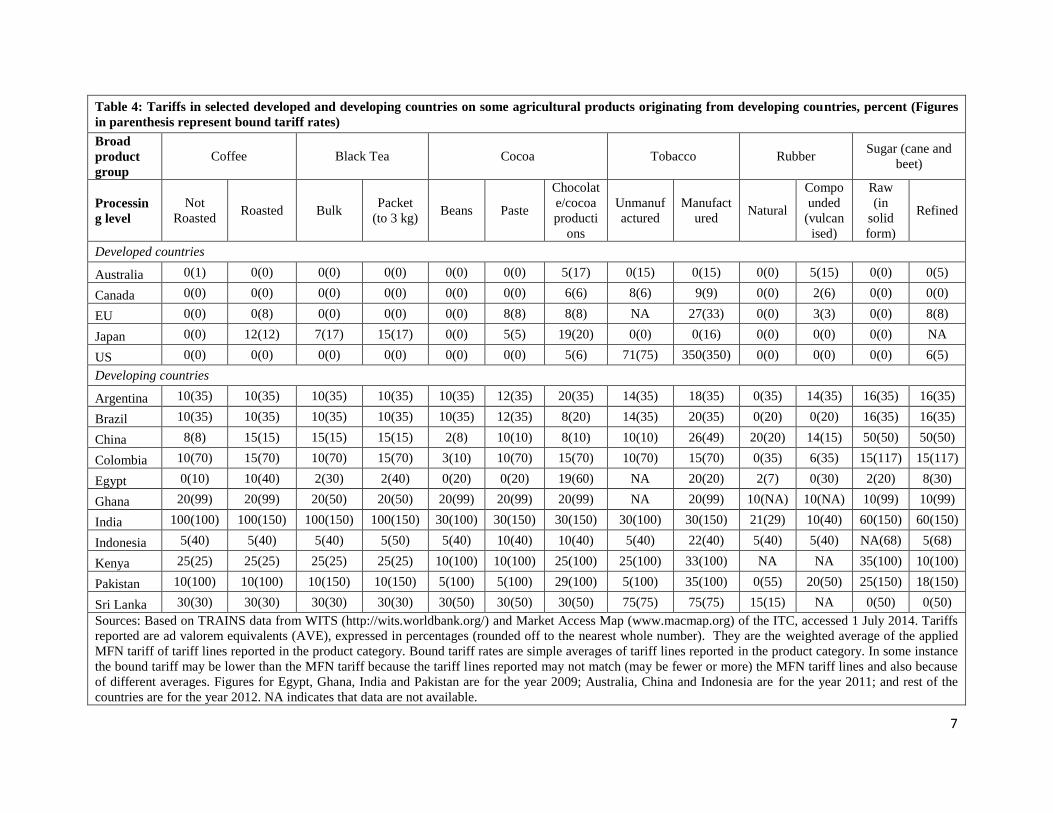
7
Table 4: Tariffs in selected developed and developing countries on some agricultural products originating from developing countries, percent (Figures
in parenthesis represent bound tariff rates)
Broad
product
group
Coffee Black Tea Cocoa Tobacco Rubber Sugar (cane and
beet)
Processin
g level
Not
Roasted Roasted Bulk
Packet
(to 3 kg) Beans Paste
Chocolat
e/cocoa
producti
ons
Unmanuf
actured
Manufact
ured Natural
Compo
unded
(vulcan
ised)
Raw
(in
solid
form)
Refined
Developed countries
Australia 0(1) 0(0) 0(0) 0(0) 0(0) 0(0) 5(17) 0(15) 0(15) 0(0) 5(15) 0(0) 0(5)
Canada 0(0) 0(0) 0(0) 0(0) 0(0) 0(0) 6(6) 8(6) 9(9) 0(0) 2(6) 0(0) 0(0)
EU 0(0) 0(8) 0(0) 0(0) 0(0) 8(8) 8(8) NA 27(33) 0(0) 3(3) 0(0) 8(8)
Japan 0(0) 12(12) 7(17) 15(17) 0(0) 5(5) 19(20) 0(0) 0(16) 0(0) 0(0) 0(0) NA
US 0(0) 0(0) 0(0) 0(0) 0(0) 0(0) 5(6) 71(75) 350(350) 0(0) 0(0) 0(0) 6(5)
Developing countries
Argentina 10(35) 10(35) 10(35) 10(35) 10(35) 12(35) 20(35) 14(35) 18(35) 0(35) 14(35) 16(35) 16(35)
Brazil 10(35) 10(35) 10(35) 10(35) 10(35) 12(35) 8(20) 14(35) 20(35) 0(20) 0(20) 16(35) 16(35)
China 8(8) 15(15) 15(15) 15(15) 2(8) 10(10) 8(10) 10(10) 26(49) 20(20) 14(15) 50(50) 50(50)
Colombia 10(70) 15(70) 10(70) 15(70) 3(10) 10(70) 15(70) 10(70) 15(70) 0(35) 6(35) 15(117) 15(117)
Egypt 0(10) 10(40) 2(30) 2(40) 0(20) 0(20) 19(60) NA 20(20) 2(7) 0(30) 2(20) 8(30)
Ghana 20(99) 20(99) 20(50) 20(50) 20(99) 20(99) 20(99) NA 20(99) 10(NA) 10(NA) 10(99) 10(99)
India 100(100) 100(150) 100(150) 100(150) 30(100) 30(150) 30(150) 30(100) 30(150) 21(29) 10(40) 60(150) 60(150)
Indonesia 5(40) 5(40) 5(40) 5(50) 5(40) 10(40) 10(40) 5(40) 22(40) 5(40) 5(40) NA(68) 5(68)
Kenya 25(25) 25(25) 25(25) 25(25) 10(100) 10(100) 25(100) 25(100) 33(100) NA NA 35(100) 10(100)
Pakistan 10(100) 10(100) 10(150) 10(150) 5(100) 5(100) 29(100) 5(100) 35(100) 0(55) 20(50) 25(150) 18(150)
Sri Lanka 30(30) 30(30) 30(30) 30(30) 30(50) 30(50) 30(50) 75(75) 75(75) 15(15) NA 0(50) 0(50)
Sources: Based on TRAINS data from WITS (http://wits.worldbank.org/) and Market Access Map (www.macmap.org) of the ITC, accessed 1 July 2014. Tariffs
reported are ad valorem equivalents (AVE), expressed in percentages (rounded off to the nearest whole number). They are the weighted average of the applied
MFN tariff of tariff lines reported in the product category. Bound tariff rates are simple averages of tariff lines reported in the product category. In some instance
the bound tariff may be lower than the MFN tariff because the tariff lines reported may not match (may be fewer or more) the MFN tariff lines and also because
of different averages. Figures for Egypt, Ghana, India and Pakistan are for the year 2009; Australia, China and Indonesia are for the year 2011; and rest of the
countries are for the year 2012. NA indicates that data are not available.
8
A simple method for estimating the nominal TE is to calculate the tariff wedge (TW),
which is the difference in nominal tariff between the output (processed) commodity and the input
(primary) commodity, that is, TW = tp – tin where tp and tin denote tariff (in ad valorem terms)
imposed on processed commodity and raw commodity respectively. A TW > 0 denotes the
existence of nominal tariff escalation.8
A limitation of the nominal TW is that it underestimates the actual level of protection
accorded to the final output. A better measure is the effective rate of protection (ERP), which is
aimed at measuring the degree of protection afforded to the actual addition to the value of the
product that is undertaken in the country. Though a better indicator to evaluate the extent of
protection, it suffers from shortcomings due both to methodological constraints and to theoretical
limitations. The computation of ERP requires detailed data on prices and production of the many
vertically linked production processes which are not easily available, assumes fixed
transformation coefficients or absence of substitutability between primary factors and
intermediates, and does not consider the presence of non-traded input.9
On the contrary, an important advantage of TW estimation is that it is straightforward.
Moreover, it reflects the minimum level of protection without overestimation. Therefore, in this
paper the TW is calculated for selected pairs of products in order to identify nominal TE between
the processed and primary stages of production. Past studies have mostly used bound tariffs for
determining TE. Although this has the advantage of providing an upper limit measure of TE that
WTO members have committed, it overestimates the actual level of TE impacting on trade flows.
Calculations based on applied MFN tariffs that are often considerably lower, better reflect the
actual level of TE.
The TW between commodity pairs across a range of countries is shown in Table 5. TW
values below five percentage points do not imply a significant level of TE (based on the WTO
rule that if the gap between the processed and unprocessed product is less than five percentage
points then it is not treated as TE and the special tariff-cutting rules are not applicable).
Excluding chocolate, most of the selected products face a zero to very low tariff and TE in most
developed economies except in Japan for most products, sugar and cocoa in the EU, and tobacco
in the US.10 In contrast, DCs impose substantial tariffs on these products.11 However in DCs the
incidence of TE is low because, with some exceptions, they tend to apply the same tariffs
irrespective of the level of processing.
8 TW < 0 denotes the existence of nominal tariff de-escalation and TW = 0 means tariff parity. 9 See Chevassus-Lozza and Gallezot ( 2003) and Greenaway and Milner (2003) for a review of the limitations of the
ERP measure. 10 These tariffs relate to recent years and do not imply that there was no incidence of TE in past years. Past studies
do find evidence of TE in several agricultural products, though most past studies analyse bound tariffs while this
study uses MFN applied tariffs. 11 The motive for this is not only to protect domestic producers and the domestic processing industry, but also to
earn revenue for the government and restrict imports to save valuable foreign exchange (Mohan 2007).
9
Table 5: Tariff wedges (TW) in applied MFN tariffs, percent
Countries Coffee Black Tea Cocoa Tobacco Rubber Sugar
Roasted &
non-roasted
Packet &
bulk
Paste &
beans
Chocolate &
beans
Manufactur
ed &
unmanufact
ured
Compounde
d & natural
Refined &
raw
Developed countries
Australia 0 0 0 5 0 5 0
Canada 0 0 0 6 1 2 0
EU 0 0 8 8 NA 3 8
Japan 12 8 5 19 0 0 NA
US 0 0 0 5 279 0 6
Developing countries
Argentina 0 0 2 10 4 14 0
Brazil 0 0 2 -2 6 0 0
China 0 0 8 6 16 -6 0
Colombia 5 5 7 12 5 6 0
Egypt 10 0 0 19 NA -2 6
Ghana 0 0 0 0 NA 0 0
India 0 0 0 0 0 -11 0
Indonesia 0 0 5 5 17 0 NA
Kenya 0 0 0 15 8 NA -25
Pakistan 0 0 0 14 30 20 -7
Sri Lanka 0 0 0 0 0 NA 0
Source: Computations based on data in Table 4. NA refers to data not available.
10
If developed and DCs reduce tariffs and TE on these products, one effect might be that
those enjoying high levels of protection may in the short run be hit by increased competition
from imports or by reduced margins. This would lead to lower consumer prices along the
processing chain, which can be expected to result in increased consumption, its extent depending
on how sensitive the market is to price changes. As a result, this may eventually lead either to an
increase in imports or to protected producers being forced to lower their margins and eventually
become more efficient, or both. The benefit of increased consumption and competition will go to
the relatively more competitive producers. Therefore, a reduction in tariffs may result in
increased exports of the selected primary products from DCs as they are their main producers;
but the same cannot be said for their processed-form exports. The benefit of increased processed-
form exports will go to the more competitive processed-product exporters wherever they may be
located.
Nevertheless, the above analysis suggests that TE in developed countries is not the main
reason for low levels of processing of the key (selected) agricultural products by DCs. This
highlights the importance of examining the extent to which NTMs can potentially limit DCs’
ability to export agricultural products in processed or semi-processed form.
3. NTMs in agriculture
While tariffs, quotas and subsidies on agricultural products have declined since the early 1990s
as a result of successive rounds of global trade liberalisation and signing of preferential trade
agreements, NTMs have increased in numbers and complexity reflecting not only trade-related
measures but also changing commercial practices, consumer and health concerns, improved
scientific knowledge, and advances in technology and communications. Both public and private
standards are increasingly influencing the production and trade of agricultural goods, and
attention is therefore being given to addressing unjustified measures that may offset the advances
brought about by lower tariffs.
NTMs in agri-food markets are policy measures, other than ordinary customs tariffs, that can
potentially have an economic effect on international trade in agricultural goods, changing
quantities traded or prices or both (MAST 2008).12 Within this broad definition, three categories
(OECD 2013) form the core of interventions commonly felt to be on the rise worldwide:
Sanitary and phytosanitary measures (SPS): Regulations that protect human and animal
health (sanitary measures) and plant health (phytosanitary measures) in order to ensure food
safety for consumers and to avoid the introduction of diseases and pests through trade.
Technical barriers to trade (TBT): Regulations and mandatory standards that target technical
characteristics of products, such as process and product standards (include norms for size,
quality and physical attributes of product), labelling and marketing standards, traceability and
origin of material, and the related conformity assessment and certification.
Other technical measures: Policies and requirements which somehow did not fit into the
previous two categories but look quite similar to them for analytical purposes.
12 It should be noted that the term NTMs refers to measures and does not refer to the conditions prevailing in
countries, such as infrastructure, qualification and governance.
11
Typically, standards are used to address information problems, market failure externalities, or
may be motivated by political considerations (for example, to satisfy demands of risk-averse and
quality-conscious consumer behaviour in developed countries) or to promote economic,
industrial and regional development as well as protect specified sectors from imports generally
or from the dumping of cheaper imports. In the context of agri-food trade, they aim to ensure
food safety, animal and plant health, but also extend to other quality and technical aspects of
food products.
To the extent that NTMs address market failures, simply removing them may not always
be optimal, even if trade volumes would increase, since their intended benefits would be
sacrificed, for example those related to human health (SPS measures). Many technical measures
may restrict trade but improve welfare through a reduction in negative externalities (e.g. through
reduced risk of importing pests or diseases) or information asymmetries (e.g. through a label
providing consumers with details on the product). It has been argued that standards and
regulations can be perceived to act as a catalyst to upgrade DCs’ processing industries
production structures to make them compatible with international standards (Henson 2006). In
some instances NTMs can expand trade as they enhance demand for a good through better
information about the good or by enhancing the good’s characteristics and attractiveness for the
consumer (Van Tongeren et al. 2009). Efficiency costs of NTMs are therefore much less evident
than the welfare losses associated with tariffs and quantity measures that restrict trade. Analysis
and policy must therefore respect these benefits, assess alternative ways to address the market
failures, and assess NTMs on a case-by-case basis (Van Tongeren et al. 2010; Winchester et al.
2012).
3.1 Analysis of NTMs: Data availability and methodology
It is a challenging task to identify incidences of NTMs and to measure the degrees of trade
restrictiveness they cause as well as the consequential economic and welfare impacts. The main
challenges are related to issues concerning lack of data, data collection and measurement. The
lack of transparency concerning the scope and effects of NTMs makes it very difficult to
quantify the coverage and extent of these measures. Moreover, the analysis of NTMs often
requires some kind of matching up of data of different classification and sources which makes it
problematic.13 Nevertheless, a host of studies employ different analytical approaches to detect
NTMs and quantify their impact on trade and economic welfare in general. Some studies are
based on overviews and assessments or deductions of NTMs, while others use economic models
such as gravity-type models, price-wedge models, simulation and primary data analysis to
measure the extent of trade restrictiveness of NTMs.14
Keeping in mind the data and methodological limitations, this paper draws on a number of
sources in an attempt to obtain relevant and useful insights on the extent to which NTMs
constitute trade barriers that thwart diversification efforts of DCs into processed agricultural
exports. The analysis rests on the following analytical framework:
13 See Korinek et al. (2008) for a discussion on methods for quantifying the trade effects of NTMs in the agri-food
sector. 14 For example see Bora et al. (2002), Andriamananjara et al. (2003), Kox and Lejour (2005), Mayer and Zignago
(2005), Maskus et al. (2005), Kee et al. (2006), Silva and Tenreyro (2006), De Frahan and Vancauteren (2006),
Graffham et al. (2007), Helpman et al. (2008), Yue and Beghin (2009), Disdier and Marette (2010).
12
a review of NTM data and relevant studies (section 3.2);
a review of theoretical considerations on the existence of NTMs (section 3.3);
a review of domestic NTMs in DCs (section 3.4).
3.2 Review of NTM data and relevant studies
This section presents the findings of some studies on NTMs and review of relevant NTM data.
Although these findings suffer from the data limitations mentioned above and do not explore
potential impacts for processed agricultural products, they are presented because they do call
attention to key points. Overall, the studies suggest that NTMs adversely affect agricultural
exports from DCs, including those of processed products.
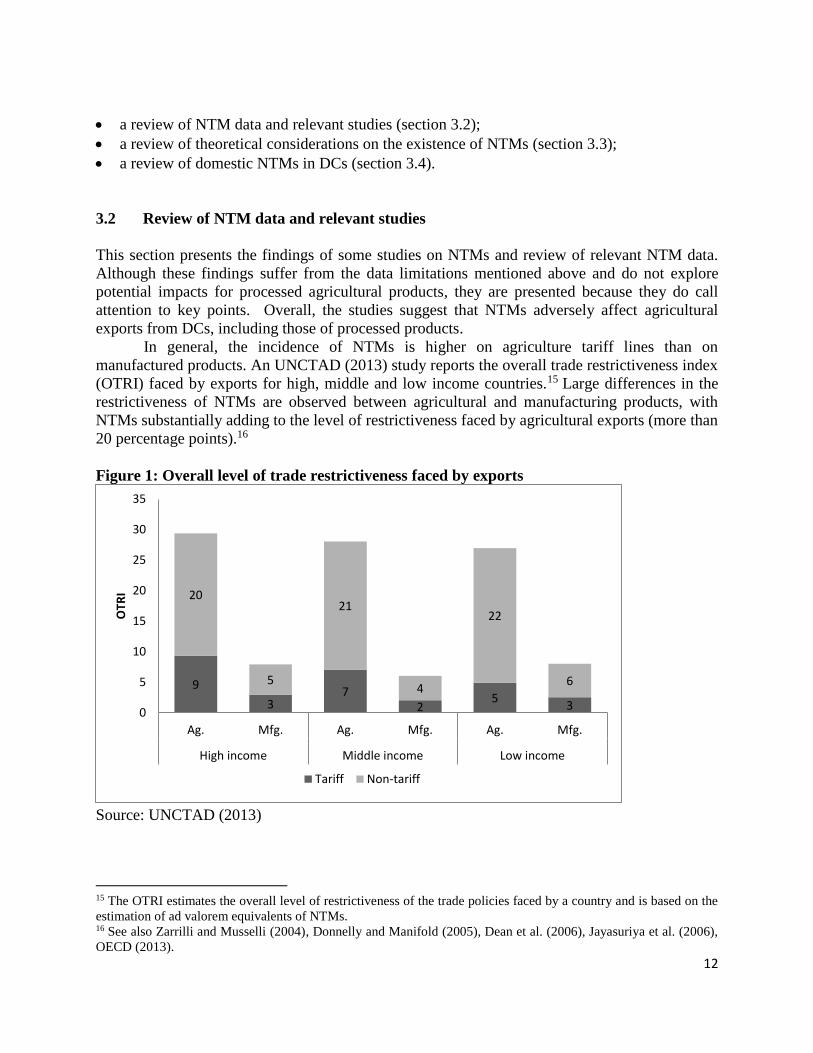
In general, the incidence of NTMs is higher on agriculture tariff lines than on
manufactured products. An UNCTAD (2013) study reports the overall trade restrictiveness index
(OTRI) faced by exports for high, middle and low income countries.15 Large differences in the
restrictiveness of NTMs are observed between agricultural and manufacturing products, with
NTMs substantially adding to the level of restrictiveness faced by agricultural exports (more than
20 percentage points).16
Figure 1: Overall level of trade restrictiveness faced by exports
Source: UNCTAD (2013)
15 The OTRI estimates the overall level of restrictiveness of the trade policies faced by a country and is based on the
estimation of ad valorem equivalents of NTMs. 16 See also Zarrilli and Musselli (2004), Donnelly and Manifold (2005), Dean et al. (2006), Jayasuriya et al. (2006),
OECD (2013).
9
37
25
3
20
5
21
4
22
6
0
5
10
15
20
25
30
35
Ag. Mfg. Ag. Mfg. Ag. Mfg.
High income Middle income Low income
OTR
I
Tariff Non-tariff
13
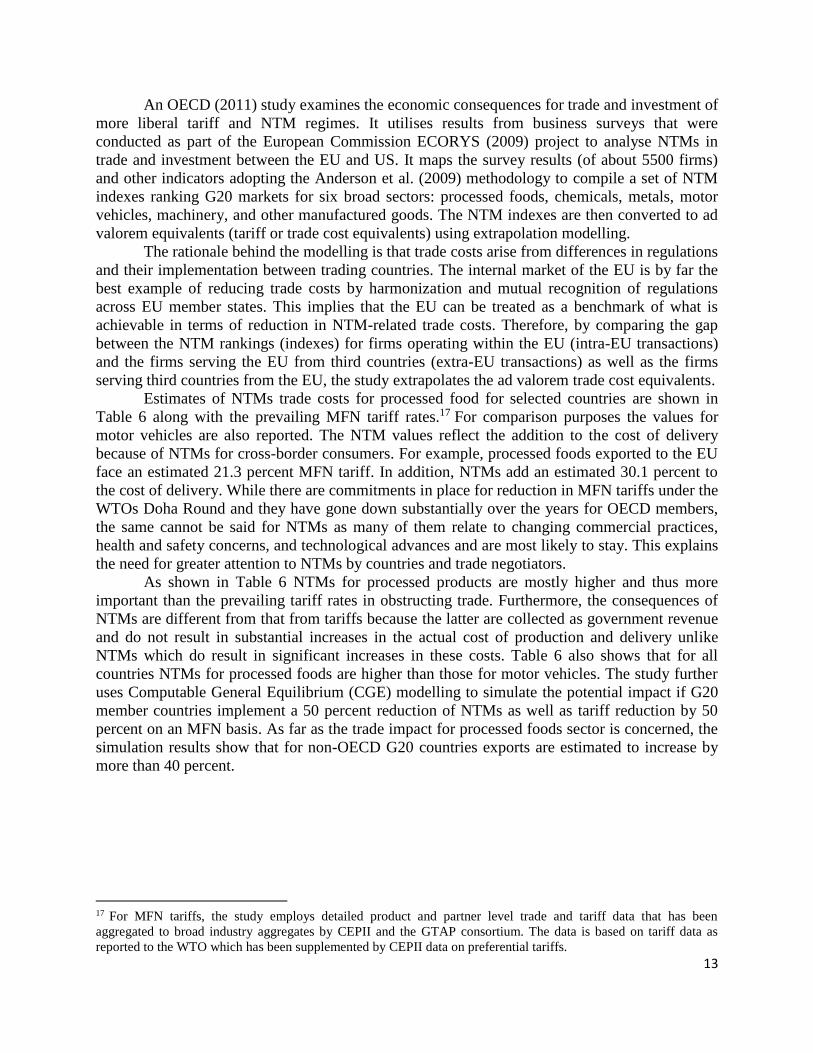
An OECD (2011) study examines the economic consequences for trade and investment of
more liberal tariff and NTM regimes. It utilises results from business surveys that were
conducted as part of the European Commission ECORYS (2009) project to analyse NTMs in
trade and investment between the EU and US. It maps the survey results (of about 5500 firms)
and other indicators adopting the Anderson et al. (2009) methodology to compile a set of NTM
indexes ranking G20 markets for six broad sectors: processed foods, chemicals, metals, motor
vehicles, machinery, and other manufactured goods. The NTM indexes are then converted to ad
valorem equivalents (tariff or trade cost equivalents) using extrapolation modelling.
The rationale behind the modelling is that trade costs arise from differences in regulations
and their implementation between trading countries. The internal market of the EU is by far the
best example of reducing trade costs by harmonization and mutual recognition of regulations
across EU member states. This implies that the EU can be treated as a benchmark of what is
achievable in terms of reduction in NTM-related trade costs. Therefore, by comparing the gap
between the NTM rankings (indexes) for firms operating within the EU (intra-EU transactions)
and the firms serving the EU from third countries (extra-EU transactions) as well as the firms
serving third countries from the EU, the study extrapolates the ad valorem trade cost equivalents.
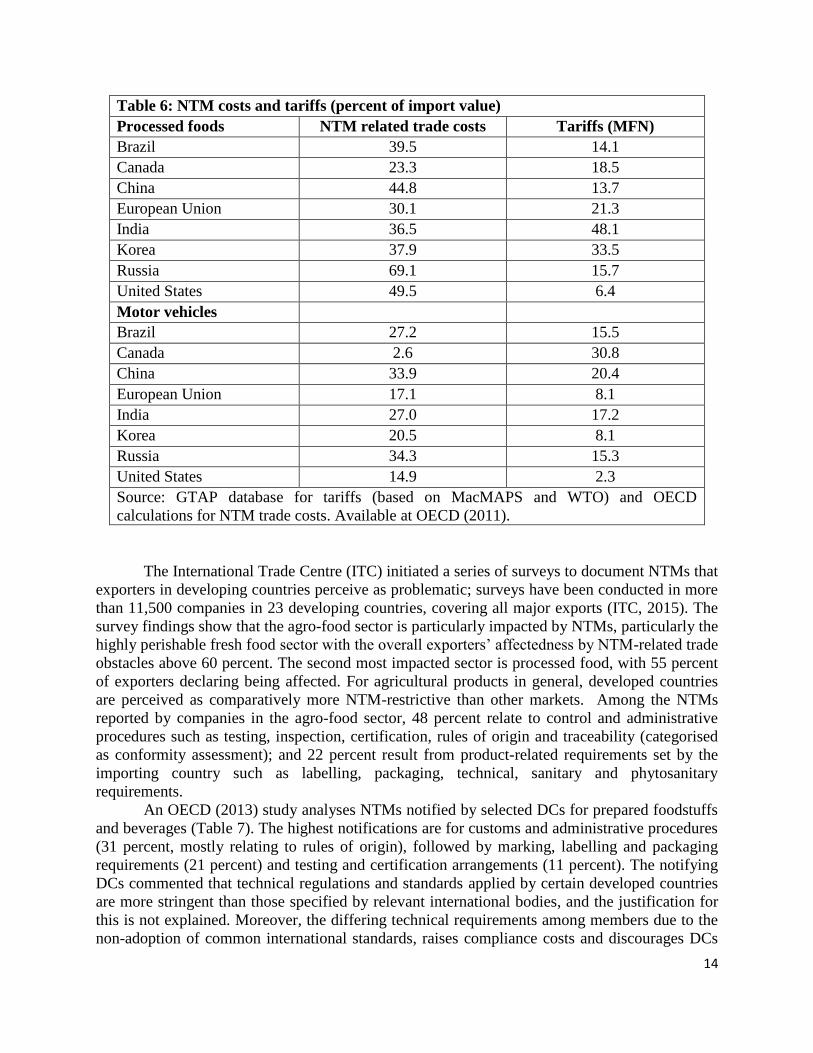
Estimates of NTMs trade costs for processed food for selected countries are shown in
Table 6 along with the prevailing MFN tariff rates.17 For comparison purposes the values for
motor vehicles are also reported. The NTM values reflect the addition to the cost of delivery
because of NTMs for cross-border consumers. For example, processed foods exported to the EU
face an estimated 21.3 percent MFN tariff. In addition, NTMs add an estimated 30.1 percent to
the cost of delivery. While there are commitments in place for reduction in MFN tariffs under the
WTOs Doha Round and they have gone down substantially over the years for OECD members,
the same cannot be said for NTMs as many of them relate to changing commercial practices,
health and safety concerns, and technological advances and are most likely to stay. This explains
the need for greater attention to NTMs by countries and trade negotiators.
As shown in Table 6 NTMs for processed products are mostly higher and thus more
important than the prevailing tariff rates in obstructing trade. Furthermore, the consequences of
NTMs are different from that from tariffs because the latter are collected as government revenue
and do not result in substantial increases in the actual cost of production and delivery unlike
NTMs which do result in significant increases in these costs. Table 6 also shows that for all
countries NTMs for processed foods are higher than those for motor vehicles. The study further
uses Computable General Equilibrium (CGE) modelling to simulate the potential impact if G20
member countries implement a 50 percent reduction of NTMs as well as tariff reduction by 50
percent on an MFN basis. As far as the trade impact for processed foods sector is concerned, the
simulation results show that for non-OECD G20 countries exports are estimated to increase by
more than 40 percent.
17 For MFN tariffs, the study employs detailed product and partner level trade and tariff data that has been
aggregated to broad industry aggregates by CEPII and the GTAP consortium. The data is based on tariff data as
reported to the WTO which has been supplemented by CEPII data on preferential tariffs.
14
Table 6: NTM costs and tariffs (percent of import value)
Processed foods NTM related trade costs Tariffs (MFN)
Brazil 39.5 14.1
Canada 23.3 18.5
China 44.8 13.7
European Union 30.1 21.3
India 36.5 48.1
Korea 37.9 33.5
Russia 69.1 15.7
United States 49.5 6.4
Motor vehicles
Brazil 27.2 15.5
Canada 2.6 30.8
China 33.9 20.4
European Union 17.1 8.1
India 27.0 17.2
Korea 20.5 8.1
Russia 34.3 15.3
United States 14.9 2.3
Source: GTAP database for tariffs (based on MacMAPS and WTO) and OECD
calculations for NTM trade costs. Available at OECD (2011).
The International Trade Centre (ITC) initiated a series of surveys to document NTMs that
exporters in developing countries perceive as problematic; surveys have been conducted in more
than 11,500 companies in 23 developing countries, covering all major exports (ITC, 2015). The
survey findings show that the agro-food sector is particularly impacted by NTMs, particularly the
highly perishable fresh food sector with the overall exporters’ affectedness by NTM-related trade
obstacles above 60 percent. The second most impacted sector is processed food, with 55 percent
of exporters declaring being affected. For agricultural products in general, developed countries
are perceived as comparatively more NTM-restrictive than other markets. Among the NTMs
reported by companies in the agro-food sector, 48 percent relate to control and administrative
procedures such as testing, inspection, certification, rules of origin and traceability (categorised
as conformity assessment); and 22 percent result from product-related requirements set by the
importing country such as labelling, packaging, technical, sanitary and phytosanitary
requirements.
An OECD (2013) study analyses NTMs notified by selected DCs for prepared foodstuffs
and beverages (Table 7). The highest notifications are for customs and administrative procedures
(31 percent, mostly relating to rules of origin), followed by marking, labelling and packaging
requirements (21 percent) and testing and certification arrangements (11 percent). The notifying
DCs commented that technical regulations and standards applied by certain developed countries
are more stringent than those specified by relevant international bodies, and the justification for
this is not explained. Moreover, the differing technical requirements among members due to the
non-adoption of common international standards, raises compliance costs and discourages DCs
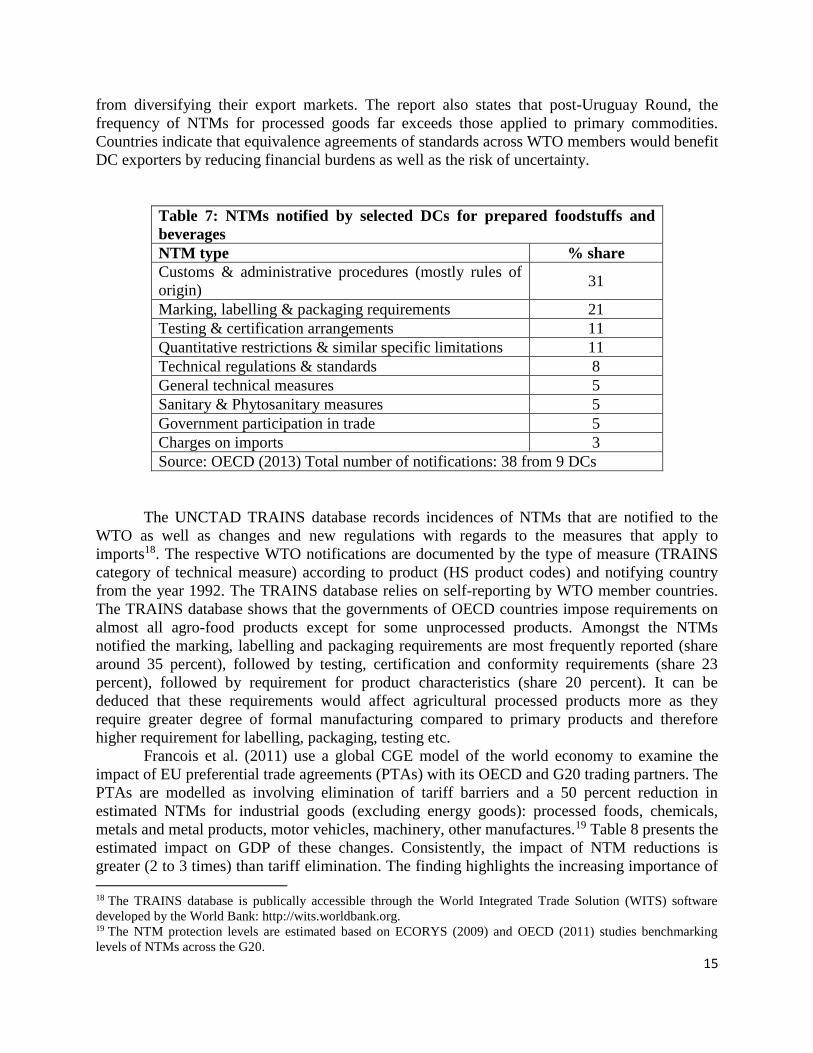
15
from diversifying their export markets. The report also states that post-Uruguay Round, the
frequency of NTMs for processed goods far exceeds those applied to primary commodities.
Countries indicate that equivalence agreements of standards across WTO members would benefit
DC exporters by reducing financial burdens as well as the risk of uncertainty.
Table 7: NTMs notified by selected DCs for prepared foodstuffs and
beverages
NTM type % share
Customs & administrative procedures (mostly rules of
origin) 31
Marking, labelling & packaging requirements 21
Testing & certification arrangements 11
Quantitative restrictions & similar specific limitations 11
Technical regulations & standards 8
General technical measures 5
Sanitary & Phytosanitary measures 5
Government participation in trade 5
Charges on imports 3
Source: OECD (2013) Total number of notifications: 38 from 9 DCs
The UNCTAD TRAINS database records incidences of NTMs that are notified to the
WTO as well as changes and new regulations with regards to the measures that apply to
imports18. The respective WTO notifications are documented by the type of measure (TRAINS
category of technical measure) according to product (HS product codes) and notifying country
from the year 1992. The TRAINS database relies on self-reporting by WTO member countries.
The TRAINS database shows that the governments of OECD countries impose requirements on
almost all agro-food products except for some unprocessed products. Amongst the NTMs
notified the marking, labelling and packaging requirements are most frequently reported (share
around 35 percent), followed by testing, certification and conformity requirements (share 23
percent), followed by requirement for product characteristics (share 20 percent). It can be
deduced that these requirements would affect agricultural processed products more as they
require greater degree of formal manufacturing compared to primary products and therefore
higher requirement for labelling, packaging, testing etc.
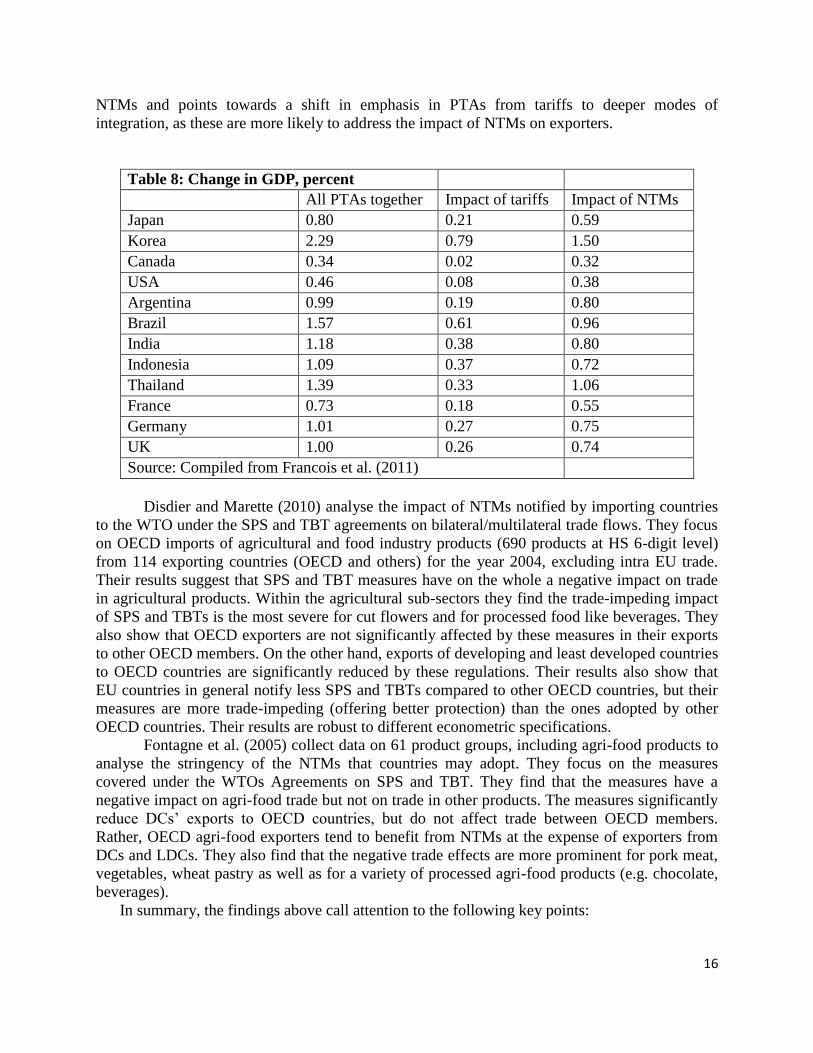
Francois et al. (2011) use a global CGE model of the world economy to examine the
impact of EU preferential trade agreements (PTAs) with its OECD and G20 trading partners. The
PTAs are modelled as involving elimination of tariff barriers and a 50 percent reduction in
estimated NTMs for industrial goods (excluding energy goods): processed foods, chemicals,
metals and metal products, motor vehicles, machinery, other manufactures.19 Table 8 presents the
estimated impact on GDP of these changes. Consistently, the impact of NTM reductions is
greater (2 to 3 times) than tariff elimination. The finding highlights the increasing importance of 18 The TRAINS database is publically accessible through the World Integrated Trade Solution (WITS) software
developed by the World Bank: http://wits.worldbank.org. 19 The NTM protection levels are estimated based on ECORYS (2009) and OECD (2011) studies benchmarking
levels of NTMs across the G20.
16
NTMs and points towards a shift in emphasis in PTAs from tariffs to deeper modes of
integration, as these are more likely to address the impact of NTMs on exporters.
Table 8: Change in GDP, percent
All PTAs together Impact of tariffs Impact of NTMs
Japan 0.80 0.21 0.59
Korea 2.29 0.79 1.50
Canada 0.34 0.02 0.32
USA 0.46 0.08 0.38
Argentina 0.99 0.19 0.80
Brazil 1.57 0.61 0.96
India 1.18 0.38 0.80
Indonesia 1.09 0.37 0.72
Thailand 1.39 0.33 1.06
France 0.73 0.18 0.55
Germany 1.01 0.27 0.75
UK 1.00 0.26 0.74
Source: Compiled from Francois et al. (2011)
Disdier and Marette (2010) analyse the impact of NTMs notified by importing countries
to the WTO under the SPS and TBT agreements on bilateral/multilateral trade flows. They focus
on OECD imports of agricultural and food industry products (690 products at HS 6-digit level)
from 114 exporting countries (OECD and others) for the year 2004, excluding intra EU trade.
Their results suggest that SPS and TBT measures have on the whole a negative impact on trade
in agricultural products. Within the agricultural sub-sectors they find the trade-impeding impact
of SPS and TBTs is the most severe for cut flowers and for processed food like beverages. They
also show that OECD exporters are not significantly affected by these measures in their exports
to other OECD members. On the other hand, exports of developing and least developed countries
to OECD countries are significantly reduced by these regulations. Their results also show that
EU countries in general notify less SPS and TBTs compared to other OECD countries, but their
measures are more trade-impeding (offering better protection) than the ones adopted by other
OECD countries. Their results are robust to different econometric specifications.
Fontagne et al. (2005) collect data on 61 product groups, including agri-food products to
analyse the stringency of the NTMs that countries may adopt. They focus on the measures
covered under the WTOs Agreements on SPS and TBT. They find that the measures have a
negative impact on agri-food trade but not on trade in other products. The measures significantly
reduce DCs’ exports to OECD countries, but do not affect trade between OECD members.
Rather, OECD agri-food exporters tend to benefit from NTMs at the expense of exporters from
DCs and LDCs. They also find that the negative trade effects are more prominent for pork meat,
vegetables, wheat pastry as well as for a variety of processed agri-food products (e.g. chocolate,
beverages).
In summary, the findings above call attention to the following key points:
17
The incidence of NTMs is higher on agriculture tariff lines than on manufactured products.
Within agriculture, highly perishable fresh food products appear as most impacted by NTMs
followed by processed food.
NTMs add an estimated 30 percent to the cost of delivery of processed foods exported to the
EU.
For agricultural products in general, developed countries are perceived as comparatively
more NTM-restrictive than other markets.
Most of NTMs in agriculture (more than 40 percent) relate to control and administrative
procedures (categorised as conformity assessment).
NTMs significantly reduce DCs’ agricultural exports to OECD countries, but do not affect
trade between OECD members (rather, OECD agri-food exporters tend to benefit from
NTMs at the expense of exporters from DCs).
3.3 NTMs: theoretical considerations
3.3.1 Heterogeneity in standards
The most common types of NTMs in agricultural products are attributed to differences in
technical and SPS standards between the exporting and importing country as well as diverging
standards and specifications across different importing countries. In particular, these include
specific measures to regulate product characteristics, marking, labelling, packaging, testing and
SPS measures. Such measures constitute a trade barrier particularly if standards are designed and
implemented, intentionally or otherwise, in a way that favours the production methods of a
particular country or those of advanced countries. The literature shows a growing concern about
certain regulations associated with environmental, national security and labour standards in
developed-country markets. While these seem to be legitimate areas for regulation, bioterrorism
rules, child labour clauses, and environment standards are mostly perceived in DCs as being
more trade restrictive than necessary to achieve intended goals.20
Several studies measure some sort of dissimilarity or heterogeneity indexes for estimating
the additional costs for exports due to divergent NTM regulations between countries.21 Although
the studies are mostly for developed countries and extend beyond agricultural products, they do
offer interesting insights on the trade impact of diverging standards. Berden et al. (2009)
examine the main NTMs involved in the EU-US trade using a global business survey.22 Their
results show that diverging regulations between the US and EU increased trade costs by 73
percent for trade flows from the EU to the US and 57 percent for those from the US to the EU
countries.
Using a similar approach, Sunesen et al. (2009) analysed the impacts of NTMs on trade
between Japan and the EU countries. They focus on regulatory differences that EU companies
face when exporting to Japan. The heterogeneity index constructed showed a divergence level of
60.0 for EU exporters of beverages and food. The European Commission funded project (2009 -
20 As discussion of these measures is controversial, few objective studies examine the impact of these measures on
DCs’ exports. 21 See Burnquist et al. (2011); Achterbosch et al. (2009). 22 The study analyses regulatory divergence faced by companies in their exporting activities using a bilateral NTM
index which assumes values between 0 (no regulatory divergence) and 100 (absolute divergence).
18
2011) ‘Assessment of the impacts of non-tariff measures on the competitiveness of the EU and
selected trade partners’ (referred to as the NTM-Impact project) analyses data on NTMs for key
agri-food products that are most commonly traded by the EU with selected nine countries. A key
finding of the project is that trade is significantly reduced when importing countries have stricter
and/or differing standards (SPS or TBT) than the exporting countries. The findings suggest that,
at least for some import standards, the harmonization of regulations will be trade-increasing
(Orden et al. 2012).
Vigani et al. (2010) test for a sample of about sixty countries how similarities or
dissimilarities in GMO regulation affect bilateral trade flows. The results show that strong
differences in these regulations, particularly in relation to labelling systems, approval processes
and traceability requirements, result in lower trade. The Mohanty (2007) study highlights that
important differences among standards applied in different industrialised countries in areas such
as aflatoxin content or pesticide residues can increase the compliance cost particularly for
developing exporting countries. The Atici (2013) study analyses the impact of EU food safety
regulations on Turkey’s fig and hazelnut exports to the EU. Compliance with the regulations
requires processing expenses which increase the unit prices of the products.
An NTM often reported on agricultural products by DC manufacturers in exporting
countries is compliance with the EU regulation on traceability, which entered into force in
January 2005 and requires all exporters to identify the origin of products.23 This imposes an
additional cost burden on DC exporters as the domestic regulations do not require traceability in
the supply chain. Small and medium sized enterprises, which form the bulk of producers and
processors in DCs, face particular challenges. Those companies often lack the internal capacity
and the economies of scale to establish effective quality assurance and traceability systems
(Giovannucci and Purcell 2008). Thus, unless these sectors can make standard compliance cost
effective and guarantee traceability for the buyers, many producers and processors will be
increasingly marginalised and excluded from competitive markets both regionally and
internationally with consequences for trade and economic growth.
Under the World Trade Organisation (WTO) rules, generally technical regulations (also
referred to as ‘mandatory standards’) with which producers/exporters are obliged to comply are
dealt with under the TBT Agreement of the WTO or if they are imposed to protect human,
animal or plant health they are dealt under the SPS Agreement of the WTO. The agreements
attempt to ensure that standards are not misused as disguised protectionist measures in favour of
domestic producers. While maintaining the sovereign right and obligation of countries to set their
own regulations and standards, countries are encouraged to base their import requirements on
internationally agreed benchmarks, in the case of food safety for example the Codex
Alimentarius standards and guidelines.24
From the above it emerges that not only are agricultural standards different and generally
more stringent in developed countries compared to DCs, and at times more restrictive than those
specified by the Codex Alimentarius (FAO, 2004a), but also that they differ across developed
23 Regulation EC/178/2002 (European Parliament 2002) defines traceability as the ability to trace and follow food,
feed and ingredients through all stages of production, processing and distribution. The main objective is that when a
risk is identified its source can be traced in order to swiftly act on the risk. Detailed information on traceability can
be found at: http://ec.europa.eu/food/food/foodlaw/traceability/index_en.htm 24 The Codex Alimentarius refers to food standards, guidelines and codes of practice recommended under the Joint
FAO/WHO Food Standards Programme. The International Plant Protection Convention (IPPC) and the World
Organization for Animal Health (OIE) respectively promote international standards and guidelines for animal and
plant health issues.
19
countries. This adversely affects DCs’ agricultural exports to developed countries, more so in the
case of processed agricultural exports that require a greater degree of formal manufacturing and
therefore higher effort and capabilities to fulfil standards. Therefore, the simplification and
harmonisation of standards through international collaboration can be expected to promote DCs’
agricultural processed exports.
3.3.2 Private voluntary standards and social labelling
In addition to agricultural standards set and implemented by government authorities (mainly SPS
and TBT regulations), an increasing number of agricultural trade standards is set by private
groups or firms (retailers and agri-food companies). These standards, at times called private
voluntary standards (PVS), usually apply to such areas as quality, process management,
packaging requirements, or social concerns. They mainly reflect specific commercial needs such
as value chain management, or the need to reduce the importing firm’s exposure to risk. They
are often implemented faster and usually have a larger scope or require higher levels of
performance than the mandatory public standards and, as they evolve more rapidly than
government regulations, they can be more difficult to follow and implement. Although
voluntary, they are becoming the basic de facto entry requirement for trade with many of the
large-scale operators and leading production and distribution chains (OECD 2013). For example,
Mellado et al. (2010) report that for African agro-food exports both public and private
requirements are important.
The increase in complaints about PVS signals their apparent importance for a growing
number of exporting DCs and raises a number of issues on the evolution of global sourcing, in
particular by lead firms within a global value chain (GVC) framework. Products must now meet
not only the importing country’s public regulations, but also those set by major importers and
retailers. Since PVS are expected to continue to evolve, increasing in stringency and extending
over wider sets of attributes, it is important to understand the implications for access by
developing country producers to global value chains (OECD 2013). The requirements of PVS are
usually greater when it comes to value-added activities, so they pose greater challenges for DCs
exports of agricultural processed products.
Furthermore, in recent years the agricultural (food) sector has witnessed a proliferation of
private social labelling initiatives to promote overtly ‘socially responsible’ production that
extends beyond organic production. Private sector bodies in the developed world such as the
EurepGAP, the International Social and Environmental Accreditation and Labelling Alliance
(ISEAL) and the Fairtrade Labelling Organisation (FLO) are engaged in developing best-practice
codes for the design and implementation of social and environmental standards for the
certification of agricultural final and other products around the globe. While these voluntary
standards have proven to be effective in promoting positive social and environmental change, the
strategies, codes and auditing methods of private labelling standards setters are often regarded by
businesses in DCs as a subtle form of developed countries’ protectionism.25
Although standards going beyond basic entry requirements can represent important
opportunities for increased market share or price for many agricultural products, they can also
entail significant challenges for developing country producers and exporters faced with capacity
and resource constraints. The heterogeneity of these standards entails collecting and evaluating
25 See Mohan (2010).
20
relevant information and data on the applicable requirements, a complex operation, for which
DC producers and exporters may be poorly prepared. In contrast, developed country producers
and exporters who are better equipped to meet the standards will be in a better position to exploit
market opportunities.
A related problem is the requirement for internationally accredited agencies to certify
many standards. This requirement particularly increases total costs for DC exporters as many of
these agencies are based in developed countries, and certificates usually have to be renewed
every year. For example, in Uganda Robusta coffee is produced organically by default, but it is
difficult for producers to get it certified as organic due to the absence of accredited local
certification firms. As a result, producers miss out on premium prices (Bigirwa 2004). From the
above it is apparent that agricultural exports have witnessed a proliferation of private and social
standards. These have opened up market and trade opportunities for countries and exporters able
to meet the standards and become fully integrated into dynamic global value chains. However,
they have also widened the gap that needs to be overcome by other DCs in order to compete
successfully on international markets. DC agricultural exports need to sustain greater
compliance costs which for processed produce are generally found to be higher than for primary
products.
To overcome the confusion over the proliferation of voluntary standards applied in
international markets and to strengthen the capacity of agricultural producers, manufacturers,
exporters, retailers and policymakers from DCs to participate in more sustainable production and
trade, the International Trade Centre’s (ITC’s) partnership-based programme has developed an
online platform ‘Standards Map’. The platform allows users to explore and compare over 130
sustainability standards, and build their personalized business' roadmap towards sustainable trade
through the following steps:
identify standards or codes of conduct which apply to their own business;
review the main features of the selected standards and codes;
generate comparisons of standards’ content requirements;
self-assess their business against standard requirements, generate their personalized
sustainability diagnostic report which traces out a roadmap towards sustainable trade;
save and share their sustainability diagnostic report with actors along the value chain via
the Sustainability Marketplace.26
It is expected that the platform will be particularly helpful in including small and medium scale
actors (farmers, processors and traders) in sustainable food systems.
3.3.3 Rules of origin
The manner in which preferential tariff treatment is granted to the exports of DCs gives rise to
certain forms of NTMs. In the multilateral framework, the Generalised System of Preferences
(GSP) scheme provides for unilateral and non-reciprocal preferences which allow selected
agricultural and industrial products originating in DCs to enter markets of developed countries at
zero or reduced MFN tariffs.27 These schemes are autonomous and granted at the discretion of
26 See more at: http://www.intracen.org/itc/market-info-tools/voluntary-standards/standardsmap 27 The GSP scheme adopted through UNCTAD Resolution 21 (ii) states ‘... the objectives of the generalized, non-
reciprocal, non-discriminatory system of preferences in favour of the developing countries, including special
measures in favour of the least advanced among developing countries, should be: to increase export earnings; to
promote their industrialization; and to accelerate their rates of economic growth.’
21
the preference-allowing country. Studies show that most processed agricultural products that
could benefit from preferential access do not do so in practice.28 This is mainly because the strict
rules of origin constrain exports of processed agricultural products from DCs to markets like the
EU, the US and Switzerland.
Rules of origin cover laws, regulations and administrative determinations of general
application that are implemented by governments of importing countries to determine the
country of origin of goods. Rules of origin are generally easy to establish for primary agricultural
products, but this is more difficult for processed agricultural products. For the latter, DCs often
find it difficult to source intermediate goods locally and therefore have problems meeting local
content requirements. Although the rules of origin allow for cumulation, complying with the
cumulation requirements can also pose difficulties.29 For instance, the EU and the US allow
cumulation only within specific regional groupings, so GSP beneficiary countries that are not
part of a specified regional group may not meet the requirements to benefit from preferences.
The existing rules in Switzerland require a minimum content of 50 percent domestic input, and
do not allow cumulation among products from DCs.
As shown in Table 7, the NTMs reported with the highest frequency by selected DCs are
customs and administrative procedures. Within this broad category, the two most prominent
barriers are rules of origin and import licensing (both automatic and non-automatic), each
responsible for more than one-third of notifications. Countries complain that rules of origin are
discriminatory, unreasonable, or inconsistent, with the result that their products are not covered
by the preferences. More generally, the requirement to comply with stringent rules of origin and
completion of customs documentation to prove exporters’ eligibility for preferences adds to the
total cost, which often wipes out part or even the full preference margin and does not provide an
incentive for DCs to participate in preferential schemes (Brenton and Ikezuki 2005; Khanal
2011).
The OECD (2013) study reports that the difficulties in complying with customs
formalities and regulations on the import market may be amongst the reasons why DCs are not
fully utilising market access (tariff) preferences in OECD countries. For instance, DCs have a
total share of 27 percent in cocoa butter imported by developed countries, but only 2.30 percent
of this comes under the GSP preferences (Mohan et al. 2013). An estimate for the EU shows that
the total costs of border formalities to determine the origin of a product amount to at least three
percent of the total value of the product (Inama 2003; Mattoo et al. 2003). For the US estimates
show that the average compliance costs for DCs to qualify for preferences was 6.2 percent in
2001 (Carrere and de Melo 2004).
3.4 Domestic NTMs in DCs
In addition to NTMs in foreign markets, there are domestic NTMs to trade in DCs that are not
very often highlighted in the literature but nonetheless impede exporting activity.30 The common
perception is that NTMs are faced in the destination market. The ITC NTM surveys of exporters
28 See Michalopoulos (1999), Panagariya (2002), Candau et al. 2004, and Hoekman and Nicita (2011). 29 Cumulation refers to the degree to which inputs (processes and/or materials) wholly or partly originating in one
preferential trading partner are allowed to count towards satisfying a rules-of-origin governing process carried out in
another preferential partner. 30For discussion on domestic NTMs see Anderson and Wincoop (2004), Kneller et al. (2008), Hoekman and Nicita
(2011), Cadot and Gourdan (2012).
22
in DCs reveal that more than 25 percent of reported problems correspond to measures applied by
the home country of the exporting company (ITC, 2015). An important category of problems
faced at home by exporters is procedural obstacles. The second most important problem concerns
red tape and corrupt practices. The WTO categorises them as trade facilitation issues such as
excessive customs documentation, import and export requirements, lack of cooperation among
customs and other government agencies, inadequate use of information technology, information
asymmetry and lack of transparency. These domestic NTMs increase transaction costs of
exports, which adversely affects export competitiveness.
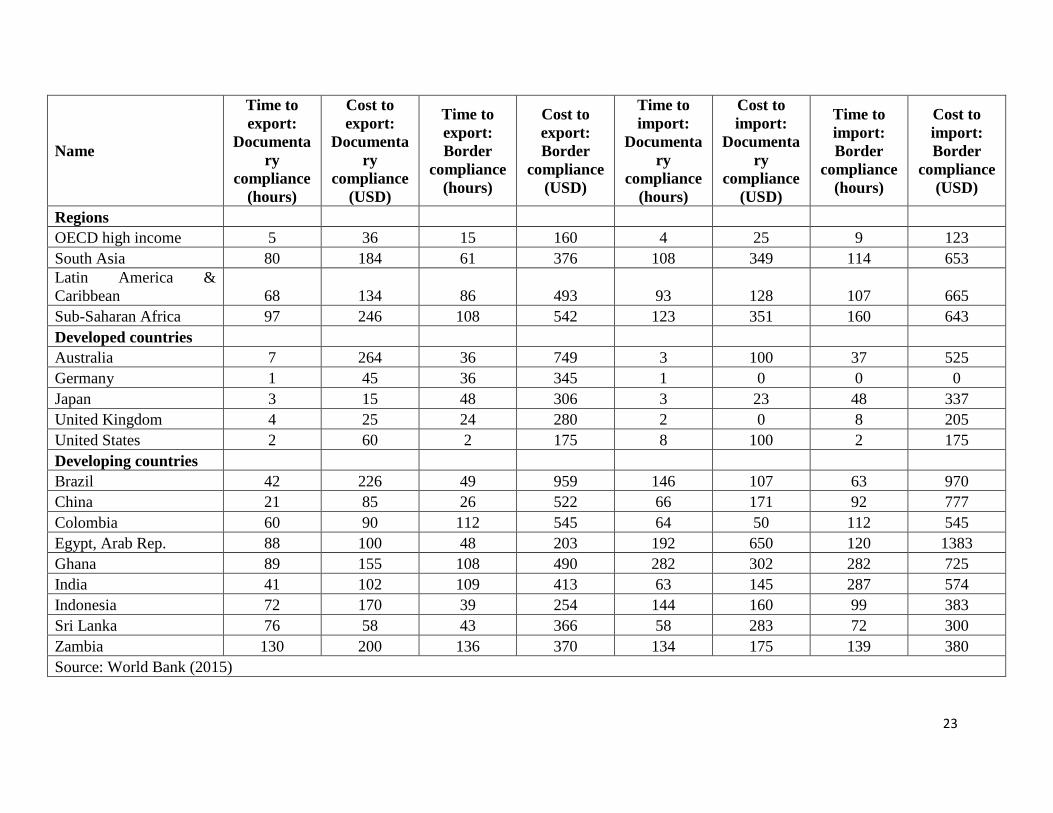
The World Bank (2015) as part of its ‘Doing Business: Trading Across Borders’ project,
records the time and cost (excluding tariff) associated with the logistical process of exporting and
importing a standardised cargo of goods. We look at two sets of procedures — documentary
compliance and border compliance – within the overall process of exporting or importing a
shipment of goods. Table 9 reports for selected regions and developed and DCs the most recent
round of data collection for the project which was completed in June 2015.
23
Name
Time to
export:
Documenta
ry
compliance
(hours)
Cost to
export:
Documenta
ry
compliance
(USD)
Time to
export:
Border
compliance
(hours)
Cost to
export:
Border
compliance
(USD)
Time to
import:
Documenta
ry
compliance
(hours)
Cost to
import:
Documenta
ry
compliance
(USD)
Time to
import:
Border
compliance
(hours)
Cost to
import:
Border
compliance
(USD)
Regions
OECD high income 5 36 15 160 4 25 9 123
South Asia 80 184 61 376 108 349 114 653
Latin America &
Caribbean 68 134 86 493 93 128 107 665
Sub-Saharan Africa 97 246 108 542 123 351 160 643
Developed countries
Australia 7 264 36 749 3 100 37 525
Germany 1 45 36 345 1 0 0 0
Japan 3 15 48 306 3 23 48 337
United Kingdom 4 25 24 280 2 0 8 205
United States 2 60 2 175 8 100 2 175
Developing countries
Brazil 42 226 49 959 146 107 63 970
China 21 85 26 522 66 171 92 777
Colombia 60 90 112 545 64 50 112 545
Egypt, Arab Rep. 88 100 48 203 192 650 120 1383
Ghana 89 155 108 490 282 302 282 725
India 41 102 109 413 63 145 287 574
Indonesia 72 170 39 254 144 160 99 383
Sri Lanka 76 58 43 366 58 283 72 300
Zambia 130 200 136 370 134 175 139 380
Source: World Bank (2015)
24
The longer time and higher cost needed to arrange exports from DCs (particularly for
documentary compliance) reflects a relatively higher level of domestic NTMs for DCs’
manufacturers (exporters) compared to developed countries’ exporters. Furthermore, most export
products have a component of imports, so ease of importing facilitates exports. Therefore, the
requirement of longer time and higher cost to arrange imports also amounts to domestic NTMs
for DCs’ exporters.
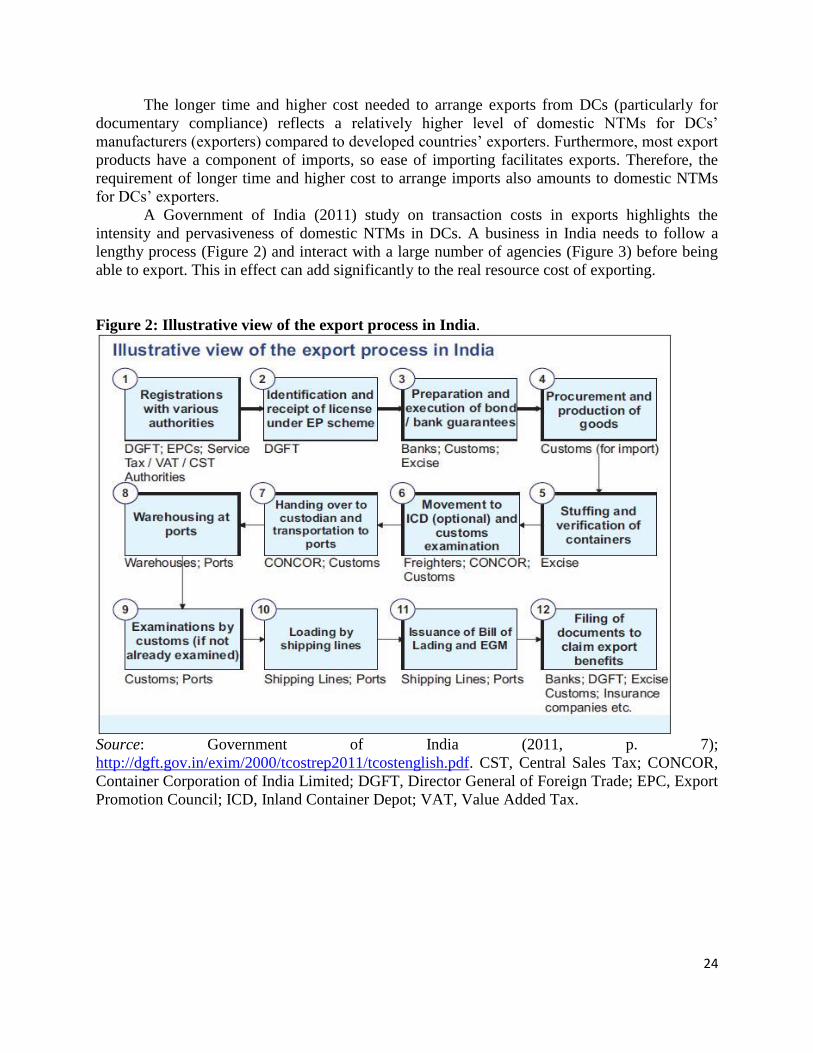
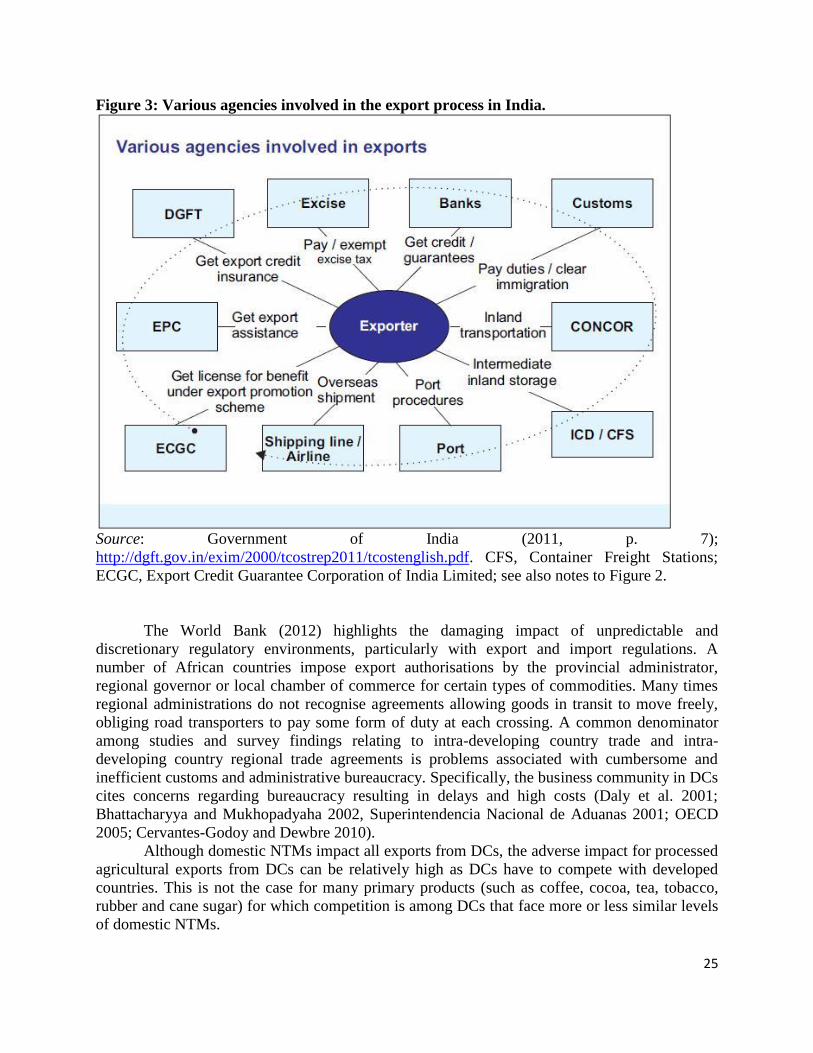
A Government of India (2011) study on transaction costs in exports highlights the
intensity and pervasiveness of domestic NTMs in DCs. A business in India needs to follow a
lengthy process (Figure 2) and interact with a large number of agencies (Figure 3) before being
able to export. This in effect can add significantly to the real resource cost of exporting.
Figure 2: Illustrative view of the export process in India.
Source: Government of India (2011, p. 7);
http://dgft.gov.in/exim/2000/tcostrep2011/tcostenglish.pdf. CST, Central Sales Tax; CONCOR,
Container Corporation of India Limited; DGFT, Director General of Foreign Trade; EPC, Export
Promotion Council; ICD, Inland Container Depot; VAT, Value Added Tax.
25
Figure 3: Various agencies involved in the export process in India.
Source: Government of India (2011, p. 7);
http://dgft.gov.in/exim/2000/tcostrep2011/tcostenglish.pdf. CFS, Container Freight Stations;
ECGC, Export Credit Guarantee Corporation of India Limited; see also notes to Figure 2.
The World Bank (2012) highlights the damaging impact of unpredictable and
discretionary regulatory environments, particularly with export and import regulations. A
number of African countries impose export authorisations by the provincial administrator,
regional governor or local chamber of commerce for certain types of commodities. Many times
regional administrations do not recognise agreements allowing goods in transit to move freely,
obliging road transporters to pay some form of duty at each crossing. A common denominator
among studies and survey findings relating to intra-developing country trade and intra-
developing country regional trade agreements is problems associated with cumbersome and
inefficient customs and administrative bureaucracy. Specifically, the business community in DCs
cites concerns regarding bureaucracy resulting in delays and high costs (Daly et al. 2001;
Bhattacharyya and Mukhopadyaha 2002, Superintendencia Nacional de Aduanas 2001; OECD
2005; Cervantes-Godoy and Dewbre 2010).
Although domestic NTMs impact all exports from DCs, the adverse impact for processed
agricultural exports from DCs can be relatively high as DCs have to compete with developed
countries. This is not the case for many primary products (such as coffee, cocoa, tea, tobacco,
rubber and cane sugar) for which competition is among DCs that face more or less similar levels
of domestic NTMs.
26
4. Conclusions and policy implications
The objective of this paper is to understand why DCs perform poorly in agricultural processed
product exports despite being the main producers of many of these products in their primary
form. The paper uses the case study of selected agricultural products to analyse the extent to
which tariffs and TE in developed countries can be blamed for the poor performance of DCs. It
emerges that even though tariffs and TE are important, they are not the main explanatory factor.
The evidence clearly points to the widespread prevalence of NTMs in developed countries that
impact on trade of processed agricultural products and that have relatively more severe effects in
restricting market access for these products from DCs. These conclusions have important policy
implications in terms of the effort that trade negotiators and policy planners need to make to
manage and reduce these barriers, particularly those that unjustifiably curtail trade. The analysis
also highlights that domestic NTMs are an important trade barrier for DCs’ agricultural
processed product exports. This is an area where DCs must act urgently if they want to compete
with developed countries. The potential benefits from lowering domestic NTMs appear to be
large, as this could add considerably to the export potential of DCs by lowering the transaction
costs of their exports. This again has important policy implications in terms of the effort that
individual DCs policy planners need to make to lower these barriers.
It should be stressed that the analysis nowhere suggests that NTMs are the only or the
main cause of the inability of DCs to capture a larger share of agricultural processed product
world exports. The reasons for this failure can be many, in particular the intrinsic supply-side
constraints in DCs limiting their ability to diversify into processed product exports. Moreover,
there may be some comparative advantage associated with processing in developed markets. If
developed markets are major consumers of the final (processed) products, an advantage of
production being closer to the consumers is of adjusting production and marketing promptly to
changing consumer preferences as well as meeting the requirements of supermarkets and
retailers. Another advantage is of access to primary product from more than one origin. For
example, most of the popular coffee and tea retail brands are blends that use coffee and tea from
different origins in different proportions. Arguably some of the above-mentioned advantages of
processing in developed consuming markets can be countered by DCs’ advantages in areas such
as cheap skilled and unskilled labour. The balance of advantage for individual products can be
ascertained only on the basis of careful review and evaluation.
Notwithstanding, there is no denying the fact that lowering NTMs does offer a dynamic
opportunity for many DCs to increase exports of agricultural processed products both to
developed and developing country markets , in particular for those agricultural products that in
their primary form are mostly produced in DCs. An important dimension of agricultural trade
liberalisation is the need to ensure that the issue of NTMs is high on the agenda of developing
country trade negotiators and that DCs pay more attention to addressing their domestic NTMs,
particularly streamlining the process of exports and imports to reduce time and transaction costs
of exporting and importing. With a high share of agriculture in gross domestic product and in
exports, the costs associated with complying with NTMs in agriculture have a relatively higher
overall economic impact in DCs than in high-income countries.
Undoubtedly there is need for greater policy coherence with regard to NTMs. Although
good regulation can facilitate trade and development, the challenge remains to separate
protectionist and non-protectionist measures and to identify alternative policies that are less
onerous for trade. More attention should be given to identifying NTMs that are of particular
27
concern to DCs agricultural processed exports so as to help determine priority targets for
strengthening special and differential treatment (SDT) as well as international collaboration in
the field of NTMs. DCs too should step up their efforts to implement domestic policies that
assure compatibility with international standards and assist agricultural processors and producers
in meeting the required standards and regulations for exports.
28
References
Achterbosch, T.J., A. Engler, M.-L. Rau, and R. Toledo (2009). Measure the Measure: the
Impact of Differences in Pesticide MRLs on Chilean Fruit Exports to the EU. Paper
presented at the International Association of Agricultural Economists Conference, Beijing,
China, 16 - 22 August.
Aksoy, M.A. and F. Ng (2010). The Evolution of Agricultural Trade Flows. Policy Research
Working Paper No. 5308, Washington, DC: Development Research Group, World Bank.
Anderson, J. E., J. H. Bergstrand, P. Egger and J. Francois (2009). Non-tariff Barrier Study
Methodology. Technical paper prepared for the EC Ecorys study, Non‐Tariff Measures in
EU‐US Trade and Investment – An Economic Analysis. European Commission,
Directorate General for Trade, Reference: OJ 2007/S 180‐219493, 2009.
Anderson, J.E. and E. V. Wincoop (2004). Trade costs. Journal of Economic Literature, 42(3):
691–751.
Andriamananjara, S., M. Ferrantino and M. Tsigas (2003). Alternative Approaches in
Estimating the Economic Effects of Non-Tariff Measures: Results from Newly Quantified
Measures. Working Paper 03-12-C, Washington, DC: US International Trade Commission.
Antimiani, A., M. Di Maio and F. Rampa (2009). Tariff Protection, Tariff Escalation and
African Countries: Who are the Real Friends? Paper presented at 11th ETSG conference,
10–12 Sept, Rome.
Atici, C. (2013). Food Safety Regulations and Export Responses of Developing Countries: The
Case of Turkey’s Fig and Hazelnut Exports. FAO Commodity and Trade Policy Research
Working Paper No: 39. FAO, Rome.
Balassa, B. (1968). The Structure of Protection in Industrial Countries and its Effects on the
Exports of Processed Goods from developing Countries. In UNCTAD (ed.), The Kennedy
Round: Estimated Effects on Tariff Barriers, New York: United Nations.
Beghin, J. and A. Aksoy (2003). Agricultural Trade and the Doha Round: Lessons from
Commodity Studies. Briefing paper 03-BP 42, Ames, IA: Centre for Agricultural and Rural
Development, Iowa State University.
Berden, K.G., J. Francois, M. Thelle, P. Wymenga and S. Tammine (2009). Non-Tariff
Measures in EU-US Trade and Investment – An Economic Analysis. European
Commission Study, DG Trade, ECORYS, the Netherlands.
Bhattacharyya, B. and S. Mukhopadyaha (2002). Non-Tariff Measures on South Asia’s
Exports: An Assessment. New Delhi: South Asian Association for Regional Cooperation.
Bigirwa, J. (2004). Equitable Trading and Coffee – Impact in Developing Countries. Paper
presented at the International Coffee Organization Round Table on Equitable Trading and
Coffee, 18 May, London.
Bora, B., A. Kuwahara, and S. Laird (2002). Quantification of Non-tariff Measures. Policy
Issues in International Trade and Commodities Study Series No. 1, New York: UNCTAD.
Brenton, P and T. Ikezuki (2005). The Value of Trade Preferences for Africa. Trade Note No.
21, Washington, DC: World Bank.
Burman, C, K. Johansson, A. Karlsson, H. Loxbo, B. Norell, Y. Mattson and M.
Wilhelmsson (2001). Tariff Escalation for Agricultural and Fishery Products. Report
2001:12, Stockholm: Swedish Board for Agriculture.
Burnquist, H.L., K. Shutes, M-L. Rau, M.J.P. Souza, R.N. Faria (2011). Heterogeneity Index
of Trade and Actual Heterogeneity Index – the case of maximum residue levels (MRLs) for
29
pesticides. Paper presented at the Agricultural & Applied Economics Association,
Pittsburgh, Pennsylvania, July 24-26, 2011.
Cadot, O. and Gourdon J. (2012). Assessing the Price-raising Effect of Non-tariff Measures in
Africa. Working Papers 2012-16, CEPII Research Center.
Candau, F., L. Fontagné and S. Jean (2004). The Utilisation Rate of Preferences in the EU.
Paper presented at the 7th Global Economic Analysis Conference, 17–19 June,
Washington, DC.
Cantore, N., M. Canavari and E. Pignatti (2008). Organic certification systems and
international trading of agricultural products in gravity models. Annual Meeting of the
American Agricultural Economics Association (new name 2008: Agricultural and Applied
Economics Association), Orlando, Florida, 27 - 29 July.
Carrere, C. and J. de Melo (2004). Are Different Rules of Origin Equally Costly: Estimates
from NAFTA. CERDI Working Paper No. 200412, Centre d’Etudes et de Recherches sur
le Developpment International (CERDI), Clermont-Ferrand.
Cernat, L., S. Laird and A. Turrini (2002). Back to Basics: Market Access Issues in the Doha
Agenda. Geneva: Trade Analysis Branch, UNCTAD.
Cervantes-Godoy, D. and J. Dewbre (2010). Economic Importance of Agriculture for Poverty
Reduction. OECD Food, Agriculture and Fisheries Working Paper No. 23, OECD, Paris.
Chevassus-Lozza, E., and J. Gallezot (2003). Preferential Agreements – Tariff Escalation:
What are the Consequences of the Multilateral Negotiations for the Access of Developing
Countries to the European Market? Paper presented at Where Are We Heading? The
International Conference on Agricultural Policy Reform and the WTO, 23–26 June, Capri.
Cobban, M.A. (1988). Tropical Products in the Uruguay Round Negotiations. The World
Economy, 2(2): 233–48.
Daly, M., Khan, M.A. and S. Staines (2001). Tariff and Non-Tariff Barriers to Trade and
Economic Development in Bangladesh. Journal of World Trade, 35(2): 253-73.
Daviron, B. and S. Ponte (2005). The Coffee Paradox: Global Markets, Commodity Trade and
the Elusive Promise of Development. London: Zed Books.
De Frahan, B.H. and M. Vancauteren (2006). Harmonisation of Food Regulations and Trade
in the Single Market: Evidence form Disaggregated Data. European Review of Agricultural
Economics, 33(3): 337–60.
Dean, J., R. Feinberg, M. Ferrantino, R. Ludema and J. Signoret (2006). Estimating the
Price Effects of Non-Tariff Measures. Office of Economics Working Paper No. 2006-06-
A, Washington, DC: US International Trade Commission.
Diaz-Bonilla, E. and L. Reca (2000). Trade and Agro-industrialization in Developing
Countries: Trends and Policy Impacts. Agricultural Economics, 23(3): 219–229.
Doanh, K.N. and Y. Kee (2007). A Comparative Study of the Trade Barriers in Vietnam and
Thailand. International Area Review, 10(1): 239–66.
Disdier, A.-C. and S. Marette (2010). The Combination of Gravity and Welfare Approaches for
Evaluating Nontariff Measures. American Journal of Agricultural Economics, 92 (3): 713 -
726.
Donnelly, W. A. and D. Manifold (2005). A Compilation of Reported Non-Tariff Measures:
Description of the Information. Working Paper No. 2005-05-A, Washington, DC: US
International Trade Commission.
30
ECORYS (2009). Non‐Tariff Measures in EU‐US Trade and Investment – An Economic
Analysis. Report prepared for European Commission, Directorate‐General for Trade,
Reference: OJ 2007/S 180‐219493
Elamin, N and H. Khaira (2004). Tariff Escalation in Agricultural Commodity Markets. In
Food and Agriculture Organization of the United Nations (FAO), Commodity Market
Review 2003–2004, Rome: FAO.
European Parliament (2002). Regulation (EC) No. 178/2002 of the European Parliament and of
the Council of European Union, Official Journal of the European Communities, English
version, L31, 1.2.2002, 1–24.
FAO (Food and Agriculture Organization of the United Nations) (2003). Major Constraints
to Trade in Processed Agricultural Products Confronting Developing Countries. FAO
Support to the WTO Negotiations, Factsheet for the Sixth WTO Ministerial Conference in
Hong Kong, Rome:FAO.
FAO (2004). Repercussions of the Doha Trade Negotiation Round, Focused on the Development
of Developing Countries: Basic Product and Trade Direction. Rome: FAO.
FAO (2004a). Worldwide Regulations for Mycotoxins in Food and Feed in 2003. Rome: FAO.
FAOSTAT (2014). Database. Food and Agriculture Organization of the United Nations, Rome.
Fontagné, L., M. Mimouni, and J-M. Pasteels (2005). Estimating the Impact of Environmental
SPS and TBT on International Trade. Integration and Trade Journal, 22:7–37.
Francois, J., M. Manchin and H. Norberg (2011). European perspectives on NTM and tariff
liberalization. ESRI Discussion Paper No. 265, Economic and Social Research Institute,
Cabinet Office, Government of Japan, Tokyo.
Giovannucci, D. and T. Purcell (2008). Standards and Agricultural Trade in Asia. Asian
Development Bank Institute, Discussion Paper, No. 107, Tokyo.
Golub, S. S. and J. M. Finger (1979). The Processing of Primary Commodities: Effects of
Developed-Country Tariff Escalation and Developing-Country Export Taxes. Journal of
Political Economy, 87(3), 559–77.
Government of India (2011). Task Force on Transaction Cost in Exports: A Report. New
Delhi: Department of Commerce, Government of India.
Graffham, A., E. Karehu and J. Macgregor (2007). Impact of EurepGAP on Small-scale
Vegetable Growers in Kenya. Fresh Insights 6, Greenwich: Natural Resources Institute.
Greenaway, D. and C. Milner (2003). Effective Protection, Policy Appraisal and Trade Policy
Reform. The World Economy, 26(4): 441–56.
Helpman, E., M. Melitz and Y. Rubinstein (2008). Estimating Trade Flows: Trading Partners
and Trading Volumes. Quarterly Journal of Economics, 123(2), 441–87.
Henson, S. (2006). The Role of Private and Public Standards in Regulating International Food
Markets. Paper presented at the IATRC Summer Symposium: Food Regulation and Trade –
Institutional Framework, Concepts of Analysis and Empirical Evidence, 28–30 May, Bonn.
Hoekman, B. and Nicita, A. (2011). Trade Policy, Trade Costs, and Developing Country Trade.
World Development, 39(12): 2069–79.
Inama, S. (2003). Quantifying the Trade Effects of Rules of Origin on Preference: The Case of
GSP, AGOA and ACP preferences. Paper presented at the workshop on The Origin of
Goods, hosted by the IADB, INRA, DELTA, and CEPR, 23 May, Paris.
Jayasuriya, S., D. MacLaren and R. Mehta (2006). Meeting Food Safety Standards in Export
Markets: Issues and Challenges facing Firms Exporting from Developing Countries. Paper
presented at the IATRC Summer Symposium, Bonn, Germany, 28-30 May.
31
Kee, H. L., A. Nicita and M. Olarreaga (2006). Estimating Trade Restrictiveness Indices.
Policy Research Working Paper No. 3840, Washington, DC: World Bank.
Khanal, D. R. (2011). Rules of Origin in GSP Schemes and their Impact of Nepal’s Exports.
Working Paper No. 98, Asia-Pacific Research and Training Network on Trade.
Kneller, R., M. Pisu and Z. Yu (2008). ‘Overseas Trading Costs and Firm Export
Performance’, Canadian Journal of Economics, 41(2): 639–69.
Korinek, J., M. Melatos and M.-L. Rau (2008). A Review of Methods for Quantifying the
Trade Effects of Standards in the Agri-food Sector. OECD, Paris.
Kox , H. and A. Lejour (2005). Regulatory Heterogeneity as Obstacle for International Services
Trade. Discussion Paper No. 49, The Hague: CPB Netherlands Bureau for Economic
Policy Analysis.
Laborde, D and W. Martin (2010). Formulas and Flexibility in Trade Negotiations: Sensitive
Agricultural Products in the WTO’s Doha Agenda. Policy Research Working Paper No.
5200, Washington, DC: World Bank.
Laird, S. and A. Yeats (1987). Tariff Cutting Formulas and Complications. In J. M. Finger and
A. Olechowski (eds), A Handbook for Multilateral Round Negotiations, Washington, DC:
World Bank.
Market Access Map (2014). Making Tariffs and Market Access Barriers Transparent. Geneva:
International Trade Center.
Maskus, K., T. Otsuki and J. S. Wilson (2005). The Cost of Compliance with Product
Standards for Firms in Developing Countries: An Econometric Study. Policy Research
Working Paper No. 3590, Washington, DC: World Bank.
MAST (Multi-agency support team) (2008). First Progress Report to the Group of Eminent
Persons on Non-tariff Barriers. Mimeo, Geneva, UNCTAD.
Mattoo, A., D. Roy and A. Subramanian (2003). The Africa Growth and Opportunity Act and
its Rules of Origin: Generosity Undermined? World Economy, 26(6), 829–52.
Mayer, T. and S. Zignago (2005). Market Access in Global and Regional Trade. Working
Paper No. 2005-02, Paris: CEPII.
Mellado, A. G., S. Helaine, M. Rau and M. Tothova (2010). Non-tariff Measures Affecting
Agro-food trade between the EU and Africa. Report of Workshop, European Commission,
Luxembourg
Michalopoulos, C. (1999). Trade Policy and Market Access Issues for DCs: Implications for the
Millennium Round. Mimeo, Washington, DC: World Bank.
Mohan, S. (2007). Reforming Agricultural Trade among Developing Countries’, World Trade
Review, 6(3), 397–411.
Mohan, S. (2010). Fair Trade without its Froth. Hobart Paper No. 170, London: Institute of
Economic Affairs.
Mohan, S., Khorana. S. and H. Choudhury (2013). Why developing countries have failed to
increase their exports of agricultural processed products. Economic Affairs, 33(1): 48-64
Mohanty, S.K. (2007). Trade and Environment Dimensions in the Food and Food Processing
Industries in Asia and the Pacific - REGIONAL STUDY, Report prepared for UNESCAP,
Environment and Sustainable Division, Bangkok, Thailand.
Moïsé, E., Delpeuch, C., Sorescu, S., Bottini, N. and A. Foch (2013). Estimating the
Constraints to Agricultural Trade of Developing Countries. OECD Trade Policy Papers,
No. 142, OECD Publishing. http://dx.doi.org/10.1787/5k4c9kwfdx8r-en
32
OECD (Organisation for Economic Co-operation and Development) (1997). The Uruguay
Round Agreement on Agriculture and Processed Agricultural Products. Paris: OECD.
OECD (2001). Non-Tariff Measures on Agricultural and Food Products: The Policy Concerns of
Emerging and Transition Economies. Paris: OECD.
OECD (2003). Agricultural Policies in OECD Countries: Monitoring and Evaluation. Paris:
OECD.
OECD (2005). Non-Tariff Barriers of Concern to Developing Countries. Paris: OECD.
OECD (2009). A cost‐benefit framework for the assessment of non‐tariff measures in agro‐food
trade. OECD Food, agriculture and fisheries Working Papers, No. 21, Paris: OECD.
OECD (2011). The Impact of Trade Liberalisation on Jobs and Growth: Technical Note. OECD
Trade Policy Working Papers, No. 107, Paris:OECD.
OECD (2013). Non-Tariff Measures in Agri‑Food Trade: Improving Policy Coherence for
Development. Paris:OECD.
Orden, D., Beghin, J. and Henry, G. (2012). Key Findings of the NTM-IMPACT Project.
World Economy, 35: 967–972.
Panagariya, A. (2002). EU Preferential Trade Arrangements and Developing Countries. The
World Economy, 25(10): 1415–32.
Panagariya, A. (2005). Agricultural Liberalisation and the Least Developed Countries: Six
Fallacies. The World Economy, 28(9): 1277–99.
Rae, A. and T. Josling (2003). Processed Food Trade and Developing Countries: Protection and
Trade Liberalization. Food Policy, 28(2): 146–66.
Safadi, R. and A. Yeats (1993). Asian Trade Barriers against Primary and Processed
Commodities. Working Paper No. 1174, Washington, DC: World Bank.
Sharma, R. (2006). The Doha Round Agricultural Tariff-Cutting Formulae and Tariff
Escalation. Rome: Commodities and Trade Division, FAO.
Silva, J.M.C.S. and S. Tenreyro (2006). The Log of Gravity, Review of Economics and
Statistics, 88(4): 641–58.
Sunesen, E. R., J. Francois and M. Thelle (2009). Assessment of Barriers to Trade and
Investment between the EU and Japan. Study commissioned by the European Commission,
DG Trade, TRADE/07/A2, Copenhagen Economics.
Superintendencia Nacional de Aduanas (2001). Evaluación de Servios de Aduanas. Estudio
Cuantitativo: Principales Resultados, Apoyo Opinión y Mercadeo, Govt. of Peru,
November 2001.
UNCTAD (2009). Report to the Group of Eminent Persons on Non-Tariff Barriers. Note by the
UNCTAD Secretariat, September, Geneva: UNCTAD.
UNCTAD (2013). Non-Tariff Measures to Trade: Economic and Policy Issues for Developing
Countries. Geneva: UNCTAD.
USDA (US Department of Agriculture) (2001). Profiles of Tariffs in Global Agricultural
Markets. Agricultural Economic Report No. 796, Washington, DC: USDA.
Van Tongeren, F., J. Beghin and S. Marette (2009). A Cost-Benefit Framework for the
Assessment of Non-Tariff Measures in Agro-Food Trade‖, OECD Food, Agriculture and
Fisheries Working Papers, No. 21, OECD Publishing.
Van Tongeren, F., Disdier, A.-C., Komorowska, J., Marette, S. and M. von Lampe (2010). Case Studies of Costs and Benefits of Non-Tariff Measures: Cheese, Shrimp and Flowers.
OECD Food, Agriculture and Fisheries Working Papers 28, OECD, Paris.
33
Verkat, J. (2001). Tariff Escalation for Agricultural and Fishery Products. Report No. 2001: 12,
Stockholm: Swedish Board for Agriculture.
Vigani, M., V. Raimondi and A. Olper (2010). GMO Regulations, International Trade and the
Imperialism of Standards. LICOS Discussion Papers 25510, Centre for Institutions and
Economic Performance (LICOS), Catholic University of Leuven.
Wainio, J. and D. Vanzetti (2008). Tariff Escalation in the Doha Talks – Bringing the Issue to
Resolution. Paper presented at the 52nd Australian Agricultural and Resource Economics
Society, 5–8 Feb, Canberra.
Winchester, N., Marie-Luise Rau, Christian Goetz, Bruno Larue, Tsunehiro Otsuki, Karl
Shutes, Christine Wieck, Heloisa L. Burnquist, Mauricio J. Pinto de Souza and
Rosane Nunes de Faria (2012). The Impact of Regulatory Heterogeneity on Agri-food
Trade. World Economy, 2012 Special Issue: 973-993.
WDI (2014). World Development Indicators. The World Bank, Washington DC.
WITS (2014). Trade Data Warehouse: Commodity Trade (COMTRADE) of the United Nations
Statistical Division; Trade Analysis Information System (TRAINS) of the UNCTAD;
Integrated Data Base (IDB) and the Consolidated Tariff Schedule (CTS) of the WTO. World
Integrated Trade Solution, Washington DC: World Bank (http://wits.worldbank.org).
World Bank (2013). Doing Business: Measuring Business Regulations. Washington, DC: World
Bank and the International Finance Corporation.
World Bank (2012). Africa Can Help Feed Africa: Removing Barriers to Regional Trade in
Food Staples. PREM Africa Region Report No. 66500-AFR, Washington, DC: World
Bank.
Yue, C. and J. C. Beghin (2009). The Tariff Equivalent and Forgone Trade Effects of
Prohibitive Technical Barriers to Trade. American Journal of Agricultural Economics,
91(4): 930–41.
Zarrilli S. and I. Musselli (2004). The Sanitary and Phyto-sanitary Agreement, food safety
policies and product attributes. In M. D. Ingco and J. D. Nash (eds), Agriculture and the
WTO: Creating a Trading System for Development, Washington, DC: World Bank, pp.
217–36.
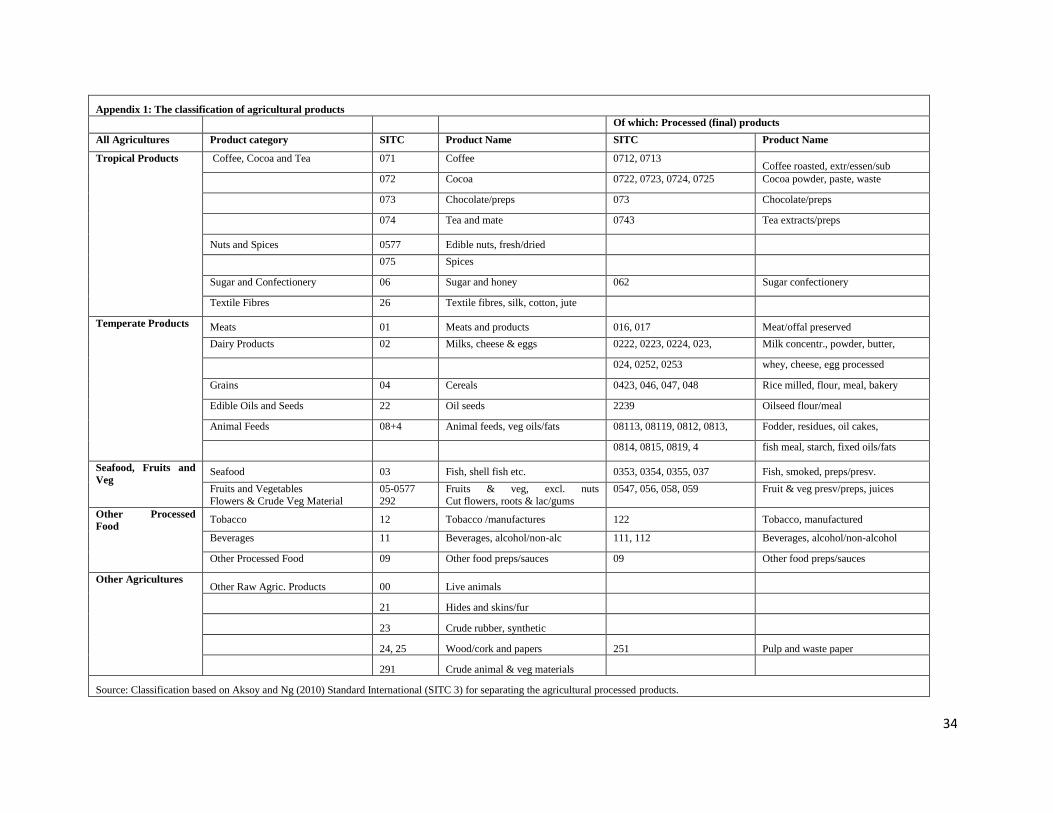
34
Appendix 1: The classification of agricultural products
Of which: Processed (final) products
All Agricultures Product category SITC Product Name SITC Product Name
Tropical Products
Coffee, Cocoa and Tea 071 Coffee 0712, 0713 Coffee roasted, extr/essen/sub
072 Cocoa 0722, 0723, 0724, 0725 Cocoa powder, paste, waste
073 Chocolate/preps 073 Chocolate/preps
074 Tea and mate 0743 Tea extracts/preps
Nuts and Spices 0577 Edible nuts, fresh/dried
075 Spices
Sugar and Confectionery 06 Sugar and honey 062 Sugar confectionery
Textile Fibres 26 Textile fibres, silk, cotton, jute
Temperate Products Meats 01 Meats and products 016, 017 Meat/offal preserved
Dairy Products 02 Milks, cheese & eggs 0222, 0223, 0224, 023, Milk concentr., powder, butter,
024, 0252, 0253 whey, cheese, egg processed
Grains 04 Cereals 0423, 046, 047, 048 Rice milled, flour, meal, bakery
Edible Oils and Seeds 22 Oil seeds 2239 Oilseed flour/meal
Animal Feeds 08+4 Animal feeds, veg oils/fats 08113, 08119, 0812, 0813, Fodder, residues, oil cakes,
0814, 0815, 0819, 4 fish meal, starch, fixed oils/fats
Seafood, Fruits and
Veg Seafood 03 Fish, shell fish etc. 0353, 0354, 0355, 037 Fish, smoked, preps/presv.
Fruits and Vegetables
Flowers & Crude Veg Material
05-0577
292
Fruits & veg, excl. nuts
Cut flowers, roots & lac/gums
0547, 056, 058, 059 Fruit & veg presv/preps, juices
Other Processed
Food
Tobacco 12 Tobacco /manufactures 122 Tobacco, manufactured
Beverages 11 Beverages, alcohol/non-alc 111, 112 Beverages, alcohol/non-alcohol
Other Processed Food 09 Other food preps/sauces 09 Other food preps/sauces
Other Agricultures Other Raw Agric. Products 00 Live animals
21 Hides and skins/fur
23 Crude rubber, synthetic
24, 25 Wood/cork and papers 251 Pulp and waste paper
291 Crude animal & veg materials
Source: Classification based on Aksoy and Ng (2010) Standard International (SITC 3) for separating the agricultural processed products.

35