
Non%Revenue!WaterManagementinSana'aWater … · Non%Revenue!WaterManagementinSana'aWater...
214
NonRevenue Water Management in Sana'a Water Distribution System Taha M. ALWashali Ʈǀůźƫř Ʋưůźƫř ƶƬƫř Ʈƀŝ Photo: www.article.wn.com
Transcript of Non%Revenue!WaterManagementinSana'aWater … · Non%Revenue!WaterManagementinSana'aWater...

Non-Revenue Water Management in Sana'a Water Distribution System
Taha M. AL-Washali
Photo: www.article.wn.com
II
The University of Jordan
Authorization Form
I, Taha AL-Washali, authorize the University of Jordan to supply copies of
my Thesis to libraries or establishments or individuals on request,
according to the University of Jordan regulations.
Signature:
Date: January, 2011
NON-REVENUE WATER MANAGEMENT IN SANA'A WATER
DISTRIBUTION SYSTEM
By
Taha M. AL-Washali
Supervisor
Dr. Abbas AL-Omari, Prof.
Co-Supervisor
Dr. Lars Ribbe, Prof
Unofficial Supervisor
Dr. Michael Sturm, Prof
This Thesis was Submitted in Partial Fulfillment of the Requirements for the
Faculty of Graduate Studies
The University of Jordan
Institute for Technology and Resources Management in the Tropics and
Subtropics (ITT)
University of Cologne for Applied Sciences
January, 2011

II
COMMITTEE DECISION

III
DEDICATION
To The Prophet (PBUH)
IV
ACKNOWLEDGEMENT
All praise and glory to Almighty Allah (SWT) who gave me strength and perseverance
to keep going with this thesis even during the darkest moments.
This work in its timeframe would never be achieved without the help of many people.
First lines go to my advisors;; Dr. Abbas Al-omari and Dr. Lars Ribbe;; without their
patience, advice, and assistance, this thesis would never be submitted. I wish to place on
record my gratitude to them. Special thanks go to Dr. Michael Sturm for his valuable
discussions.
I am indebted to Mr. Allan Lambert (IWA). With his interest, encourage, long emails,
and scientific materials, he has been a treasure full of knowledge and inspiration during
carrying out this study. Many thanks go to Mr. Michel Vermersch (IWA) for critical
feedback for the suggested approach. I am also thankful to Dr. Gerhard Lichtenthaler
and Dr. Mohammed Al-hamdi for their advices and comments at the beginning of this
work. Grateful thanks go to Dr. Mansoor Haidra whose encouragement and critical
discussions contributed greatly to this research. Thank you Dr. Yosef Abdulmalik for
your statistical advices.
I am also grateful to Mr. Zyad Shwagfeh, Eng. Adel Al-Hadad, Mr. Taha AL-syaghi,
and many others in Ministry of Water and Environment and Sana'a Water Supply and
Sanitation Local Corporation. I wish to place on record my appreciation to them all
especially those in the small offices of Sana'a water utility.
Thank you Waleed Amer, without you and your help in SPSS this thesis would never be
completed. I deeply appreciate the help of Ibn Alwan Group, Eng. Mohamed
Abdurahman, Eng. Mohamed AL-Sewari, and Mr. Rasheed AL-Saadi.
I remain grateful to all members of my family especially those who tried to put this on
LaTex.;; thank you for your undimensioned encouragement. Sincere thanks go also to
interviewees and respondents whose contributions are an important part of this research.
A last word goes to DAAD and IWRM program. THANK YOU for giving me the
chance to be a part of this program.

V
PREFACE
Joerg Koelbl has put this cartoon in the preface of his PhD dissertation. I decided to do
the same as it indeed conveys the message. Nevertheless, I also would like to highlight
another important point;; The gap between "supply side" of scientific research in the
discipline of non revenue water and "demand side". If you google the term NRW you
would find huge amount of proceedings and materials;; simultaneously, if you search the
same or similar terms in on-line libraries such as scopus , direct science, or springerlink,
you would find very rare published materials. The hope is now big with some cute
review papers trying to link the published knowledge to the conclusions in the field.
However, more attention should be paid in order for this gap to be filled. The first step
might be to bear some unfamiliar new terms and concepts proposed by practitioners of
this field such as the term "non revenue water". This study presents an example for
these terms and concepts. It tried hard to collect briefly the buzzwords that should be
known in order to re-make up the communication between scientific research and non-
revenue water. It presents the key sources in the literature till December, 2010. Then
the study has Sana'a water distribution system as a case study for NRW management. I
apologize for any limitation of this research, though.

VI
TABLE OF CONTENTS
COMMITTEE DECISION ......................................................................... II
DEDICATION ............................................................................................ III
ACKNOWLEDGEMENT .......................................................................... IV
PREFACE .................................................................................................... V
TABLE OF CONTENTS ............................................................................ VI
LIST OF TABLES ...................................................................................... XI
LIST OF FIGURES ................................................................................... XII
LIST OF ABBREVIATIONS .................................................................. XIII
LIST OF EQUATIONS ........................................................................... XIV
LIST OF APPENDIXES ........................................................................... XV
ABSTRACT ............................................................................................. XVI
1. INTRODUCTION
1. 1 Area of Study ....................................................................................... 1 1.1.1 Water Demand Management ..................................................................................... 1
1.1.2 Non-Revenue Water .................................................................................................. 2
1.2 General Background about Yemen ...................................................... 4
1.3 Overview of Sana'a Basin .................................................................... 6
1.4 Overview of Sana'a Domestic Water Supply ...................................... 8 1.4.1 Non-Revenue Water in Sana'a Water Distribution System ....................................... 9
1.5 Problem Statement ................................................................................ 13
1.6 Study importance and Justification.................................................... 14
1.7 Objectives of the study ...................................................................... 16
2. LITERATURE REVIEW
2.1 Addressing Non Revenue Water ....................................................... 18 2.1.1 Attempts and Failures ............................................................................................. 18

VII
2.2 Non-Revenue Water Strategizing ...................................................... 20
2.3 Non-Revenue Water Assessment ...................................................... 22 2.3.1 Top-Down Approach .............................................................................................. 22
2.3.2 Bottom-Up Approach .............................................................................................. 25
2.3.3 A component Base Analysis ................................................................................... 29
2.3.4 Synergetic Approach ............................................................................................... 31
2.4 Monitoring NRW Management ......................................................... 31 2.4.1 Performance Indicators ........................................................................................... 31
2.4.2 Percentage as a Performance Indicator ................................................................... 33
2.4.3 Infrastructure Leakage Index ................................................................................. 34
3. SUGGESTED APPROACH FOR NRW ASSESSMENT
3.1 The Underlying Principle .................................................................. 38
3. 2 The Reverse Approach Equation ....................................................... 38
3. 3 Determining the Components of the Equation .................................. 40 3.3.1 Estimation of Outdoor Use Consumption .............................................................. 41
3.4. Advantages of the Approach ................................................................ 42
3.5. Limitation ............................................................................................. 43
3.6. Feedback ............................................................................................... 43
3.7. Example ................................................................................................ 44
4. NRW ASSESSMENT IN SANA'A WATER UTILITY
4.1 Introduction ........................................................................................ 46
4.2 Research Question ............................................................................. 46
4.3 Research Method ............................................................................... 47 4.3.1 Appropriateness of Applying the Existing Methods ............................................... 47
4.3.2 The Used Methodology .................................................................................................. 50
4.3.3 The Assessment Steps ............................................................................................. 51
4.3.4 Determining Volume of NRW ................................................................................ 51
4.3.5 Estimating Unbilled Authorized Consumption ....................................................... 54
4.3.6 Calculating Volume of Apparent Losses ................................................................ 54
4.3.7 Calculating the real losses ....................................................................................... 63
4.3.8 Using NRW software .............................................................................................. 63
4.4. Results and Discussions ....................................................................... 66
VIII
4.4.1. Volume of Non-Revenue Water .................................................................................... 66
4.4.2. Unbilled Authorized Consumption ............................................................................... 67
4.4.3. Apparent Losses ............................................................................................................ 68
Volume of Apparent Losses .................................................................................................... 74
4.4.4. Volume of Real Losses ................................................................................................. 75
4.4.5. Non-Revenue Water Breakdown .................................................................................. 76
4.4.6 Water Balance for Sana'a Water Distribution System ................................................... 77
4.4.7. Cost of Non Revenue Water ......................................................................................... 78
4.5. Conclusion ............................................................................................ 80 4.5.1. NRW Assessment in Sana'a Water Distribution System .............................................. 80
4.5.2. The Suggested Methodology ......................................................................................... 81
5. CURRENT NRW MANAGEMENT IN SANA'A WATER UTILITY
5.1 Research Questions ............................................................................ 83
5.2 Research Method ............................................................................... 83 5.2.1 Data Collection .............................................................................................................. 84
5.2.2 Field Visits ..................................................................................................................... 85
5.2.3 Interviews ....................................................................................................................... 85
5.3. Results and Discussion ......................................................................... 87 5.3.1. NRW Assessment ......................................................................................................... 87
5.3.2. NRW Breakdown and Performance Indicators ............................................................. 88
5.3.2. Real losses ..................................................................................................................... 88
5.3.2. Apparent losses ............................................................................................................. 89
5.3.3. Other Critical Points ...................................................................................................... 91
5.4. Conclusions .......................................................................................... 92
6. SUGGESTING NRW MANAGEMENT FOR SANA'A WATER UTILITY
6.1. Research Question ................................................................................ 95
6.2. Research Method .................................................................................. 95
6.3. Addressing Real Losses ....................................................................... 95
6.4. Addressing Apparent Losses ................................................................ 96 6.4.1. Sub-Component Analysis for Apparent Losses ............................................................ 96
6.4.2. Social questionnaire ...................................................................................................... 98
6.4.3. Illegal users' questionnaire .......................................................................................... 100

IX
6.5. Results and Discussions ..................................................................... 100 6.5.1. Real Losses Management ............................................................................................ 100
6.5.2. Apparent Losses Management .................................................................................... 103
6.5.3. Causes of Illegal Water Use ........................................................................................ 106
6.6. Conclusions ........................................................................................ 113 6.6.1. Real Losses Management ............................................................................................ 113
6.6.2. Apparent Losses Management .................................................................................... 113
7. NRW MANAGEMENT MONITORING;; PERFORMANCE INDICATORS
7.1 Research Question ........................................................................... 116
7.2 Research Method ............................................................................. 116 7.2.1. Calculating the Average Ground Level ....................................................................... 117
7.3.2. Calculating the Average Pressure ............................................................................... 118
7.3.3. Defining the adjusted UARL ...................................................................................... 120
7.4. Results and discussion........................................................................ 121 ILI- Pressure Manipulation ................................................................................................... 123
7.5. Other NRW Performance Indicators (PIs) ......................................... 125
7.5. Conclusion .......................................................................................... 127 7.5.1 Infrastructure Leakage Index in General ...................................................................... 127
7.5.2 Infrastructure Leakage Index in Sana'a Water Distribution System ............................ 127
8. NRW AWARENESS IN SANA'A WATER UTILITY
8.1. Research Question .............................................................................. 128
8.2. Research Method ................................................................................ 128 8.2.1. Issues to be measured .................................................................................................. 128
8.2.2. Forming a Hypothesis ................................................................................................. 129
8.2.3. Questionnaire Approach.............................................................................................. 130
8.2.4. Questionnaire Design .................................................................................................. 131
8.2.5. Questions Groups ........................................................................................................ 132
8.2.6. Informed Consent and Confidentiality ........................................................................ 134
8.2.7. Population (Target Group) .......................................................................................... 134
8.2.8. Sample Size ................................................................................................................. 134
8.2.9. Sample Method ........................................................................................................... 136
8.2.10. Questionnaire Analysis ............................................................................................. 138
X
8.3. Results ................................................................................................ 139 8.3.1. Sample characteristics ................................................................................................. 139
8.3.2. The first part of the hypothesis .................................................................................... 141
8.3.3. The second part of the hypothesis ............................................................................... 141
8.3.4. The third part of the hypothesis .................................................................................. 142
8.3.5. The final result ............................................................................................................ 146
8.4. Conclusion .......................................................................................... 146
9. CONCLUSIONS
9.1. Volume of NRW ................................................................................ 147
9.2. Cost of NRW ...................................................................................... 148
9.3. The Dominant Component ................................................................. 148
9.4. Volume of Illegal Use ........................................................................ 148
9.5. Verification......................................................................................... 149
9.6. Causes of Illegal Use .......................................................................... 150
9.7. Current NRW Management ............................................................... 151
9.8. NRW Management Monitoring ......................................................... 151
9.9. NRW Awareness ................................................................................ 152
9.10. The Used Approaches ...................................................................... 152 9.10.1. The Suggested Approach;; The Reveres Approach ................................................... 152
9.10.2. Likert Scale ............................................................................................................... 153
10. RECOMMENDATIONS
10.1. Non Revenue Management in Sana'a Water Utility ........................ 155 10.1.1. NRW Assessment ..................................................................................................... 155
10.1.2. Real Loss Management ............................................................................................. 155
10.1.3. Apparent Loss Management ..................................................................................... 156
10.1.4. NRW Management Monitoring ................................................................................ 157
10.1.5. Other.......................................................................................................................... 158
10.2. For Scientific Research .................................................................... 159
References ................................................................................................. 160
Appendices ................................................................................................ 167
Annex 1: DECLARATION....................................................................... 195
Annex 2: ABSTRACT IN ARABIC ......................................................... 196
XI
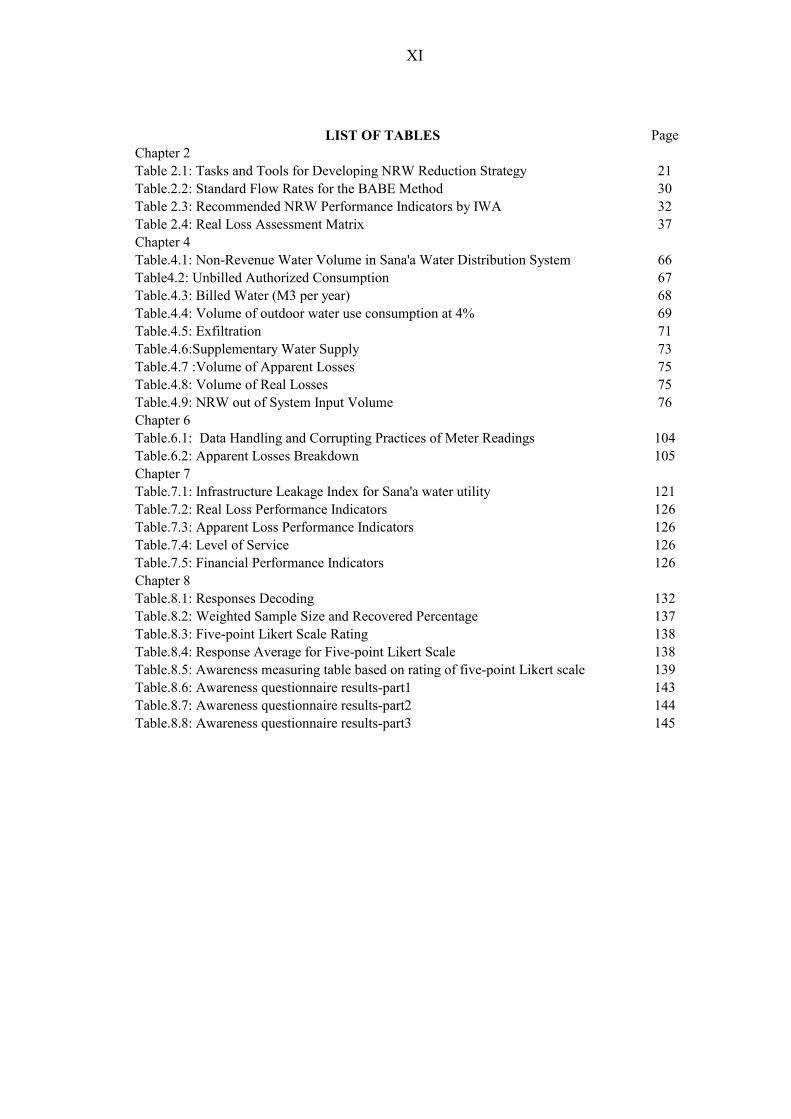
LIST OF TABLES
LIST OF TABLES PageChapter 2Table 2.1: Tasks and Tools for Developing NRW Reduction Strategy 21Table.2.2: Standard Flow Rates for the BABE Method 30Table 2.3: Recommended NRW Performance Indicators by IWA 32Table 2.4: Real Loss Assessment Matrix 37Chapter 4Table.4.1: Non-Revenue Water Volume in Sana'a Water Distribution System 66Table4.2: Unbilled Authorized Consumption 67Table.4.3: Billed Water (M3 per year) 68Table.4.4: Volume of outdoor water use consumption at 4% 69Table.4.5: Exfiltration 71Table.4.6:Supplementary Water Supply 73Table.4.7 :Volume of Apparent Losses 75Table.4.8: Volume of Real Losses 75Table.4.9: NRW out of System Input Volume 76Chapter 6Table.6.1: Data Handling and Corrupting Practices of Meter Readings 104Table.6.2: Apparent Losses Breakdown 105Chapter 7Table.7.1: Infrastructure Leakage Index for Sana'a water utility 121Table.7.2: Real Loss Performance Indicators 126Table.7.3: Apparent Loss Performance Indicators 126Table.7.4: Level of Service 126Table.7.5: Financial Performance Indicators 126Chapter 8Table.8.1: Responses Decoding 132Table.8.2: Weighted Sample Size and Recovered Percentage 137Table.8.3: Five-point Likert Scale Rating 138Table.8.4: Response Average for Five-point Likert Scale 138Table.8.5: Awareness measuring table based on rating of five-point Likert scale 139Table.8.6: Awareness questionnaire results-part1 143Table.8.7: Awareness questionnaire results-part2 144Table.8.8: Awareness questionnaire results-part3 145
XII
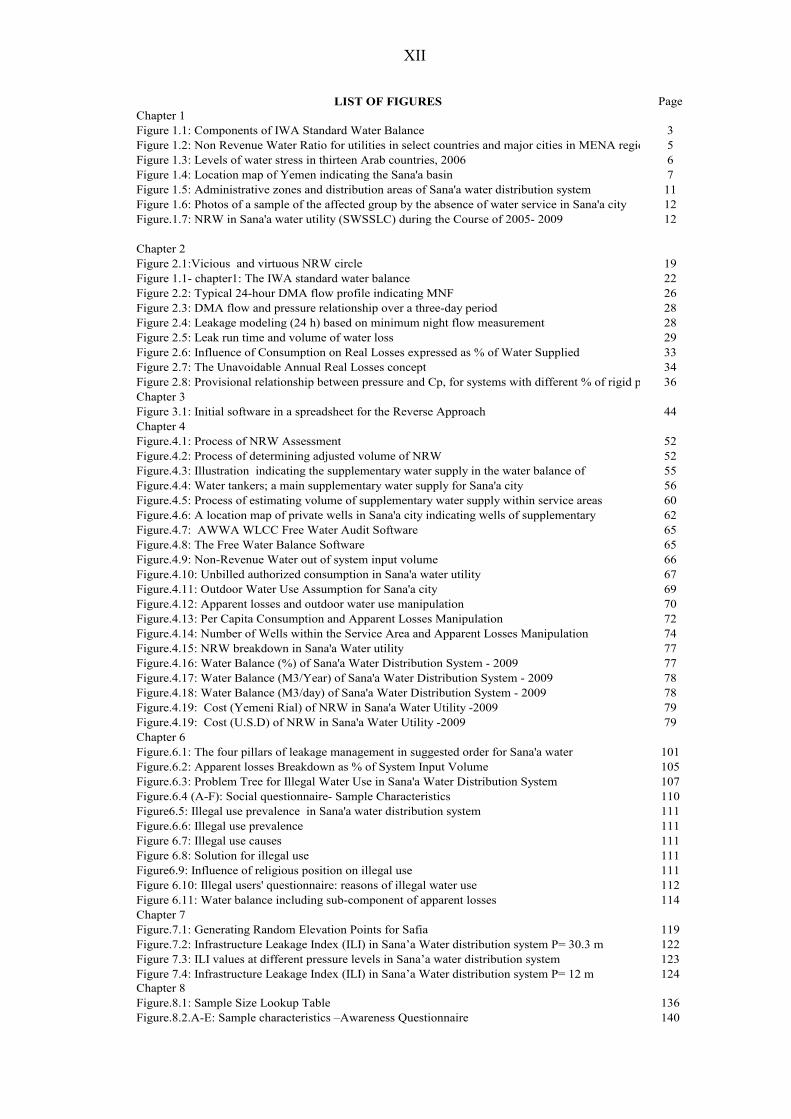
LIST OF FIGURES LIST OF FIGURES
LIST OF FIGURES PageChapter 1Figure 1.1: Components of IWA Standard Water Balance 3Figure 1.2: Non Revenue Water Ratio for utilities in select countries and major cities in MENA region 5Figure 1.3: Levels of water stress in thirteen Arab countries, 2006 6Figure 1.4: Location map of Yemen indicating the Sana'a basin 7Figure 1.5: Administrative zones and distribution areas of Sana'a water distribution system 11Figure 1.6: Photos of a sample of the affected group by the absence of water service in Sana'a city 12Figure.1.7: NRW in Sana'a water utility (SWSSLC) during the Course of 2005- 2009 12
Chapter 2Figure 2.1:Vicious and virtuous NRW circle 19Figure 1.1- chapter1: The IWA standard water balance 22Figure 2.2: Typical 24-hour DMA flow profile indicating MNF 26Figure 2.3: DMA flow and pressure relationship over a three-day period 28Figure 2.4: Leakage modeling (24 h) based on minimum night flow measurement 28Figure 2.5: Leak run time and volume of water loss 29Figure 2.6: Influence of Consumption on Real Losses expressed as % of Water Supplied 33Figure 2.7: The Unavoidable Annual Real Losses concept 34Figure 2.8: Provisional relationship between pressure and Cp, for systems with different % of rigid pipes 36Chapter 3Figure 3.1: Initial software in a spreadsheet for the Reverse Approach 44Chapter 4Figure.4.1: Process of NRW Assessment 52Figure.4.2: Process of determining adjusted volume of NRW 52Figure.4.3: Illustration indicating the supplementary water supply in the water balance of 55Figure.4.4: Water tankers;; a main supplementary water supply for Sana'a city 56Figure.4.5: Process of estimating volume of supplementary water supply within service areas 60Figure.4.6: A location map of private wells in Sana'a city indicating wells of supplementary 62Figure.4.7: AWWA WLCC Free Water Audit Software 65Figure.4.8: The Free Water Balance Software 65Figure.4.9: Non-Revenue Water out of system input volume 66Figure.4.10: Unbilled authorized consumption in Sana'a water utility 67Figure.4.11: Outdoor Water Use Assumption for Sana'a city 69Figure.4.12: Apparent losses and outdoor water use manipulation 70Figure.4.13: Per Capita Consumption and Apparent Losses Manipulation 72Figure.4.14: Number of Wells within the Service Area and Apparent Losses Manipulation 74Figure.4.15: NRW breakdown in Sana'a Water utility 77Figure.4.16: Water Balance (%) of Sana'a Water Distribution System - 2009 77Figure.4.17: Water Balance (M3/Year) of Sana'a Water Distribution System - 2009 78Figure.4.18: Water Balance (M3/day) of Sana'a Water Distribution System - 2009 78Figure.4.19: Cost (Yemeni Rial) of NRW in Sana'a Water Utility -2009 79Figure.4.19: Cost (U.S.D) of NRW in Sana'a Water Utility -2009 79Chapter 6Figure.6.1: The four pillars of leakage management in suggested order for Sana'a water 101Figure.6.2: Apparent losses Breakdown as % of System Input Volume 105Figure.6.3: Problem Tree for Illegal Water Use in Sana'a Water Distribution System 107Figure.6.4 (A-F): Social questionnaire- Sample Characteristics 110Figure6.5: Illegal use prevalence in Sana'a water distribution system 111Figure.6.6: Illegal use prevalence 111Figure 6.7: Illegal use causes 111Figure 6.8: Solution for illegal use 111Figure6.9: Influence of religious position on illegal use 111Figure 6.10: Illegal users' questionnaire: reasons of illegal water use 112Figure 6.11: Water balance including sub-component of apparent losses 114Chapter 7Figure.7.1: Generating Random Elevation Points for Safia 119Figure.7.2: Infrastructure Leakage Index (ILI) = 30.3 m 122
123124
Chapter 8Figure.8.1: Sample Size Lookup Table 136
140

XIII
LIST OF APPREVIATIONS
AWWA: American Water Work Association AZP: Average Zone Point BABE: Burst And Background Estimates BCM: Billion Cubic MetersDCMMS: Data Center Maintenance and Management SoftwareDEM: Digital Elevation Model DMA: District Metered Area EPA: United States Environmental Protection Agency FAVAD: Fixed and Variable Area Discharges GTZ: German Agency for Technical Cooperation HDI: Human Development Index HZM: Hour Zone Measurement ILI: Infrastructure Leakage Index IWA: International Water Association JICA: Japan International Cooperation Agency Masl: Meter above sea level MCM: Million Cubic MeterMENA: Middle East and North Africa MNF: Minimum Night Flow MWE: Ministry of Water and Environment NRW: Non-Revenue Water NWRA: National Water Resources Authority NWSA: National Water Supply Authority PIIS;; Performance Indicators Information System PIs: Performance Indicators SWSLC: Sana'a Water Supply and Sanitation Local Corporation UFW: Unaccounted For Water UNDP: United Nations Development Program W.S.P.: when the system is pressurizedWHO: World Health Organization WWTP: Waste Water Treatment Plant Y.R.: Yemeni Rial24/7: Continuous Supply
LIST OF ABBREVIATIONS OR SYMBOLS

XIV
LIST OF EQUATIONS
LIST OF EQUATIONS PageChapter 2Equation 2.1: Pressure Leakage Relationship 27Equation 2.2: Infrastructure Leakage Index 35Equation 2.3: Unavoidable Annual Real Losses 35Equation 2.4: Modified UARL 36Chapter 3Equation 3.1: None Revenue water 1 39Equation 3.2: Non Revenue Water 2 39Equation 3.3: Produced water 39Equation 3.4: Non Revenue water 3 39Equation 3.5: The Reserve Approach Equation 39Equation 3. 6: Exfiltration - Infiltration 40Chapter 4Equation 4.1: The adjusted reverse approach equation for Sana'a case 55Equation 4.2: Rate of consumption per service connection 57Equation 4.3: Billed consumption for wastewater connections 57Chapter 7Equation 7.1: Adjusted UARL for low pressure systems 116

XV
LIST OF APPENDIXES
LIST OF APPENDIXES Page
Appendix.1: Average length of customer service Line (Lp) 168
Appendix.2: List of interviewees 169
Appendix.3: Current Non-Revenue Water Management in Sana'a Water Utility 171
Appendix.4: Social questionnaire 178
Appendix.5: Illegal water users' questionnaire 184
Appendix.6: Estimating data handling errors in Sana'a water utility 186Appendix.7: Problem analysis for apparent losses in Sana'a water distribution system
188
Appendix.8: Results of illegal users' questionnaire 189
Appendix.9: NRW awareness questionnaire for measuring NRW awareness 190
Annex.1: Abstract in Arabic 196
Annex 2: Declaration 197
XVI
NON-REVENUE MANAGEMENT IN SANA'A WATER DISTRIBUTION SYSTEM
By
Taha M. Al-Washali
Supervisor Dr. Abbas AL-Omari, Prof
Co- Supervisor
Dr. Lars Ribbe, Prof
ABSTRACT
Without proper Non-Revenue Water (NRW) management, Sana'a water utility is not able to sustain its services or cover all population in Sana'a city with water service. This study aims at assessing the quantity, supply management options, and measure awareness of NRW in Sana'a water utility. For measuring the awareness level, interviews, report analysis and awareness questionnaire with opinion questions in form of statements with five point Likert scale were conducted. Assessing NRW components involved a review of the existing methods and their applicability for the case of Sana'a water distribution system, and then, a suggested novel methodology, the reveres approach, has been developed, introduced, and implemented. For suggesting sound management options in Sana'a water distribution system, besides the interviews, literature review, social questionnaire, illegal users' questionnaire, and problem analysis have been carried out.
The study found that volume of NRW in Sana'a water distribution system made up 38.75% of system input volume of which 26.57% is apparent losses;; 11.67% is real losses;; and 0.51% is unbilled authorized consumption. Further analysis showed that unauthorized consumption stands for 50% of NRW volume and its main causes are poor customer- utility relation and lack of monitoring measures. Although results showed that leaks make up more than 5% of Sana'a basin safe yield, no much is expected to be reduced till the utility apply zoning principle for its network. This in turn is beyond the capacity of the utility. In consequence, the study recommended optimizing the speed and quality of repairs for reported leaks and involving the private sector to supply the right technology for achieving zoning in the network. For apparent loss reduction, the study recommended working on enhancing the customer-utility relation, customer confidence on the utility, monitoring measures, and the utility employees' commitment. For improved NRW management, the study suggested assessing NRW and drawing water balance annually, and getting use of the free NRW softwares with their associated performance indicators to allow better NRW monitoring.
Keywords
Non revenue water management - apparent losses real losses - Sana'a
1
Chapter 1 Introduction
1. 1 Area of Study
1.1.1 Water Demand Management
Water demand is rapidly increasing due to population growth, urbanization, economic
development, and climate change (Cosgrove and Rijsberman, 2000). The potential
responses to this increasing demand are either meeting the new demand with new
resources (supply-side) or managing the consumptive demand to avoid the need of
developing new resources (demand-side) (Butler and Memon, 2006).
The traditional approaches of resource development are considered as unsustainable. In
contrast, the demand management, through Water Demand Management (WDM), is
considered sustainable. It provides a proper solution to the water scarcity problem
through shifting the responses from the traditional resource development to that of
demand-oriented management (Marunga, et al., 2006).
Water Demand Management views water use as a demand that can be adjusted through
various policy and technical means (Tsinde Development Consultants, 2001). The main
purpose of water demand management is to meet any of the following objectives:
economic efficiency, social development, social equity, environmental protection,
2
sustainability of water supply and services, and political acceptability (Department of
Water Affairs and Forestry, 2004).
Water demand management is defined as a management approach that aims to conserve
water by controlling demand through the application of measures such as regulatory,
technological, economical and social at all spatial and institutional levels" (IUCN, 2002
as in Marunga, et al., 2006). Another proposed operational definition for water demand
management contains five main components (1) reducing the quantity or quality of
water required to accomplish a specific task, (2) adjusting the nature of the task so it can
be accomplished with less water or lower quality water, (3) reducing losses in
movement from source through use to disposal, (4) shifting time of use to off-peak
periods, and (5) increasing the ability of the system to operate during drought seasons
(Brooks, 2006).
Consequently, water loss reduction is a component of water demand management which
one of its aims is reducing the losses and improving the distribution efficiency of water
distribution systems (Marunga, et al., 2006).
1.1.2 Non-Revenue Water
Non-Revenue Water (NRW) is a term used to express the quantity of lost water within
the distribution systems besides the amount of water that is authorized to use but not
billed (such as the amount of water used for firefighting). The term Non-Revenue Water
International Water Association (IWA) (Farley and Trow, 2007), and as recommended
by American Water Work Association (AWWA) and Environmental Protection Agency
(EPA) (EPA, 2009).
The use of the
IWA, because of widely varying interpretations of the term worldwide on one hand and
3
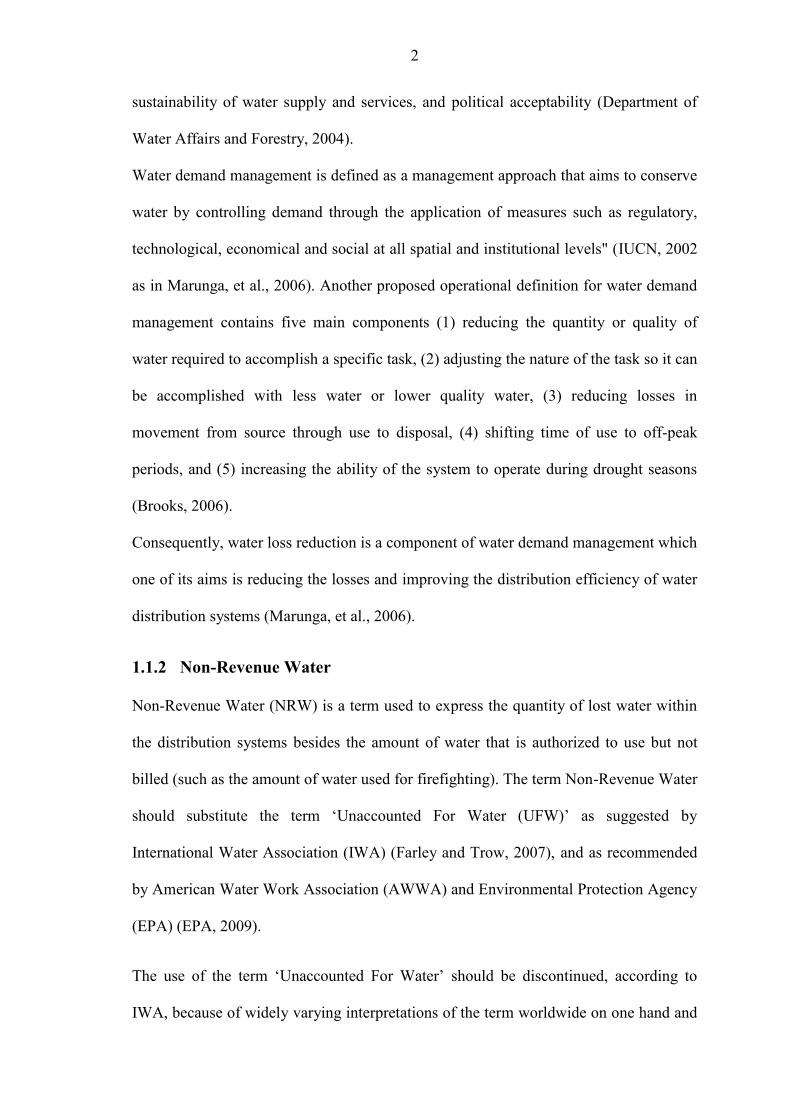
Figure 1.1.a & b: Components of IWA Standard Water Balance. Source: a: Farley and Trow (2007), b: Halfawy and Hunaidi (2008)
for that all components of the water balance should be accounted for on the other hand
(Alegre, et al., 2000 as cited in Lambert, 2003), and Farley and Trow, (2007). Instead,
IWA has recommended a new international standard water balance for water losses
using the term Non-Revenue Water (Figure 1.1). It clearly defines all the terms involved
with the suggested water balance including the term Non-Revenue Water.
Unlike Unaccounted For Water which is water losses in Figure 1.1, Non-Revenue
Water (NRW) is the difference between the amount of water put into the distribution
system and that billed to consumers (Farley and Trow, 2007). It comprises three
components;; real (physical) losses, apparent (commercial) losses, and unbilled
authorized consumption (Kingdom et al, 2006). The first two components are of
(a)
(b)
4
substantial proportion in NRW while unbilled authorized consumption is usually a small
proportion especially in utilities of high NRW. Figure 1.1 illustrates the three
components of NRW apparent losses, real losses, and unbilled authorized consumption.
1.1.2.1 Global Level of NRW
The global level of NRW is very high. The average percentage of the global NRW is
estimated at 35% (Ranhill and USAID, 2008). Further, the global volume of NRW is
48.6 Billion Cubic Meter (BCM) per Year of which 32.7 BCM is real (physical) losses
(Kingdom, et al., 2006). Additionally to water wastage of this amount, this costs water
utilities worldwide US$14 billion a year. Accordingly, saving half of this amount could
provide water service to an additional 100 million people without further investments
(Ranhill and USAID, 2008 and Kingdom, et al., 2006).
1.1.2.2 NRW in MENA Region
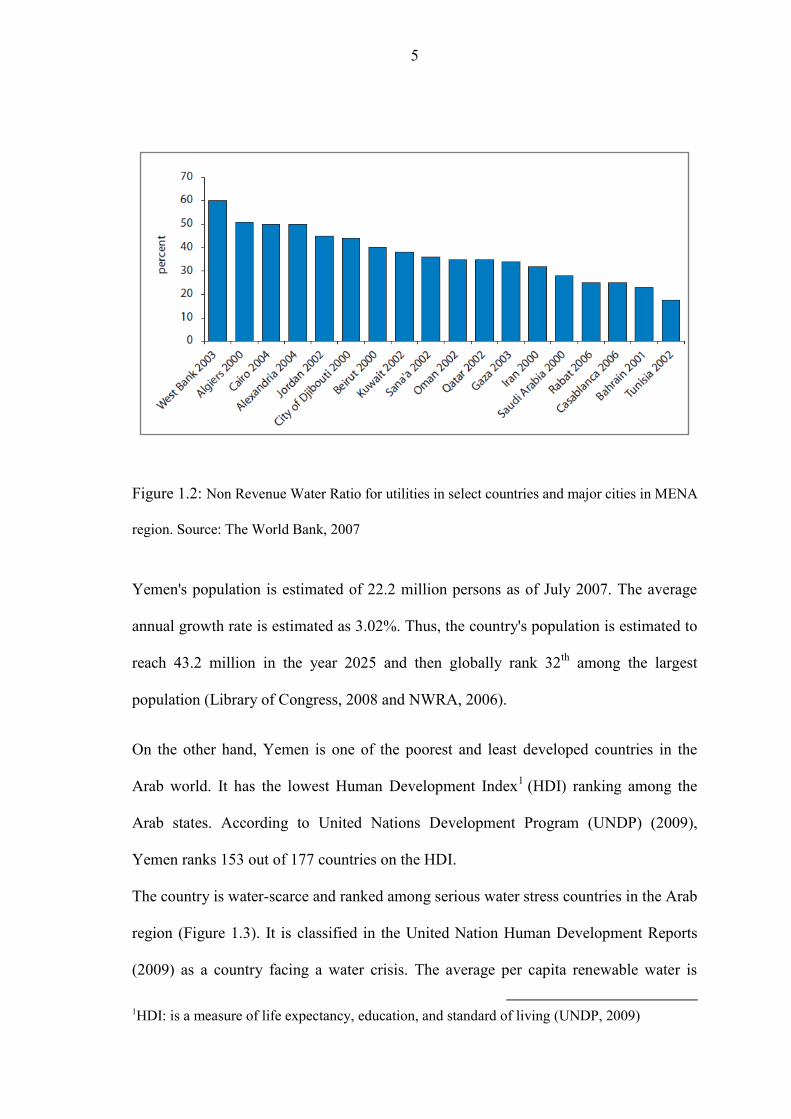
Non-Revenue Water level in the Middle East and North Africa (MENA) is close to the
global one ranging from 15% to 60% with an average of 38%. Figure 1.2 shows the
NRW level of select countries and some major cities in the MENA region (The World
Bank, 2009).
1.2 General Background about Yemen
This study is carried out on the public water distribution system in Sana'a city;; the
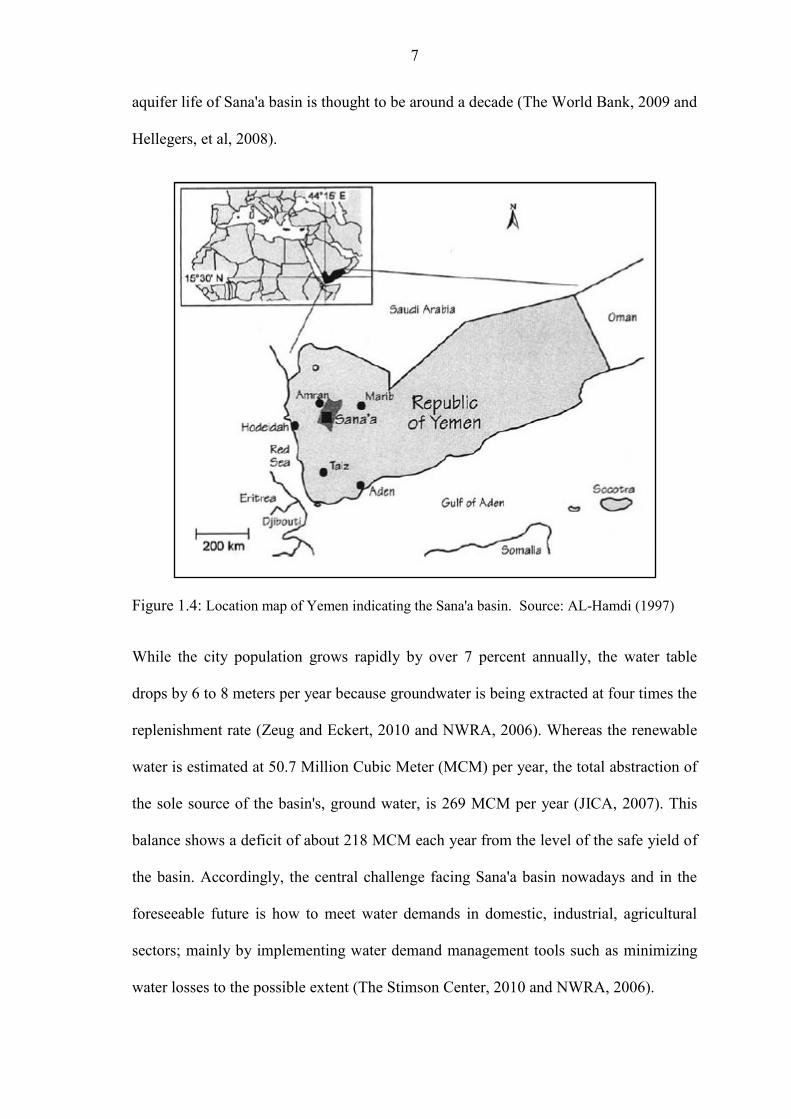
capital of Republic of Yemen. Yemen is located at the southern tip of Arabian Peninsula
(Figure 1.4). The country area size is 528,000 km2;; It is classified as the 49th largest
countries in the World (NWRA, 2006). The climate of Yemen has a predominantly
semi-arid to arid climate with an average precipitation of 130 mm per year (Library of
Congress, 2008 and Al-Kirshi and Abbas, 1998).
5
Figure 1.2: Non Revenue Water Ratio for utilities in select countries and major cities in MENA
region. Source: The World Bank, 2007
Yemen's population is estimated of 22.2 million persons as of July 2007. The average
annual growth rate is estimated as 3.02%. Thus, the country's population is estimated to
reach 43.2 million in the year 2025 and then globally rank 32th among the largest
population (Library of Congress, 2008 and NWRA, 2006).
On the other hand, Yemen is one of the poorest and least developed countries in the
Arab world. It has the lowest Human Development Index1 (HDI) ranking among the
Arab states. According to United Nations Development Program (UNDP) (2009),
Yemen ranks 153 out of 177 countries on the HDI.
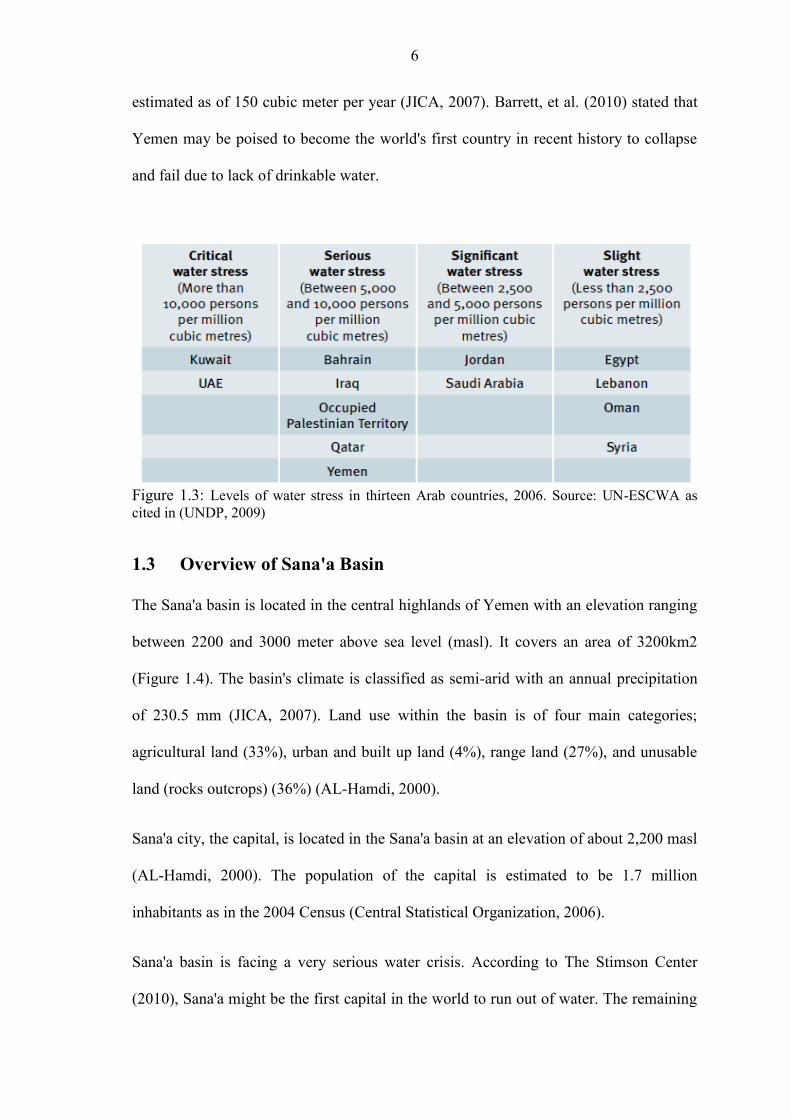
The country is water-scarce and ranked among serious water stress countries in the Arab
region (Figure 1.3). It is classified in the United Nation Human Development Reports
(2009) as a country facing a water crisis. The average per capita renewable water is
1HDI: is a measure of life expectancy, education, and standard of living (UNDP, 2009)
6
estimated as of 150 cubic meter per year (JICA, 2007). Barrett, et al. (2010) stated that
Yemen may be poised to become the world's first country in recent history to collapse
and fail due to lack of drinkable water.
Figure 1.3: Levels of water stress in thirteen Arab countries, 2006. Source: UN-ESCWA as cited in (UNDP, 2009)
1.3 Overview of Sana'a Basin
The Sana'a basin is located in the central highlands of Yemen with an elevation ranging
between 2200 and 3000 meter above sea level (masl). It covers an area of 3200km2
(Figure 1.4). The basin's climate is classified as semi-arid with an annual precipitation
of 230.5 mm (JICA, 2007). Land use within the basin is of four main categories;;
agricultural land (33%), urban and built up land (4%), range land (27%), and unusable
land (rocks outcrops) (36%) (AL-Hamdi, 2000).
Sana'a city, the capital, is located in the Sana'a basin at an elevation of about 2,200 masl
(AL-Hamdi, 2000). The population of the capital is estimated to be 1.7 million
inhabitants as in the 2004 Census (Central Statistical Organization, 2006).
Sana'a basin is facing a very serious water crisis. According to The Stimson Center
(2010), Sana'a might be the first capital in the world to run out of water. The remaining
7
aquifer life of Sana'a basin is thought to be around a decade (The World Bank, 2009 and
Hellegers, et al, 2008).
While the city population grows rapidly by over 7 percent annually, the water table
drops by 6 to 8 meters per year because groundwater is being extracted at four times the
replenishment rate (Zeug and Eckert, 2010 and NWRA, 2006). Whereas the renewable
water is estimated at 50.7 Million Cubic Meter (MCM) per year, the total abstraction of
the sole source of the basin's, ground water, is 269 MCM per year (JICA, 2007). This
balance shows a deficit of about 218 MCM each year from the level of the safe yield of
the basin. Accordingly, the central challenge facing Sana'a basin nowadays and in the
foreseeable future is how to meet water demands in domestic, industrial, agricultural
sectors;; mainly by implementing water demand management tools such as minimizing
water losses to the possible extent (The Stimson Center, 2010 and NWRA, 2006).
Figure 1.4: Location map of Yemen indicating the Sana'a basin. Source: AL-Hamdi (1997)
8
1.4 Overview of Sana'a Domestic Water Supply
Before the early 1970s, the major source of domestic water supply for Sana'a city was
from hand dug wells located within the old town. The first water supply system was a
small system installed in 1964 with only six hand-dug wells. In 1974, the National
Water Supply Authority (NWSA) took over the responsibility of water supply
throughout the country (GTZ, 2009 and Harza, 2006).
NWSA has its own identity with financial and administrative independence.
Consequently, the whole water supply systems in the country were over-centralized
through NWSA which, in turn, was under the capacity of the Ministry of Electricity and
Water (GTZ, 2009).
In 2000, a decentralization process has been started, and the Sana'a Water Supply and
Sanitation Local Corporation (SWSLC) was created (GTZ, 2009).Back then, Sana'a
Water Utility, SWSLC, took over the responsibility of water supply in Sana'a city
(Ministry of Legal Affairs, 2000).
Currently, Sana'a water utility, SWSLC, covers about 55% of the city population with
the water service. The rest of the city is covered by the private sector through some
separate private agencies;; namely, the water tankers, and small private wells with small
distribution networks (The World Bank, 2009).
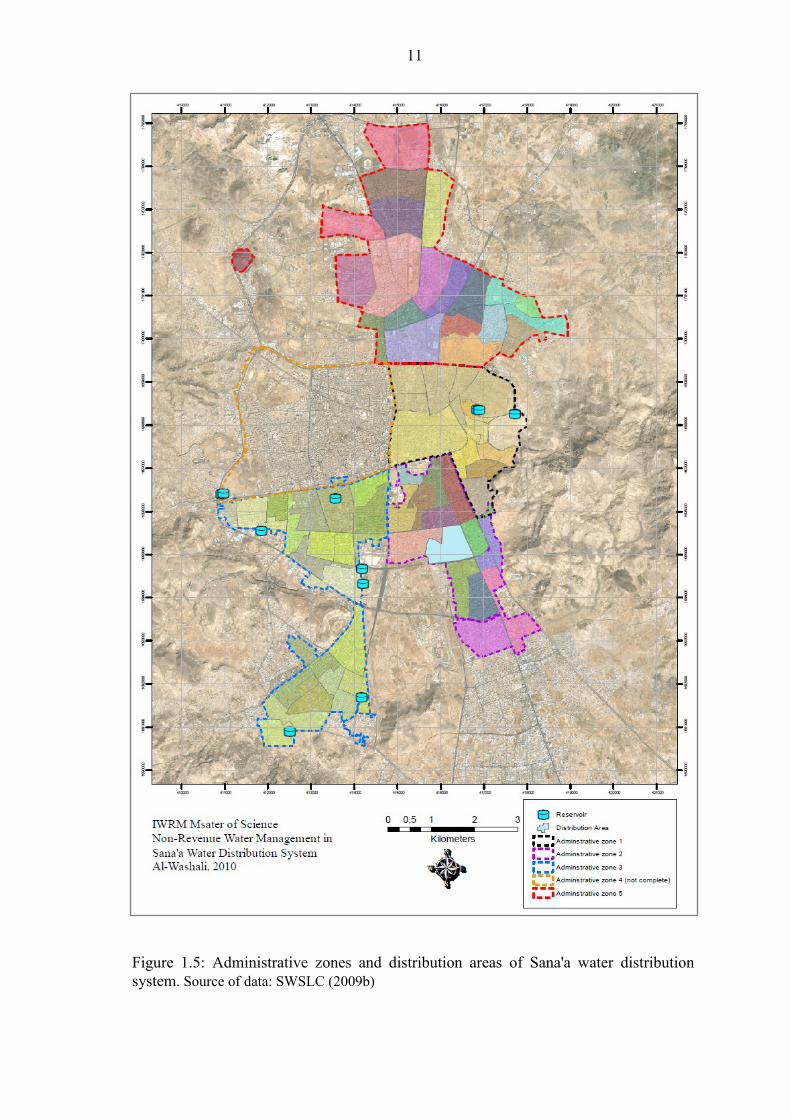
On the other hand, Sana'a water network is very old. Since its start in the 1960s, the
network expanded randomly and five administrative zones in the system were defined
geographically with interlocked networks accompanied with shared water feeding
sources (Figure 1.5). Due to dwindling of water resources in the city, age of the
network, and intermittent supply, operational fatigue in the network accelerate the
depreciation of the network and cause increasing of leakages in the network.

9
Sana'a water utility, SWSLC, faces a lot of challenges, and difficulties in covering and
providing the water service. The main challenge counters Sana'a water utility is to
handle the rapid population growth and the city expansion (Harza, 2006) since Sana'a
city expands rapidly with an annual population growth rate of 7.12% (Zeug and Eckert,
2010). In contrast, a report of Harza (2006) highlights that main deficiency of Sana'a
water system includes but not limited to the following points:
Shortage in supply that necessitates a rationing program
Unplanned network expansion
Impacts of intermittent supply that consists of network deterioration, prolonged
periods of negative pressures accompanied by water quality deterioration, and
inadequate pressure in some parts of the network.
Accordingly, Sana'a water distribution system has deficiency in water quality, water
quantity, and pressures in the network, and therefore, a deficiency in the general level of
service for the current 55% served people of the city's population.
Contrariwise, there are still some specific groups in the other 45% of the city's
population that should but not be served by Sana'a water utility (Ministry of Legal
Affairs, 2000). Those have other types of problems in having an access to safe and
potable water. GTZ (2009, Page 7) highlights that "the access to water in Yemeni urban
areas in general is a silent crisis experienced by all, particularly the poor, and tolerated
by those who have means." Figure 1.6 is photos showing that poor are the main affected
group by the absence of water service in Sana'a city.
1.4.1 Non-Revenue Water in Sana'a Water Distribution System
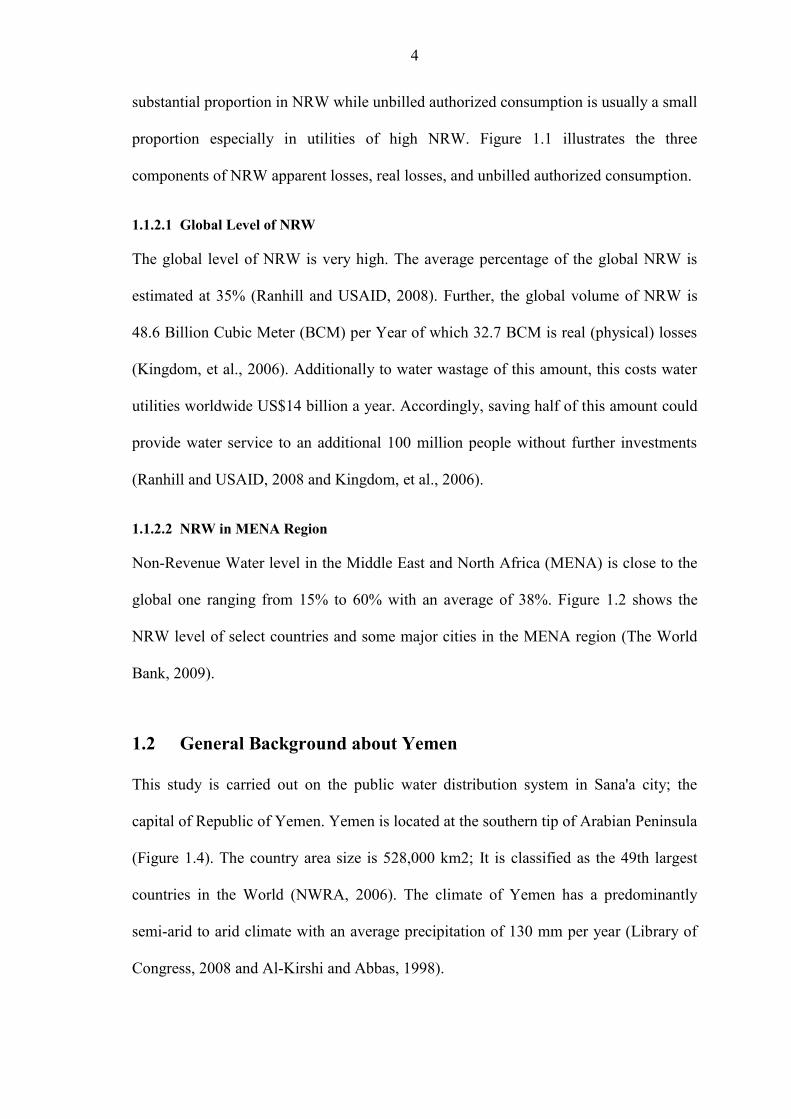
According to the production and belling data of Sana water utility, SWSLC, (2005-
2009), the average annual production of Sana'a water distribution system is 23 MCM

10
per year with an average Non-Revenue Water of 38% (Figure 1.7). Accordingly, an
average of 8.8 MCM per year is NRW of which 50% is physical losses (real losses) and
50% is administrative losses (apparent losses) as expected by Sana'a water utility
(SWSLC, 2009b). Hence, the total NRW for the period 2005-2009 is 53 MCM of which
26 MCM is expected to be physical (real) losses.
The annual cost of NRW is high. The average current domestic tariff in Sana water
utility is 139 YR. ($0.65 as in December 2010), and the production cost per cubic meter
is 69.44 YR. ($0.32) (SWSLC, 2010). Taking into consideration that apparent losses
should have the price of water, and real losses should have the cost of water and with
the assumption of SWSLC that half of the losses are apparent and the other half are real
losses, the cost of the average NRW in Sana water utility, SWSLC, is 916 Million YR.
each year ($4.3 Million) with a total of 5.5 Billion YR ($25.6 Million) for the period
from 2005-2009.
11
Figure 1.5: Administrative zones and distribution areas of Sana'a water distribution system. Source of data: SWSLC (2009b)

12
0.0
10.0
20.0
30.0
40.0
50.0
2005 2006 2007 2008 2009
NRW in Sana'a Water Utility (SWSSLC) during the Course of 2005- 2009
NRW% in Sana'a Water Supply and Sanitation Local Corporation
Figure 1.6: Photos of a sample of the affected group by the absence of water service in Sana'a city. Photo: Lena Hauck
Figure 1.7: NRW in Sana'a water utility (SWSLC) during the Course of 2005- 2009. Source of data: SWSLC (2005- 2009)

13
1.5 Problem Statement
Non-Revenue Water's assessment and management in Sana'a water distribution system
affect explicitly the sustainability of the water service in the city and implicitly the
scarce water resources in the basin.
In Sana'a basin, with a remaining aquifer life around a decade (The World Bank, 2009
and Hellegers, et al, 2008), the average NRW in Sana'a water utility is 8.8 MCM per
year. Thus, a proportion of 4.4 MCM of NRW is estimated to be leakages from the
water network annually (SWSLC, 2005-2009). Hence, with the safe yield of 50.7 MCM
for Sana'a basin (JICA, 2007), the current NRW and leakages proportion of the safe
yield of the basin stands at 17.4% and 8.7% successively. Furthermore, if Sana'a water
utility, SWSLC, achieves its forth Five-Year Plan for Poverty Alleviation (2010), the
utility should sustain 55% of the service coverage. If so, the utility should manage to
produce 45 MCM per year. In such a scenario, NRW and leakages from the network
with the current average NRW percentage of 38% is estimated at 17.1 and 8.6 MCM per
year respectively (SWSLC, 2009b and 2010b). As a result, NRW and water leakages
from the network would be 34% and 17% of the basin safe yield successively.
On the other hand, in Sana'a city, with an annual growth rate of 7% (Zeug and Eckert,
2010) and a water service coverage percentage of only 55% (The World Bank, 2009),
Sana'a water utility, has general deficiency in its level of service;; particularly water
quality, water quantity, and pressures in the network (Harza, 2006). In such a context,
NRW costs Sana'a water utility 916 Million YR. ($4.3 Million) each year.
Consequently, NRW exacerbate the financial and subsequently the technical capabilities
of the utility (SWSLC, 2005-2009 and 2010). As a result, a further lowering in the level
of service due to NRW level is likely to take place.
14
In addition, among the other 45% of the city's population that should but not be served
by Sana'a water utility (The World Bank, 2009 and Ministry of Legal Affairs, 2000),
poor are the main affected segment by the absence of the water service (GTZ, 2009).
1.6 Study importance and Justification
In reference to the above- mentioned context of NRW problem in Sana'a water
distribution system, if an efficient NRW management is supplied, the following results
could be achieved:
At the environmental level:
A significant amount of water would be saved. This contributes to prolong the life of
the basin and, therefore, participates in Sana'a basin's continuity and sustainability by
preventing water wastage of an amount of about 8%-17% of the basin's safe yield.
Besides, it minimizes the gap between water demand and water supply in Sana'a basin
in general where there is a potential of service expansion.
At the economic level:
NRW management and reduction would save a considerable amount and cost of either
desalinated and/or transported water to Sana'a city according to some future scenarios of
water supply in the city (Sufian, et al., 2006).
At the utility level:
o Financial benifits: Sana'a water utility, SWSLC, should gain an access to further
revenues in self-generated cash flow by means of reducing the production and
operation costs;; via producing less water with the saved water to meet the same
demand. In consequence, it guarantees an access to further capital investments,
15
maintenance budget, and employees' incentives that have a positive impact on
the level of service in general.
o Technical merits: it contributes to more stable supply system which extends the
operational age of the network.
o Institutional: it improves the customers service and reduce customer complaints.
At the societal level:
o Proper NRW management could save substantial amount of NRW, and as a
result, further considerable proportion of the city population shall be covered
with the water service. As far as 326.5 thousand further people could be served
with water in the current production pattern as the allocated proportion of water
per each customer and individual consumer is 480 L/day and 37 L/day
respectively (SWSLC, 2009b). Thus, pro-poor water network expansion could
be prioritized in order to mitigate the impact of the absence of the water service
on the poor segments of Sana'a population.
o NRW management creates fairness and equity of service among users by means
of reducing illegal connections and simultaneously providing the same quality of
service for all users since leakages affect the quantity, pressure and quality of the
water service.
On the other hand, taking into consideration these dimensions of NRW management,
this research tackles the issue of NRW assessment and management in Sana'a water
distribution system and potential advantage would be:
The findings of this research shall help SWSLC to get a deeper understanding of
NRW and the breakdown of its components.

16
The study would encourage developing a real model of NRW assessment, control,
reduction, and management for the water distribution network in Sana'a water utility;;
SWSLC.
NRW reduction policies and management options should be suggested in the study in
order for Sana'a Water utility, SWSLC, to confront the high percentage of NRW in the
network.
A new International Water Association (IWA) performance Indicator for the physical
losses;; Infrastructure Leakage Index (ILI) will be introduced first time to the country in
general and particularly in Sana'a water utility to allow the comparison of management
practices of Sana'a water utility, SWSLC, against NRW with other water utilities in
Yemen and other countries in the region.
The research will contribute to a recent project sponsored by German Agency for
Technical Cooperation (GTZ) dealing with NRW as a part of operation and
maintenance technical assistance program in Sana'a Water utility;; SWSLC.
1.7 Objectives of the study
The objective of this study is to identify the current NRW assessment methods and
management policies adopted by Sana'a water utility;; SWSLC. Thus, an investigation
whether the current NRW management is proactive or reactive in Sana'a water utility
will be carried out. Besides, NRW awareness shall be measured among the subjective
employees in the NRW-related departments in Sana'a water utility. Afterward, the study
aims at identifying NRW volume and breakdown its components (apparent losses, real
losses, and unbilled authorized consumption) with respect to water distribution system
of Sana'a water utility. And finally, NRW components' prioritization shall be made and
management recommendations should be suggested.
17
In addition, a special focus of an International Water Association "best practice"
performance indicator (ILI) will be paid. Accordingly, Infrastructure Leakage Index
shall be defined and highlighted for Sana'a water distribution network among other
NRW performance indicators. Doing so would introduce and familiarize ILI's
application in Yemen as a physical losses performance indicator recommended by the
World Bank, American Water Work Association, Environmental Protection Agency and
International Water Association (Kingdom et al, 2006, Ranhill and USAID, 2008 and
EPA, 2009).
Therefore, the research questions are:
At what level is the current awareness level of NRW issues of the employees of the
NRW-related departments in Sana'a water utility;; in its different managerial and
operational levels?
unbilled authorized consumption of its water distribution system?
adopted by Sana'a
water utility?
losses, and unbilled authorized consumption for Sana'a water distribution system?
the water distribution
system in Sana'a water utility?
and performance indicators should be suitable for
the context of Sana'a water utility?
On top of that, this research tries to introduce a suggested novel methodology for NRW
assessment and component break down in general.

18
Chapter 2 Literature Review
2.1 Addressing Non Revenue Water
Real losses (physical losses) and apparent losses (commercial or administrative losses)
have synergetic negative impacts on the overall performance of the utility. While real
losses cause increase of the operating costs and larger investments, the commercial
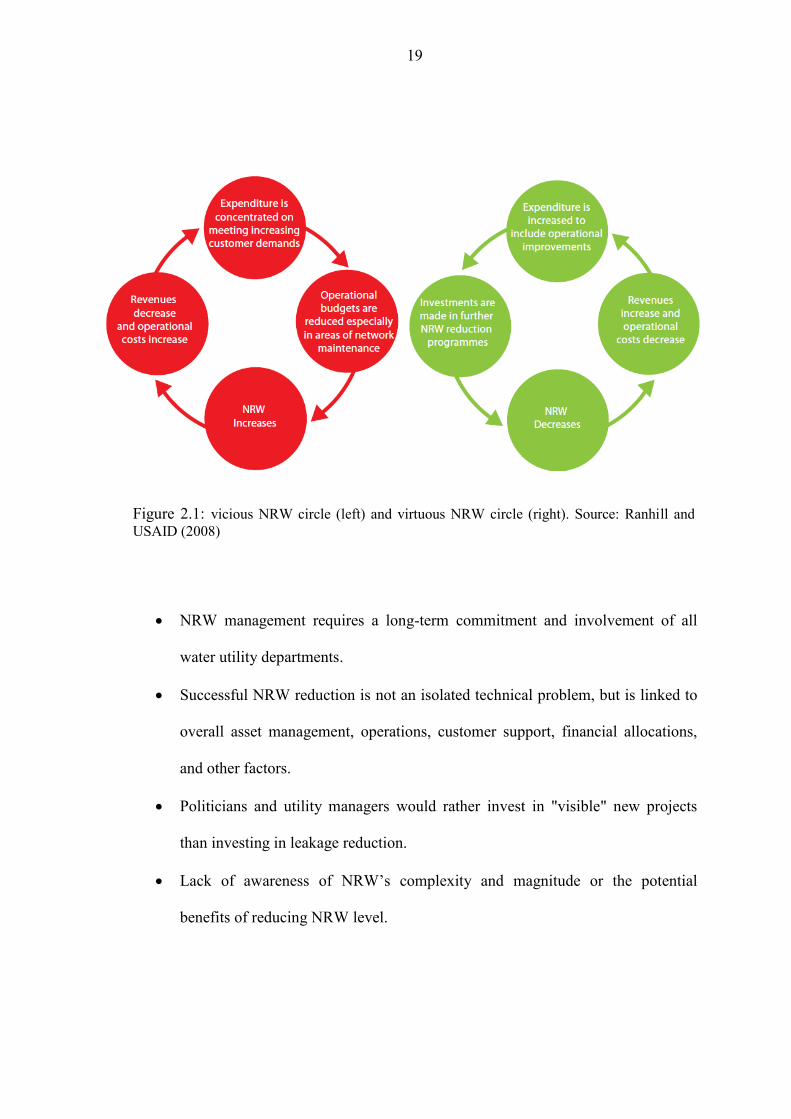
losses reduce the utility revenues. Ranhill and USAID (2008) have illustrated this detail
through drawing vicious and virtuous circles (Figure 2.1). The vicious circle shows that
increase NRW level would lead to more production cost and simultaneously less
revenues. This, in turn, causes spending the current budget to meet the increase demand
on the cost of maintenance of the system. Improper maintenance causes NRW to
increase and so forth. The challenge of the water utility is to transform the vicious circle
to the virtuous one. Once this is done, reduction in cost, postponing the investments,
and more revenues would be accomplished.
2.1.1 Attempts and Failures
Despite the fact that water losses or NRW is a buzzword that always has been targeted
in the strategies of water utilities, no satisfactory results have been achieved. An outline
for the main points that cause failure for NRW management's attempts could be
synthesized from Kingdom, et al. (2006) and Ranhill and USAID (2008) as follows:
19
NRW management requires a long-term commitment and involvement of all
water utility departments.
Successful NRW reduction is not an isolated technical problem, but is linked to
overall asset management, operations, customer support, financial allocations,
and other factors.
Politicians and utility managers would rather invest in "visible" new projects
than investing in leakage reduction.
Lack of aw
benefits of reducing NRW level.
Figure 2.1: vicious NRW circle (left) and virtuous NRW circle (right). Source: Ranhill and USAID (2008)
20
2.2 Non-Revenue Water Strategizing
The first step when developing a NRW management strategy is setting its long and
short-term targets along with the r goals and policies (Ranhill and USAID,
2008). Then Non Revenue Water assessment and components breakdown is the
following basic step. The key to progress with the strategy is then to get a better
understanding of the reasons for NRW and the factors that influence its components
(Kingdom et al, 2006 and Farley and Liemberger, 2004). These starting steps make up
the main part of a suggested diagnostic approach for developing NRW reduction
strategy by Farely and Trow (2007) which considers the following typical questions:
How much water is being lost?
Where is it being lost from?
Why is it being lost?
What strategies can be introduced to reduce losses and improve performance?
How can the strategy be maintained and the achievements sustained?
Details on how to answer these questions are provided in Table 2.1 in which tasks and
action plan are presented. Additional issues to be considered when developing the
strategy are:
To estimate the potential saved water by the target period for the various NRW
components.
To carry out a prioritizing analysis according to how the required total reduction
can be most cost-effectively achieved;; which component to be targeted first or
more (Ranhill and USAID, 2008)

21
To include the environmental factors into the strategy;; which usually is the
political role.
Table 2.1: Tasks and Tools for Developing NRW Reduction Strategy. Source: Farly and Trow, 2007

22
2.3 Non-Revenue Water Assessment
Non Revenue Water assessment is the first step towards its management, and essential
stage when preparing a baseline for NRW strategy (Kingdom, et al., 2006 and
Liemberger and Farley, 2004).
The objective of NRW assessment is to quantify NRW amount in the subject system
without considering where the losses are actually located (Puust, et al., 2010). Two
decades ago, water loss assessment was more a guesstimation process than meticulous
science (Liemberger and Farley, 2004). During the last ten years, a large effort has been
made by IWA and other organizations to promote new concepts and methods for
improving the assessment and management of Non Revenue Water (Vermersch and
Rizzo, 2008).
Puust, et al. (2010), in their review paper, concluded that the current leakage, or water
losses, assessment methods can be classified into two main groups;; (1) top-down
assessment methods;; using water balance, and (2) bottom-up assessment methods;;
mainly by using 24 Hour Zone Measurement (HZM), or Minimum Night Flow (MNF)
analysis.
2.3.1 Top-Down Approach
The top- down approach, the water balance, was first suggested by IWA Water Loss
Task Force as an international "best practice" standard approach for NRW calculations
(Figure 1.1-Chapter 1). All definitions of the terms involved in the water balance have
been provided clearly with the suggested water balance (Farley and Trow, 2007);;. The
IWA water balance has rapidly gained international acceptance, and has already been
promoted by many International agencies;; including AWWA and the World Bank. It
has been also adopted by national water utilities, associations, and consultants in the
developed, and developing countries (EPA, 2009 and Radivojevic, et al., 2008).

23
According to the NRW handbook sponsored by Ranhill and USAID (2008), four basic
steps have to be made to conduct a water balance:
(1) Determining system input volume
(2) Determining authorized consumption:
Billed: total volume of water billed by the water utility
Unbilled: total volume of water provided at no charge;; (metered and not
metered)
(3) Estimating the apparent (commercial) losses:
Theft of water and fraud
Meter under-registration;; since the tendency of the customer meters tend to be
under-registration than over-registration (AWWA, 2009)
Data handling errors
(4) Calculating the real (physical) losses:
Leakage on transmission mains
Leakage on distribution mains
Leakage from reservoirs and overflows
Leakage on customer service connections
According to these steps, system input volume, billed consumption, and unbilled
metered authorized consumption are usually metered. In contrast, unbilled authorized
unmetered consumption and the apparent losses are estimated.
The unbilled authorized consumption (metered and unmetered) is usually a small
component, and thus typically assumed in the range from 0.5% (Lambert and Taylor,
2010) to 1.25% (AWWA, 2009) of the system input volume or estimated by the utility
as it is site- specific.

24
On the other hand, the apparent losses estimation starts with assuming the unauthorized
consumption at 0.25% as in (AWWA, 2009) or 1% as in (Lambert and Taylor, 2010).
Alternatively, it could also be estimated via the utility's experience with validated data
(AWWA, 2009). Afterwards, the customer meter inaccuracies should be estimated
according to meter tests at different flow rates representing typical customer water use
and meter guidance manuals as well (Mutikanga, et al., 2010;; Ranhill and USAID,
2008;; and AWWA, 2009). The next step is to estimate systematic data handling errors
by exporting and analyzing historic billing data trends for a certain period (Mutikanga,
et al., 2010 and Ranhill and USAID, 2008). Thenceforth, the apparent losses component
is estimated by summing its subcomponents.
Eventually, the real (physical) losses are calculated by subtracting the apparent losses
and authorized unbilled consumption from the volume of NRW. Hence, NRW
components are quantified by the water balance;; top-down approach.
2.3.1.1 Unauthorized Consumption Estimation
Tackling the unauthorized consumption issue, it is rather difficult and challenging to
estimate the unauthorized consumption (Mutikanga, et al., 2010) due to its hidden
nature. The NRW handbook (Ranhill and USAID, 2008) confines this point by
recommending that the unauthorized estimation should be a transparent component-
based process (Ranhill and USAID, 2008). The guidance manual of Control and Mitigation
of Drinking Water Losses in Distribution Systems published by the Environmental Protection
Agency (2009) emphasized the difficulty of estimating unauthorized consumption, but
has only recommended that it must be accounted (EPA, 2009).
Mutikanga, et al. (2010) has attempted to estimate unauthorized consumption through
long awareness and rewarding program. Advertisements were placed in the local
newspapers requesting anyone with information on illegal use to report it to the utility

25
and a cash reward was offered (Mutikanga, et al., 2010). This process, however, is
considered bottom-up auditing rather than top down approach (Mutikanga, et al., 2010).
Besides, there still might be potential significant illegal connections that are not
reported.
To sum up this matter , yet, there is still lack of scientific methods attempts to
quantifying the unauthorized consumption through top down approach apart from
assuming it from 0.25% - 1% of the system input volume.
2.3.2 Bottom-Up Approach
Bottom-up approach estimates the physical losses by analyzing 24 Hour Zone
Measurement (HZM) or Minimum Night Flow (MNF) analysis. Minimum Night Flow
analysis is more common since the HZM in principle is used eventually to apply MNF
analysis approach (Puust, et al., 2010).
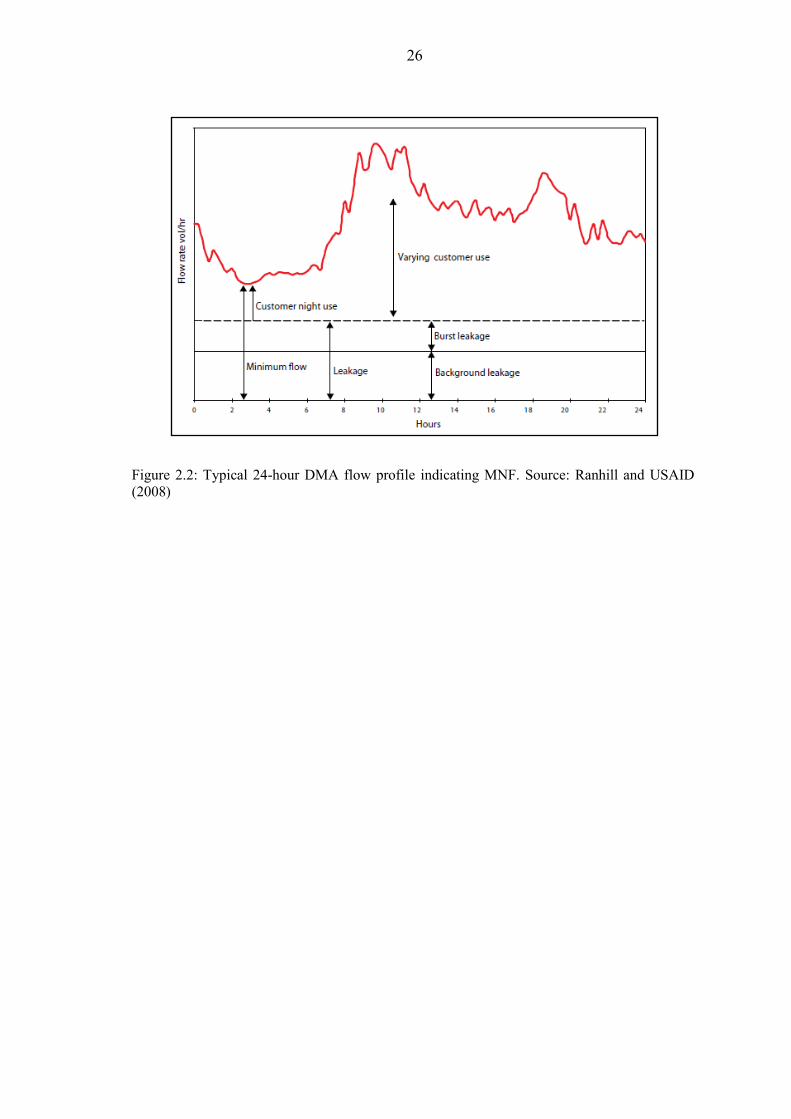
Minimum Night Flow analysis is the lowest flow into the District Metered Area2
(DMA) over a 24-hour period, which generally occurs at night when most consumers
are inactive as shown in Figure 2.2 (Farley and Trow, 2007). Minimum Night Flow
analysis requires DMA, and to perform field tests between 02: 00 am and 04: 00 am in
which most users do not use water (Cheung, et al., 2010 and Farley and Trow, 2007).
Besides, Minimum Night Flow analysis entails identifying in advance the potential
large nightly water consumers within the DMA, and further, the medium water pressure
in the DMA network (Cheung, et al., 2010 and Puust, et al., 2010)
Accordingly, estimating the leakages in the MNF period is carried out by subtracting
legitimate night uses from the MNF (Farley and Trow, 2007).
2 District Metered Area is a discrete zone with a permanent boundary defined by flow meters and/or closed valves. For further information on designing and implementing the DMA, see Farley and Trow (2007).
26
Figure 2.2: Typical 24-hour DMA flow profile indicating MNF. Source: Ranhill and USAID (2008)
27
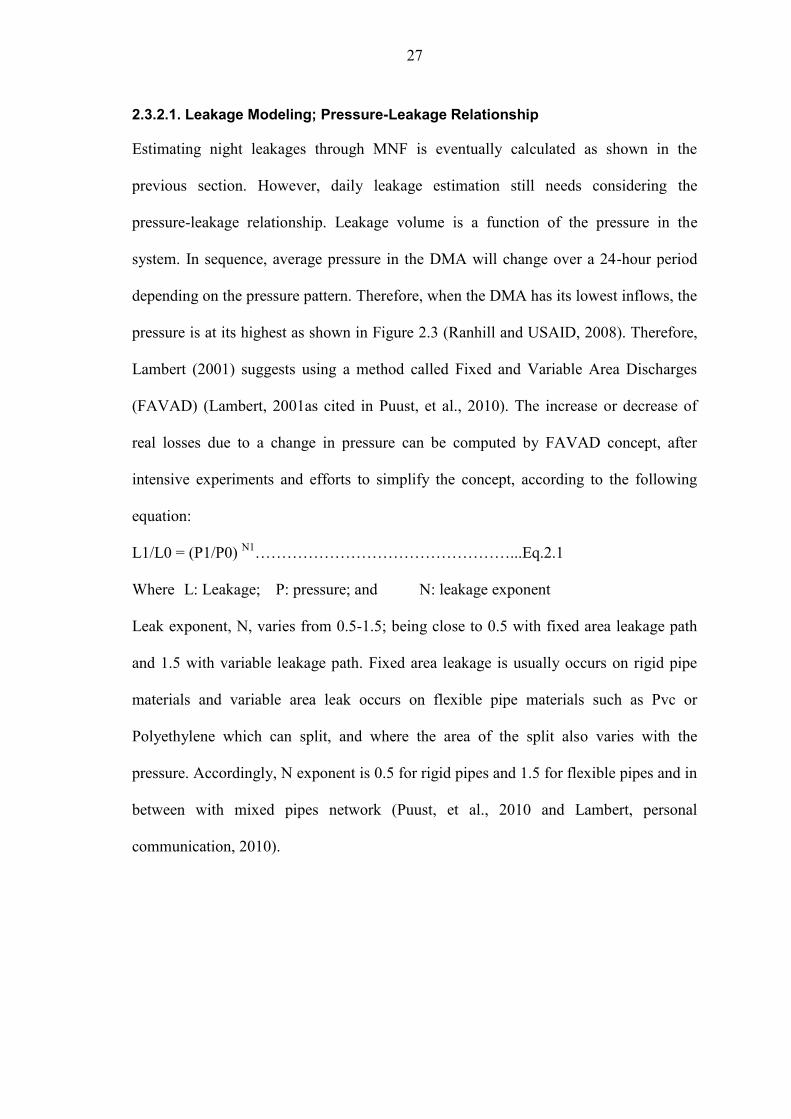
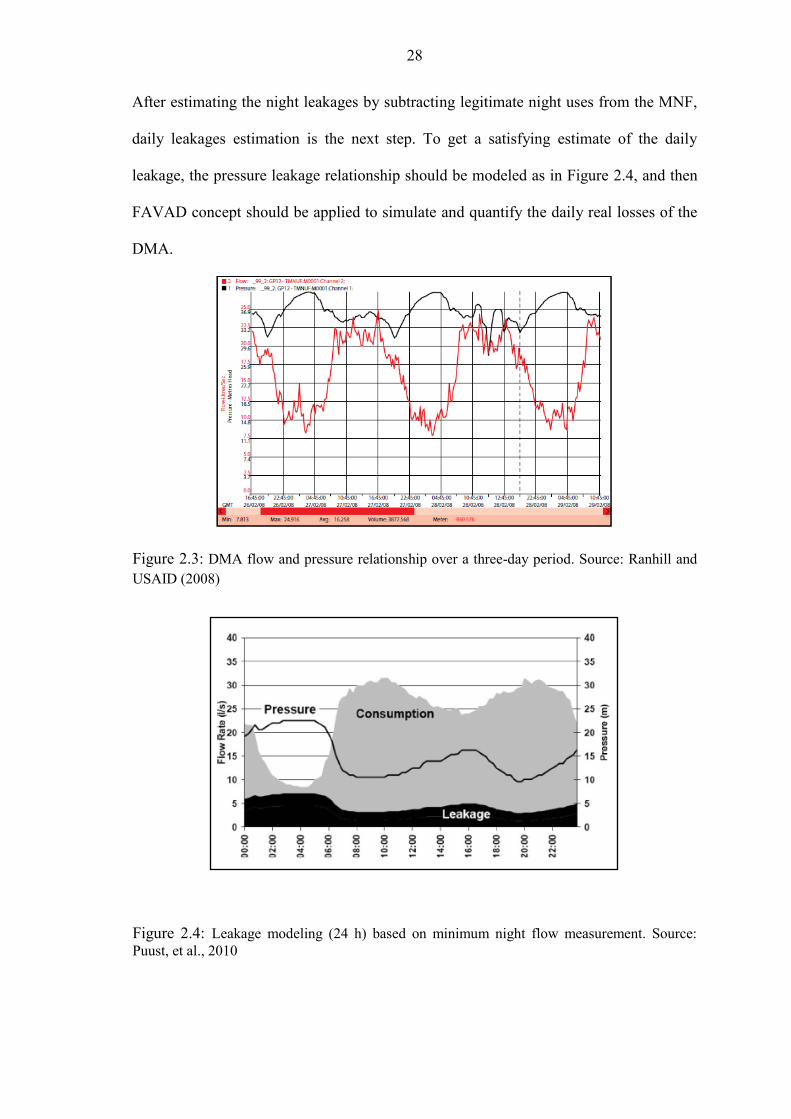
2.3.2.1. Leakage Modeling;; Pressure-Leakage Relationship
Estimating night leakages through MNF is eventually calculated as shown in the
previous section. However, daily leakage estimation still needs considering the
pressure-leakage relationship. Leakage volume is a function of the pressure in the
system. In sequence, average pressure in the DMA will change over a 24-hour period
depending on the pressure pattern. Therefore, when the DMA has its lowest inflows, the
pressure is at its highest as shown in Figure 2.3 (Ranhill and USAID, 2008). Therefore,
Lambert (2001) suggests using a method called Fixed and Variable Area Discharges
(FAVAD) (Lambert, 2001as cited in Puust, et al., 2010). The increase or decrease of
real losses due to a change in pressure can be computed by FAVAD concept, after
intensive experiments and efforts to simplify the concept, according to the following
equation:
L1/L0 = (P1/P0) N1 ...Eq.2.1
Where L: Leakage;; P: pressure;; and N: leakage exponent
Leak exponent, N, varies from 0.5-1.5;; being close to 0.5 with fixed area leakage path
and 1.5 with variable leakage path. Fixed area leakage is usually occurs on rigid pipe
materials and variable area leak occurs on flexible pipe materials such as Pvc or
Polyethylene which can split, and where the area of the split also varies with the
pressure. Accordingly, N exponent is 0.5 for rigid pipes and 1.5 for flexible pipes and in
between with mixed pipes network (Puust, et al., 2010 and Lambert, personal
communication, 2010).
28
After estimating the night leakages by subtracting legitimate night uses from the MNF,
daily leakages estimation is the next step. To get a satisfying estimate of the daily
leakage, the pressure leakage relationship should be modeled as in Figure 2.4, and then
FAVAD concept should be applied to simulate and quantify the daily real losses of the
DMA.
Figure 2.4: Leakage modeling (24 h) based on minimum night flow measurement. Source: Puust, et al., 2010
Figure 2.3: DMA flow and pressure relationship over a three-day period. Source: Ranhill and USAID (2008)

29
2.3.3 A component Base Analysis
This approach uses the concept of Burst And Background Estimates (BABE) that was
developed by Lambert in the 1990s (EPA, 2009). The underlying principle of BABE
concept is that real losses consist of numerous leakage events. Loss volume for each
event is a function of the average flow rates and average run-times for different types
of leakages (Thornton, et al., 2008) (Figure 2.5). Therefore, to conduct such analysis,
real losses in the network is categorized into four categories;; (1) Background leakage at
joints and fittings;; (2) Reported leaks and bursts (high flow rates with short duration);;
(3) Unreported leaks and bursts (moderate flow rates with duration depending on the
method of active leakage control);; and (4) Hidden loss or excess losses;; flow rates too
low to be detected by sonic detection devices (EPA, 2009).
Figure 2.5: Leak run time and volume of water loss: A: Awareness Time;; L: Locating Time;;
R: Repairing Time. Source: Ranhill and USAID (2008)
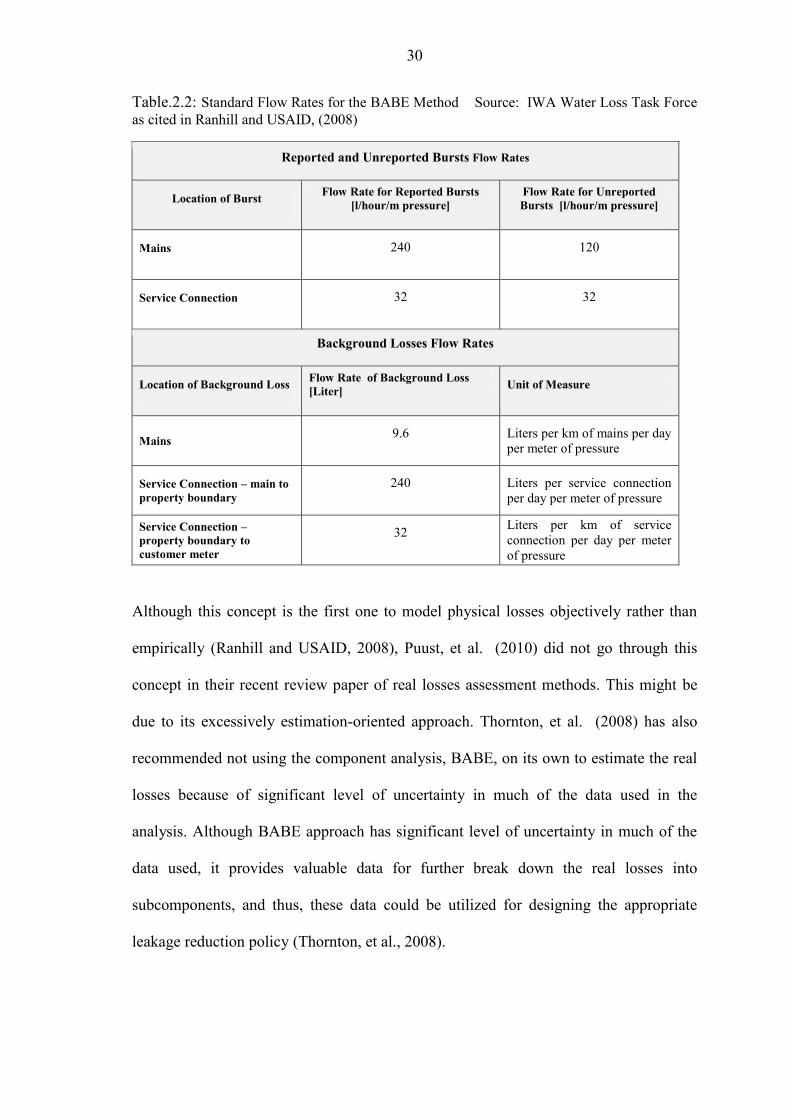
In using BABE model, typical burst flow rates are already set at a standard pressure,
and then are adjusted to actual pressure using appropriate assumptions for FAVAD
principle (EPA, 2009). Table 2.2 provides the standard approximate flow rates for the
reported, unreported and background losses.
30
Table.2.2: Standard Flow Rates for the BABE Method Source: IWA Water Loss Task Force as cited in Ranhill and USAID, (2008)
Reported and Unreported Bursts Flow Rates
Location of Burst Flow Rate for Reported Bursts [l/hour/m pressure]
Flow Rate for Unreported Bursts [l/hour/m pressure]
Mains 240 120
Service Connection 32 32
Background Losses Flow Rates
Location of Background Loss Flow Rate of Background Loss [Liter] Unit of Measure
Mains 9.6 Liters per km of mains per day per meter of pressure
Service Connection main to property boundary
240 Liters per service connection per day per meter of pressure
Service Connection property boundary to customer meter
32 Liters per km of service connection per day per meter of pressure
Although this concept is the first one to model physical losses objectively rather than
empirically (Ranhill and USAID, 2008), Puust, et al. (2010) did not go through this
concept in their recent review paper of real losses assessment methods. This might be
due to its excessively estimation-oriented approach. Thornton, et al. (2008) has also
recommended not using the component analysis, BABE, on its own to estimate the real
losses because of significant level of uncertainty in much of the data used in the
analysis. Although BABE approach has significant level of uncertainty in much of the
data used, it provides valuable data for further break down the real losses into
subcomponents, and thus, these data could be utilized for designing the appropriate
leakage reduction policy (Thornton, et al., 2008).

31
2.3.4 Synergetic Approach
It is strongly recommended with a consensus in the literature that combining the top
down approach with the bottom up approach would enhance the accuracy of the NRW
assessment and thus provides satisfactory results (Thornton, et al., 2008;; Ranhill and
USAID, 2008;; EPA, 2009;; Lambert and Taylor, 2010;; and Puust, et al., 2010 ).
Furthermore, when top down approach is already conducted, it is also recommended
using BABE concept as a supplementary analysis for the top down water balance (EPA,
2009 and Thornton, et al., 2008). Doing so allows quantifying the hidden losses3 and
thus, redesigning an effective leakage prioritizing and reduction policy.
2.4 Monitoring NRW Management
performance and financial performance. Performance indicators (PIs) of NRW are
usually used to rank the water u in the
country or in the regional level (Ranhill and USAID, 2008). Perhaps the most common
one is NRW as a percentage of the system input volume;; however, there are other NRW
PIs that are used for managerial and operational monitoring.
2.4.1 Performance Indicators
Before an international report for performance indicator for NRW in 2002, several
countries have had their own indicators (Lambert, 2002). Using these indicators, the
3Hidden loss or Excess Losses are losses include water lost from leaks that are not detected and repaired
under the current leakage control policy (Thornton, et al., 2008). Excess Losses can be calculated from
the following equation: Excess Losses = Physical losses from water balance - known physical loss
components.

32
comparison of performance from utility to utility was based on the different methods for
determining these indicators. For example, the following PIs were adopted:
percentage of average daily flow was: USA, France;;
M3/km of mains/hours: German, Japan;;
liters/property/hour: UK
Two problems were associated with these indicators: first, they do not consider
component analysis techniques (Puust, et al., 2010). Second, all of them were based on
the term Unaccounted For Water (UFW). Unaccounted For Water, in turn, was widely
used, but misinterpreted and manipulated in a way that made it difficult to be compared
in the international level (Mckenzie and Lambert, 2004). This conclusion was made in
the international report made in 2001 (Lambert, 2002) when data of UFW from 22
countries were compared and analyzed. For these reasons the term NRW among a
package of standard "best practice" performance indicators were introduced (Table2.3)
by IWA with standard and unambiguous definitions in order to allow performance
comparison in the national and international level (Mckenzie and Lambert, 2004).
Table 2.3: Recommended NRW Performance Indicators by IWA. Source: Puust, et al. (2010)
33
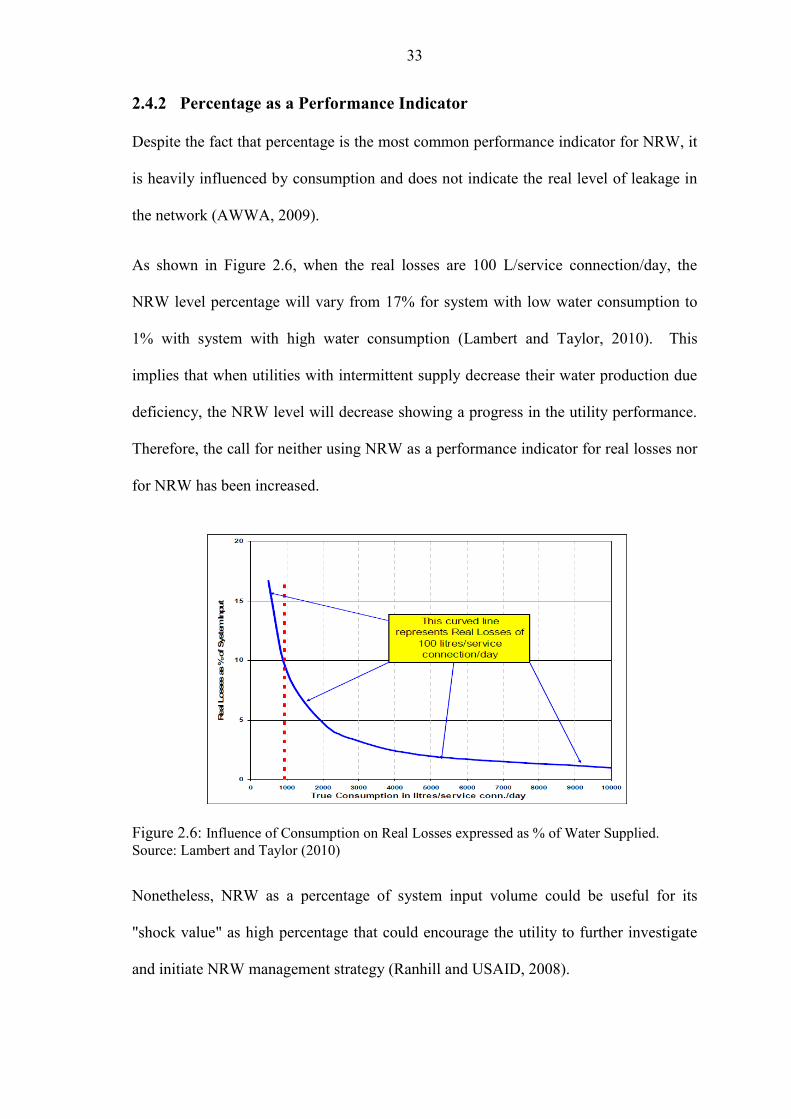
2.4.2 Percentage as a Performance Indicator
Despite the fact that percentage is the most common performance indicator for NRW, it
is heavily influenced by consumption and does not indicate the real level of leakage in
the network (AWWA, 2009).
As shown in Figure 2.6, when the real losses are 100 L/service connection/day, the
NRW level percentage will vary from 17% for system with low water consumption to
1% with system with high water consumption (Lambert and Taylor, 2010). This
implies that when utilities with intermittent supply decrease their water production due
deficiency, the NRW level will decrease showing a progress in the utility performance.
Therefore, the call for neither using NRW as a performance indicator for real losses nor
for NRW has been increased.
Nonetheless, NRW as a percentage of system input volume could be useful for its
"shock value" as high percentage that could encourage the utility to further investigate
and initiate NRW management strategy (Ranhill and USAID, 2008).
Figure 2.6: Influence of Consumption on Real Losses expressed as % of Water Supplied. Source: Lambert and Taylor (2010)
34
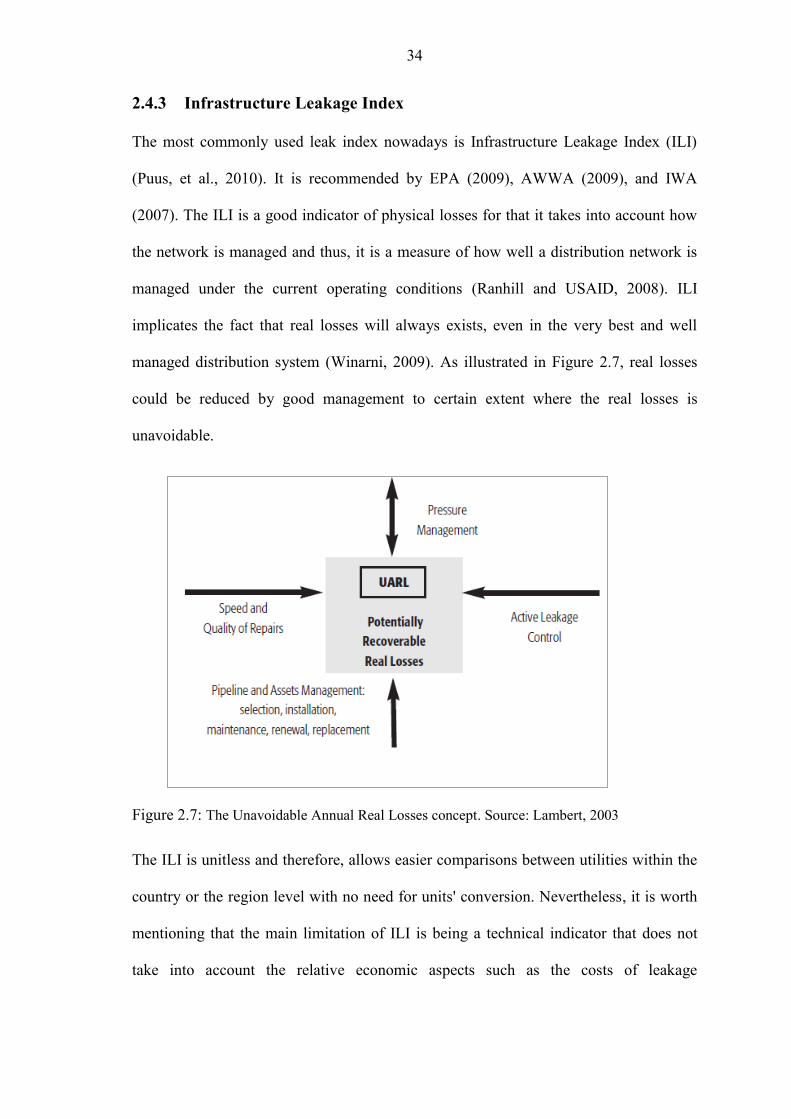
Figure 2.7: The Unavoidable Annual Real Losses concept. Source: Lambert, 2003
2.4.3 Infrastructure Leakage Index
The most commonly used leak index nowadays is Infrastructure Leakage Index (ILI)
(Puus, et al., 2010). It is recommended by EPA (2009), AWWA (2009), and IWA
(2007). The ILI is a good indicator of physical losses for that it takes into account how
the network is managed and thus, it is a measure of how well a distribution network is
managed under the current operating conditions (Ranhill and USAID, 2008). ILI
implicates the fact that real losses will always exists, even in the very best and well
managed distribution system (Winarni, 2009). As illustrated in Figure 2.7, real losses
could be reduced by good management to certain extent where the real losses is
unavoidable.
The ILI is unitless and therefore, allows easier comparisons between utilities within the
country or the region level with no need for units' conversion. Nevertheless, it is worth
mentioning that the main limitation of ILI is being a technical indicator that does not
take into account the relative economic aspects such as the costs of leakage
35
management (Puust, et al., 2010). In spite of that, it is still considered the most robust
and common indicator that yet has no substitute for the physical losses.
Infrastructure Leakage Index is the ratio of the Current Annual Real (physical) Losses
(CARL) to the Unavoidable Annual Real Losses (UARL) as shown in Equation 2.2 and
Equation 2.3:
...Eq.2.2
UARL (liters/d ..Eq.2.3
Where
CARL = Current annual real losses
UARL= Unavoidable annual real losses
Lm = Mains pipes length (km);;
Nc = Number of service connections;;
Lp = Total length of private pipe, property boundary to customer meter (km);;
P = Average pressure (m)
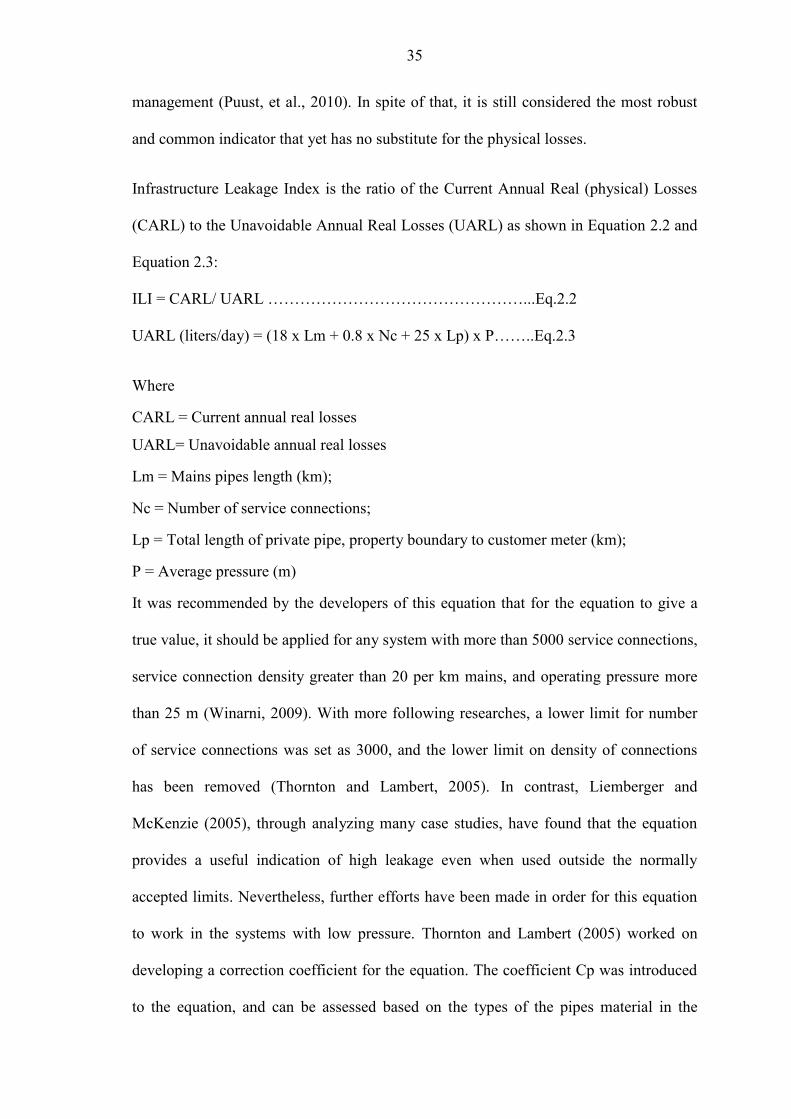
It was recommended by the developers of this equation that for the equation to give a
true value, it should be applied for any system with more than 5000 service connections,
service connection density greater than 20 per km mains, and operating pressure more
than 25 m (Winarni, 2009). With more following researches, a lower limit for number
of service connections was set as 3000, and the lower limit on density of connections
has been removed (Thornton and Lambert, 2005). In contrast, Liemberger and
McKenzie (2005), through analyzing many case studies, have found that the equation
provides a useful indication of high leakage even when used outside the normally
accepted limits. Nevertheless, further efforts have been made in order for this equation
to work in the systems with low pressure. Thornton and Lambert (2005) worked on
developing a correction coefficient for the equation. The coefficient Cp was introduced
to the equation, and can be assessed based on the types of the pipes material in the
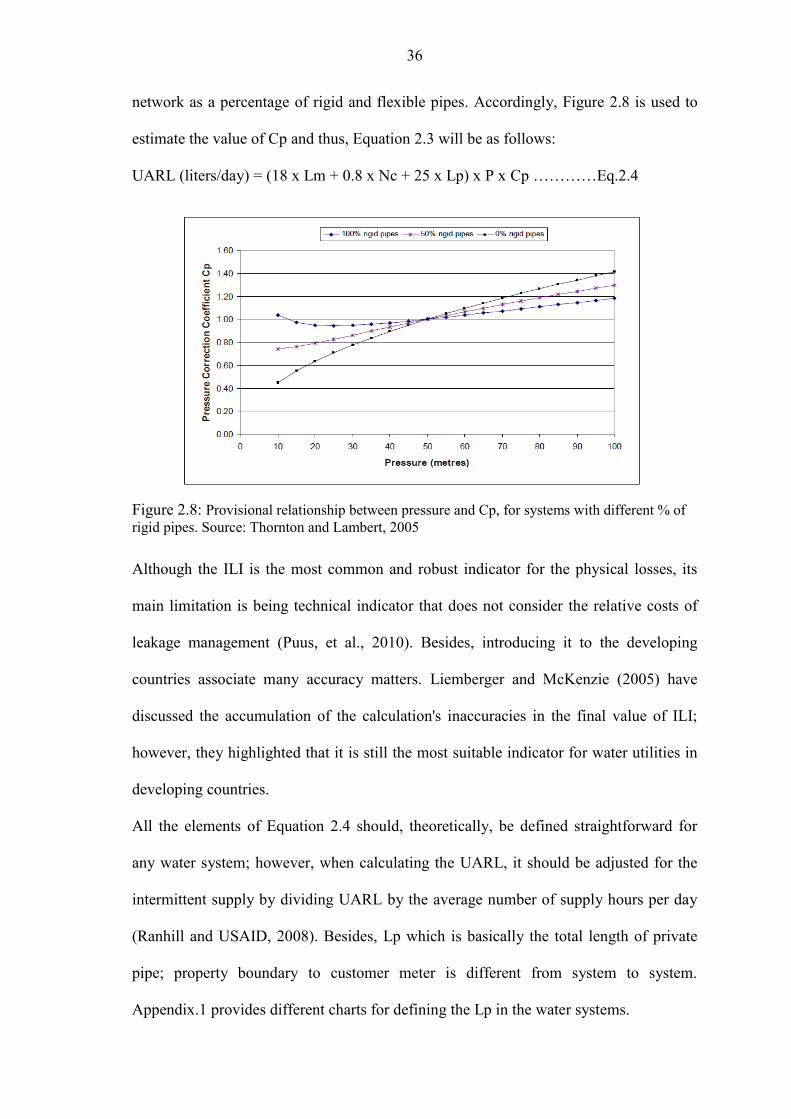
36
network as a percentage of rigid and flexible pipes. Accordingly, Figure 2.8 is used to
estimate the value of Cp and thus, Equation 2.3 will be as follows:
UARL (liters/day) = (18 x Lm + 0.8 x Nc + 25 x Lp) x P x Cp 2.4
Although the ILI is the most common and robust indicator for the physical losses, its
main limitation is being technical indicator that does not consider the relative costs of
leakage management (Puus, et al., 2010). Besides, introducing it to the developing
countries associate many accuracy matters. Liemberger and McKenzie (2005) have
discussed the accumulation of the calculation's inaccuracies in the final value of ILI;;
however, they highlighted that it is still the most suitable indicator for water utilities in
developing countries.
All the elements of Equation 2.4 should, theoretically, be defined straightforward for
any water system;; however, when calculating the UARL, it should be adjusted for the
intermittent supply by dividing UARL by the average number of supply hours per day
(Ranhill and USAID, 2008). Besides, Lp which is basically the total length of private
pipe;; property boundary to customer meter is different from system to system.
Appendix.1 provides different charts for defining the Lp in the water systems.
Figure 2.8: Provisional relationship between pressure and Cp, for systems with different % of rigid pipes. Source: Thornton and Lambert, 2005
Source: Thornton and Lambert, 2005
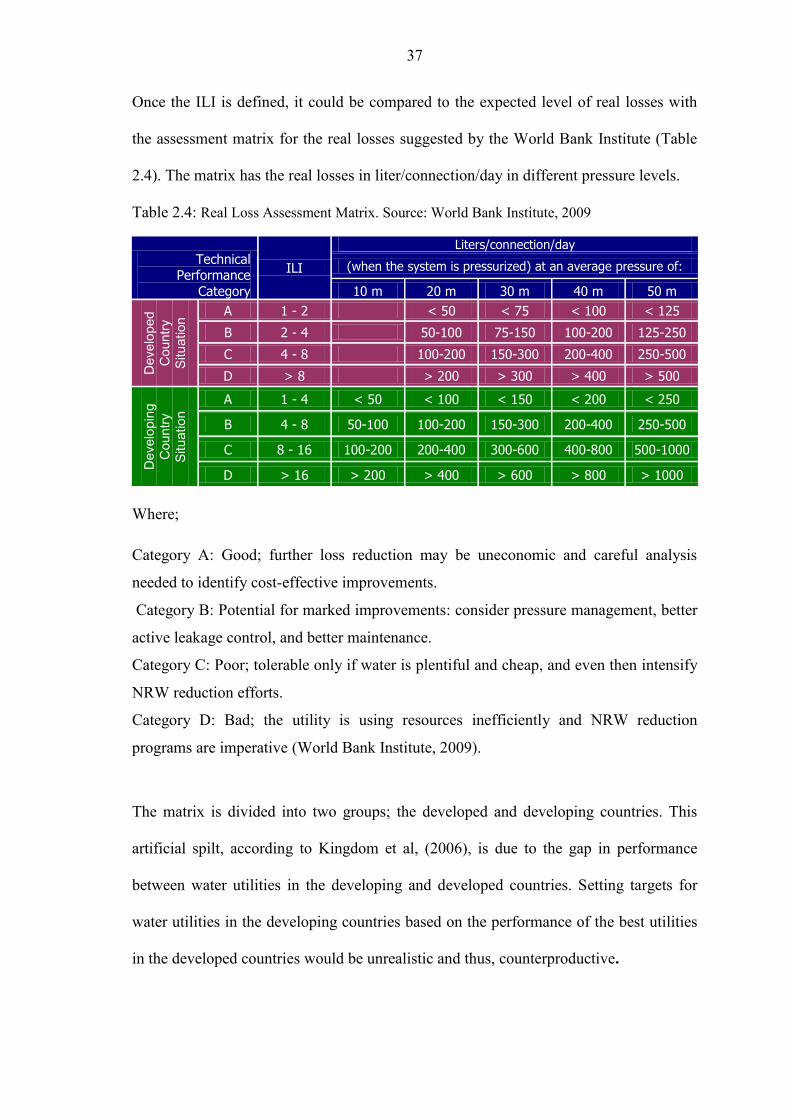
37
Once the ILI is defined, it could be compared to the expected level of real losses with
the assessment matrix for the real losses suggested by the World Bank Institute (Table
2.4). The matrix has the real losses in liter/connection/day in different pressure levels.
Table 2.4: Real Loss Assessment Matrix. Source: World Bank Institute, 2009
Technical Performance Category
ILI
Liters/connection/day
(when the system is pressurized) at an average pressure of:
10 m 20 m 30 m 40 m 50 m
Developed
Country
Situation
A 1 - 2 < 50 < 75 < 100 < 125
B 2 - 4 50-100 75-150 100-200 125-250
C 4 - 8 100-200 150-300 200-400 250-500
D > 8 > 200 > 300 > 400 > 500
Developing
Country
Situation
A 1 - 4 < 50 < 100 < 150 < 200 < 250
B 4 - 8 50-100 100-200 150-300 200-400 250-500
C 8 - 16 100-200 200-400 300-600 400-800 500-1000
D > 16 > 200 > 400 > 600 > 800 > 1000
Where;;
Category A: Good;; further loss reduction may be uneconomic and careful analysis
needed to identify cost-effective improvements.
Category B: Potential for marked improvements: consider pressure management, better
active leakage control, and better maintenance.
Category C: Poor;; tolerable only if water is plentiful and cheap, and even then intensify
NRW reduction efforts.
Category D: Bad;; the utility is using resources inefficiently and NRW reduction
programs are imperative (World Bank Institute, 2009).
The matrix is divided into two groups;; the developed and developing countries. This
artificial spilt, according to Kingdom et al, (2006), is due to the gap in performance
between water utilities in the developing and developed countries. Setting targets for
water utilities in the developing countries based on the performance of the best utilities
in the developed countries would be unrealistic and thus, counterproductive.

38
Chapter 3 Suggested Approach for NRW Assessment
3.1 The Underlying Principle
The principle of this approach is that tracking water to its destiny confirms that after
water is used in the premises, only the real consumption enters the sewer networks. This
includes water used through illegal connections and bypasses. Besides, meter
inaccuracies that appear in the billing system of the water utilities do not appear in the
sewers flow. In other words, the apparent (administrative) losses should appear in the
outlet of the wastewater network of the District Metered Area or the inlet of the
wastewater treatment plant. Unambiguously, the wastewater treatment plant receives the
apparent losses but not the real losses. The same applies with the out let of a certain
zone or DMA. Hence, studying the wastewater flow would indicate the quantity of the
apparent losses.
3. 2 The Reverse Approach Equation
The methodology tries to draw the line between apparent losses and real losses in NRW
calculations by utilizing the fact that apparent losses enter the wastewater sewers while
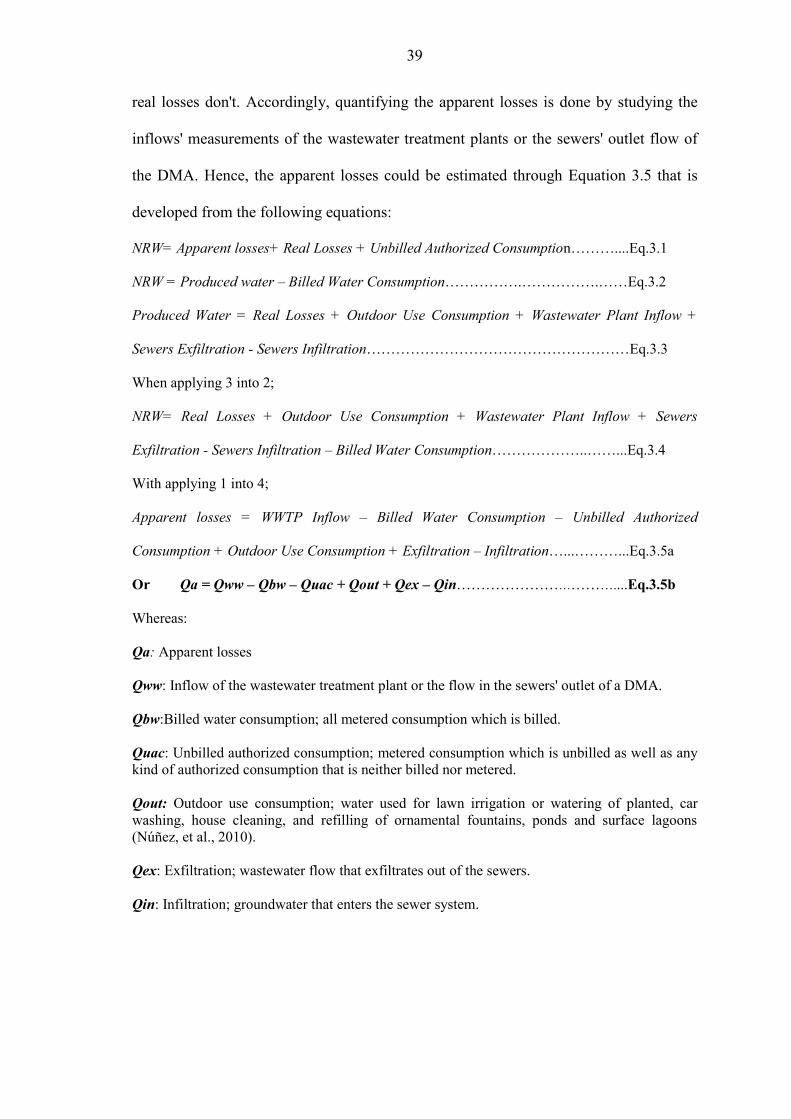
39
real losses don't. Accordingly, quantifying the apparent losses is done by studying the
inflows' measurements of the wastewater treatment plants or the sewers' outlet flow of
the DMA. Hence, the apparent losses could be estimated through Equation 3.5 that is
developed from the following equations:
NRW= Apparent losses+ Real Losses + Unbilled Authorized Consumptio ....Eq.3.1
NRW = Produced water Billed Water Consumption Eq.3.2
Produced Water = Real Losses + Outdoor Use Consumption + Wastewater Plant Inflow +
Sewers Exfiltration - Sewers Infiltration Eq.3.3
When applying 3 into 2;;
NRW= Real Losses + Outdoor Use Consumption + Wastewater Plant Inflow + Sewers
Exfiltration - Sewers Infiltration Billed Water Consumption ...Eq.3.4
With applying 1 into 4;;
Apparent losses = WWTP Inflow Billed Water Consumption Unbilled Authorized
Consumption + Outdoor Use Consumption + Exfiltration Infiltration . .Eq.3.5a
Or Qa = Qww Qbw Quac + Qout + Qex Qin ....Eq.3.5b
Whereas:
Qa: Apparent losses Qww: Inflow of the wastewater treatment plant or the flow in the sewers' outlet of a DMA. Qbw:Billed water consumption;; all metered consumption which is billed. Quac: Unbilled authorized consumption;; metered consumption which is unbilled as well as any kind of authorized consumption that is neither billed nor metered. Qout: Outdoor use consumption;; water used for lawn irrigation or watering of planted, car washing, house cleaning, and refilling of ornamental fountains, ponds and surface lagoons (Núñez, et al., 2010). Qex: Exfiltration;; wastewater flow that exfiltrates out of the sewers. Qin: Infiltration;; groundwater that enters the sewer system.

40
3. 3 Determining the Components of the Equation Qww and Qbw;; the wastewater flow and billed water consumption are measured and thus,
they have usually available data in water utilities.
Quac;; unbilled authorized consumption is usually a small component in the equation. It is
either assumed, as in the other NRW assessment methods, from 0.5% (Lambert and
Taylor, 2010) to 1.25% (AWWA, 2009) of system input volume, or estimated by the
utility as it is site-specific.
Qout;; outdoor use consumption, could be calculated through Winter Summer Method
or Minimum Month Method by studying the variance of water consumption's monthly
data for one year (Gleick, et al., 2003). So, it needs only the monthly consumption data
of the studied city for one year.
Qex and Qin: Exfiltration from, and Infiltration to sewers could be calculated from
Equation 3.6 that is adapted from Rutsch, et al., (2008) and Amick, et al., (2000) for the
exfiltration;; and De Bénédittis and Bertrand-Krajewski, (2004) and Dublin Drainage
Consultancy, (2001) for the infiltration:
Exfiltration Infiltration = wastewater generated at the demand site - wastewater
. .. Eq.3.6a Or
Qex-Qinf = Np . Qcap . (1- Qout%) + Qind - Qww Eq.3. 6b
Where;;
Qex: Exfiltration
Qinf: Infiltration
Np: Nr. of population served
Qcap: per capita water consumption
Qout%: outdoor use percentage from water consumption
Qind: Industrial wastewater discharge
Qww: WWTP inflow4
4- Industrial wastewater discharge could be estimated straightforward from the records of the billing system in the water utility. - WWTP inflow should be of dry-weather flow and does not include flow caused by rainfall. - Per capita consumption should be measured. It should not include any losses.
41
However, Infiltration should be zero for sewers with far enough ground water table and
when there is no inflow caused by rainstorm (in the dry seasons). In this case, there are
other methods for assessing the exfiltration rate. Rutsch, et al.(2008), in their review
paper, has presented a thorough analysis for these methods and their accuracies. For a
"snapshot" apparent losses assessment, exfiltration could be assumed from 5%- 10% of
the base flow. This assumption was a conclusion of experimental studies of sewer
exfiltration conducted by Ellis, et al. (2003) so they pointed out that exfiltration from
urban sewers can be estimated as being probably no more than 5% - 10% of average
daily dry weather (base wastewater) flow .
3.3.1 Estimation of Outdoor Use Consumption
Outdoor residential water use consists of water used for lawn irrigation or watering of
planted, car washing, house cleaning, and refilling of fountains, ponds and surface
lagoons(Núñez, et al., 2010).
The outdoor use consumption could be estimated by using variables that reflect the
outdoor characteristics such as irrigable area of the premises, garden sizes, and pool
ownership (Arbués, et al., 2003). Interestingly, the amount of water used for irrigation
purposes is the dominant proportion of outdoor use (Singh, et al, 2009;; Palenchar, et al.,
2009;; and Gleick, et al., 2003). Mitchell, et al. (1999), estimate Garden irrigation at
90% of the outdoor water use. As reported by Gleick, et al., (2003), Skeel and Lucas
(1998) found that outdoor water use for single family house accounted more than 95
percent of the observed increase in peak summer consumption. 85% of this increase was
because of irrigation uses and less than 5% was due to a slight increase of the indoor use
in summer months. Hence, the climatic conditions' variance influences the outdoor
irrigation and therefore, the outdoor water demand (Mitchell, et al., 1999). For this

42
reason, the methods of estimating the outdoor water use are based on the conclusion that
irrigation areas of the premises makes up the almost all proportion of the outdoor water
use.
There are three methods for calculating the outdoor use consumption;; summer winter
method, minimum month method, and average winter month method (Gleick, et al.,
2003). Summer winter method (or average winter consumption method) relies on the
assumption that the difference between winter use and summer use was approximately
equal to outdoor use (Romero and Dukes, 2010 and Gleick, et al., 2003).
Alternatively, the minimum month method is the most popular way for calculating the
outdoor water use (Palenchar, et al., 2009). It assumes that the lowest-use month
represents indoor use and all differences between the other months and the minimum
month consumption were considered to be outdoor use (Romero and Dukes, 2010). The
third method, average month method, is adapted from minimum month method
approach through using the average of the three lowest water use months rather than the
minimum month to represent the indoor water use (Gleick, et al., 2003).
3.4. Advantages of the Approach
The reveres approach provides a substitute for the top-down approach in the
1% of the system input volume. In contrast, unauthorized consumption could
reach as high as 10% of the system input volume in the developing countries
(Mutikanga, et al., 2010).
This methodology uses already available data that are usually existed in the
water utilities.
43
The approach has the advantage of being more cost-effective over the bottom-up
approach which, in turn, is cost and time-consuming for that it depends on field
experiments. Furthermore, when conducting bottom-up approach, DMA
representativeness is questionable especially when the DMA itself has many
requirements to be fulfilled (Farley and Tow, 2007).
Unlike the other existed approaches, the suggested approach could be used to
breakdown the components of apparent losses and come up with objective
estimation of the unauthorized consumption.
3.5. Limitation
This methodology should work under the following conditions:
Data to be used in this methodology should be for dry seasons. Data of WWTP
for dry days throughout the year should supply the average dry flow for the
whole year.
Hydrants, firefighting and public water use should be minimized, null, or
considered. However, controlling the public use for a certain period could be
achieved through many ways. For, example by labeling the hydrants of the
public use in the DMA, and then checking how many were used, if any, and then
estimating this quantity.
3.6. Feedback
This approach was discussed with three NRW experts in the International Water
Association. Their feedback was considered to further considerations when developing

44
the approach. Afterward, it was sent again with an example to Mr. Allan Lambert5, for
further discussion about the methodology. Eventually, an initial software has been
developed for this approach (Figure 3.1).
3.7. Example
Water produced;; System input volume = 60000 CM/day
Unbilled authorized consumption= 300 CM/day
The service is covered 24/7, and the coverage service of water and wastewater is 100%
The inflow of the WWTP= 38000 CM/day
Population served = 420 000 people
Water consumption = 100 L/day.cap
5Mr. Allan Lambert is the developer of BABE, FAVAD and ILI concepts in the discipline of Non-Revenue Water management.
Figure 3.1: Initial software in a spreadsheet for the Reverse Approach;; developed by Lambert (2010)

45
In this example the previous outdoor use studies estimated it as 5% or assumed based on
behavior of people, gardens areas, and car washing practices. Exfiltration is assumed 7%.
So: Outdoor use = 0.05*420 000* 100/ 1000 = 2100 CM/day
Exfiltration is assumed to be 7% = 0.07 * (420 000 * 100 */ 1000 - 2100) = 2793 CM/day
Therefore: The apparent losses = WWTP Flow Billed consumption unbilled authorized
consumption + outdoor use + Exfiltration
Then apparent losses = 38000 35000 300 + 2100 + 2793 = 7593 CM/day
Then, real losses = NRW- apparent losses unbilled authorized consumption = 17107 CM/day
Therefore:
The apparent losses are 30% of NRW (13% of the system input volume).
The real losses are 68% of NRW (28.5% of the system input volume)
The unbilled authorized consumption is 2% of NRW (0.5% of the system input volume)
46
Chapter 4 Non-Revenue Water Assessment in Sana'a Water Utility
4.1 Introduction
This chapter discusses why the suggested approach was used for NRW assessment in
Sana'a water distribution system. Afterwards, thorough and detailed methods for
calculating the volumes of different NRW components are presented in this chapter to
serve as a case study for implementing the suggested approach. NRW software were
used to visualize the results of the assessment and integrate the results in a form of the
standard water balance and calculate the cost of NRW. At the end of this chapter, results
of the assessment are discussed and conclusions are drawn.
4.2 Research Question
losses, and unbilled authorized consumption for Sana'a water distribution system?
47
4.3 Research Method
This section demonstrates why all the existed methods of NRW assessment do not give
satisfactory results when applying them for the case of Sana'a water distribution system.
Afterwards, the suggested approach in chapter three will be implemented with a slight
modification.
4.3.1 Appropriateness of Applying the Existing Methods
4.3.1.1 Top Down Approach
As presented in Chapter 2, top down approach tries to estimate the apparent losses and
unbilled authorized consumption first, and then, it calculates the real losses. In the
estimation of the apparent losses, unauthorized consumption is assumed from 0.25% -
1% of the system input volume.
This assumption is inappropriate neither in the case of Sana'a water network nor in
developing countries in general because the volume of unauthorized consumption is
likely to be higher than the volume calculated by this assumption. Mutikanga, et al.
(2010) concludes that unauthorized consumption in the developing countries might
reach as high as 10% of water sales (6% of the system input volume in Sana'a case with
average NRW of 38%). Besides, Sana'a water utility, SWSLC, estimates apparent losses
from 19% - 23% of the system input volume of which a considerable amount to be
unauthorized consumption.
Therefore, applying the top-down approach should not represent the real trends of NRW
components because of the very little assumption of unauthorized consumption that
does not fit Sana'a case. Further, assuming the value of unauthorized consumption does
not help Sana'a water utility to design the appropriate prioritizing and reduction policies
for the apparent losses based on the component-base analysis.
48
Henceforth, top down approach with its assumption of unauthorized consumption from
0.25% - 1% of the system input volume is not an appropriate method for NRW
assessment in Sana'a water distribution system.
4.3.1.2 Bottom Up approach
Bottom up approach uses Minimum Night Flow (MNF) analysis. This in turn, requires
performing field tests between 02: 00 am and 04: 00 am in which most users do not use
water, and then the leakages in the MNF period is carried out by subtracting an
estimated legitimate night uses from the MNF.
MNF analysis could not be implemented under the current conditions of Sana'a water
network because of the following reasons:
1. Supply in Sana'a water distribution system is intermittent and insufficient.
Customers of Sana'a water utility use ground tank to store water for the times
with no supply. These tanks will be being filled during the time of the
experiment. Even though MNF could still be conducted when the customer
tanks of the District Metered Area (DMA) are full, the distribution pattern of
Sana'a water network is insufficient. Supply in Sana'a is dominated with short
periods that are enough for filling the tanks in some zones, but not adequate to
fill the tanks in some other zones (SWSLC, 2009b).
2. Zoning principle in general and the DMA concept in particular are yet neither
have been adopted nor applied in Sana'a water network.
3. Applying DMA requires from 1000-3000 connections in the network to be
separated and discrete. The DMA should be representative for the whole
network in terms of population profile, leakage, and illegal connections. DMA
should be hydraulically sound area with good records of pipes, fittings, and
customer records. It is rather complicated under the current operational

49
conditions of the network to meet these conditions and implement DMA with
appropriate water distribution pattern. Besides, the current knowledge about the
network and its components (e.g. valves) in Sana'a water utility is not adequate
to apply DMA
For these reasons, many trials to separate some zones failed. Water and Environment
Center in Sana'a University (WEC, 2010) has tried to conduct MNF analysis in Sana'a
water network. Sana'a water utility has arranged the technical team and the best
hydraulically sound area with what thought to be an appropriate water distribution
pattern. In spite of closing all the valves in the study area, water was still feeding some
of customer tanks from unknown pipes. Due to the uncertainty of the network working
nature, while customers' tanks were full at the time of the experiment in the areas that
are close to the source of water, water had not yet been reaching the remote customers'
tanks. Therefore, the trial of conducting MNF analysis carried out by WEC in 2010 has
concluded that DMA needs minimum limit of hydraulic knowledge about the network
to ensure completely separation the DMA. Sana'a water utility lacks adequate
knowledge for such a purpose.
4.3.1.3 Component-Based Analysis
This method is not appropriate for assessing NRW in Sana'a water distribution system
because of two reasons:
(1) This analysis is a data-based analysis;; data availability and accuracy in Sana'a water
utility is not adequately complete to conduct such analysis. There is a recent project
applying the Data Center Maintenance Management Software (DCMMS) for recording
the customers' complaints including the leakages. The program is adopted recently and
has worked well in terms of reducing and managing the customer complaints.
Nevertheless, yet the DCMMS in Sana'a water utility has only the total number of the
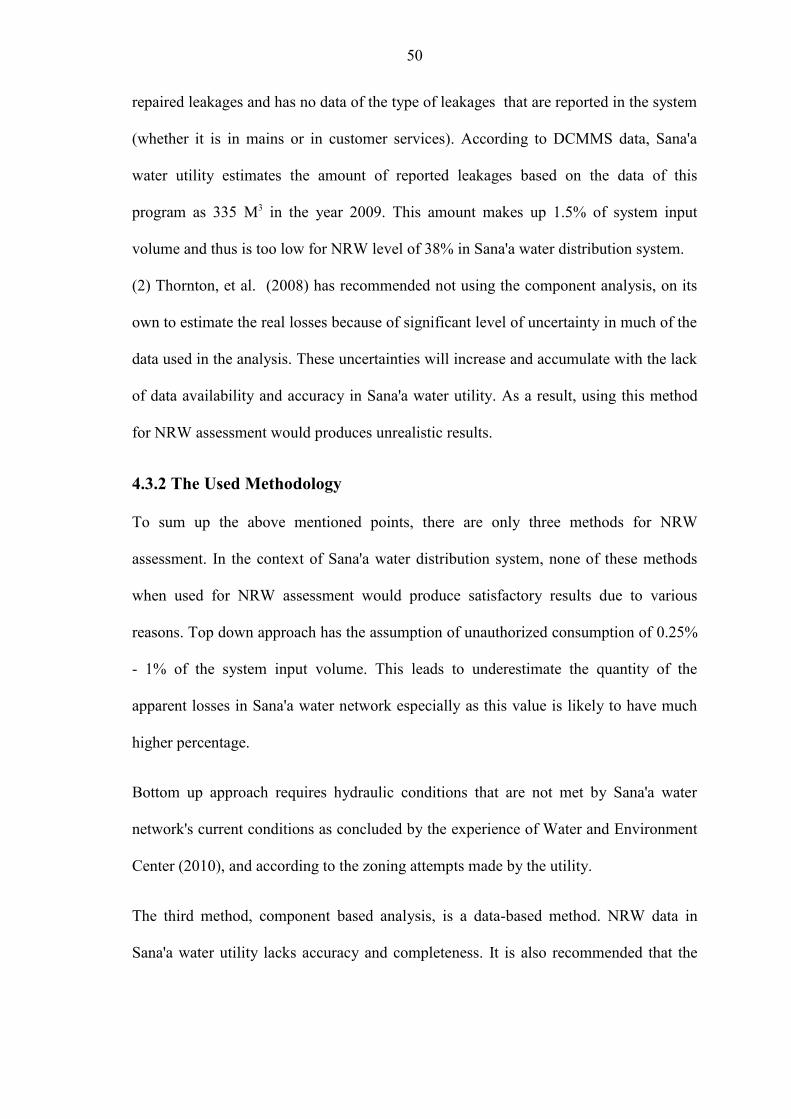
50
repaired leakages and has no data of the type of leakages that are reported in the system
(whether it is in mains or in customer services). According to DCMMS data, Sana'a
water utility estimates the amount of reported leakages based on the data of this
program as 335 M3 in the year 2009. This amount makes up 1.5% of system input
volume and thus is too low for NRW level of 38% in Sana'a water distribution system.
(2) Thornton, et al. (2008) has recommended not using the component analysis, on its
own to estimate the real losses because of significant level of uncertainty in much of the
data used in the analysis. These uncertainties will increase and accumulate with the lack
of data availability and accuracy in Sana'a water utility. As a result, using this method
for NRW assessment would produces unrealistic results.
4.3.2 The Used Methodology
To sum up the above mentioned points, there are only three methods for NRW
assessment. In the context of Sana'a water distribution system, none of these methods
when used for NRW assessment would produce satisfactory results due to various
reasons. Top down approach has the assumption of unauthorized consumption of 0.25%
- 1% of the system input volume. This leads to underestimate the quantity of the
apparent losses in Sana'a water network especially as this value is likely to have much
higher percentage.
Bottom up approach requires hydraulic conditions that are not met by Sana'a water
network's current conditions as concluded by the experience of Water and Environment
Center (2010), and according to the zoning attempts made by the utility.
The third method, component based analysis, is a data-based method. NRW data in
Sana'a water utility lacks accuracy and completeness. It is also recommended that the

51
component based approach should not be used on its own due to its high level of
uncertainty.
Therefore, none of these methods could supply acceptable results for NRW assessment.
In such a context, the suggested novel methodology, The Reverse Approach, has been
applied to assess NRW in Sana'a water utility;; SWSLC. Chapter 3 demonstrates the
suggested methodology and presents the equations through which this methodology is
implemented.
4.3.3 The Assessment Steps
The primary step is defining the volume of NRW by subtracting volumes of billed water
from produced water. Then, determining the three components of NRW in the order as
illustrated in Figure 4.1. First, unbilled authorized consumption was derived from
Sana'a water utility's reports;; next apparent losses were estimated using the suggested
approach;; and so Real losses were defined by subtracting the volumes of unbilled
authorized consumption and apparent losses from NRW volume.
4.3.4 Determining Volume of NRW
NRW was set as the difference between adjusted produced water and adjusted billed
water for the period of 2009 as shown in Figure 4.2.
First, the assessment period was defined. Then produced water (system input volume)
was adjusted to production meters inaccuracies. Billed consumption (metered and
unmetered) was obtained and computed. In the end, time lag between produced water
and billed water was considered to give the adjusted volume of NRW.
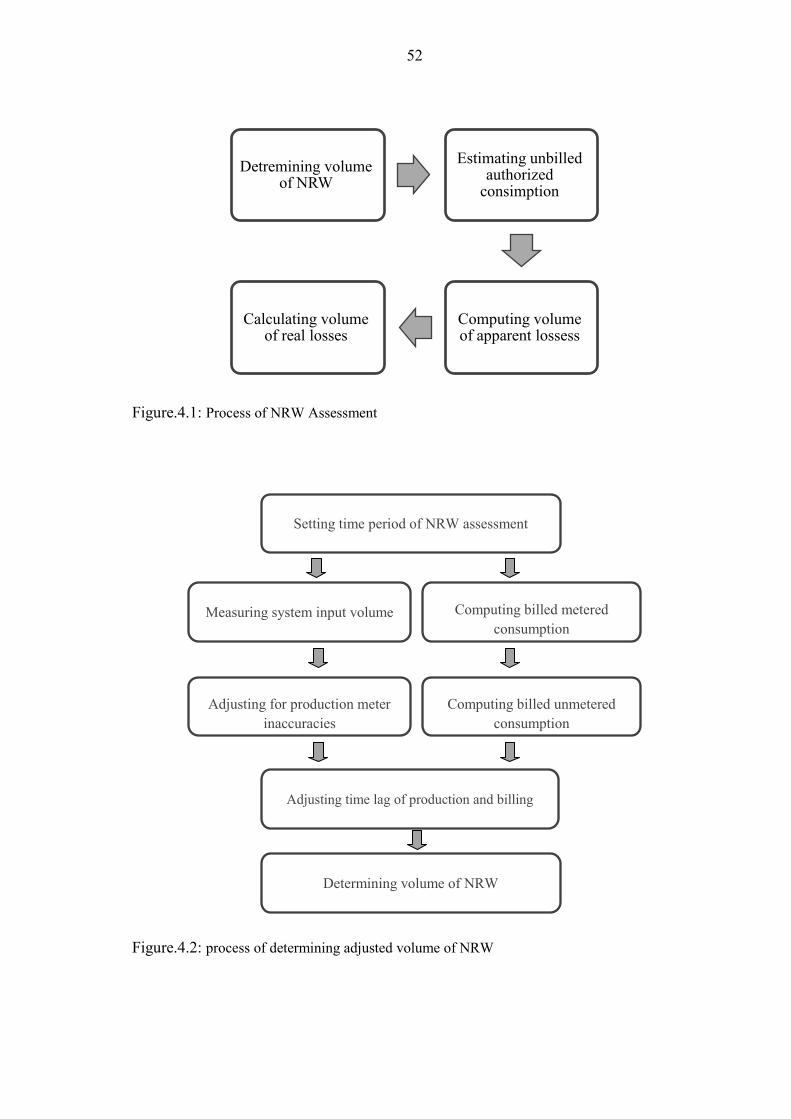
52
Detremining volume of NRW
Estimating unbilled authorizedconsimption
Computing volume of apparent lossess
Calculating volume of real losses
Setting time period of NRW assessment
Adjusting time lag of production and billing
Determining volume of NRW
Measuring system input volume Computing billed metered consumption
Adjusting for production meter inaccuracies
Computing billed unmetered consumption
Figure.4.1: Process of NRW Assessment
Figure.4.2: process of determining adjusted volume of NRW

53
Time period
For the purpose of assessing NRW in general, one year period is recommended by
AWWA as it is long enough to include seasonal variations and reduces the effects of lag
time in customer meter readings (AWWA, 2009). Hence, NRW in Sana'a water utility
was assessed for one complete year;; 2009.
System Input Volume Adjustment
The system input volume (produced water) was adjusted for production meter
inaccuracies. Since it is not possible for the time frame of this study to conduct accuracy
analysis and experiments for the production meters, the production meter inaccuracy
was assumed at 7% under-registration based on the estimation of the production unit in
Sana'a water utility. This estimation is justified by the following:
There is no maintenance programmed for production meters by Sana'a water
utility. The production meters are examined or maintained only once they are
stopped or too low readings are obtained.
Some meters are not installed according to their manuals that require minimum
straight distance before water meter or specified sizes of pipe diameters.
Water flow is of low level in the production pipes because of regression of wells'
production as a result of water scarcity in the basin.
Billed Metered and Unmetered Consumption
Metered consumption and the estimated unmetered consumption of customers with flat
rate policy were obtained from the billing records of Sana'a water utility. Then the billed
water (metered and unmetered) was summed.
54
Lag Time Adjustment
For the reason that water produced in Sana'a water utility is billed after a month, the
production data were taken for all the months of the year 2009 except January 2009.
Instead, the billed consumption of January 2010 was counted to represent the
consumption of December 2009. Other time lag adjustments were neglected.
After all, NRW volume was determined by subtracting the adjusted volume of billed
water from the adjusted volume of produced water.
4.3.5 Estimating Unbilled Authorized Consumption
Unbilled authorized consumption has two types;; metered and unmetered. The unbilled
metered consumption in Sana'a water utility consists of the consumption of the staff in
buildings belong to the utility as they are metered as well as the exemptions and wells
guards' consumption.
The unbilled unmetered consumption in Sana'a water utility consists of water used for
pipes washing, firefighting, special institutions, and consumption of some notable
people. All these types are supplied by means of water tankers, and thus estimated by
the number of the tankers per year for each type in every administrative zone.
The unbilled authorized consumption (metered and unmetered) was estimated by
obtaining relevant data from the internal reports of the utility.
4.3.6 Calculating Volume of Apparent Losses
Adjusting the suggested approach for the case of Sana'a
Besides having an intermittent supply pattern, Sana'a water utility provides insufficient
water for many zones in the city. This has led to emerging and expanding the industry
of private water tankers as a supplement water supply for the city once there is water
shortage at the customers' side.

55
The supplementary supply of Sana'a city enters the sewers and eventually reaches
Sana'a wastewater treatment plant as illustrated in Figure 4.3 and Figure 4.4 For the
purpose of calculating apparent losses by using the WWTP inflow measurements,
volume of water supplementary supply that reaches WWTP should be considered.
Therefore, Equation.3.5 of apparent losses determination in Chapter 3 was adjusted to
Equation 4.1 in which supplementary supply is considered as follows:
Qa = Qww Qbw Quac + Qout + Qex Qin - Qss ...Eq.4.1
Where:
Qa: Apparent losses volume Qww: Inflow of the wastewater treatment plant
Qbw: Billed water consumption.
Quac: Unbilled authorized consumption;;
Qout: Outdoor use consumption;;
Qex: Exfiltration volume.
Qin: Infiltration volume
Qss: Volume of supplementary water supply that reaches the treatment plant and not considered
in the billing records of the billed consumption.
Figure.4.3: Illustration indicating the supplementary water supply in the water balance of Sana'a water utility
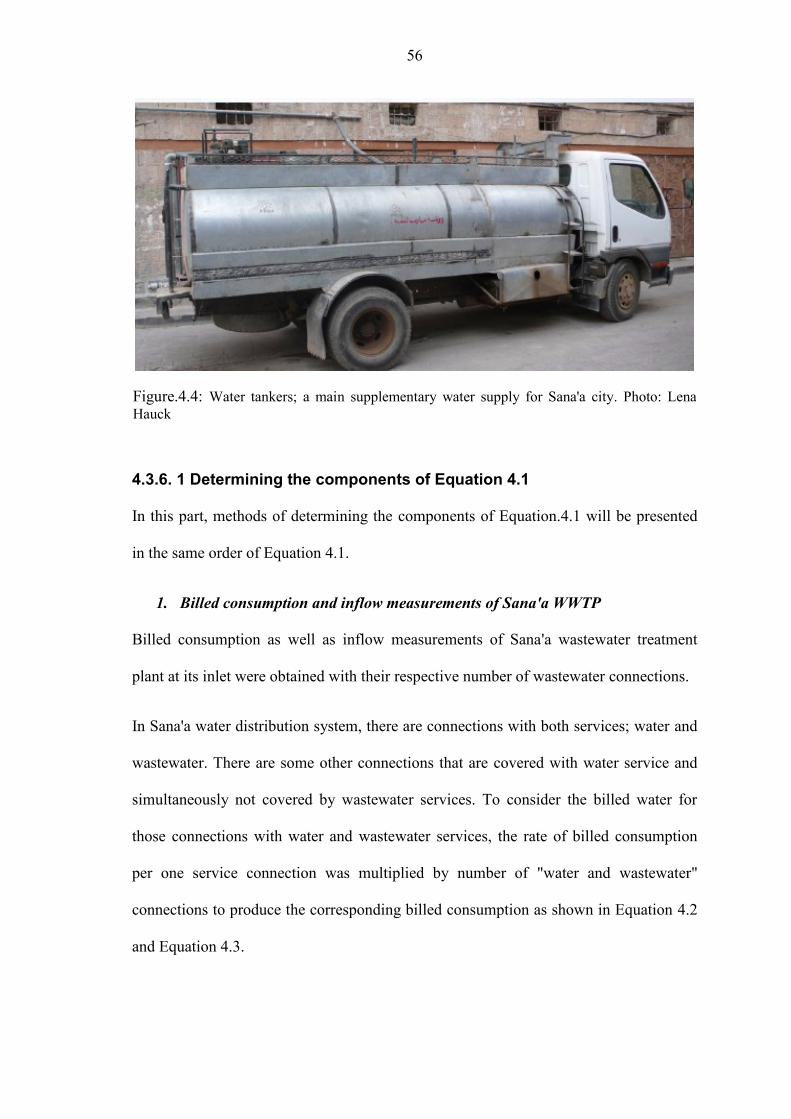
56
4.3.6. 1 Determining the components of Equation 4.1
In this part, methods of determining the components of Equation.4.1 will be presented
in the same order of Equation 4.1.
1. Billed consumption and inflow measurements of Sana'a WWTP
Billed consumption as well as inflow measurements of Sana'a wastewater treatment
plant at its inlet were obtained with their respective number of wastewater connections.
In Sana'a water distribution system, there are connections with both services;; water and
wastewater. There are some other connections that are covered with water service and
simultaneously not covered by wastewater services. To consider the billed water for
those connections with water and wastewater services, the rate of billed consumption
per one service connection was multiplied by number of "water and wastewater"
connections to produce the corresponding billed consumption as shown in Equation 4.2
and Equation 4.3.
Figure.4.4: Water tankers;; a main supplementary water supply for Sana'a city. Photo: Lena Hauck

57
Qconn = Qbcwc/ Nw conn
Qbcwwc = Qconn . Nww conn 4.3
Where;;
Qconn: Rate of billed consumption per each water connection
Qbcwc: Billed consumption for all water connections
Nw conn: Nr. of water connections
Qbcwwc: Billed consumption for connections that have water and wastewater service
Nww conn: Nr. connections that have water and wastewater service
Afterwards, the calculated volumes of apparent losses were modified for the whole
water connections.
2. Estimating the Outdoor Water Use in Sana'a City
There are three methods for estimating outdoor use;; summer winter method, minimum
month method, and average winter month method (Chapter 3). All these methods
depend on studying the seasonal variance of water consumption to deduce outdoor use
consumption. In consequence, monthly consumption data are required to implement
these methods.
There is no representative monthly consumption data for Sana'a city. Monthly
consumption records in Sana'a water utility do not represent the real variance of
seasonal consumption of consumers since supply by Sana'a water utility is insufficient.
Most customers use all amounts of water they could get from Sana'a water utility to
minimize the need for a more expensive supplementary supply via tankers. For this
reason, two steps were made to estimate outdoor use consumption in Sana'a city:
(1) Estimating outdoor use for another city with similar influencing characteristics;; and
here the only city in Yemen with representative consumption data is Dhamar city.
58
Therefore, outdoor water use for Dhamar city was estimated to supply assumption for
Sana'a city.
(2) Consulting local water experts in Sana'a city;; water experts in Water and
Environment Center in Sana'a University were consulted for estimating outdoor water
use consumption in Sana'a city (WEC, 2010).
3. Estimating Exfiltration from the Sewers
The exfiltration from the sewers is estimated by deducting the wastewater generated at
the demand site from the wastewater volume at the entrance of WWTP using Equation
3.6b. Despite the fact that there is no infiltration into the sewers in Sana'a wastewater
network as the ground table is far enough from the sewers level, there might be
marginal amount of water leakages that find its way to sewers and thus already implied
in the equation.
Qex-Qinf = Np . Qcap . (1- Qout%) + Qind - Qww .3. 6b
Where;;
Qex: Exfiltration
Qinf: Infiltration
Np: Nr. of population served
Qcap: per capita water consumption
Qout%: outdoor use percentage from water consumption
Qind: Industrial wastewater discharge
Qww: WWTP inflow
Population served by wastewater service
There are no exact figures for how many people are served by wastewater service or
water service. Sana'a water utility assumes the figure 6.9 people for each water
connection or wastewater connection as there has not been any inventory in this regard.
This figure is assumed after the statistical census in 2004 that has estimated the number
of people for each family at 6.9 people (Central Statistical Organization, 2006). This
59
assumption implies that there is only one family served by each service connection
which is not necessarily true. Therefore, figures of Sana'a water utility was not used for
estimating exfiltration rate by Eq3.6b.
Instead, it was assumed that the number per each service connection is 13 people after
AL-Washali, et al., (2006) who made a survey for 539 households in five different
zones in the city. The survey has shown that around 48% of the surveyed connections
serve one family, 33.7% for two families, 8.7% for three families, 4.6% for four
families, 2.8% for six families, and 1.8% for eight families. Therefore, the average
number of people served by each service connection is 13 people.
Hence, the population served by the service was calculated by multiplying this figure
with the number of the service connection for the wastewater service.
Per capita consumption
Per capita consumption for Sana'a city as appears in the PIIS report of the Ministry of
Water and Environment (MWE, 2008) is with an average of 61.4L/day for the year
2006 and 2007. This figure does not imply any losses as it is driven from the billing
records and number of the consumers for these records in areas with sufficient supply.
Industrial discharge and WWTP inflow
The other data of the WWTP inflow measurement and the industrial consumption was
obtained from Sana'a water utility. The industrial consumption is very low at Sana'a
water utility and has types of industries that have no outdoor use such as central
slaughterhouses;; therefore, the discharge of the industrial activities was assumed to be
similar to its consumption.

60
Water Tankers
Nr. of wells withtin the service area (GIS maps and discussion in SWSSLC)
average production for each tankers' well (NWRA)
supplementary supply via tankers is defined
Small Private Networks
Nr. and locations of the private networks
production data for each well of private network (NWRA)
suplementary supply via private network is defined
4. The volume of the supplementary Water Supply
Wells that contribute to the city supply and eventually their production were reflected in
Sana'a WWTP inflows were first inventoried and then their production quantities were
estimated. Figure 4.5 illustrates the process of estimating the supplementary water
supply volume within the service areas of Sana'a water utility. GIS maps were
generated to record the number of wells within the service area and then production of
these wells were estimated based on a study conducted by National Water Resources
Authority (NWRA, 2006b).
Inventory of wells' number
To have the right number of how many wells contributes to the city supply within
service areas through water tankers, GIS maps were generated and then number of wells
within the boundary of the service was defined by Sana'a water utility.
Figure.4.5: Proccess of estimating volume of suplementary water supply within service araes of Sana'a water utility

61
First, location data for all the wells in Sana'a were obtained from the database of
NWRA (2010). Then, data of water and wastewater networks shape files were taken
from the GIS units of Sana'a water utility. Both types of data as well as remote sensed
image for Sana'a city were processed in the Arc GIS Packages to generate maps that
contain the boundaries of water and wastewater network and the private wells used in
the supplementary supply for the city as shown in Figure 4.6. Afterwards, the private
wells used for filling water tankers within the places of the wastewater service were
inventoried. Similarly, the locations of the few private wells that supply small private
networks were obtained from the database of NWRA (2010) and reflected in Figure 4.6.
Then, a discussion has been made in the wastewater projects department in Sana'a water
utility to define the boundaries of the service in 2009. After all, the numbers of the wells
that supplement the water supply in Sana'a city within the boundaries of the wastewater
network were defined.
Estimation production quantity of supplementary supply
To determine the quantity of water that those wells produce annually, the production
data and the tankers inventory were obtained from NWRA (2010, 2006b). The water
tankers' inventory data shows the following
Average number of the tankers filled by each well;;
Average number of times each tanker in the city is filled annually with
consideration to the number of working days per year;; and
Average volume of the different shapes and types of tankers.
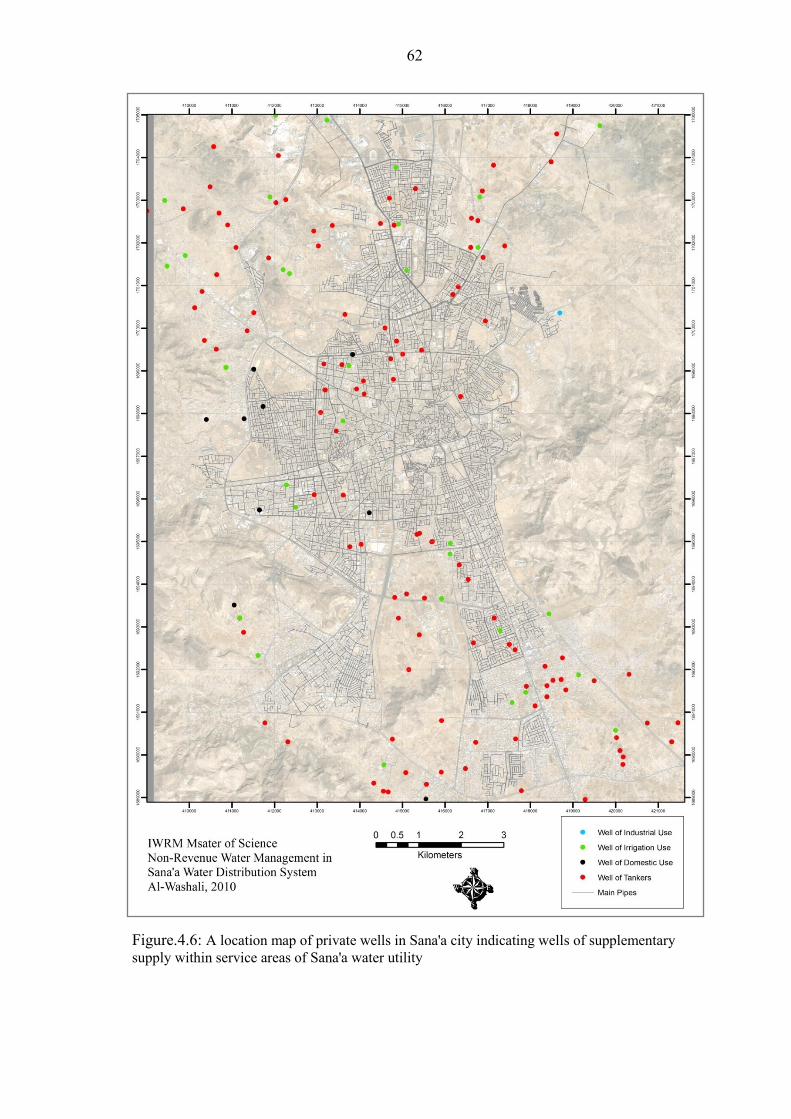
62
Figure.4.6: A location map of private wells in Sana'a city indicating wells of supplementary supply within service areas of Sana'a water utility

63
Based on these data the study provides the average production for each tanker's well in
Sana'a in terms of the volume of the filled tankers per year. Part of this quantity is used
for non-domestic uses and 87.3% is used for the drinking and domestic uses (NWRA,
2006b).
The other private wells that supply small networks have production data based on the
average production flow and the working hours per year, and thus is also obtained from
the database of NWRA.
For the five private networks that are located within service area, it was assumed that
there are no losses and leakages in these networks as NRW level in these small
networks is very low and the leakages are with negligible quantities (Al-Hamdi, 2000).
Henceforth, the additional water that reaches the WWTP besides that produced by
SWSLC was calculated for the subject service connections, and thus, Equation 4.1 for
the suggested approach is computed, and the volume of the apparent losses component
was determined.
4.3.7 Calculating the real losses
As the apparent losses are defined and the unbilled authorized consumption is
estimated, then real losses could be calculated straightforward from the following
formula:
Real Losses = NRW- Apparent Losses - Unbilled authorized consumption
4.3.8 Using NRW software
There are three main reasons for integrating NRW software in the process of NRW
assessment in Sana'a water utility: (1) To visualize the results in form of the standard
NRW water balance;; (2) To avoid the calculating errors during the assessment process;;
and (3) To derive the cost of NRW components.
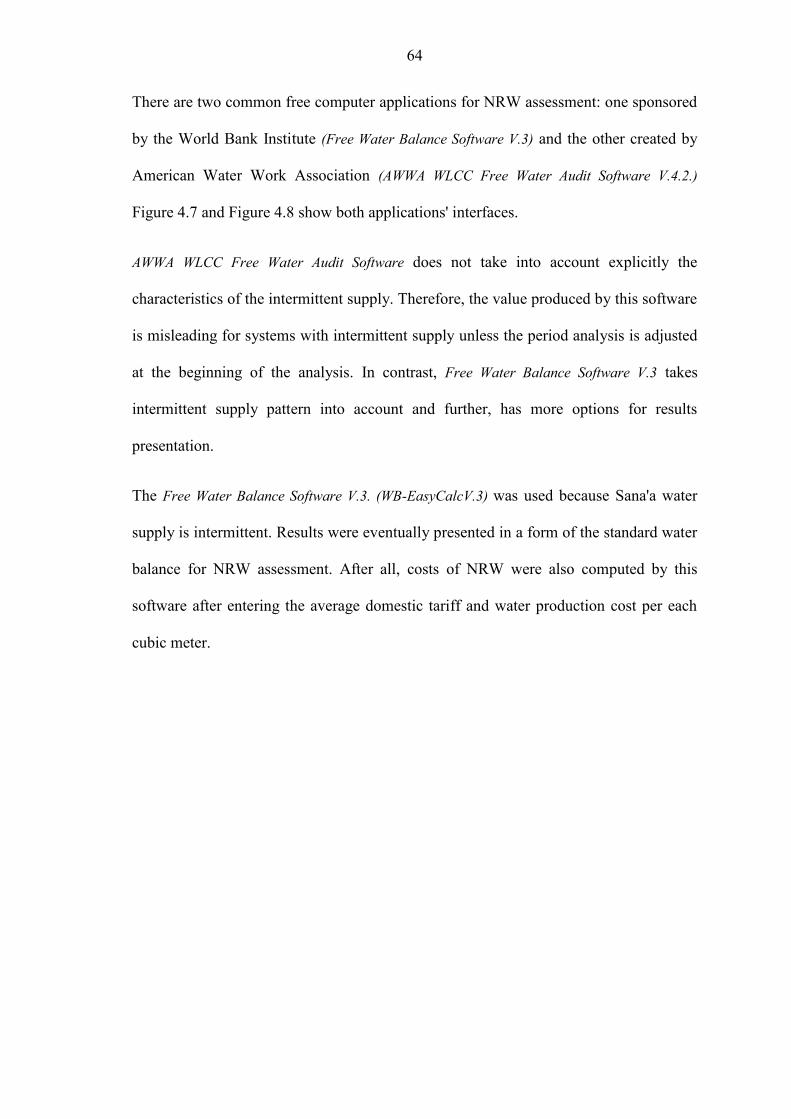
64
There are two common free computer applications for NRW assessment: one sponsored
by the World Bank Institute (Free Water Balance Software V.3) and the other created by
American Water Work Association (AWWA WLCC Free Water Audit Software V.4.2.)
Figure 4.7 and Figure 4.8 show both applications' interfaces.
AWWA WLCC Free Water Audit Software does not take into account explicitly the
characteristics of the intermittent supply. Therefore, the value produced by this software
is misleading for systems with intermittent supply unless the period analysis is adjusted
at the beginning of the analysis. In contrast, Free Water Balance Software V.3 takes
intermittent supply pattern into account and further, has more options for results
presentation.
The Free Water Balance Software V.3. (WB-EasyCalcV.3) was used because Sana'a water
supply is intermittent. Results were eventually presented in a form of the standard water
balance for NRW assessment. After all, costs of NRW were also computed by this
software after entering the average domestic tariff and water production cost per each
cubic meter.
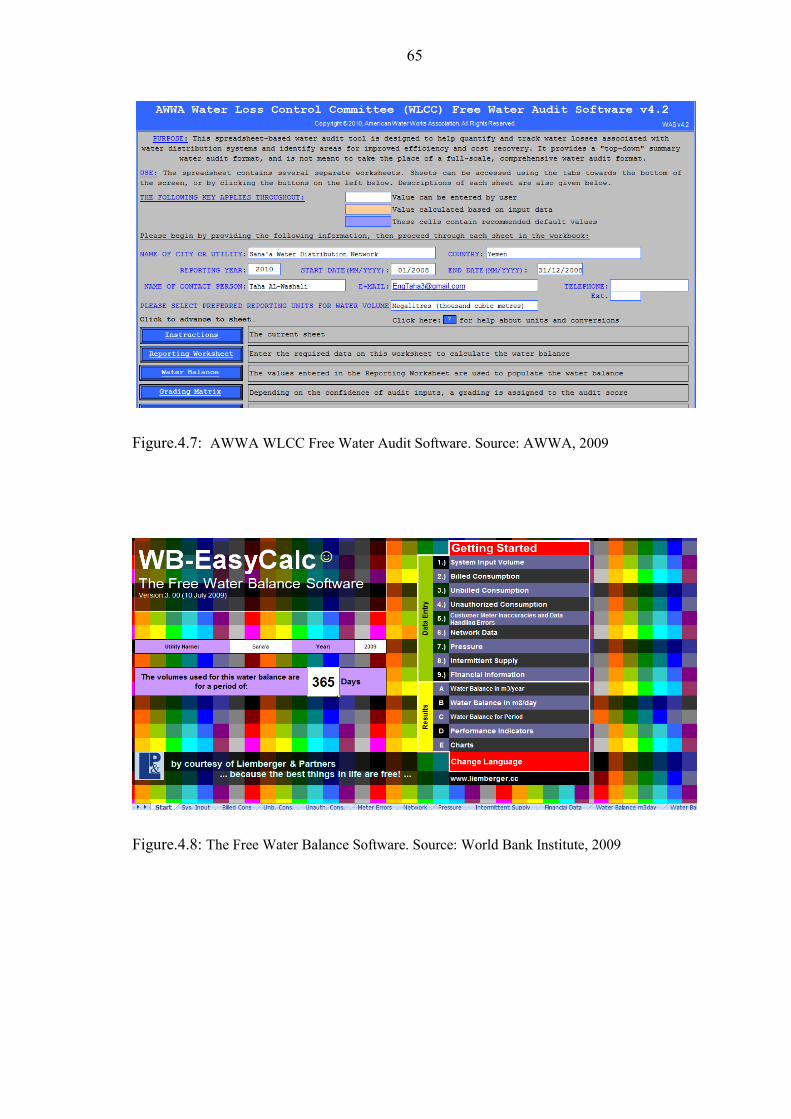
65
Figure.4.7: AWWA WLCC Free Water Audit Software. Source: AWWA, 2009
Figure.4.8: The Free Water Balance Software. Source: World Bank Institute, 2009

66
4.4. Results and Discussions
4.4.1. Volume of Non-Revenue Water
Non-revenue water in Sana'a water distribution system makes up 38.75% of system
input volume as shown in Figure 4.9, and stands for 23665 M3/day. Table.4.1 shows the
volume of NRW, the volume of billed water, and the adjusted volume of produced
water for Sana'a water distribution system with consideration to time lag adjustment in
the year 2009. If no adjustment for the production meters inaccuracies were made,
NRW would be 34.5% of system input volume. Therefore, 4.25% is losses that are
important to be, but usually not, considered when determining the system input volume.
Table.4.1 Non-Revenue Water Volume in Sana'a Water Distribution System
Produced water (M3/year) (A)
Total Billed Water (M3/year) (B)
Non-Revenue Water (A-B)
Measured 20,832,069 Metered 13,506,402 M3/year 8,637,692
Adjusted for meter inaccuracies
1,458,245 Unmetered 146,220 M3/day 23,665
Total 22,290,314 Total 13,652,622 % of system input volume 38.75
Figure.4.9: Non-Revenue Water out of system input volume
Billed water61.25%
Non-Revenue Water38.75%
Non-Revenue Water out of System Input Volume
Billed water
Non-Revenue Water
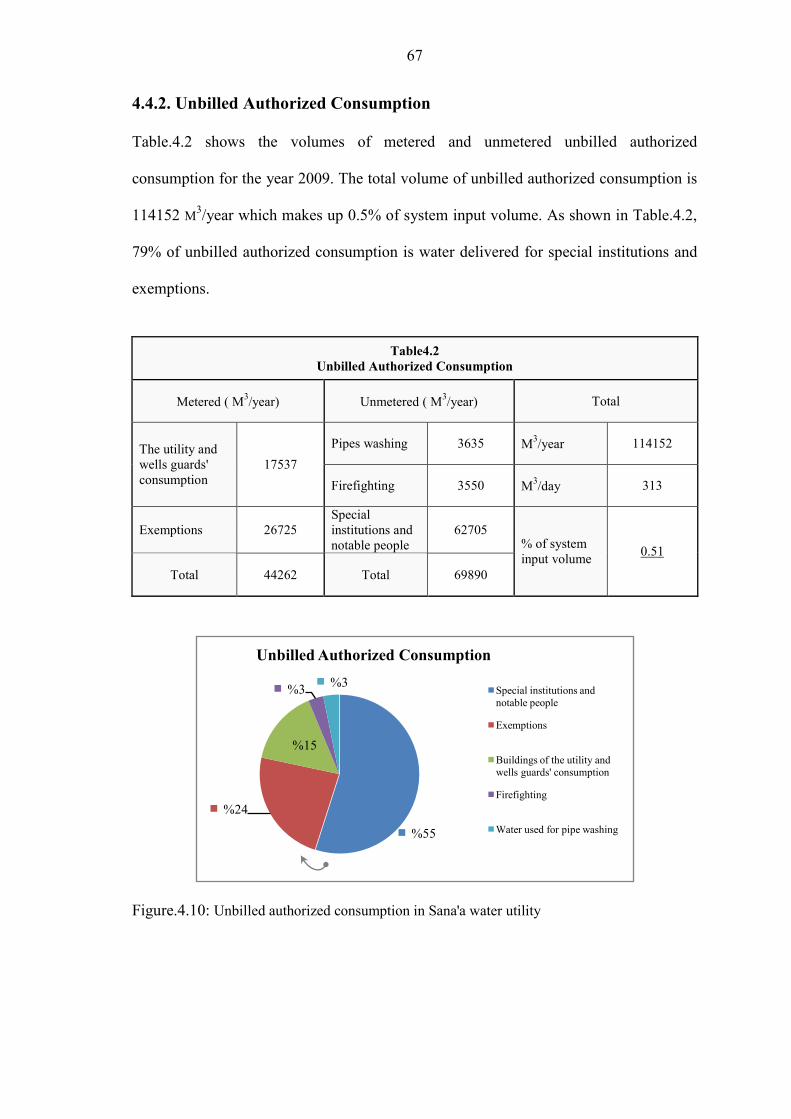
67
4.4.2. Unbilled Authorized Consumption
Table.4.2 shows the volumes of metered and unmetered unbilled authorized
consumption for the year 2009. The total volume of unbilled authorized consumption is
114152 M3/year which makes up 0.5% of system input volume. As shown in Table.4.2,
79% of unbilled authorized consumption is water delivered for special institutions and
exemptions.
Table4.2 Unbilled Authorized Consumption
Metered ( M3/year) Unmetered ( M3/year) Total
The utility and wells guards' consumption
17537 Pipes washing 3635 M3/year 114152
Firefighting 3550 M3/day 313
Exemptions 26725 Special institutions and notable people
62705 % of system input volume 0.51
Total 44262 Total 69890
Unbilled Authorized Consumption
Special institutions and notable people
Exemptions
Buildings of the utility and wells guards' consumption
Firefighting
Water used for pipe washing
Figure.4.10: Unbilled authorized consumption in Sana'a water utility

68
4.4.3. Apparent Losses
Wastewater inflows and its respected billed consumption
Wastewater inflow as measured at the inlet of Sana'a WWTP is 19361500 M3/year. The
billed consumption for those connections of water and wastewater connections is
12760667 as shown in Table.4.3.
Outdoor water use consumption
As this dissertation seems to be the first study that attempts to estimate outdoor water
use in Yemen, water experts of Water and Environment Center (WEC) were consulted
for their expectations of outdoor use in Sana'a city. Experts of WEC (2010) expect
outdoor water use in Sana'a city around 3%.
This low value is justified by the very limited areas of yards and irrigation land in the
premises of the city. Jorgensen, et al. (2009) and Mitchell, et al. (1999) highlighted that
there is a link between housing density and outdoor water use due to the size of the
premises' gardens;; Outdoor use generally increases with spacious blocks and decreases
with high-density units in the city.
On the other hand, results of the three methods of outdoor water use estimation for
Dhamar city would supply general trends of outdoor use in Yemen and allow realistic
Table.4.3 Billed Water ( M3 per year)
13652622 Total Billed water
83374 Nr. of water connections
163.75 Rate of billed water per connection
77927 Nr. of WW connections
12760667 billed water for WW connections
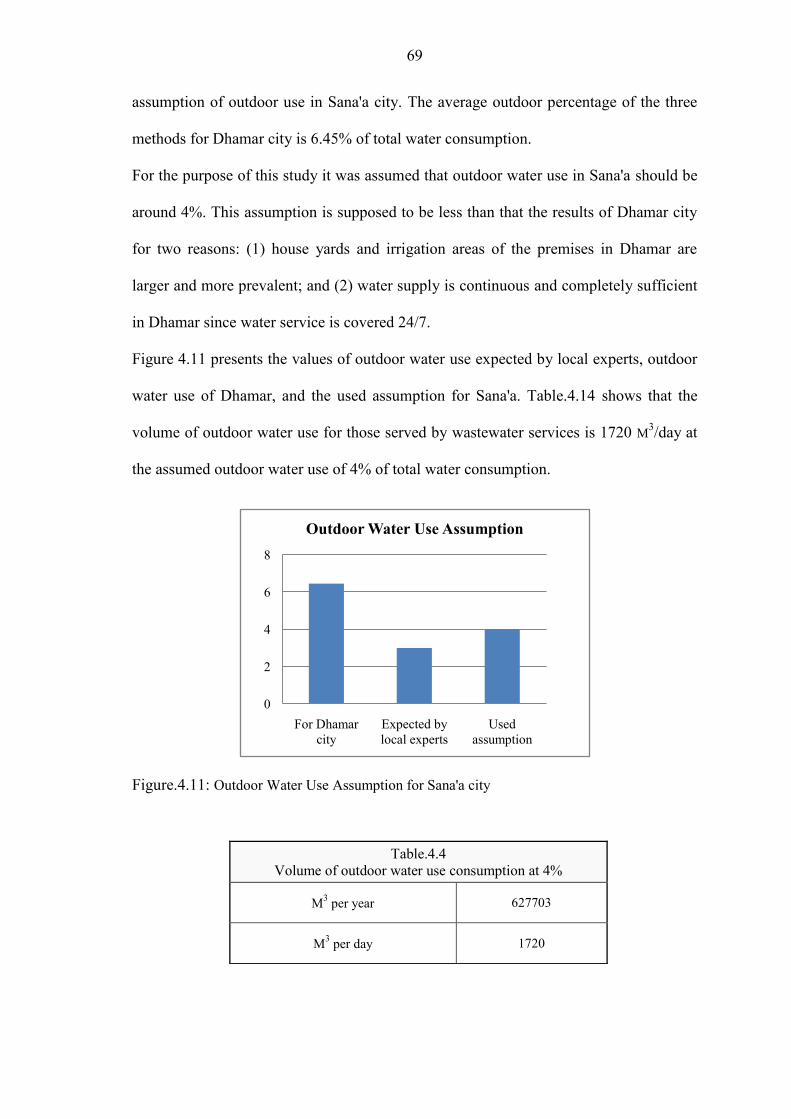
69
assumption of outdoor use in Sana'a city. The average outdoor percentage of the three
methods for Dhamar city is 6.45% of total water consumption.
For the purpose of this study it was assumed that outdoor water use in Sana'a should be
around 4%. This assumption is supposed to be less than that the results of Dhamar city
for two reasons: (1) house yards and irrigation areas of the premises in Dhamar are
larger and more prevalent;; and (2) water supply is continuous and completely sufficient
in Dhamar since water service is covered 24/7.
Figure 4.11 presents the values of outdoor water use expected by local experts, outdoor
water use of Dhamar, and the used assumption for Sana'a. Table.4.14 shows that the
volume of outdoor water use for those served by wastewater services is 1720 M3/day at
the assumed outdoor water use of 4% of total water consumption.
Table.4.4 Volume of outdoor water use consumption at 4%
627703 M3 per year
1720 M3 per day
0
2
4
6
8
For Dhamar city
Expected by local experts
Used assumption
Outdoor Water Use Assumption
Figure.4.11: Outdoor Water Use Assumption for Sana'a city

70
To analyze the impacts of outdoor water use on the accuracy of the results of NRW
assessment in Sana'a water distribution system, apparent losses were manipulated with
the outdoor percentage as shown in Figure 4.12. It is found that outdoor water use has
no major impact on NRW assessment through the reveres approach;; rather, it has a
slight influence on the volume of apparent losses. As shown in Figure 4.12, each
increase of outdoor water use by 1% causes apparent losses decreases by 0.28% of
system input volume. Therefore, there is no significant influence of outdoor water use
volume on volume of apparent losses. For Sana'a case, outdoor water use should lie
between 3-5% of water consumption. If so, the precision of the results of apparent
losses would be ± 0.28% of system input volume due to potential errors for estimating
outdoor water use consumption.
20
22
24
26
28
30
32
Outdoor Use %
Influence of Outdoor Use on Apparent Losses Calculation through the Suggested Approach
Apparent Losses % of system input volume
Figure.4.12: Apparent losses and outdoor water use manipulation
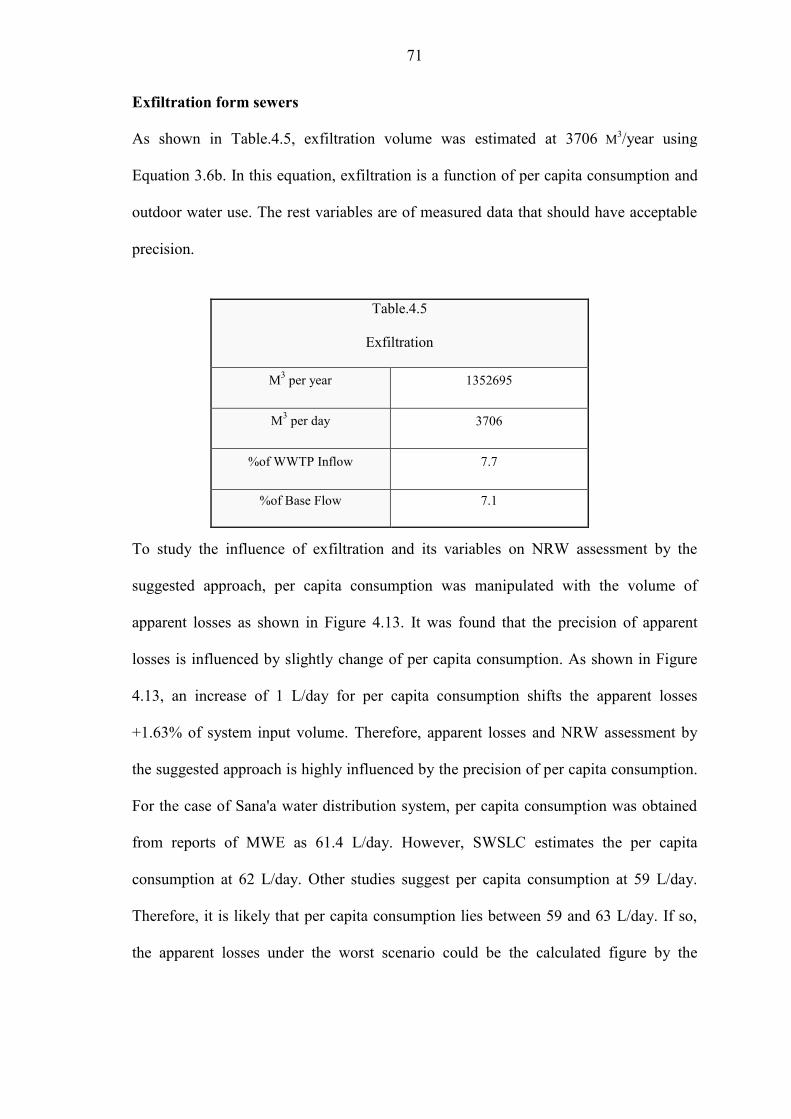
71
Exfiltration form sewers
As shown in Table.4.5, exfiltration volume was estimated at 3706 M3/year using
Equation 3.6b. In this equation, exfiltration is a function of per capita consumption and
outdoor water use. The rest variables are of measured data that should have acceptable
precision.
To study the influence of exfiltration and its variables on NRW assessment by the
suggested approach, per capita consumption was manipulated with the volume of
apparent losses as shown in Figure 4.13. It was found that the precision of apparent
losses is influenced by slightly change of per capita consumption. As shown in Figure
4.13, an increase of 1 L/day for per capita consumption shifts the apparent losses
+1.63% of system input volume. Therefore, apparent losses and NRW assessment by
the suggested approach is highly influenced by the precision of per capita consumption.
For the case of Sana'a water distribution system, per capita consumption was obtained
from reports of MWE as 61.4 L/day. However, SWSLC estimates the per capita
consumption at 62 L/day. Other studies suggest per capita consumption at 59 L/day.
Therefore, it is likely that per capita consumption lies between 59 and 63 L/day. If so,
the apparent losses under the worst scenario could be the calculated figure by the
Table.4.5
Exfiltration
1352695 M3 per year
3706 M3 per day
7.7 %of WWTP Inflow
7.1 %of Base Flow
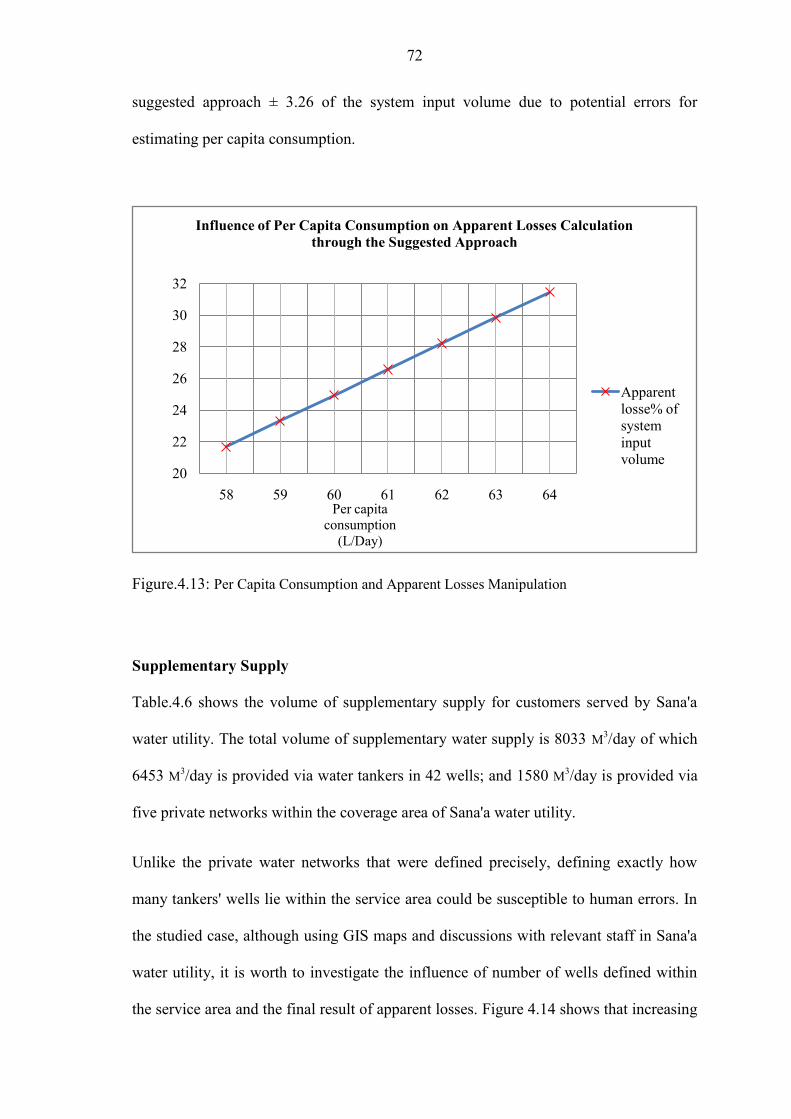
72
suggested approach ± 3.26 of the system input volume due to potential errors for
estimating per capita consumption.
Supplementary Supply
Table.4.6 shows the volume of supplementary supply for customers served by Sana'a
water utility. The total volume of supplementary water supply is 8033 M3/day of which
6453 M3/day is provided via water tankers in 42 wells;; and 1580 M3/day is provided via
five private networks within the coverage area of Sana'a water utility.
Unlike the private water networks that were defined precisely, defining exactly how
many tankers' wells lie within the service area could be susceptible to human errors. In
the studied case, although using GIS maps and discussions with relevant staff in Sana'a
water utility, it is worth to investigate the influence of number of wells defined within
the service area and the final result of apparent losses. Figure 4.14 shows that increasing
20
22
24
26
28
30
32
Per capita consumption (L/Day)
Influence of Per Capita Consumption on Apparent Losses Calculation through the Suggested Approach
Apparent losse% of system input volume
Figure.4.13: Per Capita Consumption and Apparent Losses Manipulation

73
the number of wells by one well decreases the apparent losses by 0.26% of system input
volume.
Therefore, no big influence do wells have on apparent losses determination. In the study
case, worst scenario lies between 39-45 wells. Therefore, the apparent losses should be
the estimated value by the suggested approach ± 0.78% of system input volume due to
potential human errors when counting the number of wells within the service area.
Table.4.6 Supplementary Water Supply
supplementary supply via filled tankers supplementary supply via private networks
64233 average water volume for each well ( M3/year)* 5.0 Nr. of wells within the
coverage area
87.3 % of domestic use 8.65 average production flow for the wells (L/sec)
56076 volume of domestic use for each well ( M3/year)
2642 dry seasons working hours
1062 wet seasons
42 Nr. of wells within the service coverage areas 576713 total Supply ( M3/year)
2355185 total supply ( M3/year) 1580 total Supply ( M3/day)
6453 total supply ( M3/day) * average water volume for each well is estimated based on 337.5 filled tankers per week and 3.65 average volume for the tanker (NWRA, 2006b)
Total Supplementary Supply ( M3/year)
2931898
Total Supplementary Supply ( M3/day)
8033
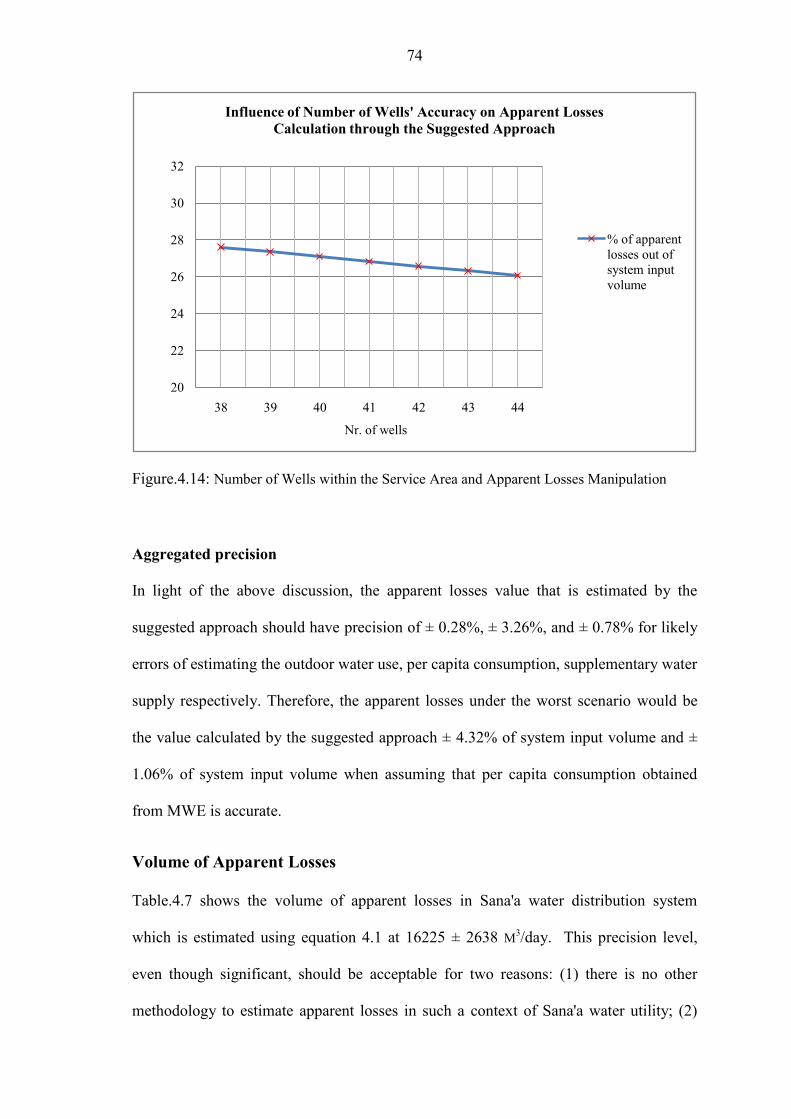
74
Aggregated precision
In light of the above discussion, the apparent losses value that is estimated by the
suggested approach should have precision of ± 0.28%, ± 3.26%, and ± 0.78% for likely
errors of estimating the outdoor water use, per capita consumption, supplementary water
supply respectively. Therefore, the apparent losses under the worst scenario would be
the value calculated by the suggested approach ± 4.32% of system input volume and ±
1.06% of system input volume when assuming that per capita consumption obtained
from MWE is accurate.
Volume of Apparent Losses
Table.4.7 shows the volume of apparent losses in Sana'a water distribution system
which is estimated using equation 4.1 at 16225 ± 2638 M3/day. This precision level,
even though significant, should be acceptable for two reasons: (1) there is no other
methodology to estimate apparent losses in such a context of Sana'a water utility;; (2)
20
22
24
26
28
30
32
Nr. of wells
Influence of Number of Wells' Accuracy on Apparent Losses Calculation through the Suggested Approach
% of apparent losses out of system input volume
Figure.4.14: Number of Wells within the Service Area and Apparent Losses Manipulation
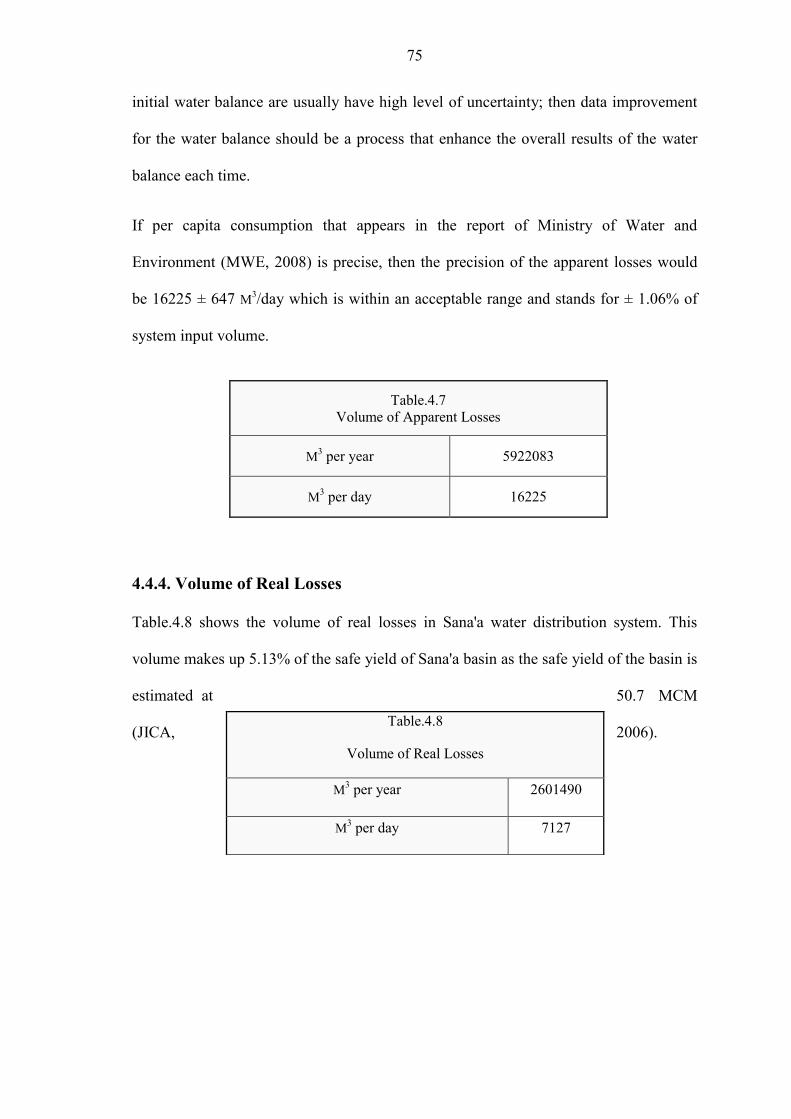
75
initial water balance are usually have high level of uncertainty;; then data improvement
for the water balance should be a process that enhance the overall results of the water
balance each time.
If per capita consumption that appears in the report of Ministry of Water and
Environment (MWE, 2008) is precise, then the precision of the apparent losses would
be 16225 ± 647 M3/day which is within an acceptable range and stands for ± 1.06% of
system input volume.
4.4.4. Volume of Real Losses
Table.4.8 shows the volume of real losses in Sana'a water distribution system. This
volume makes up 5.13% of the safe yield of Sana'a basin as the safe yield of the basin is
estimated at 50.7 MCM
(JICA, 2006).
Table.4.7 Volume of Apparent Losses
5922083 M3 per year
16225 M3 per day
Table.4.8
Volume of Real Losses
2601490 M3 per year
7127 M3 per day

76
4.4.5. Non-Revenue Water Breakdown
Table.4.9 shows the three components of NRW as a percentage of system input volume.
The dominant component of NRW is the apparent losses which make up 26.57% of
system input volume and stand for 68.57% of NRW volume as shown in Figure 4.15.
Real losses are only 30% of NRW volume in Sana'a water distribution system, and
unbilled authorized consumption is of marginal volume with only 1.3% of NRW
volume.
It is worth to mention that Sana'a water utility assumes 50% for apparent losses and
50% for real losses in its reports such as the production and distribution report
(SWSLC, 2009b). Nevertheless, as will be presented in the next chapters, staff of Sana'
water utility expect apparent losses to be around 60% and real losses around 40%. The
outputs of NRW assessment of this study are close to what is expected by Sana'a water
utility, but in an objective and scientific method.
Table.4.9 NRW out of System Input Volume
61069 System Input Volume ( M3/day)
61.25 Billed Water (%)
38.75 NRW (%)
26.57 Apparent Losses (%)
11.67 Real Losses (%)
0.51 Unbilled Authorized Consumption (%)
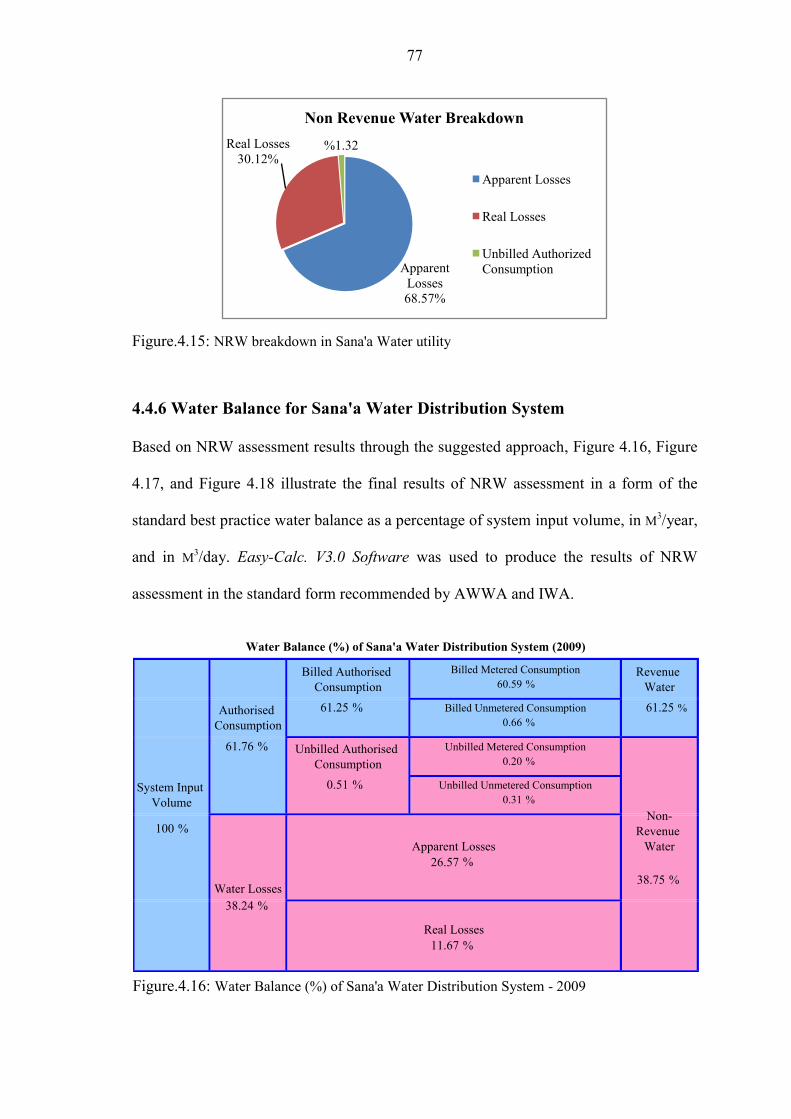
77
Figure.4.16: Water Balance (%) of Sana'a Water Distribution System - 2009
4.4.6 Water Balance for Sana'a Water Distribution System
Based on NRW assessment results through the suggested approach, Figure 4.16, Figure
4.17, and Figure 4.18 illustrate the final results of NRW assessment in a form of the
standard best practice water balance as a percentage of system input volume, in M3/year,
and in M3/day. Easy-Calc. V3.0 Software was used to produce the results of NRW
assessment in the standard form recommended by AWWA and IWA.
Apparent Losses 68.57%
Real Losses 30.12%
Non Revenue Water Breakdown
Apparent Losses
Real Losses
Unbilled Authorized Consumption
Figure.4.15: NRW breakdown in Sana'a Water utility
%Apparent Losses
Water Balance (%) of Sana'a Water Distribution System (2009)
100
Revenue Water61.25 %
Billed Metered Consumption
0.51 %
61.25 %
60.59 %
Billed Unmetered Consumption
Unbilled Metered Consumption
Unbilled Unmetered Consumption
0.20 %
0.66 %
Billed Authorised Consumption
Unbilled Authorised Consumption
%
11.67 %
38.75 %
Authorised Consumption
0.31 %
61.76
Water Losses
Non-Revenue Water
System Input Volume
38.24 %
Real Losses
26.57 %
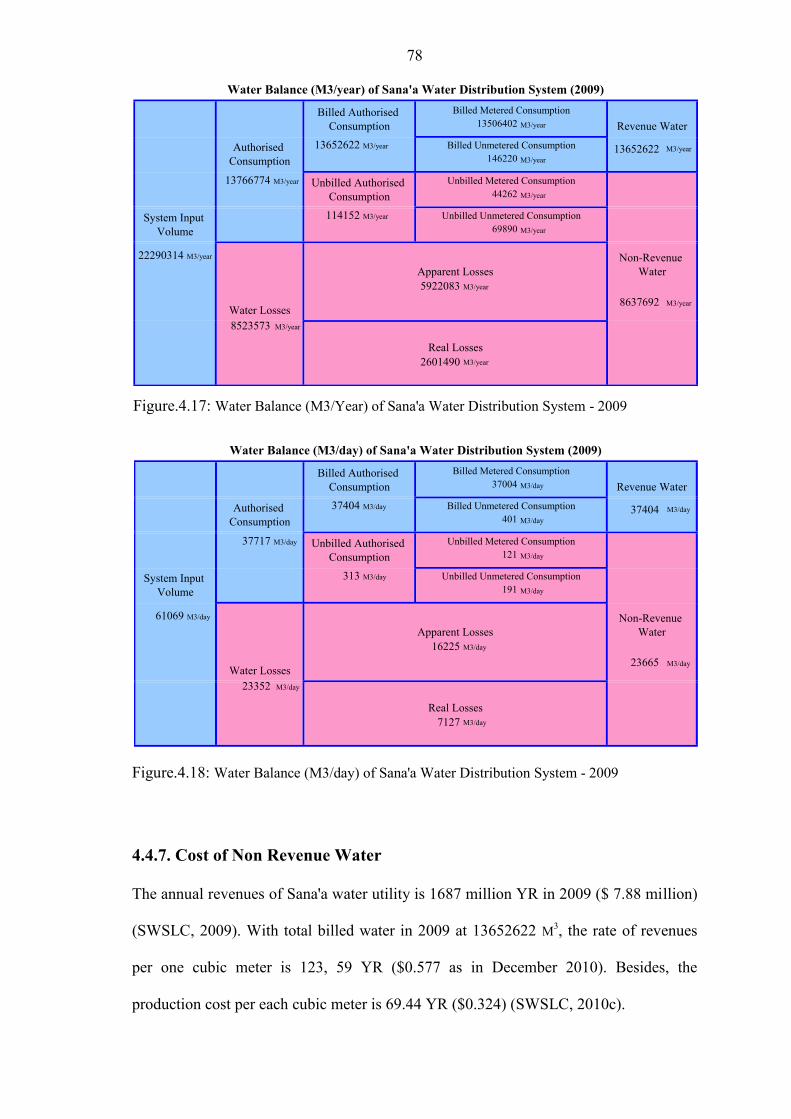
78
4.4.7. Cost of Non Revenue Water
The annual revenues of Sana'a water utility is 1687 million YR in 2009 ($ 7.88 million)
(SWSLC, 2009). With total billed water in 2009 at 13652622 M3, the rate of revenues
per one cubic meter is 123, 59 YR ($0.577 as in December 2010). Besides, the
production cost per each cubic meter is 69.44 YR ($0.324) (SWSLC, 2010c).
Figure.4.17: Water Balance (M3/Year) of Sana'a Water Distribution System - 2009
M3/year
M3/year
M3/year
M3/year
M3/year
8523573 M3/year
Real Losses2601490
5922083 M3/year
Water Losses8637692
Non-Revenue Water
22290314Apparent Losses
114152System Input Volume
M3/year Unbilled Unmetered Consumption69890 M3/year
13766774 Unbilled Authorised Consumption
Unbilled Metered Consumption44262 M3/year
146220 M3/year13652622Authorised
Consumption13652622 M3/year Billed Unmetered Consumption
Water Balance (M3/year) of Sana'a Water Distribution System (2009)Billed Metered ConsumptionBilled Authorised
Consumption Revenue Water13506402 M3/year
M3/day
23352 M3/day
Real Losses7127 M3/day
16225 M3/day23665 M3/day
Water Losses
Non-Revenue Water
61069Apparent Losses
313System Input Volume
M3/day Unbilled Unmetered Consumption191 M3/day
37717 M3/day Unbilled Authorised Consumption
Unbilled Metered Consumption121 M3/day
37404 M3/day401 M3/day
Authorised Consumption
37404 M3/day Billed Unmetered Consumption
Water Balance (M3/day) of Sana'a Water Distribution System (2009)Billed Metered ConsumptionBilled Authorised
Consumption Revenue Water37004 M3/day
Figure.4.18: Water Balance (M3/day) of Sana'a Water Distribution System - 2009

79
Based on these data the Easy-Calc. V3.0 Software drew the costs of NRW components
providing the average revenue for valuing the apparent losses and average production
cost for valuing the real losses. Figure 4.19 and Figure 4.20 show the cost of NRW in
YR and USD. NRW in 2009 cost Sana'a water utility 920.6 million YR ($4.3 million) of
which 79% are apparent losses. Real losses and unbilled authorized consumption cost
Sana'a water utility 20% and 1% respectively.
13,652,622 1,687,326,848
114,152 10,323,500 5,879,518 726,649,320
2,644,022 183,600,879
0%10%20%30%40%50%60%70%80%90%100%
m3/year YR
Volume and Value of NRW Components (Cost-YR)
Real Losses
Apparent Losses
Unbilled Authorised Consumption
Revenue Water
13,652,622 7,884,705
114,152 48,241 5,879,518 3,395,558
2,644,022 857,948
0%
10%
20%
30%
40%
50%
60%
70%
80%
90%
100%
m3/year U.S.D
Volume and Value of NRW Components (Cost- U.S.D)
Real Losses
Apparent Losses
Unbilled Authorised Consumption
Revenue Water
Figure.4.19: Cost (Yemeni Rial) of NRW in Sana'a Water Utility -2009
Figure.4.19: Cost (U.S.D) of NRW in Sana'a Water Utility -2009
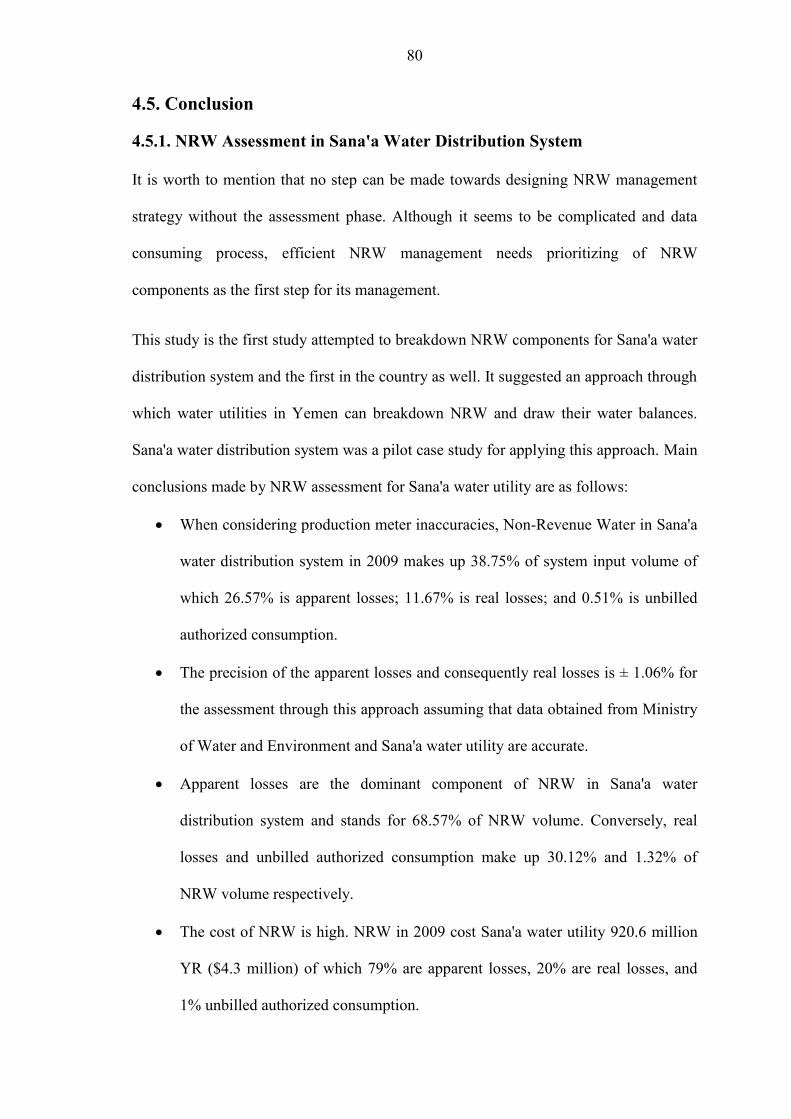
80
4.5. Conclusion
4.5.1. NRW Assessment in Sana'a Water Distribution System
It is worth to mention that no step can be made towards designing NRW management
strategy without the assessment phase. Although it seems to be complicated and data
consuming process, efficient NRW management needs prioritizing of NRW
components as the first step for its management.
This study is the first study attempted to breakdown NRW components for Sana'a water
distribution system and the first in the country as well. It suggested an approach through
which water utilities in Yemen can breakdown NRW and draw their water balances.
Sana'a water distribution system was a pilot case study for applying this approach. Main
conclusions made by NRW assessment for Sana'a water utility are as follows:
When considering production meter inaccuracies, Non-Revenue Water in Sana'a
water distribution system in 2009 makes up 38.75% of system input volume of
which 26.57% is apparent losses;; 11.67% is real losses;; and 0.51% is unbilled
authorized consumption.
The precision of the apparent losses and consequently real losses is ± 1.06% for
the assessment through this approach assuming that data obtained from Ministry
of Water and Environment and Sana'a water utility are accurate.
Apparent losses are the dominant component of NRW in Sana'a water
distribution system and stands for 68.57% of NRW volume. Conversely, real
losses and unbilled authorized consumption make up 30.12% and 1.32% of
NRW volume respectively.
The cost of NRW is high. NRW in 2009 cost Sana'a water utility 920.6 million
YR ($4.3 million) of which 79% are apparent losses, 20% are real losses, and
1% unbilled authorized consumption.

81
NRW assessment show that apparent losses volume should be prioritized for
NRW management since it is dominant and its management is cost-effective.
4.5.2. The Suggested Methodology
NRW assessment in water utilities with expected high unauthorized
consumption is difficult. Top down approach is not recommended as it
underestimates unauthorized consumption unless objective estimations for
unauthorized consumption are available. On the other hand, the only
recommended other method of NRW assessment is bottom up approach which
estimates NRW through conducting DMAs and zoning principle in their water
distribution systems. This, in turn is advanced phase of NRW management as it
is part of assets and infrastructure management which requires high technical
and financial resources.
The suggested approach is an added value in the literature of NRW
management. It provides an alternative methodology of NRW assessment and
breakdown for water utilities in countries where unauthorized consumption is
expected to be high such as developing countries. In such a case, this approach
serves as an alternative for top down approach that developed by AWWA and
IWA. The suggested approach uses usually available data of WWTP inflows,
per capita consumption, number of people served and billing records of water
utilities. All these data should be available in any water utility.
It is found in this study that determining the volume of apparent losses is
sensitive to precision of per capita consumption when exfiltration volume is
estimated through Eq.3.6b. Therefore, for the purpose of using Eq3.6b for
estimating the volume of exfiltration, per capita consumption should be
estimated precisely or other ways of estimating exfiltration rate should be used.
82
It is found in this study that accuracy of estimating outdoor water use
consumption has no significant influence on NRW assessment through the
suggested approach. This was due to the low level of outdoor water use
consumption in Sana'a city. Where there is high level of outdoor water use
consumption, further analysis should be conducted to evaluate the impact of
outdoor water use consumption' accuracy on NRW assessment through this
approach.
83
Chapter 5 Current NRW Management in Sana'a Water Utility
5.1 Research Questions
How does Sana'a water utility determine NRW, apparent losses, real losses, and
unbilled authorized consumption of its water distribution system?
What are NRW performance indicators and reduction policies adopted by Sana'a water
utility?
5.2 Research Method
To answer the objective questions of this part, related data and reports were collected
from all the relative units and departments in Sana'a water utility;; extensive review of
relevant data and reports has been conducted, field visits to the points of data sources
have been made, and exhaustive interviews (32 interviews;; pre-interviews, structured
and semi-structured interviews) throughout the different departments in the utility
headquarter as well as the administrative zones have been carried out (Appendix.2).
These tools were also used for the last objective of the research.
84
5.2.1 Data Collection
Non-Revenue Water data were collected from the relevant units. The production data
was collected from the production unit;; the annual records of leakages and repaired
leakages were acquired from the compliance and maintenance unit;; water distribution
pattern was taken from the distribution unit;; network data was gathered from the GIS
unit;; and water tariffs, billing records, number of customers, active and inactive
accounts, metered and non-metered customers, and inactive meters were gotten from the
commercial department. Besides, the annual performance and progress reports of
SWSLC were obtained from the statistical unit. Furthermore, NRW performance
indicators were collected from the Performance Indicators Information System (PIIS)
reports from the Ministry of Water and Environment (MWE, 2008). In addition, several
field visits to the reservoirs, production pumps, and production unit have been made to
consider the flow of NRW data on one hand and to assess the accuracy of the subject
data on the other hand.
To have a closer look at the procedures of NRW calculation, the internal reports of the
technical departments were tracked, obtained, and analyzed and then, further discussed
in the interview phase.
Nonetheless, it is worth to mention that data acquisition in Sana'a water utility is a hard
task. The Information Technology department is still recent, young and lacks a lot of
data. The secretarial work of the technical and commercial units and departments are of
poor information management. The data are scattered in the specialists' laptops or PC's.
Those, in turn, are either in the field or not often in their offices for various reasons.
Once the needed specialists are found, they need a complex routine of approvals for
data access. When the data are obtained, some data are missing, and the rest are of
85
questionable accuracy. However, for the purpose of this research, where no data
analysis is required, it is assumed that obtained data are accurate.
5.2.2 Field Visits
Due to the importance of the data processing and accuracy of the production input
volume in NRW calculation, field visits were conducted to the master meters, main
pumping station, and main reservoir to have a closer look at how the production data
flow through the production unit to the technical department. The way through which
production data were read, recorded, and reported was tracked in order to conclude what
the technical department's figures really measure.
Besides, visits to the fifth administrative zone were carried out to investigate the
estimates methods and the terms used in NRW internal reports that are usually sent up
to the utility headquarters.
In addition, a recent project of NRW reduction through pressure management,
implemented by VAG Consultant was investigated to consider the project status and to
derive lessons learnt.
5.2.3 Interviews
Since NRW issue interlinks with almost all the units and departments of the utility,
thirty two pre-interview, semi-structured, and structured interviews as well as re-
interviews were carried out for several units based on various sub-purposes.
Ministry of Water and Environment was targeted to tackle the legal and political
dimension of NRW management. German Technical Cooperation was approached to
consider the international cooperation aspects in NRW reduction through the ongoing

86
operation and maintenance projects with NRW reduction activities on one hand and to
highlights the potential contribution of the research in the project on the other hand.
The purpose of the pre-interviews' questions was to realize the structure and dimensions
of NRW management in the utility, the hierarchy of the utility, the Ministry of Water
and Environment role, and the research authorization matter. In contrast, re-interviews
were implemented to check and insure the critical information extracted from the
interviews.
The interviews techniques were conducted in accordance with the interview guidelines
proposed by Steinar (2007). In his guidelines, Steinar has highlighted the importance of
recording and transcription the interviews. Nevertheless, recording the interviews were
not applied in this research since it affects the "inter"- "view" process in the research's
case. In Sana'a water utility, it is rather difficult for the employees to give direct
statements when demonstrating their perspectives for issues related to their professions.
This would be more difficult and thus rejected when it is a recorded interview as
concluded from the pre-interviews phase. Instead, questions were prepared in advance,
and notes were taken immediately in the same language of the interviewee. Then the
interview notes were analyzed, and re-interviews were made when critical points have
to be rechecked.
Other aspects of the interviews techniques were considered during the implementation
phase. Main points of these techniques are: asking understandable and clear questions;;
listening carefully to the answers;; paying attention to the voice as indication of the
topic's importance and sensitivity;; following up the important statements with second
question;; noticing the effects of the questioning style on the answers;; translating the oral
language into written language;; considering ethical transgressions;; and avoiding filling
the interview with small talk (Steinar, 2007).
87
The interviews were made during the timeframe from 6th October to 7th of November
2010 (Appendix 2) during the work time in the offices of Sana'a water utility;; SWSLC.
The durations of the interview ranges from 10 to 150 minutes depending on the topic,
purpose, and the interaction process of the interview;; however, the average duration was
about 25 minutes. Eventually, the final conclusions of the interviews were deduced and
therefore, the purposes of the interviews were achieved.
In conclusion, the interviews were conducted in accordance with the interview
guidelines proposed by Steinar (2007). To ensure the completeness of the interviews,
exhaustive interviews were conducted. To increase the accuracy and avoid biases of the
interviews, some re-interviews were made, and certain questions were re-asked in other
interviews. To fulfill the confidentially ethics, the interviewees were informed about the
purpose of the study, voluntary participation, and permissions have been taken.
Afterwards, the data were synthesized and organized, information was presented, and
conclusions were deduced.
5.3. Results and Discussion
This section summaries the main aspect of NRW current management in Sana'a water
utility. However, a detailed presentation for the results of this chapter is provided in
Appendix.3.
5.3.1. NRW Assessment
Sana'a water utility underestimates the amount of NRW in its water distribution system
through two main actions: (1) The utility discounts significant amount of losses that the
utility knows its causes such as estimated amount of repaired leakages and unbilled
88
authorized consumption;; (2) No adjustment is made for system input volume although
the utility estimates production meters inaccuracies around 7% under-registration.
An example for that is volume of NRW for the year 2009 which is 38.75%. The utility
estimated it at 29%.
5.3.2. NRW Breakdown and Performance Indicators
There is no rule or methodology of NRW break down in Sana'a water utility. The utility
does not assess the components of NRW. While some of the utility reports assume 50%
of the losses to be apparent and the other 50% to be real, the dominant expectation of
the losses among the staff of the utility is around 60% for the apparent losses and 40%
for the real losses.
Regarding the performance indicators, the only used NRW performance indicator is
volume of NRW expressed in % of system input volume.
5.3.2. Real losses
The main trials have been made by Sana'a water utility to reduce real losses are: zoning;;
installing Data Center Maintenance and Management Software;; activities of network
rehabilitation;; and pressure management.
Many trials have been made to reduce leakages through zoning, but were
encountered with incompleteness of knowledge about locations of valves. They
also were faced by multi-feeding source of water for each zone or area. So far,
no trial has succeeded.
Sana'a water utility has installed Data Center Maintenance and Management
Software (DCMMS). It is a system for customer complaints and reported
leakages' maintenance. The system has a "hot line" through which customers'
complaints are recorded systematically and the time period of repairing the
89
leakages is then counted and documented with all data involved. The system
started to work recently (2009) and the average recorded repairing time is 123.7
hours for 2354 leakages in the year 2009.
The existence of DCMMS system contributed for real losses reduction through
accelerating repairing time of leakages. However, there is still high potential for
enhancing the reactive management of leakage through this system;; by
achieving shorter repairing time as its average current repairing time is 123.7
hours per leak.
Another trial is a recent project for pressure management for hilly area in
Nokom in the first zone. The project aimed at reducing pressure by installing
Pressure Reducers Valves (PRV);; however, the project has failed because of
intermittent supply for both water and electricity. Even though the project is still
recent (2008-2009), it is already stopped.
5.3.2. Apparent losses
In general, Sana'a water utility manages apparent losses through policies that are not
component-based. It neither has NRW strategy nor does it have NRW components'
prioritizing policy. While its focus and effort is in reducing meter readers' errors and
readers corrupting practices, there are no enough measures for illegal use reduction.
5.3.2.1. Reduction activities
Training for meter readers has been recently intensified within the operation and
maintenance program sponsored by GTZ trying to reduce meter reading errors
and associated corrupting practices.
Sana'a water utility conducts several, but not enough, investigation campaigns
for stopped meters or customers with too low consumption. Then estimated
90
consumptions are determined based on historical data, and bills are distributed
with the estimated consumption.
There were a lot of exemptions from paying water bills for the employees of the
utility and some customers. The policy now is replaced by providing incentives
in term of money rather than exemption of unlimited volume of water.
Sana'a water utility has suited many customers for illegal water use. However,
the utility disregard this policy for the following reasons:
The lack of clear laws and legislations dealing with illegal water
use
Lack of court ruling enforcement
Sana'a water utility intends to utilize religious position for limiting illegal water use
and has unofficial fatwa from Mofte of the Republic of Yemen denying using illegal
water for public use (particularly mosques). However, yet, no official fatwa has
been obtained by Sana'a water utility nor a planned commercial advertisement has
been implemented.
5.3.2.2. Related Illegal water use policy
Analyzing the sales' records, Sana'a water utility found that more than 50% of its
customers consume 1-10 M3 per month. It found that 33% of the customers lie in the
first tariff block and consume 1-5 M3 per month. The utility doubts that this amount is
enough for half of the customers and assumes that this indicates the high level of illegal
water use. To treat the low level of revenues caused by illegal water use, the utility
decided that 10 M3 per month is the minimum limit of consumption.
91
This reactive policy is neither water conservative nor pro poor policy. The tariff blocks
were designed by Ministry of Water and Environment (MWE) based on estimation
consumption of poor in Sana'a city around 5 M3 per month and therefore, the first block
of tariff structure was designed from 1-5 M3. Thus, the new policy contradicts the tariff
structure designed by MWE. Further, it is likely that those customers who consume less
than 10 M3 per month would increase their consumption since they already pay the price
of "water" and "wastewater" for the10 M3 every month.
5.3.3. Other Critical Points
Three other critical points should be mentioned in this section with regards to current
NRW-relevant policies in Sana'a water utility: employees' loyalty, the utility customer
relation, and number of disconnected customers. All of these points should contribute to
high level of illegal water use and apparent losses.
Employees Loyalty and Commitment
Out of 40 tampered meters a week that reach meters workshop in the utility
headquarters, 30% of these meters are tampered professionally by technicians of Sana'a
water utility as estimated by the workshop experts. This point indicates the low level of
loyalty of low level employees in Sana'a water utility. This in turn is due to low level of
incentives or job stability of the segments of low level employees.
Another point that could be mentioned here is the contradiction of how influential meter
readers might be and how good they indeed are. This contradiction could be concluded
from the following two statements for the commercial manager and the manager of the
fifth administrative zone respectively.
by their mangers are usually sent

92
The Utility Customers Relation
There is a weak utility-customer relation associated with low level of customer
confidence on Sana'a water utility. Significant decline of customer confidence level has
been recognized since the new dry water meters that "could" record air in the network
when air goes through the meter have been installed at the same time of raising water
tariff. Carrying out these two procedures at the same time has weakened the relation of
customers with the utility and affected the customers' confidence level.
Disconnected Customers
Among 18445 customers that were disconnected in 2009 because they didn't pay the
bills, only 2705 are reconnected in the same year. These figures are also close to those
of year 2008, 2007, 2006, and 2005 according to SWSLC annual reports. Accordingly,
about 15740 customers are still disconnected in spite of the fact that water price from
tankers are much higher than that provided by Sana'a water utility ($1.7 and $0.65 per
M3 respectively).
5.4. Conclusions
There is no assessment and consequently no management prioritizing for NRW
components in Sana'a water utility. As a result, NRW management is inefficient. It
treats the obvious NRW elements without consideration to its contribution to the
volume of NRW. An example, the utility measures focus on reducing meter readers'
errors more than illegal water use.
93
Sana'a water utility underestimates the volume of NRW significantly by
discounting leakages and unbilled authorized consumption, and neglecting
production meters inaccuracies.
Sana'a water utility has made many attempts to reduce real losses;; pressure
management, zoning, and installing DCMMS system. All encountered with many
difficulties and thus did not progress apart from DCMMS system. The system
enhanced the reactive leakage management in Sana'a water distribution system.
However, there is a lot of potential to further improve it by achieving shorter
repairing time for the reported leakages.
Illegal water use is significant and underlying in Sana'a water distribution system.
The following two indicators points toward it:
o When Sana'a water utility analyzed the sales' records, it found that more
than 50% of its customers consume 1-10 M3 per month and 33% of the
customers lie in the first tariff block consuming 1-5 M3 per month. The
utility doubts that less than 5 M3 per month is enough for 33% of its
customers and assumed that many of these customers use bypass illegal
connections.
o Among 18445 customers that were disconnected in 2009 because they didn't
pay the bills, only 2705 are reconnected and 15740 customers are still
disconnected in spite of the fact that water price from tankers are
significantly higher than that provided by Sana'a water utility ($1.7 and
$0.65 per M3 respectively).
Two main factors contribute to high level of illegal water use;;
o Poor customer-utility relation: The utility had not raised tariff or substitute
water meters for long time, and at once, it substituted water meters with new

94
ones that could record air;; and simultaneously raised the tariff. The
customer who used to pay the bill at certain range of price for years
suddenly found unexpected increase of his bill. Customers then assumed
that the new meters is the reason for the bill increase and this increase is just
air recorded by the new meters.
o Low level of employees' loyalty and commitment as a result of lack of
appropriate incentives or/and job stability for maintenance technicians and
meter readers. 30% of 40 tampered meters a week that reach meters
workshop are tampered by technicians of Sana'a water utility.
95
Chapter 6 Suggesting NRW Management for Sana'a Water Utility
6.1. Research Question
What NRW management options should be suitable for the context of Sana'a water
utility?
6.2. Research Method
The steps mentioned in this part were conducted after the draft results of the previous
objectives have been drawn. The following two parts (6.3 and 6.4) present the
methodology used in this chapter in order to supply management suggestions and
recommendations for improved NRW management in Sana'a water utility.
6.3. Addressing Real Losses
Literature review was the base of the suggested management options for addressing real
losses in Sana'a water distribution system.
96
6.4. Addressing Apparent Losses
Apparent losses were further analyzed for two reasons: (1) apparent losses are dominant
in Sana'a water distribution system and thus, should be prioritized;; and (2) reducing
apparent losses is always cost-effective (Kingdom, et al., 2006).
Apparent losses analysis was done using four techniques: (1) sub-component analysis
for apparent losses was carried out to define its sub-components;; (2) problem tree
analysis after European Commission (2004) was used to ensure that root causes of
apparent losses and illegal use are identified;; (3) a social questionnaire was distributed
to the utility's customers for the purpose of defining the causes of unauthorized
consumption;; (4) another questionnaire was delivered to consumers with illegal
connections for the same purpose of defining the causes of unauthorized consumption,
but here from the illegal users point of view.
6.4.1. Sub-Component Analysis for Apparent Losses
Data handling errors
Customer meter reading in Sana'a water distribution system is implemented using the
common approach whereby meter readers visit individual meters to collect readings.
This method of meter reading is likely to be susceptible to human errors. The
headquarters of Sana'a water utility implemented auditing campaign for the fifth zone in
the month of June 2010 to compare it with the consumption of May in order to
investigate the meter readings errors. The headquarters chose the fifth zone because
corrupting practices among meter readers are common to non-negligible extent. Putting
that in mind, meter readings of the fifth zone were obtained from Sana'a water utility for
the month of June, 2010 to compare the consumption in this month to the month of
97
May, 2010 in order to verify the accuracy of meter readings submitted by meter readers
for billing purposes.
Accordingly, when analyzing the readings of the fifth zone, the readings that showed
unrealistic variances were regarded as erroneous readings after Mutikanga, et al. (2010).
Erroneous readings then were categorized into two groups;; losses (negative due to
corrupting practices or errors) and profits (positive due to reading approximation). The
net erroneous readings were sorted to either losses or profits. If the net erroneous
readings are losses, total losses then were considered as the volume of data handling
errors in M3.
For the rest zones, Sana'a water utility's headquarters estimates data handling errors at
3% of the system input volume (makes up 4.95% of the consumption in 2009).
Therefore, a weighted average for the zones based on number of service connections per
each zone was identified to present the volume of corrupting practices and data handling
errors in Sana'a water utility.
Customer meter inaccuracies
Meters workshop in Sana'a water utility receives two types of meters;; stopped and
tampered meters, and meters that are working but complained about to have over-
registration. About six meters a week are received in meters workshop in Sana'a water
utility as complained to have over-registration, but tests reveal that they are working
properly with slight under-registration. Data of these meters were targeted to estimate
customer meter inaccuracies in Sana'a water distribution system. The workshop
estimation based on these data is that customer meter inaccuracies are around 7%. This
estimation was built on the results of tests on the workshop;; not documented, though.
Test results show that meter accuracy was recorded as 85%, 95%, and 97% for amount
98
of meter that makes up 30%, 50%, and 20% of the total number of meters received
respectively. Accordingly, customer meter inaccuracy is assumed at 7% of billed
metered consumption and 4.24% of system input volume based on data of 2009 for
Sana'a water distribution system.
Unauthorized consumption
Unauthorized consumption is then computed by subtracting the volume of data handling
errors and customer meter inaccuracies from the volume of apparent losses. Further, an
estimation of the number of illegal connections was estimated through dividing the
volume of unauthorized consumption by water consumption for the service connection
based on per capita consumption of 61.4 L/day and average number of people per
connection as 13 persons.
6.4.2. Social questionnaire
Purpose
The main purpose of the social questionnaire was to investigate the underlying causes of
unauthorized consumption. Besides, assessment of the service level as an indicator of
customer relation with Sana'a water utility was included to the questionnaire.
Design
The questionnaire was semi-structured interview with one part of closed-end
quantitative answers and one part of qualitative free answers (Appendix.4). The
questions were formed, tested, then modified in a simple wording style;; further,
conducted in the slang language to ensure understanding of the questions.
Consideration has been made to informed consent and confidentiality guidelines that are
promoted by international compilation of human research protections (Office for
Human Research Protections, 2010) to protect rights of the interviewees, the research

99
purpose, confidentiality of records, and voluntary participating were highlighted at the
beginning of the questionnaire.
Population
The target group of the social questionnaire is those served by Sana'a water utility in its
five administrative zones. Households were targeted and those who are in charge of
their families were preferred in both male and females. As social constraints prevent
giving access to women at households, amount of questionnaires were conducted in
Sana'a University to increase gender representativeness. This step, although influences
the sample characteristics, increases "realisticness" level of data as women in Sana'a
city are likely to be more affected by the level of water service and more frank for
expressing real causes than men.
Zones where there is no water service provided by Sana'a water utility were disregarded
in the questionnaire design and not targeted in the implementation phase. Therefore, all
the populations were ensured to be from the target group of the social questionnaire.
Sample Size
The sample size required for the social questionnaire was indentified from Sample Size
Lookup Table after National Audit Office (2000);; The sample size at 95% population
percentage, ±4% precision, and 95% confidence level is 114 samples. Since the
questionnaire is implemented through interacting interview;; no increase for the sample
has been made for contingencies such as non-response samples. Eventually, the total
recovered questionnaires were 114.
Sample Method
Simple random sampling was chosen for the social questionnaire as it gives equal
chance of selection among the population. The questionnaire was conducted in the fife
100
administrative zones of Sana'a water utility to random samples to assure that all the
population has an equal chance of selection.
6.4.3. Illegal users' questionnaire
The aim of the illegal users' questionnaire was to investigate the reason of this
phenomenon in Sana'a water distribution network, but this time from the view point of
illegal users themselves.
The questionnaire was structured interview with closed-end quantitative answers and
one part of qualitative free answer (Appendix.5). The questions were formed in a simple
wording style since the questionnaire will be reached to illegal users through a third
party. Confidentiality has been quarantined and maintained to the respondents in the
implementation and analysis phase. The size of sample is not known;; however, ten
respondents were identified to be targeted in the first and second administrative zones in
Sana'a water utility. Although acceptance has been gained at the beginning, only four
questionnaires were recovered due to lack of trust on some mediators. Four samples are
too low to generate and generalize a conclusion of the reasons underlies illegal use;;
however, this questionnaire hand in hand with the social questionnaire should give a
picture of the general reasons' direction for illegal water use in Sana'a water utility. It is
worth to motion that questions related to reasons of illegal use were added to the
awareness questionnaire to present the view of the employees on the illegal use reasons.
6.5. Results and Discussions
6.5.1. Real Losses Management
Although this part should be repeated in the recommendation chapter, here a discussion
of why priorities of leakage management are set in a certain order.

101
Figure.6.1: The four pillars of leakage management in suggested order for Sana'a water distribution system. Source: adapted from Ranhill and USAID (2008)
There are four main pillars for a successful leakage management. Figure 6.1 shows how
these four billers squeezing the rectangular of current level of real losses in a certain
network towards the smaller rectangle of unavoidable annual real losses where real
losses could not be minimized any more. It should be noted that all these four billers
should work hand in hand to supply successful leakage management. However, their
establishment in Sana'a water distribution system should be according to the special
conditions of both Sana'a water network and Sana'a water utility. A suggested sequence
for establishing these pillars in Sana'a water utility is as follows:
The first step for a better leakage management in Sana'a water distribution system is
through enhancing the speed and quality of repairs as it is a cost-effective procedure.
Although Sana'a water utility has established DCMMS system for leakage management,
the system is still young and lacks four elements: (1) the system achieved low level of
average repairing time in 2009 (123 h/day), and there is a lot of potential for
improvement;; (2) it lacks categorizing the leakages into leakage types (e.g. service
102
connections, mains, ..) ;; (3) there is no breakdown for the repairing time into awareness
time, locating time, and repairing time;; and (4) the system lacks evaluating procedures
for the quality of work done for repairing leakages. Once these elements are integrated
in the system, advanced leakage analysis could be achieved, and thus better level of
speed and quality of repairing could be fulfilled.
The second step of leakage management in Sana'a water distribution system is the most
difficult one;; assets management. Although Sana'a water utility has failed in many trials
for zoning its network, no assets or network management could be progressed without
this procedure. Zoning principle as well as District Metered Areas (DMA) must be
installed in Sana'a water distribution system. If the utility could not fulfill that, then,
here comes the role of the private sector;; to help the utility with a new technology to
exceed the technical constraints for applying zoning and DMAs in the water system.
Once achieved, zoning Sana'a water network would contribute significantly to a more
effective network operating, rehabilitating, and maintaining.
The third step is pressure management in the sense of management rather than
reduction. Pressure management requires DMAs to allow controlling and sustaining the
required pressure by means of valves and pressure reducer valves. Although pressure
management is considered to be the most effective tool for leakage reduction in short-
term intervals, it does not have such a reduction potential in Sana'a water distribution
system whose pressure is likely to be at too low level for reducing. However, pressure
management in the sense of sustaining the planned pressure in the DMAs and
controlling transient and altitudes of the network would lead to leakage reduction in
Sana'a water distribution system.
103
The forth step is monitoring network flows through bulk metering in DMAs where no
leaks are reported. Active leakage control should determine where leak location
activities should be undertaken in proactive rather than reactive leakage management.
Although this seems to be advanced for the case of Sana'a water distribution system, it
is considered internationally as cost-effective and efficient leakage management. It
reaches unreported and invisible leaks before they got worsened limiting the total
volume of water lost.
Once these four steps are implemented in Sana'a water utility in whatever order, the four
techniques should work simultaneously to give a synergetic effect on leakage reduction
and thus supply efficient management.
6.5.2. Apparent Losses Management
6.5.2.1. Sub-Component Analysis
Data handling errors
Sana'a water utility estimates data handling errors at 3% of system input volume which
makes up 4.95% of metered consumption based on 2009 data. Further auditing
campaign has been conducted by the headquarters of Sana'a water utility in June, 2010
to the fifth zone with 23044 customers due to recognizable corrupting practices by
meter readers in the fifth zone. A statistical analysis for audit data reveal that data
handling errors and corrupting practices in the fifth zone stands for 7.8% of metered
consumption (Detailed analysis is provided in Appendix.6). This percentage was
weighted to number of customers for the zone and an average of 5.71% was estimated
to be volume of data handling errors out of metered consumption as shown in
Table.6.1. This percentage makes up 3.46% of the system input volume. This result is
realistic as it goes along with the default values suggested by Mutikanga, et al. (2010)

104
for utilities in developing countries with similar practices' category of Sana'a water
utility.
Table.6.1 Errors of Data Handling and Corrupting Practices of Meter Readings in
SWSLC
unit Out of Metered Consumption Out of System input volume
% -5.71 -3.46
M3/day* 2112.92
*For 2009, Metered consumption = 37003.84 M3/day;; system input volume = 61069 M3/day
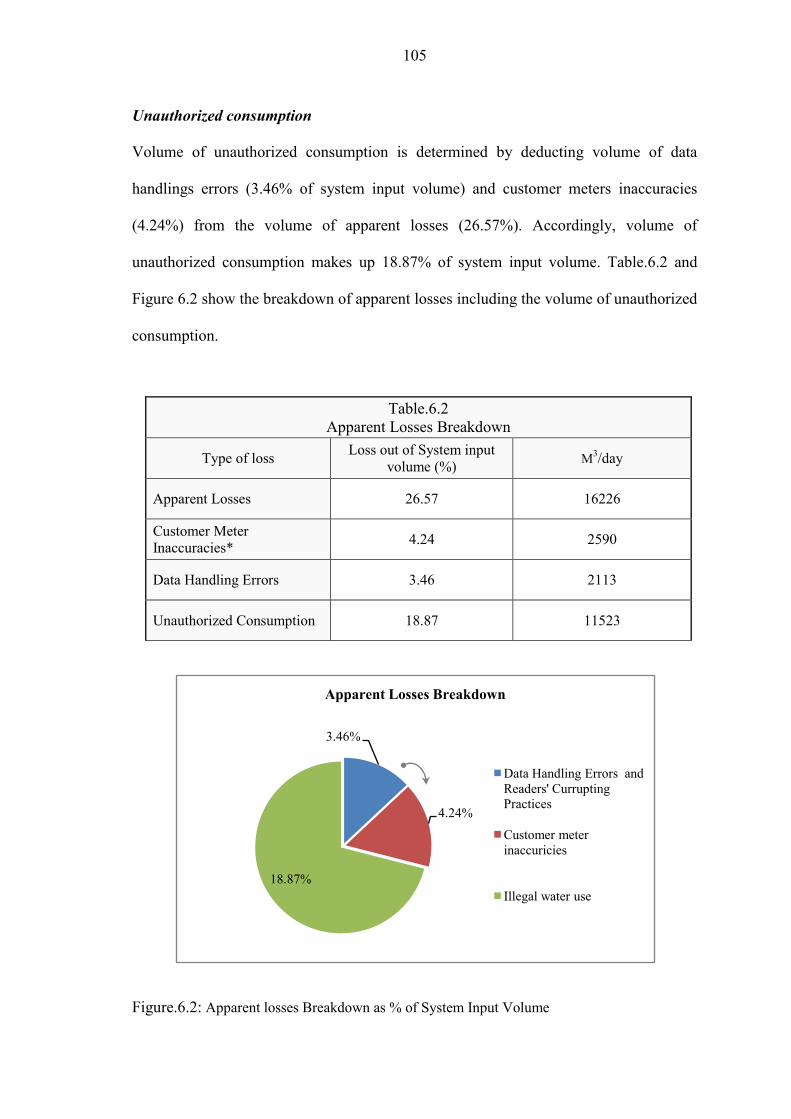
105
Unauthorized consumption
Volume of unauthorized consumption is determined by deducting volume of data
handlings errors (3.46% of system input volume) and customer meters inaccuracies
(4.24%) from the volume of apparent losses (26.57%). Accordingly, volume of
unauthorized consumption makes up 18.87% of system input volume. Table.6.2 and
Figure 6.2 show the breakdown of apparent losses including the volume of unauthorized
consumption.
Table.6.2 Apparent Losses Breakdown
M3/day Loss out of System input volume (%) Type of loss
16226 26.57 Apparent Losses
2590 4.24 Customer Meter Inaccuracies*
2113 3.46 Data Handling Errors
11523 18.87 Unauthorized Consumption
3.46%
4.24%
18.87%
Apparent Losses Breakdown
Data Handling Errors and Readers' Currupting Practices
Customer meter inaccuricies
Illegal water use
Figure.6.2: Apparent losses Breakdown as % of System Input Volume
106
With 13 people served by each service connection and per capita consumption of 61.4
L/day, the number of illegal connections is 14437 connections. This number includes
bypasses, tampered and zero meters, and illegal connections. Therefore, 16% of
customers of Sana'a water utility use unauthorized water through illegal connections,
bypasses and tampered and stopped meters. This reveals that illegal water use in Sana'a
water distribution system tends to be a phenomenon rather than limited practices and the
reason for such a phenomenon should be defined. The following parts attempt to answer
this query in order to supply a solution for this phenomenon.
6.5.3. Causes of Illegal Water Use
6.5.3.1. Problem Analysis of Illegal Water Use
Figure 6.3 shows a tree problem analysis for causes of illegal water use in Sana'a water
distribution system. This figure is part of a bigger problem tree analysis for all
components of apparent losses in a suggested form of IWRM tree problem analysis in
Appendix.7. Figure 6.3 shows that the general frame of illegal use causes lies within six
main causes: (1) poor customer-utility relation;; (2) lack of monitoring;; (3) high
competition for water as customers use illegal connections to suck water from the
network within the time of service provision;; (4) lack of employees' loyalty and
commitment;; (5) poverty;; and (6) corrupting practices.
Determination of how much each of these causes contribute to the problem of illegal
water use in Sana'a water distribution system could be drawn by the results of social and
illegal users' questionnaires and also from results of current practices of Sana'a water
utility in Chapter 5.

107
Illegal Water Use
Inability to pay for water
Poverty
Lack of monitoring
Poor NRW management
Overlapping of responsibilities
Imprpoer hierarchy
low incentives
Poor customer-utility relation
Meters record air
Lack of awareness measures
customers treated
improperly
Lack of employees' loyalty
Low incentives
Job instability
Insufficient water delivered
Lack of water quantity
Water scarcity
Technical difficulties
Wrong practices
Cultural perspectives
Lack of awareness
Corrupting practices
Lack of law enforcement
Figure.6.3: Problem Tree for Illegal Water Use in Sana'a Water Distribution System
108
6.5.3.2. Social questionnaire
Sample characteristics
A questionnaire was interviewed in areas covered by water service of Sana'a water
utility in its fives zones. The target group was households that covered by water
service of Sana'a water utility. The main purpose of the questionnaire was to
investigate the causes of illegal water use in Sana'a water distribution system as
unauthorized consumption makes a significant volume of NRW.
Figures 6.4.A-F show the characteristics of the questionnaire's sample. Most of the
respondents live in houses (67%), the other live in apartment (25%), and only 4% live
in villas as shown in Figure 6.4.B. This indicate the income level and economic
situation of the sample which show that most of the respondent have middle class
income level and thus live in houses rather than apartment according to the living
pattern in Sana'a city.
The prevalent gender of the respondents are male and about 35% of the respondents
are female as shown in Figure 6.4.D. This percentage is considered high as social
constraints limits the access to interview female at households. This percentage was
due to conducting some interviews in the Sana'a University to allow access to gender
perception presentation in the questionnaire.
Figure 6.4.E shows that almost half of the respondents are with age between 20-30
years. These age categories are usually of educated people that consider objectiveness
of the research process. The rest are older than 30 which indicate that all sections of
the society are presented in term of age distribution.
109
The questionnaire's Results
Results show that more than half of the respondents believe that illegal water use
phenomenon is prevalent (Figure 6.5). However, only 35% of the respondents state
that they know illegal water users (Figure 6.6). This is due to sensitivity of the
question that might imply potential harm for illegal water users whom respondents
know.
As shown in Figure 6.7, the main three causes of illegal water use in Sana'a water
distribution system are lack of monitoring, high water tariffs, and lack of water
availability in the network. The main solution respondents suggest is monitoring
measures to be implemented by Sana'a water utility (Figure 6.8). As Sana'a water
utility tends to utilize the religious position for limiting illegal use, results show that it
would contribute to its limitation but to the expected extent (Figure 6.9).
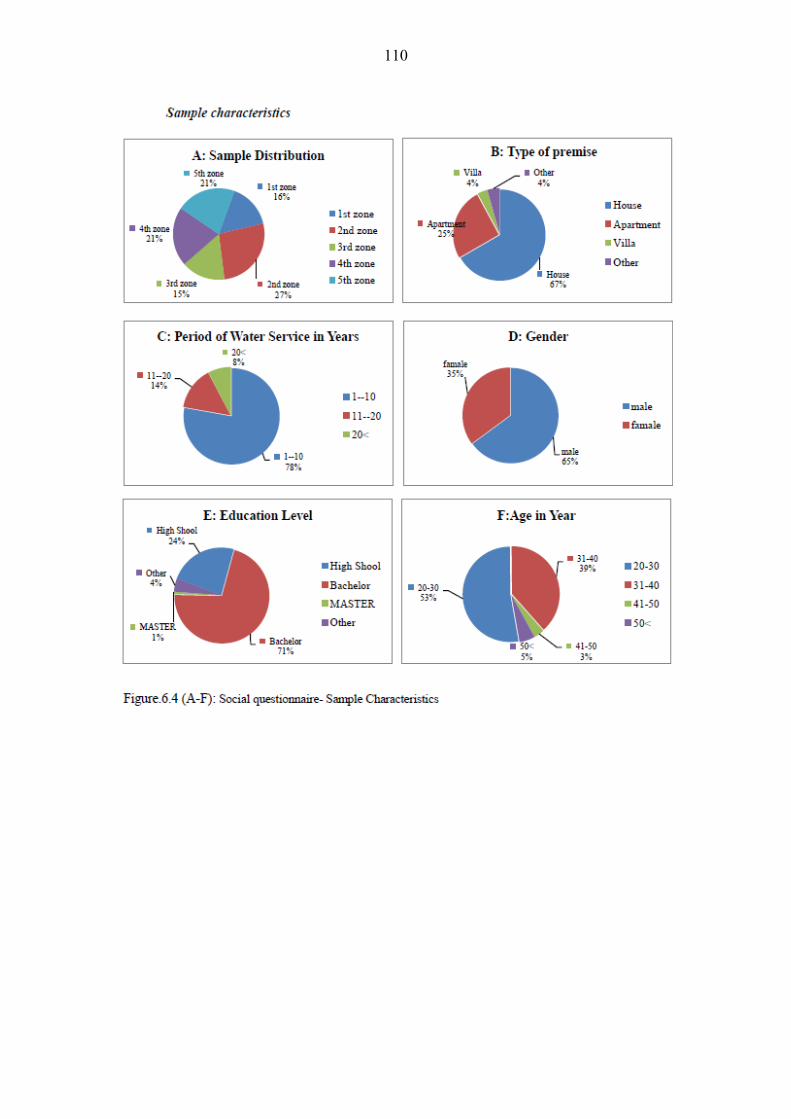
110

111
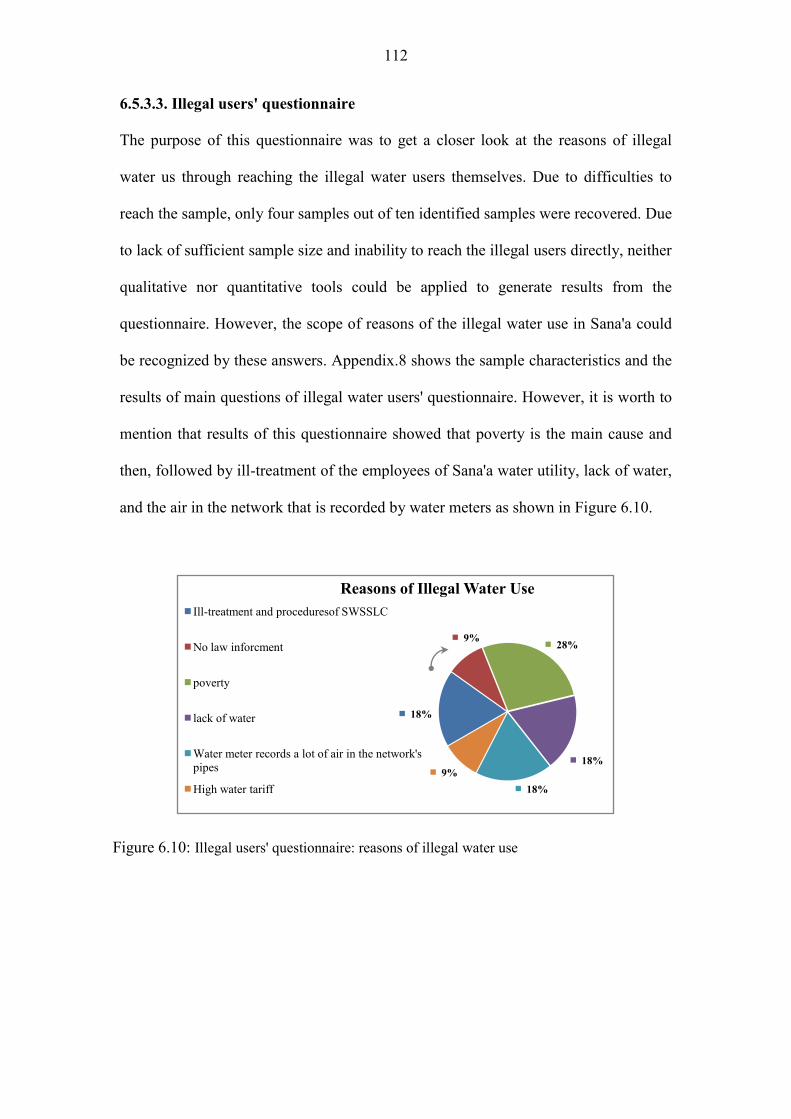
112
18%
9% 28%
18%
18%9%
Reasons of Illegal Water UseIll-treatment and proceduresof SWSSLC
No law inforcment
poverty
lack of water
Water meter records a lot of air in the network's pipes
High water tariff
6.5.3.3. Illegal users' questionnaire
The purpose of this questionnaire was to get a closer look at the reasons of illegal
water us through reaching the illegal water users themselves. Due to difficulties to
reach the sample, only four samples out of ten identified samples were recovered. Due
to lack of sufficient sample size and inability to reach the illegal users directly, neither
qualitative nor quantitative tools could be applied to generate results from the
questionnaire. However, the scope of reasons of the illegal water use in Sana'a could
be recognized by these answers. Appendix.8 shows the sample characteristics and the
results of main questions of illegal water users' questionnaire. However, it is worth to
mention that results of this questionnaire showed that poverty is the main cause and
then, followed by ill-treatment of the employees of Sana'a water utility, lack of water,
and the air in the network that is recorded by water meters as shown in Figure 6.10.
Figure 6.10: Illegal users' questionnaire: reasons of illegal water use
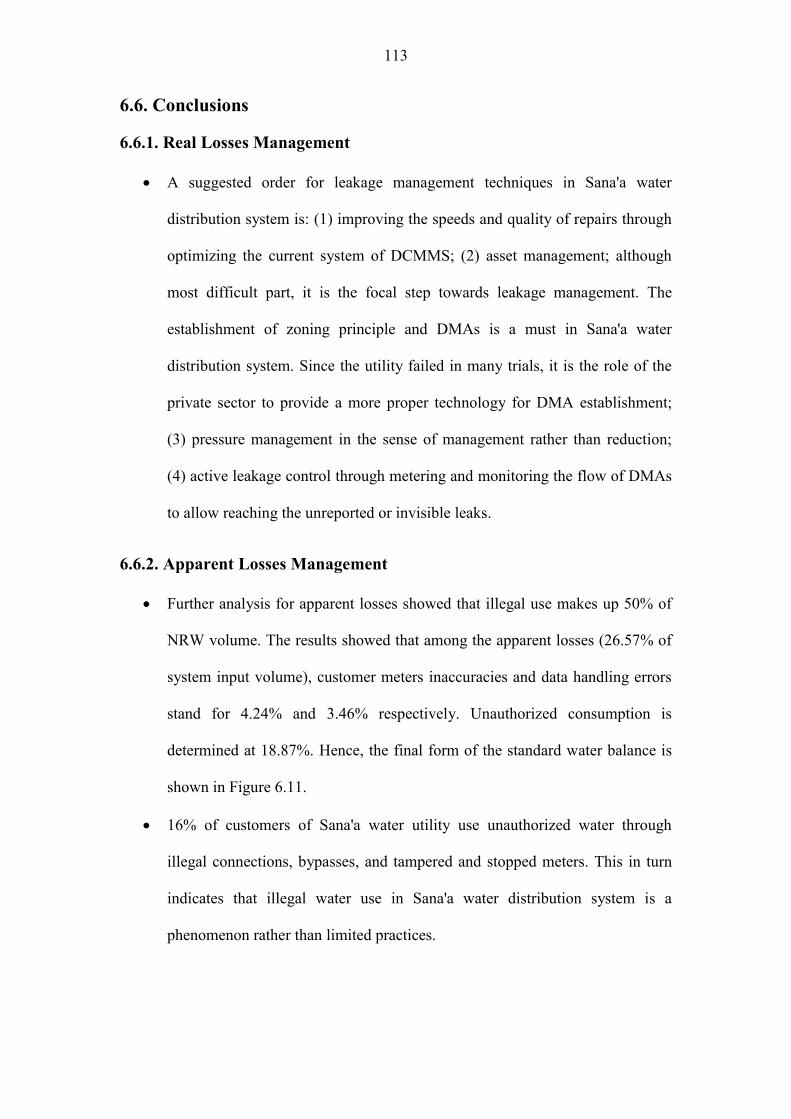
113
6.6. Conclusions
6.6.1. Real Losses Management
A suggested order for leakage management techniques in Sana'a water
distribution system is: (1) improving the speeds and quality of repairs through
optimizing the current system of DCMMS;; (2) asset management;; although
most difficult part, it is the focal step towards leakage management. The
establishment of zoning principle and DMAs is a must in Sana'a water
distribution system. Since the utility failed in many trials, it is the role of the
private sector to provide a more proper technology for DMA establishment;;
(3) pressure management in the sense of management rather than reduction;;
(4) active leakage control through metering and monitoring the flow of DMAs
to allow reaching the unreported or invisible leaks.
6.6.2. Apparent Losses Management
Further analysis for apparent losses showed that illegal use makes up 50% of
NRW volume. The results showed that among the apparent losses (26.57% of
system input volume), customer meters inaccuracies and data handling errors
stand for 4.24% and 3.46% respectively. Unauthorized consumption is
determined at 18.87%. Hence, the final form of the standard water balance is
shown in Figure 6.11.
16% of customers of Sana'a water utility use unauthorized water through
illegal connections, bypasses, and tampered and stopped meters. This in turn
indicates that illegal water use in Sana'a water distribution system is a
phenomenon rather than limited practices.
114
Causes of apparent losses should lie within six main reasons: (1) poor
customer-utility relation;; (2) lack of monitoring;; (3) insufficient water as
customers use illegal connections to suck water from the network within the
time of service provision;; (4) lack of employees' loyalty and commitment;; (5)
poverty;; and (6) corrupting practices.
Among the above reasons, the social perspective is that lack of monitoring, not
appropriate tariffs, and insufficient supply are the main reasons for illegal
water use.
Many reasons mentioned in the social questionnaires imply the low level of
customer-utility relation that is also concluded in Chapter 5. For example,
complexity of the utility procedures, ill-treatment of the employees of Sana'a
water utility, and the air in the network that is recorded by water meters.
%
26.57 %
7.70 %
Unauthorised Consumption
Apparent Losses 18.87 %
38.24 %
Real Losses11.67 %
38.75 %Water Losses
Metres Inaccuricies and Data Handling Errors
Non-Revenue Water
100
0.51System Input Volume
% Unbilled Unmetered Consumption0.31 %
61.76 % Unbilled Authorised Consumption
Unbilled Metered Consumption0.20 %
61.25 %0.66 %
Authorised Consumption
61.25 % Billed Unmetered Consumption
Water Balance (%) of Sana'a Water Distribution System (2009)
Billed Metered ConsumptionBilled Authorised Consumption
Revenue Water60.59 %
Figure 6.11: Water balance including sub-component of apparent losses

115
The solution of illegal water use from the social perspective is implementing
more effective monitoring measures, and working on the employees' loyalty;;
Or as they stated: personnel change.

116
Chapter 7 NRW Monitoring in Sana'a Water utility;; Performance Indicators
In this chapter, the Infrastructure Leakage Index (ILI) as a recommended indicator of
physical losses by several international agencies would be familiarized. Afterwards,
the rest of NRW performance indicators will be determined and presented using NRW
softwares.
7.1 Research Question
value of Infrastructure Leakage Index (ILI), for the real losses
component of NRW in the water distribution system in Sana'a water utility?
7.2 Research Method
Infrastructure Leakage Index is determined by applying Equation 2.2 and with
adapting Equation 2.3 to Equation 1.7 which has a correction for low pressures as
follow:
Eq.2.2
UARL (liters/day) = (18 x Lm + 0.8 x Nc + 25 x Lp) x P x Cp Eq.7.1
Where
CARL = Current annual real losses UARL= Unavoidable annual real losses Lm = Mains pipes length (km);;
117
Nc = Number of service connections;; Lp = Total length of private pipe, property boundary to customer meter (km);; P = Average pressure (m)
Cp: correction coefficient of pressure once pressure is less than 25 m.
Current annual real losses (CARL) are calculated in previous objectives of the
research. Other data such as Lm and Nc were obtained from Sana'a water utility
through analyzing the network in the Arc GIS software Packages. Lp was set as zero
for the case of Sana'a water network according to Appendix.1 as the configuration of
the water meter is outside of the customer building, and thus the private length for the
customers in Sana'a water network is zero.
For the purpose of calculating the average pressure, Lambert and Taylor (2010) have
suggested a systematic approach through;; (1) calculating the weighted average ground
level against the number of service connection for each distribution area;; (2)
measuring the average zone pressure for each area;; and (3) calculating the weighted
average pressure for the aggregated zones.
For calculating the average pressure in Sana'a water network with consideration to the
supply pattern similar approach was implemented:
7.2.1. Calculating the Average Ground Level
For calculating the average pressure in the network, the ground elevation difference of
the Average Zone Point (AZP) and the pumping station point should be considered.
Since there is no contour map for the network in Sana'a water utility, the Average
Zone elevations were determined through three steps:
(1) The elevations of the wells within the distribution areas in the network were
obtained from Sana'a water utility, and then the difference in elevation from the wells
in the subject area and the pumping station elevation were calculated.

118
(2) For the reason that the wells are not located in the average zone point, the Digital
Elevation Model (DEM) for Sana'a city was integrated with the network data in the
Arc GIS Software. Using the Arc GIS should provide more sensible and
representative elevation variance as it generates numerous random elevation points for
the whole area rather than certain points in the area. Then, the software computes the
average elevation of the area. Figure 5.1 and Figure 5.2 show samples of how the
average zone elevation is computed using the Arc GIS software;; particularly the tool
"generate random elevation points".
(3) Since the DEM accuracy might not be appropriate, the elevation of the wells that
are obtained from Sana'a water utility were compared to the elevations from the DEM
to assess the accuracy of this process. Doing so showed that the differences between
the respective elevations were in the range of 1-2 m. This range of accuracy is
accepted when calculating the average zone point for the initial average pressure in
the network because the suggested approach by Lambert and Taylor (2010) does not
take into count the friction losses that should have higher source of errors. Therefore,
it was assumed that accuracy of about ± 1 2 m was accepted when calculating the
average zone point for "initial average pressure" determination in Sana'a water
network.
7.3.2. Calculating the Average Pressure
The pumping pressure data for areas that are supplied from the main pumping station
were taken and the rest were estimated by mangers and staff of the utility through
long discussions. So, the pressure data at the pumping stations were all defined.
Consequently, as the average zone elevations were already determined, the average
pressure for each area in the pumping station was reduced due to elevation difference.

119
Eventually, the operating pressure for each distribution area was weighted to the
number of service connection, and finally the operating average pressure in Sana'a
water network was determined.
Figure.7.1: Generating Random Elevation Points for Safia- Bilaily Area- the 2nd zone
120
7.3.3. Defining the adjusted UARL
As discussed in Chapter two, when calculating the Unavoidable Annual Real Losses
(UARL) for the purpose of determining the ILI, UARL should be adjusted for the
intermittent supply by dividing UARL by the average number of supply hours per day
(Ranhill and USAID, 2008). For this reason, the distribution pattern of water supply
in Sana'a network should be considered for each distribution area. The area name, the
number of service connections per area, supply time in days per week, and supply
times in hours per day should be determined to define the average supply time in the
network. These figures are available in Sana'a water network apart from the service
connection for each distribution area.
To determine the number of connections for each distribution area, the total number
of service connections was divided by the total length of mains for the whole network
to give the average number of service connection per each km of mains length. Then
the length of mains for each distribution area was summed using the Arc GIS
software. Afterwards, the number of service connection for each distribution area was
determined via multiplying the length of mains for each distribution area by the
average number of service connection per km of mains.
The average supply time was obtained from the record of the main pumping station in
Sana'a water utility. For the areas that are supplied from wells within the areas and
therefore, there are no records for their supply time, a discussion was made with the
distribution staff including managers and an estimation of the average supply time
was defined for these areas.
Eventually, the weighted average supply time for each area was weighted to the
number of service connection and thus, the average supply time for whole network in
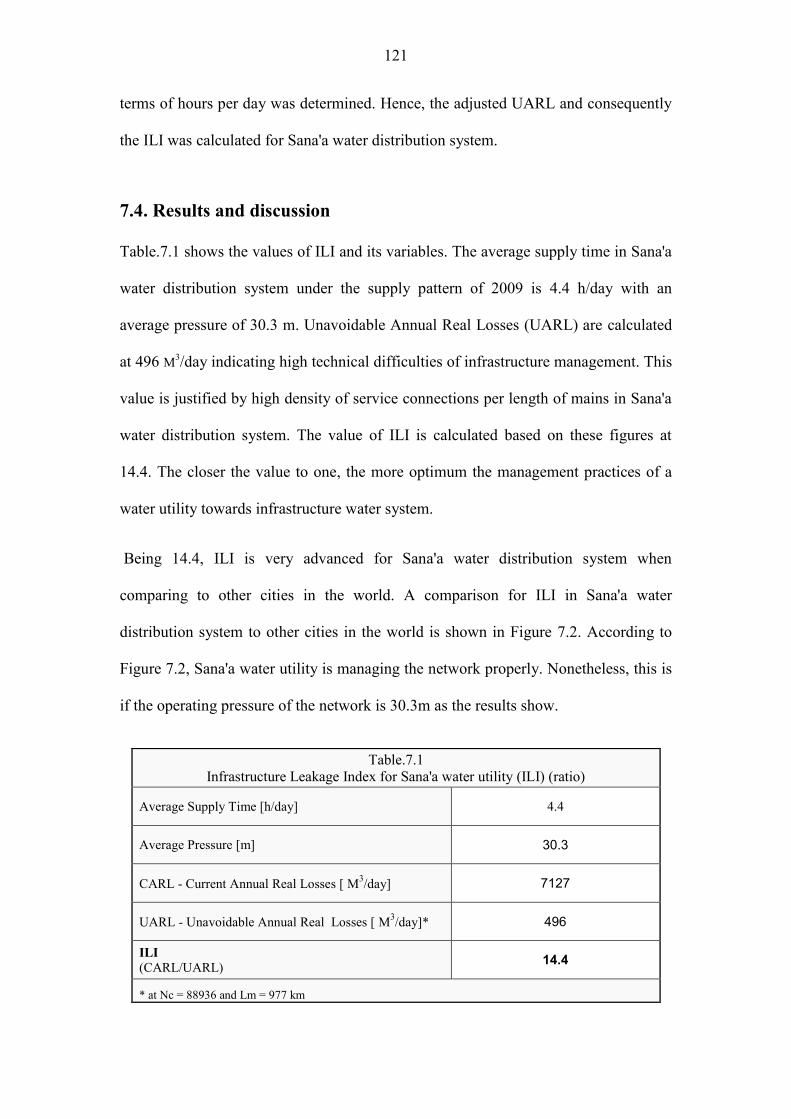
121
terms of hours per day was determined. Hence, the adjusted UARL and consequently
the ILI was calculated for Sana'a water distribution system.
7.4. Results and discussion
Table.7.1 shows the values of ILI and its variables. The average supply time in Sana'a
water distribution system under the supply pattern of 2009 is 4.4 h/day with an
average pressure of 30.3 m. Unavoidable Annual Real Losses (UARL) are calculated
at 496 M3/day indicating high technical difficulties of infrastructure management. This
value is justified by high density of service connections per length of mains in Sana'a
water distribution system. The value of ILI is calculated based on these figures at
14.4. The closer the value to one, the more optimum the management practices of a
water utility towards infrastructure water system.
Being 14.4, ILI is very advanced for Sana'a water distribution system when
comparing to other cities in the world. A comparison for ILI in Sana'a water
distribution system to other cities in the world is shown in Figure 7.2. According to
Figure 7.2, Sana'a water utility is managing the network properly. Nonetheless, this is
if the operating pressure of the network is 30.3m as the results show.
Table.7.1 Infrastructure Leakage Index for Sana'a water utility (ILI) (ratio)
Average Supply Time [h/day] 4.4
Average Pressure [m] 30.3
CARL - Current Annual Real Losses [ M3/day] 7127
UARL - Unavoidable Annual Real Losses [ M3/day]* 496
ILI (CARL/UARL) 14.4
* at Nc = 88936 and Lm = 977 km

122
Having an average operating pressure of 30.3m in Sana'a water utility is likely to be
not realistic to present the operating pressure of the network. In such a case, the value
of ILI is fallible.
It is likely that operating pressure calculated is not accurate for one reason: average
operating pressure in Sana'a water distribution system was calculated based on the
guidelines of Lambert and Taylor, (2010) who recommended that the friction losses
could be negligible for initial calculation of average operating pressure. The friction
losses and pressure minor losses in Sana'a water distribution system are likely to be
significant since results revealed that the density of service connections in Sana'a
water network is 91 service connections per km of mains which is very high when
comparing to typical water network in a European city with 20 service connections
per km of mains. This indicates high number of joints and therefore, high level of
friction losses that affect water pressure.
Figure.7.2: ge operating pressure of 30.3 m. Source of Data for other cities: The Free Water Balance Software V3.00
0
10
20
30
40
50
60
70
80
90Cyprus
Australia
New Zealand UKUKUK
Germany
France
Czech Rep.
New Zealand
Japan
Ireland
Hungary
South Africa
Czech Rep.
Italy
Ukraine
Greece
South Africa
Caribbean
Sri Lanka
Sana'a
Turkey
Italy
Greece
Costa Rica
Bulgaria
Jordan
Malaysia
Indonesia
Sri Lanka
Turkey
Turkey
Russia
Vietnam
ILI
Infrastructure Leakage Index (ILI) in Sana'a water distribution system at average operating pressure of 30.3 m
Randomly Selected International Data Set
Sana'a
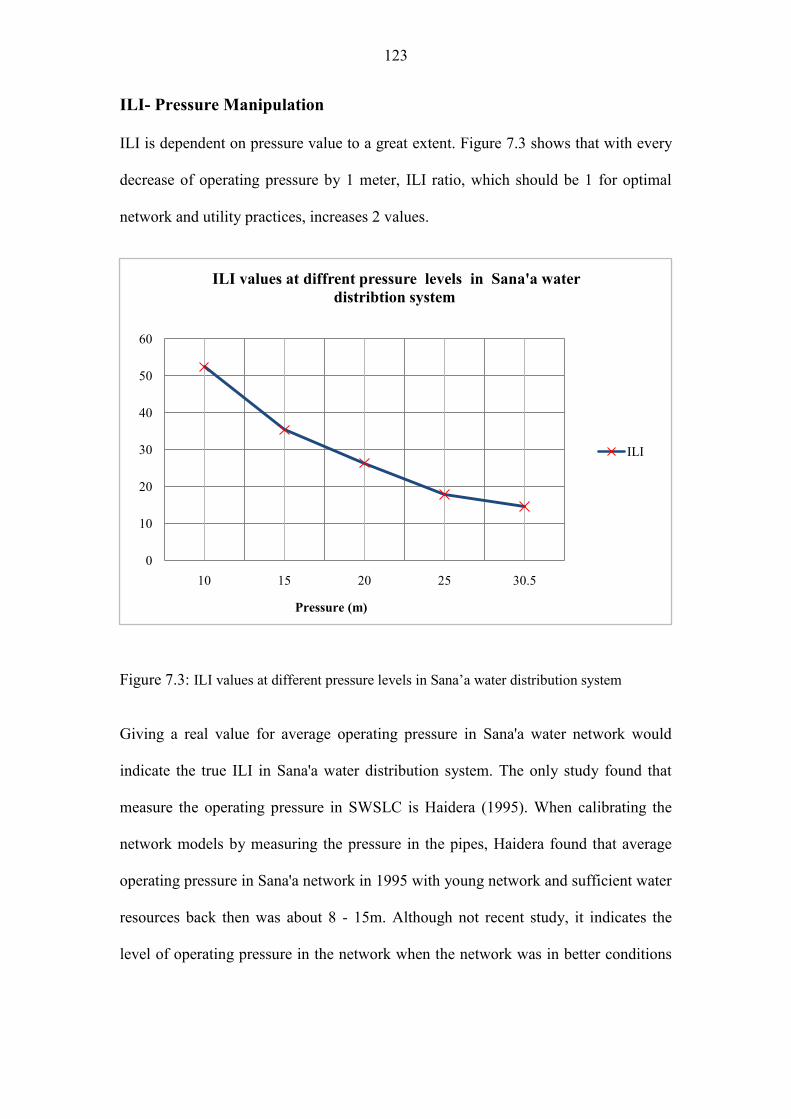
123
0
10
20
30
40
50
60
30.525201510
Pressure (m)
ILI values at diffrent pressure levels in Sana'a water distribtion system
ILI
ILI- Pressure Manipulation
ILI is dependent on pressure value to a great extent. Figure 7.3 shows that with every
decrease of operating pressure by 1 meter, ILI ratio, which should be 1 for optimal
network and utility practices, increases 2 values.
Giving a real value for average operating pressure in Sana'a water network would
indicate the true ILI in Sana'a water distribution system. The only study found that
measure the operating pressure in SWSLC is Haidera (1995). When calibrating the
network models by measuring the pressure in the pipes, Haidera found that average
operating pressure in Sana'a network in 1995 with young network and sufficient water
resources back then was about 8 - 15m. Although not recent study, it indicates the
level of operating pressure in the network when the network was in better conditions
Figure 7.3:

124
such as age of the network and water availability. Having average pressure around 10
m, ILI would be around 45 if so Figure 7.2 would be modified to Figure 7.4.
On the other hand, friction losses and minor losses for a network of connections
density of 91 connections per km of mains are most likely to be more than 1 meter. If
so, ILI would exceed 16 as decreasing the pressure with one meter increases ILI with
2 values. Therefore, ILI in Sana'a water distribution system should be more than 16.
Once ILI value is defined, then it should be interpreted by the real loss assessment
matrix developed by World Bank Institute (Table.2.4 in Chapter 2). Consequently, ILI
for values between 8 and 16 is classified in C category and for values more than 16
lies in category D for the developing countries. Bothe categories, C and D, require
intensifying NRW reduction efforts.
Sana'a water distribution system is categorized either in C or in D category in the real
losses assessment matrix with more probability of being in category D. If so, Sana'a
0
10
20
30
40
50
60
70
80
90
Cyprus
Australia
New Zealand UKUKUK
Germany
France
Czech Rep.
New Zealand
Japan
Ireland
Hungary
South Africa
Czech Rep.
Italy
Ukraine
Greece
South Africa
Caribbean
Sri Lanka
Hungary
Turkey
Italy
Greece
Costa Rica
Bulgaria
Jordan
Malaysia
Indonesia
Sri Lanka
Turkey
Sana'a
Russia
Vietnam
ILI
Infrastructure Leakage Index (ILI) at average operating pressure of 12 m
Randomly Selected International Data Set
Sana'a
Figure 7.4: on system at average operating pressure of 12 m. Source of Data for other cities: The Free Water Balance Software V3.00

125
water utility is classified as it uses resources inefficiently, and NRW reduction
programs are imperative.
7.5. Other NRW Performance Indicators (PIs)
Main NRW performance indicators for the apparent losses and real losses that are
recommended by IWA and AWWA are shown in Table.7.2 and Table.7.3. Losses are
expressed in terms of volume per each service connections or per length of mains.
Despite the fact that each water utility has its own performance indicators, the most
common and recommended ones are ILI for real losses and apparent losses expressed in
% of authorized consumption.
While this study could not provide exact figure for ILI as discussed earlier, real losses
in Sana'a water distribution system when intermittent supply is considered in the
calculations, is 437 L/service connection/day. This value is not influenced by pressure
values, and thus could be an alternative indicator that represents the level of real
losses in Sana'a water distribution system.
On the other hand, apparent losses make up 43% of the authorized consumption as
shown in Table.7.3. This percentage is high due to the fact that apparent losses are
dominant in Sana'a water distribution system as discussed in Chapter 4.
Other financial indicators and indicators for level of service are provided in Table.7.4
and Table.7.5. The level of service in Sana'a water distribution system is 4.4 h/day
which is low and NRW monetary value is high and standing for 33% of annual
operating cost.
Apart from ILI, all these indicators while reflect low performance of Sana'a water
utility, does not consider the potential difficulties that the utility might encounter.

126
Table.7.2
Real Loss Performance Indicators
Infrastructure Leakage Index (ILI) 14.4*
Liters per Connection per Day (w.s.p.)* 437
Liters per Connection per Day per meter Pressure (w.s.p.) 14
M3/km mains per hour (w.s.p.) 1.66
*w.s.p.: when the system is pressurized - this means the value is already corrected in the case of intermittent supply
* As discussed earlier, ILI for Sana'a water distribution system is likely to have higher value. However, this value is calculated based on pressure of 30.3m.
Table.7.3
Apparent Loss Performance Indicators
Apparent Losses expressed in % of Authorized Consumption 43%
liters/connection/day 186
Table.7.4
Level of Service
Average Supply Time [h/day] 4.4
Average Pressure [m] 30.3
Table.7.5
Financial Performance Indicators
Volume of NRW expressed in % of System Input Volume 38%
Value of NRW expressed in % of Annual Operating Cost 33%
Liters per Connection per Day (w.s.p.) 1478.3

127
7.5. Conclusion
7.5.1 Infrastructure Leakage Index in General
Infrastructure Leakage Index is a robust indicator. Besides measuring the level
of real losses, ILI indicates both level of service through taking into
consideration pressure level and average time of water service;; and
management practices towards water distribution network through taking into
consideration the conditions of the infrastructure and UARL.
7.5.2 Infrastructure Leakage Index in Sana'a Water Distribution System
Unavoidable Annual Real Losses in Sana'a water distribution system are high
(496 M3/day). This is due to high density of service connections per length of
mains. High UARL indicates high difficulty level of managing infrastructure
of Sana'a water distribution system.
Infrastructure leakage Index in Sana'a water utility lies between 14 and 45
depending on the operating pressure of the network (30.3 to 10 respectively).
A specific value for ILI is difficult to be determined with absence of concrete
data inputs for estimating the average operating pressure in the network.
However, under all scenarios, in accordance to the real losses assessment
matrix developed by World Bank Institute, Sana'a water utility should
intensify NRW reduction efforts.
Despite the fact that Infrastructure leakage Index is recommended by many
international agencies, yet its application in Sana'a water utility under the
current conditions is likely to be difficult due to its data requirements.
However, if ILI is to be measure, precise estimation of the operating pressure
is required as ILI is highly influenced by the value of operating pressure.
128
Chapter 8 Non-Revenue Water Awareness in Sana'a Water Utility
8.1. Research Question
How aware are the employees of the NRW-related departments in Sana'a water
utility;; in its different managerial and operational levels with regard to NRW issues?
8.2. Research Method
8.2.1. Issues to be measured
Employees in NRW-related departments in Sana'a water utility should be aware of
what is NRW, what could it mainly affect, and what is the influence of performance
and policies of their units and departments on NRW management. Further, those who
work in the technical department as well as those who work in the commercial
departments in the utility should also know that there are methods existed through
which it is possible to assess their job-related components of NRW. It is not
necessarily a must that they know how to use these methods;; however, they should
know that these methods existe. On the other hand, prioritizing and strategizing NRW
management is also of importance to be measured. However, it is the responsibility of
certain management level and thus, employees in the different managerial and

129
operational levels do not necessarily have to know these issues. Measuring these
issues requires dividing the sample of the population into groups and then a certain
group that is involved in NRW planning and strategizing should be targeted in the
headquarters of the utility as well as the five administrative zones. Doing so is not
within the scope or objective of this research due to time and resources limitations.
Accordingly, NRW awareness measuring of employees in Sana'a water utility covered
the following parts: (1) NRW essence, and NRW main impacts;; (2) the influence of
performance and policies of the different departments in the utility on NRW level;;
and (3) the existence of assessment methods for NRW break down, and NRW
performance indicators;;
8.2.2. Forming a Hypothesis
In order to measure the awareness of these issues in Sana'a water utility, several
interviews, data collection, reports analysis and field visits have been conducted and
then, a primary conclusion of these activities was formed as follows:
"Employees of NRW-relative departments in Sana'a water utility are aware of the
NRW essence, and NRW general impacts, but they are not adequately aware of the
existence of NRW assessment methods, and NRW performance indicators. Further,
they are not aware enough of the impacts and relations of the different departments in
the utility on NRW level."
In order to generalize this conclusion for the entire relevant target group in the
managerial and operational levels of the utility, a further awareness questionnaire was
distributed in Sana'a water utility in its headquarters and administrative zones.
Henceforth, this conclusion was treated as a hypothesis that should be tested through
conducting awareness questionnaire.
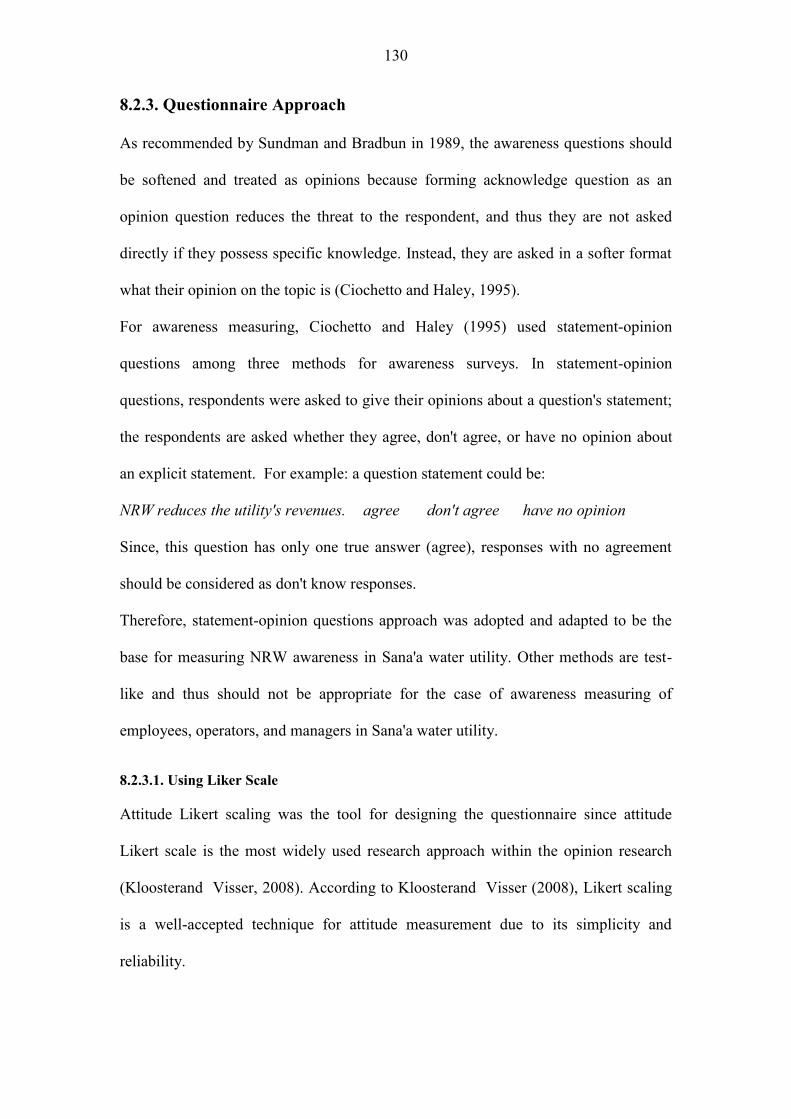
130
8.2.3. Questionnaire Approach
As recommended by Sundman and Bradbun in 1989, the awareness questions should
be softened and treated as opinions because forming acknowledge question as an
opinion question reduces the threat to the respondent, and thus they are not asked
directly if they possess specific knowledge. Instead, they are asked in a softer format
what their opinion on the topic is (Ciochetto and Haley, 1995).
For awareness measuring, Ciochetto and Haley (1995) used statement-opinion
questions among three methods for awareness surveys. In statement-opinion
questions, respondents were asked to give their opinions about a question's statement;;
the respondents are asked whether they agree, don't agree, or have no opinion about
an explicit statement. For example: a question statement could be:
NRW reduces the utility's revenues. agree don't agree have no opinion
Since, this question has only one true answer (agree), responses with no agreement
should be considered as don't know responses.
Therefore, statement-opinion questions approach was adopted and adapted to be the
base for measuring NRW awareness in Sana'a water utility. Other methods are test-
like and thus should not be appropriate for the case of awareness measuring of
employees, operators, and managers in Sana'a water utility.
8.2.3.1. Using Liker Scale
Attitude Likert scaling was the tool for designing the questionnaire since attitude
Likert scale is the most widely used research approach within the opinion research
(Kloosterand Visser, 2008). According to Kloosterand Visser (2008), Likert scaling
is a well-accepted technique for attitude measurement due to its simplicity and
reliability.

131
Likert Scale has three, five, seven, and nine-point scale (Hawcroft and Milfont, 2010).
An example of three-point scale is questionnaires with (Agree, Undecided, and
Disagree). Five-point scale has the choices of (Strongly Agree, Agree, Undecided,
Disagree, and Strongly Disagree). Since the number of points on a Likert scale
offered to participants affects the responses (Hawcroft and Milfont, 2010), five-point
likert scale was used to enhance measuring the agreement and disagreement level.
Besides, according to (Kloosterand Visser, 2008), the typical five-point agreement
scale is the best known rating scales. Accordingly, the choices of answers were
(Strongly Agree, Agree, Undecided, Disagree, and Strongly Disagree).
This approach of measuring awareness of the employees in the organization through
statement-opinion questions and Likert scale is also adopted and used by Western
Australian General Practice Network (2008).
8.2.4. Questionnaire Design
Based on the questionnaire approach discussed in the previous part, statement-opinion
questions with five-point likert scale was the used approach. The statements are fact,
literature-based and have only one true answer;; agreement answer. Untrue answers
were treated as don't know answers. Besides, respondents were asked to choose
"Undecided" for points that they don't know or haven't heard about it. Accordingly,
Table.8.1 shows the designed interpretation of responses.
In addition, since all statements should have an agreement answer to be true, the
respondents might start guessing towards agreement choices. To make the
questionnaire looks to have variety of answers, further fourteen opinion answers that
do not measure awareness but have real different opinion answers were added to
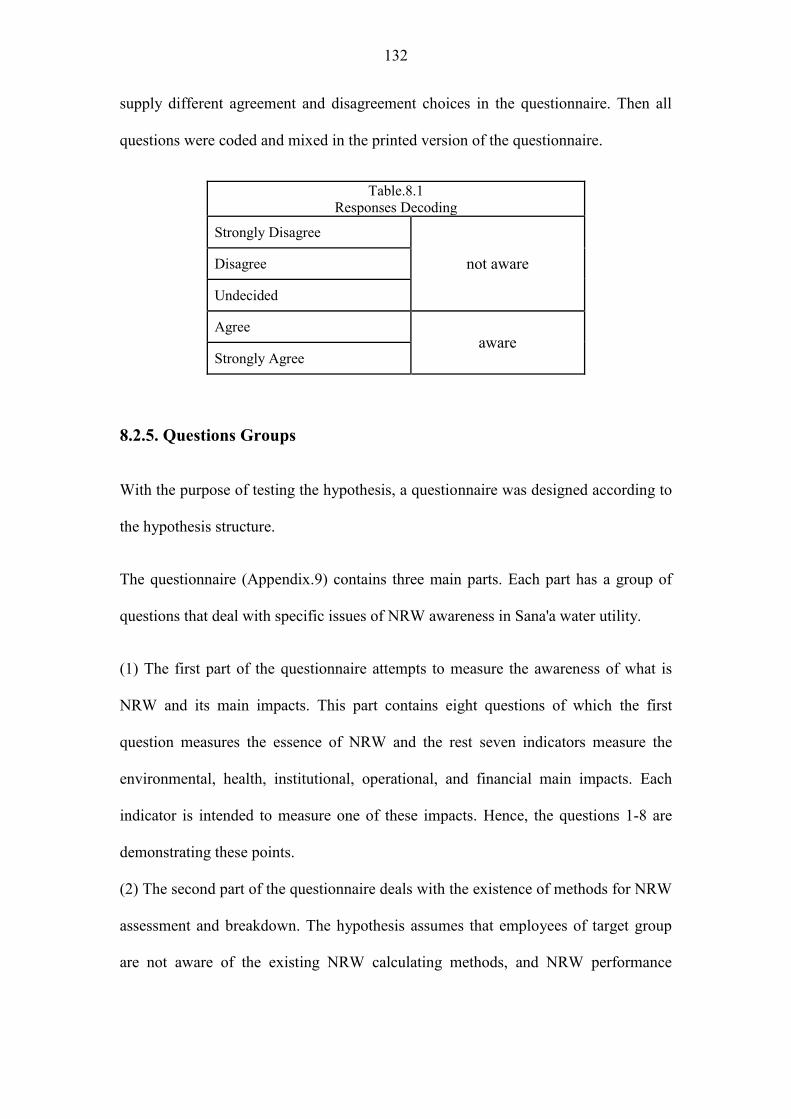
132
supply different agreement and disagreement choices in the questionnaire. Then all
questions were coded and mixed in the printed version of the questionnaire.
Table.8.1 Responses Decoding
Strongly Disagree
not aware Disagree
Undecided
Agree aware
Strongly Agree
8.2.5. Questions Groups
With the purpose of testing the hypothesis, a questionnaire was designed according to
the hypothesis structure.
The questionnaire (Appendix.9) contains three main parts. Each part has a group of
questions that deal with specific issues of NRW awareness in Sana'a water utility.
(1) The first part of the questionnaire attempts to measure the awareness of what is
NRW and its main impacts. This part contains eight questions of which the first
question measures the essence of NRW and the rest seven indicators measure the
environmental, health, institutional, operational, and financial main impacts. Each
indicator is intended to measure one of these impacts. Hence, the questions 1-8 are
demonstrating these points.
(2) The second part of the questionnaire deals with the existence of methods for NRW
assessment and breakdown. The hypothesis assumes that employees of target group
are not aware of the existing NRW calculating methods, and NRW performance

133
indicators. Consequently, the second part contains four questions (9-12) that talk
about the existence of such methods and calculations.
(3) The third part of the questionnaire tries to measure whether the subject employees
are aware of the influence of performance and policies of the different departments in
Sana'a water utility on NRW level. The hypothesis assumes that subject employees
are not adequately aware of the impacts and relations of these departments on NRW
level. The questionnaire starts with asking whether NRW issue is only a matter for the
technical and commercial departments in Sana'a water utility, then it went further
investigating the awareness of respondents with regard to the influence of the projects
department, administration department, training department, distribution department,
and customer relations departments on NRW level.
Each one of these departments has a contribution on NRW management. For example,
studies and projects departments should take into consideration to apply zoning
requirements when designing and implementing the new projects. Incentives and job
stability affects employee loyalty;; training on needs of NRW management is
essential;; proper water distribution pattern ensures stable operation for the network
and minimum level of service;; proper customer relations increase the potential of
reporting leakages in short time and contribute to limiting the Illegal use
phenomenon. Therefore, all the departments are involved in NRW management.
Putting that in mind, the third part of the questionnaire contains six indicators (13-18)
that deal with the relations and impacts of the different departments in Sana'a water
utility on NRW level.
It should be mentioned that this part lacks an indicator for the impact of the financial
department on NRW level. Nevertheless, it is assumed that seven indicators for this

134
part could be representative for the relation and influence of the different departments
of Sana'a water utility on NRW management.
8.2.6. Informed Consent and Confidentiality
The international compilation of human research protections provides guidelines for
ethics and procedures that protect the rights of the interviewees and sampled people
(Office for Human Research Protections, 2010). Based on these guidelines, the
research purpose, confidentiality of records, and voluntary participating were
highlighted at the beginning of the questionnaire and maintained in the analysis phase.
8.2.7. Population (Target Group)
The target group of measuring the awareness issue in Sana'a water utility, SWSLC, is
the technical and commercial departments in the utility headquarter. Besides, the five
independent administrative zones that are responsible for the operational tasks in the
subdivided network are also a part of this objective's population. In addition, the
engineers in of the designs, studies, and projects departments were targeted as well.
In contrast, employees working in irrelative fields were excluded because whether
they are aware of NRW issues or not have no impact on NRW management in the
utility. An example of those is the employees of specific units such as accountants and
editors in the financial department or wastewater technicians in the technical
department.
8.2.8. Sample Size
Despite the fact that the questionnaire was eventually distributed to the relevant
employees in the NRW-relative units and departments throughout the utility, the
following section shows the procedures of calculating the sample size in order to have
a representative sample of the employees.
135
The total number of the employees of Sana'a Water utility is 1242 of which 45% is
working in the five independent administrative zones (SWSLC, 2009). According to
the figures of the personnel department in the annual report of SWSLC (2009), the
ratio of the target group out of the total number of the employees in the utility's
headquarter is 29% (195 out of 680). Due to lack of data for the number of the
employees in the different units of the other five administrative zones, the same ratio
was assumed. Tackling this issue, the administrative zones are likely to have higher
ratio of operational employees and thus have a higher ratio of the target group.
However, there are a considerable number of employees working in irrelative jobs
among the target group in the secretarial work in both the utility's headquarter and the
five administrative zones. Therefore, this calculation is the worst scenario trying to
avoid underestimation of sample size.
In the light of that, the total number of the target group is 357 employees.
Accordingly, the sample size required is taken from the Sample Size Lookup Table
after National Audit Office (2000);; Figure 8.1.
When deciding the sample size from the table, the population proportion was assumed
at 95%. Moreover, it was considered that all the samples would be ensured to be
among the target group. Besides, once the questions being of five-order Likert scale,
the worst scenario of population percentage should be shifted to a lower percentage
(BOLD, 2010).
Accordingly, the sample size at 95% population percentage, ±8% precision, and 95%
confidence level is 28 samples which, in turn, stand for 8% of the total population.
Afterwards, the sample has been further increased by 25% to account for
contingencies such as non-response samples (IFAD, 2010). This action was done
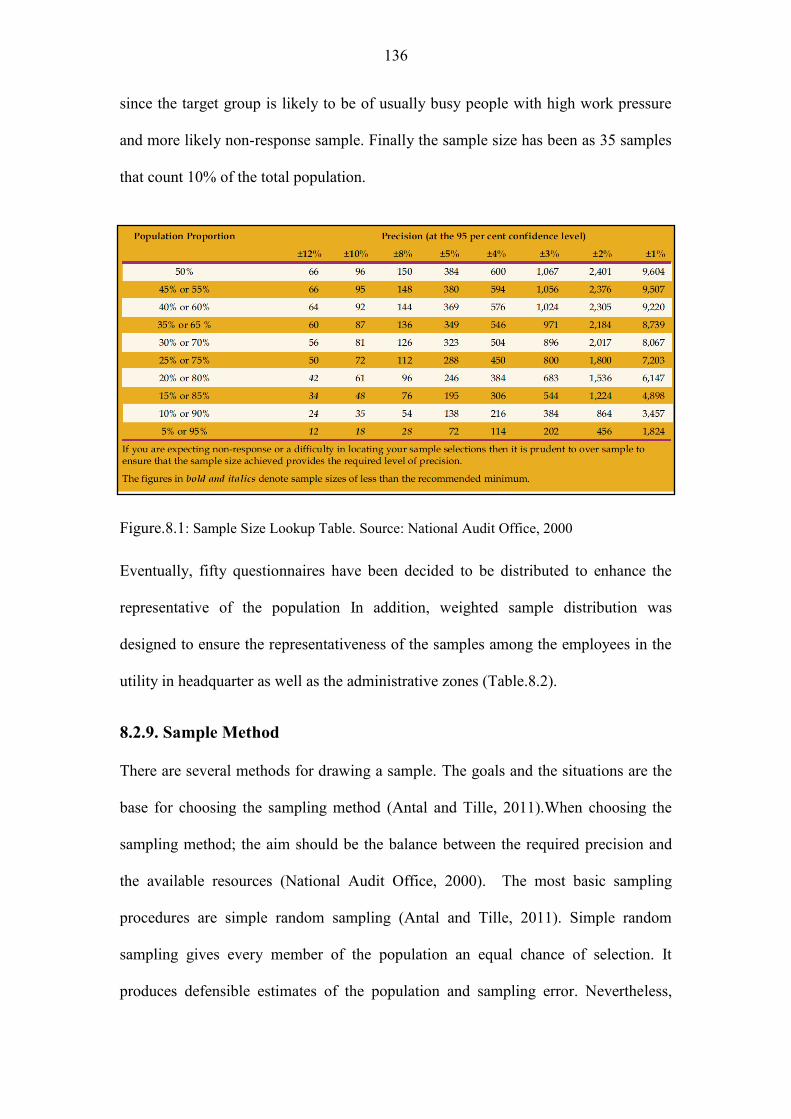
136
since the target group is likely to be of usually busy people with high work pressure
and more likely non-response sample. Finally the sample size has been as 35 samples
that count 10% of the total population.
Eventually, fifty questionnaires have been decided to be distributed to enhance the
representative of the population In addition, weighted sample distribution was
designed to ensure the representativeness of the samples among the employees in the
utility in headquarter as well as the administrative zones (Table.8.2).
8.2.9. Sample Method
There are several methods for drawing a sample. The goals and the situations are the
base for choosing the sampling method (Antal and Tille, 2011).When choosing the
sampling method;; the aim should be the balance between the required precision and
the available resources (National Audit Office, 2000). The most basic sampling
procedures are simple random sampling (Antal and Tille, 2011). Simple random
sampling gives every member of the population an equal chance of selection. It
produces defensible estimates of the population and sampling error. Nevertheless,
Figure.8.1: Sample Size Lookup Table. Source: National Audit Office, 2000

137
simple random sampling needs complete and accurate population listing (National
Audit Office, 2000).
In the research's case, there was no available listing for the target groups. Instead, the
questionnaire sample size was weighted according to the number of population in the
utility headquarter and administrative zones. Afterwards, visits to the locations of the
target groups' offices have been managed after locations investigation. Then the
questionnaire was distributed to random samples to assure that all the population has
an equal chance of selection.
Table.8.2 Weighted Sample Size and Recovered Percentage
Location Nr. Of
Population
Percentage of
Population
Weighted
Sample Size
Recovered
Samples
Recovered
Percentage
Headquarter 195 55% 28 18 64%
Zones 162 45% 22 18 82%
Total 357 100% 50 36 72%
Percentage of Distributed Sample out of the Total Population 14%
Percentage of Recovered Sample out of the Total Population 10.1%

138
8.2.10. Questionnaire Analysis
The Statistical Package for the Social Sciences (SPSS 13.0 software package) was
used for the questionnaire analysis.
First, the questionnaire data was entered to the software. Then, Likert Scale ratings
were defined as in Table 8.3. Afterwards, the percentages for each answers' choice out
of the total sample were calculated. These percentages were then multiplied by the
weight of the choice as in Table.8.3. Then, the mean and standard deviation for each
question's answers were calculated. At the end mean and standard deviation for each
part (group of questions) were computed.
Table.8.3 Five-point Likert Scale Rating
Source: Abdulfatah , 2008
Choice Strongly
Disagree Disagree Undecided Agree
Strongly
Agree
Rate 1 2 3 4 5
After having the mean of each part of the questionnaire, these means were
transformed into verbal appreciation according to Table.8.4 as follows:
Table.8.4
Response Average for Five-point Likert Scale
Source: Abdulfatah , 2008
Mean Response Average
from 1.00 to 1.79 Strongly Disagree
from 1.80 to 2.59 Disagree
from 2.60 to 3.39 Undecided
from 3.40 to 4.19 Agree
from 4.25 to 5.00 Strongly Agree
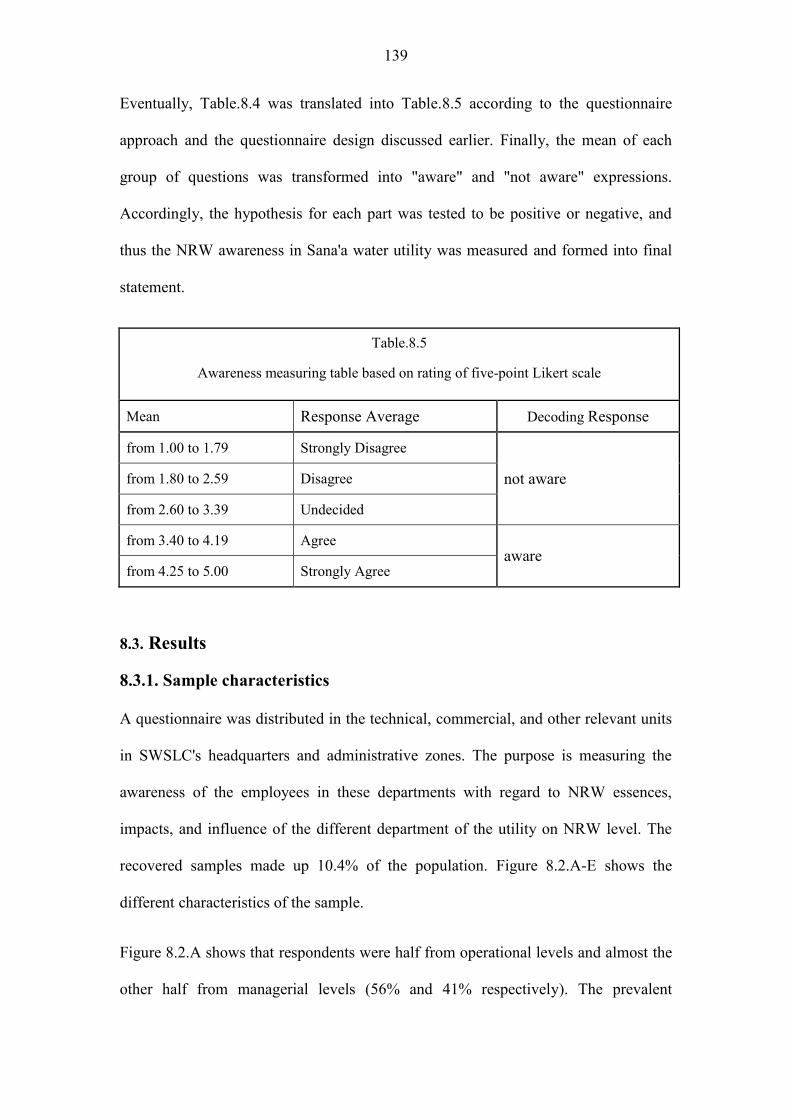
139
Eventually, Table.8.4 was translated into Table.8.5 according to the questionnaire
approach and the questionnaire design discussed earlier. Finally, the mean of each
group of questions was transformed into "aware" and "not aware" expressions.
Accordingly, the hypothesis for each part was tested to be positive or negative, and
thus the NRW awareness in Sana'a water utility was measured and formed into final
statement.
Table.8.5
Awareness measuring table based on rating of five-point Likert scale
Mean Response Average Decoding Response
from 1.00 to 1.79 Strongly Disagree
not aware from 1.80 to 2.59 Disagree
from 2.60 to 3.39 Undecided
from 3.40 to 4.19 Agree aware
from 4.25 to 5.00 Strongly Agree
8.3. Results
8.3.1. Sample characteristics
A questionnaire was distributed in the technical, commercial, and other relevant units
in SWSLC's headquarters and administrative zones. The purpose is measuring the
awareness of the employees in these departments with regard to NRW essences,
impacts, and influence of the different department of the utility on NRW level. The
recovered samples made up 10.4% of the population. Figure 8.2.A-E shows the
different characteristics of the sample.
Figure 8.2.A shows that respondents were half from operational levels and almost the
other half from managerial levels (56% and 41% respectively). The prevalent
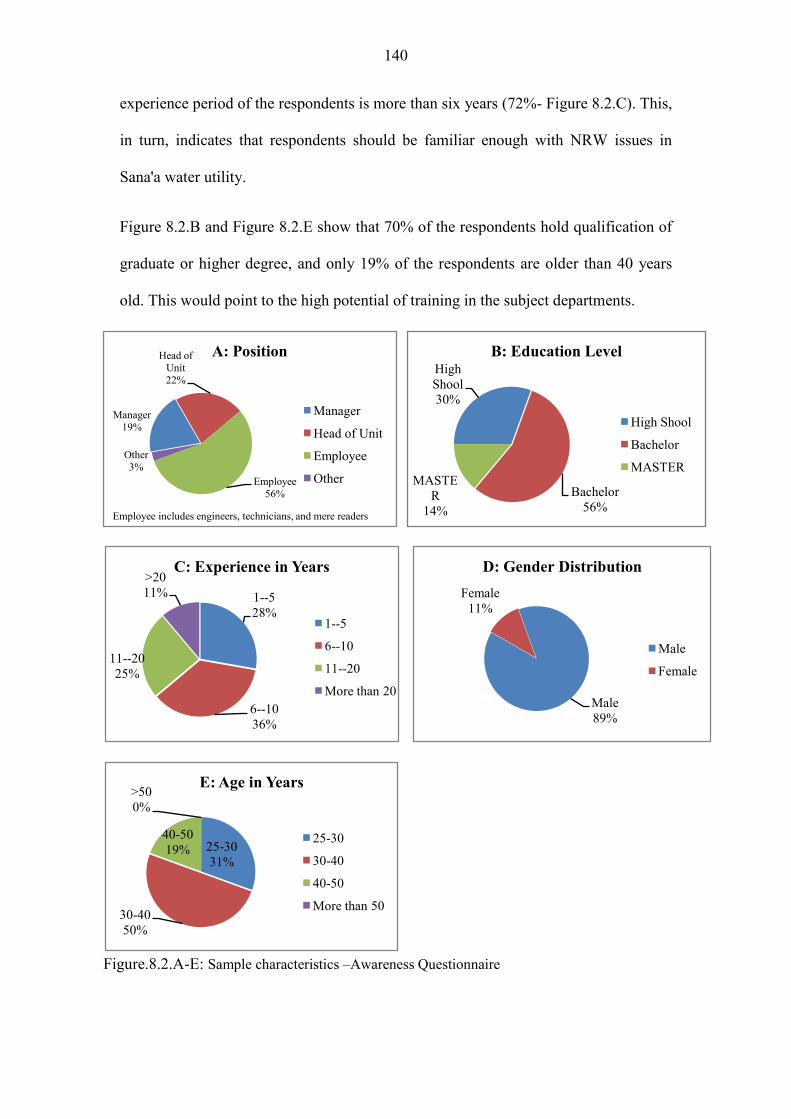
140
Manager19%
Head of Unit22%
Employee56%
Other3%
A: Position
Manager
Head of Unit
Employee
Other
Employee includes engineers, technicians, and mere readers
High Shool30%
Bachelor56%
MASTER14%
B: Education Level
High Shool
Bachelor
MASTER
1--528%
6--1036%
11--2025%
>20 11%
C: Experience in Years
1--5
6--10
11--20
More than 20
25-3031%
30-4050%
40-5019%
>500%
E: Age in Years
25-30
30-40
40-50
More than 50
Male89%
Female11%
D: Gender Distribution
Male
Female
experience period of the respondents is more than six years (72%- Figure 8.2.C). This,
in turn, indicates that respondents should be familiar enough with NRW issues in
Sana'a water utility.
Figure 8.2.B and Figure 8.2.E show that 70% of the respondents hold qualification of
graduate or higher degree, and only 19% of the respondents are older than 40 years
old. This would point to the high potential of training in the subject departments.
Figure.8.2.A-E: Sample characteristics Awareness Questionnaire

141
8.3.2. The first part of the hypothesis
As shown in Table.8.6, results show that the respondents are aware of the
environmental, health, institutional, operational, and financial impacts of NRW;;
however, they are not aware of the impact of it on the level of service such as lower
quality. This indicates to that they do not know the meaning of the term "level of
service" or that the question's wording was not appropriate even though it was tested
many times before its implementation.
Regarding the level of agreement, the average mean of this part is 3.62 with standard
deviation of 1.02 for the eight questions which not very far from "not aware" ranking
(3.4) which in turn indicate that respondents prefer not to give extreme statement for
things they know.
The final results of this part show that employees of the relevant NRW department in
Sana'a water utility are aware of what is NRW, and its main impacts;; and thus, the
first part of the hypothesis is positive.
8.3.3. The second part of the hypothesis
As shown in Table.8.7, results show that respondents are not aware of the existence of
any NRW assessment methods including water balance and minimum night flow
analysis. On the other hand, the results show that respondents are aware of the
existence of many NRW performance indicators;; however, they are not aware of the
infrastructure leakage index.
Although the first question that tackled the existence of calculating methods was
general, and thus could increase the potential of having aware answer, the result of the
question is that employees do not know that there are methods for NRW assessment.

142
This point is also supported by the general practice of Sana'a water utility, that have
no trials of NRW assessment as concluded in Chapter 5.
The average mean of this part is 3.34 with standard deviation of 0.84 of the means of
this part. The final results of this part indicate that the subject employees in Sana'a
water utility are not aware of the existence of NRW assessment methods and not ware
enough of all NRW performance indicators. Hence, the second part of the hypothesis
is positive.
8.3.4. The third part of the hypothesis
Results of this part (Table.8.8) are inconsistent. Results indicate that respondents are
not aware of the impacts of units in the technical departments on NRW level such as
designs and projects department;; however, they are well aware that meter readers
loyalty and qualification as well as job stability and customer relations are of
influence on NRW level. This might reflect the special focus of Sana'a water utility
which concentrates on reducing losses for meter readers' errors more than other NRW
elements such as real losses.
The average mean of this part is 3.57 with standard deviation of 1.09 which indicate
that subject employees are aware of the impacts of performance and activities in the
different departments in Sana'a water utility on NRW level. Hence, the hypothesis of
this part is negative.
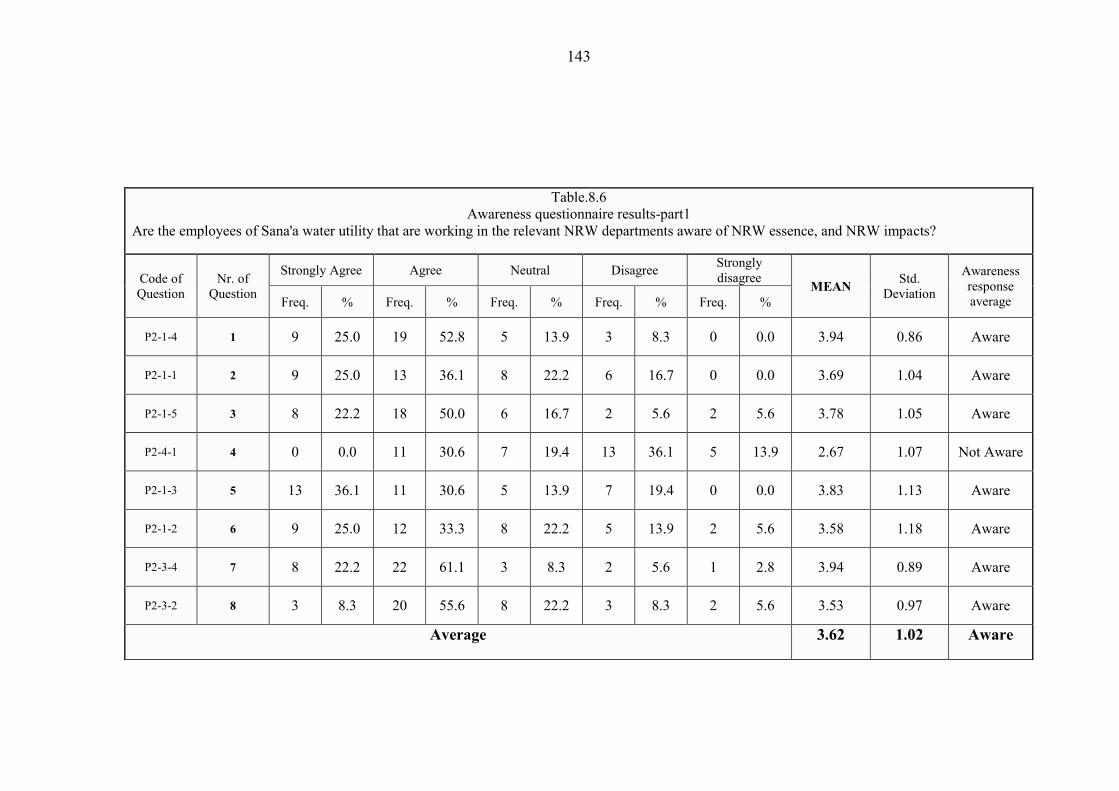
143
Table.8.6 Awareness questionnaire results-part1
Are the employees of Sana'a water utility that are working in the relevant NRW departments aware of NRW essence, and NRW impacts?
Code of Question
Nr. of Question
Strongly Agree Agree Neutral Disagree Strongly disagree MEAN Std.
Deviation
Awareness response average Freq. % Freq. % Freq. % Freq. % Freq. %
P2-1-4 1 9 25.0 19 52.8 5 13.9 3 8.3 0 0.0 3.94 0.86 Aware
P2-1-1 2 9 25.0 13 36.1 8 22.2 6 16.7 0 0.0 3.69 1.04 Aware
P2-1-5 3 8 22.2 18 50.0 6 16.7 2 5.6 2 5.6 3.78 1.05 Aware
P2-4-1 4 0 0.0 11 30.6 7 19.4 13 36.1 5 13.9 2.67 1.07 Not Aware
P2-1-3 5 13 36.1 11 30.6 5 13.9 7 19.4 0 0.0 3.83 1.13 Aware
P2-1-2 6 9 25.0 12 33.3 8 22.2 5 13.9 2 5.6 3.58 1.18 Aware
P2-3-4 7 8 22.2 22 61.1 3 8.3 2 5.6 1 2.8 3.94 0.89 Aware
P2-3-2 8 3 8.3 20 55.6 8 22.2 3 8.3 2 5.6 3.53 0.97 Aware
Average 3.62 1.02 Aware
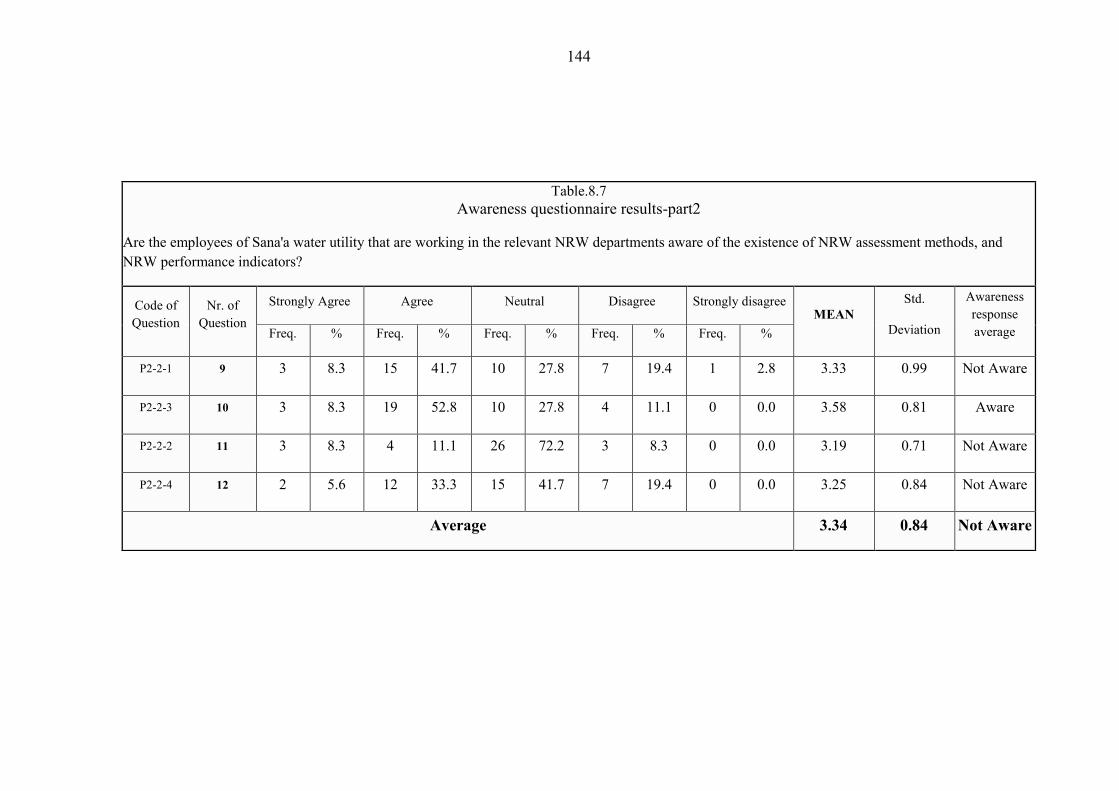
144
Table.8.7 Awareness questionnaire results-part2
Are the employees of Sana'a water utility that are working in the relevant NRW departments aware of the existence of NRW assessment methods, and NRW performance indicators?
Code of Question
Nr. of Question
Strongly Agree Agree Neutral Disagree Strongly disagree MEAN
Std.
Deviation
Awareness response average Freq. % Freq. % Freq. % Freq. % Freq. %
P2-2-1 9 3 8.3 15 41.7 10 27.8 7 19.4 1 2.8 3.33 0.99 Not Aware
P2-2-3 10 3 8.3 19 52.8 10 27.8 4 11.1 0 0.0 3.58 0.81 Aware
P2-2-2 11 3 8.3 4 11.1 26 72.2 3 8.3 0 0.0 3.19 0.71 Not Aware
P2-2-4 12 2 5.6 12 33.3 15 41.7 7 19.4 0 0.0 3.25 0.84 Not Aware
Average 3.34 0.84 Not Aware
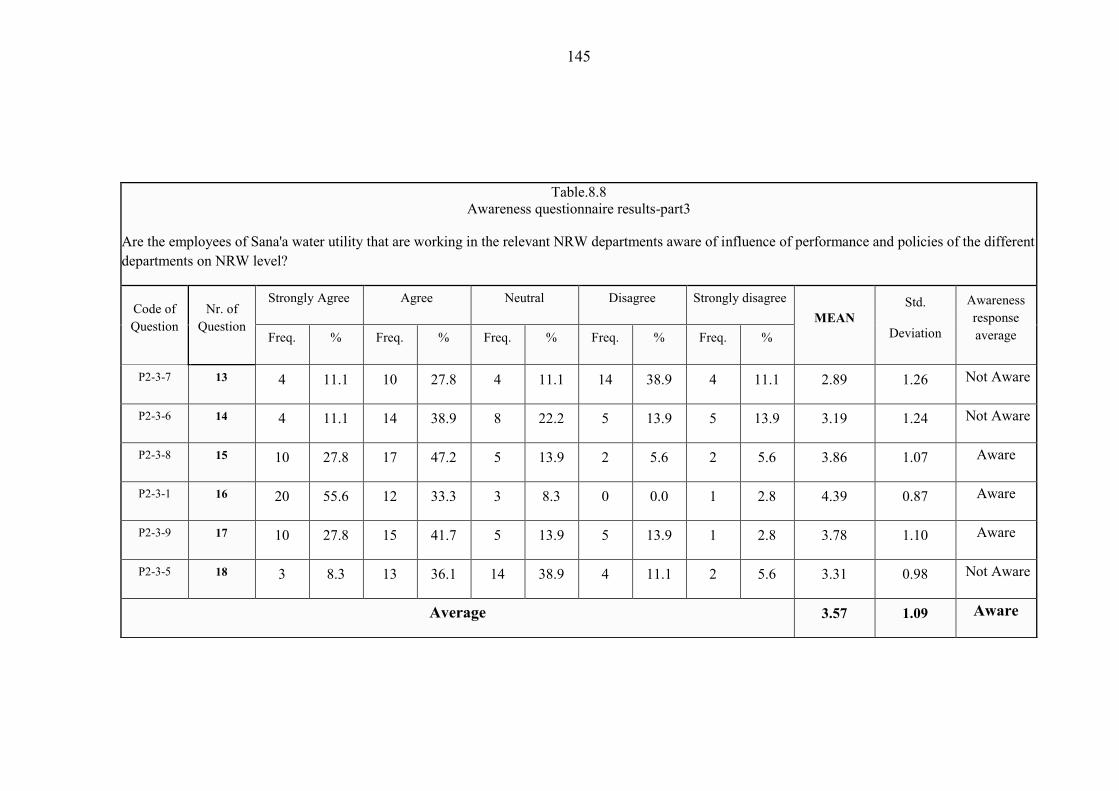
145
Table.8.8 Awareness questionnaire results-part3
Are the employees of Sana'a water utility that are working in the relevant NRW departments aware of influence of performance and policies of the different departments on NRW level?
Code of Question
Nr. of Question
Strongly Agree Agree Neutral Disagree Strongly disagree MEAN
Std.
Deviation
Awareness response average Freq. % Freq. % Freq. % Freq. % Freq. %
P2-3-7 13 4 11.1 10 27.8 4 11.1 14 38.9 4 11.1 2.89 1.26 Not Aware
P2-3-6 14 4 11.1 14 38.9 8 22.2 5 13.9 5 13.9 3.19 1.24 Not Aware
P2-3-8 15 10 27.8 17 47.2 5 13.9 2 5.6 2 5.6 3.86 1.07 Aware
P2-3-1 16 20 55.6 12 33.3 3 8.3 0 0.0 1 2.8 4.39 0.87 Aware
P2-3-9 17 10 27.8 15 41.7 5 13.9 5 13.9 1 2.8 3.78 1.10 Aware
P2-3-5 18 3 8.3 13 36.1 14 38.9 4 11.1 2 5.6 3.31 0.98 Not Aware
Average 3.57 1.09 Aware

146
8.3.5. The final result
The aggregate statement of the questionnaire's results could be formed as the following:
"Employees of the NRW-relative departments in Sana'a water utility are aware of the
NRW essence, and NRW general impacts. They are also aware of the impacts and
relations of the different departments in the utility on NRW level. However, they are not
adequately aware of the existence of NRW calculating methods, and NRW performance
indicators. "
This statement should be generalized to the whole population of the questionnaire as
statistical means of responses are with acceptable standard deviation. Further statistical
tests that study the variance of the answers' means such as One-Sample Test were
obtained from SPSS software. One-Sample Test drew Sig. (2-tailed) for the three parts
of the questionnaire with 0.000 which means that results are reliable. The tests prove
that the three parts of the questionnaire are a statistical function, and therefore, could be
used for extracting a factual statement. This conclusion is due to the use of Likert
scaling that is a well-accepted and reliable technique for attitude measurement as
pointed out by Klooster and Visser (2008).
8.4. Conclusion
Employees of the NRW-relative departments in Sana'a water utility are aware of the
NRW essence, and NRW general impacts. They are also aware of the impacts and
relations of the different departments in the utility on NRW level. However, they are not
adequately aware of the existence of NRW assessment methods, and NRW performance
indicators.
147
Chapter 9 Conclusions
9.1. Volume of NRW
Conclusion#1
Due to lack of awareness, Sana'a water utility underestimates significantly the volume
of Non Revenue Water by discounting unbilled authorized consumption, estimated
volume of repaired leakages, and production meters under-registration. These volumes
made up 9% of system input volume in 2009.
Conclusion#2
Non-Revenue Water for Sana'a water distribution system in 2009 made up 38.75% of
system input volume of which 26.57% is apparent losses;; 11.67% is real losses;; and
0.51% is unbilled authorized consumption.
Conclusion#3
The volume of real losses in Sana'a water distribution system in 2009 exceeded 5% of
the safe yield of Sana'a basin. Using ILI, Sana'a water distribution system should be
classified in D category in the real losses assessment matrix developed by World Bank
Institute. In accordance to the assessment matrix, Sana'a water utility uses resources
inefficiently, and NRW reduction programs are imperative.

148
9.2. Cost of NRW
Conclusion#4
The cost of NRW is high. NRW in 2009 cost Sana'a water utility 920.6 million YR
($4.3 million) of which 79% are apparent losses, 20% are real losses, and 1% unbilled
authorized consumption.
9.3. The Dominant Component
Conclusion#5
Apparent losses are the dominant component of NRW in Sana'a water distribution
system. They should be prioritized as they stand for 68.57% of NRW volume. In
contrary, real losses and unbilled authorized consumption make up 30.12% and 1.32%
of NRW volume, respectively.
Conclusion#6
Further analysis showed that among the 26.57% apparent losses, customer meters
inaccuracies and data handling errors stand for 4.24% and 3.46% respectively.
Unauthorized consumption is determined at 18.87%. The final figure of the standard
water balance is shown in Figure 6.11.
9.4. Volume of Illegal Use
Conclusion#7
Illegal water use in Sana'a water distribution system makes up 50% of NRW volume.
16% of the customers of Sana'a water utility use unauthorized water through illegal
connections, bypasses, and tampered and stopped meters. This indicates that illegal
water use in Sana'a water distribution system is a phenomenon rather than limited
practices.

149
%
26.57 %
7.70 %
Unauthorised Consumption
Apparent Losses 18.87 %
38.24 %
Real Losses11.67 %
38.75 %Water Losses
Metres Inaccuricies and Data Handling Errors
Non-Revenue Water
100
0.51System Input Volume
% Unbilled Unmetered Consumption0.31 %
61.76 % Unbilled Authorised Consumption
Unbilled Metered Consumption0.20 %
61.25 %0.66 %
Authorised Consumption
61.25 % Billed Unmetered Consumption
Water Balance (%) of Sana'a Water Distribution System (2009)
Billed Metered ConsumptionBilled Authorised Consumption
Revenue Water60.59 %
Figure 6.1-Chapter2: Water balance with sub-component of apparent losses
9.5. Verification
Conclusion#8
Accuracy analysis showed that the accuracy of the apparent losses assessment and
consequently real losses is ± 1.06% of system input volume assuming that data obtained
from Ministry of Water and Environment and Sana'a water utility are accurate.
Conclusion#9
Two further evidences prove the results of NRW assessment through the suggested
approach: (1) When Sana'a water utility analyzed the sales' records, it found that more
than 50% of its customers consume 1-10 M3 per month and 33% of the customers lie in
the first tariff block consuming 1-5 M3 per month. The utility doubts that less than 5 M3
per month is enough for 33% of its customers and assumed that many of these

150
customers use bypass illegal connections. (2) Records of 2009 showed that among
18445 customers that were disconnected because they didn't pay the bills, only 2705 are
reconnected and 15740 customers are still disconnected in spite of the fact that water
price from tankers are significantly higher than that provided by Sana'a water utility
($1.7 and $0.65 per M3 respectively). Those who are still disconnected make up 17.7%
of the utility customers.
9.6. Causes of Illegal Use
Conclusion#10
Causes of illegal water use in Sana'a water distribution system lie within six main
reasons: (1) poor customer-utility relation;; (2) lack of monitoring;; (3) insufficient water;;
(4) lack of employees' loyalty and commitment;; (5) poverty;; and (6) corrupting
practices.
Conclusion#11
The poor customer-utility relation is a main contributor to high level of illegal water
use. While the social perspective stated that lack of monitoring is the main reason,
responses of social questionnaires implied many points related to customer-utility
relation. Examples are: complexity of the utility procedures, ill-treatment of the
employees of Sana'a water utility, and the air in the network that "could" be recorded by
water meters. The air issue was the kick-start of a dwindling customer confidence on
Sana'a water utility.
Conclusion#12

151
There is low level of employees' loyalty and commitment of many technicians and
meter readers in Sana'a water utility. This is a result of lack of appropriate incentives
or/and job stability.
9.7. Current NRW Management
Conclusion#13
There is no assessment and consequently no prioritizing for NRW components in Sana'a
water utility. As a result, NRW management is inefficient. It treats the obvious NRW
elements without consideration to its contribution to the volume of NRW. An example,
the utility measures focus on reducing meter readers' errors and readers corrupting
practices more than illegal water use.
Conclusion#14
Sana'a water utility has made many attempts to reduce real losses;; pressure
management, zoning, and installing DCMMS system. All encountered with many
difficulties and thus did not progress apart from DCMMS system. The system enhanced
the reactive leakage management in Sana'a water distribution system. However, there is
a lot of potential for further improvement.
9.8. NRW Management Monitoring
Conclusion#15
Unlike the common used percentage indicator, Infrastructure Leakage Index is a robust
indicator. Besides measuring the level of real losses, ILI indicates both level of service
through taking into consideration pressure level and average time of water service;; and
management practices towards water distribution network through taking into

152
consideration the conditions of the infrastructure and the level of unavoidable annual
real losses.
Conclusion#16
Yet, the application of Infrastructure Leakage Index in Sana'a water utility under the
current conditions is likely to be difficult due to its data requirements.
Conclusion#17
Volume of NRW expressed as a percentage of system input volume as a NRW indicator
should not be used on its own;; rather, the use of suggested package of real, apparent,
and financial indicators by IWA and AWWA allow efficient and comprehensive
monitoring. These indicators provided in the free NRW softwares.
9.9. NRW Awareness
Conclusion#18
Employees of the NRW-relative departments in Sana'a water utility are aware of the
NRW essence, and NRW general impacts. They are also aware of the impacts and
relations of the different departments in the utility on NRW level. However, they are not
adequately aware of the existence of NRW assessment methods, and NRW performance
indicators.
9.10. The Used Approaches
9.10.1. The Suggested Approach;; The Reveres Approach
Conclusion#19
153
NRW assessment in water utilities with expected high unauthorized consumption is
difficult. Top down approach is not recommended as it underestimates unauthorized
consumption unless objective estimations for unauthorized consumption are available.
On the other hand, the only other option is bottom up approach which estimates NRW
through conducting DMAs and zoning principle. This, in turn, besides that it is
advanced phase of NRW management as it is part of assets and infrastructure
management, it requires advanced technical and financial resources.
Conclusion#20
The suggested approach is an added value in the discipline of NRW management. It
provides an alternative methodology of NRW assessment and breakdown for water
utilities in countries where unauthorized consumption is expected to be high such as
developing countries. In such a case, this approach serves as an alternative for top down
approach that developed by AWWA and IWA. The suggested approach uses usually
available data of WWTP inflows, per capita consumption, number of people served and
billing records of water utilities. All these data should be available in any water utility.
Conclusion#21
The Reveres Approach is sensitive to accuracy of per capita consumption unless other
methods of estimating exfiltration rate are used. Besides, although outdoor water use
was proved to be with no significant influence on NRW assessment through the reverse
approach, it might have other trends in cities where high level of outdoor water use
consumption is recorded.
9.10.2. Likert Scale
Conclusion#22

154
Due to its simplicity and reliability, Likert scale proved to be a robust tool for
questionnaire design and analysis.

155
Chapter 10 Recommendations
10.1. Non Revenue Management in Sana'a Water Utility
10.1.1. NRW Assessment
Recommondation#1
The standard water balance should be drawn at least annually to assess NRW. NRW
components could not be prioritized or properly managed without the assessment phase.
For this purpose, Sana'a water utility should get use of the free NRW softwares by
World Bank Institute and American Water Works Association.
Recommondation#2
Non-Revenue water assessment is not a one end action;; rather, it should be a continuous
process whose input data to be improved and accuracy of its output water balance to be
analyzed.
10.1.2. Real Loss Management
Recommondation#3
A suggested order for leakage management techniques in Sana'a water distribution
system is: (1) improving the speeds and quality of repairs through optimizing the
current system of DCMMS;; (2) asset management;; the focal but most difficult step
156
towards leakage management. The establishment of zoning principle and DMAs is a
must in Sana'a water distribution system. Since the utility failed in many trials, it is the
role of the private sector to provide a more proper technology for DMA establishment;;
(3) pressure management in the sense of management rather than reduction;; (4) active
leakage control through metering and monitoring the flow of DMAs to allow reaching
the unreported or invisible leaks.
Recommondation#4
To optimize the existence of DCMMS system, four issues should be improved: (1):
achieving shorter average repairing time;; the recordered123 h/day in 2009 is still far;; (2)
recorded leaks should be categorized into leakage types (e.g. service connections,
mains,..);; (3) the leakage repairing time should be categorized into awareness time,
locating time, and repairing time;; and (4) the system should have evaluating measures
for quality of work done for repairing leakages.
Once these elements are integrated in the system, advanced leakage analysis could be
achieved, and thus better level of speed and quality of repairing could be fulfilled.
10.1.3. Apparent Loss Management
Recommondation#5
Apparent loss should be prioritized when designing NRW management strategy as they
are dominant and its management is cost effective. Special focus should be paid for
unauthorized consumption minimization.
Recommondation#6
For limiting the illegal water use in Sana'a water utility, first, loyalty and commitment
of employees, especially technician and meter readers, should be gained and maintained
by proper incentives and job stability. Then, monitoring measures for illegal use should

157
be set;; and whenever possible sufficient water should be allocated fairly among the
customers within the same distribution area.
Second, customer-utility relation should be improved;; communication channels should
be established;; more appropriate customer treatment should be offered, and regular
awareness campaigns should be planned with any management measure related to
customers.
Third, customer confidence should be a targeted objective for Sana'a water utility. The
air issue should be dealt with by conducting studies for defining the magnitude of the air
in the network and its impacts of customer confidence. Then, a cost-benefit analysis
should be carried out, and substitution of customer meters should be put among the
alternatives.
Forth, once the above points are considered, other measures could be used such as
advertisement and rewards for any one report illegal use or as the utility suggest
utilizing the religious position for illegal use limitation.
10.1.4. NRW Management Monitoring
Recommondation#7
NRW Percentage as an indicator should not be used on its own as it is highly affected
by water consumption and amount of water produced. Instead, it should be planned to
make data available for introducing Infrastructure Leakage Index as a real loss indicator
that measure the level of service and real losses at the same time. Till that is achieved
and after, Sana'a water utility and Ministry of Water and Environment should integrate
the package of performance indicators suggested by IWA/AWWA for proper NRW
monitoring.
158
10.1.5. Other
Recommondation#8
Economic Studies
Further studies tackling the economic aspects of NRW management should be
conducted with special focus on defining the economic level of leakage. However,
apparent losses management is usually cost-effective.
Recommondation#9
Awareness Raising and Capacity Building:
First: awareness measures for the utility employees should be planned for NRW
management in general and its assessment in particular;; employees should be aware of
the existence of NRW assessment methods. Second: the training programs that are
designed in participatory approach in the utility should be at the employees' level rather
than the managers' level. This would supply more chance for NRW management
training among capacity building programs in the utility.
Recommondation#10
Hierarchy Change
First: Commercial unit should be a department on its own. Being a unit in the financial
department limited its authorizations and produced confused policies (commercial
thinking vs. financial thinking).
Second: Although NRW is an issue of mainly the commercial and technical department
in the utility, all the other departments are involved in its management. For this reason
and for that there is a natural overlapping of duties and tasks among the units of both
commercial and technical departments, it is recommended that an "independent" unit for
NRW management to be integrated with the hierarchy of Sana'a water utility to bear the

159
tasks of collecting NRW data and following up implementation of NRW management
measures in all these departments. This unit should have representatives from all the
stakeholder departments to ensure access to all relevant departments.
10.2. For Scientific Research
Recommondation#11
There is lack of scientific methods for NRW assessment especially in countries where
expected unauthorized consumption is high. Research initiatives for such methods
would contribute to save considerable amount of water through better NRW reduction
throughout the world. This study attempted to contribute by the suggested approach,
Reverse Approach. However, there is big room for improvement;; more accurate
methods are required for estimating exfiltration from sewers. Analysis for the
contribution of the organic material's volume in the suggested equation would also give
insights to consider these volumes in the future and then achieve better accuracy of
NRW assessment which, in turn, is the most difficult and important phase. Once
achieved, water utilities with international cooperation agencies should be and usually
are professional of making strategies and the rest of the job.

160
References Abdulfatah A. (2008), Introduction to Descriptive and Inferential Statistics Using SPSS, (1st ed. in Arabic), Khwarizm, AL-Riyadh. Al-Hamdi, M. (1997): Case Study XIII - (1997), Water Pollution Control - A Guide to the Water Quality Management Principles. (1sted), UK: St Edmundsbury Press, Bury St Edmunds, and Suffolk. Printed on the Behalf of World Health Organization, United Nations Environment Program, and Water Supply & Sanitation Collaborative Council. Al-Hamdi, M. (2000): Yemen. A study on the incentive systems for urban and agricultural water use.Published Doctoral Dissertation.A.A.Balkema, Rotterdam. Al-Kirshi A., and Abbas T. (1998), Protected Agriculture in the Republic of Yemen. In: Mustafa A., AL-Mohammadi A., Abo-Hdid A., and Pencock J.(ED), Protected Agriculture in the Arabian Peninsula, Summary Proceedings of an International Workshop 15-18, February 1998, Doha, Qatar, International Center for Agricultural Research in the Dry Areas, Aleppo, Syria. x+104pp. Al-Washali T., Aklan M., Alwan, M., and AL-Zobairy I. (2006), Designing Water and Wastewater Networks for the 45th Zone. Unpublished BSc. Graduation Project, Faculty of Engineering, Sana'a University. American Water Works Association (AWWA) (2009), Water Audits and Loss Control Programs. (3rd ed.), M36 Publication Rewrite, Denver, CO: AWWA Publication. Amick S., Burgess E., and Selvakumar A. (2000), Exfiltration in Sewer System (EPA publication No.EPA/600/R-01/034), USA.
- -Espiñeira R. (2003), Estimation of Residential Water Demand: a State-of-the-Art Review. Journal of Socio-Economics, 32: 81 102. Barrett C., Hamilton B. A., and Arlington V. A. (2010), Water Security & Yemen: Will the Lack of Water Security Lead to a Failed State and a National Security Threat to the US?,Annual Water Resources Conference, Pennsylvania, USA, November. 1 - 4, 2010, Abstracts. BOLD Educational Software (2010), Sample Size Calculator. Retrieved November 28, 2000, from http://bold-ed.com/calculator.htm Brooks, D. (2006) An Operational Definition of Water Demand Management. International Journal of Water Resources Development, 22, (4): 521 528
161
Butler D. and andMemon F. A. (2006), Water Demand Management. (1st ed.), UK:IWA Publishing. Central Statistical Organization (2006), The General Population, Housing, Establishment Census 2004, General Frame of the Population: Final Results, Sana'a. Ciochetto S. and Haley B. (1995). How Do You Measure "Awareness"? Experience with the Lead-Based Paint Survey. Proceedings of Survey Research Methods, Alexandria, VA. American Statistical Association, 1, pp. 1163-1168. Cheung P., Girol G., Abe N., and Propato M. (2010), Night flow analysis and modeling for leakage estimation in a water distribution system. In: Boxall J., and Maksimovic C. (Eds), Integrating Water Systems: Proceedings of the Tenth International Conference on Computing and Control in the Water Industry 2009. London: Taylor & Francis Group. Cosgrove, W., and Rijsberman F. (2000) World Water Vision: Making Water
. (1st ed.). London: Earthscan Publications. De BénédittisJ., and Bertrand-Krajewski J.-L. (2004). Infiltration in sewer systems: comparison of measurement methods. Proceedings of the 4th International Conference on Sewer Processes and Networks, Funchal, Madeira, Portugal, 22-24 November, pp 301-308. Department of Water Affairs and Forestry (2004), Integrated Water Resources Management;; Guidelines for Water Conservation and Water Management in Water Management Areas and in the Water Services Sector, South Africa, Volume 2 Undertaking a Situation Assessment and Development of a Business Plan in the Water Services Sector. Full Guidelines Version (1st ed.), South Africa. Dublin Drainage Consultancy (2001), The Greater Dublin Strategic Drainage Study (Publication of Dublin City Council, Vol. 4). Dublin. Ellis, J.B., Revitt, D.M., Lister, C.W., and Buckley, A. (2003), Experimental Studies of Sewer Exfiltration.Water Science & Technology, 47: 61 67. Environmental Protection Agency (2009), Control and Mitigation of Drinking Water Losses in Distribution Systems.(EPA 816-D-09-001). Washington DC. European Commission (2004), Aid Delivery Methods, Project Cycle Management Guidelines (Volume1), Brussels. Farley M., and Liemberger R. (2004), Developing a Non-Revenue Water Reduction Strategy, Part 2: Planning and Implementing the Strategy, Conference Proceedings, IWA World Water Congress, 19-24 September, 2004, Marrakech. Farley M., and Trow S. (2007),Losses in Water Distribution Networks;; A Practitioner's Guide to Assessment, Monitoring, and Control.(2nd ed), UK: International Water Association Publishing.
162
German Agency for Technical Cooperation (GTZ) (2009) Yemen Urban Water Supply and Sanitation Sector Reform, Technical Secretariat (TS)/Reform of the Institutional Framework in the Urban Water and Sanitation Sector, Sana'a. Gleick P. H., Haasz D., Henges-Jeck C., Srinivasan V., Wolff G., Cushing K. K., and Mann A. (2003) Waste Not, Want Not: The Potential for Urban Water Conservation in California, (1st ed.,), appendix b. Hayward, CA: Alonzo Printing Co., Inc. HalfawyM., and Hunaidi O. (2008), GIS-Based Water Balance System for Integrated Sustainability Management of Water Distribution Assets. Proceedings of The 60th Annual Western Canada Water and Wastewater Association Conference, Regina, Saskatchewan, September 23-26, 2008, pp. 1-16. Harza Engineering Company International and Montgomery Waston Arabtech Jardanah (2006), Sana'a Water Distribution Systems Improvements, Design final report, Sana'a. Hawcroft L., and Milfont T. (2010), The Use (and abuse) of the New Environmental Paradigm Scale over the Last 30 Years: A Meta-analysis. Journal of Environmental Psychology, 30: 143 158 Hellegers P. Perry, C. Al_Aulaqi N., Al_Eryani A., and Al_Hebshi M.(2008), Incentives to reduce groundwater extraction in Yemen. Report 2008-058, the leading Institute for Social-Economic Research (LEI), Wageningen UR, Netherlands and Belgium. Haidarah M. (1995) Computer Modeling of Water Distribution Systems with Intermittent Supply;; Case Study Sana'a, Yemen. MSc. Thesis E.E. 73, IHE, Delf Japan International Cooperation Agency (JICA) (2007), The Study for the Water Resources Management and Rural Water Supply Improvement in the Republic of Yemen, Water Resources Management Action Plan for Sana'a Basin, Final Report, Sana'a.
ter use behavior: An integrated model. Journal of Environmental Management 91: 227 236. Kingdom, B., Liemberger, R., and Marin, P.(2006),The Challenge of Reducing Non-Revenue Water (NRW) in Developing Countries How the Private Sector Can Help: A Look at Performance-Based Service Contracting. Water Supply and Sanitation Sector Board Discussion Paper Series Paper NO.8. The World Bank Group. Klooster P. M., and Visser M. D. T. (2008), Comparing two image research instruments: The Q-sort method versus the Likert attitude questionnaire. Food Quality and Preference, 19: 511 518
163
Lambert A. (2002), International Report on Water Loss Management and Techniques. Water Science and Technology: Water Supply, 2 (4): 1-20 Lambert A. (2003), Assessing Non-Revenue Water and its Components: A Practical Approach. Water 21: Magazine of the International Water Association, Special Series of IWA Water Loss Task Force: World Best-Practice in Water Loss Assessment, and Reduction Strategies, August: 50-51. Lambert A., and Taylor R. (2010), Water Loss Guidelines. A guideline for the New Zealand Water and Wastes Association;; Water New Zealand, New Zealand. Lambert A. (2010), Personal Communication. Library of Congress (2008), Country Profile: Yemen, Country Studies Series, Federal Research Division, Washington DC. Liemberger, R., Farley, M. (2004), Developing a non-revenue water reduction strategy, part 1: Investigating and assessing water losses, Proceedings of IWA 4th World Water Congress, Morocco, Marrakech 19-24 September 2004. Liemberger R., and McKenzie R. (2005). Accuracy Limitations of the ILI - Is it an Appropriate Indicator for Developing Countries. Proceedings of IWA Specialized
, Halifax, Nova Scotia, Canada 12-14th September 2005 pp 82 89. Marunga A., Hoko Z., and Kaseke E. (2006), Pressure management as a leakage reduction and water demand management tool: The case of the City of Mutare, Zimbabwe. Physics and Chemistry of the Earth, 31: 763 770. Meckenzie R., and Lambert A. (2004), Best Practice Performance Indicators: A Practical Approach Water 21: Magazine of the International Water Association, Special Series of IWA Water Loss Task Force: World Best-Practice in Water Loss Assessment, and Reduction Strategies, August: pp 43-45. Michel Vermersch and Alex Rizzo (2008), Designing an action plan to control non-revenue water. Water 21: Magazine of the International Water Association, April: 39-41. Ministry of Legal Affairs (2000), Presidential Decree Nr. 53 on the Establishment of Sana'a Water Supply and Sanitation Local Corporation of the Secretariat of the Capital, Official Gazette, Sana'a. Ministry of Water and Environment (MWE) (2008), Performance Indicators Information System (PIIS): Annual Report, 2007. Sana'a, Yemen. Mitchell G., Mein R., and McMahon T. (1999) The Reuse Potential of Urban Stormwater and Wastewater. Cooperative Research Centre for Catchment Hydrology (Industry Report, Report 99/14), Canberra.
164
Mutikanga, H., Sharma, S., and Vairavamoorthy, K. (2010), Assessment of apparent losses in urban water systems. Water and Environment Journal, (to be cited as) no. doi: 10.1111/j.1747-6593.2010.00225.x National Audit Office (2000), A practical guide to sampling, publication of Statistical and Technical Team, London. National Water Resources Authority (NWRA) (2006), Baseline Survey for Future Impact Evaluation Document-Final Report, NWRA -Sana'a Branch, Sana'a. National Water Resources Authority (NWRA) (2006b), Investigation and evaluation of private wells and water tankers in Sana'a: the physical and chemical characteristics and health conditions. NWRA, Sana'a Branch. National Water Resources Authority (NWRA) (2010), The Database of Sana'a Wells. Updated till November, 2010. NWRA, Sana'a Branch. Núñe M., Oliver-Solà J., Rieradevall J., and Gabarrell X. (2010), Water Management in Integrated Service Systems: Accounting for Water Flows in Urban Areas. Water Resour Manage, 24:1583 1604 Office for Human Research Protections (2010), International Compilation of Human Research Protections (2010 Edition, Final Version), U.S. Department of Health and Human Services, Washington DC. Palenchar, J., Friedman, K. and J. Heaney (2009), Hydrograph Separation of Indoor and
Sector. Proceedings of Florida Section of AWWA Fall Conference, November 27 - December 1, 2009, Orlando. Puust R., Kapelan Z., Savic D., and Koppel, T. (2010), A review of methods for leakage management in pipe networks. Urban Water Journal, 7 (1): 25-45. Radivojevic D., Milicevic D., and Blagojevic B. (2008), IWA Best Practice and Performance Indicators for Water utilities in Serbia- Case Study Pirot. Factua Universitatis, Architecture and Civil Engineering, 6 (1): 37 50. Ranhill Utilities Berhad and the United States Agency for International Development (2008), -Revenue Water Handbook. A Guide to Understanding Water Losses. Malaysia/ Thailand. Romero C., and Dukes M. (2010), Residential Benchmarks for Minimal Landscape Water Use. University of Florida Water Institute (the Conserve Florida Water Clearinghouse Research Agenda), Florida. Rutsch M., Rieckermann J., Cullmann J., Ellis J.B., Vollertsen J., and Krebs P. (2008), Towards a better understanding of sewer exfiltration. Water Research, 42: 2385 2394
165
Sana'a Water Supply and Sanitation Local Corporation (2005, 2006, 2007, 2008, 2009), Annual Report, General Department of Projects and Planning, Sana'a. Sana'a Water Supply and Sanitation Local Corporation (2009b), A Report on Water Production and Distribution, Production Unit, Technical Department, Sana'a. Sana'a Water Supply and Sanitation Local Corporation (2010), Water and Wastewater Tariff, Commercial Department, Sana'a. Sana'a Water Supply and Sanitation Local Corporation (2010b), The Forth Five-Year Plan for Poverty Alleviation, General Department of Projects and Planning, Sana'a. Sana'a Water Supply and Sanitation Local Corporation (2010c), Report of Performance Indicators: 2010, Performance Indicators' Unit, Sana'a. Singh, R., Maheshwari, B. L., and Malano, H. M., (2009) Developing a conceptual model for water accounting in peri-urban catchments. The 18th World IMACS Congress and MODSIM 09, International Congress on Modeling and Simulation, July 13 17, 2009, Cairns, Australia, pp 7- 14. Steinar K. (2007), Learning the Craft of Interviewing. In: Flick, Uwe (Ed), Doing Interviews. (pp.137-141), U.K., SAGE Publications. Sufian T., Altowaie H., Knies G., Trieb F., and Kern J. (2006),
, Trans-Mediterranean Renewable Energy Cooperation (TREC), Sana'a/Hamburg. The International Bank for Reconstruction and Development (The World Bank) (2007), Making the Most of Scarcity;; Accountability for Better Water Management in the Middle East and North Africa, Washington, DC. The International Bank for Reconstruction and Development (The World Bank), Cities
SStrategy. A report of strategic planning for Ministry of planning and development, Washington DC. The International Fund for Agricultural Development (IFAD) (2010), Calculating the Sample Size. Retrieved November 29, 2000, from http://www.ifad.org/gender/tools/hfs/anthropometry/ant_3.htm The Stimson Center (2010), Fresh Water Futures: Imagining Responses to Demand Growth, Climate Change, and the Politics of Water Resource Management by 2040. A report of the future of global fresh water resources and the politics of water resource management, National Intelligence Council and the US State Department, Washington DC. Thornton J, and Lambert A. (2005), Progress in practical prediction of pressure: leakage, pressure: burst frequency and pressure: consumption relationships.
166
, Halifax, Nova Scotia, Canada 12-14th September 2005 p347-358 Thornton J., Sturm R., and Kunkel G. (2008), Water Loss Control, (2nd ed.). USA: McGraw-Hill Companies Publishers. United Nations Development Program (2009), Arab Human Development Report: Challenges to Human Security in the Arab Countries. Regional Bureau for Arab States, New York. Water and Environment Center (WEC) (2010) Unaccounted For Water Training Program: Minimum Night Flow Analysis in Al-Akama Area, 2nd Zone. Unpublished Report, WEC-Sana'a University. Water and Environment Center (WEC) (2010). Personal Communication, WEC-Sana'a University. Western Australian General Practice Network (2008), Toolkit Staff surveys of
. Divisions of General Practice, Information Management Maturity Framework, Bentley, Western Australia. Winarni W. (2009), Infrastructure Leakage Index (ILI) as Water Losses Indicator. Civil Engineering Dimension, 11 (2): 126-134 World Bank Institute, 2009. Free Water Balance Software V.3.00 Zeug G., and Eckert S.(2010), Population Growth and Its Expression in Spatial Built-up
Case Study. Remote Sensing, 2: 1014-1034
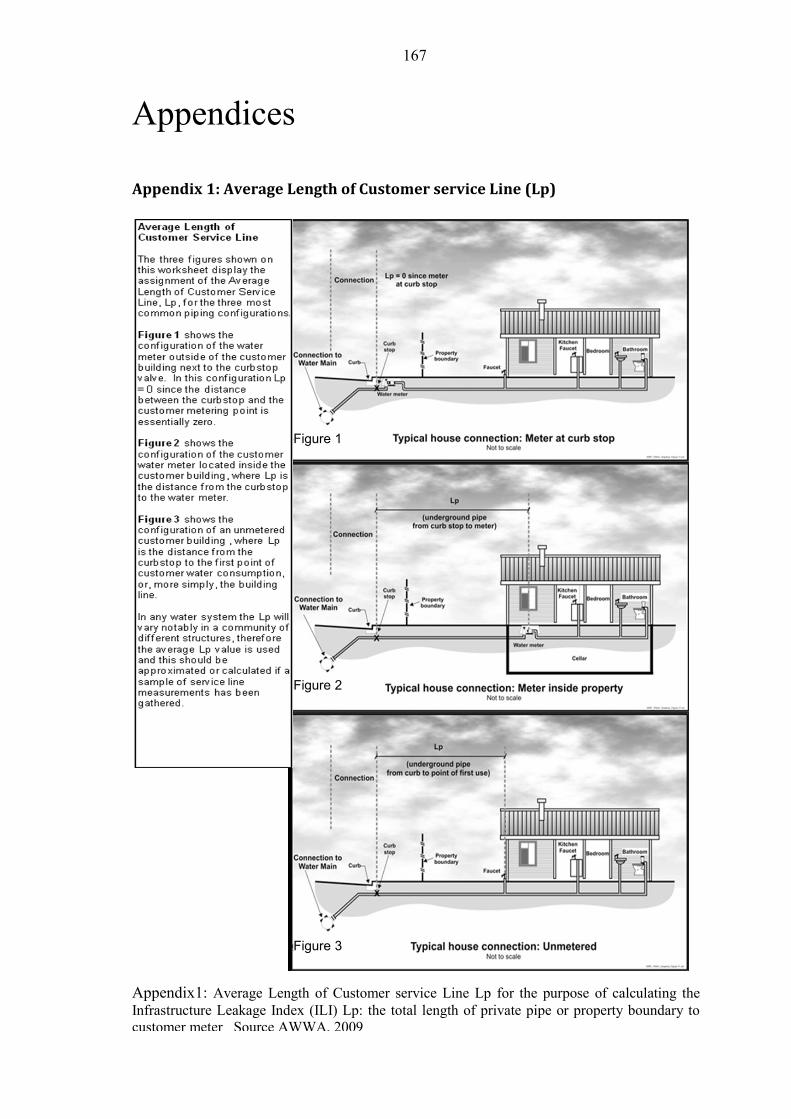
167
Appendix 1: Average Length of Customer service Line (Lp)
Appendices
Appendix1: Average Length of Customer service Line Lp for the purpose of calculating the Infrastructure Leakage Index (ILI) Lp: the total length of private pipe or property boundary to customer meter Source AWWA, 2009
Figure 1
Figure 2
Figure 3

168
Appendix 2: List of interviewees
Date Interviewee Position Topic
6/10/2010 Mr. Adel Al-Haddad Deputy Minister-MWE current NRW projects - JICA & GTZ, Authorization
Mr. Grellium GTZ Component 2: Team Leader,
Mr. Shwagfeh GTZ Component 2: Senior Consultant
Mr. Thomas Dorsch Consultant-O&M Project- Team Leader
6/10/2010 Mr. Ali Zabarah IT Department Manager NRW-data cycle and availability
6/10/2010 Mr. Ali Jadel Sanaa Water Project, Team Leader zoning of new projects
physical loss: level, causes, solutions
possibility of conducting MNF analysis
23/10/2010 hierarchy of technical Department & suggested NRW Unit, its stakeholders
7/10/2010 Dr. Fadhl Al-Nozaily Scientific Consultant of the utility NRW assessment, MNF analysis
8/10/2010 Dr. Mansor Hydraa Prof, Water and Environment Center the suggested approach- NRW assessment, previous trials of MNF analysis
Mr. Mohammad Amin,
Mr. Ibrahim Amer
9/10/2010 Mr. Jameel Shehatal Dorsch Consultant-O&M Project- Senior technician
NRW reduction project- OMs project and subprojects
9/10/2010 Mr. Abdulhack Al-sharafi GIS unit - head Available GIS data
10/10/2010 Mr. Nabeel Al-Shagdari Statistical Department Manager Annual reports , the utility five-year plan
10/10/2010 Mr. Mohammed Bawragy Water laboratory- head complaints of water pollution caused by leakages
10/10/2010 Mr. Ahmad Othman Water laboratory- Manager complaints of water pollution caused by leakages
11/10/2010 Mr. Ibrahim Jelhem water production unit- technician production data, meters maintenance
9/10/2010 DCMMS- Complaints- Telephonist leakages complaints and procuress of repairs
7/10/2010
9/10/2010 potential contribution of the research, status quo of NRW project
Mr. Saleh Abdulwadood Technical Department Manager
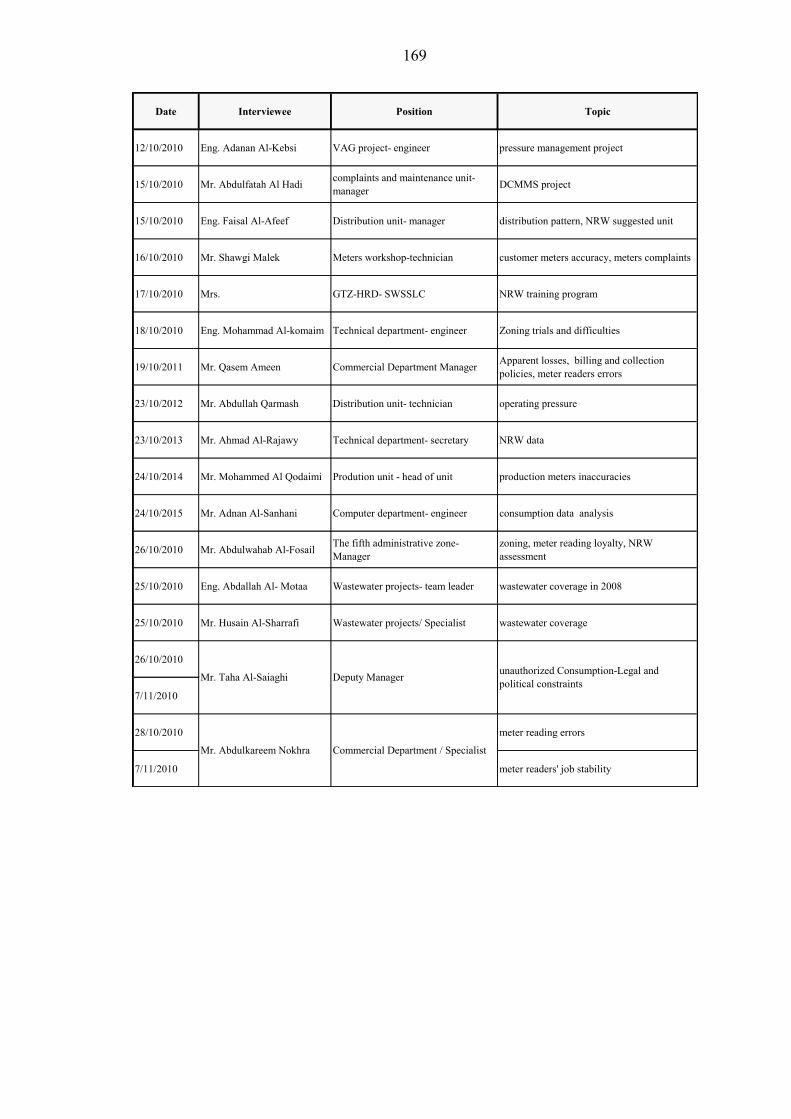
169
Date Interviewee Position Topic
12/10/2010 Eng. Adanan Al-Kebsi VAG project- engineer pressure management project
15/10/2010 Mr. Abdulfatah Al Hadi complaints and maintenance unit- manager DCMMS project
15/10/2010 Eng. Faisal Al-Afeef Distribution unit- manager distribution pattern, NRW suggested unit
16/10/2010 Mr. Shawgi Malek Meters workshop-technician customer meters accuracy, meters complaints
17/10/2010 Mrs. GTZ-HRD- SWSSLC NRW training program
18/10/2010 Eng. Mohammad Al-komaim Technical department- engineer Zoning trials and difficulties
19/10/2011 Mr. Qasem Ameen Commercial Department Manager Apparent losses, billing and collection policies, meter readers errors
23/10/2012 Mr. Abdullah Qarmash Distribution unit- technician operating pressure
23/10/2013 Mr. Ahmad Al-Rajawy Technical department- secretary NRW data
24/10/2014 Mr. Mohammed Al Qodaimi Prodution unit - head of unit production meters inaccuracies
24/10/2015 Mr. Adnan Al-Sanhani Computer department- engineer consumption data analysis
26/10/2010 Mr. Abdulwahab Al-Fosail The fifth administrative zone- Manager
zoning, meter reading loyalty, NRW assessment
25/10/2010 Eng. Abdallah Al- Motaa Wastewater projects- team leader wastewater coverage in 2008
25/10/2010 Mr. Husain Al-Sharrafi Wastewater projects/ Specialist wastewater coverage
26/10/2010
7/11/2010
28/10/2010 meter reading errors
7/11/2010 meter readers' job stability
Mr. Taha Al-Saiaghi Deputy Manager unauthorized Consumption-Legal and political constraints
Mr. Abdulkareem Nokhra Commercial Department / Specialist
170
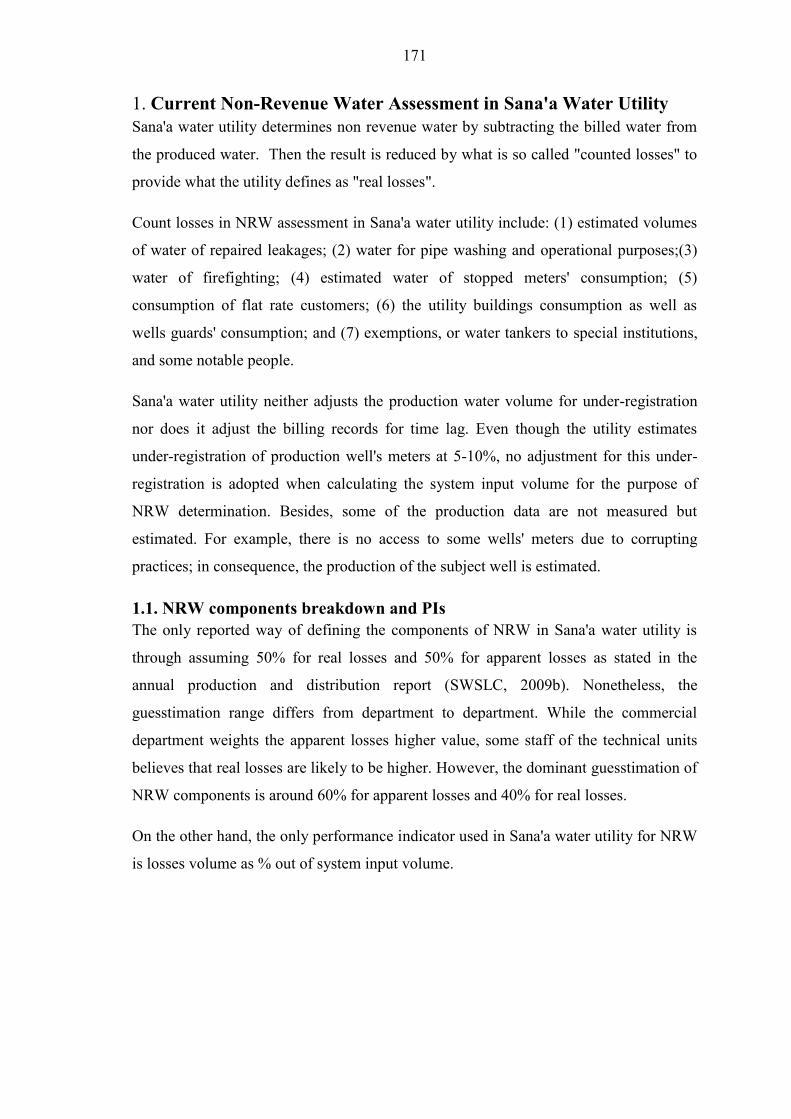
171
1. Current Non-Revenue Water Assessment in Sana'a Water Utility Sana'a water utility determines non revenue water by subtracting the billed water from
the produced water. Then the result is reduced by what is so called "counted losses" to
provide what the utility defines as "real losses".
Count losses in NRW assessment in Sana'a water utility include: (1) estimated volumes
of water of repaired leakages;; (2) water for pipe washing and operational purposes;;(3)
water of firefighting;; (4) estimated water of stopped meters' consumption;; (5)
consumption of flat rate customers;; (6) the utility buildings consumption as well as
wells guards' consumption;; and (7) exemptions, or water tankers to special institutions,
and some notable people.
Sana'a water utility neither adjusts the production water volume for under-registration
nor does it adjust the billing records for time lag. Even though the utility estimates
under-registration of production well's meters at 5-10%, no adjustment for this under-
registration is adopted when calculating the system input volume for the purpose of
NRW determination. Besides, some of the production data are not measured but
estimated. For example, there is no access to some wells' meters due to corrupting
practices;; in consequence, the production of the subject well is estimated.
1.1. NRW components breakdown and PIs The only reported way of defining the components of NRW in Sana'a water utility is
through assuming 50% for real losses and 50% for apparent losses as stated in the
annual production and distribution report (SWSLC, 2009b). Nonetheless, the
guesstimation range differs from department to department. While the commercial
department weights the apparent losses higher value, some staff of the technical units
believes that real losses are likely to be higher. However, the dominant guesstimation of
NRW components is around 60% for apparent losses and 40% for real losses.
On the other hand, the only performance indicator used in Sana'a water utility for NRW
is losses volume as % out of system input volume.

172
2. Current Non- Revenue Water Related Policies
2.1. Real losses
2.1.1. Network conditions Sana'a water network is very old. Since its start in the 1960s, the network expanded
randomly with no master plan nor adequate attention was paid to documenting the
network drawings. The result is lack of knowledge about the network or locations of its
components (e.g. valves). In sequence, the administrative zones are defined
geographically with interlocked networks accompanied with shared water feeding
sources.
Due to dwindling of water resources in the city and intermittent supply in the utility,
operational fatigue in the network accelerate the leakages occurrence and thus
significant increasing of level of leakages was recorded.
2.1.2. Policy in practice for production metering Neither regular maintenance nor replacement policy is adopted for production
meters.
There is only one master meter left working for the west wells' field. Records of
this meter indicate that 7% of the field production is losses in the way from the
well to the reservoir;; most of this amount is estimated to be used in looting the
irrigated lands at the wells' areas.
2.1.3. Reduction Trials
Zoning Many trials have been made to reduce leakages through zoning, but were encountered
with incompleteness of knowledge about locations of valves, and faced by multi-
feeding source of water for each zone or area. Another difficulty encountered is that
water distribution pattern is for different defined areas than the suggested zoning areas.
So far, no trial has succeeded.
173
DCMMS system Data Center Maintenance and Management Software is a system for customer
complaints and reported leakages' maintenance. The system has a "hot line" through
which customers' complaints are recorded systematically and the time period of
repairing the leakages is then counted and documented with all data involved. The
system started recently in 2009 and the average recorded repairing time is 123.7 hours
for 2354 leakages in 2009.
Pressure management There is a recent project for pressure management for hilly area in Nokom in the first
zone. The project was implemented by VAG Armaturen in a public private partnership
project. The project aimed at reducing pressure by installing Pressure Reducers
Valves(PRV);; however, the project has failed because of intermittent supply for both
water and electricity. Even though the project is still recent (2008-2009), it is already
stopped.
2.2. Apparent losses
2.2.1. Customer confidence No meter replacement policy had been adopted by Sana'a water utility for decades till
the 2000s when the under-registration rate could not be ignored any more. When the
utility decided to replace meters, the policy was accompanied by raising the tariffs. The
customer, who used to pay certain range of bill price for years, was surprised with
significant jump in the bill price due to the new dry meter that measure water and air,
whatever amount of air is, and the new high tariff as well. Since then, the customer's
confidence started to decline significantly.
2.2.2. Water allocation and competition Water is allocated at different quantities among customers because of (1) increasing
water scarcity;; (2) water production costs and difficulties;; (3) and the uncertainty of
how much/ how water in the network is being diverted within the distribution areas.
Whereas some customers receive water few hours a week, some receive the service 3-7
days a week. A lot of water insufficiency complaints have been recorded and
competition among customers in many areas to get the water by means of pumps during
water provision times was recognized by the utility. Most of these pumps were installed
in a way that meters do not measure the flow. In other words, pumps were installed with
illegal bypass connections.
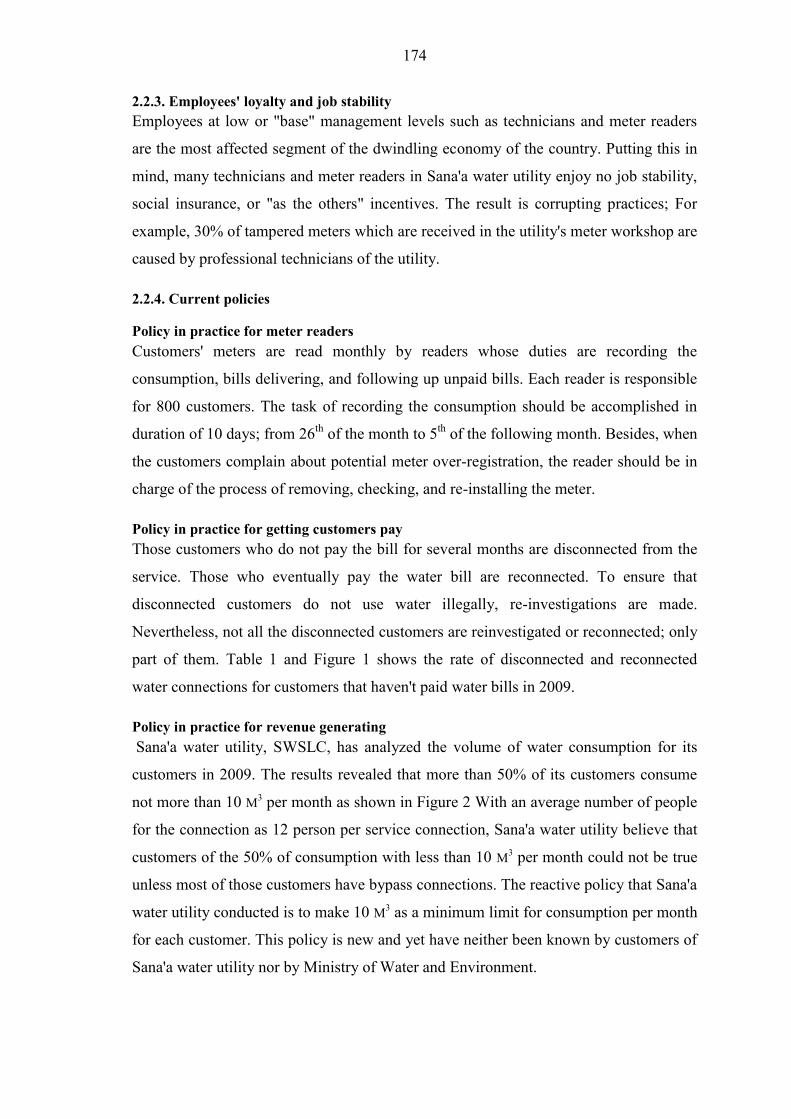
174
2.2.3. Employees' loyalty and job stability Employees at low or "base" management levels such as technicians and meter readers
are the most affected segment of the dwindling economy of the country. Putting this in
mind, many technicians and meter readers in Sana'a water utility enjoy no job stability,
social insurance, or "as the others" incentives. The result is corrupting practices;; For
example, 30% of tampered meters which are received in the utility's meter workshop are
caused by professional technicians of the utility.
2.2.4. Current policies
Policy in practice for meter readers Customers' meters are read monthly by readers whose duties are recording the
consumption, bills delivering, and following up unpaid bills. Each reader is responsible
for 800 customers. The task of recording the consumption should be accomplished in
duration of 10 days;; from 26th of the month to 5th of the following month. Besides, when
the customers complain about potential meter over-registration, the reader should be in
charge of the process of removing, checking, and re-installing the meter.
Policy in practice for getting customers pay Those customers who do not pay the bill for several months are disconnected from the
service. Those who eventually pay the water bill are reconnected. To ensure that
disconnected customers do not use water illegally, re-investigations are made.
Nevertheless, not all the disconnected customers are reinvestigated or reconnected;; only
part of them. Table 1 and Figure 1 shows the rate of disconnected and reconnected
water connections for customers that haven't paid water bills in 2009.
Policy in practice for revenue generating Sana'a water utility, SWSLC, has analyzed the volume of water consumption for its
customers in 2009. The results revealed that more than 50% of its customers consume
not more than 10 M3 per month as shown in Figure 2 With an average number of people
for the connection as 12 person per service connection, Sana'a water utility believe that
customers of the 50% of consumption with less than 10 M3 per month could not be true
unless most of those customers have bypass connections. The reactive policy that Sana'a
water utility conducted is to make 10 M3 as a minimum limit for consumption per month
for each customer. This policy is new and yet have neither been known by customers of
Sana'a water utility nor by Ministry of Water and Environment.

175
18
3
16
0.6002468101214161820
Nr. Disconnected
Thousands Nr. Disconnected
Nr. Re-connected
Difference
Nr. Detected illegal
Table.1
Number of Disconnected - Re-connected and Detected Illegal Connections Source of data: SWSLC, 2005-2009
Year Nr. Disconnected
connections
Nr. Re-connected
connections Difference
Nr. Detected illegal
connections
2005 21928 3248 18680 793
2006 13646 2435 11211 657
2007 15901 3173 12728 528
2008 18192 2275 15917 438
2009 22559 2393 20166 568
Ave 18445 2705 15740 597
Figure.1: Average number of disconnected - re-connected and detected illegal connections in Sana'a water utility for the years 2005-2009
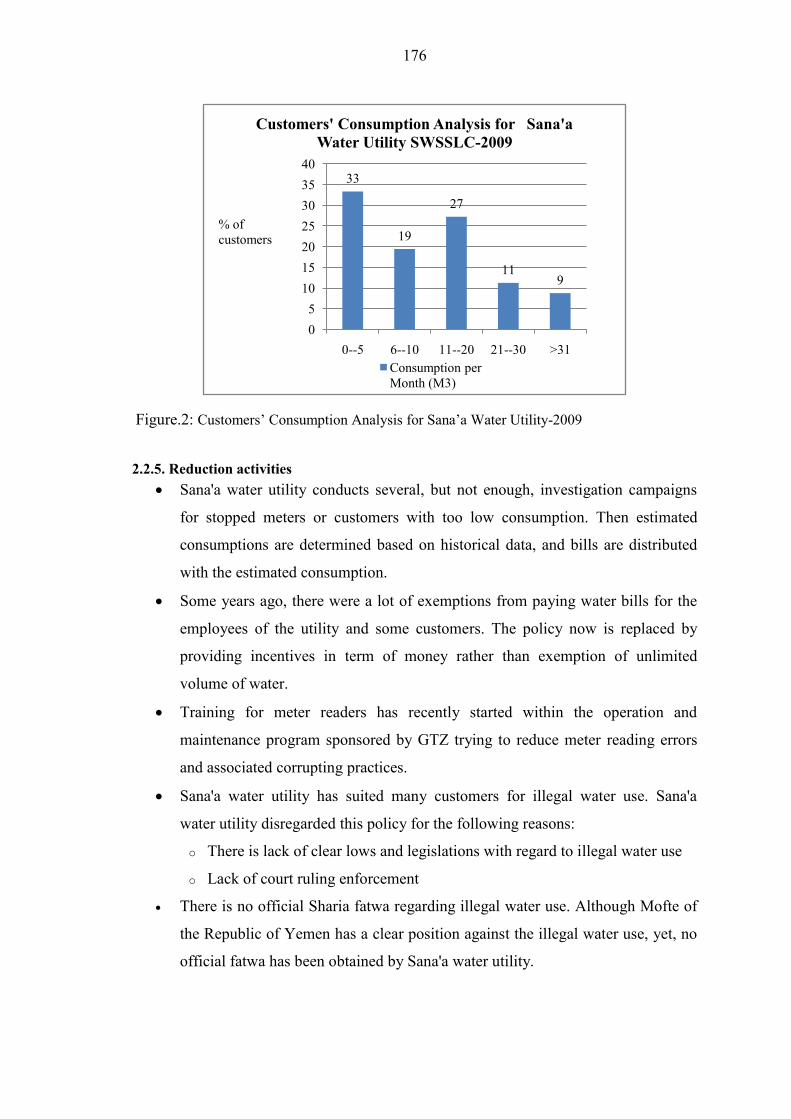
176
33
19
27
119
0510152025303540
0--5 6--10 11--20 21--30 >31
Customers' Consumption Analysis for Sana'a Water Utility SWSSLC-2009
Consumption per Month (M3)
% of customers
2.2.5. Reduction activities Sana'a water utility conducts several, but not enough, investigation campaigns
for stopped meters or customers with too low consumption. Then estimated
consumptions are determined based on historical data, and bills are distributed
with the estimated consumption.
Some years ago, there were a lot of exemptions from paying water bills for the
employees of the utility and some customers. The policy now is replaced by
providing incentives in term of money rather than exemption of unlimited
volume of water.
Training for meter readers has recently started within the operation and
maintenance program sponsored by GTZ trying to reduce meter reading errors
and associated corrupting practices.
Sana'a water utility has suited many customers for illegal water use. Sana'a
water utility disregarded this policy for the following reasons:
o There is lack of clear lows and legislations with regard to illegal water use
o Lack of court ruling enforcement
There is no official Sharia fatwa regarding illegal water use. Although Mofte of
the Republic of Yemen has a clear position against the illegal water use, yet, no
official fatwa has been obtained by Sana'a water utility.
Figure.2: onsumption Analysis -2009

177
Appendix 4A: Social questionnaire for defining reasons of illegal water
use in Sana'a water distribution system-Arabic Version
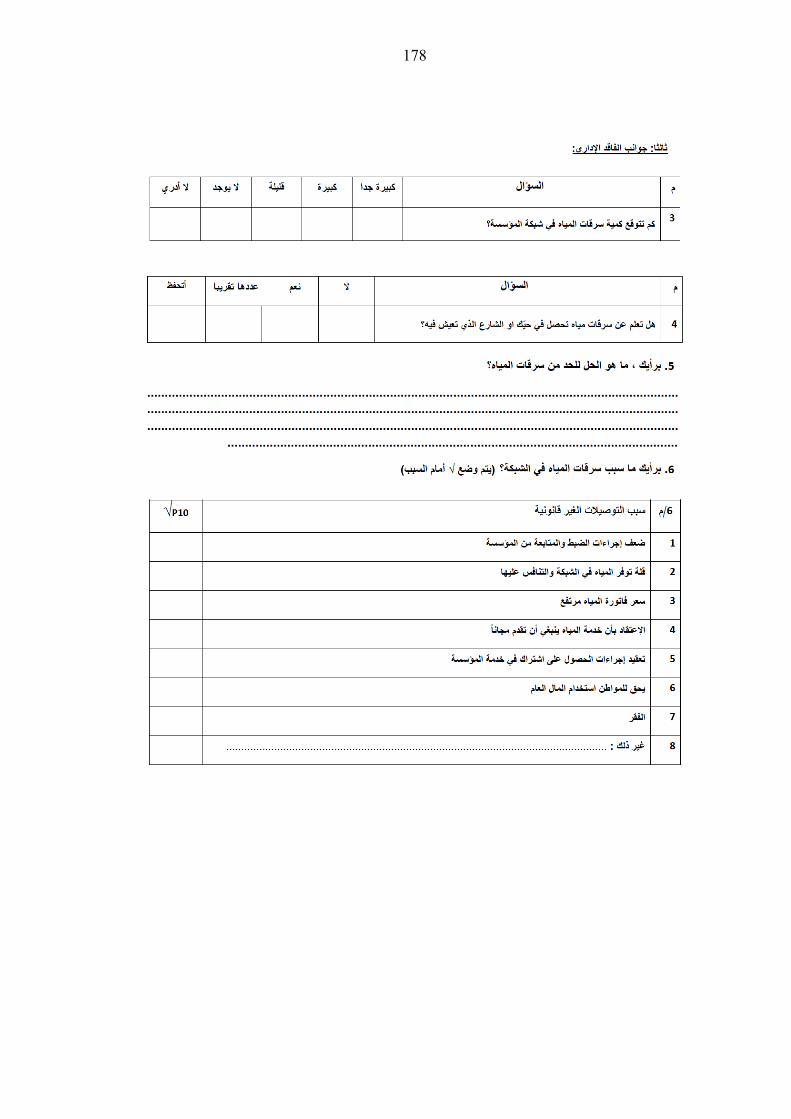
178
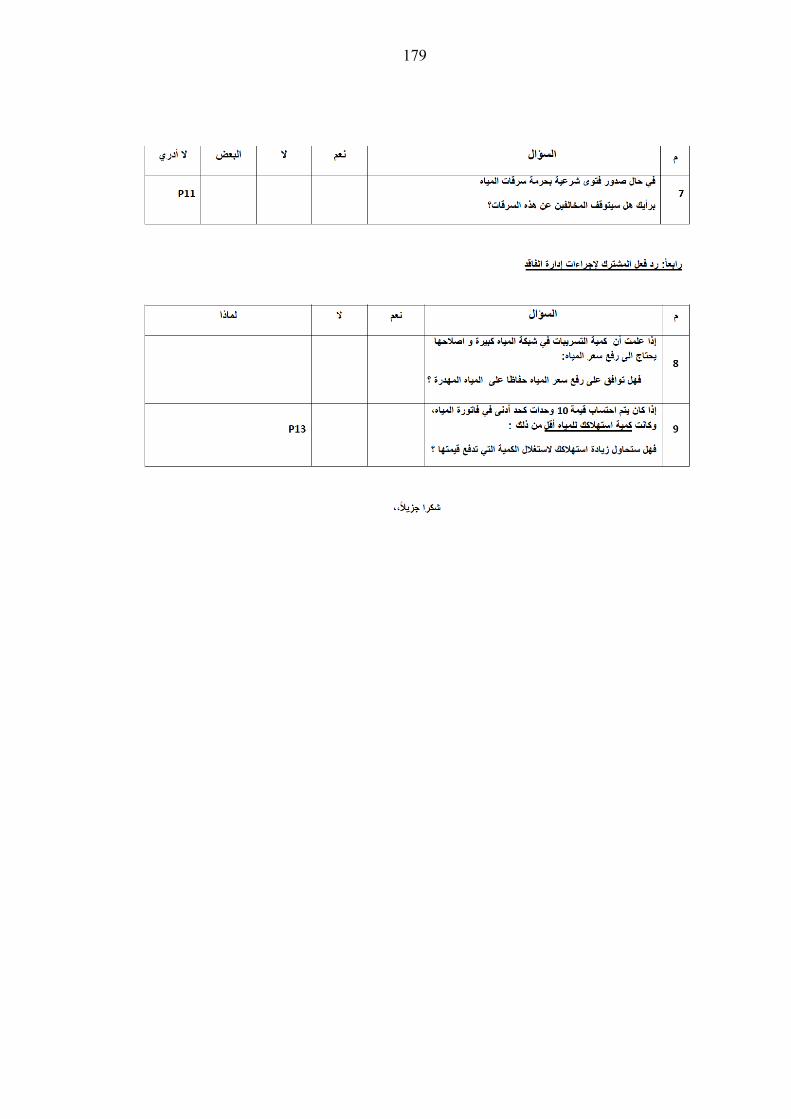
179

180
Appendix 4B: Social questionnaire for defining reasons of illegal water
use in Sana'a water distribution system-Translation of questions

181
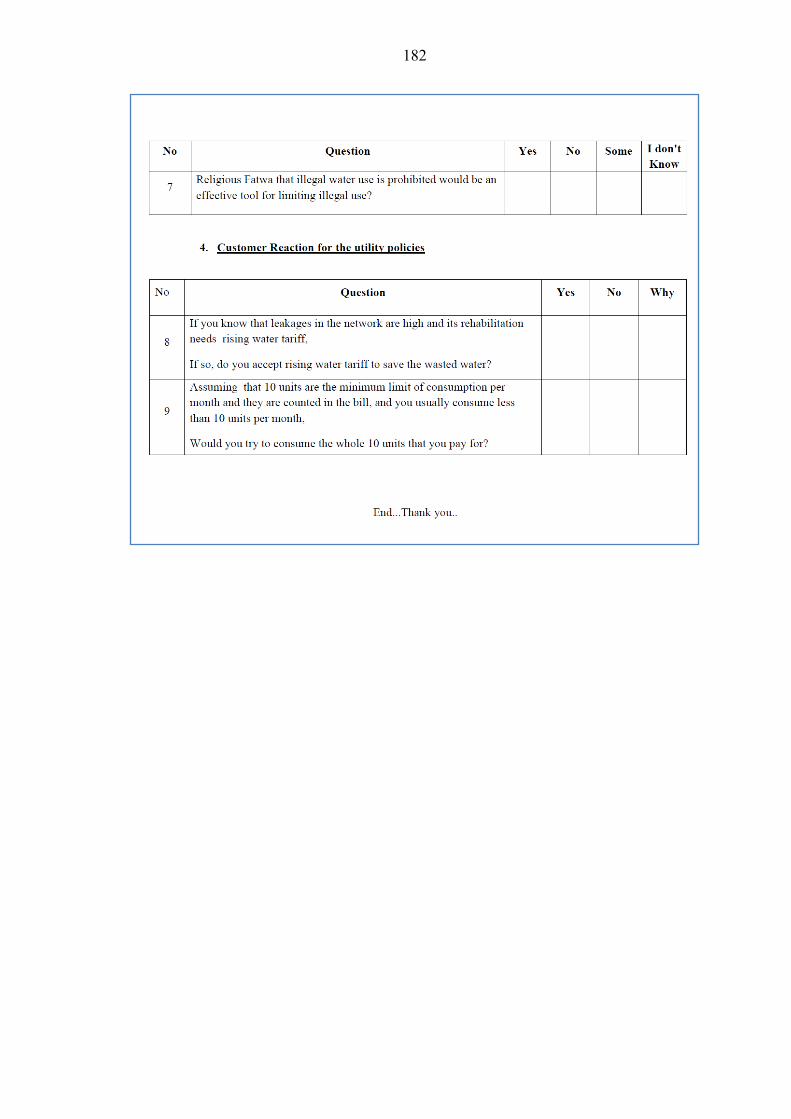
182
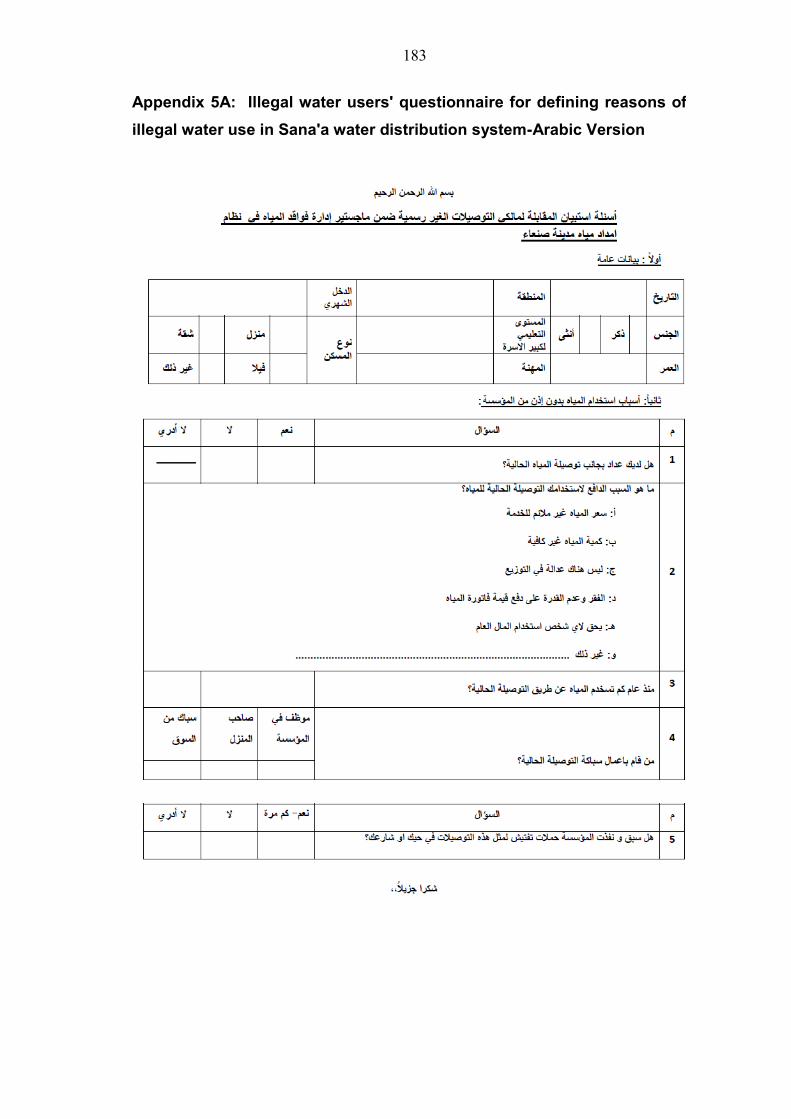
183
Appendix 5A: Illegal water users' questionnaire for defining reasons of illegal water use in Sana'a water distribution system-Arabic Version
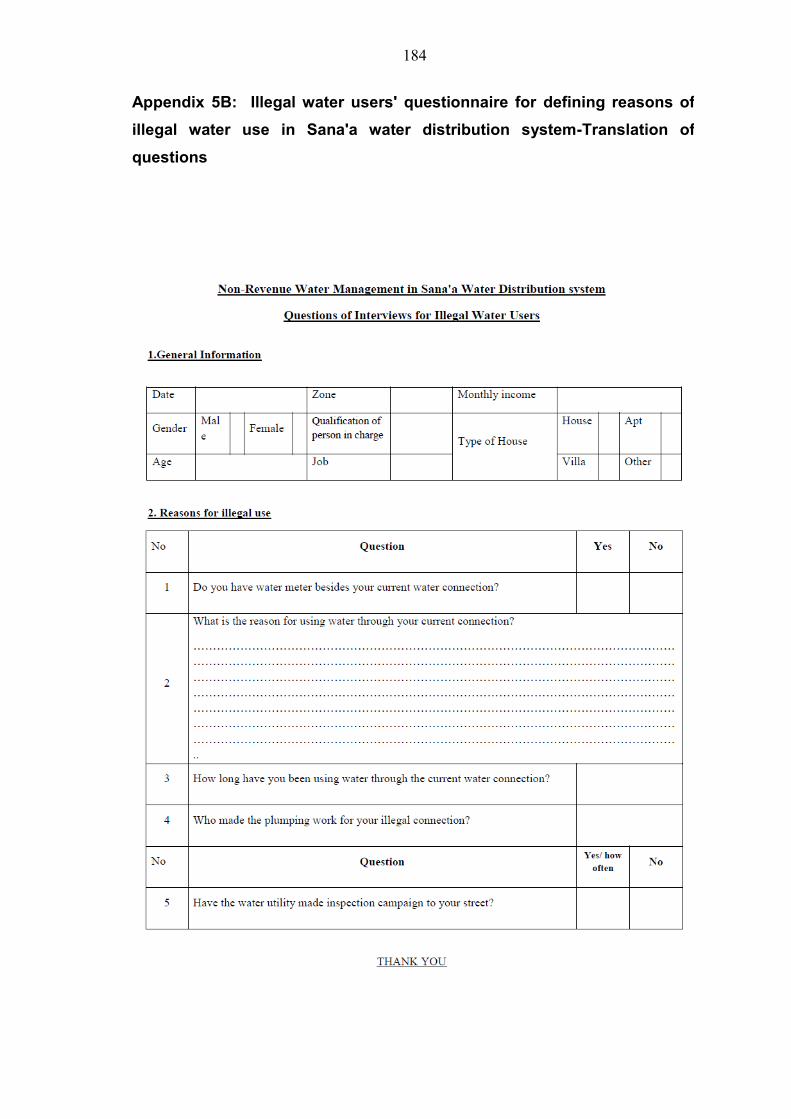
184
Appendix 5B: Illegal water users' questionnaire for defining reasons of illegal water use in Sana'a water distribution system-Translation of
questions

185
No Zone Nr. (1)
Square code (2)
Number of customers (3)
Consumption of May 2010 (4)
Consumption of June 2010;; By Audits (5)
Difference of Consumption (6)
Difference per customer (7)
Average of column7 (8)
Variance (8) with (7)
statistical difference of consumption= (8) * (3)
Reading Errors (10-6)
Type of Errors
1 5 192 1,118 15482 39228 23,746 21.240 -0.239154 230.671 -267 -24,013 losses
2 5 191 1,101 16555 26348 9,793 8.895 -0.239154 41.713 -263 -10,056 losses
3 5 201 823 13576 13767 191 0.232 -0.239154 0.111 -197
4 5 271 1,110 16217 16401 184 0.166 -0.239154 0.082 -265
5 5 306 25 2168 2275 107 4.280 -0.239154 10.211 -6 -113 losses
6 5 273 1,080 10650 10650 0 0.000 -0.239154 0.029 -258
7 5 281 15 177 142 -35 -2.333 -0.239154 2.193 -4
8 5 251 1,011 13922 13753 -169 -0.167 -0.239154 0.003 -242
9 5 272 1,330 21409 21185 -224 -0.168 -0.239154 0.003 -318
10 5 91 1,019 14141 13901 -240 -0.236 -0.239154 0.000 -244
11 5 215 459 8705 8356 -349 -0.760 -0.239154 0.136 -110
12 5 93 348 4288 3938 -350 -1.006 -0.239154 0.294 -83
13 5 94 191 2506 2015 -491 -2.571 -0.239154 2.718 -46
14 5 175 696 7769 7246 -523 -0.751 -0.239154 0.131 -166
15 5 213 1,356 20233 19630 -603 -0.445 -0.239154 0.021 -324
16 5 253 689 12685 12071 -614 -0.891 -0.239154 0.213 -165
17 5 171 865 10884 10188 -696 -0.805 -0.239154 0.160 -207
18 5 211 985 15404 14577 -827 -0.840 -0.239154 0.180 -236
19 5 173 868 10402 9438 -964 -1.111 -0.239154 0.380 -208
20 5 252 706 9405 8333 -1,072 -1.518 -0.239154 0.818 -169
21 5 172 1,065 15175 13722 -1,453 -1.364 -0.239154 0.633 -255
22 5 92 1,351 22434 20645 -1,789 -1.324 -0.239154 0.589 -323
23 5 174 943 16732 14887 -1,845 -1.957 -0.239154 1.475 -226
24 5 212 1,290 13055 10640 -2,415 -1.872 -0.239154 1.333 -309
25 5 305 202 20820 17801 -3,019 -14.946 -0.239154 108.139 -48 2,971 Profits
26 5 214 1,420 19674 16421 -3,253 -2.291 -0.239154 2.105 -340
27 5 202 978 15294 11466 -3,828 -3.914 -0.239154 6.753 -234 3,594 Profits
Total 23,044 349762 359024
Total 23,044 349762 359024 1,296,171 15.22560873 699524
Data were statistically analyzed using rank-test and variance comparison
Appendix 6: Estimating Data Handling Errors in SWSLC by Auditors from the headquarters to the Fifth Zone and
Statistical Analysis
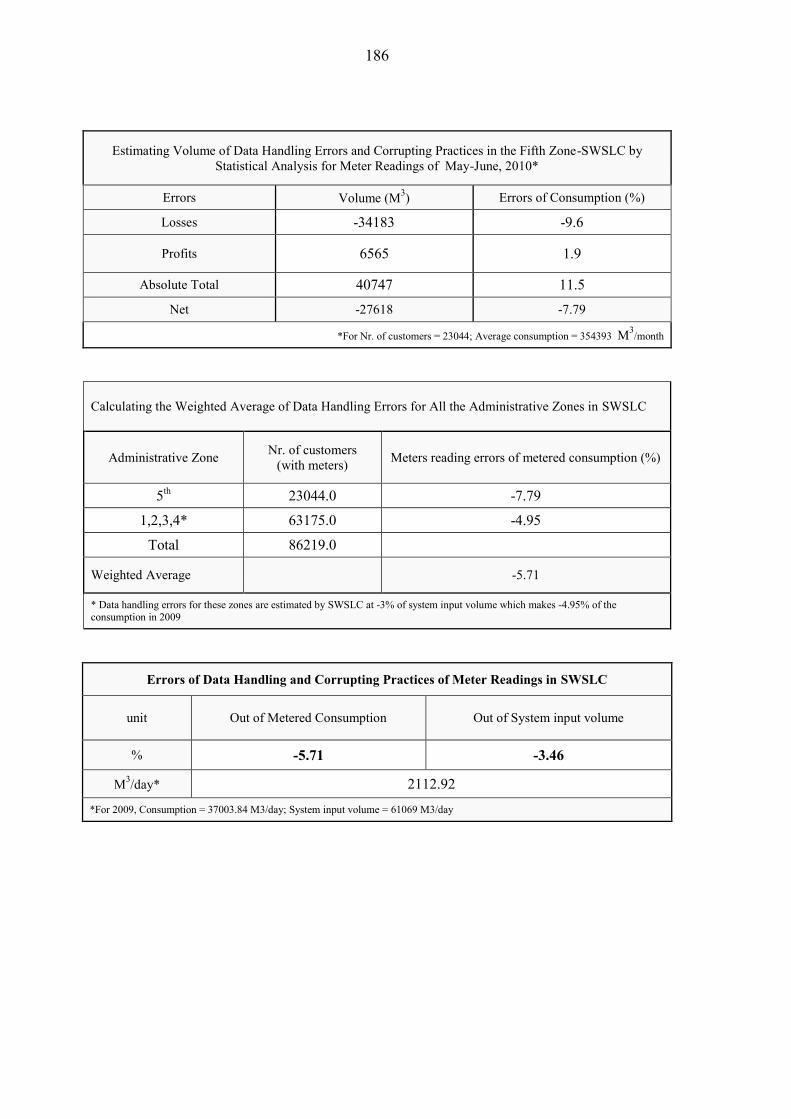
186
Estimating Volume of Data Handling Errors and Corrupting Practices in the Fifth Zone-SWSLC by Statistical Analysis for Meter Readings of May-June, 2010*
Errors Volume (M3) Errors of Consumption (%)
Losses -34183 -9.6
Profits 6565 1.9
Absolute Total 40747 11.5
Net -27618 -7.79
*For Nr. of customers = 23044;; Average consumption = 354393 M3/month
Calculating the Weighted Average of Data Handling Errors for All the Administrative Zones in SWSLC
Administrative Zone Nr. of customers (with meters) Meters reading errors of metered consumption (%)
5th 23044.0 -7.79
1,2,3,4* 63175.0 -4.95
Total 86219.0 Weighted Average -5.71
* Data handling errors for these zones are estimated by SWSLC at -3% of system input volume which makes -4.95% of the consumption in 2009
Errors of Data Handling and Corrupting Practices of Meter Readings in SWSLC
unit Out of Metered Consumption Out of System input volume
% -5.71 -3.46
M3/day* 2112.92
*For 2009, Consumption = 37003.84 M3/day;; System input volume = 61069 M3/day
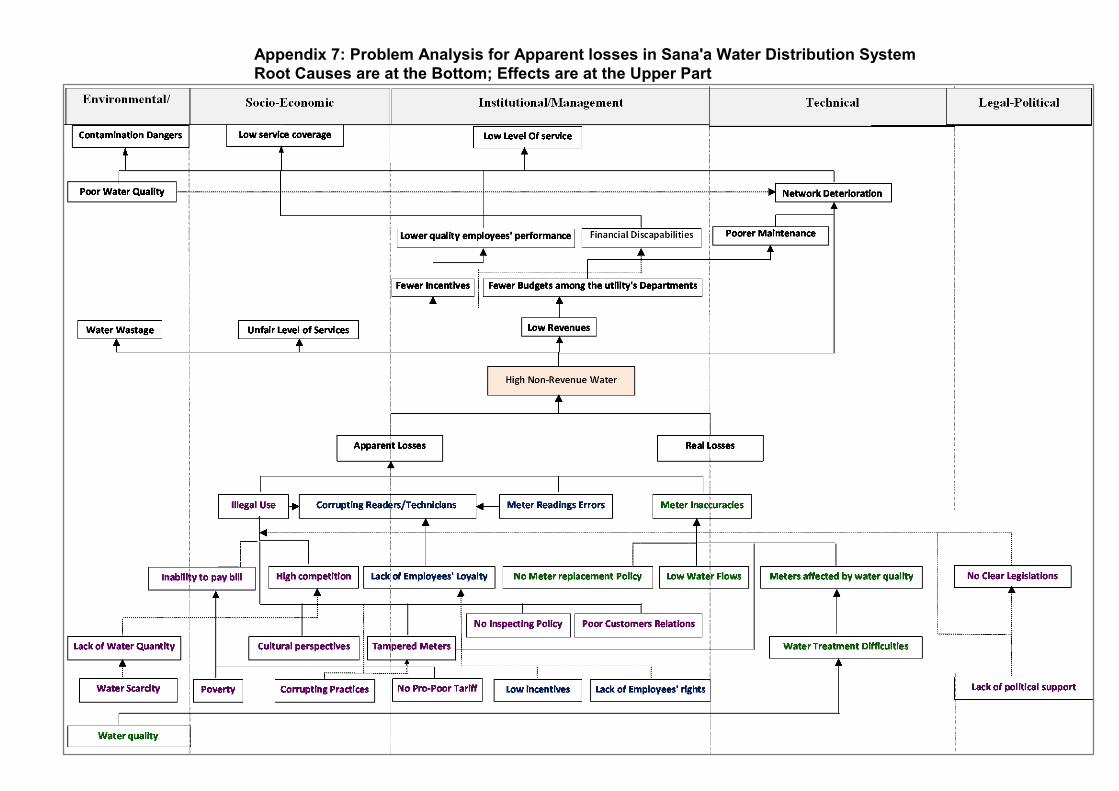
187
t Appendix 7: Problem Analysis for Apparent losses in Sana'a Water Distribution System Root Causes are at the Bottom;; Effects are at the Upper Part

188
18%
9% 28%
18%18%9%
Reason of Illegal Water UseIll-treatment and proceduresof SWSSLCNo law inforcment
poverty
lack of water
Water meter records a lot of air in the network's pipes High water tariff
63
3644
27
1234
Age of person of Charge of the Family
11
17
107
1234
Nr. of Family Members
467
935
210234
1234
Income ($/Month)
Basic Education25%
High school50%
less than Basic
Education25%
Education Level of Person in Charge of the Family
100%
0%
Type of Illegal Connection
Connection with water meter + Bypass connection
Illegal connectionYes: Many Times100%
No0%
Has SWSSLC implement search campaigns for such connections in your neighborhood or your street?
Yes: Many Times
No
50%
50%
who implement the plumbing work?
The Plumber of SWSSLC
House owner
Appendix 8: Sample characteristics and results of four recovered
samples of Illegal users' questionnaire

189
Appendix 9A: NRW awareness questionnaire for measuring NRW awareness in SWSLC- Arabic Version

190

191
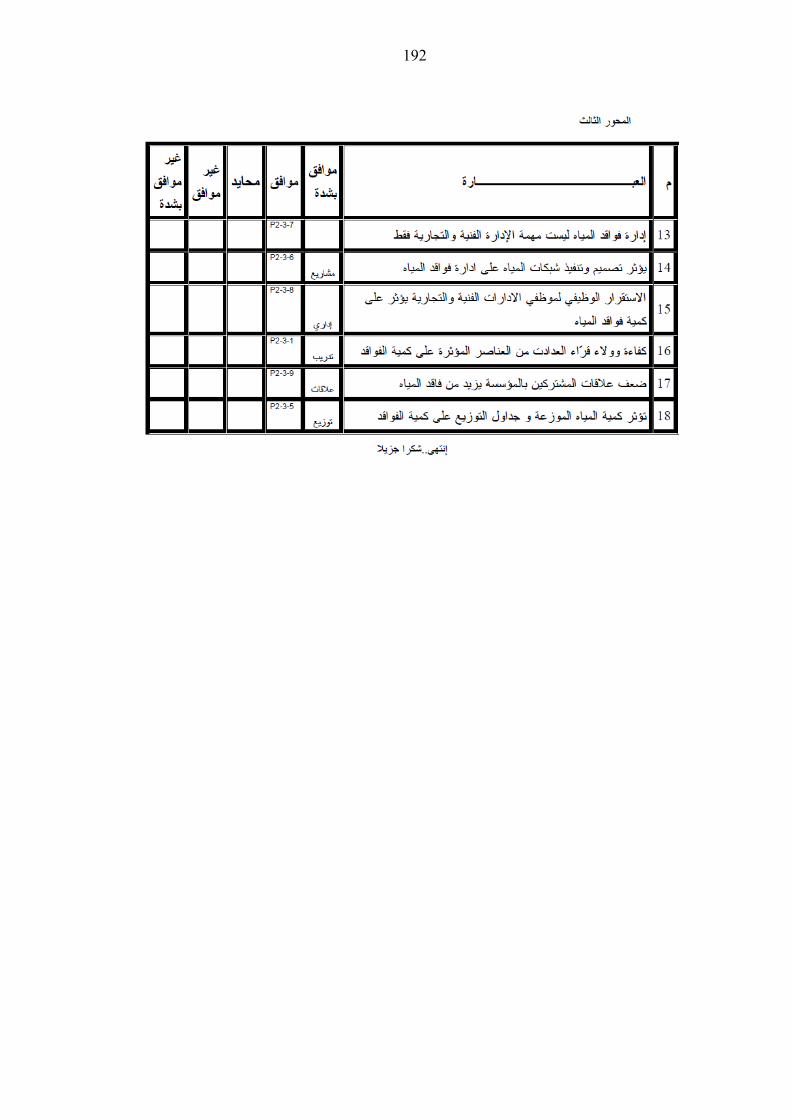
192
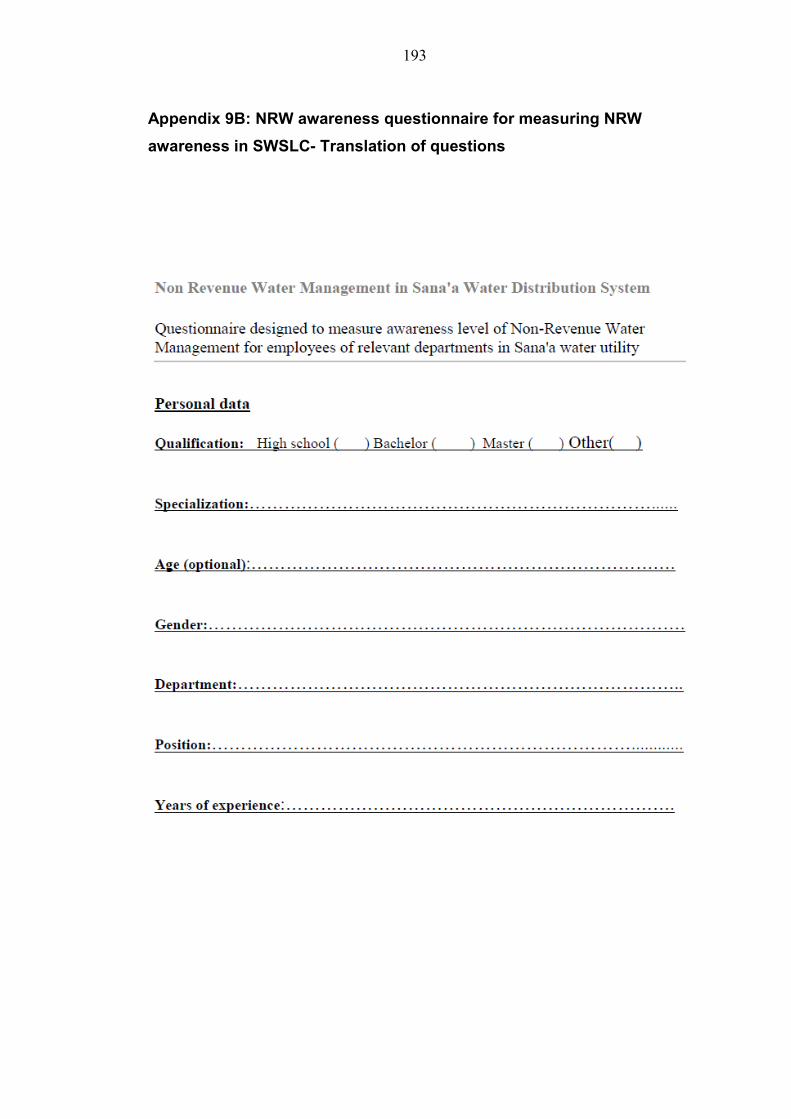
193
Appendix 9B: NRW awareness questionnaire for measuring NRW awareness in SWSLC- Translation of questions

194

195
Annex 1: DECLARATION
Name Taha AL-Washali
Matr. No.:
I, Taha AL-Washali, declare hereby on oath that this Master Thesis in hand has been
made independently and without the help of any other than acknowledged.
The thoughts taken directly or indirectly from external sources are made recognisable as
such. This thesis was not presented to any other examination authority either in the
same or similar form and till now it has not been published.
Cologne, Signature
December 23, 2010
I do further agree to a later publication of this Master Thesis, may it be in parts or
entirely within the ITT publications or within the scope of the IT
Signature
196
Annex 2: Abstract in Arabic
38.7526.5711.670.51
50
5


![Revenue [Non] Equivalence in Field Experiments on eBay](https://static.fdocuments.in/doc/165x107/586e03911a28ab3a0c8bb46d/revenue-non-equivalence-in-field-experiments-on-ebay.jpg)