Non-General Fund Revenue - Montana...
79
Revenue Estimates as adopted by the Revenue and Taxation Committee 199 November 17, 2000 Non-General Fund Revenue Arts Trust Interest Capital Land Grant Interest & Income Deaf & Blind Trust Interest & Income Diesel Tax Federal Forest Receipts Gasoline Tax GVW and Other Fees Lodging Facility Use Tax Parks Trust Interest Pine Hills Interest & Income Property Tax 6 Mill Property Tax 9 Mill Resource Indemnity Tax Resource Indemnity Trust Interest Treasure State Endowment Trust Interest Vehicle Tax
Transcript of Non-General Fund Revenue - Montana...

Revenue Estimates as adopted by the Revenue and Taxation Committee 199 November 17, 2000
Non-General Fund Revenue
Arts Trust Interest Capital Land Grant Interest & Income Deaf & Blind Trust Interest & Income Diesel Tax Federal Forest Receipts Gasoline Tax GVW and Other Fees Lodging Facility Use Tax
Parks Trust Interest Pine Hills Interest & Income Property Tax 6 Mill Property Tax 9 Mill Resource Indemnity Tax Resource Indemnity Trust Interest Treasure State Endowment Trust Interest Vehicle Tax

Revenue Estimates as adopted by the Revenue and Taxation Committee 200 November 17, 2000
Legislative Fiscal Division Revenue Estimate Profile
Arts Trust Interest
Revenue Estimates as adopted by the Revenue and Taxation Committee 201 November 17, 2000
Arts Trust Interest
Revenue Description: Beginning in fiscal 1976, a portion of coal severance tax revenue was deposited into the Parks Acquisition and Arts Protection trust fund. The 1991 legislature split the principal of this trust into two separate trusts, the Parks Acquisition trust and the Arts Protection trust (arts trust), with coal severance taxes allocated to each one. The 1997 legislature appropriated $3.9 million from the Arts Trust fund for the immediate purchase of Virginia and Nevada City properties. This action resulted in a loss of trust interest revenue that otherwise would be used to fund cultural and aesthetic (C&A) projects in the state during the 1999 biennium. Thus, beginning July 1, 1997, and ending June 30, 1999, 0.87 percent in coal severance tax revenue was allocated to an account in the state special revenue fund to compensate for the lost interest earnings and the previous 0.63 percent distribution of coal severance tax to the arts trust was eliminated. Beginning July 1, 1999, the amount of 0.63 percent is once again statutorily allocated to the arts trust, the interest from which is to be used for the purpose of protection of works of art in the capitol and for other cultural and aesthetic projects.
Applicable Tax Rate(s): N/A
Distribution: All income from the trust must be appropriated for protection of works of art in the state capitol and for other cultural and aesthetic projects.
Collection Frequency: Monthly
Applicable Assumptions and/or Relevant Indicators: Gains and Losses Income Trust Pool Amortizations Trust Pool Accretions Board of Investments Fees Secondary Lending Income Long Term Interest Rates Short Term Interest Rates Coal Severance Tax Collections
Coal severance tax collections are estimated via the coal severance tax methodology.
Data Source(s): Board of Investments, SBAS, SABHRS, Wall Street Journal , Wharton Econometrics Forecasting Associates (WEFA)
Contacts:
Statute: Title 15, Chapter 35, MCA
% of Total FY 2000 General Fund Revenue: N/A
Revenue Estimate Methodology: The LFD uses a number of analytical techniques to develop relevant assumptions for this source of revenue. Historical data trends, economic conditions, input from industry experts, company surveys, and etc., are examples of information used to formulate these assumptions. The techniques used to develop these assumptions may vary from biennium to biennium and are highly dependent on availability of information, professional intuition/judgment, and a detailed analysis of the revenue source. The applicable methodology (formulas) and assumptions used by the LFD to develop a revenue estimate for this source are provided in a subsequent section of this document. The following summarizes the LFD process used to develop the revenue estimate.
The methodology used to forecast arts trust interest earnings is a multi-step process. In order to estimate total investment earnings for the trust, income must be calculated on three separate components: 1) arts trust pool interest; 2) interest on new deposits; and 3) short term interest earnings.
Legislative Fiscal Division Revenue Estimate Profile
Arts Trust Interest
Revenue Estimates as adopted by the Revenue and Taxation Committee 202 November 17, 2000
As of October 1, 1995, all fixed-income investments held by the state’s major trust funds were transferred to a newly-created Trust Fund Bond Pool (TFBP). Thus, the first step involves determining coupon interest income for the entire TFBP, by multiplying the par value of the portfolio times the coupon interest rate. Total income for the TFBP is then calculated by adding the TFBP coupon interest income with other income variables, including: pool short term interest, gains and losses income, Board of Investments fees, TFBP amortizations and accretions, and secondary lending income. Once total TFBP income is estimated, the portion of interest income attributable to the arts trust fund is calculated based on the number of arts trust fund shares relative to the total number of TFBP shares. Investment income on new deposits is calculated by multiplying the forecast amount for quarterly coal severance tax collections by the appropriate interest rate. The investable balance used varies in accordance with the timing of when new monies become available. For example, coal severance tax collections due for the first quarter of the biennium will earn interest at the short term (STIP) rate for one month, after which they will earn interest at the long term rate for the remainder of the biennium. (Coal severance tax collections are forecast as part of the coal severance tax methodology.) Finally, because a portion of the trust is invested on a short term basis, an assumption is made for the balance of trust funds in STIP. This balance is then multiplied by the short term interest rate to determine short term interest income. Once investment income has been calculated for these three components, the sum of these comprises total arts trust investment income.
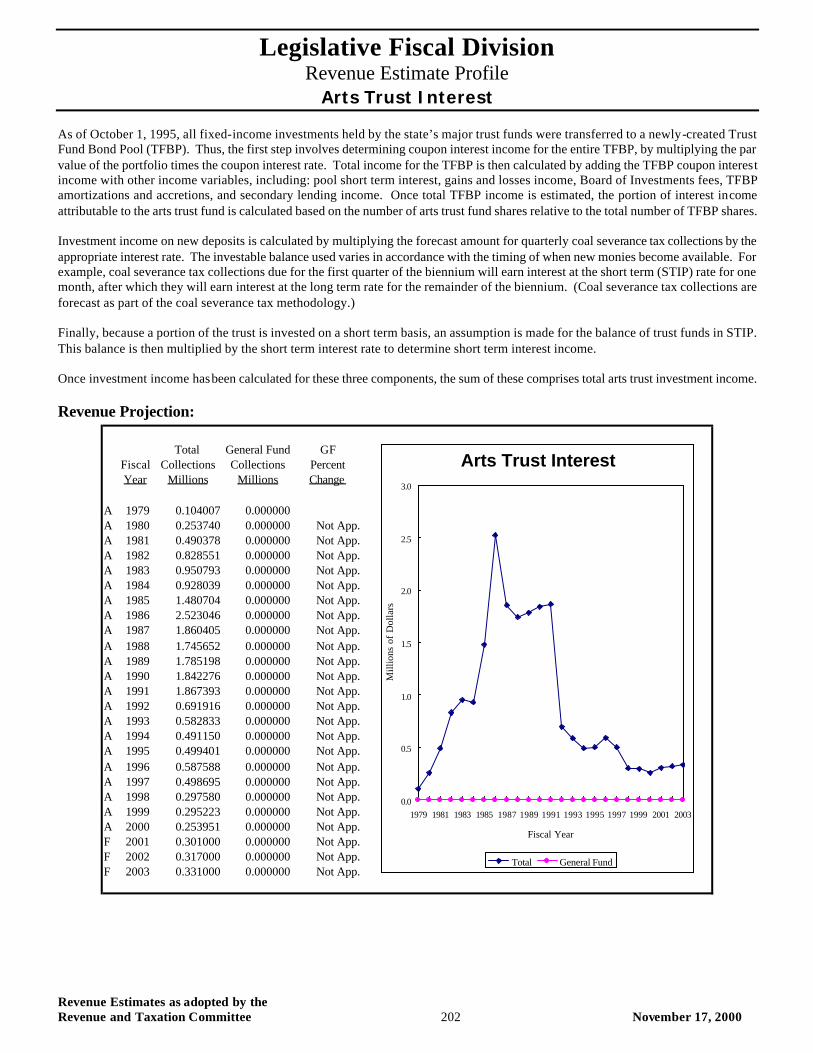
Revenue Projection:
Total General Fund GFFiscal Collections Collections PercentYear Millions Millions Change
A 1979 0.104007 0.000000A 1980 0.253740 0.000000 Not App.A 1981 0.490378 0.000000 Not App.A 1982 0.828551 0.000000 Not App.A 1983 0.950793 0.000000 Not App.A 1984 0.928039 0.000000 Not App.A 1985 1.480704 0.000000 Not App.A 1986 2.523046 0.000000 Not App.A 1987 1.860405 0.000000 Not App.A 1988 1.745652 0.000000 Not App.A 1989 1.785198 0.000000 Not App.A 1990 1.842276 0.000000 Not App.A 1991 1.867393 0.000000 Not App.A 1992 0.691916 0.000000 Not App.A 1993 0.582833 0.000000 Not App.A 1994 0.491150 0.000000 Not App.A 1995 0.499401 0.000000 Not App.A 1996 0.587588 0.000000 Not App.A 1997 0.498695 0.000000 Not App.A 1998 0.297580 0.000000 Not App.A 1999 0.295223 0.000000 Not App.A 2000 0.253951 0.000000 Not App.F 2001 0.301000 0.000000 Not App.F 2002 0.317000 0.000000 Not App.F 2003 0.331000 0.000000 Not App.
Arts Trust Interest
0.0
0.5
1.0
1.5
2.0
2.5
3.0
1979 1981 1983 1985 1987 1989 1991 1993 1995 1997 1999 2001 2003
Fiscal Year
Mill
ions
of
Dol
lars
Total General Fund

Legislative Fiscal Division Revenue Estimate Profile
Arts Trust Interest
Revenue Estimates as adopted by the Revenue and Taxation Committee 203 November 17, 2000
Forecast Methodology TPCI t = SUM(i=1...n)(PAR t * CR t)i ---where TPCI = Trust Pool Coupon Interest PAR = Security Par Value CR = Coupon Interest Rate t = Fiscal Year i = Security in the Pool
TTPI t = TPCI t + PSTI t + GLI t + BOIF t + AMT t + SECL t + ACCR t ---where TTPI = Total Trust Pool Income TPCI = Trust Pool Coupon Interest PSTI = Pool Short Term Interest GLI = Gains and Losses Income BOIF = Board of Investments Fees AMT = Trust Pool Amortizations SECL = Secondary Lending Income ACCR = Trust Pool Accretions t = Fiscal Year ATPI t = (ATS t / TPS t ) * TTPI t ---where ATPI = Arts Trust Pool Interest ATS = Arts Trust Shares TPS = Total Bond Pool Shares TTPI = Total Trust Pool Income t = Fiscal Year NDI t = (CST t / 4) * (LTIR t / 12) * 22 + (CST t / 4) * (STIR t / 12) * 4 + CST t-1 * LTIR t -1 ---where NDI = New Deposits Interest CST = Coal Severance Tax Allocation LTIR = Long Term Interest Rate STIR = Short Term Interest Rate t = Fiscal Year NPSTI t = STIB t * STIR t ---where NPSTI = Non Pool STIP Investment Interest STIB = STIP Investment Balance STIR = STIP Interest Rate t = Fiscal Year
Legislative Fiscal Division Revenue Estimate Profile
Arts Trust Interest
Revenue Estimates as adopted by the Revenue and Taxation Committee 204 November 17, 2000
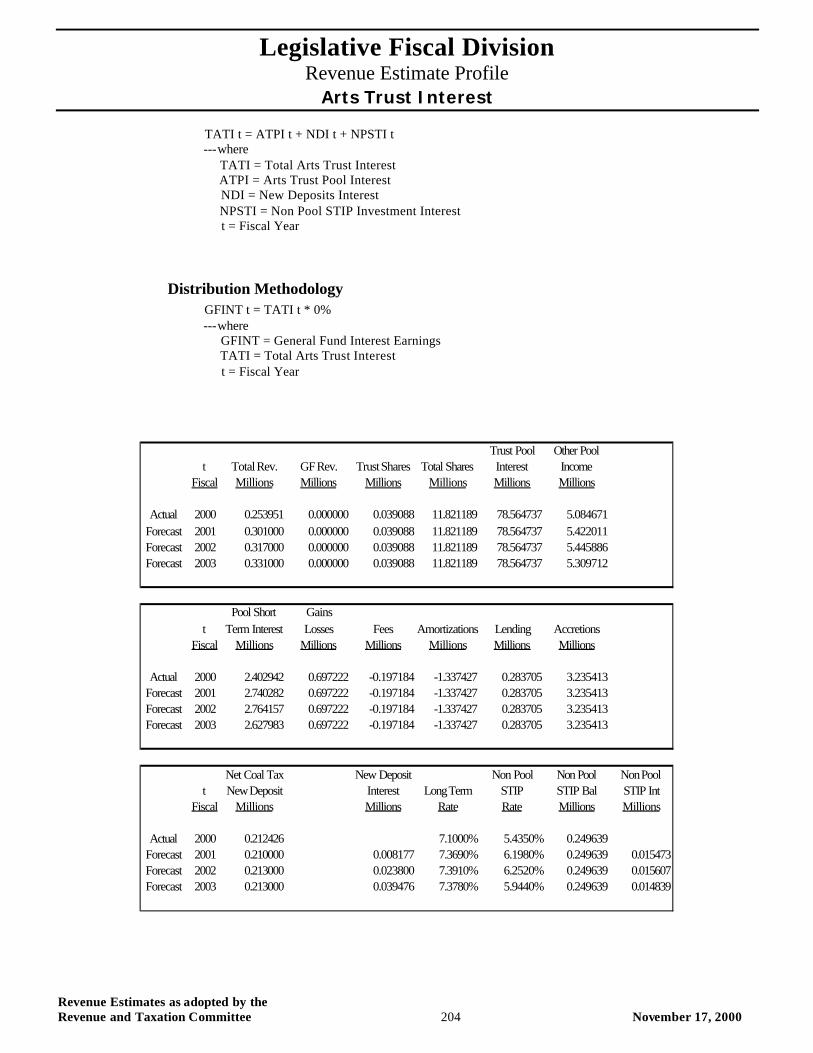
TATI t = ATPI t + NDI t + NPSTI t ---where TATI = Total Arts Trust Interest ATPI = Arts Trust Pool Interest NDI = New Deposits Interest NPSTI = Non Pool STIP Investment Interest t = Fiscal Year
Distribution Methodology GFINT t = TATI t * 0% ---where GFINT = General Fund Interest Earnings TATI = Total Arts Trust Interest t = Fiscal Year
Trust Pool Other Poolt Total Rev. GF Rev. Trust Shares Total Shares Interest Income
Fiscal Millions Millions Millions Millions Millions Millions
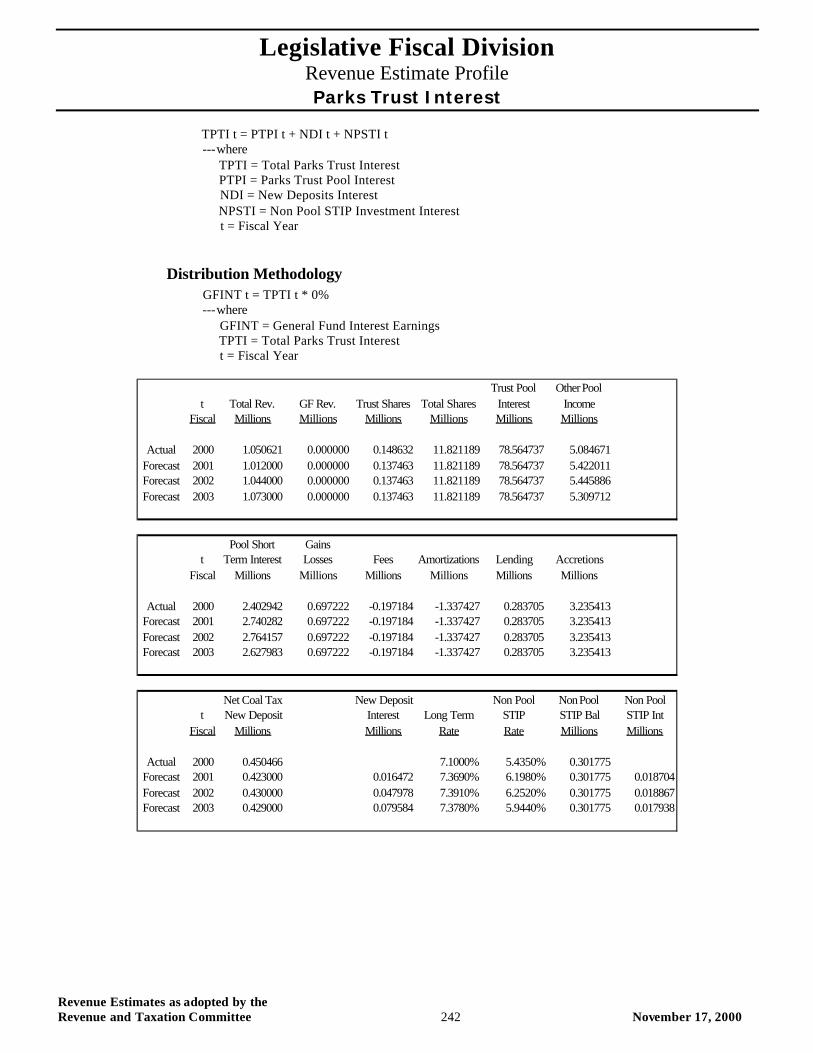
Actual 2000 0.253951 0.000000 0.039088 11.821189 78.564737 5.084671Forecast 2001 0.301000 0.000000 0.039088 11.821189 78.564737 5.422011Forecast 2002 0.317000 0.000000 0.039088 11.821189 78.564737 5.445886Forecast 2003 0.331000 0.000000 0.039088 11.821189 78.564737 5.309712
Pool Short Gainst Term Interest Losses Fees Amortizations Lending Accretions
Fiscal Millions Millions Millions Millions Millions Millions
Actual 2000 2.402942 0.697222 -0.197184 -1.337427 0.283705 3.235413Forecast 2001 2.740282 0.697222 -0.197184 -1.337427 0.283705 3.235413Forecast 2002 2.764157 0.697222 -0.197184 -1.337427 0.283705 3.235413Forecast 2003 2.627983 0.697222 -0.197184 -1.337427 0.283705 3.235413
Net Coal Tax New Deposit Non Pool Non Pool Non Poolt New Deposit Interest Long Term STIP STIP Bal STIP Int
Fiscal Millions Millions Rate Rate Millions Millions
Actual 2000 0.212426 7.1000% 5.4350% 0.249639Forecast 2001 0.210000 0.008177 7.3690% 6.1980% 0.249639 0.015473Forecast 2002 0.213000 0.023800 7.3910% 6.2520% 0.249639 0.015607Forecast 2003 0.213000 0.039476 7.3780% 5.9440% 0.249639 0.014839
Legislative Fiscal Division Revenue Estimate Profile
Capital Land Grant Interest and Income
Revenue Estimates as adopted by the Revenue and Taxation Committee 205 November 17, 2000
Capital Land Grant Interest and Income
Revenue Description: Lands granted by the federal government to the state generate income from a variety of sources. Section 12 of the Enabling Act requires that income generated on certain sections of federally granted land be used for public buildings at the state capital for construction, repair, renovation, and other permanent improvements of state buildings. Capital land grant funds can also be used for the acquisition of land for such buildings, as well as the payment of principal and interest on bonds issued for any of these purposes.
Non-permanent sources of revenue generated from capital land grant lands include: grazing fees, agricultural fees, miscellaneous fees and rentals, and oil and natural gas leases and penalties. Statute requires that 3.0 percent of total non-permanent revenue be allocated to the Department of Natural Resources and Conservation (DNRC) for resource development purposes. Senate Bill 48, passed by the 1999 legislature, allows an amount up to 10 percent of the previous year’s revenue to be deposited each year in a state special revenue account used to fund the Trust Land Management Division of DNRC. Permanent sources of revenue generated from capital land grant lands include: timber sales and oil and natural gas royalties.
Applicable Tax Rate(s): N/A
Distribution: After deductions for DNRC administration, all capital land grant income is deposited into a capital projects fund to be used for projects on the state capital complex in accordance with the provisions of section 12 of the Enabling Act.
Collection Frequency: Monthly
Applicable Assumptions and/or Relevant Indicators: Grazing Fees Agricultural Fees Oil and Natural Gas Leases Oil and Natural Gas Penalties Oil and Natural Gas Royalties Miscellaneous Fees Miscellaneous Rentals Timber Sales
Data Source(s): SBAS, SABHRS, Wall Street Journal , Department of Natural Resources and Conservation
Contacts: Department of Administration, Department of Natural Resources and Conservation
Statute: Title 18, Chapter 2, MCA
% of Total FY 2000 General Fund Revenue: N/A
Revenue Estimate Methodology: The LFD uses a number of analytical techniques to develop relevant assumptions for this source of revenue. Historical data trends, economic conditions, input from industry experts, company surveys, and etc., are examples of information used to formulate these assumptions. The techniques used to develop these assumptions may vary from biennium to biennium and are highly dependent on availability of information, professional intuition/judgment, and a detailed analysis of the revenue source. The applicable methodology (formulas) and assumptions used by the LFD to develop a revenue estimate for this source are provided in a subsequent section of this document. The following summarizes the LFD process used to develop the revenue estimate.
Legislative Fiscal Division Revenue Estimate Profile
Capital Land Grant Interest and Income
Revenue Estimates as adopted by the Revenue and Taxation Committee 206 November 17, 2000
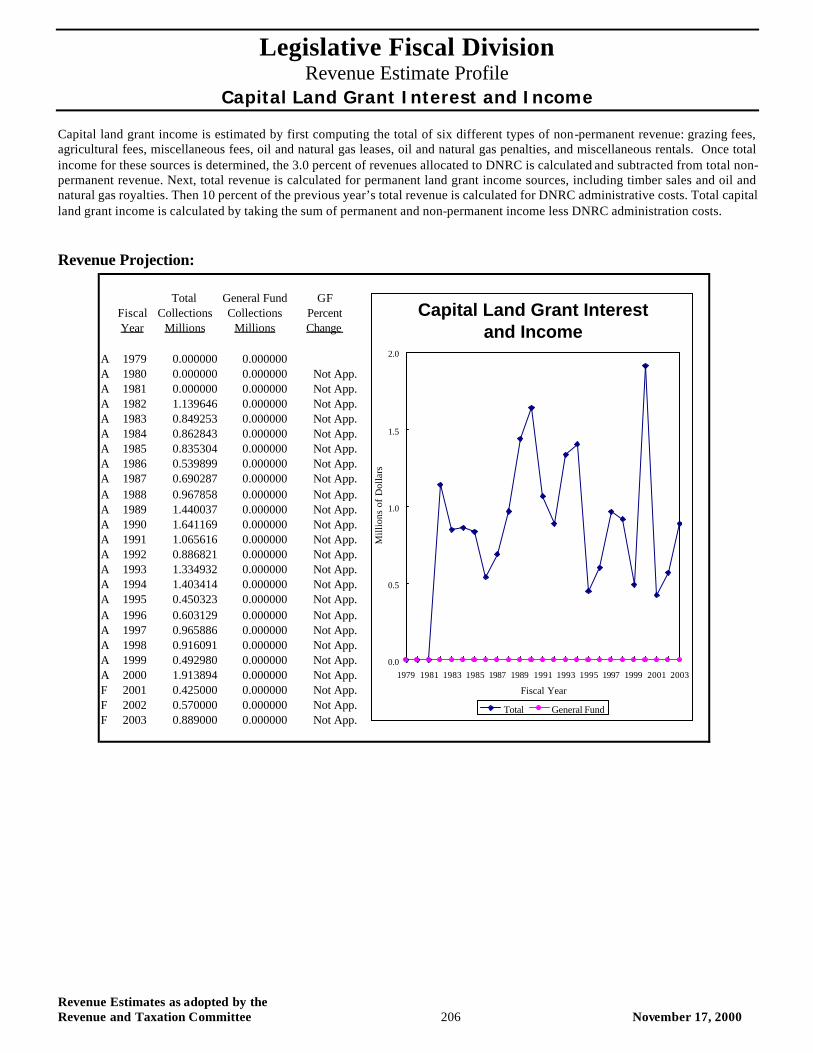
Capital land grant income is estimated by first computing the total of six different types of non-permanent revenue: grazing fees, agricultural fees, miscellaneous fees, oil and natural gas leases, oil and natural gas penalties, and miscellaneous rentals. Once total income for these sources is determined, the 3.0 percent of revenues allocated to DNRC is calculated and subtracted from total non-permanent revenue. Next, total revenue is calculated for permanent land grant income sources, including timber sales and oil and natural gas royalties. Then 10 percent of the previous year’s total revenue is calculated for DNRC administrative costs. Total capital land grant income is calculated by taking the sum of permanent and non-permanent income less DNRC administration costs.
Revenue Projection:
Total General Fund GFFiscal Collections Collections PercentYear Millions Millions Change
A 1979 0.000000 0.000000A 1980 0.000000 0.000000 Not App.A 1981 0.000000 0.000000 Not App.A 1982 1.139646 0.000000 Not App.A 1983 0.849253 0.000000 Not App.A 1984 0.862843 0.000000 Not App.A 1985 0.835304 0.000000 Not App.A 1986 0.539899 0.000000 Not App.A 1987 0.690287 0.000000 Not App.A 1988 0.967858 0.000000 Not App.A 1989 1.440037 0.000000 Not App.A 1990 1.641169 0.000000 Not App.A 1991 1.065616 0.000000 Not App.A 1992 0.886821 0.000000 Not App.A 1993 1.334932 0.000000 Not App.A 1994 1.403414 0.000000 Not App.A 1995 0.450323 0.000000 Not App.A 1996 0.603129 0.000000 Not App.A 1997 0.965886 0.000000 Not App.A 1998 0.916091 0.000000 Not App.A 1999 0.492980 0.000000 Not App.A 2000 1.913894 0.000000 Not App.F 2001 0.425000 0.000000 Not App.F 2002 0.570000 0.000000 Not App.F 2003 0.889000 0.000000 Not App.
Capital Land Grant Interest and Income
0.0
0.5
1.0
1.5
2.0
1979 1981 1983 1985 1987 1989 1991 1993 1995 1997 1999 2001 2003
Fiscal Year
Mill
ions
of
Dol
lars
Total General Fund
Legislative Fiscal Division Revenue Estimate Profile
Capital Land Grant Interest and Income
Revenue Estimates as adopted by the Revenue and Taxation Committee 207 November 17, 2000
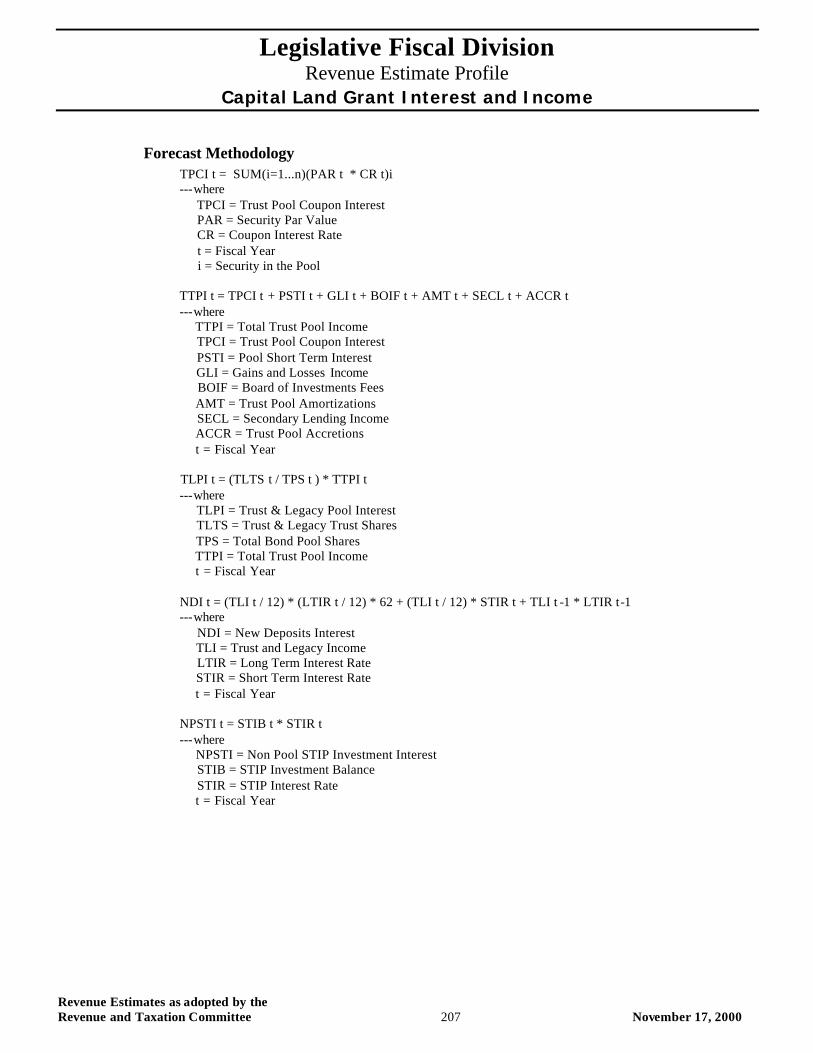
Forecast Methodology TPCI t = SUM(i=1...n)(PAR t * CR t)i ---where TPCI = Trust Pool Coupon Interest PAR = Security Par Value CR = Coupon Interest Rate t = Fiscal Year i = Security in the Pool TTPI t = TPCI t + PSTI t + GLI t + BOIF t + AMT t + SECL t + ACCR t ---where TTPI = Total Trust Pool Income TPCI = Trust Pool Coupon Interest PSTI = Pool Short Term Interest GLI = Gains and Losses Income BOIF = Board of Investments Fees AMT = Trust Pool Amortizations SECL = Secondary Lending Income ACCR = Trust Pool Accretions t = Fiscal Year TLPI t = (TLTS t / TPS t ) * TTPI t ---where TLPI = Trust & Legacy Pool Interest TLTS = Trust & Legacy Trust Shares TPS = Total Bond Pool Shares TTPI = Total Trust Pool Income t = Fiscal Year NDI t = (TLI t / 12) * (LTIR t / 12) * 62 + (TLI t / 12) * STIR t + TLI t -1 * LTIR t-1 ---where NDI = New Deposits Interest TLI = Trust and Legacy Income LTIR = Long Term Interest Rate STIR = Short Term Interest Rate t = Fiscal Year NPSTI t = STIB t * STIR t ---where NPSTI = Non Pool STIP Investment Interest STIB = STIP Investment Balance STIR = STIP Interest Rate t = Fiscal Year
Legislative Fiscal Division Revenue Estimate Profile
Capital Land Grant Interest and Income
Revenue Estimates as adopted by the Revenue and Taxation Committee 208 November 17, 2000
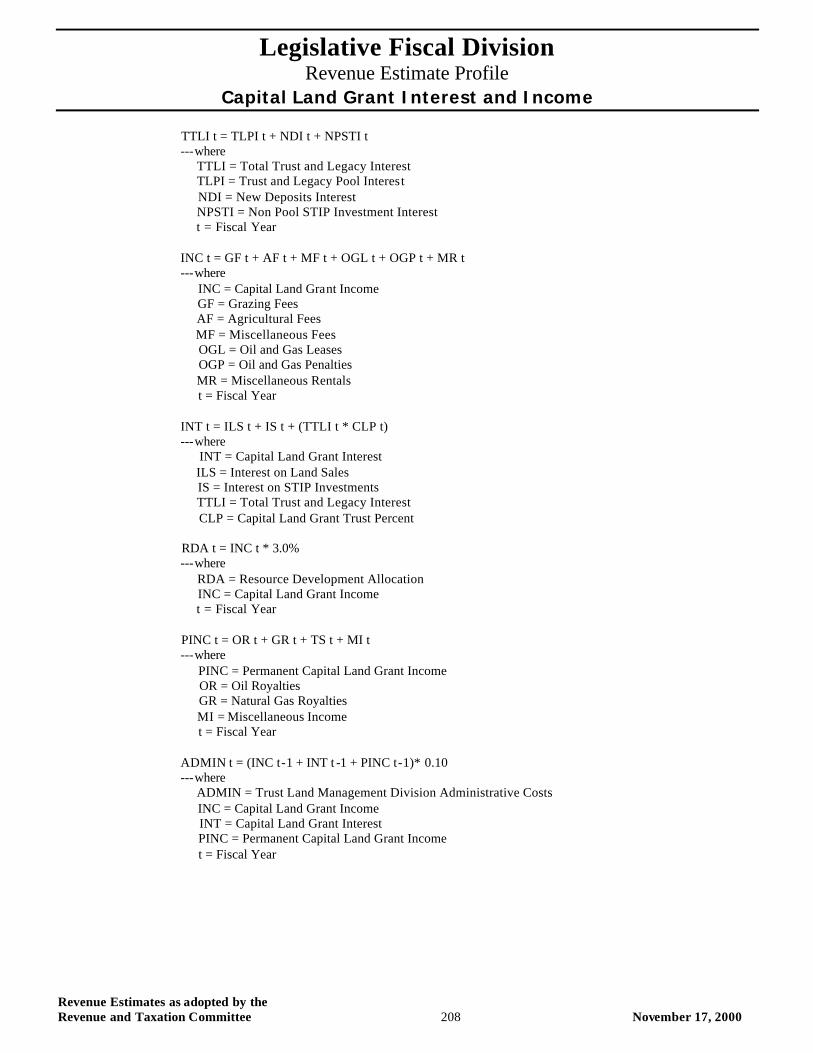
TTLI t = TLPI t + NDI t + NPSTI t ---where TTLI = Total Trust and Legacy Interest TLPI = Trust and Legacy Pool Interest NDI = New Deposits Interest NPSTI = Non Pool STIP Investment Interest t = Fiscal Year INC t = GF t + AF t + MF t + OGL t + OGP t + MR t ---where INC = Capital Land Grant Income GF = Grazing Fees AF = Agricultural Fees MF = Miscellaneous Fees OGL = Oil and Gas Leases OGP = Oil and Gas Penalties MR = Miscellaneous Rentals t = Fiscal Year INT t = ILS t + IS t + (TTLI t * CLP t) ---where INT = Capital Land Grant Interest ILS = Interest on Land Sales IS = Interest on STIP Investments TTLI = Total Trust and Legacy Interest CLP = Capital Land Grant Trust Percent RDA t = INC t * 3.0% ---where RDA = Resource Development Allocation INC = Capital Land Grant Income t = Fiscal Year PINC t = OR t + GR t + TS t + MI t ---where PINC = Permanent Capital Land Grant Income OR = Oil Royalties GR = Natural Gas Royalties MI = Miscellaneous Income t = Fiscal Year ADMIN t = (INC t-1 + INT t -1 + PINC t-1)* 0.10 ---where ADMIN = Trust Land Management Division Administrative Costs INC = Capital Land Grant Income INT = Capital Land Grant Interest PINC = Permanent Capital Land Grant Income t = Fiscal Year

Legislative Fiscal Division Revenue Estimate Profile
Capital Land Grant Interest and Income
Revenue Estimates as adopted by the Revenue and Taxation Committee 209 November 17, 2000
TII t = (INC t + INT t + RDA t) * 100% + PINC t + ADMIN t ---where TII = Total Interest and Income INC = Capital Land Grant Income INT = Capital Land Grant Interest RDA = Resource Development Allocation PINC = Permanent Capital Land Grant Income ADMIN = Trust Land Management Division Administrative Costs t = Fiscal Year
Distribution Methodology GFINT t = TII t * 0% ---where GFINT = General Fund Interest Earnings TII = Total Interest and Income t = Fiscal Year
Trust Pool Other Pool Capitalt Total Rev. GF Rev. Trust Shares Total Shares Interest Income Land Share
Fiscal Millions Millions Millions Millions Millions Millions T&L
Actual 2000 1.913894 0.000000 3.583217 11.821189 78.564737 5.084671 0.000000Forecast 2001 0.425000 0.000000 3.583217 11.821189 78.564737 5.077838 0.000000Forecast 2002 0.570000 0.000000 3.583217 11.821189 78.564737 5.084671 0.000000Forecast 2003 0.889000 0.000000 3.583217 11.821189 78.564737 4.938141 0.000000
Pool Short Gainst Term Interest Losses Fees Amortizations Lending Accretions
Fiscal Millions Millions Millions Millions Millions Millions
Actual 2000 2.402942 0.697222 -0.197184 -1.337427 0.283705 3.235413Forecast 2001 2.396109 0.697222 -0.197184 -1.337427 0.283705 3.235413Forecast 2002 2.402942 0.697222 -0.197184 -1.337427 0.283705 3.235413Forecast 2003 2.256412 0.697222 -0.197184 -1.337427 0.283705 3.235413
Trust Income Trust Land New Deposit Non Pool Non Pool Non Poolt New Deposit Admin. Interest Long Term STIP STIP Bal STIP Int
Fiscal Millions Millions Millions Rate Rate Millions Millions
Actual 2000 10.962021 0.000000Forecast 2001 6.505141 -0.196848 0.253308 7.3690% 6.1980% 11.676486 0.723709Forecast 2002 7.111158 -0.062966 0.757307 7.3910% 6.2520% 11.676486 0.730014Forecast 2003 8.194991 -0.064122 1.322663 7.3780% 5.9440% 11.676486 0.694050
Legislative Fiscal Division Revenue Estimate Profile
Capital Land Grant Interest and Income
Revenue Estimates as adopted by the Revenue and Taxation Committee 210 November 17, 2000
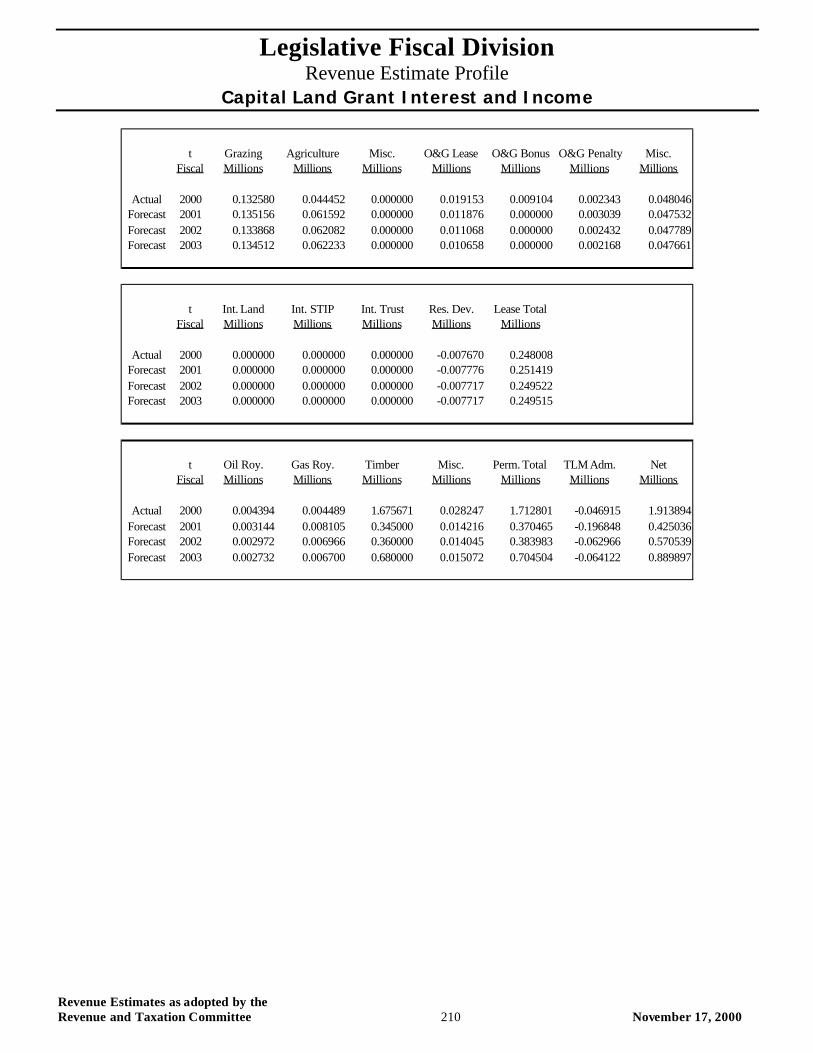
t Grazing Agriculture Misc. O&G Lease O&G Bonus O&G Penalty Misc.Fiscal Millions Millions Millions Millions Millions Millions Millions
Actual 2000 0.132580 0.044452 0.000000 0.019153 0.009104 0.002343 0.048046Forecast 2001 0.135156 0.061592 0.000000 0.011876 0.000000 0.003039 0.047532Forecast 2002 0.133868 0.062082 0.000000 0.011068 0.000000 0.002432 0.047789Forecast 2003 0.134512 0.062233 0.000000 0.010658 0.000000 0.002168 0.047661
t Int. Land Int. STIP Int. Trust Res. Dev. Lease TotalFiscal Millions Millions Millions Millions Millions
Actual 2000 0.000000 0.000000 0.000000 -0.007670 0.248008Forecast 2001 0.000000 0.000000 0.000000 -0.007776 0.251419Forecast 2002 0.000000 0.000000 0.000000 -0.007717 0.249522Forecast 2003 0.000000 0.000000 0.000000 -0.007717 0.249515
t Oil Roy. Gas Roy. Timber Misc. Perm. Total TLM Adm. NetFiscal Millions Millions Millions Millions Millions Millions Millions
Actual 2000 0.004394 0.004489 1.675671 0.028247 1.712801 -0.046915 1.913894Forecast 2001 0.003144 0.008105 0.345000 0.014216 0.370465 -0.196848 0.425036Forecast 2002 0.002972 0.006966 0.360000 0.014045 0.383983 -0.062966 0.570539Forecast 2003 0.002732 0.006700 0.680000 0.015072 0.704504 -0.064122 0.889897
Legislative Fiscal Division Revenue Estimate Profile
Deaf and Blind Trust Interest and Income
Revenue Estimates as adopted by the Revenue and Taxation Committee 211 November 17, 2000
Deaf and Blind Trust Interest and Income
Revenue Description: Lands granted by the federal government to the state for the benefit of public schools and various state institutions generate income. These lands produce revenue through rents or crop shares for agricultural purposes, royalties from the sale of mineral rights, and sales of timber. Income from certain portions of public school/institution lands has been designated for support of the School for the Deaf and Blind. Thus, some of these funds are deposited into a component of the trust and legacy trust fund referred to as the Deaf and Blind trust, which generates interest earnings for the state. As of October 1, 1995, all fixed-income investments held by the state’s major trust funds were transferred to a newly-created Trust Fund Bond Pool (TFBP). The majority of trust and legacy trust funds are invested as part of the TFBP. Some funds, however, are invested on a short term basis in the state’s Short Term Investment Pool (STIP). The state constitution prohibits the investment of any trust funds in common stock.
In accordance with statute, 3.0 percent of Deaf and Blind trust interest and income is allocated to the Department of Natural Resources and Conservation (DNRC) to be used for resource development purposes. Senate Bill 48, passed by the 1999 legislature, provides for the diversion of the following funds for the purpose of funding the Trust Land Management Division in the DNRC: 1) mineral royalties; 2) revenues from the sale of easements; and 3) 5.0 percent of interest and income previously credited to the common school trust. The amount of the money diverted from the Deaf and Blind trust reduces the growth of the trust fund balance and, hence, reduces the amount of distributable interest earnings.
Applicable Tax Rate(s): N/A
Distribution: Interest and income from the trust, less amounts to fund DNRC administration, is allocated to the School for the Deaf and Blind.
Collection Frequency: Monthly
Applicable Assumptions and/or Relevant Indicators: Gains and Losses Income Trust Pool Amortizations Trust Pool Accretions Board of Investments Fees Secondary Lending Income Long Term Interest Rates Short Term Interest Rates Trust and Legacy Income
Data Source(s): Board of Investments, SBAS, SABHRS, Wall Street Journal , Wharton Econometrics Forecasting Associates (WEFA), Department of Natural Resources and Conservation
Contacts: Department of Natural Resources and Conservation
Statute: N/A
% of Total FY 2000 General Fund Revenue: N/A

Legislative Fiscal Division Revenue Estimate Profile
Deaf and Blind Trust Interest and Income
Revenue Estimates as adopted by the Revenue and Taxation Committee 212 November 17, 2000
Revenue Estimate Methodology: The LFD uses a number of analytical techniques to develop relevant assumptions for this source of revenue. Historical data trends, economic conditions, input from industry experts, company surveys, and etc., are examples of information used to formulate these assumptions. The techniques used to develop these assumptions may vary from biennium to biennium and are highly dependent on availability of information, professional intuition/judgment, and a detailed analysis of the revenue source. The applicable methodology (formulas) and assumptions used by the LFD to develop a revenue estimate for this source are provided in a subsequent section of this document. The following summarizes the LFD process used to develop the revenue estimate. The methodology used to forecast Deaf and Blind trust interest and income is a multi-step process. Interest income is derived from investment of the Deaf and Blind trust fund, as well as from interest on land sales. In order to calculate total investment earnings for the trust, income must be calculated on three separate components: 1) trust and legacy trust pool interest; 2) interest on new deposits; and 3) short term interest earnings. The first step involves determining coupon interest income for the entire TFBP, by multiplying the par value of the portfolio times the coupon interest rate. Total income for the TFBP is then calculated by adding the TFBP coupon interest income with other income variables, including: pool short term interest, gains and losses income, Board of Investments fees, TFBP amortizations and accretions, and secondary lending income. Once total TFBP income is estimated, the portion of interest income attributable to the trust and legacy trust fund is calculated based on the number of trust and legacy shares relative to the total number of TFBP shares. Investment income on new deposits is calculated by multiplying the forecast amount for trust and legacy income (lessened by the amount to fund the Trust Land Management Division in DNRC) by the appropriate interest rate. The interest rate and investable balance used varies in accordance with the timing of when new monies become available. For example, revenues received for the first month of the biennium will earn interest at the short term (STIP) rate for one month, after which they will earn interest at the long term rate for the remainder of the biennium. In addition, because a portion of the trust is invested on a short term basis, an assumption is made for the balance of trust funds in STIP. This balance is then multiplied by the short term interest rate to determine short term interest income. Once investment income has been calculated for these three comp onents, the sum of the three is multiplied by the percent of income attributable to the Deaf and Blind trust portion of the trust and legacy trust fund. This number is added to the amount of interest expected from land sales and interest on STIP investments, to comprise total Deaf and Blind trust interest income. Deaf and Blind trust income is estimated by computing the total of six different types of revenue: grazing fees, agricultural fees, miscellaneous fees, oil and gas leases, oil and gas penalties, and miscellaneous rentals. Once total income is determined, the 3.0 percent allocation to DNRC is calculated. Total interest and income is calculated by taking the sum of total Deaf and Blind trust income, total Deaf and Blind trust interest, and timber sale revenue, less the resource development allocation.
Legislative Fiscal Division Revenue Estimate Profile
Deaf and Blind Trust Interest and Income
Revenue Estimates as adopted by the Revenue and Taxation Committee 213 November 17, 2000
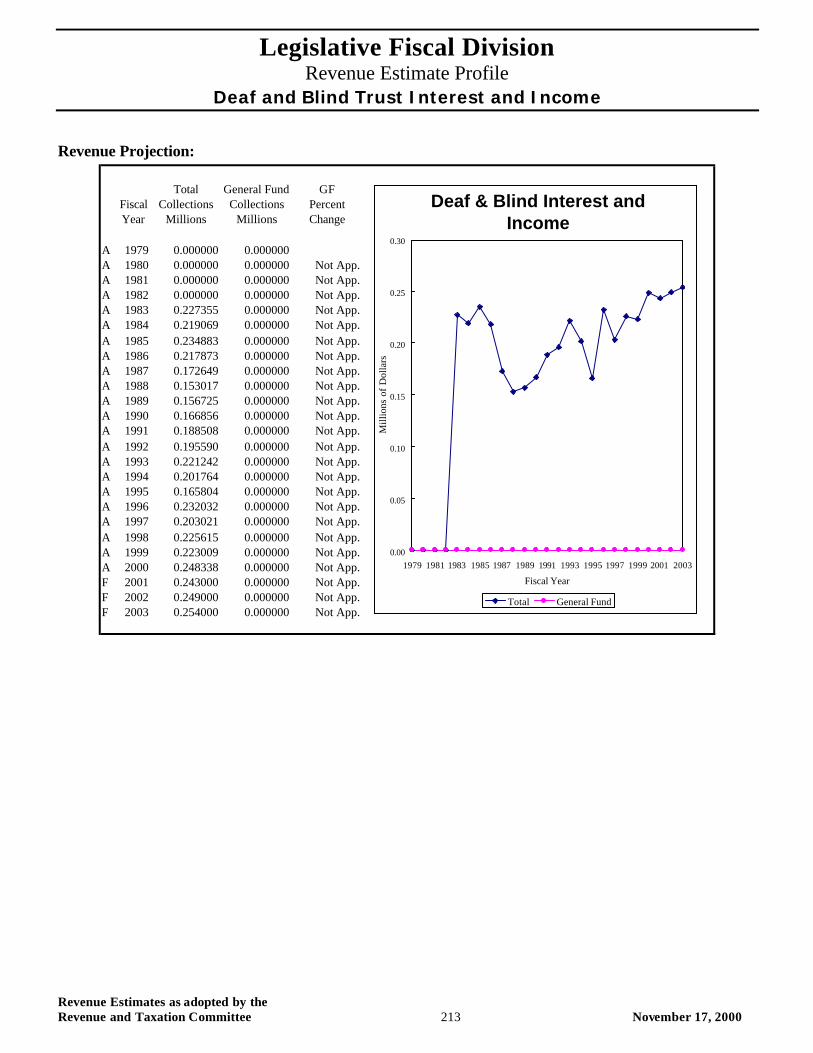
Revenue Projection:
Total General Fund GFFiscal Collections Collections PercentYear Millions Millions Change
A 1979 0.000000 0.000000A 1980 0.000000 0.000000 Not App.A 1981 0.000000 0.000000 Not App.A 1982 0.000000 0.000000 Not App.A 1983 0.227355 0.000000 Not App.A 1984 0.219069 0.000000 Not App.A 1985 0.234883 0.000000 Not App.A 1986 0.217873 0.000000 Not App.A 1987 0.172649 0.000000 Not App.A 1988 0.153017 0.000000 Not App.A 1989 0.156725 0.000000 Not App.A 1990 0.166856 0.000000 Not App.A 1991 0.188508 0.000000 Not App.A 1992 0.195590 0.000000 Not App.A 1993 0.221242 0.000000 Not App.A 1994 0.201764 0.000000 Not App.A 1995 0.165804 0.000000 Not App.A 1996 0.232032 0.000000 Not App.A 1997 0.203021 0.000000 Not App.A 1998 0.225615 0.000000 Not App.A 1999 0.223009 0.000000 Not App.A 2000 0.248338 0.000000 Not App.F 2001 0.243000 0.000000 Not App.F 2002 0.249000 0.000000 Not App.F 2003 0.254000 0.000000 Not App.
Deaf & Blind Interest and Income
0.00
0.05
0.10
0.15
0.20
0.25
0.30
1979 1981 1983 1985 1987 1989 1991 1993 1995 1997 1999 2001 2003
Fiscal Year
Mill
ions
of
Dol
lars
Total General Fund
Legislative Fiscal Division Revenue Estimate Profile
Deaf and Blind Trust Interest and Income
Revenue Estimates as adopted by the Revenue and Taxation Committee 214 November 17, 2000
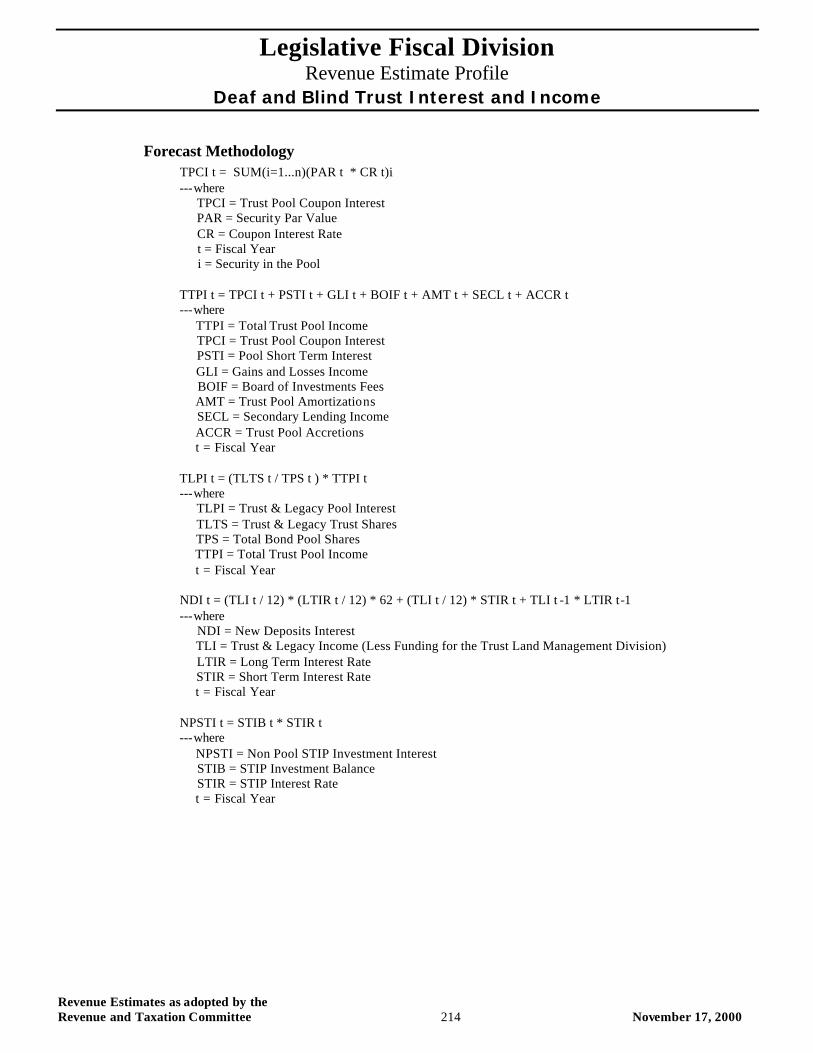
Forecast Methodology TPCI t = SUM(i=1...n)(PAR t * CR t)i ---where TPCI = Trust Pool Coupon Interest PAR = Security Par Value CR = Coupon Interest Rate t = Fiscal Year i = Security in the Pool TTPI t = TPCI t + PSTI t + GLI t + BOIF t + AMT t + SECL t + ACCR t ---where TTPI = Total Trust Pool Income TPCI = Trust Pool Coupon Interest PSTI = Pool Short Term Interest GLI = Gains and Losses Income BOIF = Board of Investments Fees AMT = Trust Pool Amortizations SECL = Secondary Lending Income ACCR = Trust Pool Accretions t = Fiscal Year TLPI t = (TLTS t / TPS t ) * TTPI t ---where TLPI = Trust & Legacy Pool Interest TLTS = Trust & Legacy Trust Shares TPS = Total Bond Pool Shares TTPI = Total Trust Pool Income t = Fiscal Year NDI t = (TLI t / 12) * (LTIR t / 12) * 62 + (TLI t / 12) * STIR t + TLI t -1 * LTIR t-1 ---where NDI = New Deposits Interest TLI = Trust & Legacy Income (Less Funding for the Trust Land Management Division) LTIR = Long Term Interest Rate STIR = Short Term Interest Rate t = Fiscal Year NPSTI t = STIB t * STIR t ---where NPSTI = Non Pool STIP Investment Interest STIB = STIP Investment Balance STIR = STIP Interest Rate t = Fiscal Year
Legislative Fiscal Division Revenue Estimate Profile
Deaf and Blind Trust Interest and Income
Revenue Estimates as adopted by the Revenue and Taxation Committee 215 November 17, 2000
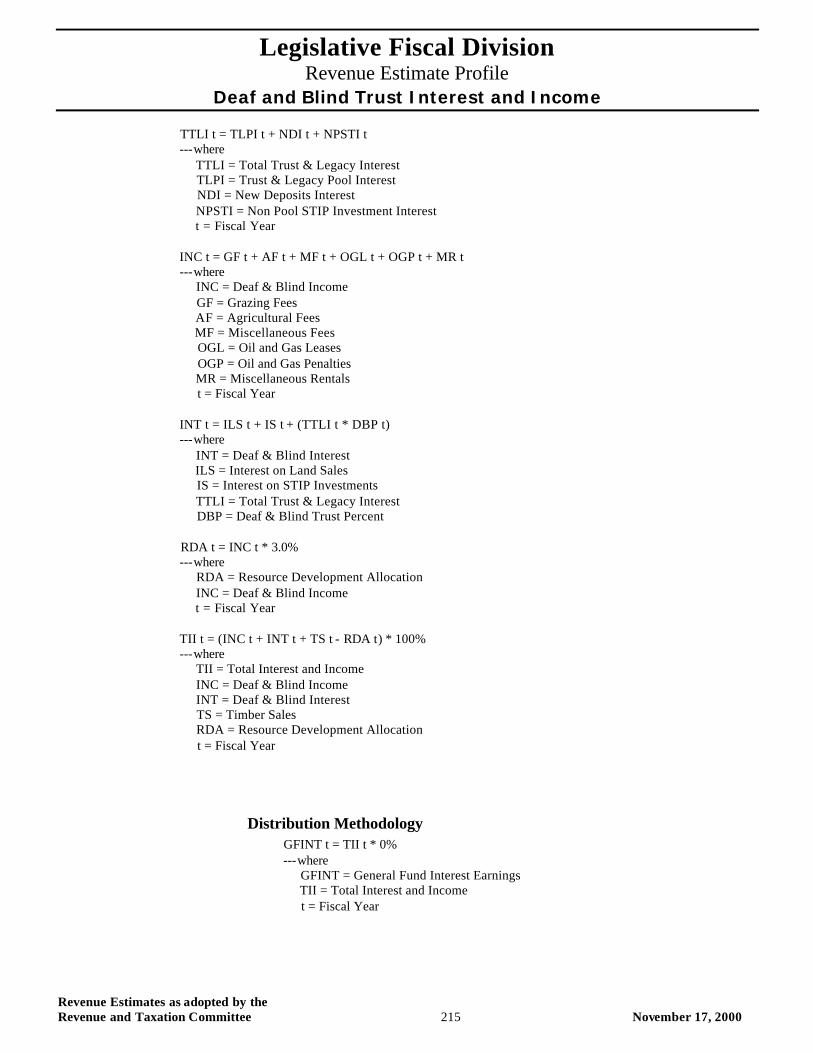
TTLI t = TLPI t + NDI t + NPSTI t ---where TTLI = Total Trust & Legacy Interest TLPI = Trust & Legacy Pool Interest NDI = New Deposits Interest NPSTI = Non Pool STIP Investment Interest t = Fiscal Year INC t = GF t + AF t + MF t + OGL t + OGP t + MR t ---where INC = Deaf & Blind Income GF = Grazing Fees AF = Agricultural Fees MF = Miscellaneous Fees OGL = Oil and Gas Leases OGP = Oil and Gas Penalties MR = Miscellaneous Rentals t = Fiscal Year INT t = ILS t + IS t + (TTLI t * DBP t) ---where INT = Deaf & Blind Interest ILS = Interest on Land Sales IS = Interest on STIP Investments TTLI = Total Trust & Legacy Interest DBP = Deaf & Blind Trust Percent RDA t = INC t * 3.0% ---where RDA = Resource Development Allocation INC = Deaf & Blind Income t = Fiscal Year TII t = (INC t + INT t + TS t - RDA t) * 100% ---where TII = Total Interest and Income INC = Deaf & Blind Income INT = Deaf & Blind Interest TS = Timber Sales RDA = Resource Development Allocation t = Fiscal Year
Distribution Methodology GFINT t = TII t * 0% ---where GFINT = General Fund Interest Earnings TII = Total Interest and Income t = Fiscal Year
Legislative Fiscal Division Revenue Estimate Profile
Deaf and Blind Trust Interest and Income
Revenue Estimates as adopted by the Revenue and Taxation Committee 216 November 17, 2000
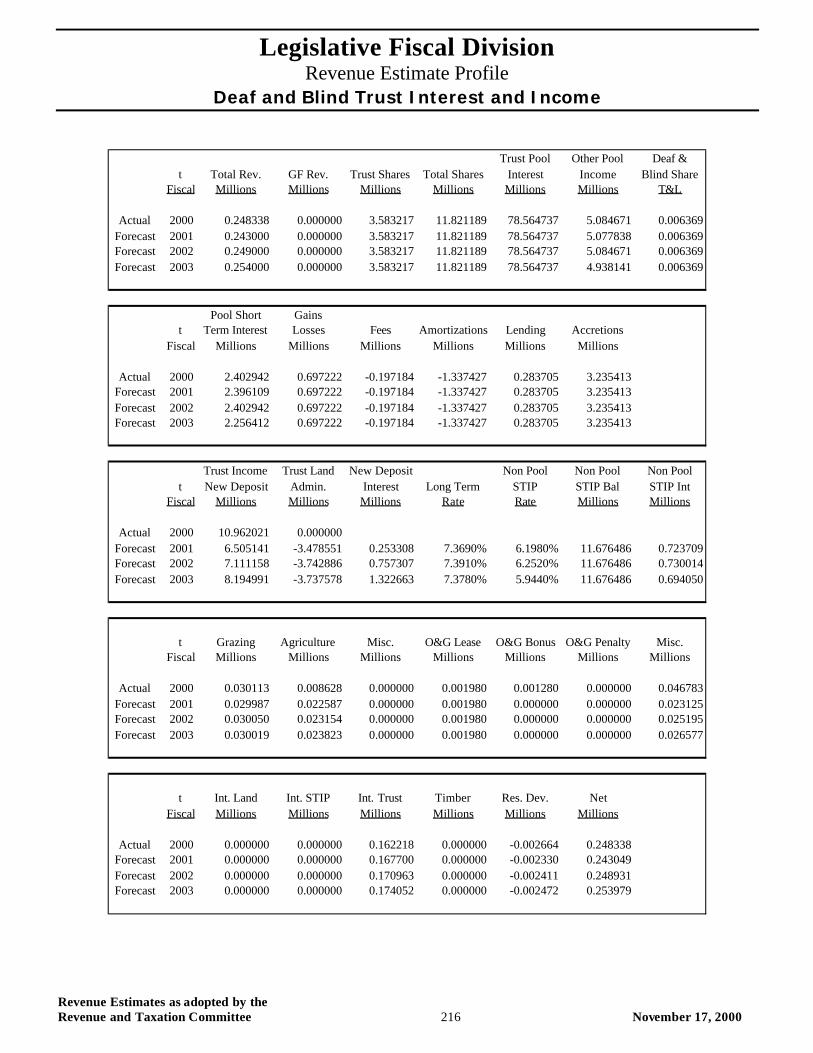
Trust Pool Other Pool Deaf &t Total Rev. GF Rev. Trust Shares Total Shares Interest Income Blind Share
Fiscal Millions Millions Millions Millions Millions Millions T&L
Actual 2000 0.248338 0.000000 3.583217 11.821189 78.564737 5.084671 0.006369Forecast 2001 0.243000 0.000000 3.583217 11.821189 78.564737 5.077838 0.006369Forecast 2002 0.249000 0.000000 3.583217 11.821189 78.564737 5.084671 0.006369Forecast 2003 0.254000 0.000000 3.583217 11.821189 78.564737 4.938141 0.006369
Pool Short Gainst Term Interest Losses Fees Amortizations Lending Accretions
Fiscal Millions Millions Millions Millions Millions Millions
Actual 2000 2.402942 0.697222 -0.197184 -1.337427 0.283705 3.235413Forecast 2001 2.396109 0.697222 -0.197184 -1.337427 0.283705 3.235413Forecast 2002 2.402942 0.697222 -0.197184 -1.337427 0.283705 3.235413Forecast 2003 2.256412 0.697222 -0.197184 -1.337427 0.283705 3.235413
Trust Income Trust Land New Deposit Non Pool Non Pool Non Poolt New Deposit Admin. Interest Long Term STIP STIP Bal STIP Int
Fiscal Millions Millions Millions Rate Rate Millions Millions
Actual 2000 10.962021 0.000000Forecast 2001 6.505141 -3.478551 0.253308 7.3690% 6.1980% 11.676486 0.723709Forecast 2002 7.111158 -3.742886 0.757307 7.3910% 6.2520% 11.676486 0.730014Forecast 2003 8.194991 -3.737578 1.322663 7.3780% 5.9440% 11.676486 0.694050
t Grazing Agriculture Misc. O&G Lease O&G Bonus O&G Penalty Misc.Fiscal Millions Millions Millions Millions Millions Millions Millions
Actual 2000 0.030113 0.008628 0.000000 0.001980 0.001280 0.000000 0.046783Forecast 2001 0.029987 0.022587 0.000000 0.001980 0.000000 0.000000 0.023125Forecast 2002 0.030050 0.023154 0.000000 0.001980 0.000000 0.000000 0.025195Forecast 2003 0.030019 0.023823 0.000000 0.001980 0.000000 0.000000 0.026577
t Int. Land Int. STIP Int. Trust Timber Res. Dev. NetFiscal Millions Millions Millions Millions Millions Millions
Actual 2000 0.000000 0.000000 0.162218 0.000000 -0.002664 0.248338Forecast 2001 0.000000 0.000000 0.167700 0.000000 -0.002330 0.243049Forecast 2002 0.000000 0.000000 0.170963 0.000000 -0.002411 0.248931Forecast 2003 0.000000 0.000000 0.174052 0.000000 -0.002472 0.253979
Legislative Fiscal Division Revenue Estimate Profile
Diesel Tax
Revenue Estimates as adopted by the Revenue and Taxation Committee 217 November 17, 2000
Diesel Tax
Revenue Description: The constitution of the state (Article VII, Section 6) provides that money from taxes on vehicle fuel be used solely for: 1) payment of obligations incurred for construction, reconstruction, repair, operation, and maintenance of public highways, streets, roads, and bridges; 2) payment of county, city, and town obligations on streets roads, and bridges; and 3) enforcement of highway safety, driver education, tourist promotion, and administrative collection costs. Appropriation of the money for any other use requires a three-fifth vote of each house of the legislature.
There are three sources of revenue associated with the taxation of special fuels (primarily diesel): 1) the main source of revenue is a diesel tax of $0.2775 per gallon paid to the Department of Transportation (DOT) for every gallon of diesel sold or used in the state, 2) a tax of $0.0075 is assessed on each gallon of diesel fuel for the purpose of funding petroleum storage tank cleanup; and 3) although House Bill 138, passed by the 1999 legislature eliminated the $200 annual license fee paid by persons who engage in the wholesale distribution of diesel in the state, it left intact the $100 reissuance fee. The focus of this profile is on revenue generated by the $0.2775 and $0.0075 per gallon taxes on diesel fuel.
Distributors are allowed to withhold 1.0 percent of the diesel tax as an allowance for collecting the tax. In order to prevent the possibility of dual taxation of motor fuels purchased by Montana citizens and businesses on Indian reservations, DOT and Indian tribes may enter into a cooperative agreement. Refunds of the tax paid is provided for commercial vehicle use other than for use on public highways and streets, governmental use, and nonpublic school use for the transportation of pupils.
Applicable Tax Rate(s): Diesel (Special) Fuel Tax - $0.2775 per gallon. Petroleum Storage Tank Cleanup Tax - $0.0075.
Distribution: After reductions for: 1) the 1.0 percent withheld by distributors; 2) administrative expenses and refund amounts deducted by DOT under a tribal agreement that are deposited in the tribal motor fuels administration account; 3) diesel tax refunds; and 4) amounts refunded through the international fuel tax agreement, diesel tax proceeds are distributed to DOT. Of that amount, 1/4 of $0.01 per gallon is allocated specifically to the funding of highway system maintenance.
Collection Frequency: Monthly
Applicable Assumptions and/or Relevant Indicators: Gallons of diesel
Data Source(s): SBAS, SABHRS, Department of Transportation
Contacts: Department of Transportation
Statute: Title 15, Chapter 70 and Title 60, Chapter 3, MCA
% of Total FY 2000 General Fund Revenue: N/A
Revenue Estimate Methodology: The LFD uses a number of analytical techniques to develop relevant assumptions for this source of revenue. Historical data trends, economic conditions, input from industry experts, company surveys, and etc., are examples of information used to formulate these assumptions. The techniques used to develop these assumptions may vary from biennium to biennium and are highly dependent on availability of information, professional intuition/judgement, and a detailed analysis of the revenue source. The applicable methodology (formulas) and assumptions used by the LFD to develop a revenue estimate for this source are provided in a subsequent section of this document. The following summarizes the LFD process used to develop the revenue estimate.
Legislative Fiscal Division Revenue Estimate Profile
Diesel Tax
Revenue Estimates as adopted by the Revenue and Taxation Committee 218 November 17, 2000
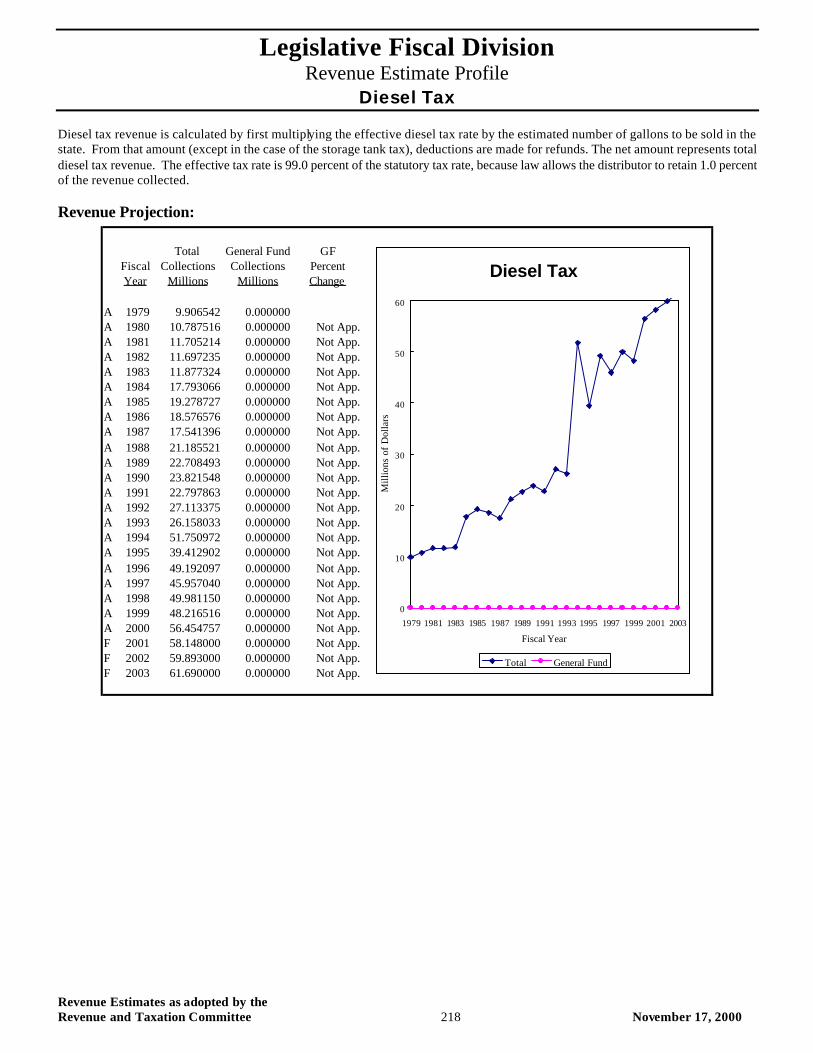
Diesel tax revenue is calculated by first multiplying the effective diesel tax rate by the estimated number of gallons to be sold in the state. From that amount (except in the case of the storage tank tax), deductions are made for refunds. The net amount represents total diesel tax revenue. The effective tax rate is 99.0 percent of the statutory tax rate, because law allows the distributor to retain 1.0 percent of the revenue collected.
Revenue Projection:
Total General Fund GFFiscal Collections Collections PercentYear Millions Millions Change
A 1979 9.906542 0.000000A 1980 10.787516 0.000000 Not App.A 1981 11.705214 0.000000 Not App.A 1982 11.697235 0.000000 Not App.A 1983 11.877324 0.000000 Not App.A 1984 17.793066 0.000000 Not App.A 1985 19.278727 0.000000 Not App.A 1986 18.576576 0.000000 Not App.A 1987 17.541396 0.000000 Not App.A 1988 21.185521 0.000000 Not App.A 1989 22.708493 0.000000 Not App.A 1990 23.821548 0.000000 Not App.A 1991 22.797863 0.000000 Not App.A 1992 27.113375 0.000000 Not App.A 1993 26.158033 0.000000 Not App.A 1994 51.750972 0.000000 Not App.A 1995 39.412902 0.000000 Not App.A 1996 49.192097 0.000000 Not App.A 1997 45.957040 0.000000 Not App.A 1998 49.981150 0.000000 Not App.A 1999 48.216516 0.000000 Not App.A 2000 56.454757 0.000000 Not App.F 2001 58.148000 0.000000 Not App.F 2002 59.893000 0.000000 Not App.F 2003 61.690000 0.000000 Not App.
Diesel Tax
0
10
20
30
40
50
60
1979 1981 1983 1985 1987 1989 1991 1993 1995 1997 1999 2001 2003
Fiscal Year
Mill
ions
of
Dol
lars
Total General Fund
Legislative Fiscal Division Revenue Estimate Profile
Diesel Tax
Revenue Estimates as adopted by the Revenue and Taxation Committee 219 November 17, 2000
Forecast Methodology EDTR t = DTR t * 0.99 ---where EDTR = Effective Diesel Tax Rate per Gallon DTR = Tax Rate of Diesel DTAX t = (GAL t * EDTR t) - REF t - TA t ---where DTAX = Diesel Tax GAL = Gallons of Diesel EDTR = Effective Diesel Tax Rate per Gallon REF = Refunds TA = Tribal Agreements t = Fiscal Year STDTAX t = GAL t * STDTR t ---where STDTAX = Storage Tax Diesel Tax GAL = Gallons of Diesel STDRT = Storage Tank Diesel Tax Rate Per Gallon t = Fiscal Year
Distribution Methodology GFTAX t = TAX t * 0% ---where GFTAX = General Fund Allocation of Tax TAX = Diesel License Tax t = Fiscal Year

Legislative Fiscal Division Revenue Estimate Profile
Diesel Tax
Revenue Estimates as adopted by the Revenue and Taxation Committee 220 November 17, 2000
t Total Tax GF Tax Gross Diesel Tax Tank TaxFiscal Millions Millions Millions Millions Millions
Actual 2000 56.454757 0.000000 59.780702 54.259213 2.195544Forecast 2001 58.148000 0.000000 61.574123 55.886990 2.261410Forecast 2002 59.893000 0.000000 63.421347 57.563599 2.329253Forecast 2003 61.690000 0.000000 65.323987 59.290507 2.399130
Diesel Tank Tankt Refunds Effective Effective Gallons Gallons
Fiscal Millions Rate Rate Millions Millions
Actual 2000 -3.325945 0.274725 0.007500 209.610185 292.739200Forecast 2001 -3.425723 0.274725 0.007500 215.898491 301.521376Forecast 2002 -3.528495 0.274725 0.007500 222.375446 310.567017Forecast 2003 -3.634350 0.274725 0.007500 229.046709 319.884028
t GF DOT GF DOTFiscal Percent Percent Millions Millions
Actual 2000 0.0000% 100.0000% 0.000000 54.259213Forecast 2001 0.0000% 100.0000% 0.000000 55.887000Forecast 2002 0.0000% 100.0000% 0.000000 57.564000Forecast 2003 0.0000% 100.0000% 0.000000 59.291000
Legislative Fiscal Division Revenue Estimate Profile
Federal Forest Receipts
Revenue Estimates as adopted by the Revenue and Taxation Committee 221 November 17, 2000
Federal Forest Receipts
Revenue Description: The federal government authorizes logging operations on forest lands located within the borders of Montana. The sale of timber generates revenue that the federal government shares with the state in the following year. The state receives 25 percent of the federal forest receipts. The state sends the money to the county treasurer of the county in which the receipts were generated. Within thirty days, the county treasurer distributes the money to various county and state accounts. Beginning November 2000, HR 2389 (federal legislation) fixes the allocation to the state at the average of the highest three years of forest receipts in the state. Not more than 20 percent and not less than 15 percent may be used by county governments for special projects on federal lands. The remainder is distributed under state law as described below.
Applicable Tax Rate(s): N/A
Distribution: The county treasurer apportions federal forest receipts in the following manner.
?? 66 2/3% to the general fund of the county ?? 33 1/3% to the following county wide accounts, based on the mill ratios of each to total mills in the current year:
the county equalization accounts (55 mills) the county transportation account the county retirement accounts
This revenue source represents one component used to calculate total non levy property tax revenue.
Collection Frequency: Twice annually (usually October and December).
Applicable Assumptions and/or Relevant Indicators: Federal Forest Timber Prices Federal Board Feet Harvested Mill Levies for County Transportation and Retirement Accounts
Data Source(s): U.S. Forest Service survey, SBAS, SABHRS
Contacts: U.S. Forest Service
Statute: Title 17, Chapter 3, MCA
% of Total FY 2000 General Fund Revenue: Included in total property tax contribution.
Revenue Estimate Methodology: The LFD uses a number of analytical techniques to develop relevant assumptions for this source of revenue. Historical data trends, economic conditions, input from industry experts, company surveys, and etc., are examples of information used to formulate these assumptions. The techniques used to develop these assumptions may vary from biennium to biennium and are highly dependent on availability of information, professional intuition/judgement, and a detailed analysis of the revenue source. The applicable methodology (formulas) and assumptions are used by the LFD to develop a revenue estimate for this source are provided in a subsequent section of this document. The following summarizes the LFD process used to develop the revenue estimate. Before the passage of federal HR 2389, forest receipts were estimated using the following procedure. Forest receipts and harvest data in Montana are collected for the most recent year available, from which a statewide average price is derived. U.S. Forest Service officials are interviewed to estimate future board feet production based on known sales and other future considerations. Future timber prices are also elicited from U.S. Forest Service officials. Total revenue is derived by multiplying estimated board feet by the estimated price by the state’s share of 25.0 percent. This amount is then distributed to the county equalization account (55 mills) based on last year’s ratio.
Legislative Fiscal Division Revenue Estimate Profile
Federal Forest Receipts
Revenue Estimates as adopted by the Revenue and Taxation Committee 222 November 17, 2000
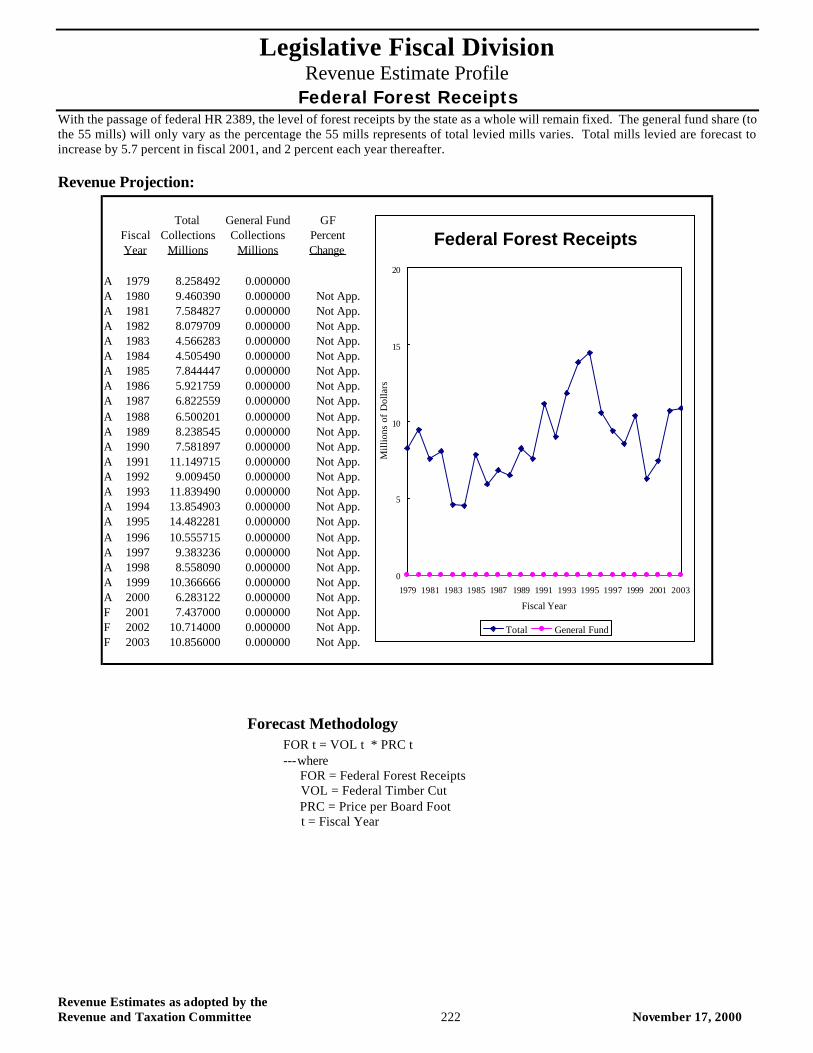
With the passage of federal HR 2389, the level of forest receipts by the state as a whole will remain fixed. The general fund share (to the 55 mills) will only vary as the percentage the 55 mills represents of total levied mills varies. Total mills levied are forecast to increase by 5.7 percent in fiscal 2001, and 2 percent each year thereafter.
Revenue Projection:
Forecast Methodology FOR t = VOL t * PRC t ---where FOR = Federal Forest Receipts VOL = Federal Timber Cut PRC = Price per Board Foot t = Fiscal Year
Total General Fund GFFiscal Collections Collections PercentYear Millions Millions Change
A 1979 8.258492 0.000000A 1980 9.460390 0.000000 Not App.A 1981 7.584827 0.000000 Not App.A 1982 8.079709 0.000000 Not App.A 1983 4.566283 0.000000 Not App.A 1984 4.505490 0.000000 Not App.A 1985 7.844447 0.000000 Not App.A 1986 5.921759 0.000000 Not App.A 1987 6.822559 0.000000 Not App.A 1988 6.500201 0.000000 Not App.A 1989 8.238545 0.000000 Not App.A 1990 7.581897 0.000000 Not App.A 1991 11.149715 0.000000 Not App.A 1992 9.009450 0.000000 Not App.A 1993 11.839490 0.000000 Not App.A 1994 13.854903 0.000000 Not App.A 1995 14.482281 0.000000 Not App.A 1996 10.555715 0.000000 Not App.A 1997 9.383236 0.000000 Not App.A 1998 8.558090 0.000000 Not App.A 1999 10.366666 0.000000 Not App.A 2000 6.283122 0.000000 Not App.F 2001 7.437000 0.000000 Not App.F 2002 10.714000 0.000000 Not App.F 2003 10.856000 0.000000 Not App.
Federal Forest Receipts
0
5
10
15
20
1979 1981 1983 1985 1987 1989 1991 1993 1995 1997 1999 2001 2003
Fiscal Year
Mill
ions
of
Dol
lars
Total General Fund
Legislative Fiscal Division Revenue Estimate Profile
Federal Forest Receipts
Revenue Estimates as adopted by the Revenue and Taxation Committee 223 November 17, 2000
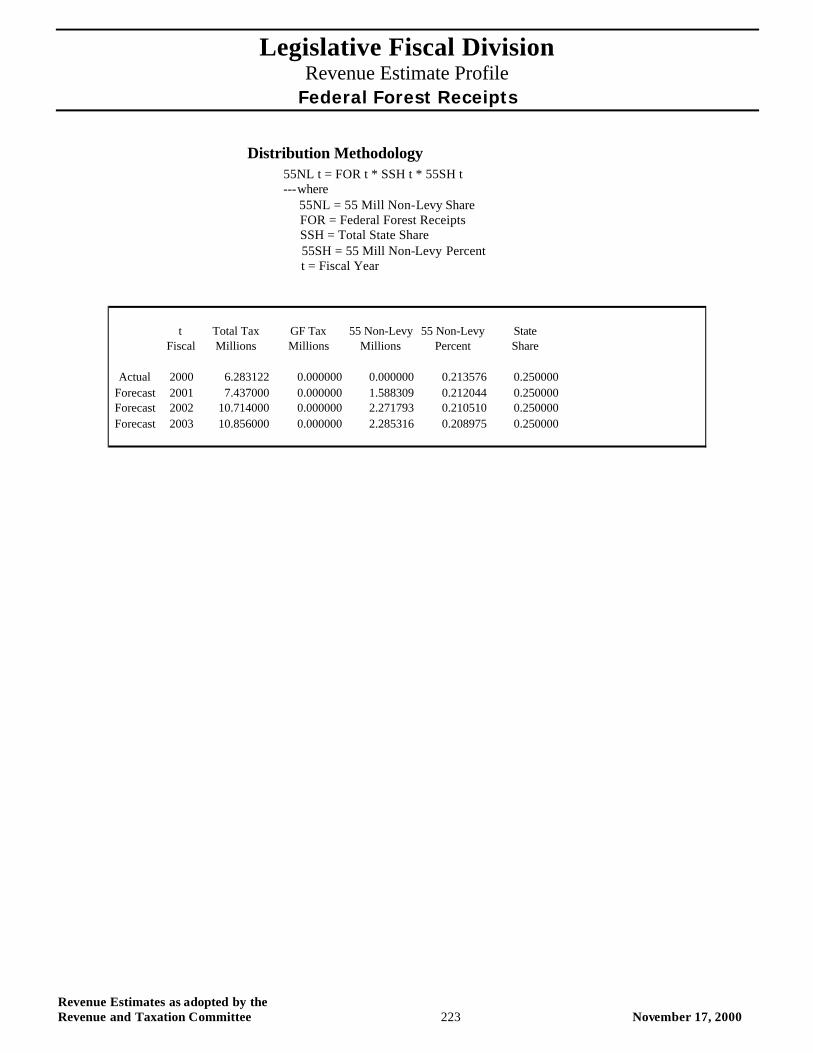
Distribution Methodology 55NL t = FOR t * SSH t * 55SH t ---where 55NL = 55 Mill Non-Levy Share FOR = Federal Forest Receipts SSH = Total State Share 55SH = 55 Mill Non-Levy Percent t = Fiscal Year
t Total Tax GF Tax 55 Non-Levy 55 Non-Levy StateFiscal Millions Millions Millions Percent Share
Actual 2000 6.283122 0.000000 0.000000 0.213576 0.250000Forecast 2001 7.437000 0.000000 1.588309 0.212044 0.250000Forecast 2002 10.714000 0.000000 2.271793 0.210510 0.250000Forecast 2003 10.856000 0.000000 2.285316 0.208975 0.250000

Revenue Estimates as adopted by the Revenue and Taxation Committee 224 November 17, 2000
Legislative Fiscal Division Revenue Estimate Profile
Gasoline Tax
Revenue Estimates as adopted by the Revenue and Taxation Committee 225 November 17, 2000
Gasoline Tax
Revenue Description: The constitution of the state (Article VII, Section 6) provides that money from taxes on vehicle fuel be used solely for: 1) payment of obligations incurred for construction, reconstruction, repair, operation, and maintenance of public highways, streets, roads, and bridges; 2) payment of county, city, and town obligations on streets roads, and bridges; and 3) enforcement of highway safety, driver education, tourist promotion, and administrative collection costs. Appropriation of the money for any other use requires a three-fifth vote of each house of the legislature.
There are two sources of revenue associated with the taxation of gasoline: 1) the primary source of revenue is a gasoline license tax of $0.27 per gallon paid to the Department of Transportation (DOT) by every distributor for the privilege of selling gasoline; and 2) a tax of $.0075 assessed on each gallon of gasoline for the purpose of funding petroleum storage tank cleanup.. Distributors are allowed to withhold 1.0 percent of the gasoline tax as an allowance for collecting the tax. In order to prevent the possibility of dual taxation of motor fuels purchased by Montana citizens and businesses on Indian reservations, DOT and Indian tribes may enter into a cooperative agreement. Refunds of the tax paid is provided for denaturing alcohol used in gasohol, stationary gasoline engines used off public highways and streets, and commercial vehicle use other than for use on public highways and streets.
Applicable Tax Rate(s): Gasoline License Tax - $0.27 per gallon Petroleum Storage Tank Cleanup Tax - $0.0075.
Distribution: After reductions for: 1) the 1.0 percent withheld by distributors; 2) administrative expenses and refund amounts deducted by DOT under a tribal agreement that are deposited in the tribal motor fuels administration account; 3) gasoline tax refunds; and 4) amounts refunded through the international fuel tax agreement, the remainder of the gasoline tax is allocated as follows:
?? 9/10 of 1.0% to the state park account ?? 15/28 of 1.0% to a snowmobile account in the state special revenue fund. This amount is further allocated 86.0% for
general use, 4.33% for enforcement, 8.67% for safety and education, and 1.0 percent to the noxious weed trust. ?? 1/8 of 1.0% to an off-highway vehicle account in the state special revenue fund. This amount is further allocated 90% for
general use (including repair of damaged areas) and 10% for safety. ?? 1/25 of 1.0% to the aeronautics revenue fund of the Department of Transportation ?? 98.3993% to DOT to be used for highway-related purposes, primarily construction projects and administrative costs.
One-fourth of $.01 per gallon is allocated specifically to the funding of highway system maintenance.
Collection Frequency: Monthly
Applicable Assumptions and/or Relevant Indicators: Gallons of gasoline
Data Source(s): SBAS, SABHRS, Department of Transportation
Contacts: Department of Transportation
Statute: Title 15, Chapter 70 and Title 60, Chapter 3, MCA
% of Total FY 2000 General Fund Revenue: N/A
Legislative Fiscal Division Revenue Estimate Profile
Gasoline Tax
Revenue Estimates as adopted by the Revenue and Taxation Committee 226 November 17, 2000
Revenue Estimate Methodology: The LFD uses a number of analytical techniques to develop relevant assumptions for this source of revenue. Historical data trends, economic conditions, input from industry experts, company surveys, and etc., are examples of information used to formulate these assumptions. The techniques used to develop these assumptions may vary from biennium to biennium and are highly dependent on availability of information, professional intuition/judgment, and a detailed analysis of the revenue source. The applicable methodology (formulas) and assumptions used by the LFD to develop a revenue estimate for this source are provided in a subsequent section of this document. The following summarizes the LFD process used to develop the revenue estimate. Gasoline tax revenue is calculated by first multiplying the effective gasoline tax rate by the estimated number of gallons to be sold in the state. From that amount, deductions are made for: refunds, alcohol incentives, and tribal agreements. The net amount represents total gas tax revenue. The effective tax rate is 99.0 percent of the statutory rate, because law allows distributor to retain 1.0 percent of the revenue.
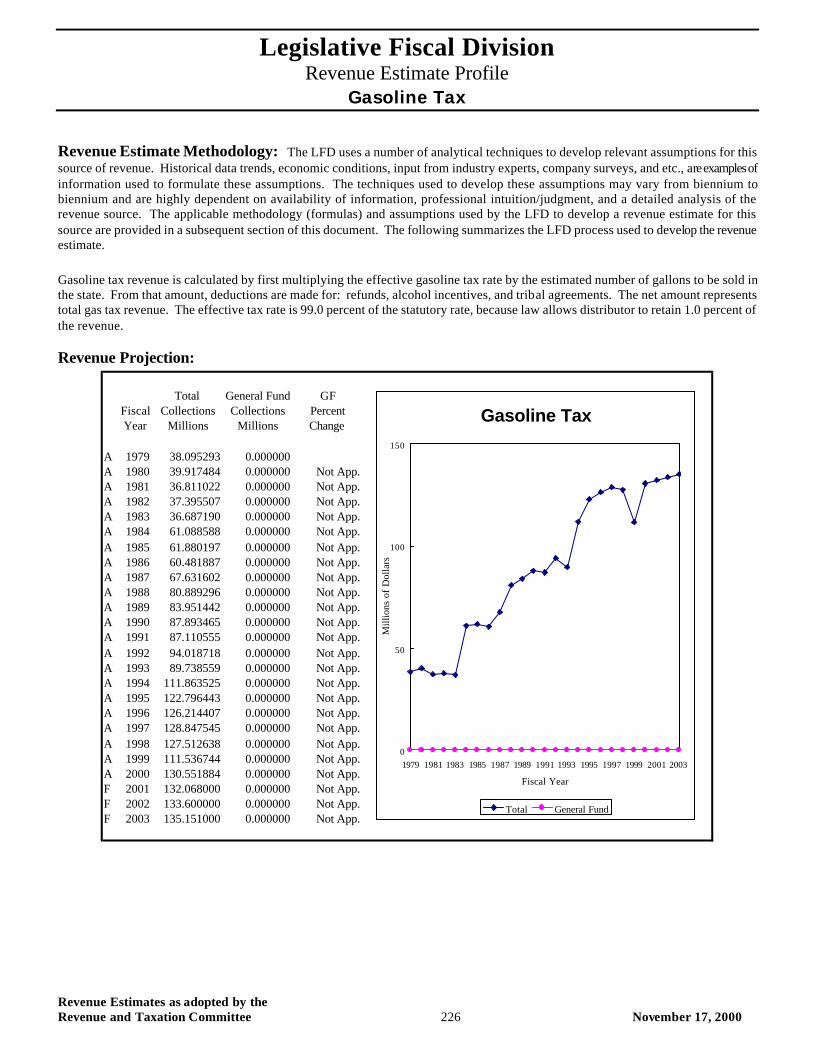
Revenue Projection:
Total General Fund GFFiscal Collections Collections PercentYear Millions Millions Change
A 1979 38.095293 0.000000A 1980 39.917484 0.000000 Not App.A 1981 36.811022 0.000000 Not App.A 1982 37.395507 0.000000 Not App.A 1983 36.687190 0.000000 Not App.A 1984 61.088588 0.000000 Not App.A 1985 61.880197 0.000000 Not App.A 1986 60.481887 0.000000 Not App.A 1987 67.631602 0.000000 Not App.A 1988 80.889296 0.000000 Not App.A 1989 83.951442 0.000000 Not App.A 1990 87.893465 0.000000 Not App.A 1991 87.110555 0.000000 Not App.A 1992 94.018718 0.000000 Not App.A 1993 89.738559 0.000000 Not App.A 1994 111.863525 0.000000 Not App.A 1995 122.796443 0.000000 Not App.A 1996 126.214407 0.000000 Not App.A 1997 128.847545 0.000000 Not App.A 1998 127.512638 0.000000 Not App.A 1999 111.536744 0.000000 Not App.A 2000 130.551884 0.000000 Not App.F 2001 132.068000 0.000000 Not App.F 2002 133.600000 0.000000 Not App.F 2003 135.151000 0.000000 Not App.
Gasoline Tax
0
50
100
150
1979 1981 1983 1985 1987 1989 1991 1993 1995 1997 1999 2001 2003
Fiscal Year
Mill
ions
of
Dol
lars
Total General Fund
Legislative Fiscal Division Revenue Estimate Profile
Gasoline Tax
Revenue Estimates as adopted by the Revenue and Taxation Committee 227 November 17, 2000
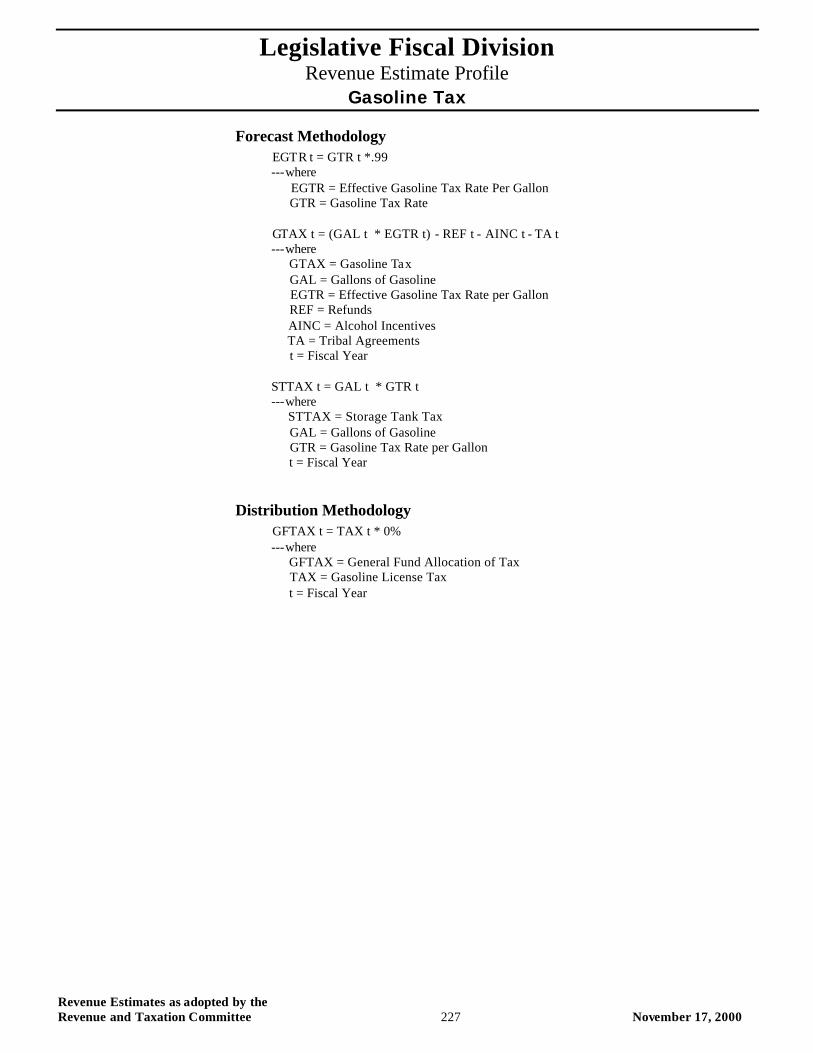
Forecast Methodology EGTR t = GTR t *.99 ---where EGTR = Effective Gasoline Tax Rate Per Gallon GTR = Gasoline Tax Rate GTAX t = (GAL t * EGTR t) - REF t - AINC t - TA t ---where GTAX = Gasoline Tax GAL = Gallons of Gasoline EGTR = Effective Gasoline Tax Rate per Gallon REF = Refunds AINC = Alcohol Incentives TA = Tribal Agreements t = Fiscal Year STTAX t = GAL t * GTR t ---where STTAX = Storage Tank Tax GAL = Gallons of Gasoline GTR = Gasoline Tax Rate per Gallon t = Fiscal Year
Distribution Methodology GFTAX t = TAX t * 0% ---where GFTAX = General Fund Allocation of Tax TAX = Gasoline License Tax t = Fiscal Year

Legislative Fiscal Division Revenue Estimate Profile
Gasoline Tax
Revenue Estimates as adopted by the Revenue and Taxation Committee 228 November 17, 2000
t Total Tax GF Tax Gross Tax Gas Tax Tank TaxFiscal Millions Millions Millions Millions Millions
Actual 2000 130.551884 0.000000 137.379589 126.764307 3.787577Forecast 2001 132.068000 0.000000 138.932253 128.237231 3.830384Forecast 2002 133.600000 0.000000 140.502465 129.726802 3.873675Forecast 2003 135.151000 0.000000 142.090424 131.233209 3.917455
Alcohol Gas Tank Tankt Refunds Incentives Tribal Effective Effective Gallons Gallons
Fiscal Millions Millions Millions Rate Rate Millions Millions
Actual 2000 -3.267807 0.000000 -3.559898 0.267300 0.007500 499.783060 505.01027Forecast 2001 -3.304740 0.000000 -3.559898 0.267300 0.007500 505.431608 510.71789Forecast 2002 -3.342090 0.000000 -3.559898 0.267300 0.007500 511.143996 516.49003Forecast 2003 -3.379862 0.000000 -3.559898 0.267300 0.007500 516.920945 522.32740
t GF DOT FWP Snow FWP Boat Aeronautics Off HighwayFiscal Percent Percent Percent Percent Percent Percent
Actual 2000 0.0000% 98.3551% 0.4729% 0.9253% 0.0411% 0.1131%Forecast 2001 0.0000% 98.3993% 0.4607% 0.9000% 0.0400% 0.1125%Forecast 2002 0.0000% 98.3993% 0.4607% 0.9000% 0.0400% 0.1125%Forecast 2003 0.0000% 98.3993% 0.4607% 0.9000% 0.0400% 0.1125%

Legislative Fiscal Division Revenue Estimate Profile
Gasoline Tax
Revenue Estimates as adopted by the Revenue and Taxation Committee 229 November 17, 2000
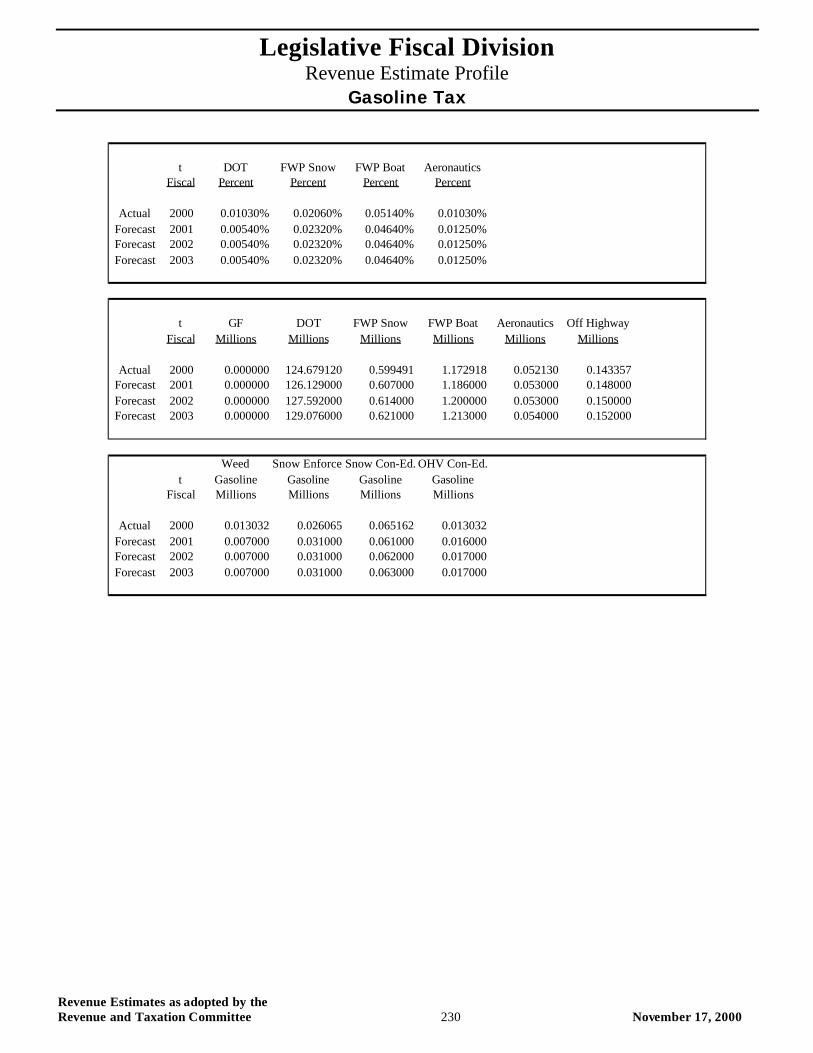
t DOT FWP Snow FWP Boat AeronauticsFiscal Percent Percent Percent Percent
Actual 2000 0.01030% 0.02060% 0.05140% 0.01030%Forecast 2001 0.00540% 0.02320% 0.04640% 0.01250%Forecast 2002 0.00540% 0.02320% 0.04640% 0.01250%Forecast 2003 0.00540% 0.02320% 0.04640% 0.01250%
t GF DOT FWP Snow FWP Boat Aeronautics Off HighwayFiscal Millions Millions Millions Millions Millions Millions
Actual 2000 0.000000 124.679120 0.599491 1.172918 0.052130 0.143357Forecast 2001 0.000000 126.129000 0.607000 1.186000 0.053000 0.148000Forecast 2002 0.000000 127.592000 0.614000 1.200000 0.053000 0.150000Forecast 2003 0.000000 129.076000 0.621000 1.213000 0.054000 0.152000
Weed Snow Enforce.Snow Con-Ed. OHV Con-Ed.t Gasoline Gasoline Gasoline Gasoline
Fiscal Millions Millions Millions Millions
Actual 2000 0.013032 0.026065 0.065162 0.013032Forecast 2001 0.007000 0.031000 0.061000 0.016000Forecast 2002 0.007000 0.031000 0.062000 0.017000Forecast 2003 0.007000 0.031000 0.063000 0.017000
Legislative Fiscal Division Revenue Estimate Profile
Gasoline Tax
Revenue Estimates as adopted by the Revenue and Taxation Committee 230 November 17, 2000
t DOT FWP Snow FWP Boat AeronauticsFiscal Percent Percent Percent Percent
Actual 2000 0.01030% 0.02060% 0.05140% 0.01030%Forecast 2001 0.00540% 0.02320% 0.04640% 0.01250%Forecast 2002 0.00540% 0.02320% 0.04640% 0.01250%Forecast 2003 0.00540% 0.02320% 0.04640% 0.01250%
t GF DOT FWP Snow FWP Boat Aeronautics Off HighwayFiscal Millions Millions Millions Millions Millions Millions
Actual 2000 0.000000 124.679120 0.599491 1.172918 0.052130 0.143357Forecast 2001 0.000000 126.129000 0.607000 1.186000 0.053000 0.148000Forecast 2002 0.000000 127.592000 0.614000 1.200000 0.053000 0.150000Forecast 2003 0.000000 129.076000 0.621000 1.213000 0.054000 0.152000
Weed Snow Enforce.Snow Con-Ed. OHV Con-Ed.t Gasoline Gasoline Gasoline Gasoline
Fiscal Millions Millions Millions Millions
Actual 2000 0.013032 0.026065 0.065162 0.013032Forecast 2001 0.007000 0.031000 0.061000 0.016000Forecast 2002 0.007000 0.031000 0.062000 0.017000Forecast 2003 0.007000 0.031000 0.063000 0.017000

Legislative Fiscal Division Revenue Estimate Profile GVW and Other Fees
Revenue Estimates as adopted by the Revenue and Taxation Committee 231 November 17, 2000
GVW and Other Fees
Revenue Description: There are two types of revenue derived from over 20 different sources classified under gross vehicle weight (GVW)and other income: fee revenue and permit revenue. The majority of revenue is derived from a variety of GVW fees, including those fees collected by counties when vehicles are registered. Miscellaneous permits comprise the second income component under this source.
Applicable Tax Rate(s): Various
Distribution: A portion of certain GVW revenue is allocated to counties when vehicles are registered by the counties, such as 5.0 percent of total GVW fees. Fees collected in accordance with regional, national or international agreements are shared with participating jurisdictions. The majority of GVW revenue, however, is allocated to the Department of Transportation. The s ingle state registration fee is deposited to the general fund.
Collection Frequency: Various
Applicable Assumptions and/or Relevant Indicators: Consumer Price Index (CPI) MT Wage & Salary Employment Growth Total Population
Data Source(s): SBAS, SABHRS, Department of Transportation
Contacts: Department of Transportation
Statute: Title 15, Chapters 24, 70 and 71; and Title 61, Chapters 3, 4 and 10, MCA
% of Total FY 2000 General Fund Revenue:
Revenue Estimate Methodology: The LFD uses a number of analytical techniques to develop relevant assumptions for this source of revenue. Historical data trends, economic conditions, input from industry experts, company surveys, and etc., are examples of information used to formulate these assumptions. The techniques used to develop these assumptions may vary from biennium to biennium and are highly dependent on availability of information, professional intuition/judgement, and a detailed analysis of the revenue source. The applicable methodology (formulas) and assumptions used by the LFD to develop a revenue estimate for this source are provided in a subsequent section of this document. The following summarizes the LFD process used to develop the revenue estimate. Each GVW fee type is calculated by applying an annual growth rate to the last known fiscal year collection amount. Total fee revenue is the result of summing the estimates for all fee types.

Legislative Fiscal Division Revenue Estimate Profile GVW and Other Fees
Revenue Estimates as adopted by the Revenue and Taxation Committee 232 November 17, 2000
Revenue Projection:
Forecast Methodology TGVW t = SUM(i=1..n) (GR t * BASE x) i ---where TGVW = Total GVW Revenue GR = Growth Rate BASE = Last Known Amount For GVW Fee Type t = Fiscal Year x = Last Completed Fiscal Year i = GVW Fee Type
Total General Fund GFFiscal Collections Collections PercentYear Millions Millions Change
A 1979 0.000000 0.000000A 1980 0.000000 0.000000 Not App.A 1981 0.000000 0.000000 Not App.A 1982 0.000000 0.000000 Not App.A 1983 0.000000 0.000000 Not App.A 1984 0.000000 0.000000 Not App.A 1985 0.000000 0.000000 Not App.A 1986 14.750038 0.000000 Not App.A 1987 14.912864 0.000000 Not App.A 1988 15.699160 0.000000 Not App.A 1989 16.197170 0.000000 Not App.A 1990 17.314355 0.000000 Not App.A 1991 16.652775 0.000000 Not App.A 1992 27.135371 0.000000 Not App.A 1993 29.201031 0.000000 Not App.A 1994 27.408456 0.000000 Not App.A 1995 28.957323 0.000000 Not App.A 1996 30.946303 1.241263 Not App.A 1997 32.207050 1.143078 -7.91%A 1998 31.303824 1.266223 10.77%A 1999 32.316004 1.332595 5.24%A 2000 35.210631 1.275935 -4.25%F 2001 33.658000 1.292000 2.04%F 2002 30.807000 1.292000 0.00%F 2003 30.960000 1.292000 0.00%
GVW and Other Fees
0
10
20
30
40
1979 1981 1983 1985 1987 1989 1991 1993 1995 1997 1999 2001 2003
Fiscal Year
Mill
ions
of
Dol
lars
Total General Fund
Legislative Fiscal Division Revenue Estimate Profile GVW and Other Fees
Revenue Estimates as adopted by the Revenue and Taxation Committee 233 November 17, 2000
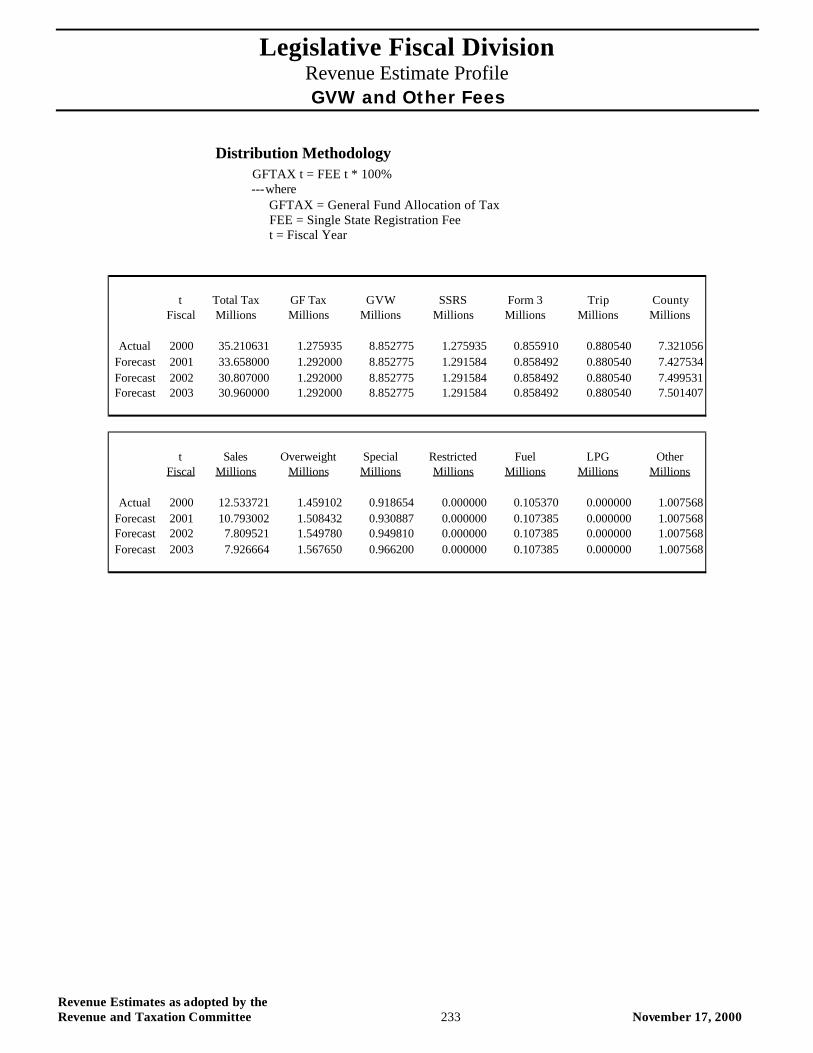
Distribution Methodology GFTAX t = FEE t * 100% ---where GFTAX = General Fund Allocation of Tax FEE = Single State Registration Fee t = Fiscal Year
t Total Tax GF Tax GVW SSRS Form 3 Trip CountyFiscal Millions Millions Millions Millions Millions Millions Millions
Actual 2000 35.210631 1.275935 8.852775 1.275935 0.855910 0.880540 7.321056Forecast 2001 33.658000 1.292000 8.852775 1.291584 0.858492 0.880540 7.427534Forecast 2002 30.807000 1.292000 8.852775 1.291584 0.858492 0.880540 7.499531Forecast 2003 30.960000 1.292000 8.852775 1.291584 0.858492 0.880540 7.501407
t Sales Overweight Special Restricted Fuel LPG OtherFiscal Millions Millions Millions Millions Millions Millions Millions
Actual 2000 12.533721 1.459102 0.918654 0.000000 0.105370 0.000000 1.007568Forecast 2001 10.793002 1.508432 0.930887 0.000000 0.107385 0.000000 1.007568Forecast 2002 7.809521 1.549780 0.949810 0.000000 0.107385 0.000000 1.007568Forecast 2003 7.926664 1.567650 0.966200 0.000000 0.107385 0.000000 1.007568

Revenue Estimates as adopted by the Revenue and Taxation Committee 234 November 17, 2000
Legislative Fiscal Division Revenue Estimate Profile
Lodging Facility Use Tax
Revenue Estimates as adopted by the Revenue and Taxation Committee 235 November 17, 2000
Lodging Facility Use Tax
Revenue Description: The state imposes a tax on room charges collected by lodging facilities. The tax only applies for rooms used for lodging. All percentage distributed tax collections (see below) are earmarked for specific purposes and are statutorily appropriated. All tax paid by state employees is returned to the fund that paid the tax. Since general fund pays a portion of the tax, a portion is returned to the general fund. This amount is accounted for in the “All Other Revenue” profile.
Applicable Tax Rate(s): The tax is 4.0 percent of room charges.
Distribution: For the 2001 biennium, the revenue is first distributed: 1) to the Department of Revenue in the amount appropriated for collection and disbursement costs; 2) to the various funds from which payment of the tax paid by state employees were made, including the general fund; and 3) $400,000 to the Montana heritage preservation and development fund which is statutorily appropriated for restoring and maintaining historic properties. After these distributions, the remainder is distributed and statutorily appropriated:
?? 67.5% to the Department of Commerce for tourism promotion and promotion of the state as a location for the production of motion pictures and television commercials.
?? 22.5% to regional nonprofit tourism corporations. ?? 6.5% to the Department of Fish, Wildlife and Parks for maintenance of state park facilities. ?? 2.5% to the university system for the establishment and maintenance of a Montana travel research program. ?? 1.0% to the Montana Historical Society to install and maintain roadside historical signs and historic sites.
For the 2003 biennium and beyond, the revenue is first distributed: 1) to the Department of Revenue in the amount appropriated for collection and disbursement costs; and 2) to the various funds from which payment of the tax paid by state employees were made, including the general fund. After these distributions, the remainder is distributed and statutorily appropriated:
?? 67.5% to the Department of Commerce for tourism promotion and promotion of the state as a location for the production of motion pictures and television commercials.
?? 22.5% to regional nonprofit tourism corporations. ?? 6.5% to the Department of Fish, Wildlife and Parks for maintenance of state park facilities. ?? 2.5% to the university system for the establishment and maintenance of a Montana travel research program. ?? 1.0% to the Montana Historical Society to install and maintain roadside historical signs and historic sites.
Collection Frequency: The owner of a facility collects the tax and remits it quarterly to the Department of Revenue.
Applicable Assumptions and/or Relevant Indicators: Inflation Consumer Price Index
Data Source(s): SBAS, SABHRS, Wharton Econometric Forecasting Associates (WEFA)
Contacts:
Statute: Title 15, Chapter 65, MCA
% of Total FY 2000 General Fund Revenue: N/A
Legislative Fiscal Division Revenue Estimate Profile
Lodging Facility Use Tax
Revenue Estimates as adopted by the Revenue and Taxation Committee 236 November 17, 2000
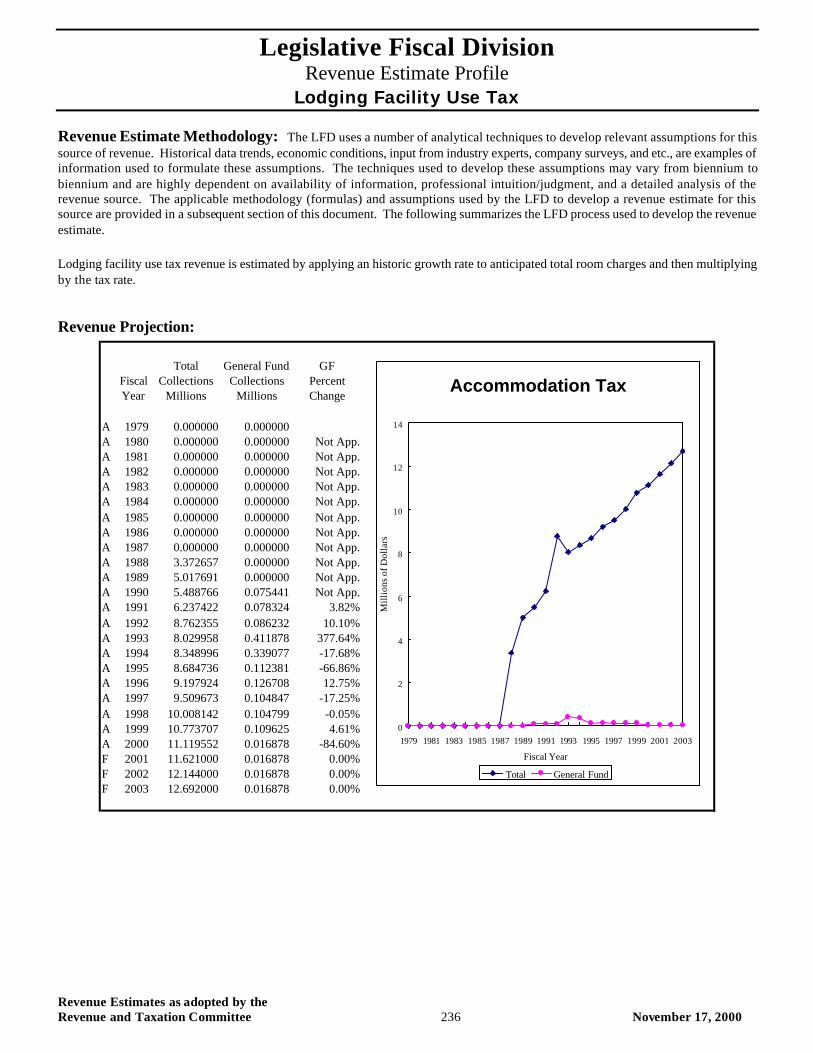
Revenue Estimate Methodology: The LFD uses a number of analytical techniques to develop relevant assumptions for this source of revenue. Historical data trends, economic conditions, input from industry experts, company surveys, and etc., are examples of information used to formulate these assumptions. The techniques used to develop these assumptions may vary from biennium to biennium and are highly dependent on availability of information, professional intuition/judgment, and a detailed analysis of the revenue source. The applicable methodology (formulas) and assumptions used by the LFD to develop a revenue estimate for this source are provided in a subsequent section of this document. The following summarizes the LFD process used to develop the revenue estimate. Lodging facility use tax revenue is estimated by applying an historic growth rate to anticipated total room charges and then multiplying by the tax rate.
Revenue Projection:
Total General Fund GFFiscal Collections Collections PercentYear Millions Millions Change
A 1979 0.000000 0.000000A 1980 0.000000 0.000000 Not App.A 1981 0.000000 0.000000 Not App.A 1982 0.000000 0.000000 Not App.A 1983 0.000000 0.000000 Not App.A 1984 0.000000 0.000000 Not App.A 1985 0.000000 0.000000 Not App.A 1986 0.000000 0.000000 Not App.A 1987 0.000000 0.000000 Not App.A 1988 3.372657 0.000000 Not App.A 1989 5.017691 0.000000 Not App.A 1990 5.488766 0.075441 Not App.A 1991 6.237422 0.078324 3.82%A 1992 8.762355 0.086232 10.10%A 1993 8.029958 0.411878 377.64%A 1994 8.348996 0.339077 -17.68%A 1995 8.684736 0.112381 -66.86%A 1996 9.197924 0.126708 12.75%A 1997 9.509673 0.104847 -17.25%A 1998 10.008142 0.104799 -0.05%A 1999 10.773707 0.109625 4.61%A 2000 11.119552 0.016878 -84.60%F 2001 11.621000 0.016878 0.00%F 2002 12.144000 0.016878 0.00%F 2003 12.692000 0.016878 0.00%
Accommodation Tax
0
2
4
6
8
10
12
14
1979 1981 1983 1985 1987 1989 1991 1993 1995 1997 1999 2001 2003
Fiscal Year
Mill
ions
of D
olla
rs
Total General Fund
Legislative Fiscal Division Revenue Estimate Profile
Lodging Facility Use Tax
Revenue Estimates as adopted by the Revenue and Taxation Committee 237 November 17, 2000
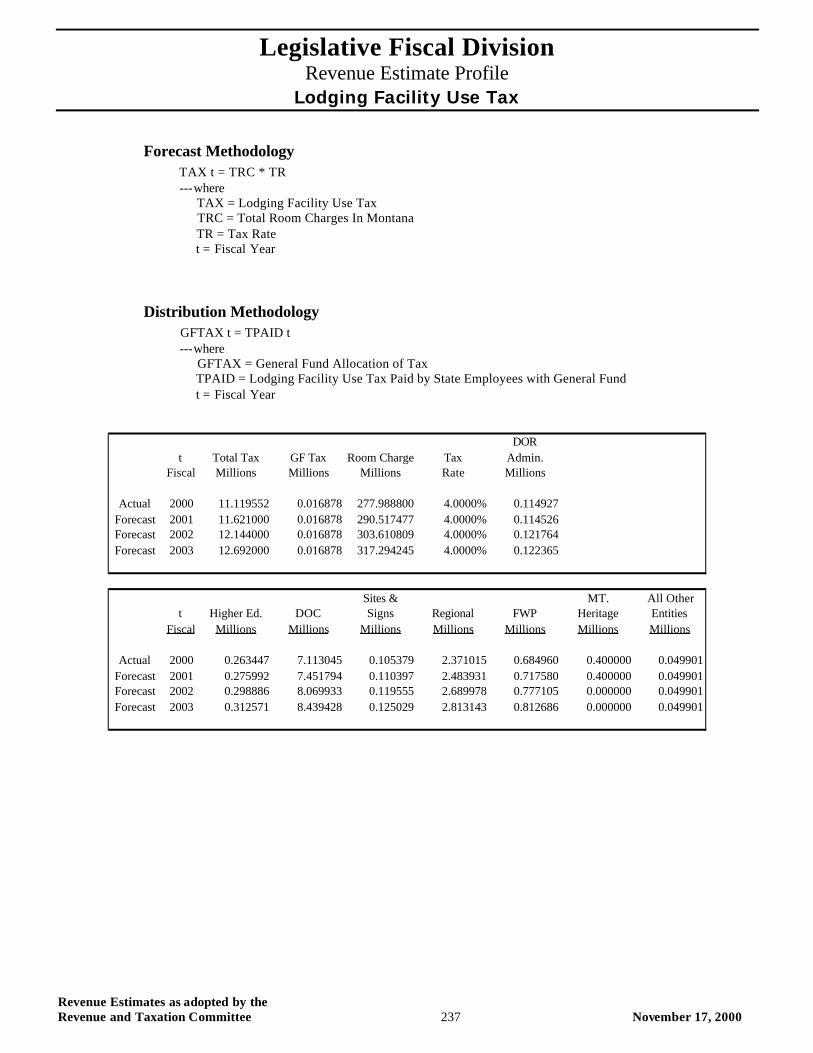
Forecast Methodology TAX t = TRC * TR ---where TAX = Lodging Facility Use Tax TRC = Total Room Charges In Montana TR = Tax Rate t = Fiscal Year
Distribution Methodology GFTAX t = TPAID t ---where GFTAX = General Fund Allocation of Tax TPAID = Lodging Facility Use Tax Paid by State Employees with General Fund t = Fiscal Year
DORt Total Tax GF Tax Room Charge Tax Admin.
Fiscal Millions Millions Millions Rate Millions
Actual 2000 11.119552 0.016878 277.988800 4.0000% 0.114927Forecast 2001 11.621000 0.016878 290.517477 4.0000% 0.114526Forecast 2002 12.144000 0.016878 303.610809 4.0000% 0.121764Forecast 2003 12.692000 0.016878 317.294245 4.0000% 0.122365
Sites & MT. All Othert Higher Ed. DOC Signs Regional FWP Heritage Entities
Fiscal Millions Millions Millions Millions Millions Millions Millions
Actual 2000 0.263447 7.113045 0.105379 2.371015 0.684960 0.400000 0.049901Forecast 2001 0.275992 7.451794 0.110397 2.483931 0.717580 0.400000 0.049901Forecast 2002 0.298886 8.069933 0.119555 2.689978 0.777105 0.000000 0.049901Forecast 2003 0.312571 8.439428 0.125029 2.813143 0.812686 0.000000 0.049901

Revenue Estimates as adopted by the Revenue and Taxation Committee 238 November 17, 2000
Legislative Fiscal Division Revenue Estimate Profile Parks Trust Interest
Revenue Estimates as adopted by the Revenue and Taxation Committee 239 November 17, 2000
Parks Trust Interest
Revenue Description: Beginning in fiscal 1976, a portion of coal severance tax revenue was deposited into the Parks Acquisition and Arts Protection trust fund. The 1991 legislature split the principal of this trust into two separate trusts, the Parks Acquisition trust (parks trust) and the Arts Protection trust, with coal severance taxes allocated to each one. The amount of 1.27 percent of coal tax revenues is statutorily allocated to the parks trust for the purpose of parks acquisition or management. Income from the parks trust must be appropriated for the acquisition, development, operation, and maintenance of state parks, state recreational areas, state monuments, and state historical sites under control of the Department of Fish, Wildlife and Parks.
Applicable Tax Rate(s): N/A
Distribution: Interest earnings on the parks trust are allocated to the Department of Fish, Wildlife, and Parks.
Collection Frequency: Monthly
Applicable Assumptions and/or Relevant Indicators: Gains and Losses Income Trust Pool Amortizations Trust Pool Accretions Board of Investments Fees Secondary Lending Income Long Term Interest Rates Short Term Interest Rates Coal Severance Tax Collections
Coal severance tax collections are estimated via the coal severance tax methodology.
Data Source(s): Board of Investments, SBAS, SABHRS, Wall Street Journal , Wharton Econometrics Forecasting Associates (WEFA)
Contacts:
Statute: Title 15, Chapter 35 and Title 23, Chapter 1, MCA
% of Total FY 2000 General Fund Revenue: N/A
Revenue Estimate Methodology: The LFD uses a number of analytical techniques to develop relevant assumptions for this source of revenue. Historical data trends, economic conditions, input from industry experts, company surveys, and etc., are examples of information used to formulate these assumptions. The techniques used to develop these assumptions may vary from biennium to biennium and are highly dependent on availability of information, professional intuition/judgment, and a detailed analysis of the revenue source. The applicable methodology (formulas) and assumptions used by the LFD to develop a revenue estimate for this source are provided in a subsequent section of this document. The following summarizes the LFD process used to develop the revenue estimate. The methodology used to forecast parks trust interest earnings is a multi-step process. In order to estimate total investment earnings for the trust, income must be calculated on three separate components: 1) parks trust pool interest; 2) interest on new deposits; and 3) short term interest earnings.
Legislative Fiscal Division Revenue Estimate Profile Parks Trust Interest
Revenue Estimates as adopted by the Revenue and Taxation Committee 240 November 17, 2000
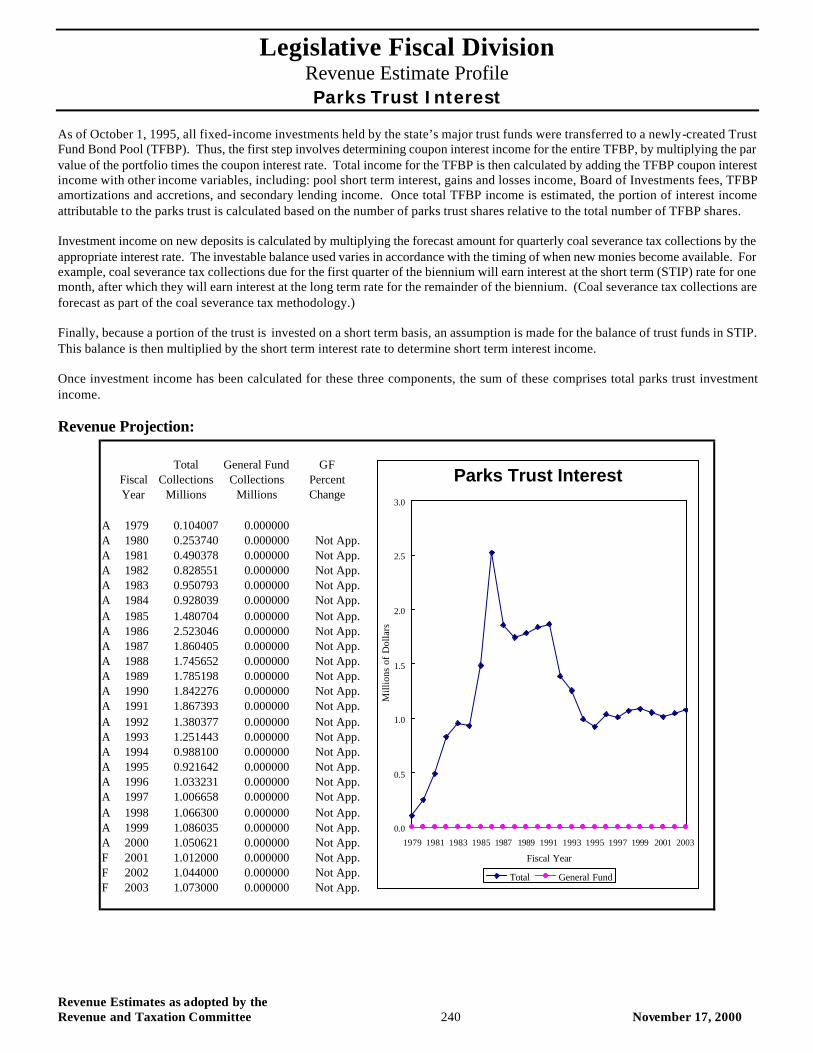
As of October 1, 1995, all fixed-income investments held by the state’s major trust funds were transferred to a newly-created Trust Fund Bond Pool (TFBP). Thus, the first step involves determining coupon interest income for the entire TFBP, by multiplying the par value of the portfolio times the coupon interest rate. Total income for the TFBP is then calculated by adding the TFBP coupon interest income with other income variables, including: pool short term interest, gains and losses income, Board of Investments fees, TFBP amortizations and accretions, and secondary lending income. Once total TFBP income is estimated, the portion of interest income attributable to the parks trust is calculated based on the number of parks trust shares relative to the total number of TFBP shares. Investment income on new deposits is calculated by multiplying the forecast amount for quarterly coal severance tax collections by the appropriate interest rate. The investable balance used varies in accordance with the timing of when new monies become available. For example, coal severance tax collections due for the first quarter of the biennium will earn interest at the short term (STIP) rate for one month, after which they will earn interest at the long term rate for the remainder of the biennium. (Coal severance tax collections are forecast as part of the coal severance tax methodology.) Finally, because a portion of the trust is invested on a short term basis, an assumption is made for the balance of trust funds in STIP. This balance is then multiplied by the short term interest rate to determine short term interest income. Once investment income has been calculated for these three components, the sum of these comprises total parks trust investment income.
Revenue Projection:
Total General Fund GFFiscal Collections Collections PercentYear Millions Millions Change
A 1979 0.104007 0.000000A 1980 0.253740 0.000000 Not App.A 1981 0.490378 0.000000 Not App.A 1982 0.828551 0.000000 Not App.A 1983 0.950793 0.000000 Not App.A 1984 0.928039 0.000000 Not App.A 1985 1.480704 0.000000 Not App.A 1986 2.523046 0.000000 Not App.A 1987 1.860405 0.000000 Not App.A 1988 1.745652 0.000000 Not App.A 1989 1.785198 0.000000 Not App.A 1990 1.842276 0.000000 Not App.A 1991 1.867393 0.000000 Not App.A 1992 1.380377 0.000000 Not App.A 1993 1.251443 0.000000 Not App.A 1994 0.988100 0.000000 Not App.A 1995 0.921642 0.000000 Not App.A 1996 1.033231 0.000000 Not App.A 1997 1.006658 0.000000 Not App.A 1998 1.066300 0.000000 Not App.A 1999 1.086035 0.000000 Not App.A 2000 1.050621 0.000000 Not App.F 2001 1.012000 0.000000 Not App.F 2002 1.044000 0.000000 Not App.F 2003 1.073000 0.000000 Not App.
Parks Trust Interest
0.0
0.5
1.0
1.5
2.0
2.5
3.0
1979 1981 1983 1985 1987 1989 1991 1993 1995 1997 1999 2001 2003
Fiscal Year
Mill
ions
of
Dol
lars
Total General Fund
Legislative Fiscal Division Revenue Estimate Profile Parks Trust Interest
Revenue Estimates as adopted by the Revenue and Taxation Committee 241 November 17, 2000
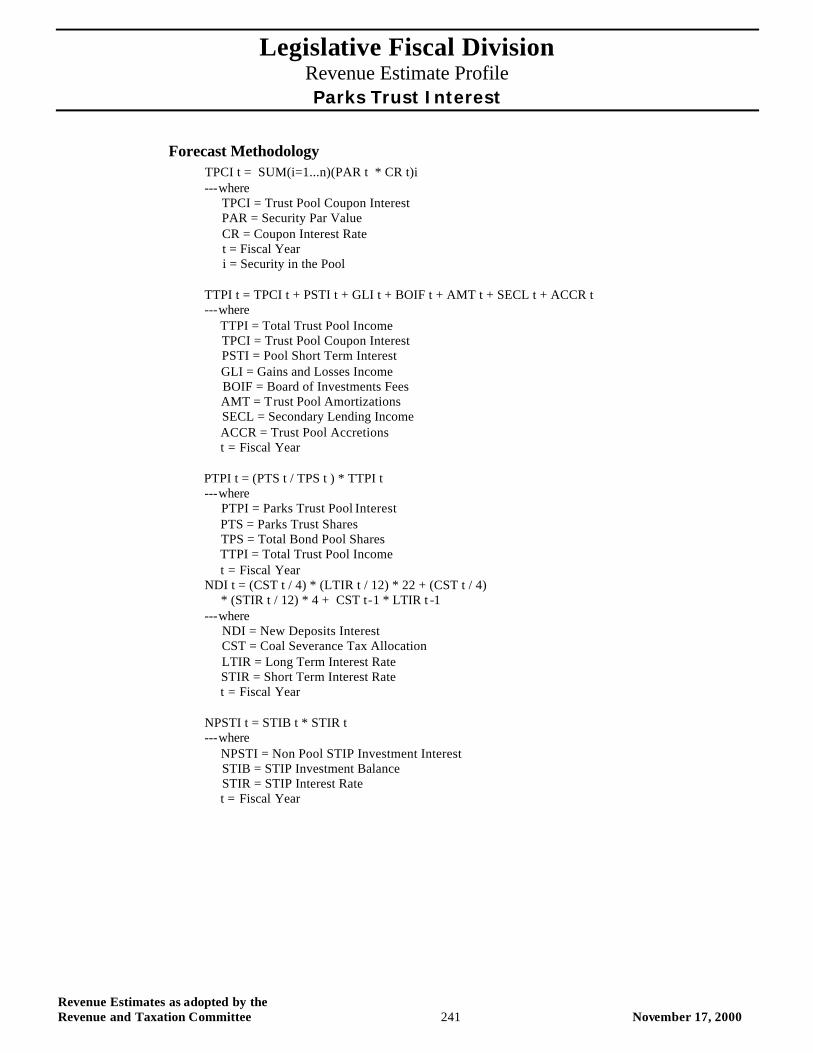
Forecast Methodology TPCI t = SUM(i=1...n)(PAR t * CR t)i ---where TPCI = Trust Pool Coupon Interest PAR = Security Par Value CR = Coupon Interest Rate t = Fiscal Year i = Security in the Pool TTPI t = TPCI t + PSTI t + GLI t + BOIF t + AMT t + SECL t + ACCR t ---where TTPI = Total Trust Pool Income TPCI = Trust Pool Coupon Interest PSTI = Pool Short Term Interest GLI = Gains and Losses Income BOIF = Board of Investments Fees AMT = Trust Pool Amortizations SECL = Secondary Lending Income ACCR = Trust Pool Accretions t = Fiscal Year PTPI t = (PTS t / TPS t ) * TTPI t ---where PTPI = Parks Trust Pool Interest PTS = Parks Trust Shares TPS = Total Bond Pool Shares TTPI = Total Trust Pool Income t = Fiscal Year NDI t = (CST t / 4) * (LTIR t / 12) * 22 + (CST t / 4) * (STIR t / 12) * 4 + CST t-1 * LTIR t -1 ---where NDI = New Deposits Interest CST = Coal Severance Tax Allocation LTIR = Long Term Interest Rate STIR = Short Term Interest Rate t = Fiscal Year NPSTI t = STIB t * STIR t ---where NPSTI = Non Pool STIP Investment Interest STIB = STIP Investment Balance STIR = STIP Interest Rate t = Fiscal Year
Legislative Fiscal Division Revenue Estimate Profile Parks Trust Interest
Revenue Estimates as adopted by the Revenue and Taxation Committee 242 November 17, 2000
TPTI t = PTPI t + NDI t + NPSTI t ---where TPTI = Total Parks Trust Interest PTPI = Parks Trust Pool Interest NDI = New Deposits Interest NPSTI = Non Pool STIP Investment Interest t = Fiscal Year
Distribution Methodology GFINT t = TPTI t * 0% ---where GFINT = General Fund Interest Earnings TPTI = Total Parks Trust Interest t = Fiscal Year
Trust Pool Other Poolt Total Rev. GF Rev. Trust Shares Total Shares Interest Income
Fiscal Millions Millions Millions Millions Millions Millions
Actual 2000 1.050621 0.000000 0.148632 11.821189 78.564737 5.084671Forecast 2001 1.012000 0.000000 0.137463 11.821189 78.564737 5.422011Forecast 2002 1.044000 0.000000 0.137463 11.821189 78.564737 5.445886Forecast 2003 1.073000 0.000000 0.137463 11.821189 78.564737 5.309712
Pool Short Gainst Term Interest Losses Fees Amortizations Lending Accretions
Fiscal Millions Millions Millions Millions Millions Millions
Actual 2000 2.402942 0.697222 -0.197184 -1.337427 0.283705 3.235413Forecast 2001 2.740282 0.697222 -0.197184 -1.337427 0.283705 3.235413Forecast 2002 2.764157 0.697222 -0.197184 -1.337427 0.283705 3.235413Forecast 2003 2.627983 0.697222 -0.197184 -1.337427 0.283705 3.235413
Net Coal Tax New Deposit Non Pool Non Pool Non Poolt New Deposit Interest Long Term STIP STIP Bal STIP Int
Fiscal Millions Millions Rate Rate Millions Millions
Actual 2000 0.450466 7.1000% 5.4350% 0.301775Forecast 2001 0.423000 0.016472 7.3690% 6.1980% 0.301775 0.018704Forecast 2002 0.430000 0.047978 7.3910% 6.2520% 0.301775 0.018867Forecast 2003 0.429000 0.079584 7.3780% 5.9440% 0.301775 0.017938
Legislative Fiscal Division Revenue Estimate Profile
Pine Hills Interest and Income
Revenue Estimates as adopted by the Revenue and Taxation Committee 243 November 17, 2000
Pine Hills Interest and Income
Revenue Description: Lands granted by the federal government to the state for the benefit of public schools and various state institutions generate income. These lands produce revenue through rents or crop shares for agricultural purposes, royalties from the sale of mineral rights, and sales of timber. Income from certain portions of public school/institution lands has been designated for the support of the Pine Hills youth correctional facility. Thus, some of these funds are deposited into a component of the trust and legacy trust fund referred to as the Pine Hills trust, which generates interest earnings for the state. As of October 1, 1995, all fixed-income investments held by the state’s major trust funds were transferred to a newly-created Trust Fund Bond Pool (TFBP). The majority of trust and legacy trust funds are invested as part of the TFBP. Some funds, however, are invested on a short term basis in the state’s Short Term Investment Pool (STIP). The state constitution prohibits the investment of any trust funds in common stock.
In accordance with statute, 3.0 percent of Pine Hills interest and income is allocated to the Department of Natural Resources and Conservation (DNRC) to be used for resource development purposes. Senate Bill 48, passed by the 1999 legislature, provides for the diversion of the following funds for the purpose of funding the Trust Land Management Division in the DNRC: 1) mineral royalties; 2) revenues from the sale of easements; and 3) 5.0 percent of interest and income previously credited to the common school trust. The amount of the money diverted from the Pine Hills trust reduces the growth of the trust fund balance and, hence, reduces the amount of distributable interest earnings.
Applicable Tax Rate(s): N/A
Distribution: Interest and income from the trust, less amounts to fund DNRC administration, is allocated to the Department of Corrections for support of the Pine Hills youth correctional facility.
Collection Frequency: Monthly
Applicable Assumptions and/or Relevant Indicators: Gains and Losses Income Trust Pool Amortizations Trust Pool Accretions Board of Investments Fees Secondary Lending Income Long Term Interest Rates Short Term Interest Rates Trust and Legacy Income
Data Source(s): Board of Investments, SBAS, SABHRS, Wall Street Journal, Wharton Econometrics Forecasting Associates (WEFA), Department of Natural Resources and Conservation
Contacts: Department of Natural Resources and Conservation
Statute: N/A
% of Total FY 2000 General Fund Revenue: N/A
Legislative Fiscal Division Revenue Estimate Profile
Pine Hills Interest and Income
Revenue Estimates as adopted by the Revenue and Taxation Committee 244 November 17, 2000
Revenue Estimate Methodology: The LFD uses a number of analytical techniques to develop relevant assumptions for this source of revenue. Historical data trends, economic conditions, input from industry experts, company surveys, and etc., are examples of information used to formulate these assumptions. The techniques used to develop these assumptions may vary from biennium to biennium and are highly dependent on availability of information, professional intuition/judgment, and a detailed analysis of the revenue source. The applicable methodology (formulas) and assumptions used by the LFD to develop a revenue estimate for this source are provided in a subsequent section of this document. The following summarizes the LFD process used to develop the revenue estimate. The methodology used to forecast Pine Hills interest and income is a multi-step process. Interest income is derived from both investment of the Pine Hills trust fund, as well as interest on land sales. In order to calculate total investment earnings for the trust, income must be calculated on three separate components: 1) trust and legacy trust pool interest; 2) interest on new deposits; and 3) short term interest earnings. The first step involves determining coupon interest income for the entire TFBP, by multiplying the par value of the portfolio times the coupon interest rate. Total income for the TFBP is then calculated by adding the TFBP coupon interest income with other income variables, including: pool short term interest, gains and losses income, Board of Investments fees, TFBP amortizations and accretions, and secondary lending income. Once total TFBP income is estimated, the portion of interest income attributable to the trust and legacy trust fund is calculated based on the number of trust and legacy shares relative to the total number of TFBP shares. Investment income on new deposits is calculated by multiplying the forecast amount for trust and legacy income (lessened by the amount to fund the Trust Land Management Division in DNRC) by the appropriate interest rate. The interest rate and investable balance used varies in accordance with the timing of when new monies become available. For example, revenues received for the first month of the biennium will earn interest at the short term (STIP) rate for one month, after which they will earn interest at the long term rate for the remainder of the biennium. In addition, because a portion of the trust is invested on a short term basis, an assumption is made for the balance of trust funds in STIP. This balance is then multiplied by the short term interest rate to determine short term interest income. Once investment income has been calculated for these three components, the sum of the three is multiplied by the percent of income attributable to the Pine Hills trust portion of the trust and legacy trust fund. This number is added to the amount of interest expected from land sales and interest on STIP investments, to comprise total Pine Hills trust interest income. Pine Hills income is estimated by computing the total of six different types of revenue: grazing fees, agricultural fees, miscellaneous fees, oil and gas leases, oil and gas penalties, and miscellaneous rentals. Once total income is determined, the 3.0 percent of revenues allocated to DNRC is calculated. Total interest and income is calculated by taking the sum of total Pine Hills income, total Pine Hills interest, and timber sale revenue, less the resource development allocation.
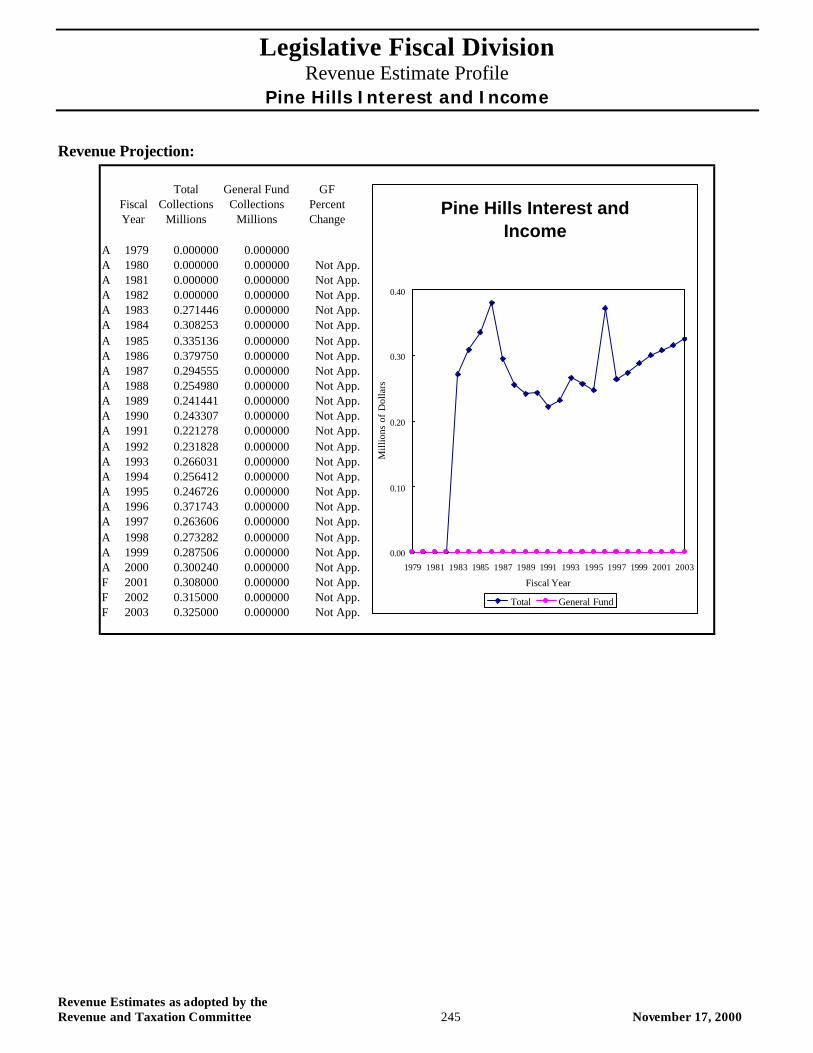
Legislative Fiscal Division Revenue Estimate Profile
Pine Hills Interest and Income
Revenue Estimates as adopted by the Revenue and Taxation Committee 245 November 17, 2000
Revenue Projection:
Total General Fund GFFiscal Collections Collections PercentYear Millions Millions Change
A 1979 0.000000 0.000000A 1980 0.000000 0.000000 Not App.A 1981 0.000000 0.000000 Not App.A 1982 0.000000 0.000000 Not App.A 1983 0.271446 0.000000 Not App.A 1984 0.308253 0.000000 Not App.A 1985 0.335136 0.000000 Not App.A 1986 0.379750 0.000000 Not App.A 1987 0.294555 0.000000 Not App.A 1988 0.254980 0.000000 Not App.A 1989 0.241441 0.000000 Not App.A 1990 0.243307 0.000000 Not App.A 1991 0.221278 0.000000 Not App.A 1992 0.231828 0.000000 Not App.A 1993 0.266031 0.000000 Not App.A 1994 0.256412 0.000000 Not App.A 1995 0.246726 0.000000 Not App.A 1996 0.371743 0.000000 Not App.A 1997 0.263606 0.000000 Not App.A 1998 0.273282 0.000000 Not App.A 1999 0.287506 0.000000 Not App.A 2000 0.300240 0.000000 Not App.F 2001 0.308000 0.000000 Not App.F 2002 0.315000 0.000000 Not App.F 2003 0.325000 0.000000 Not App.
Pine Hills Interest and Income
0.00
0.10
0.20
0.30
0.40
1979 1981 1983 1985 1987 1989 1991 1993 1995 1997 1999 2001 2003
Fiscal Year
Mill
ions
of
Dol
lars
Total General Fund

Legislative Fiscal Division Revenue Estimate Profile
Pine Hills Interest and Income
Revenue Estimates as adopted by the Revenue and Taxation Committee 246 November 17, 2000
Forecast Methodology TPCI t = SUM(i=1...n)(PAR t * CR t)i ---where TPCI = Trust Pool Coupon Interest PAR = Security Par Value CR = Coupon Interest Rate t = Fiscal Year i = Security in the Pool TTPI t = TPCI t + PSTI t + GLI t + BOIF t + AMT t + SECL t + ACCR t ---where TTPI = Total Trust Pool Income TPCI = Trust Pool Coupon Interest PSTI = Pool Short Term Interest GLI = Gains and Losses Income BOIF = Board of Investments Fees AMT = Trust Pool Amortizations SECL = Secondary Lending Income ACCR = Trust Pool Accretions t = Fiscal Year TLPI t = (TLTS t / TPS t ) * TTPI t ---where TLPI = Trust & Legacy Pool Interest TLTS = Trust & Legacy Trust Shares TPS = Total Bond Pool Shares TTPI = Total Trust Pool Income t = Fiscal Year NDI t = (TLI t / 12) * (LTIR t / 12) * 62 + (TLI t / 12) * STIR t + TLI t -1 * LTIR t-1 ---where NDI = New Deposits Interest (Less Funding for the Trust Land Management Division) TLI = Trust and Legacy Income LTIR = Long Term Interest Rate STIR = Short Term Interest Rate t = Fiscal Year NPSTI t = STIB t * STIR t ---where NPSTI = Non Pool STIP Investment Interest STIB = STIP Investment Balance STIR = STIP Interest Rate t = Fiscal Year
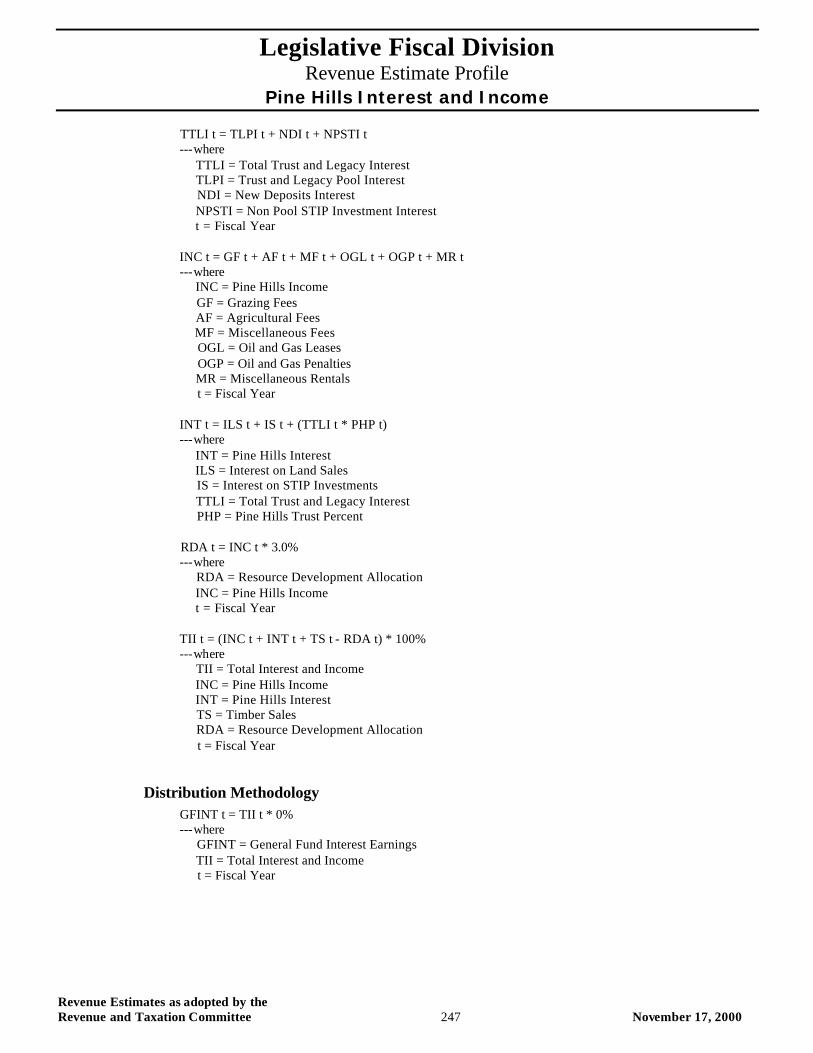
Legislative Fiscal Division Revenue Estimate Profile
Pine Hills Interest and Income
Revenue Estimates as adopted by the Revenue and Taxation Committee 247 November 17, 2000
TTLI t = TLPI t + NDI t + NPSTI t ---where TTLI = Total Trust and Legacy Interest TLPI = Trust and Legacy Pool Interest NDI = New Deposits Interest NPSTI = Non Pool STIP Investment Interest t = Fiscal Year INC t = GF t + AF t + MF t + OGL t + OGP t + MR t ---where INC = Pine Hills Income GF = Grazing Fees AF = Agricultural Fees MF = Miscellaneous Fees OGL = Oil and Gas Leases OGP = Oil and Gas Penalties MR = Miscellaneous Rentals t = Fiscal Year INT t = ILS t + IS t + (TTLI t * PHP t) ---where INT = Pine Hills Interest ILS = Interest on Land Sales IS = Interest on STIP Investments TTLI = Total Trust and Legacy Interest PHP = Pine Hills Trust Percent RDA t = INC t * 3.0% ---where RDA = Resource Development Allocation INC = Pine Hills Income t = Fiscal Year TII t = (INC t + INT t + TS t - RDA t) * 100% ---where TII = Total Interest and Income INC = Pine Hills Income INT = Pine Hills Interest TS = Timber Sales RDA = Resource Development Allocation t = Fiscal Year
Distribution Methodology GFINT t = TII t * 0% ---where GFINT = General Fund Interest Earnings TII = Total Interest and Income t = Fiscal Year
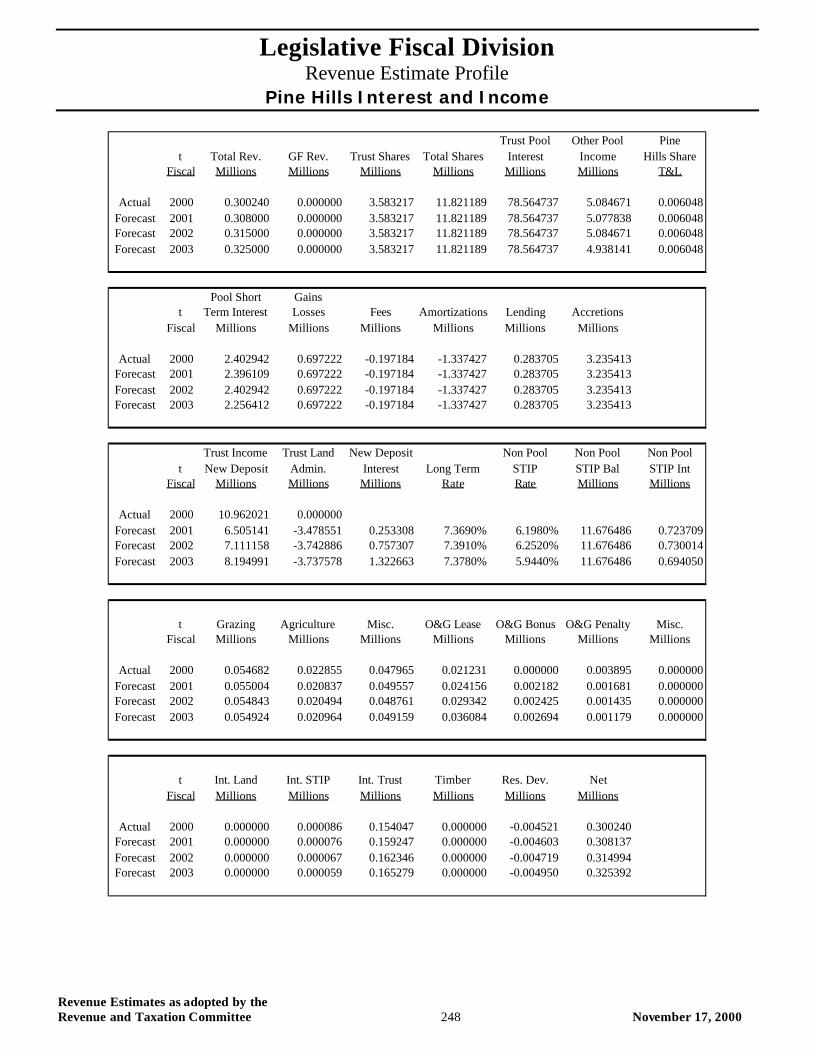
Legislative Fiscal Division Revenue Estimate Profile
Pine Hills Interest and Income
Revenue Estimates as adopted by the Revenue and Taxation Committee 248 November 17, 2000
Trust Pool Other Pool Pinet Total Rev. GF Rev. Trust Shares Total Shares Interest Income Hills Share
Fiscal Millions Millions Millions Millions Millions Millions T&L
Actual 2000 0.300240 0.000000 3.583217 11.821189 78.564737 5.084671 0.006048Forecast 2001 0.308000 0.000000 3.583217 11.821189 78.564737 5.077838 0.006048Forecast 2002 0.315000 0.000000 3.583217 11.821189 78.564737 5.084671 0.006048Forecast 2003 0.325000 0.000000 3.583217 11.821189 78.564737 4.938141 0.006048
Pool Short Gainst Term Interest Losses Fees Amortizations Lending Accretions
Fiscal Millions Millions Millions Millions Millions Millions
Actual 2000 2.402942 0.697222 -0.197184 -1.337427 0.283705 3.235413Forecast 2001 2.396109 0.697222 -0.197184 -1.337427 0.283705 3.235413Forecast 2002 2.402942 0.697222 -0.197184 -1.337427 0.283705 3.235413Forecast 2003 2.256412 0.697222 -0.197184 -1.337427 0.283705 3.235413
Trust Income Trust Land New Deposit Non Pool Non Pool Non Poolt New Deposit Admin. Interest Long Term STIP STIP Bal STIP Int
Fiscal Millions Millions Millions Rate Rate Millions Millions
Actual 2000 10.962021 0.000000Forecast 2001 6.505141 -3.478551 0.253308 7.3690% 6.1980% 11.676486 0.723709Forecast 2002 7.111158 -3.742886 0.757307 7.3910% 6.2520% 11.676486 0.730014Forecast 2003 8.194991 -3.737578 1.322663 7.3780% 5.9440% 11.676486 0.694050
t Grazing Agriculture Misc. O&G Lease O&G Bonus O&G Penalty Misc.Fiscal Millions Millions Millions Millions Millions Millions Millions
Actual 2000 0.054682 0.022855 0.047965 0.021231 0.000000 0.003895 0.000000Forecast 2001 0.055004 0.020837 0.049557 0.024156 0.002182 0.001681 0.000000Forecast 2002 0.054843 0.020494 0.048761 0.029342 0.002425 0.001435 0.000000Forecast 2003 0.054924 0.020964 0.049159 0.036084 0.002694 0.001179 0.000000
t Int. Land Int. STIP Int. Trust Timber Res. Dev. NetFiscal Millions Millions Millions Millions Millions Millions
Actual 2000 0.000000 0.000086 0.154047 0.000000 -0.004521 0.300240Forecast 2001 0.000000 0.000076 0.159247 0.000000 -0.004603 0.308137Forecast 2002 0.000000 0.000067 0.162346 0.000000 -0.004719 0.314994Forecast 2003 0.000000 0.000059 0.165279 0.000000 -0.004950 0.325392
Legislative Fiscal Division Revenue Estimate Profile Property Tax: 6 Mill
Revenue Estimates as adopted by the Revenue and Taxation Committee 249 November 17, 2000
Property Tax 6 Mill
Revenue Description: Montana law requires all counties to levy 6 mill university levy for deposit in a state special revenue account to be used for revenue to fund the university system. This levy is voted by voters statewide every ten years.
Taxable value is defined as the market value of statutorily defined property times a statutory tax rate. Property valued at market value includes personal property, utility property, railroad and airline property, livestock, and mineral net and gross proceeds. Property valued at assessed value includes residential and commercial real estate, agricultural land and timberland. Residential and commercial real estate, agricultural land and timberland were reappraised in tax year 1997. SB184, passed during the 1999 session, required that appraised values be phased-in over four years. At the same time, a homestead exemption was created and phased-in for residential real estate, and a homestead exemption was phased-in for commercial real estate. In addition, the tax rates for residential and commercial real estate, agricultural and timberland are being phased-in. Agricultural land and timberland are valued on a productivity basis. The revenue from the property tax depends on the underlying value of the property, legislated tax rates, as well as state and local mill levies. In addition to the tax on property, this revenue component includes collections from "non-levy" sources that are distributed on the basis of mills levied by taxing jurisdictions. These non-levy sources include the local share of the oil and gas production tax (formerly the local government severance tax and net proceeds tax), vehicle fees, coal gross proceeds taxes, the local share of the state corporation license taxes, and other smaller revenue sources. In addition, the 6 mill account receives statutory reimbursements from the general fund for shortfalls in revenue attributable to SB184 and SB260 (1999 session).
Applicable Tax Rate(s): Varies according to property classification.
Distribution: All property tax receipts are deposited into the general fund, except revenue associated with the university and welfare levy.
Collection Frequency: Monthly with significant state deposits in December and June.
Applicable Assumptions and/or Relevant Indicators:
Statewide Taxable Value Vehicle Taxes Coal Gross Proceeds Tax Collections Corporation License Tax Collections Natural Gas and Oil Production Tax Collections Personal Property Tax Reimbursements Total Federal Forest Receipts Other Non-Levy Receipts
Revenue collections for these sources are calculated under individual, separate processes.

Legislative Fiscal Division Revenue Estimate Profile Property Tax: 6 Mill
Revenue Estimates as adopted by the Revenue and Taxation Committee 250 November 17, 2000
Data Source(s): Department of Revenue (DOR), Office of Public Instruction (OPI), County Assessor Offices, Montana Association of Counties (MACO)
Contacts: Department of Revenue
Statute: Title 15, Chapter 6, MCA
% of Total FY 2000 General Fund Revenue: 0.00 %
Revenue Estimate Methodology: The LFD uses a number of analytical techniques to develop relevant assumptions for this source of revenue. Historical data trends, economic conditions, input from industry experts, company surveys, and etc., are examples of information used to formulate these assumptions. The techniques used to develop these assumptions may vary from biennium to biennium and are highly dependent on availability of information, professional intuition/judgment, and a detailed analysis of the revenue source. The applicable methodology (formulas) and assumptions used by the LFD to develop a revenue estimate for this source are provided in a subsequent section of this document. The following summarizes the LFD process used to develop the revenue estimate. The first step in estimating property tax revenue requires calculating total statewide taxable value. This is done by taking the sum of all taxable value by class, each adjusted by a growth rate and adding taxable value abatements. According to state law the six mill tax base is not adjusted by the value of tax increment financing district (TIF) value, unlike the other property mill levies. The estimates for the growth of taxable value in residential and commercial real estate, agricultural and timberland include the phasing in of reappraisal, the phasing in of assessed value exemptions, and the phasing in of tax rate reductions. In addition, an adjustment of 3.9 percent per year to the taxable value of residential and commercial real estate is made to adjust for the addition of new property to the tax base. The next step involves estimating total non-levy revenue. The various components used in doing this calculation include: corporation income tax on financial institutes, motor vehicle tax, natural gas and oil production tax, coal gross proceeds, personal property reimbursements, and other revenue. Each of these variables is multiplied by the applicable allocation percent and the sum of those figures provides the estimate for total non-levy revenue. The applicable percentage is based on the ratio of the applicable state mill levy divided by the total mills assessed. Total 6 mill property tax revenue is calculated by first taking the total statewide taxable value times 6 mills. That figure is then added to the estimates for total non-levy revenue. Other adjustments attributable to changes in legislation are factored in.

Legislative Fiscal Division Revenue Estimate Profile Property Tax: 6 Mill
Revenue Estimates as adopted by the Revenue and Taxation Committee 251 November 17, 2000
Revenue Projection:
Total General Fund GFFiscal Collections Collections PercentYear Millions Millions Change
A 1979 0.000000 0.000000A 1980 0.000000 0.000000 Not App.A 1981 0.000000 0.000000 Not App.A 1982 0.000000 0.000000 Not App.A 1983 0.000000 0.000000 Not App.A 1984 0.000000 0.000000 Not App.A 1985 0.000000 0.000000 Not App.A 1986 0.000000 0.000000 Not App.A 1987 0.000000 0.000000 Not App.A 1988 0.000000 0.000000 Not App.A 1989 0.000000 0.000000 Not App.A 1990 13.474561 0.000000 Not App.A 1991 12.496650 0.000000 Not App.A 1992 13.617908 0.000000 Not App.A 1993 14.043891 0.000000 Not App.A 1994 13.216589 0.000000 Not App.A 1995 13.205272 0.000000 Not App.A 1996 14.303006 0.000000 Not App.A 1997 14.403716 0.000000 Not App.A 1998 14.702250 0.000000 Not App.A 1999 14.833917 0.000000 Not App.A 2000 13.189138 0.000000 Not App.F 2001 12.483843 0.000000 Not App.F 2002 11.889000 0.000000 Not App.F 2003 12.092000 0.000000 Not App.
Property Tax: 6 Mill
0
5
10
15
20
1979 1981 1983 1985 1987 1989 1991 1993 1995 1997 1999 2001 2003
Fiscal Year
Mill
ions
of D
olla
rs
Total General Fund

Legislative Fiscal Division Revenue Estimate Profile Property Tax: 6 Mill
Revenue Estimates as adopted by the Revenue and Taxation Committee 252 November 17, 2000
Forecast Methodology TVAL t = Sum(i=1...n)(CLSS t)i * GRT it + ABAT t + LEG t ---where TVAL = Statewide Taxable Value CLSS = Taxable Value by Class GRT it = Growth Rate for Each Class ABAT = Taxable Value Abatement LEG t = Legislation Impacts t = Fiscal Year i = Property Class NLR ts = CIT t * APER its + VT t * APER its + OGT t * APER its +CGP t *APER its +PPR t *APER its +OTH t *APER its ---where NLR = Non Levy Revenue CIT = Corporation Income Tax VT = Vehicle Tax OGT = Oil and Gas Tax CGP = Coal Gross Proceeds PPR = Personal Property Reimbursement OTH = Other Revenue APER = Allocation Percent t = Fiscal Year i = Non Levy Tax Source s = State Mill Levy TTAX t = MILLS t * TVAL t + NLR ts + ADJ t ---where TTAX = Total Property Tax MILLS = 6 Mills / 1000 TVAL = Statewide Taxable Value NLR = Non Levy Revenue ADJ = Legislation t = Fiscal Year s = State Mill Levy
Distribution Methodology GFTAX t = TTAX t * 0% ---where GFTAX = General Fund Allocation of Tax TTAX = Total Property Tax t = Fiscal Year
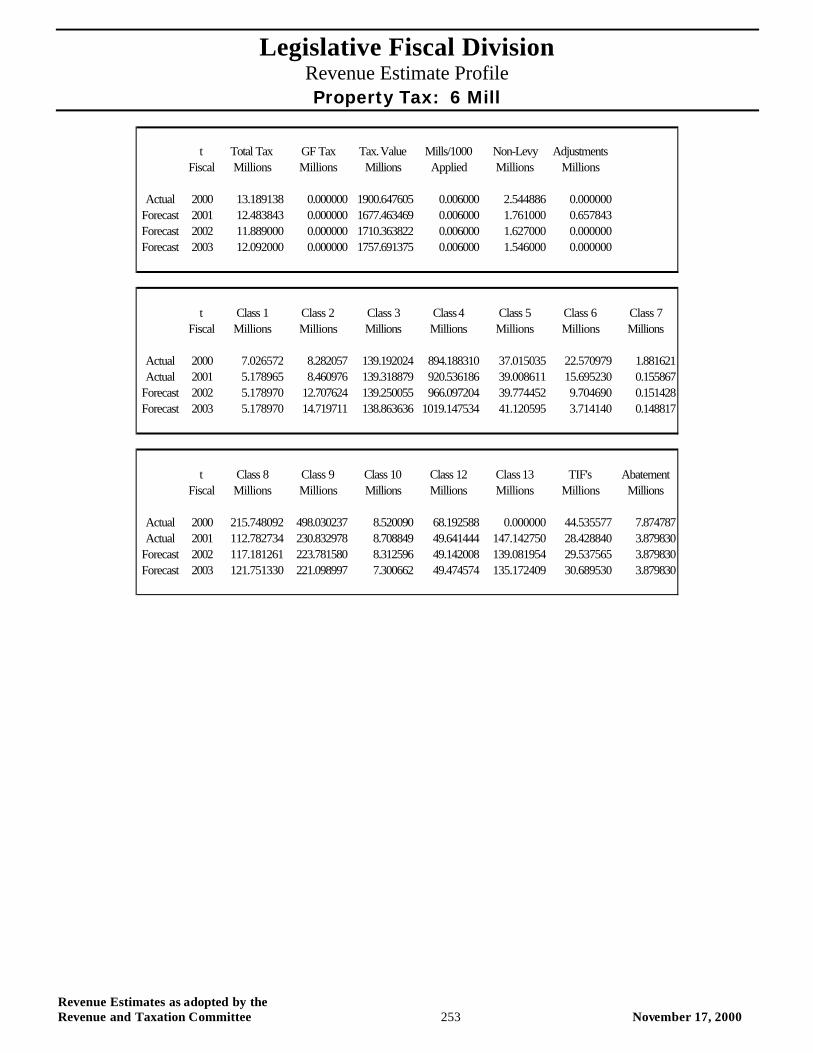
Legislative Fiscal Division Revenue Estimate Profile Property Tax: 6 Mill
Revenue Estimates as adopted by the Revenue and Taxation Committee 253 November 17, 2000
t Total Tax GF Tax Tax. Value Mills/1000 Non-Levy AdjustmentsFiscal Millions Millions Millions Applied Millions Millions
Actual 2000 13.189138 0.000000 1900.647605 0.006000 2.544886 0.000000Forecast 2001 12.483843 0.000000 1677.463469 0.006000 1.761000 0.657843Forecast 2002 11.889000 0.000000 1710.363822 0.006000 1.627000 0.000000Forecast 2003 12.092000 0.000000 1757.691375 0.006000 1.546000 0.000000
t Class 1 Class 2 Class 3 Class 4 Class 5 Class 6 Class 7Fiscal Millions Millions Millions Millions Millions Millions Millions
Actual 2000 7.026572 8.282057 139.192024 894.188310 37.015035 22.570979 1.881621Actual 2001 5.178965 8.460976 139.318879 920.536186 39.008611 15.695230 0.155867
Forecast 2002 5.178970 12.707624 139.250055 966.097204 39.774452 9.704690 0.151428Forecast 2003 5.178970 14.719711 138.863636 1019.147534 41.120595 3.714140 0.148817
t Class 8 Class 9 Class 10 Class 12 Class 13 TIF's AbatementFiscal Millions Millions Millions Millions Millions Millions Millions
Actual 2000 215.748092 498.030237 8.520090 68.192588 0.000000 44.535577 7.874787Actual 2001 112.782734 230.832978 8.708849 49.641444 147.142750 28.428840 3.879830
Forecast 2002 117.181261 223.781580 8.312596 49.142008 139.081954 29.537565 3.879830Forecast 2003 121.751330 221.098997 7.300662 49.474574 135.172409 30.689530 3.879830

Revenue Estimates as adopted by the Revenue and Taxation Committee 254 November 17, 2000

Legislative Fiscal Division Revenue Estimate Profile
Property Tax: 9 Mill
Revenue Estimates as adopted by the Revenue and Taxation Committee 255 November 17, 2000
Property Tax 9 Mill
Revenue Description: Montana law authorizes 12 counties to levy 9 mill university levy for deposit in a state special revenue account to be used for revenue to fund welfare expenditures in the 12 counties.
Taxable value is defined as the market value of statutorily defined property times a statutory tax rate. Property valued at market value includes personal property, utility property, railroad and airline property, livestock, and mineral net and gross proceeds. Property valued at assessed value includes residential and commercial real estate, agricultural land and timberland. Residential and commercial real estate, agricultural land and timberland were reappraised in tax year 1997. SB184, passed during the 1999 session, required that appraised values be phased-in over four years. At the same time, a homestead exemption was created and phased-in for residential real estate, and a homestead exemption was phased-in for commercial real estate. In addition, the tax rates for residential and commercial real estate, agricultural and timberland are being phased-in. Agricultural land and timberland are valued on a productivity basis. The revenue from the 9 mill property tax depends on the underlying value of the property and legislated tax rates. In addition to the tax on property, this revenue component includes collections from "non-levy" sources that are distributed on the basis of mills levied by taxing jurisdictions. These non-levy sources include the local share of the oil and gas production tax (formerly the local government severance tax and net proceeds tax), vehicle fees, coal gross proceeds taxes, the local share of the state corporation license taxes, and other smaller revenue sources. In addition, the 9 mill account receives statutory reimbursements from the general fund for shortfalls in revenue attributable to SB184 and SB260 (1999 session).
Applicable Tax Rate(s): Varies according to property classification.
Distribution: All property tax receipts are deposited into the general fund, except revenue associated with the university and welfare levy.
Collection Frequency: Monthly with significant state deposits in December and June.
Applicable Assumptions and/or Relevant Indicators:
Statewide Taxable Value Vehicle Taxes Coal Gross Proceeds Tax Collections Corporation License Tax Collections Natural Gas and Oil Production Tax Collections Personal Property Tax Reimbursements Total Federal Forest Receipts Other Non-Levy Receipts
Revenue collections for these sources are calculated under individual, separate processes.

Legislative Fiscal Division Revenue Estimate Profile
Property Tax: 9 Mill
Revenue Estimates as adopted by the Revenue and Taxation Committee 256 November 17, 2000
Data Source(s): Department of Revenue (DOR), Office of Public Instruction (OPI), County Assessor Offices, Montana Association of Counties (MACO)
Contacts: Department of Revenue
Statute: Title 15, Chapter 6, MCA
% of Total FY 2000 General Fund Revenue: 0%
Revenue Estimate Methodology: The LFD uses a number of analytical techniques to develop relevant assumptions for this source of revenue. Historical data trends, economic conditions, input from industry experts, company surveys, and etc., are examples of information used to formulate these assumptions. The techniques used to develop these assumptions may vary from biennium to biennium and are highly dependent on availability of information, professional intuition/judgment, and a detailed analysis of the revenue source. The applicable methodology (formulas) and assumptions used by the LFD to develop a revenue estimate for this source are provided in a subsequent section of this document. The following summarizes the LFD process used to develop the revenue estimate. The first step in estimating property tax revenue requires calculating total 12 county taxable value. This is done by taking the sum of all taxable value by class in each county, each adjusted by a growth rate, subtracting taxable value for Tax Increment Financing Districts and adding taxable value abatements. The estimates for the growth of taxable value in residential and commercial real estate, agricultural and timberland include the phasing in of reappraisal, the phasing in of assessed value exemptions, and the phasing in of tax rate reductions. In addition, an adjustment of 3.9 percent per year to the taxable value of residential and commercial real estate is made to adjust for the addition of new property to the tax base. The next step involves estimating total non-levy revenue. The various components used in doing this calculation include: corporation income tax on financial institutes, motor vehicle tax, natural gas and oil production tax, coal gross proceeds, personal property reimbursements, and other revenue. Each of these variables is multiplied by the applicable allocation percent and the sum of those figures provides the estimate for total non-levy revenue. The applicable percentage is based on the ratio of the applicable state mill levy divided by the total mills assessed. Total 9 mill property tax revenue is calculated by first taking the total taxable value in the 12 counties less adjustments for tax increment financing districts taxable value plus abatement taxable value times 9 mills. That figure is then added to the estimates for total non-levy revenue. Other adjustments attributable to changes in legislation are factored in.

Legislative Fiscal Division Revenue Estimate Profile
Property Tax: 9 Mill
Revenue Estimates as adopted by the Revenue and Taxation Committee 257 November 17, 2000
Revenue Projection:
Total General Fund GFFiscal Collections Collections PercentYear Millions Millions Change
A 1979 0.000000 0.000000A 1980 0.000000 0.000000 Not App.A 1981 0.000000 0.000000 Not App.A 1982 0.000000 0.000000 Not App.A 1983 0.000000 0.000000 Not App.A 1984 0.000000 0.000000 Not App.A 1985 0.000000 0.000000 Not App.A 1986 0.000000 0.000000 Not App.A 1987 0.000000 0.000000 Not App.A 1988 0.000000 0.000000 Not App.A 1989 0.000000 0.000000 Not App.A 1990 6.907000 0.000000 Not App.A 1991 7.029997 0.000000 Not App.A 1992 7.518660 0.000000 Not App.A 1993 9.171339 0.000000 Not App.A 1994 7.003999 0.000000 Not App.A 1995 6.883058 0.000000 Not App.A 1996 6.820641 0.000000 Not App.A 1997 7.941091 0.000000 Not App.A 1998 7.509524 0.000000 Not App.A 1999 8.072360 0.000000 Not App.A 2000 8.481136 0.000000 Not App.F 2001 6.418000 0.000000 Not App.F 2002 6.512000 0.000000 Not App.F 2003 6.660000 0.000000 Not App.
Property Tax: 9 Mill
0
1
2
3
4
5
6
7
8
9
10
1979 1981 1983 1985 1987 1989 1991 1993 1995 1997 1999 2001 2003
Fiscal Year
Mill
ions
of
Dol
lars
Total General Fund

Legislative Fiscal Division Revenue Estimate Profile
Property Tax: 9 Mill
Revenue Estimates as adopted by the Revenue and Taxation Committee 258 November 17, 2000
Forecast Methodology TVAL t = Sum(i=1...n)(CLSS t)i * GRT it - TIF t + ABAT t ---where TVAL = Statewide Taxable Value CLSS = Taxable Value by Class GRT t = Growth Rate for Each Class TIF = Tax Increment Financing District Taxable Value ABAT = Taxable Value Abatement t = Fiscal Year i = Property Class NLR ts = CIT t * APER its + VT t * APER its + OGT t * APER its +CGP t *APER its +PPR t *APER its +OTH t *APER its ---where NLR = Non Levy Revenue CIT = Corporation Income Tax VT = Vehicle Tax OGT = Oil and Gas Tax CGP = Coal Gross Proceeds PPR = Personal Property Reimbursement OTH = Other Revenue APER = Allocation Percent t = Fiscal Year i = Non Levy Tax Source s = State Mill Levy TTAX t = MILLS t * TVAL t + NLR ts + ADJ t ---where TTAX = Total Property Tax MILLS = 9 Mills / 1000 TVAL = 12 counties Taxable Value NLR = Non Levy Revenue ADJ = Legislation t = Fiscal Year s = State Mill Levy
Distribution Methodology GFTAX t = TTAX t * 0% ---where GFTAX = General Fund Allocation of Tax TTAX = Total Property Tax t = Fiscal Year
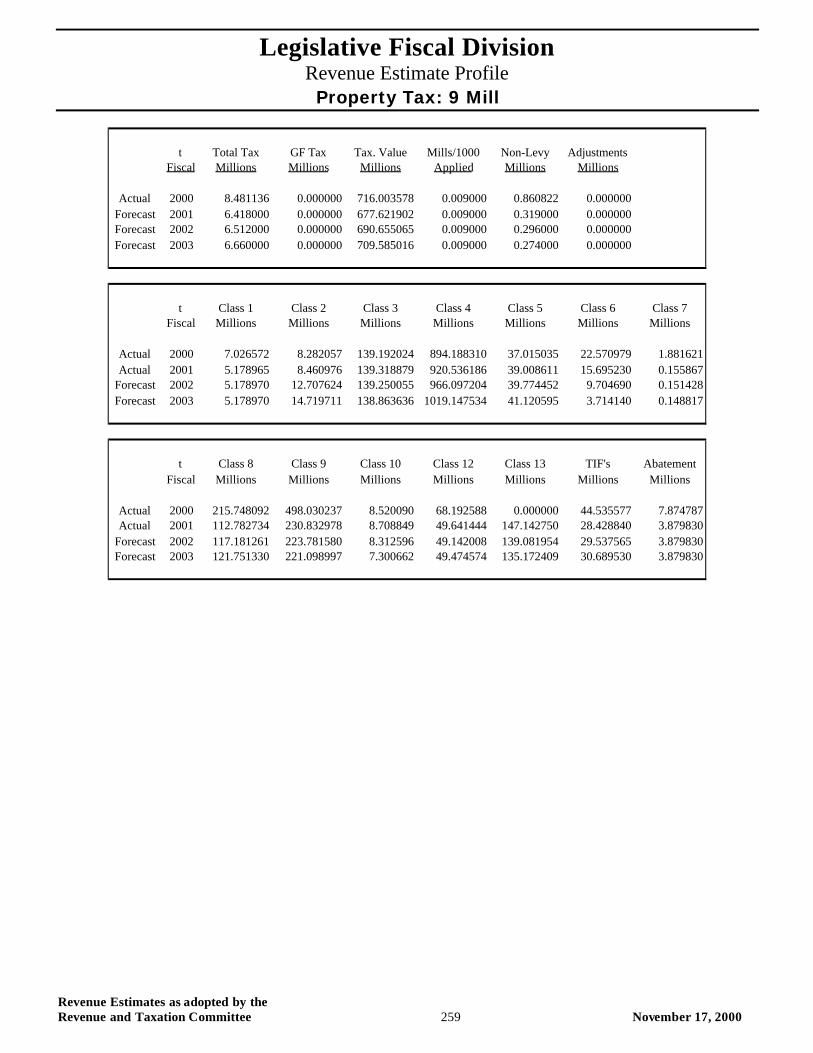
Legislative Fiscal Division Revenue Estimate Profile
Property Tax: 9 Mill
Revenue Estimates as adopted by the Revenue and Taxation Committee 259 November 17, 2000
t Total Tax GF Tax Tax. Value Mills/1000 Non-Levy AdjustmentsFiscal Millions Millions Millions Applied Millions Millions
Actual 2000 8.481136 0.000000 716.003578 0.009000 0.860822 0.000000Forecast 2001 6.418000 0.000000 677.621902 0.009000 0.319000 0.000000Forecast 2002 6.512000 0.000000 690.655065 0.009000 0.296000 0.000000Forecast 2003 6.660000 0.000000 709.585016 0.009000 0.274000 0.000000
t Class 1 Class 2 Class 3 Class 4 Class 5 Class 6 Class 7Fiscal Millions Millions Millions Millions Millions Millions Millions
Actual 2000 7.026572 8.282057 139.192024 894.188310 37.015035 22.570979 1.881621Actual 2001 5.178965 8.460976 139.318879 920.536186 39.008611 15.695230 0.155867
Forecast 2002 5.178970 12.707624 139.250055 966.097204 39.774452 9.704690 0.151428Forecast 2003 5.178970 14.719711 138.863636 1019.147534 41.120595 3.714140 0.148817
t Class 8 Class 9 Class 10 Class 12 Class 13 TIF's AbatementFiscal Millions Millions Millions Millions Millions Millions Millions
Actual 2000 215.748092 498.030237 8.520090 68.192588 0.000000 44.535577 7.874787Actual 2001 112.782734 230.832978 8.708849 49.641444 147.142750 28.428840 3.879830
Forecast 2002 117.181261 223.781580 8.312596 49.142008 139.081954 29.537565 3.879830Forecast 2003 121.751330 221.098997 7.300662 49.474574 135.172409 30.689530 3.879830

Revenue Estimates as adopted by the Revenue and Taxation Committee 260 November 17, 2000

Legislative Fiscal Division Revenue Estimate Profile
Resource Indemnity Tax
Revenue Estimates as adopted by the Revenue and Taxation Committee 261 November 17, 2000
Resource Indemnity Tax
Revenue Description: The state imposes a resource indemnity and ground water assessment (RIGWA) tax on the gross value of coal, as well as most minerals, excluding metals. The RIGWA tax on oil and gas is a portion of the oil and natural gas production tax discussed in the general fund section. The RIGWA tax on all other production is specific to each resource as described below.
Applicable Tax Rate(s): The applicable rates are as follows:
Coal: $25 plus 0.4% of the gross value of coal produced in the preceding year in excess of $6,250 Minerals: $25 plus 0.5% of the gross value of minerals (not including metals) produced in the preceding year in excess of $5,000 Talc: $25 plus 0.4% of the gross value of talc produced in the preceding year in excess of $625 Vermiculite: $25 plus 2.0% of the gross value of vermiculite produced in the preceding year in excess of $1,250 Limestone: $25 plus 10.0% of the gross value of limestone produced in the preceding year in excess of $250 Garnets: $25 plus 1.0% of the gross value of garnets produced in the preceding year in excess of $2,500
Distribution: Prior to the resource indemnity trust (RIT) reaching a $100 million balance, 50 percent of RIGWA tax proceeds are deposited each year in the RIT and $300,000 each year is deposited in the ground water assessment account. The remainder of RIGWA tax proceeds are distributed as follows:
50.0% to the orphan share account 50.0% to the reclamation and development grants account
After the RIT balance reaches a $100 million, $366,000 each year of RIGWA tax proceeds are deposited in the ground water assessment account. The remainder of RIGWA tax is distributed as follows:
50.0% to the orphan share account 50.0% to the reclamation and development grants account
Collection Frequency: Annually: The tax is paid on or before March 31 of the year following the production year.
Applicable Assumptions and/or Relevant Indicators: Montana Coal Production Montana Coal Price Montana Mineral Production Montana Mineral Price Montana Oil Production Montana Oil Price Montana Natural Gas Production Montana Natural Gas Price
Data Source(s): Department of Revenue, Surveys of Various Companies
Contacts: Department of Revenue
Statute: Title 15, Chapter 38, MCA
% of Total FY 2000 General Fund Revenue: N/A
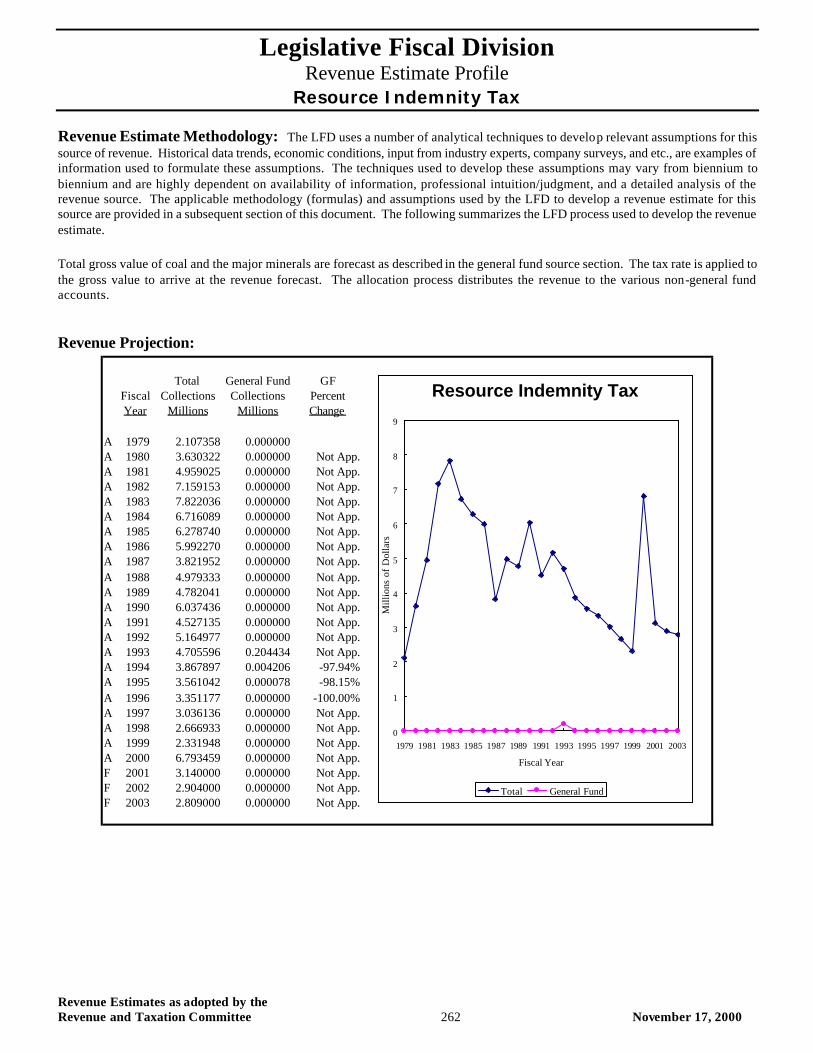
Legislative Fiscal Division Revenue Estimate Profile
Resource Indemnity Tax
Revenue Estimates as adopted by the Revenue and Taxation Committee 262 November 17, 2000
Revenue Estimate Methodology: The LFD uses a number of analytical techniques to develop relevant assumptions for this source of revenue. Historical data trends, economic conditions, input from industry experts, company surveys, and etc., are examples of information used to formulate these assumptions. The techniques used to develop these assumptions may vary from biennium to biennium and are highly dependent on availability of information, professional intuition/judgment, and a detailed analysis of the revenue source. The applicable methodology (formulas) and assumptions used by the LFD to develop a revenue estimate for this source are provided in a subsequent section of this document. The following summarizes the LFD process used to develop the revenue estimate. Total gross value of coal and the major minerals are forecast as described in the general fund source section. The tax rate is applied to the gross value to arrive at the revenue forecast. The allocation process distributes the revenue to the various non-general fund accounts.
Revenue Projection:
Total General Fund GFFiscal Collections Collections PercentYear Millions Millions Change
A 1979 2.107358 0.000000A 1980 3.630322 0.000000 Not App.A 1981 4.959025 0.000000 Not App.A 1982 7.159153 0.000000 Not App.A 1983 7.822036 0.000000 Not App.A 1984 6.716089 0.000000 Not App.A 1985 6.278740 0.000000 Not App.A 1986 5.992270 0.000000 Not App.A 1987 3.821952 0.000000 Not App.A 1988 4.979333 0.000000 Not App.A 1989 4.782041 0.000000 Not App.A 1990 6.037436 0.000000 Not App.A 1991 4.527135 0.000000 Not App.A 1992 5.164977 0.000000 Not App.A 1993 4.705596 0.204434 Not App.A 1994 3.867897 0.004206 -97.94%A 1995 3.561042 0.000078 -98.15%A 1996 3.351177 0.000000 -100.00%A 1997 3.036136 0.000000 Not App.A 1998 2.666933 0.000000 Not App.A 1999 2.331948 0.000000 Not App.A 2000 6.793459 0.000000 Not App.F 2001 3.140000 0.000000 Not App.F 2002 2.904000 0.000000 Not App.F 2003 2.809000 0.000000 Not App.
Resource Indemnity Tax
0
1
2
3
4
5
6
7
8
9
1979 1981 1983 1985 1987 1989 1991 1993 1995 1997 1999 2001 2003
Fiscal Year
Mill
ions
of
Dol
lars
Total General Fund
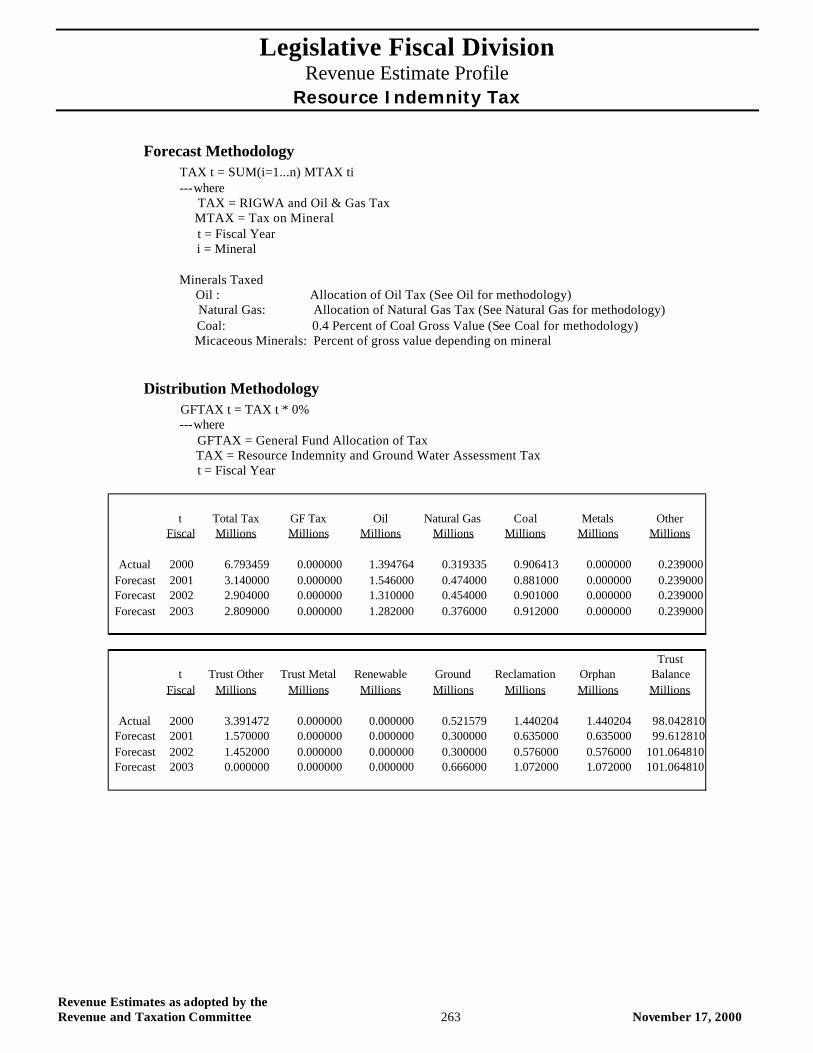
Legislative Fiscal Division Revenue Estimate Profile
Resource Indemnity Tax
Revenue Estimates as adopted by the Revenue and Taxation Committee 263 November 17, 2000
Forecast Methodology TAX t = SUM(i=1...n) MTAX ti ---where TAX = RIGWA and Oil & Gas Tax MTAX = Tax on Mineral t = Fiscal Year i = Mineral Minerals Taxed Oil : Allocation of Oil Tax (See Oil for methodology) Natural Gas: Allocation of Natural Gas Tax (See Natural Gas for methodology) Coal: 0.4 Percent of Coal Gross Value (See Coal for methodology) Micaceous Minerals: Percent of gross value depending on mineral
Distribution Methodology GFTAX t = TAX t * 0% ---where GFTAX = General Fund Allocation of Tax TAX = Resource Indemnity and Ground Water Assessment Tax t = Fiscal Year
t Total Tax GF Tax Oil Natural Gas Coal Metals OtherFiscal Millions Millions Millions Millions Millions Millions Millions
Actual 2000 6.793459 0.000000 1.394764 0.319335 0.906413 0.000000 0.239000Forecast 2001 3.140000 0.000000 1.546000 0.474000 0.881000 0.000000 0.239000Forecast 2002 2.904000 0.000000 1.310000 0.454000 0.901000 0.000000 0.239000Forecast 2003 2.809000 0.000000 1.282000 0.376000 0.912000 0.000000 0.239000
Trustt Trust Other Trust Metal Renewable Ground Reclamation Orphan Balance
Fiscal Millions Millions Millions Millions Millions Millions Millions
Actual 2000 3.391472 0.000000 0.000000 0.521579 1.440204 1.440204 98.042810Forecast 2001 1.570000 0.000000 0.000000 0.300000 0.635000 0.635000 99.612810Forecast 2002 1.452000 0.000000 0.000000 0.300000 0.576000 0.576000 101.064810Forecast 2003 0.000000 0.000000 0.000000 0.666000 1.072000 1.072000 101.064810

Revenue Estimates as adopted by the Revenue and Taxation Committee 264 November 17, 2000
Legislative Fiscal Division Revenue Estimate Profile
Resource Indemnity Trust Interest
Revenue Estimates as adopted by the Revenue and Taxation Committee 265 November 17, 2000
Resource Indemnity Trust Interest
Revenue Description: Article IX, Section 2 of the Montana Constitution and Title 15, Chapter 38, MCA, require that certain resource extraction taxes, as determined by the legislature, be placed in a trust. The principal of the Resource Indemnity Trust (RIT) "shall forever remain inviolate in an amount of one hundred million dollars ($100,000,000), guaranteed by the state against loss or diversion." Once the principal of the trust reaches $100.0 million, any additional tax deposits may be appropriated. Interest earnings on the RIT are to be spent to improve the total environment and rectify damage to the environment. It is also the legislature’s intent that interest earnings not be appropriated for general operating expenses of state agencies. Currently, the RIT receives revenue from the resource indemnity and ground water assessment tax and the oil and gas tax. These allocations of revenue will terminate July 1 of the first year following the date that the Governor by executive order certifies to the Secretary of State that the RIT balance has reached $100 million. Revenue estimates show this occurring July of 2002. Therefore, the trust balance will remain constant and interest earnings dependent only on the interest rates.
Applicable Tax Rate(s): N/A
Distribution: Statute allocates RIT interest earnings in the following manner for the 2003 biennium through the 2009 biennium:
1) at the beginning of the biennium, an amount not to exceed $175,000 to the environmental contingency fund to bring the balance up to $750,000. Money in this account is statutorily appropriated for unanticipated public needs arising from certain disasters and emergencies, which may be used upon authorization of the Governor. 2) at the beginning of the biennium, an amount not to exceed $50,000 to the oil and gas mitigation account to bring the balance up to $200,000. Money in this account is s tatutorily appropriated to the Board of Oil and Gas Conservation for the cost of plugging wells that have been abandoned and for which no responsible party can be found. 3) at the beginning of the biennium, $500,000 to the water storage state special revenue account to provide loans and grants for water storage projects 4) $2.0 million annually to the renewable resource grant and loan program state special revenue account for distribution as grants 5) $1.5 million annually to the reclamation and development grant state special revenue account for distribution as grants 6) $500,000 annually to the future fisheries program for bull trout and cutthroat trout recovery. 7) $300,000 annually to the ground water assessment account to improve ground water management and protection 8) $240,000 annually to MSU Northern for the environmental science-water quality instructional programs. This amount is statutorily appropriated. 9) Of the remaining RIT interest earnings: a) 30.0 percent goes to the renewable resource grant and loan account for program and administrative costs; b) 35.0 percent goes to the reclamation and development grant account for program and administrative costs; c) 26.0 percent goes to the hazardous waste/CERCLA account for superfund activities; and d) 9.0 percent goes to the environmental quality protection fund for additional clean-up activities.
The Department of Natural Resources and Conservation administers two of the RIT interest accounts which are used for grants, loans, and administrative costs: the renewable resource grant and loan program account and the reclamation and development grant account. These accounts also receive funding from other sources. All grants and loans made from these accounts require legislative approval. Grants must also be appropriated.
Collection Frequency: Monthly
Applicable Assumptions and/or Relevant Indicators: Gains and Losses Income Trust Pool Amortizations Trust Pool Accretions Board of Investments Fees Secondary Lending Income Long Term Interest Rates Short Term Interest Rates RIGWA Tax Collections Oil and Natural Gas Tax Collections
Legislative Fiscal Division Revenue Estimate Profile
Resource Indemnity Trust Interest
Revenue Estimates as adopted by the Revenue and Taxation Committee 266 November 17, 2000
RIGWA, oil, and natural gas tax collections are estimated under separate methodologies.
Data Source(s): Board of Investments, SBAS, SABHRS, Wall Street Journal, Wharton Econometrics Forecasting Associates (WEFA)
Contacts:
Statute: Title 15, Chapter 38, MCA
% of Total FY 2000 General Fund Revenue: N/A
Revenue Estimate Methodology: The LFD uses a number of analytical techniques to develop relevant assumptions for this source of revenue. Historical data trends, economic conditions, input from industry experts, company surveys, and etc., are examples of information used to formulate these assumptions. The techniques used to develop these assumptions may vary from biennium to biennium and are highly dependent on availability of information, professional intuition/judgement, and a detailed analysis of the revenue source. The applicable methodology (formulas) and assumptions used by the LFD to develop a revenue estimate for this source are provided in a subsequent section of this document. The following summarizes the LFD process used to develop the revenue estimate. The methodology used to forecast RIT interest earnings is a multi-step process. In order to estimate total investment earnings for the trust, income must be calculated on three separate components: 1) RIT pool interest; 2) interest on new deposits; and 3) short term interest earnings. As of October 1, 1995, all fixed-income investments held by the state’s major trust funds were transferred to a newly-created Trust Fund Bond Pool (TFBP). Thus, the first step involves determining coupon interest income for the entire TFBP, by multiplying the par value of the portfolio times the coupon interest rate. Total income for the TFBP is then calculated by adding the TFBP coupon interest income with other income variables, including: pool short term interest, gains and losses income, Board of Investments fees, TFBP amortizations and accretions, and secondary lending income. Once total TFBP income is estimated, the portion of interest income attributable to the RIT is calculated based on the number of RIT fund shares relative to the total number of TFBP shares. Investment income on new deposits is calculated by multiplying the forecast amount for resource indemnity and groundwater assessment (RIGWA) tax, and oil and gas tax collections, by the appropriate interest rate. The investable balance used varies in accordance with the timing of when new monies become available. For example, RIGWA, oil and gas tax collections due for the first quarter of the biennium will earn interest at the short term (STIP) rate for one month, after which they will earn interest at the long term rate for the remainder of the biennium. (These various tax collections are forecast under separate methodologies.) Finally, because a portion of the trust is invested on a short term basis, an assumption is made for the balance of trust funds in STIP. This balance is then multiplied by the short term interest rate to determine short term interest income.

Legislative Fiscal Division Revenue Estimate Profile
Resource Indemnity Trust Interest
Revenue Estimates as adopted by the Revenue and Taxation Committee 267 November 17, 2000
Revenue Projection:
Forecast Methodology TPCI t = SUM(i=1...n)(PAR t * CR t)i ---where TPCI = Trust Pool Coupon Interest PAR = Security Par Value CR = Coupon Interest Rate t = Fiscal Year i = Security in the Pool
Total General Fund GFFiscal Collections Collections PercentYear Millions Millions Change
A 1979 0.908982 0.000000A 1980 1.175530 0.000000 Not App.A 1981 1.607667 0.000000 Not App.A 1982 2.294265 0.000000 Not App.A 1983 3.789855 0.000000 Not App.A 1984 4.225130 0.000000 Not App.A 1985 5.526373 0.000000 Not App.A 1986 6.487967 0.000000 Not App.A 1987 7.208545 0.000000 Not App.A 1988 6.149783 0.000000 Not App.A 1989 6.858164 0.000000 Not App.A 1990 7.316096 0.000000 Not App.A 1991 8.260874 0.000000 Not App.A 1992 8.245914 0.000000 Not App.A 1993 8.715126 0.000000 Not App.A 1994 8.239056 0.000000 Not App.A 1995 6.380294 0.000000 Not App.A 1996 7.959843 0.000000 Not App.A 1997 7.318083 0.000000 Not App.A 1998 7.555620 0.000000 Not App.A 1999 1.948278 0.000000 Not App.A 2000 9.184060 0.000000 Not App.F 2001 7.467000 0.000000 Not App.F 2002 7.582000 0.000000 Not App.F 2003 7.609000 0.000000 Not App.
RIT Trust Interest
0
1
2
3
4
5
6
7
8
9
10
1979 1981 1983 1985 1987 1989 1991 1993 1995 1997 1999 2001 2003
Fiscal Year
Mill
ions
of
Dol
lars
Total General Fund
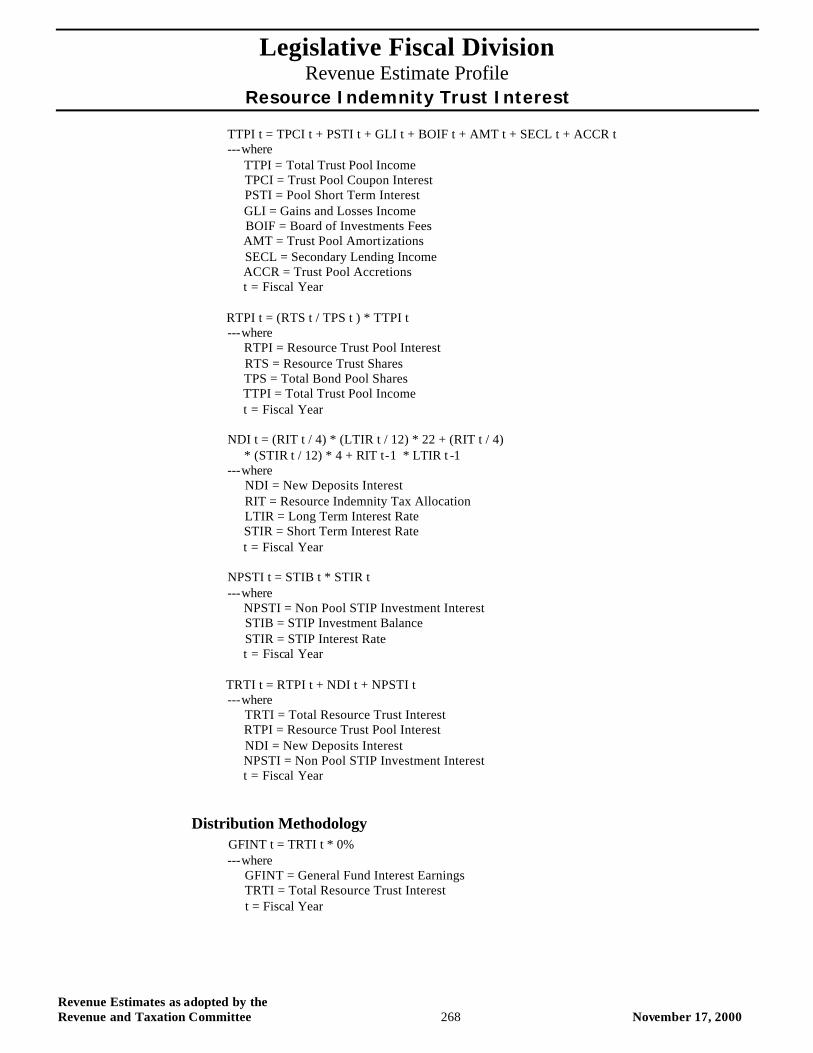
Legislative Fiscal Division Revenue Estimate Profile
Resource Indemnity Trust Interest
Revenue Estimates as adopted by the Revenue and Taxation Committee 268 November 17, 2000
TTPI t = TPCI t + PSTI t + GLI t + BOIF t + AMT t + SECL t + ACCR t ---where TTPI = Total Trust Pool Income TPCI = Trust Pool Coupon Interest PSTI = Pool Short Term Interest GLI = Gains and Losses Income BOIF = Board of Investments Fees AMT = Trust Pool Amortizations SECL = Secondary Lending Income ACCR = Trust Pool Accretions t = Fiscal Year RTPI t = (RTS t / TPS t ) * TTPI t ---where RTPI = Resource Trust Pool Interest RTS = Resource Trust Shares TPS = Total Bond Pool Shares TTPI = Total Trust Pool Income t = Fiscal Year NDI t = (RIT t / 4) * (LTIR t / 12) * 22 + (RIT t / 4) * (STIR t / 12) * 4 + RIT t-1 * LTIR t -1 ---where NDI = New Deposits Interest RIT = Resource Indemnity Tax Allocation LTIR = Long Term Interest Rate STIR = Short Term Interest Rate t = Fiscal Year NPSTI t = STIB t * STIR t ---where NPSTI = Non Pool STIP Investment Interest STIB = STIP Investment Balance STIR = STIP Interest Rate t = Fiscal Year TRTI t = RTPI t + NDI t + NPSTI t ---where TRTI = Total Resource Trust Interest RTPI = Resource Trust Pool Interest NDI = New Deposits Interest NPSTI = Non Pool STIP Investment Interest t = Fiscal Year
Distribution Methodology GFINT t = TRTI t * 0% ---where GFINT = General Fund Interest Earnings TRTI = Total Resource Trust Interest t = Fiscal Year
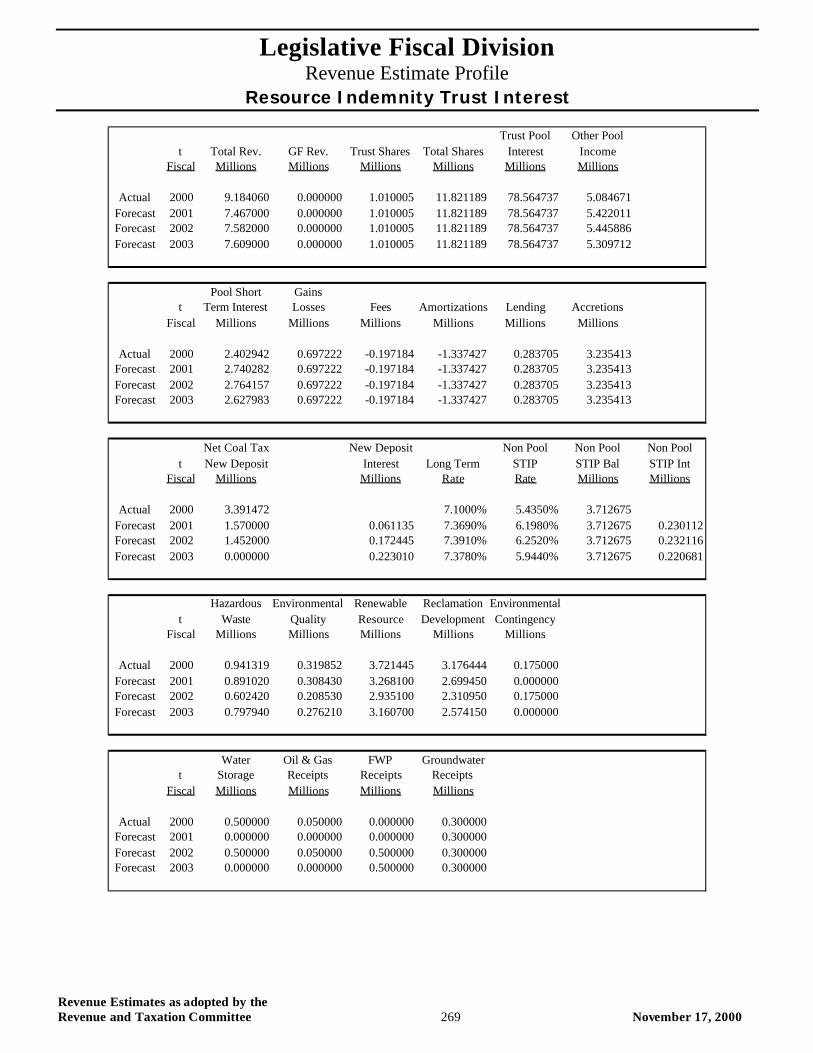
Legislative Fiscal Division Revenue Estimate Profile
Resource Indemnity Trust Interest
Revenue Estimates as adopted by the Revenue and Taxation Committee 269 November 17, 2000
Trust Pool Other Poolt Total Rev. GF Rev. Trust Shares Total Shares Interest Income
Fiscal Millions Millions Millions Millions Millions Millions
Actual 2000 9.184060 0.000000 1.010005 11.821189 78.564737 5.084671Forecast 2001 7.467000 0.000000 1.010005 11.821189 78.564737 5.422011Forecast 2002 7.582000 0.000000 1.010005 11.821189 78.564737 5.445886Forecast 2003 7.609000 0.000000 1.010005 11.821189 78.564737 5.309712
Pool Short Gainst Term Interest Losses Fees Amortizations Lending Accretions
Fiscal Millions Millions Millions Millions Millions Millions
Actual 2000 2.402942 0.697222 -0.197184 -1.337427 0.283705 3.235413Forecast 2001 2.740282 0.697222 -0.197184 -1.337427 0.283705 3.235413Forecast 2002 2.764157 0.697222 -0.197184 -1.337427 0.283705 3.235413Forecast 2003 2.627983 0.697222 -0.197184 -1.337427 0.283705 3.235413
Net Coal Tax New Deposit Non Pool Non Pool Non Poolt New Deposit Interest Long Term STIP STIP Bal STIP Int
Fiscal Millions Millions Rate Rate Millions Millions
Actual 2000 3.391472 7.1000% 5.4350% 3.712675Forecast 2001 1.570000 0.061135 7.3690% 6.1980% 3.712675 0.230112Forecast 2002 1.452000 0.172445 7.3910% 6.2520% 3.712675 0.232116Forecast 2003 0.000000 0.223010 7.3780% 5.9440% 3.712675 0.220681
Hazardous Environmental Renewable Reclamation Environmentalt Waste Quality Resource Development Contingency
Fiscal Millions Millions Millions Millions Millions
Actual 2000 0.941319 0.319852 3.721445 3.176444 0.175000Forecast 2001 0.891020 0.308430 3.268100 2.699450 0.000000Forecast 2002 0.602420 0.208530 2.935100 2.310950 0.175000Forecast 2003 0.797940 0.276210 3.160700 2.574150 0.000000
Water Oil & Gas FWP Groundwatert Storage Receipts Receipts Receipts
Fiscal Millions Millions Millions Millions
Actual 2000 0.500000 0.050000 0.000000 0.300000Forecast 2001 0.000000 0.000000 0.000000 0.300000Forecast 2002 0.500000 0.050000 0.500000 0.300000Forecast 2003 0.000000 0.000000 0.500000 0.300000

Revenue Estimates as adopted by the Revenue and Taxation Committee 270 November 17, 2000
Legislative Fiscal Division Revenue Estimate Profile
Treasure State Endowment Trust Interest
Revenue Estimates as adopted by the Revenue and Taxation Committee 271 November 17, 2000
Treasure State Endowment Trust Interest
Revenue Description: In the June 1992 election, voters approved a referendum to create the Treasure State Endowment Fund (TSEF) within the permanent coal tax trust fund. The TSEF received a $10.0 million grant from the permanent trust principal in fiscal 1994 and receives 37.5 percent of total coal severance tax collections from July 1999 through June 2013. Interest earned on the TSEF is used to finance local infrastructure projects, as prioritized by the Departments of Commerce and Natural Resources and Conservation and authorized by the legislature via the Treasure State Endowment Program (TSEP).
Applicable Tax Rate(s): N/A
Distribution: Interest earnings are allocated to the Department of Commerce to fund TSEP.
Collection Frequency: Monthly
Applicable Assumptions and/or Relevant Indicators: Gains and Losses Income Trust Pool Amortizations Trust Pool Accretions Board of Investments Fees Secondary Lending Income Long Term Interest Rates Short Term Interest Rates Coal Severance Tax Collections
Coal severance tax collections are estimated via the coal severance tax methodology.
Data Source(s): Board of Investments, SBAS, SABHRS, Wall Street Journal, Wharton Econometrics Forecasting Associates (WEFA)
Contacts:
Statute: Title 15, Chapter 35; Title 17, Chapter 5; and Title 90, Chapter 6, MCA
% of Total FY 2000 General Fund Revenue: N/A
Revenue Estimate Methodology: The LFD uses a number of analytical techniques to develop relevant assumptions for this source of revenue. Historical data trends, economic conditions, input from industry experts, company surveys, and etc., are examples of information used to formulate these assumptions. The techniques used to develop these assumptions may vary from biennium to biennium and are highly dependent on availability of information, professional intuition/judgement, and a detailed analysis of the revenue source. The applicable methodology (formulas) and assumptions used by the LFD to develop a revenue estimate for this source are provided in a subsequent section of this document. The following summarizes the LFD process used to develop the revenue estimate. The methodology used to forecast TSEF interest earnings is a multi-step process. In order to estimate total investment earnings for the trust, income must be calculated on three separate components: 1) TSEF pool interest; 2) interest on new deposits; and 3) short term interest earnings.
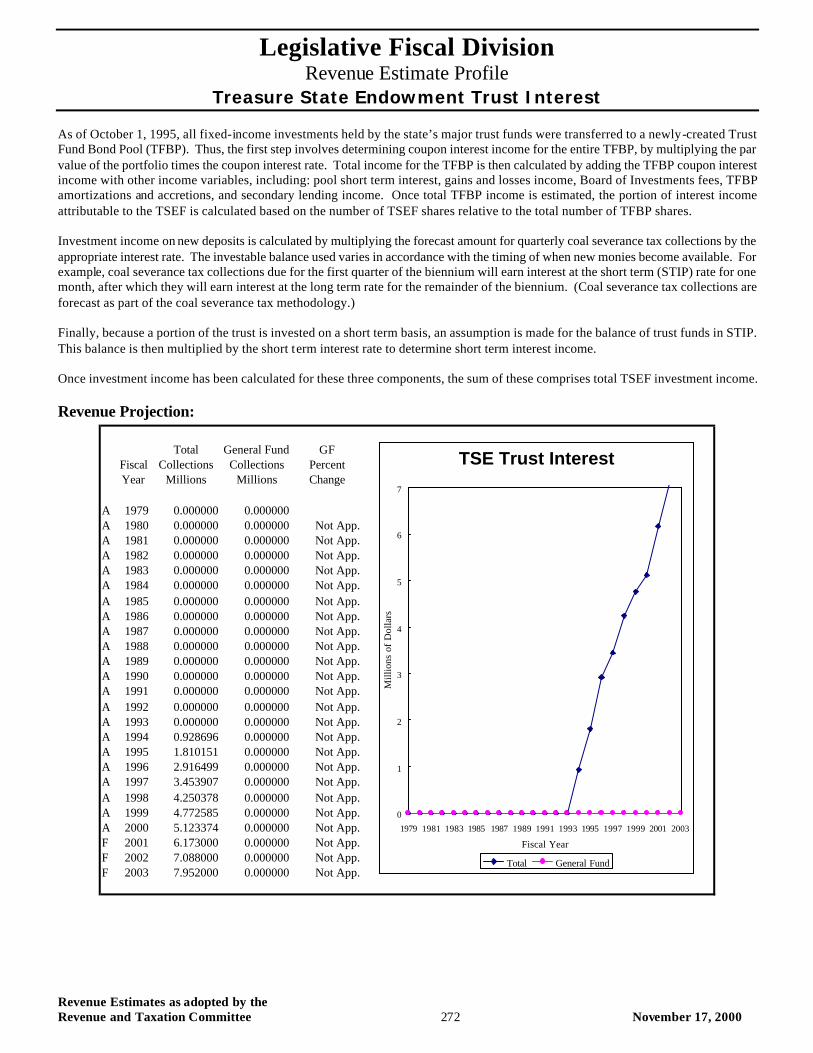
Legislative Fiscal Division Revenue Estimate Profile
Treasure State Endowment Trust Interest
Revenue Estimates as adopted by the Revenue and Taxation Committee 272 November 17, 2000
As of October 1, 1995, all fixed-income investments held by the state’s major trust funds were transferred to a newly-created Trust Fund Bond Pool (TFBP). Thus, the first step involves determining coupon interest income for the entire TFBP, by multiplying the par value of the portfolio times the coupon interest rate. Total income for the TFBP is then calculated by adding the TFBP coupon interest income with other income variables, including: pool short term interest, gains and losses income, Board of Investments fees, TFBP amortizations and accretions, and secondary lending income. Once total TFBP income is estimated, the portion of interest income attributable to the TSEF is calculated based on the number of TSEF shares relative to the total number of TFBP shares. Investment income on new deposits is calculated by multiplying the forecast amount for quarterly coal severance tax collections by the appropriate interest rate. The investable balance used varies in accordance with the timing of when new monies become available. For example, coal severance tax collections due for the first quarter of the biennium will earn interest at the short term (STIP) rate for one month, after which they will earn interest at the long term rate for the remainder of the biennium. (Coal severance tax collections are forecast as part of the coal severance tax methodology.) Finally, because a portion of the trust is invested on a short term basis, an assumption is made for the balance of trust funds in STIP. This balance is then multiplied by the short term interest rate to determine short term interest income. Once investment income has been calculated for these three components, the sum of these comprises total TSEF investment income.
Revenue Projection:
Total General Fund GFFiscal Collections Collections PercentYear Millions Millions Change
A 1979 0.000000 0.000000A 1980 0.000000 0.000000 Not App.A 1981 0.000000 0.000000 Not App.A 1982 0.000000 0.000000 Not App.A 1983 0.000000 0.000000 Not App.A 1984 0.000000 0.000000 Not App.A 1985 0.000000 0.000000 Not App.A 1986 0.000000 0.000000 Not App.A 1987 0.000000 0.000000 Not App.A 1988 0.000000 0.000000 Not App.A 1989 0.000000 0.000000 Not App.A 1990 0.000000 0.000000 Not App.A 1991 0.000000 0.000000 Not App.A 1992 0.000000 0.000000 Not App.A 1993 0.000000 0.000000 Not App.A 1994 0.928696 0.000000 Not App.A 1995 1.810151 0.000000 Not App.A 1996 2.916499 0.000000 Not App.A 1997 3.453907 0.000000 Not App.A 1998 4.250378 0.000000 Not App.A 1999 4.772585 0.000000 Not App.A 2000 5.123374 0.000000 Not App.F 2001 6.173000 0.000000 Not App.F 2002 7.088000 0.000000 Not App.F 2003 7.952000 0.000000 Not App.
TSE Trust Interest
0
1
2
3
4
5
6
7
1979 1981 1983 1985 1987 1989 1991 1993 1995 1997 1999 2001 2003
Fiscal Year
Mill
ions
of
Dol
lars
Total General Fund

Legislative Fiscal Division Revenue Estimate Profile
Treasure State Endowment Trust Interest
Revenue Estimates as adopted by the Revenue and Taxation Committee 273 November 17, 2000
Forecast Methodology TPCI t = SUM(i=1...n)(PAR t * CR t)i ---where TPCI = Trust Pool Coupon Interest PAR = Security Par Value CR = Coupon Interest Rate t = Fiscal Year i = Security in the Pool TTPI t = TPCI t + PSTI t + GLI t + BOIF t + AMT t + SECL t + ACCR t ---where TTPI = Total Trust Pool Income TPCI = Trust Pool Coupon Interest PSTI = Pool Short Term Interest GLI = Gains and Losses Income BOIF = Board of Investments Fees AMT = Trust Pool Amortizations SECL = Secondary Lending Income ACCR = Trust Pool Accretions t = Fiscal Year TTPI t = (TTS t / TPS t ) * TTPI t ---where TTPI = Treasure Trust Pool Interest TTS = Treasure Trust Shares TPS = Total Bond Pool Shares TTPI = Total Trust Pool Income t = Fiscal Year NDI t = (CST t / 4) * (LTIR t / 12) * 22 + (CST t / 4) * (STIR t / 12) * 4 + CST t-1 * LTIR t -1 ---where NDI = New Deposits Interest CST = Coal Severance Tax Allocation LTIR = Long Term Interest Rate STIR = Short Term Interest Rate t = Fiscal Year NPSTI t = STIB t * STIR t ---where NPSTI = Non Pool STIP Investment Interest STIB = STIP Investment Balance STIR = STIP Interest Rate t = Fiscal Year

Legislative Fiscal Division Revenue Estimate Profile
Treasure State Endowment Trust Interest
Revenue Estimates as adopted by the Revenue and Taxation Committee 274 November 17, 2000
TTTI t = TTPI t + NDI t + NPSTI t ---where TTTI = Total Treasure Trust Interest TTPI = Treasure Trust Pool Interest NDI = New Deposits Interest NPSTI = Non Pool STIP Investment Interest t = Fiscal Year
Distribution Methodology GFINT t = TTTI t * 0% ---where GFINT = General Fund Interest Earnings TTTI = Total Treasure Trust Interest t = Fiscal Year
Trust Pool Other Poolt Total Rev. GF Rev. Trust Shares Total Shares Interest Income
Fiscal Millions Millions Millions Millions Millions Millions
Actual 2000 5.123374 0.000000 0.694065 11.821189 78.564737 5.084671Forecast 2001 6.173000 0.000000 0.694065 11.821189 78.564737 5.422011Forecast 2002 7.088000 0.000000 0.694065 11.821189 78.564737 5.445886Forecast 2003 7.952000 0.000000 0.694065 11.821189 78.564737 5.309712
Pool Short Gainst Term Interest Losses Fees Amortizations Lending Accretions
Fiscal Millions Millions Millions Millions Millions Millions
Actual 2000 2.402942 0.697222 -0.197184 -1.337427 0.283705 3.235413Forecast 2001 2.740282 0.697222 -0.197184 -1.337427 0.283705 3.235413Forecast 2002 2.764157 0.697222 -0.197184 -1.337427 0.283705 3.235413Forecast 2003 2.627983 0.697222 -0.197184 -1.337427 0.283705 3.235413
Net Coal Tax New Deposit Non Pool Non Pool Non Poolt New Deposit Interest Long Term STIP STIP Bal STIP Int
Fiscal Millions Millions Rate Rate Millions Millions
Actual 2000 13.301172 7.1000% 5.4350% 12.385400Forecast 2001 12.181000 0.474323 7.3690% 6.1980% 12.385400 0.767647Forecast 2002 12.366000 1.380948 7.3910% 6.2520% 12.385400 0.774335Forecast 2003 12.370000 2.291164 7.3780% 5.9440% 12.385400 0.736188
Legislative Fiscal Division Revenue Estimate Profile
Vehicle Tax
Revenue Estimates as adopted by the Revenue and Taxation Committee 275 November 17, 2000
Vehicle Tax
Revenue Description: Before January 1, 2001, light vehicles (including vans and sport utility vehicles) are taxed at 1.4 percent of the depreciated value of the manufacturer’s suggested retail price (MSRP). In addition, buses, trucks, truck tractors having a manufacturer’s rated capacity of more than 1 ton, and certain trailers, are taxed under a fee schedule which varies by age and weight. Effective January 1, 2001, light vehicles will be charged a registration fee as a result of the passage of LR 115 (HB540) by the electorate in November 2000. The fee is $195 for light vehicles of age between zero and four years, $65 for vehicles between five and ten years of age, and $6 for vehicles over ten years old. LR 115 also lowers the registration fees charged on motorcycles and quadricycles. Under the law before LR 115, motorcycles were charged a fee based on four age categories and three engine size categories. Under LR 115 and beginning January 1, 2001, the number of age categories is reduced to three and the number of engine size categories remains the same. The new motorcycles registration fees are reduced relative to those in existence before LR 115.
Applicable Tax Rate(s): Varies
Distribution: All registration fees from newly titled light vehicles are deposited into the highway restricted state special revenue account. Ten percent of registration fees collected on light vehicles is distributed to a state special revenue account to fund certain district court expenses. The remaining 90 percent of light vehicle registrations fees and fees in lieu of taxes for motorcycles and quadricycles are distributed in the relative proportions required by the levies for county, school district, and municipal purposes in the same manner as personal property taxes are distributed. No registration fee revenue from light vehicles and motorcycles and quadricycles is distributed to state mills, nor to the 9 mill welfare levy. The vo-tech levy (1.5 mills) continues to receive a share of this revenue. All other registration fee and fees in lieu of taxes (on large trucks, trailers, motor homes, campers etc.) are distributed in the relative proportions required by the levies for state, county, school district, and municipal purposes based on prior year mills. This revenue source represents one component used to calculate total non levy property tax revenue.
Collection Frequency: Monthly
Applicable Assumptions and/or Relevant Indicators: Consumer Price Index (CPI) Population growth for ages 16 and over Statewide Average Mill Levy
Data Source(s): Department of Justice, SBAS, SABHRS
Contacts: Department of Justice
Statute: Title 61, Chapter 3, MCA
% of Total FY 2000 General Fund Revenue: Included in total property tax contribution.
Revenue Estimate Methodology: The LFD uses a number of analytical techniques to develop relevant assumptions for this source of revenue. Historical data trends, economic conditions, input from industry experts, company surveys, and etc., are examples of information used to formulate these assumptions. The techniques used to develop these assumptions may vary from biennium to biennium and are highly dependent on availability of information, professional intuition/judgment, and a detailed analysis of the revenue source. The applicable methodology (formulas) and assumptions used by the LFD to develop a revenue estimate for this source are provided in a subsequent section of this document. The following summarizes the LFD process used to develop the revenue estimate.

Legislative Fiscal Division Revenue Estimate Profile
Vehicle Tax
Revenue Estimates as adopted by the Revenue and Taxation Committee 276 November 17, 2000
Beginning January 1, 2001, total vehicle tax for the state is made up of revenue from light vehicles and revenue from trucks, buses and trailers (hereafter called trucks). The revenue from light vehicles is dependent upon growth in the number of light vehicles, and the revenue from trucks is dependent upon growth in the number of trucks. Since the growth in the revenue from light vehicles differs from the revenue growth from trucks, each component is estimated separately. The revenue from light vehicles depends on the growth in the number of vehicles. In turn, the number of vehicles is expected to grow slightly faster than the population of drivers in the state. The percentage growth is applied to the base year revenue derived from light vehicles. The base year light vehicle value is inferred from the amount of revenue in the special revenue account. The allocations to the highway account, the special revenue account, and the property tax levies are then computed. The growth rate used for fiscal 2001 through fiscal 2003 is 1.5 percent per year. The tax on trucks began on January 1, 1998. Before this time, these vehicles were taxed as part of the class 8 property tax base. Future truck revenue estimates are based on an historical growth rate in the number of trucks, buses ,and trailers multiplied by the base revenue in calendar 1999. The growth rate applied to truck revenue during the 2003 biennium is 1.5 percent per year. Ten percent of fees from both light vehicles and trucks is deposited in a special revenue account for district courts and the rest is distributed to state and local government accounts on the basis of property tax mill ratios in the preceding fiscal year.
Revenue Projection:
Total General Fund GFFiscal Collections Collections PercentYear Millions Millions Change
A 1979 0.000000 0.000000A 1980 0.000000 0.000000 Not App.A 1981 0.000000 0.000000 Not App.A 1982 0.000000 0.000000 Not App.A 1983 0.000000 0.000000 Not App.A 1984 0.000000 0.000000 Not App.A 1985 0.000000 0.000000 Not App.A 1986 4.524027 2.409577 Not App.A 1987 4.880792 2.608426 8.25%A 1988 32.216414 2.255149 -13.54%A 1989 35.306743 2.471472 9.59%A 1990 38.024086 2.661686 7.70%A 1991 39.102029 2.737142 2.83%A 1992 46.095786 3.226705 17.89%A 1993 46.976700 3.288369 1.91%A 1994 52.908729 3.703611 12.63%A 1995 62.029200 4.342044 17.24%A 1996 68.641271 4.804889 10.66%A 1997 75.330243 5.273117 9.74%A 1998 78.210343 0.000000 -100.00%A 1999 83.005171 0.000000 Not App.A 2000 74.950871 0.000000 Not App.F 2001 69.355000 0.000000 Not App.F 2002 69.357000 0.000000 Not App.F 2003 69.474000 0.000000 Not App.
Vehicle Tax
0
10
20
30
40
50
60
70
80
90
1979 1981 1983 1985 1987 1989 1991 1993 1995 1997 1999 2001 2003
Fiscal Year
Mill
ions
of D
olla
rs
Total General Fund
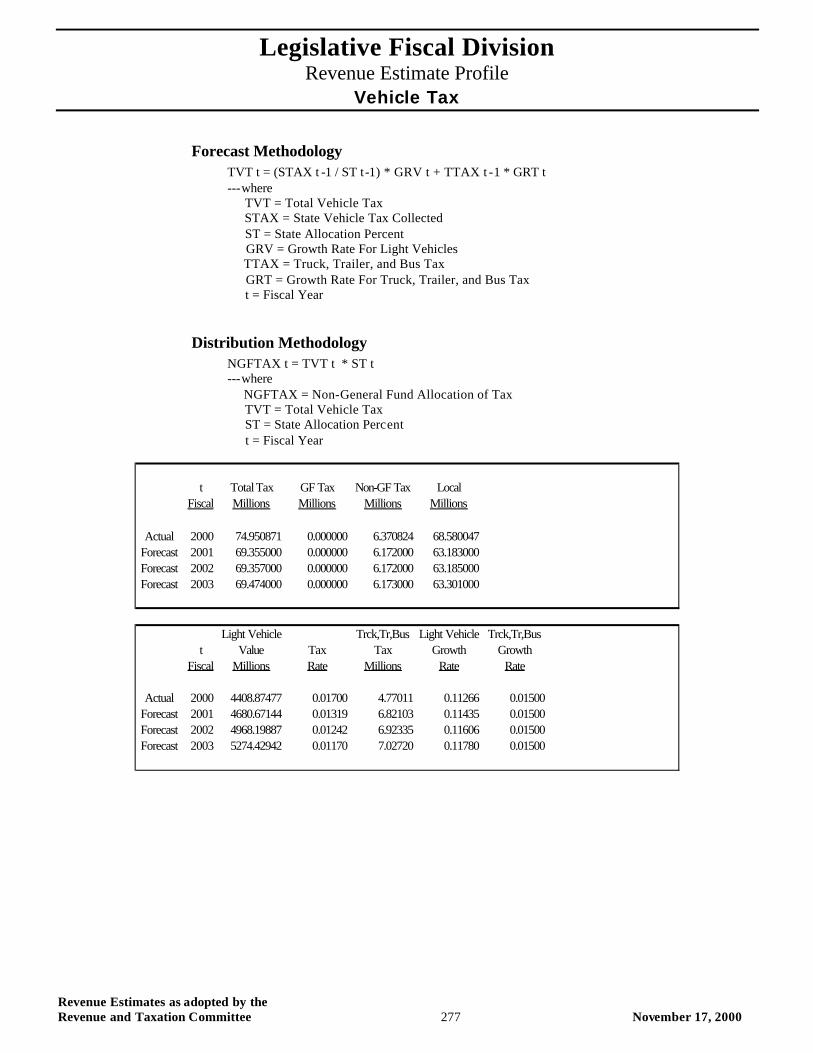
Legislative Fiscal Division Revenue Estimate Profile
Vehicle Tax
Revenue Estimates as adopted by the Revenue and Taxation Committee 277 November 17, 2000
Forecast Methodology TVT t = (STAX t -1 / ST t-1) * GRV t + TTAX t -1 * GRT t ---where TVT = Total Vehicle Tax STAX = State Vehicle Tax Collected ST = State Allocation Percent GRV = Growth Rate For Light Vehicles TTAX = Truck, Trailer, and Bus Tax GRT = Growth Rate For Truck, Trailer, and Bus Tax t = Fiscal Year
Distribution Methodology NGFTAX t = TVT t * ST t ---where NGFTAX = Non-General Fund Allocation of Tax TVT = Total Vehicle Tax ST = State Allocation Percent t = Fiscal Year
t Total Tax GF Tax Non-GF Tax LocalFiscal Millions Millions Millions Millions
Actual 2000 74.950871 0.000000 6.370824 68.580047Forecast 2001 69.355000 0.000000 6.172000 63.183000Forecast 2002 69.357000 0.000000 6.172000 63.185000Forecast 2003 69.474000 0.000000 6.173000 63.301000
Light Vehicle Trck,Tr,Bus Light Vehicle Trck,Tr,Bust Value Tax Tax Growth Growth
Fiscal Millions Rate Millions Rate Rate
Actual 2000 4408.87477 0.01700 4.77011 0.11266 0.01500Forecast 2001 4680.67144 0.01319 6.82103 0.11435 0.01500Forecast 2002 4968.19887 0.01242 6.92335 0.11606 0.01500Forecast 2003 5274.42942 0.01170 7.02720 0.11780 0.01500