Nonprofit and Voluntary Sector Quarterly · Nonprofit and Voluntary Sector Quarterly, vol. 36, ......
21
http://nvs.sagepub.com Sector Quarterly Nonprofit and Voluntary DOI: 10.1177/0899764006293177 2007; 36; 65 Nonprofit and Voluntary Sector Quarterly Mark O. Wilhelm The Quality and Comparability of Survey Data on Charitable Giving http://nvs.sagepub.com/cgi/content/abstract/36/1/65 The online version of this article can be found at: Published by: http://www.sagepublications.com On behalf of: Association for Research on Nonprofit Organizations and Voluntary Action can be found at: Nonprofit and Voluntary Sector Quarterly Additional services and information for http://nvs.sagepub.com/cgi/alerts Email Alerts: http://nvs.sagepub.com/subscriptions Subscriptions: http://www.sagepub.com/journalsReprints.nav Reprints: http://www.sagepub.com/journalsPermissions.nav Permissions: http://nvs.sagepub.com/cgi/content/abstract/36/1/65#BIBL SAGE Journals Online and HighWire Press platforms): (this article cites 11 articles hosted on the Citations reserved. Not for commercial use or unauthorized distribution. © 2007 ASSOCIATION FOR RESEARCH ON NONPROFIT ORGANIZATIONS AND VOLUNTARY ACTION. All rights at UNIV OF MICHIGAN on April 4, 2007 http://nvs.sagepub.com Downloaded from
-
Upload
truongxuyen -
Category
Documents
-
view
215 -
download
1
Transcript of Nonprofit and Voluntary Sector Quarterly · Nonprofit and Voluntary Sector Quarterly, vol. 36, ......

http://nvs.sagepub.comSector Quarterly
Nonprofit and Voluntary
DOI: 10.1177/0899764006293177 2007; 36; 65 Nonprofit and Voluntary Sector Quarterly
Mark O. Wilhelm The Quality and Comparability of Survey Data on Charitable Giving
http://nvs.sagepub.com/cgi/content/abstract/36/1/65 The online version of this article can be found at:
Published by:
http://www.sagepublications.com
On behalf of:
Association for Research on Nonprofit Organizations and Voluntary Action
can be found at:Nonprofit and Voluntary Sector Quarterly Additional services and information for
http://nvs.sagepub.com/cgi/alerts Email Alerts:
http://nvs.sagepub.com/subscriptions Subscriptions:
http://www.sagepub.com/journalsReprints.navReprints:
http://www.sagepub.com/journalsPermissions.navPermissions:
http://nvs.sagepub.com/cgi/content/abstract/36/1/65#BIBLSAGE Journals Online and HighWire Press platforms):
(this article cites 11 articles hosted on the Citations
reserved. Not for commercial use or unauthorized distribution.© 2007 ASSOCIATION FOR RESEARCH ON NONPROFIT ORGANIZATIONS AND VOLUNTARY ACTION. All rights
at UNIV OF MICHIGAN on April 4, 2007 http://nvs.sagepub.comDownloaded from

65
Note: I am grateful to the Indiana University Research Fund 54-921-02 for financial support andto Elliott Miller for excellent research assistance. Thanks also go to Kris Hammill, Keith Hume,Jim Morgan, Bill Roberts, Karen Roberts, and Tom Smith for patiently answering numerousquestions about the data and to Renè Bekkers, Michael Hall, Tom Kniesner, Rich Steinberg, sem-inar participants at Indiana University Purdue University–Indianapolis, and three anonymousreferees for helpful comments. I was a member of the team that designed the Center onPhilanthropy Panel Study, one of the data sets analyzed in the paper. However, the conclusionsexpressed in the paper as well as any remaining errors are my own.
Nonprofit and Voluntary Sector Quarterly, vol. 36, no. 1, March 2007 65-84DOI: 10.1177/0899764006293177© 2007 Association for Research on Nonprofit Organizations and Voluntary Action
The Quality and Comparability of SurveyData on Charitable Giving
Mark O. WilhelmIndiana University Purdue University–Indianapolis
This article examines six major household surveys of charitable giving and attemptsto trace differences in estimates to underlying differences in survey methodology. Themain result is that surveys that cue respondent recall by directing attention to chari-ties’ outputs and use interviewers experienced in obtaining information about dollaramounts measure larger amounts of giving. Even so, it is very difficult to estimate giv-ing at the top of the distribution without a high-income oversample: Only one of thesurveys not containing a high-income oversample produces estimates around the 90thpercentile similar to that obtained with a high-income oversample.
Keywords: charitable donations; charitable contributions; relative distributions
Research interest in voluntary giving to charitable purposes crosses disciplinaryboundaries (Berking, 1999; Komter, 1996; Lee, Piliavin, & Call, 1999; Vesterlund,2006). The tax deductibility of charitable giving and the recently proposedCharity Aid, Recovery, and Empowerment Act are evidence of the govern-ment’s long-standing and ongoing attempts to encourage charitable giving.New releases of giving statistics routinely receive substantial media attention.
With this level of research, government, and media interest it may come asa surprise that household-level survey data on charitable giving were scarceuntil recently. After the National Study of Philanthropy, an extensive house-hold survey fielded in 1974, survey data on giving were not collected untilIndependent Sector’s 1988 initiation of its biennial series of cross-sections
reserved. Not for commercial use or unauthorized distribution.© 2007 ASSOCIATION FOR RESEARCH ON NONPROFIT ORGANIZATIONS AND VOLUNTARY ACTION. All rights
at UNIV OF MICHIGAN on April 4, 2007 http://nvs.sagepub.comDownloaded from

Giving and Volunteering in the United States. Since that time there has been aflurry of activity. The General Social Survey placed the core questions fromGiving and Volunteering on its 1996 survey. In 1997, the Canadian Centre onPhilanthropy took a different methodological approach to the design of givingquestions and Statistics Canada fielded the new instrument as part of its laborforce survey. Researchers at the University of San Francisco followed that newapproach in a survey of giving in California. Because none of these surveyswere producing panel data, the Center on Philanthropy at Indiana Universityand the University of Michigan’s Survey Research Center launched a moduleof giving and volunteering questions in the 2001 wave of the Panel Study ofIncome Dynamics (PSID).
The recent availability of so many data sets is a welcome change but socialscientists planning research on charitable giving must now choose whichdata set to use in their projects. That choice would not matter if each data setproduced similar giving statistics but preliminary indications are that theydo not. For instance, the percentage of households making donations is68.5 in Giving and Volunteering (Hodgkinson & Weitzman, 1996) but 89.9 inthe California survey. As another example, Schervish and Havens (1998)reported that the average donation per household is much lower in Givingand Volunteering ($696) than in the General Social Survey ($1,099). It wouldbe important to investigate the quality and comparability of these surveysunder usual circumstances but differences like these make such an investi-gation indispensable.
This article investigates the quality and comparability of giving data inthese six surveys and attempts to trace differences among them to underly-ing differences in survey methodology. The research strategy has threeimportant features. First, it examines the prevalence of missing data, apotentially important problem because giving is not a highly salient eventfor many respondents. Second, instead of a narrow comparison of givingaverages, the article uses relative distribution methods (Handcock & Morris,1999) to provide a visually appealing comparison of entire giving distribu-tions. Relative distribution methods also lead to a straightforward test forsignificant differences. Third, by including six major household-level sur-veys on giving, the results can help researchers decide which of the availabledata sets may be best suited for their projects.
The analysis produces four results. First, surveys fielded by organizationswhose primary experience is in measuring public opinion produce much moremissing data on amounts given to charity than do surveys fielded by organi-zations with extensive experience collecting other kinds of dollar-amount infor-mation. Second, surveys that cue respondent recall by asking about methodsrespondents may have used to transfer money into charities (input cues suchas asking about giving in response to a telephone solicitation, through payrolldeductions, at a shopping center, etc.) measure higher fractions who give butalso a higher frequency of small gifts. Third, surveys that cue respondent recall
66 Wilhelm
reserved. Not for commercial use or unauthorized distribution.© 2007 ASSOCIATION FOR RESEARCH ON NONPROFIT ORGANIZATIONS AND VOLUNTARY ACTION. All rights
at UNIV OF MICHIGAN on April 4, 2007 http://nvs.sagepub.comDownloaded from
by asking about the output or purpose of the charities (such as asking aboutgiving to religious organizations, the United Way, educational organizations,etc.) more frequently measure large amounts of giving, but only when fieldedby organizations experienced in collecting dollar information. Finally, it isdifficult to measure giving at the very top of the distribution without ahigh-income oversample. The Center Panel is the only survey without such anoversample that measures giving at the top of the distribution similar to thatmeasured by the high-income oversample 1974 National Study. Even so, theNational Study indicates larger giving at the very highest percentiles.
PREVIOUS LITERATURE
The consensus concern among survey researchers is that householdsurveys potentially underestimate giving because of recall bias—charitabledonations often are not salient events and surveys typically ask about dona-tions made during the previous calendar year, in many cases well over a yearprior to the interview. Although social desirability may lead to some overre-porting of donations, most survey researchers think that recall bias presentsa more serious problem (e.g., Hall, 2001). Consequently, several method-ological approaches to questionnaire design have arisen to address concernsabout respondent recall. Rooney, Steinberg, and Schervish (2001) evaluatedthese approaches by fielding them simultaneously under the direction of asingle public opinion research organization and found that output cuedesigns measured smaller average giving than did input cue designs (seealso Rooney, Mesch, Chin, & Steinberg, 2005). This is surprising because itmight be expected that input cue designs would facilitate recall of smallergifts but not necessarily larger gifts.
None of the previous research has studied exactly where in the distributionof giving different surveys produce different results. Indeed, because giving ishighly skewed, a few outliers could cause large differences in sample meanseven if the empirical distributions are otherwise similar. Neither has previousresearch considered the degree of missing data nor analyzed whether theoversampling of high-income respondents produces different empirical distri-butions of giving.
METHOD: MISSING DATA BOUNDS AND RELATIVE DISTRIBUTIONS
The effect of missing data is examined by determining the range of theirpotential effects on the estimate of the median gift. At one extreme, if all themissing data on amounts are set to zero, the resulting estimate of the medianwould be the lower bound of the potential effects of the missing data. At theother extreme, if all the missing data are set to a value large enough to move
Survey Data on Charitable Giving 67
reserved. Not for commercial use or unauthorized distribution.© 2007 ASSOCIATION FOR RESEARCH ON NONPROFIT ORGANIZATIONS AND VOLUNTARY ACTION. All rights
at UNIV OF MICHIGAN on April 4, 2007 http://nvs.sagepub.comDownloaded from

the corresponding respondents above the median, the resulting estimate ofthe median would be the upper bound of the potential missing data effects.Although it is unlikely that respondents would fail to recall such largeamounts, this is not the point. The point is that although reasonable analystsmay disagree over their preferred imputation procedure they cannot disagreethat any imputation procedure must produce an estimate of the medianwithin the bounds just described (Manski, 1995).
The analysis then shifts to the use of relative distributions to describe dif-ferences in the lower bound distributions of giving—that is, the distributionsthat arise if missing amounts are taken as zeros (the lower bound to the esti-mate of the median is simply the median of the lower bound distribution).Two considerations lead to the decision to work with the lower bound distri-butions. First, the treatment of missing amounts as zeros is common in chari-table giving research. Second, implementing a more sophisticated imputationprocedure is complicated by the uneven quality of income data across the sur-veys. (Income would be the most important variable in any procedure toimpute giving.) For those interested in alternative imputations, the presentexamination of the lower bound distributions can serve as a benchmark.
An intuitive description of the relative distribution of a comparison dataset to a reference data set, for example giving in the General Social Survey toGiving and Volunteering in the United States, is to construct histogram binsdefined by the deciles of Giving and Volunteering (the reference) and thenplace the General Social Survey (comparison) data into these bins. If theunderlying distributions are the same, then aside from sampling variationthe relative histogram would be uniform. If instead the General SocialSurvey measures higher giving than Giving and Volunteering does, the rel-ative histogram would be skewed right. In this way the relative distributiongives an easily interpretable, visual description of the differences betweentwo empirical distributions.
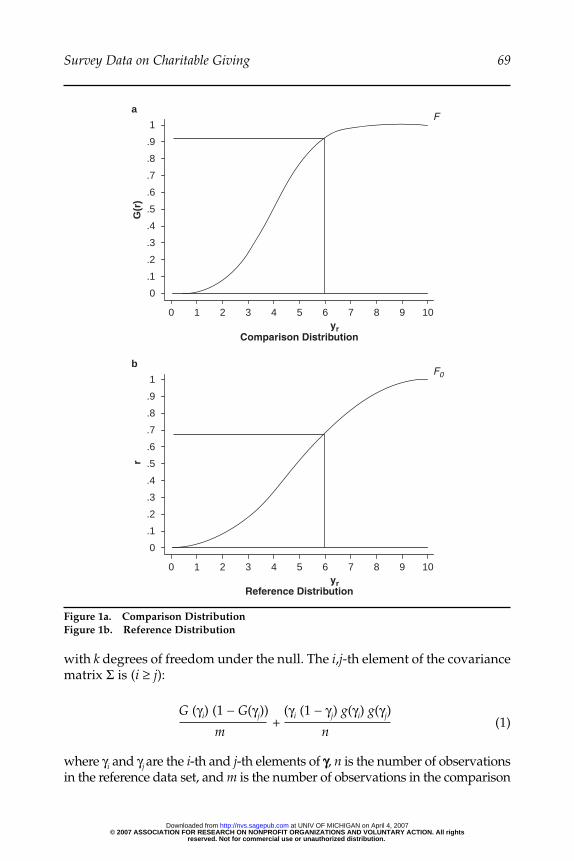
Figure 1 illustrates the construction of the relative distribution, G(r), of acomparison random variable Y relative to a reference random variable Y0,with respective cumulative distribution functions (cdfs) F and F0. (SeeHandcock & Morris, 1999, Chapter 2, for additional details; this brief dis-cussion follows their treatment.) In Figure 1B, yr is the rth quantile of the ref-erence distribution F0. In Figure 1A, G(r) is the probability that Y will take onvalues less than this quantile; that is, G(r) = F(Y ≤ yr). Because the derivativeg(r) = dG(r)/dr is a valid probability density function—it is the density of therandom variable defined to be the rank of Y relative to Y0 (the realizations ofthese ranks are the relative data)—the relative distribution can be used informal statistical analysis.
In particular, a test that two random variables have equal cdfs can be con-ducted by testing whether their relative distribution is uniform. Suppose weare interested in testing the equality of the cdfs at a k × 1vector of percentiles,γ; that is, H0: G (γ) = γγ, where G (γ) represents a k × 1 vector whose i-th elementis G(γi). The test statistic (G(γ) – γ)´Σ-1 (G(γ) – γ) is asymptotically chi-square
68 Wilhelm
reserved. Not for commercial use or unauthorized distribution.© 2007 ASSOCIATION FOR RESEARCH ON NONPROFIT ORGANIZATIONS AND VOLUNTARY ACTION. All rights
at UNIV OF MICHIGAN on April 4, 2007 http://nvs.sagepub.comDownloaded from
where γi and γj are the i-th and j-th elements of γγ, n is the number of observationsin the reference data set, and m is the number of observations in the comparison
Survey Data on Charitable Giving 69
0
0 1 2 3 4 5 6 7 8
F
F0
9 10
.1
.2
.3
.4
.5
.6
.7
.8
.9
1G
(r)
r
yrComparison Distribution
a
0
0 1 2 3 4 5 6 7 8 9 10
.1
.2
.3
.4
.5
.6
.7
.8
.9
1
yrReference Distribution
b
Figure 1a. Comparison DistributionFigure 1b. Reference Distribution
G (γi) (1 − G(γj)) +
(γi (1 − γj) g(γi) g(γj)
m n(1)
with k degrees of freedom under the null. The i,j-th element of the covariancematrix Σ is (i ≥ j):
reserved. Not for commercial use or unauthorized distribution.© 2007 ASSOCIATION FOR RESEARCH ON NONPROFIT ORGANIZATIONS AND VOLUNTARY ACTION. All rights
at UNIV OF MICHIGAN on April 4, 2007 http://nvs.sagepub.comDownloaded from

data set (Handcock & Morris, 1999, Theorem 9.2.2.1). A kernel density estimateis used for g(·); because g(·) is uniform under the null, the relative data arereflected around zero and around one prior to the estimation. The test results inthis article are not sensitive to typical bandwidth choices.
THE SIX DATA SETS
The data sets included in the analysis were purposefully selected. Givingand Volunteering is the present-day standard among U.S. household surveysof giving—it is frequently used by researchers, practitioners, and policy mak-ers (e.g., Andreoni, Brown, & Rischall, 2003; Andreoni, Gale, & Scholtz, 1996;Clotfelter, 1997; Council of Economic Advisors, 2000; Nonprofit Almanac, 2002;U.S. Census Bureau, 2001, Table 560). As such, it is the obvious choice for thereference distribution with which to begin the relative distribution analysis.The General Social Survey is included because it adopted the Giving andVolunteering questions and thereby allows the comparison of results fromidentical output cue instruments fielded in the same year (1996) by differentsurvey organizations.1 Moreover, the General Social Survey is a heavily useddata set among sociologists and economists. Giving and Volunteering inCalifornia is included because it is the only U.S. survey to use the input cueapproach. Canada’s Survey of Giving, Volunteering and Participating isincluded because it pioneered the input cue approach. The 1974 NationalStudy of Philanthropy is included because it is the only survey of giving tohave had the government use administrative records (income tax returns) topinpoint a high-income oversample. Despite the National Study’s age it isstill used for research purposes (e.g., Schiff, 1990; Duncan, 1999). Finally, theCenter Panel is included because it is the initial wave of the first panel surveyof giving. Because the Center Panel is a part of the ongoing PSID, the futureuse of the Center Panel by sociologists and economists is anticipated to behigh. Introductions and discussions of basic findings are available for Givingand Volunteering (Hodgkinson & Weitzman, 1996), the California study(O’Neill & Roberts, 2000), Canadian study (Hall et al., 1998), Nationalstudy (Morgan, Dye, & Hybels, 1977), and the Center Panel (http://www.philanthropy.iupui.edu/COPPS.html).
Table 1 summarizes several important features of the surveys. The opin-ion research firms that fielded the Giving and Volunteering, General Social,and California surveys use interviewers not extensively trained to elicitresponses to questions about dollar amounts.2 In contrast, the organizationsthat fielded the Canadian, National, and Center Panel studies are widely rec-ognized as expert in eliciting responses to questions about dollar amounts;their interviewers are better trained in this regard.
Each survey queries total giving through a series of component questions.As already discussed, the surveys differ in how these component questionscue respondent recall, and these cues are listed in Column 3. Although the
70 Wilhelm
reserved. Not for commercial use or unauthorized distribution.© 2007 ASSOCIATION FOR RESEARCH ON NONPROFIT ORGANIZATIONS AND VOLUNTARY ACTION. All rights
at UNIV OF MICHIGAN on April 4, 2007 http://nvs.sagepub.comDownloaded from

71
Tab
le 1
.S
urv
eys
Wit
h D
ata
on C
har
itab
le G
ivin
g
Org
aniz
atio
nR
ecal
l R
espo
nse
Scal
eSu
rvey
Fiel
ding
the
Sur
vey
Cue
Rat
eSp
ecia
l Cha
ract
eris
tics
Fact
ora
Giv
ing
and
Vol
unte
erin
g in
Gal
lup
Out
put
19b
—1.
22th
e U
nite
d S
tate
s (1
996)
Gen
eral
Soc
ial S
urve
y (1
996)
Nat
iona
l Opi
nion
Out
put
76—
1.22
Res
earc
h C
ente
rG
ivin
g an
d V
olun
teer
ing
Heb
ert
Inpu
t35
Inco
mpl
ete
tota
l0.
94in
Cal
ifor
nia
(200
0)fo
r 40
% o
f m
arri
ed c
oupl
es.
Res
pons
e in
cent
ive—
nonr
and
omN
atio
nal S
urve
y of
Giv
ing,
Stat
isti
cs C
anad
aIn
put
78In
com
plet
e to
tal f
or1.
20V
olun
teer
ing
and
60%
of
mar
ried
cou
ples
Part
icip
atin
g (1
997)
Nat
iona
l Stu
dy
ofM
ichi
gan
Surv
ey R
esea
rch
Out
put
78H
igh-
inco
me
over
sam
ple.
4.51
Phila
nthr
opy
(197
4)C
ente
r an
d th
e U
.S. C
ensu
sTo
tal u
nkno
wn
if le
ssth
an $
100
(in
1973
dol
lars
)C
ente
r on
Phi
lant
hrop
yM
ichi
gan
Surv
ey R
esea
rch
Out
put
66c
$25
thre
shol
d0.
96Pa
nel S
tud
y (2
001)
Cen
ter
a. T
he s
cale
fac
tor
is u
sed
to m
ulti
ply
the
orig
inal
sur
vey
dat
a to
acc
ount
for
gro
wth
in a
vera
ge h
ouse
hold
nom
inal
inco
me
betw
een
the
year
cov
ered
by th
e su
rvey
and
199
9.b.
The
act
ual r
ate
has
not b
een
publ
ishe
d. T
his
figu
re is
take
n fr
om K
irsc
h, M
cCor
mac
k, a
nd S
axon
-Har
rold
’s (
2001
) ge
nera
l dis
cuss
ion
of r
espo
nse
rate
s in
the
Giv
ing
and
Vol
unte
erin
g se
ries
.c.
Thi
s is
the
cum
ulat
ive
resp
onse
rat
e si
nce
1989
. The
ann
ual r
espo
nse
rate
s va
ry b
etw
een
95 a
nd 9
8%.
reserved. Not for commercial use or unauthorized distribution.© 2007 ASSOCIATION FOR RESEARCH ON NONPROFIT ORGANIZATIONS AND VOLUNTARY ACTION. All rights
at UNIV OF MICHIGAN on April 4, 2007 http://nvs.sagepub.comDownloaded from

survey questions cannot be presented in their entirety, it is helpful to see anexample of each type of cue. (A more detailed description of all six ques-tionnaires is available upon request.) Here is an illustration of an output cuetaken from the Center Panel:
Did you make any donations specifically for religious purposes or spir-itual development, for example to a church, synagogue, mosque, TV orradio ministry? Please do not include donations to schools, hospitals,and other charities run by religious organizations. I will be asking youabout those donations next.
[If yes] Altogether, what was the total dollar value of all donations[you/you and your family] made in 2000 towards religious purposes?
Subsequent components use a similar structure to ask about donations toeducational organizations, health organizations, and so forth. The followingillustrates an input cue taken from the Canadian survey:
In the past 12 months, have you made a charitable donation byresponding to a request through the mail?
If the answer is yes, the respondent is asked a series of questions to learn thenumber of such donations and their total amount. This is followed by compo-nents asking about donations in response to requests by co-workers, throughpayroll deduction, in memoriam, at public cash boxes, to door-to-door collec-tors, etc. Many of these specified methods of transferring contributions intocharitable organizations are used for small donations, and by focusing on theminput cue surveys might be expected to measure smaller levels of giving.
Column 4 lists survey response rates. Gallup and Hebert did not use mul-tiple call backs and this likely explains the very low response rates in theGiving and Volunteering and California surveys. Response rates at theselevels are cause for concern. The Center Panel’s response rate is based onattrition from the PSID since 1989. Although attrition is always a matter ofconcern in panel studies, there is evidence suggesting that the PSID remainsrepresentative.3
Four other characteristics of the surveys are important to keep in mind andare listed in Column 5. First, in contrast to the other surveys, the Californiaand Canadian surveys attempted to obtain an individual unit of account bysubtracting one half of donations respondents made jointly with their spouses.This subtraction can be undone for some respondents but not for 40 and 60percent of the married couples in the respective surveys, and for this reasonalone giving measured by these surveys may be less than that measured bythe other surveys. Unfortunately, the two affected surveys are also the twoexpected to produce lower measures of giving because of their use of inputcues. Second, in an attempt to increase response rates the California surveyoffered to make charitable contributions on behalf of respondents, perhaps
72 Wilhelm
reserved. Not for commercial use or unauthorized distribution.© 2007 ASSOCIATION FOR RESEARCH ON NONPROFIT ORGANIZATIONS AND VOLUNTARY ACTION. All rights
at UNIV OF MICHIGAN on April 4, 2007 http://nvs.sagepub.comDownloaded from

producing a nonrandom sample selection toward generous respondents.Third, the National Study sought to determine the exact amount given to char-itable organizations only if the respondent initially reported that their totalcontributions were greater than $100 (1973 dollars); thus, for many donors allwe know is that their gifts were between $1 and $100. Fourth, the first ques-tion in the Center Panel screened out respondents who said they did not givemore than $25. Hence, some panel respondents that I classify as nondonors mayhave, in fact, given amounts between $1 and $25 dollars. This classificationwill be further examined in the sensitivity analysis.
Several data handling decisions are important to mention. Attention isrestricted to respondents who were heads of households or spouses of headsin the surveys that randomly selected respondents from a household listing.Unless otherwise indicated, survey weights are used for the Giving andVolunteering, California, Canadian, and National studies. Neither theGeneral Social Survey nor the Center Panel require weighting, in the lattercase because I use the PSID’s nationally representative subsample. Toaccount for inflation and real income growth, the data are scaled to 1999levels using the growth in average household nominal income between theyear covered by the survey and 1999. The scale factors are listed in the lastcolumn of Table 1.
RESULTS
Table 2 presents the prevalence of missing data in each of the surveys. Foreach survey, the first column lists the unweighted fraction of respondentshaving no missing data in any of the component questions and the last col-umn contains the number of component questions about giving used in eachsurvey. The remaining columns list the fractions having the indicatednumber of missing components. Column 1 shows that only 65% of theGiving and Volunteering respondents had no missing data. The 35% withsome missing data consist of 7.6% missing only 1 of the 12 components, 2.2%missing 2 components, 3.1% missing between 3 and 5 components, and22.3% missing 6 or more components. Clearly, missing data are extensive inGiving and Volunteering.
The percentages of respondents with no missing data in the GeneralSocial and California surveys are similar to that in Giving and Volunteering(71% and 67.3%); however, the fractions of respondents missing six or morecomponents are much smaller in these surveys. Missing data are much lessprevalent in the Canadian, National, and Center Panel surveys—the surveysfielded by organizations experienced in collecting dollar-amount informa-tion. In addition to interviewer training, the very infrequent missing data inthe Center Panel—only 1.2% of the respondents have any missing data—may result from the experience PSID respondents have gained over the yearsanswering questions about dollar amounts.
Survey Data on Charitable Giving 73
reserved. Not for commercial use or unauthorized distribution.© 2007 ASSOCIATION FOR RESEARCH ON NONPROFIT ORGANIZATIONS AND VOLUNTARY ACTION. All rights
at UNIV OF MICHIGAN on April 4, 2007 http://nvs.sagepub.comDownloaded from

Figure 2 indicates how the missing data described in Table 2 can affectwhat each survey unambiguously reveals about the median gift. The figurepresents lower and upper missing data bounds (the bottom and top of thevertical lines) on the median gift among the subsample of givers. The largedistance between the lower and upper bounds in Giving and Volunteering,the General Social Survey, and the California survey reflects the difficultythese surveys had in getting respondents to answer the amount questions; indetermining giving percentiles, the prevalence of missing data discussed inTable 2 has a big effect.
Compare the width of the missing data bounds to the sampling variationconfidence intervals that would be reported in the typical giving study thatignores the missing data bounds. In Figure 2, the 95% confidence intervals(bootstrapped) for the lower bound medians are shown by the triangles; theintervals are very narrow compared to the wide missing data bounds in theGiving and Volunteering, General Social, and California surveys. Hence, theconfidence intervals typically reported for these surveys could well be dom-inated by missing data problems.
The other three surveys with more “dollar experience” did much better:The distances between the lower and upper missing data bounds are in the$50 to $70 range in the Canadian, National, and Center Panel studies. Theseranges are similar in magnitude to the respective confidence intervals for thelower bound medians.
As previously mentioned, the lower missing data bound on the median isthe median of the lower bound distribution. More detailed statistics for thelower bound distributions are presented in Table 3. The first row contains the
74 Wilhelm
Table 2. The Fraction of Respondents With Missing Data
Number of Component QuestionsWith Missing Data
6 or Number ofSurvey None 1 2 3 to 5 more Component Questions
Giving and Volunteering .649 .076 .022 .031 .223 12in the United States
General Social Survey .710 .106 .031 .021 .133 12Giving and Volunteering .673 .168 .065 .072 .022 17
in CaliforniaNational Survey of Giving, .836 .105 .027 .026 .006 17
Volunteering, andParticipating (Canadian)
National Study of Philanthropy .917 .046 .018 .020 — 4Center on Philanthropy .988 .008 .002 .002 .001 6
Panel Study
Note: For each survey, the table reports the fractions of respondents with various numbers ofgiving component questions containing missing data. The data are not weighted.
reserved. Not for commercial use or unauthorized distribution.© 2007 ASSOCIATION FOR RESEARCH ON NONPROFIT ORGANIZATIONS AND VOLUNTARY ACTION. All rights
at UNIV OF MICHIGAN on April 4, 2007 http://nvs.sagepub.comDownloaded from

lower bound fractions that give. With the exception of the National Study, theinput cue surveys (the California and Canadian studies) measure a higherfraction of the population who gives. Row 2 shows the average amounts given(including respondents who did not give in the average); the National Studywith its good high-income oversample measures average giving higher thando the other surveys by a non-negligible amount. Row 3 shows that excludingthe single largest gift affects the average in several surveys, especially theGeneral Social, illustrating that the average is not necessarily a robust indica-tor of systematic differences between distributions. The same point applies tothe average among the subsample of givers in Rows 4 and 5.
Systematic differences between distributions can be gleaned from patientstudy of the conditional distribution deciles in Table 3, Rows 6 through 14.Alternatively, the differences are quickly transparent in Figure 3’s relativehistograms. All the histograms are relative to Giving and Volunteering;hence the first histogram—Giving and Volunteering relative to itself—is uni-form by definition. The next histogram shows that except at the tenth decilethe General Social Survey measures more small gifts than does Giving andVolunteering.4 The third histogram shows that the California survey alsomeasures more small gifts than does Giving and Volunteering. The threeremaining histograms show larger differences. The amounts in the Canadiansurvey are concentrated in the lowest three Giving and Volunteering deciles
Survey Data on Charitable Giving 75
1500
1350
1200
1050
900
750
600
450
300
150
G&V Gen.Soc. Calif. Canadian National Center
Figure 2. Median Gifts: Missing Data Bounds and Confidence IntervalsNote: G & V = Giving and Volunteering; Gen.Soc. = General Social Survey; Calif. = Californiasurvey. Ends of the intervals are the lower and upper bounds to the medians based on assign-ing missing data to zero or above the median. Triangles are 95% confidence intervals (boot-strapped) on the lower bounds. The Giving and Volunteering upper bound is indeterminatebecause just over one half of the head and spouse donors have some missing information abouttheir donated amounts.
reserved. Not for commercial use or unauthorized distribution.© 2007 ASSOCIATION FOR RESEARCH ON NONPROFIT ORGANIZATIONS AND VOLUNTARY ACTION. All rights
at UNIV OF MICHIGAN on April 4, 2007 http://nvs.sagepub.comDownloaded from

76
Tab
le 3
.S
um
mar
y S
tati
stic
s fo
r th
e L
ower
Bou
nd
Dis
trib
uti
ons
of G
ivin
g
Giv
ing
and
Vol
unte
erin
gG
ener
al S
ocia
l Sur
vey
Cal
iforn
iaC
anad
ian
Nat
iona
l Stu
dyC
ente
r P
anel
Perc
enta
ge d
onat
ing
0.70
30.
708
0.95
40.
899
0.88
00.
687a
Ave
rage
am
ount
giv
en90
11,
218
1,13
250
72,
109
1,34
1A
vera
ge w
itho
ut th
e m
axim
um g
ift
798
835
1,04
250
42,
087
1,24
4A
mou
nt g
iven
, con
dit
iona
l on
givi
ngA
vera
ge1,
399
1,95
11,
256
492
2,43
51,
979
Ave
rage
wit
hout
the
max
imum
gif
t1,
239
1,33
71,
155
489
2,40
91,
837
Dec
iles
149
4333
225
962
122
9494
425
216
322
013
416
972
533
74
306
244
277
118
548
05
488
366
408
168
677
720
661
254
961
024
41,
128
1,07
47
976
781
915
348
1,69
11,
668
81,
586
1,40
31,
407
522
2,70
62,
648
92,
769
3,05
02,
678
1,02
04,
510
4,51
2M
axim
um a
mou
nt g
iven
118,
950
487,
981
159,
000
48,0
722,
255,
000
471,
840
Nex
t lar
gest
am
ount
giv
en61
,000
62,2
2079
,451
32,7
531,
578,
500
73,7
28N
umbe
r of
obs
erva
tion
s2,
424
1,27
02,
037
15,7
452,
802
4,88
7
Not
e:D
ecile
s, a
vera
ges,
and
max
ima
are
in 1
999
dol
lars
. The
dat
a ar
e w
eigh
ted
(th
e nu
mbe
rs o
f ob
serv
atio
ns a
re n
ot).
a. T
he p
erce
ntag
e d
onat
ing
in th
e C
ente
r Pa
nel i
ndic
ates
whe
ther
the
resp
ond
ent g
ave
mor
e th
an $
25; i
n th
e ot
her
surv
eys
ther
e is
no
such
thre
shol
d.
reserved. Not for commercial use or unauthorized distribution.© 2007 ASSOCIATION FOR RESEARCH ON NONPROFIT ORGANIZATIONS AND VOLUNTARY ACTION. All rights
at UNIV OF MICHIGAN on April 4, 2007 http://nvs.sagepub.comDownloaded from
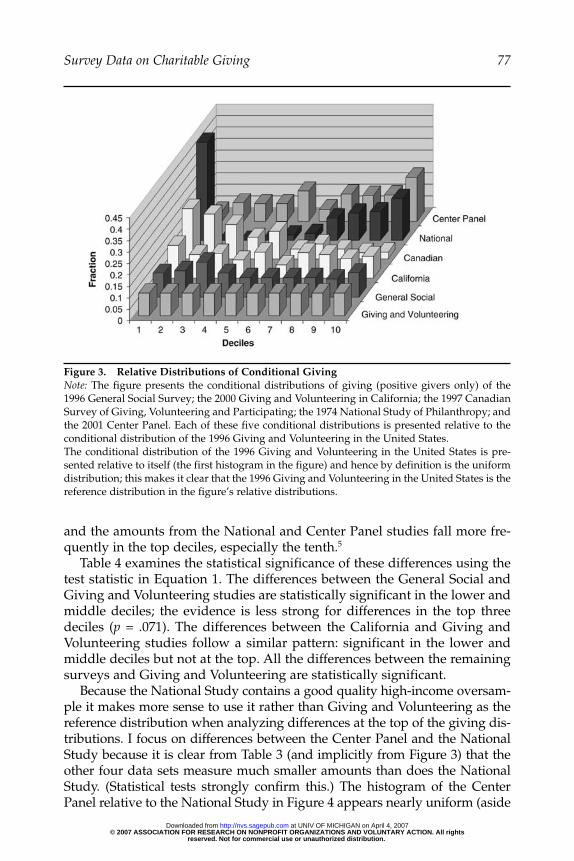
and the amounts from the National and Center Panel studies fall more fre-quently in the top deciles, especially the tenth.5
Table 4 examines the statistical significance of these differences using thetest statistic in Equation 1. The differences between the General Social andGiving and Volunteering studies are statistically significant in the lower andmiddle deciles; the evidence is less strong for differences in the top threedeciles (p = .071). The differences between the California and Giving andVolunteering studies follow a similar pattern: significant in the lower andmiddle deciles but not at the top. All the differences between the remainingsurveys and Giving and Volunteering are statistically significant.
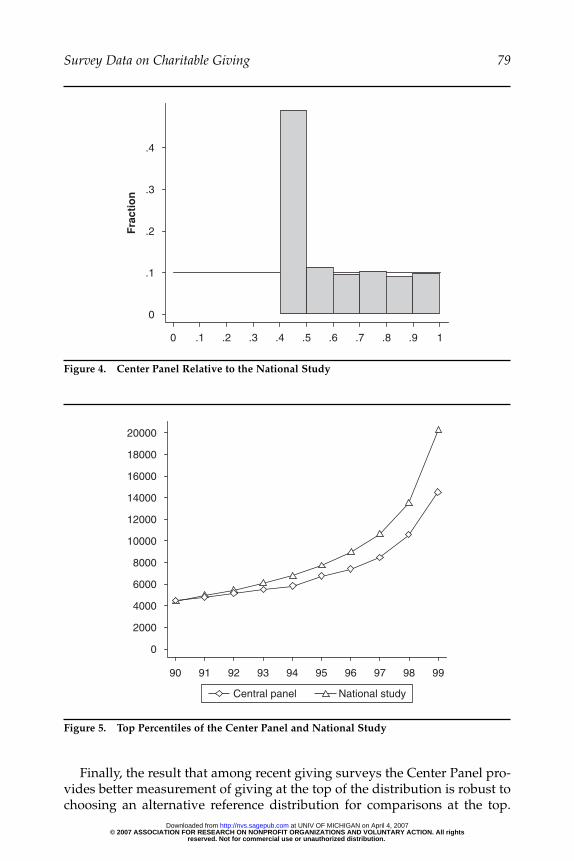
Because the National Study contains a good quality high-income oversam-ple it makes more sense to use it rather than Giving and Volunteering as thereference distribution when analyzing differences at the top of the giving dis-tributions. I focus on differences between the Center Panel and the NationalStudy because it is clear from Table 3 (and implicitly from Figure 3) that theother four data sets measure much smaller amounts than does the NationalStudy. (Statistical tests strongly confirm this.) The histogram of the CenterPanel relative to the National Study in Figure 4 appears nearly uniform (aside
Survey Data on Charitable Giving 77
Figure 3. Relative Distributions of Conditional GivingNote: The figure presents the conditional distributions of giving (positive givers only) of the1996 General Social Survey; the 2000 Giving and Volunteering in California; the 1997 CanadianSurvey of Giving, Volunteering and Participating; the 1974 National Study of Philanthropy; andthe 2001 Center Panel. Each of these five conditional distributions is presented relative to theconditional distribution of the 1996 Giving and Volunteering in the United States.The conditional distribution of the 1996 Giving and Volunteering in the United States is pre-sented relative to itself (the first histogram in the figure) and hence by definition is the uniformdistribution; this makes it clear that the 1996 Giving and Volunteering in the United States is thereference distribution in the figure’s relative distributions.
reserved. Not for commercial use or unauthorized distribution.© 2007 ASSOCIATION FOR RESEARCH ON NONPROFIT ORGANIZATIONS AND VOLUNTARY ACTION. All rights
at UNIV OF MICHIGAN on April 4, 2007 http://nvs.sagepub.comDownloaded from

from the mass of Center Panel amounts in the fifth National Study decile)6
indicating close agreement between the two surveys through the tenth decile.Testing that the two distributions are equal at the .70, .80, and .90 quantilesshows that they are statistically indistinguishable (p = .888).
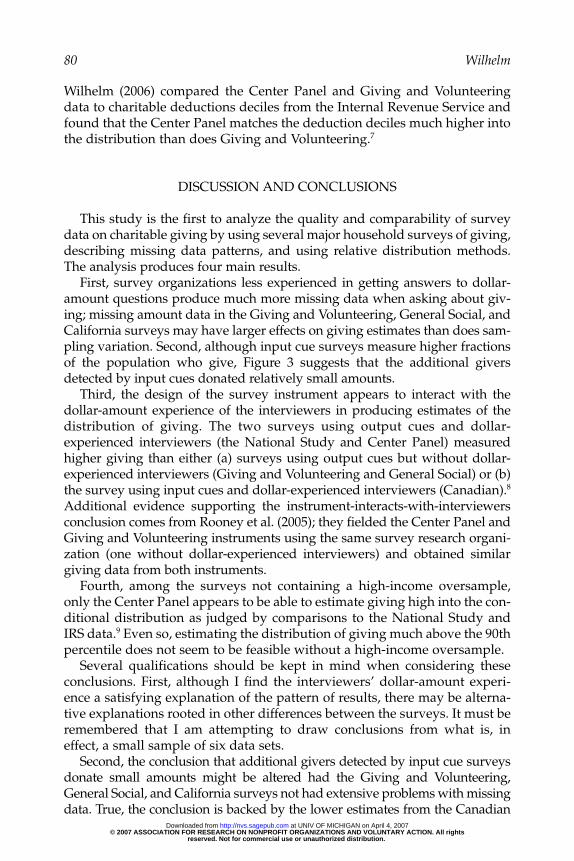
The findings that Center Panel and the National Study are indistinguish-able through the 90th percentile while the Center Panel conditional mean is19% lower (see Table 3, Row 4) imply that differences must exist higher inthe distribution. Figure 5 graphs the top 10 percentiles from each data setand shows that they match fairly closely through the 92nd percentile: Thetest of equality has a p value of .177. The divergence in the plots at the 93rdpercentile is more noticeable ($5,472 in the Center Panel and $6,089 in theNational Study), and the p value for this difference is .012.
SENSITIVITY ANALYSIS
The close match between the Center Panel and the National Study at thetop of the distribution may be sensitive to classifying all those in the panelwho were screened out by the $25 threshold question as if they were non-donors. Some of those screened likely gave small amounts and includingthem in the conditional distribution would shift the Center Panel distribu-tion down and away from the National Study. To check this, I reclassified6.6% of those screened (and previously treated as nondonors) to now bedonors of small amounts and included them in the Center Panel’s condi-tional distribution (6.6 is the percentage of respondents in the Californiastudy giving between 1 and 25 dollars—the highest such estimate from allthe data sets). The top half of the reclassified conditional Center Panel dis-tribution relative to the National Study is less uniform than in Figure 4, andthe difference at the upper three deciles is on the margin of significance at10% (p = .108). Nevertheless, the reclassified Center Panel distribution stillmatches the National Study more closely than the other four data sets.
78 Wilhelm
Table 4. Tests of Equality of Conditional Distributions of GivingWith Giving and Volunteering in the United States
Quantiles
Data Sets .10, .20, .30 .40, .50, .60 .70, .80, .90
General Social Survey 13.6 (.004) 12.6 (.006) 7.0 (.071)Giving and Volunteering in California 18.3 (.000) 26.7 (.000) 2.4 (.494)National Survey of Giving, Volunteering 309.8 (.000) 535.4 (.000) 635.0 (.000)
and Participating (Canadian)National Study of Philanthropy 2405.7 (.000) 369.6 (.000) 50.3 (.000)Center on Philanthropy Panel Study 111.7 (.000) 138.3 (.000) 68.1 (.000)
Note: In Column 1, the null hypothesis is that the .10, .20, and .30 quantiles of the data set in aselected row are equal to those in Giving and Volunteering. In Column 2, the null hypothesis isbased on the .40, .50, and .60 quantiles and in column 3 the .70, .80, and .90 quantiles. The resultsare the χ2 test statistic. p values are in parentheses.
reserved. Not for commercial use or unauthorized distribution.© 2007 ASSOCIATION FOR RESEARCH ON NONPROFIT ORGANIZATIONS AND VOLUNTARY ACTION. All rights
at UNIV OF MICHIGAN on April 4, 2007 http://nvs.sagepub.comDownloaded from
Finally, the result that among recent giving surveys the Center Panel pro-vides better measurement of giving at the top of the distribution is robust tochoosing an alternative reference distribution for comparisons at the top.
Survey Data on Charitable Giving 79
0
0 .1 .2 .3 .4 .5 .6 .7 .8 .9 1
.1
.2
.3
.4
Fra
ctio
n
Figure 4. Center Panel Relative to the National Study
0
90 91 92 93 94 95 96 97 98 99
2000
4000
6000
8000
10000
12000
14000
16000
18000
20000
Central panel National study
Figure 5. Top Percentiles of the Center Panel and National Study
reserved. Not for commercial use or unauthorized distribution.© 2007 ASSOCIATION FOR RESEARCH ON NONPROFIT ORGANIZATIONS AND VOLUNTARY ACTION. All rights
at UNIV OF MICHIGAN on April 4, 2007 http://nvs.sagepub.comDownloaded from
Wilhelm (2006) compared the Center Panel and Giving and Volunteeringdata to charitable deductions deciles from the Internal Revenue Service andfound that the Center Panel matches the deduction deciles much higher intothe distribution than does Giving and Volunteering.7
DISCUSSION AND CONCLUSIONS
This study is the first to analyze the quality and comparability of surveydata on charitable giving by using several major household surveys of giving,describing missing data patterns, and using relative distribution methods.The analysis produces four main results.
First, survey organizations less experienced in getting answers to dollar-amount questions produce much more missing data when asking about giv-ing; missing amount data in the Giving and Volunteering, General Social, andCalifornia surveys may have larger effects on giving estimates than does sam-pling variation. Second, although input cue surveys measure higher fractionsof the population who give, Figure 3 suggests that the additional giversdetected by input cues donated relatively small amounts.
Third, the design of the survey instrument appears to interact with thedollar-amount experience of the interviewers in producing estimates of thedistribution of giving. The two surveys using output cues and dollar-experienced interviewers (the National Study and Center Panel) measuredhigher giving than either (a) surveys using output cues but without dollar-experienced interviewers (Giving and Volunteering and General Social) or (b)the survey using input cues and dollar-experienced interviewers (Canadian).8
Additional evidence supporting the instrument-interacts-with-interviewersconclusion comes from Rooney et al. (2005); they fielded the Center Panel andGiving and Volunteering instruments using the same survey research organi-zation (one without dollar-experienced interviewers) and obtained similargiving data from both instruments.
Fourth, among the surveys not containing a high-income oversample,only the Center Panel appears to be able to estimate giving high into the con-ditional distribution as judged by comparisons to the National Study andIRS data.9 Even so, estimating the distribution of giving much above the 90thpercentile does not seem to be feasible without a high-income oversample.
Several qualifications should be kept in mind when considering theseconclusions. First, although I find the interviewers’ dollar-amount experi-ence a satisfying explanation of the pattern of results, there may be alterna-tive explanations rooted in other differences between the surveys. It must beremembered that I am attempting to draw conclusions from what is, ineffect, a small sample of six data sets.
Second, the conclusion that additional givers detected by input cue surveysdonate small amounts might be altered had the Giving and Volunteering,General Social, and California surveys not had extensive problems with missingdata. True, the conclusion is backed by the lower estimates from the Canadian
80 Wilhelm
reserved. Not for commercial use or unauthorized distribution.© 2007 ASSOCIATION FOR RESEARCH ON NONPROFIT ORGANIZATIONS AND VOLUNTARY ACTION. All rights
at UNIV OF MICHIGAN on April 4, 2007 http://nvs.sagepub.comDownloaded from
survey (which had less missing data) but those lower estimates may be becauseof differences in Canada’s expenditure policy and social conditions or even thesurvey’s treatment of married respondents; for these reasons, the conclusionthat input cue surveys produce lower giving estimates even when administeredby dollar-experienced interviewers is accordingly tentative.
Finally, it is not known whether choice of recall cue affects estimates ofgiving to specific charitable purposes such as religious giving or giving tohelp the needy. The advice a researcher should take from the present resultson total giving is that the distribution of giving to a specific charitable pur-pose may well differ across surveys and that he or she should compare thedistributions of (specific) giving from candidate surveys to consider whetherany differences will have implications for his or her research. This articleillustrates how this comparison can be carried out.10 Also, I have not consid-ered whether the National Study and the Center Panel, for example, producesimilar joint distributions of giving and income. These questions are naturalnext steps in evaluating the quality of giving data.
Although these qualifications must be kept in mind, the results at presentsuggest that surveys using interviewers trained in obtaining informationabout dollar amounts and questionnaires that cue on charitable output facil-itate the recall of giving. It seems that such a survey would be the appropri-ate choice for researchers interested in the behavior of people contributing atthe median and higher quantiles. Among recent surveys of giving, only theCenter Panel meets these requirements.
Finally, researchers should use caution when interpreting the results frommean regressions based on surveys without high-income oversamples becausethese surveys draw few observations from the top-giving decile and the topdecile has a large effect on estimates of the mean gift. This creates two problemsfor mean regression analysis. First, assuming that regression relationships inthe population are the same in the top decile as in the bottom 90th percent, thestandard errors on predicted regression relationships for giving in the topdecile will be very large. Second, the underlying assumption just evoked—thatpopulation regression relationships are the same in the top decile as in the bot-tom 90th percent—cannot be checked. Accordingly and in addition to usinggiving data that accurately reflect the median and higher quantiles, givingresearchers should make use of quantile regressions to check the sensitivity ofmean regression results.
Notes
1. Giving and Volunteering from 1996 is used so that the alignment with the General SocialSurvey is as close as possible. (The General Social Survey asked the giving questions only in1996.) Giving and Volunteering was also fielded in 1988, 1990, 1992, 1994, 1999, and 2001.
2. This judgment is not entirely fair to the National Opinion Research Center, which adminis-ters the General Social Survey as well as surveys gathering high-quality dollar amount informationsuch as the Survey of Consumer Finances (SCF). It is not known how many General Social Surveyinterviewers also worked on the SCF but even so the rarity and structure of other dollar-amount
Survey Data on Charitable Giving 81
reserved. Not for commercial use or unauthorized distribution.© 2007 ASSOCIATION FOR RESEARCH ON NONPROFIT ORGANIZATIONS AND VOLUNTARY ACTION. All rights
at UNIV OF MICHIGAN on April 4, 2007 http://nvs.sagepub.comDownloaded from

questions in the 1996 General Social Survey suggest that little interviewer training would havebeen devoted to getting accurate responses to open-ended dollar-amount questions: Aside from thegiving questions, only two questions dealt with dollar amounts and each of these were structuredto have respondents select an income category from a list.
3. The 66% response rate is calculated by assuming the Panel Study of Income Dynamics(PSID) was representative as of 1989 and then cumulating response rates since then; 1989 wasselected as the base year because of Fitzgerald, Gottschalk, and Moffitt’s (1998) conclusion thatthe PSID had remained representative through that year. More recent PSID income data con-tinue to align well with the Current Population Survey (Gouskova & Schoeni, 2002), suggestingthat post-1989 attrition has not compromised the representativeness of the PSID.
4. This is different than the impression left by the Schervish and Havens (1998) finding dis-cussed in the introduction. Furthermore, the averages of the two distributions are similar if thesingle largest gift in the General Social Survey is excluded (see Table 3).
5. The mass of National Study respondents in the lowest Giving and Volunteering decileoccurs because the National Study did not query amounts if donors said their gifts totaled $100or less. The lower bound for such donors is $1 (1973 dollars), which brought forward by the 4.51scale factor generates the $5 decile boundaries in Table 3.
6. The mass consists of all Center Panel amounts greater than $5 but less than $677; once morethis arises because the National Study does not quantify gifts less than $100 (1973 dollars). The veryshort bar in the first decile contains four Center Panel respondents who reported gifts totaling lessthan $5 (even though in the initial screening question they said that they gave more than $25).
7. Other than the general practice of conducting sensitivity checks whenever feasible, thereare two possible problems motivating the consideration of an alternative reference distributionto the National Study scaled by income growth since 1974: Auten, Clotfelter, and Schmalbeck(2000) provided evidence suggesting that giving in the top deciles has not kept pace withincome growth, and Jencks (1986) argued that the National Study may have overestimated giv-ing at the top in the first place. The fact that the Center Panel also compares well to IRS dataimplies that these two possible problems are not affecting the results.
Because the SCF also obtains government assistance in pinpointing a high-income oversam-ple it seems at first to offer another alternative reference distribution for comparisons at the topof the distribution. Unfortunately, the SCF measures charitable giving with only a single ques-tion, potentially creating a serious underreporting problem. Comparing gifts from the CenterPanel above $500 (to match the SCF’s $500 screen) to the SCF shows much higher giving in theCenter Panel through the first eight deciles; the ninth deciles match.
8. Such interactive effects may be part of the explanation of why the present results differfrom Rooney et al.’s (2001) finding of higher giving estimates with input rather than output cues—the interviewers collecting the Rooney et al. data did not have experience getting answers to ques-tions about dollar amounts.
9. This is reminiscent of the finding that the PSID’s estimate of the wealth distributionmatches that obtained with the high-income oversample SCF, although in the case of wealth thematch extends through the 98th percentile (Juster, Smith, & Stafford 1999).
10. Along these lines, the 2003 Center Panel has six component questions collecting data ongiving to youth and family services, the arts, neighborhood improvement, the environment,international aid, and open-ended purposes. (The 2001 Center Panel has only one componentquestion for all six of these purposes.) This presents an opportunity to study how more detailedquestions affect reported amounts within a survey for which interviewers are well-trained inquerying, and respondents are well-trained in providing, dollar-amount information.
REFERENCES
Andreoni, J., Brown, E., & Rischall, I. (2003). Charitable giving by married couples: Who decidesand why does it matter? Journal of Human Resources, 38(1), 111-133.
82 Wilhelm
reserved. Not for commercial use or unauthorized distribution.© 2007 ASSOCIATION FOR RESEARCH ON NONPROFIT ORGANIZATIONS AND VOLUNTARY ACTION. All rights
at UNIV OF MICHIGAN on April 4, 2007 http://nvs.sagepub.comDownloaded from

Andreoni, J., Gale, W. G., & Scholtz, J. K. (1996). Charitable contributions of time and money.Unpublished manuscript, University of Wisconsin–Madison.
Auten, G. E., Clotfelter, C. T., & Schmalbeck, R. L. (2000). Taxes and philanthropy among thewealthy. In J. B. Slemrod (Ed.), Does Atlas shrug? The economic consequences of taxing the rich.New York: Russell Sage Foundation and Harvard University Press.
Berking, H. (1999). Sociology of giving. Thousand Oaks, CA: Sage.Clotfelter, C. T. (1997). The economics of giving. In J. W. Barry & B. V. Manno (Eds.), Giving better,
giving smarter: Working papers of the National Commission of Philanthropy and Civic Renewal.Washington, DC: National Commission on Philanthropy and Civic Renewal.
Council of Economic Advisors. (2000). Philanthropy in the American economy. Washington, DC:Author.
Duncan, B. (1999). Modeling charitable contributions of time and money. Journal of PublicEconomics, 72, 213-242.
Fitzgerald, J., Gottschalk, P., & Moffitt, R. (1998). An analysis of sample attrition in panel data:The Michigan Panel Study of Income Dynamics.” Journal of Human Resources, 33, 251-299.
Gouskova, E., & Schoeni, R. F. (2002). Comparing estimates of family income in the Panel Study ofIncome Dynamics and the March current population surveys, 1968-1999. Unpublished manu-script, University of Michigan, Institute for Social Research.
Hall, M. (2001). Measurement issues in surveys of Giving and Volunteering and strategiesapplied in the design of Canada’s National Survey of Giving, Volunteering and Participating.Nonprofit and Voluntary Sector Quarterly, 30, 515-526.
Hall, M., Knighton, T., Reed, P., Bussiere, P., McRae , D., & Bowen, P. (1998). Caring Canadians, involvedCanadians: Highlights from the 1997 National Survey of Giving, Volunteering and Participating. Ottawa:Statistics Canada.
Handcock, M. S., & Morris, M. (1999). Relative distribution methods in the social sciences. New York:Springer-Verlag.
Hodgkinson, V. A., & Weitzman, M. S. (1996). Giving and volunteering in the United States:Findings from a national survey. Washington, DC: Independent Sector.
Jencks, C. (1986). Who gives to what? In W. W. Powell (Ed.), The nonprofit sector: A research hand-book. New Haven, CT: Yale University Press.
Juster, F. T., Smith, J. P., & Stafford, F. (1999). The measurement and structure of householdwealth. Labour Economics, 6, 253-275.
Kirsch, A. D., McCormack, M. T., & Saxon-Harrold, S. K. E. (2001). Evaluation of differences ingiving and volunteering data collected by in-home and telephone interviewing. Nonprofitand Voluntary Sector Quarterly, 30, 495-504.
Komter, A. E. (Ed.). (1996). The gift: An interdisciplinary perspective. Amsterdam, the Netherlands:Amsterdam University Press.
Lee, L., Piliavin, J. A., & Call, V. R. A. (1999). Giving time, money, and blood: Similarities anddifferences. Social Psychology Quarterly, 62, 276-290.
Manski, C. F. (1995). Identification problems in the social sciences. Cambridge, MA: HarvardUniversity Press.
Morgan, J. N., Dye, R. F., & Hybels, J. H. (1977). Results from two national surveys of philan-thropic activity. In Research papers sponsored by the Commission on Private Philanthropy andPublic Needs, Volume I: History, trends, and current magnitudes. Washington, DC: U.S.Department of the Treasury.
Nonprofit almanac: The new nonprofit almanac and desk reference. (2002). San Francisco: Jossey-Bass.O’Neill, M., & Roberts, W. L. (2000). Giving and volunteering in California. San Francisco: University
of San Francisco.Rooney, P. M., Mesch, D. J., Chin, W., & Steinberg, K. S. (2005). The effects of race, gender, and
survey methodologies on giving in the US. Economics Letters, 86, 173-180.Rooney, P. M., Steinberg, K. S., & Schervish, P. G. (2001). A methodological comparison of giv-
ing surveys: Indiana as a test case. Nonprofit and Voluntary Sector Quarterly, 30, 551-568.Schervish, P. G., & Havens, J. J. (1998). Embarking on a republic of benevolence? New survey
findings on charitable giving. Nonprofit and Voluntary Sector Quarterly, 27, 237-242.
Survey Data on Charitable Giving 83
reserved. Not for commercial use or unauthorized distribution.© 2007 ASSOCIATION FOR RESEARCH ON NONPROFIT ORGANIZATIONS AND VOLUNTARY ACTION. All rights
at UNIV OF MICHIGAN on April 4, 2007 http://nvs.sagepub.comDownloaded from

Schiff, J. (1990). Charitable giving and government policy: An economic analysis. New York: Greenwood.U.S. Census Bureau. (2001). Statistical abstract of the United States, 2001. Washington, DC:
Government Printing Office.Vesterlund, L. (2006). Why do people give? In R. Steinberg and W.W. Powell (Eds.), The nonprofit
sector: A research handbook. New Haven, CT: Yale University Press.Wilhelm, M. O. (2006, July 1). New data on charitable giving in the PSID. Economics Letters, 92,
26-31.
84 Wilhelm
Mark O. Wilhelm is an associate professor of economics and philanthropic studies at Indiana UniversityPurdue University–Indianapolis. His most recent research is on the transmission of philanthropic behaviorto children, generational changes in giving, the roles of empathy and principles of care in helping behavior,and the effect of low income and family structure disruption during childhood on subsequent giving andvolunteering in young adulthood. He is the founding director of the Center on Philanthropy’s PanelStudy—data on the giving and volunteering of more than 7,000 families that is a module within the PanelStudy of Income Dynamics. Waves 2001 and 2003 of the Center on Philanthropy’s Panel Study are avail-able at present. Wave 2005 will be available at the end of 2006. The data are freely available via the PSIDWeb site (http://www.philanthropy.iupui.edu/studies.htm#panel) and easier to use abstracts are available athttps://oncourse.iu.edu/access/content/user/mowilhel/Web_page/data.htm. Other information about theCenter Panel can be found at http://www.philanthropy.iupui.edu/COPPS.html.
reserved. Not for commercial use or unauthorized distribution.© 2007 ASSOCIATION FOR RESEARCH ON NONPROFIT ORGANIZATIONS AND VOLUNTARY ACTION. All rights
at UNIV OF MICHIGAN on April 4, 2007 http://nvs.sagepub.comDownloaded from