Non-woven fabric activated carbon produced from fibrous ...
41
This is a repository copy of Non-woven fabric activated carbon produced from fibrous waste biomass for sulphur dioxide control . White Rose Research Online URL for this paper: http://eprints.whiterose.ac.uk/140515/ Version: Accepted Version Article: Illingworth, JM, Rand, B and Williams, PT orcid.org/0000-0003-0401-9326 (2019) Non-woven fabric activated carbon produced from fibrous waste biomass for sulphur dioxide control. Process Safety and Environmental Protection, 122. pp. 209-220. ISSN 0957-5820 https://doi.org/10.1016/j.psep.2018.12.010 © 2018 Institution of Chemical Engineers. Published by Elsevier B.V. All rights reserved. This manuscript version is made available under the CC-BY-NC-ND 4.0 license http://creativecommons.org/licenses/by-nc-nd/4.0/. [email protected] https://eprints.whiterose.ac.uk/ Reuse This article is distributed under the terms of the Creative Commons Attribution-NonCommercial-NoDerivs (CC BY-NC-ND) licence. This licence only allows you to download this work and share it with others as long as you credit the authors, but you can’t change the article in any way or use it commercially. More information and the full terms of the licence here: https://creativecommons.org/licenses/ Takedown If you consider content in White Rose Research Online to be in breach of UK law, please notify us by emailing [email protected] including the URL of the record and the reason for the withdrawal request.
Transcript of Non-woven fabric activated carbon produced from fibrous ...
This is a repository copy of Non-woven fabric activated carbon produced from fibrous waste biomass for sulphur dioxide control.
White Rose Research Online URL for this paper:http://eprints.whiterose.ac.uk/140515/
Version: Accepted Version
Article:
Illingworth, JM, Rand, B and Williams, PT orcid.org/0000-0003-0401-9326 (2019) Non-woven fabric activated carbon produced from fibrous waste biomass for sulphur dioxide control. Process Safety and Environmental Protection, 122. pp. 209-220. ISSN 0957-5820
https://doi.org/10.1016/j.psep.2018.12.010
© 2018 Institution of Chemical Engineers. Published by Elsevier B.V. All rights reserved. This manuscript version is made available under the CC-BY-NC-ND 4.0 license http://creativecommons.org/licenses/by-nc-nd/4.0/.
[email protected]://eprints.whiterose.ac.uk/
Reuse
This article is distributed under the terms of the Creative Commons Attribution-NonCommercial-NoDerivs (CC BY-NC-ND) licence. This licence only allows you to download this work and share it with others as long as you credit the authors, but you can’t change the article in any way or use it commercially. More information and the full terms of the licence here: https://creativecommons.org/licenses/
Takedown
If you consider content in White Rose Research Online to be in breach of UK law, please notify us by emailing [email protected] including the URL of the record and the reason for the withdrawal request.
1
Non-woven fabric activated carbon produced from fibrous waste biomass for sulphur dioxide control
James M. Illingworth, Brian Rand, Paul T. Williams *
School of Chemical & Process Engineering University of Leeds, Leeds, LS2 9JT, UK
* (Corresponding author; Email: [email protected]; Tel. ##44 113 3432504) ABSTRACT: Waste fibrous biomass (flax) has been processed using non-woven textile
techniques to produce a fibrous fabric material. The biomass fabric was then processed to
produce activated carbons which retained their structure and flexibility. The carbons produced
in a range of process conditions possessed a range of different surface areas and porosities. The
activated carbons produced by chemical activation at different temperatures had high surface
areas, ranging from 126 m2 g-1 for the activated carbon produced at 450 ºC to 1177 m2 g-1
produced at 800 °C activation temperature. At increased hold times at 800 °C the surface areas
increased further, for example reaching 1656 m2 g-1 at 2 h hold time. The activated carbons
were found to be very microporous, containing very small micropores. The produced activated
carbons were then investigated in terms of the removal of sulphur dioxide in a bench scale
continuous flow reactor. The SO2 adsorption results showed that for the waste biomass fibre
carbons, uptake of SO2 from the gas stream was found to be dependent on the degree of
activation. As the micropore volume and surface area of the samples increased, the SO2
adsorption capacity also increased, observing a linear relationship. The adsorption of SO2 by
the waste derived activated carbons was significantly higher when compared to commercially
obtained activated carbons. This appeared to be related to the pore size distribution of the
samples, with the waste biomass activated carbons possessing a greater number of ultra-
micropores than the commercial samples. Increase in the temperature of the activated carbon
bed led to a marked decrease in the adsorption of SO2. Uptake of SO2 was also shown to be
dependent on the concentration of the SO2 inlet feed gas, where higher SO2 concentrations led
to enhanced uptake. The advantages of using textile processing techniques to produce a non-
woven fabric activated carbon enabling different forms to be produced related to the end-use
application has great potential for resource recovery.
Keywords: Biomass; Waste; Activated carbon; Sulphur dioxide; Resource efficiency; Environment
2
1. Introduction
There is considerable current concern over the emissions of pollutants to the atmosphere from
industrial processes. Sulphur dioxide emissions are of particular concern since it has a
detrimental effects on human health and the environment and there are strict regulatory controls
of emissions of SO2 from industrial processes (Xu et al, 2016). For example, the European
Industrial Emissions Directive (EC, 2010) covers SO2 emissions (and other emissions) from a
range of large plants including coal fired power plant, cement kilns, steel industry, waste
incinerators etc. The most common methods for control of sulphur dioxide involve
desulphurisation with reactants such as lime or limestone, or wet-scrubbing with alkalis such
as calcium hydroxide or sodium hydroxide (Karatepe, 2000; Sun et al., 2016). However, there
is growing interest in the use of activated carbon for control of SO2 due to advantages which
include high operational flexibility and lower maintenance costs (Karatepe, 2000; Xu et al,
2016).
Activated carbons are high surface area, high porosity materials with a high surface
activity and mechanical strength which are widely used in industrial applications (Yahya et al.,
2015). Biomass waste in the form of agricultural waste materials have been extensively
investigated as precursors for the production of activated carbons (Yahya et al, 2015, Koseoglu
and Akmil-Basar, 2015; Ioannidou and Zabaniotou, 2007). For example, cotton stalks (Nahil
and Williams, 2012) date stones (Al -Rahbi et al, 2016), coconut shell (Hu and Srinivasan,
1999) palm shell (Daud et al, 2000) rice bran (Suzuki et al, 2007), corn cobs (El-Hendawy et
al., 2001) rice husks (Yalcin and Sevine, 2000) etc.
The adsorptive properties of such waste derived activated carbons have been utilised as
pollution control materials for control of polluting gases. For example, Al-Rahbi et al (2016)
used waste biomass in the form of date stones to produce activated carbons for the low
3
temperature (50 °C) control of NOx. They reported that the biomass derived activated carbon
had similar removal efficiencies for NOx as for commercially available activated carbons and
that the micropore structure of the carbon significantly influences removal efficiency. Porosity
classification of activated carbons have been defined by the International Union of Pure and
Applied Chemistry (IUPAC) as micropores (pore size <2 nm) mesopores, (2-50 nm) and
mesopores (>50 nm) (Yahya et al, 2015). Very small micropores have also been defined as
ultra-micropores with pore size < 0.5 nm. Lee et al (2002) prepared activated carbons via the
chemical activation of coconut shells and investigated their use for the removal of SO2 in a
fixed bed reactor. They reported that the adsorption of SO2 was influenced by the alkali used
in the chemical activation (KOH) through chemical adsorption. Katada et al (2003) investigated
the removal of sulphur dioxide using activated carbons produced from several waste biomass,
including waste urban wood and coconut shells in a fixed bed reactor at low temperature (45
°C). They reported high removal efficiencies for some of the biomass derived activated carbons
(>90%) which they attributed to the pore structure, surface chemistry and
hydrophobic/hydrophilic properties of the carbons. Guo and Lua (2003) also used a fixed bed
reactor system to study the adsorption of sulphur dioxide in nitrogen onto activated carbons
produced from waste biomass in the form of oil-palm shells. They reported that the uptake of
the sulphur dioxide was dependent on the operating conditions of the reactor (particularly SO2
flow rate), the textural characteristics (particle size and porosity) of the carbon and the surface
chemistry of the activated carbon.
Activated carbons are produced using either physical activation or chemical activation
(Yahya et al, 2015). Physical activation is a two-stage process, firstly involving pyrolysis of
the biomass agricultural waste material (typically at ~ 500 °C) in an inert atmosphere which
produces a char. The char is then activated via partial oxidation with air, steam or carbon
dioxide to produce the activated carbon (typically at ~700-900 °C). Chemical activation

4
involves impregnation of either the biomass precursor or the pyrolysis char with the chemical
activating agent (typically used are KOH, NaOH, HNO3. H3PO4, ZnCl2) followed by activation
in an inert atmosphere at temperatures which can range from 300 – 800 °C. The chemicals
acting as dehydrating agents and oxidants to aid pore development in the carbon. A final stage
involves washing of the product activated carbon to remove the residual activating chemicals.
For particular control of sulphur dioxide, activated carbon in the form of activated
carbon fibres have been shown to be effective for control of SO2 from flue gases (Mochida et
al, 2000; Mangun et al, 2001; Daley et al., 1997; Davini 2003; Gaur et al, 2006). For example,
Magnun et al (2001) used activated carbon fibres with different surface areas (730 – 1890 m2
g -1) prepared from a woven phenolic fibre and steam/CO2 activation for the adsorption of SO2
at 120 °C. They reported that SO2 adsorption was influenced by pore size and the basicity of
the carbon surface groups, but there was less influence of surface area. Davini (2003) used
activated carbon fibres produced from polyacrylonitrile fibres and CO2 activation for control
of SO2 from a simulated mixture of flue gases at a temperature between 100 and 160 °C.
Surface chemistry, i.e. the presence of nitrogen groups from the acrylonitrile precursor were
found to influence the amount of SO2 adsorbed. Commercially produced activated carbon fibre
is produced via a synthetic process. For example, the raw material such as acrylonitrile or coal
tar pitch is polymerised and spun to produce fibres which are then oxidised and activated to
produce the activated carbon fibre (Mochida et al, 2000). It has been reported that such
synthetically activated carbon fibres have superior adsorption ability compared to granular
activated carbons. This has been ascribed to the micropores in the carbon fibres which open
directly onto the surface of the carbon rather than being located within mesopores or
transitional pores (Mochida et al, 2000). In addition, the small size of the fibres facilitates
gas/liquid to solid interaction (Gaur et al, 2006). However, synthetically produced activated
carbon fibres are more expensive (Mochida et al, 2000). Therefore the production of activated
5
carbon fibres from fibrous biomass waste which have good adsorptive properties for pollutants
would be of significant economic potential.
A particular type of biomass waste is fibrous biomass which has also been investigated
for the production of activated carbons (Dizbay-Onat et al, 2017; Shamsuddin et al, 2016;
Hwang et al, 2015; Zhao et al. 2015). The fibrous nature of the biomass waste material has
been utilised in our previous work to produce a non-woven textile fabric matting which is then
processed to produce activated carbon that retains its original fabric matting structure after
activation (Illingworth et al, 2012; Williams and Reed, 2003; 2004). The process has the
potential for the fibrous biomass to be produced via textile technology into a variety of pre-
formed shapes. Thereby the activated carbon fabric matting can be used directly in various end-
use applications, rather than the need for further processing such as granulation of the carbon,
cartridge packing or attachment to a support.
There are few studies reporting on the use of activated carbon fibrous material produced
from biomass fibrous waste material and none related to the adsorption of SO2 using processed
activated carbon fabric matting. In this paper we report on the production of activated carbon
fabric matting using physical and chemical activation for the adsorption of SO2. Different
process conditions for the production of the activated carbon matting have been used and their
influence on SO2 adsorption investigated. The adsorption results are compared with that
obtained using commercially available activated carbons.
2. Materials and methods
2.1 Materials

6
The precursor biomass material used for the production of the non-woven biomass fabric was
a low-grade flax fibre obtained from British Fibres Limited, UK. The raw flax was prepared
using a ‘scutching’ process which separates the woody flax stems from the surface of the fibres
producing the raw material for the experiments which consisted of long flax fibres, shorter
coarse fibres and surface woody material. The produced flax fibre was then processed into a
non-woven fabric material. The process involved aligning the fibres into parallel arrays using
rotating cylinders covered with small wires. The position of the wires can be modified during
the process to alter the direction in which the fibres are laid, thereby providing a greater cross
directional strength within the fabric. The flax material was produced at a uniform thickness of
8mm. The fabric was then subjected to needle-punch bonding, whereby, barbed needles are
punched through the fabric, hooking and tangling the fibres together, enhancing the strength
and stability of the non-woven fabric. Finally, the material was rolled between two heated
cylinders where the heat and pressure causes the fibres to fuse, further adding to the structural
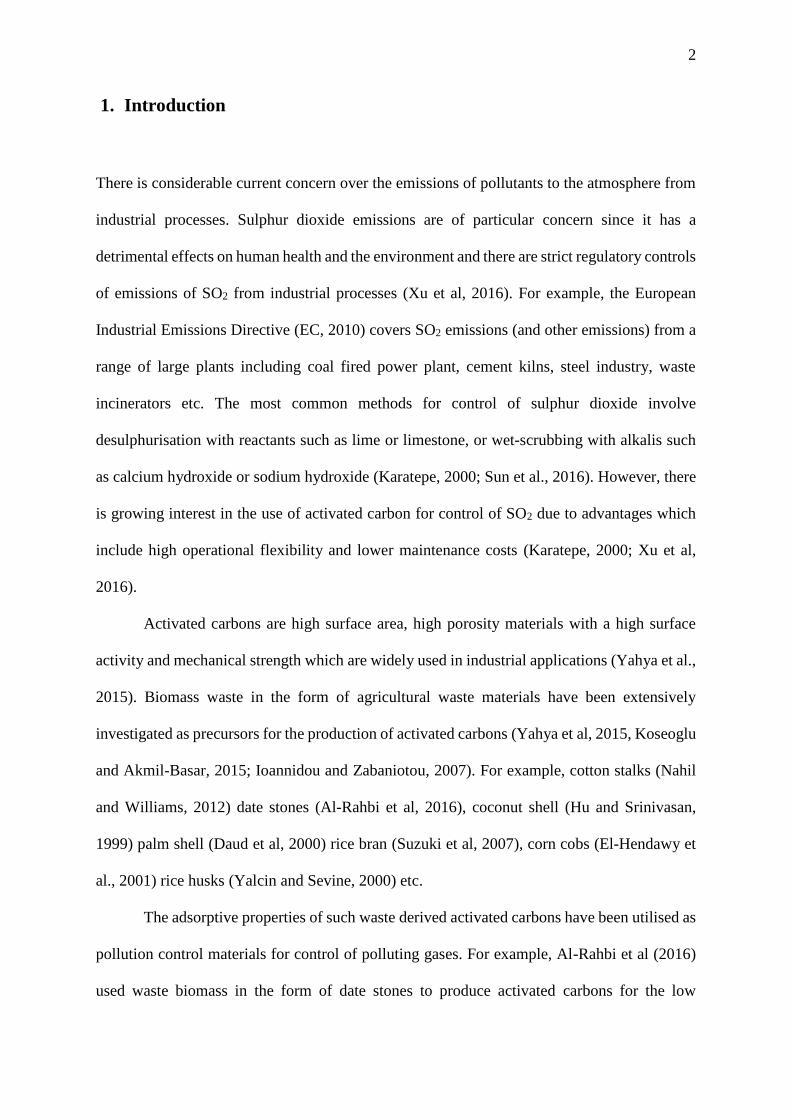
stability of the non-woven fabric. Figure 1 shows a photograph of the non-woven fibrous flax
fabric material.
For comparison of the effectiveness of the produced activated carbons in relation to
their effectiveness for SO2 adsorption, three commercial activated carbons were used for
comparison. These were an activated carbon fibre from the Osaka Gas Company, Japan), a
granular lignite carbon from BDH Ltd., UK, and a powdered carbon (Darco) obtained from
Sigma Aldrich Ltd.
2.2. Production of activated carbons
The production of activated carbon involved mainly chemical activation through pyrolysis of
the flax biomass material followed by chemical impregnation of the char and activation at
7
temperatures between 450 °C and 800 ºC. In addition, samples of activated carbon were
prepared by physical activation, involving production of the pyrolysis char followed by
activation in carbon dioxide. The pyrolysis of the non-woven flax fabric material was carried
out in a bench scale static-bed batch reactor, the details of which have been reported in our
earlier work (Illingworth et al., 2012). The reactor was constructed of stainless steel (length
200mm, internal diameter 65mm) which enabled the pyrolysis of up to 60 grams of biomass
material. The reactor was heated by an electrically heated vertical furnace (length 300 mm,
internal diameter 75mm). Nitrogen was sued as the purge gas to maintain pyrolysis conditions.
The samples of biomass non-woven material were heated at a heating rate of 2 oC min-1 to the
final pyrolysis temperature of 800 ºC and held at that temperature for 60 mins.
Chemical activation of the pyrolysis chars was the method used to produce the activated
carbons. The product non-woven flax char material derived from pyrolysis was dried overnight
at 110oC and 1.00g quantities were then thoroughly mixed with 50ml of deionised water
containing potassium hydroxide as the activating chemical. The ratio of mass of KOH to mass
of char was 4:1. The mixture was then evaporated to dryness at 80oC before drying at 110oC
for 24 hours. The impregnated chars were then heated at 5oC min-1 to the activation
temperatures of either 450 ºC, 650 °C or 800 ºC without any hold time under a nitrogen flow
using the same reactor used for pyrolysis. In addition, hold times at 800 °C were also increased
to 1 and 2h. After the activation procedure, the carbons were washed with water to remove the
residual KOH until the wash water attained a pH of 7 to 7.5. The product activated carbons
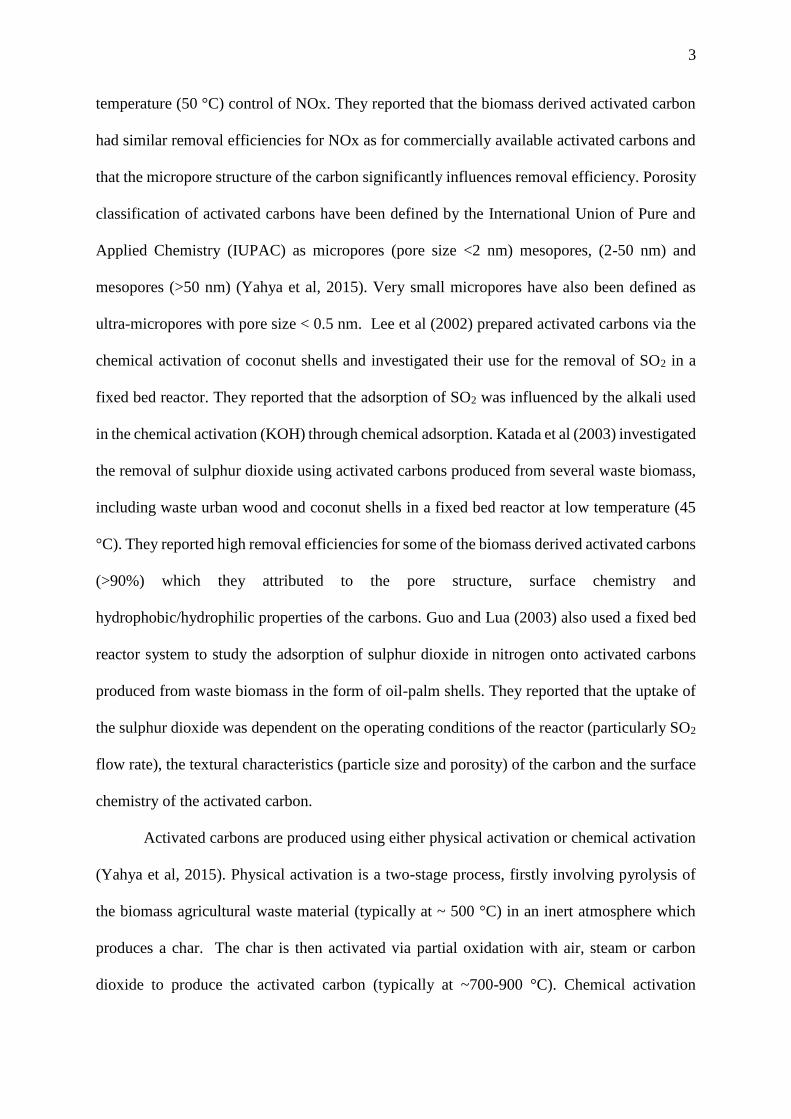
were finally dried at 110oC for 24 hours. A typical non-woven fibrous activated carbon fabric
material produced by pyrolysis followed by activation using KOH is shown in Figure 2.
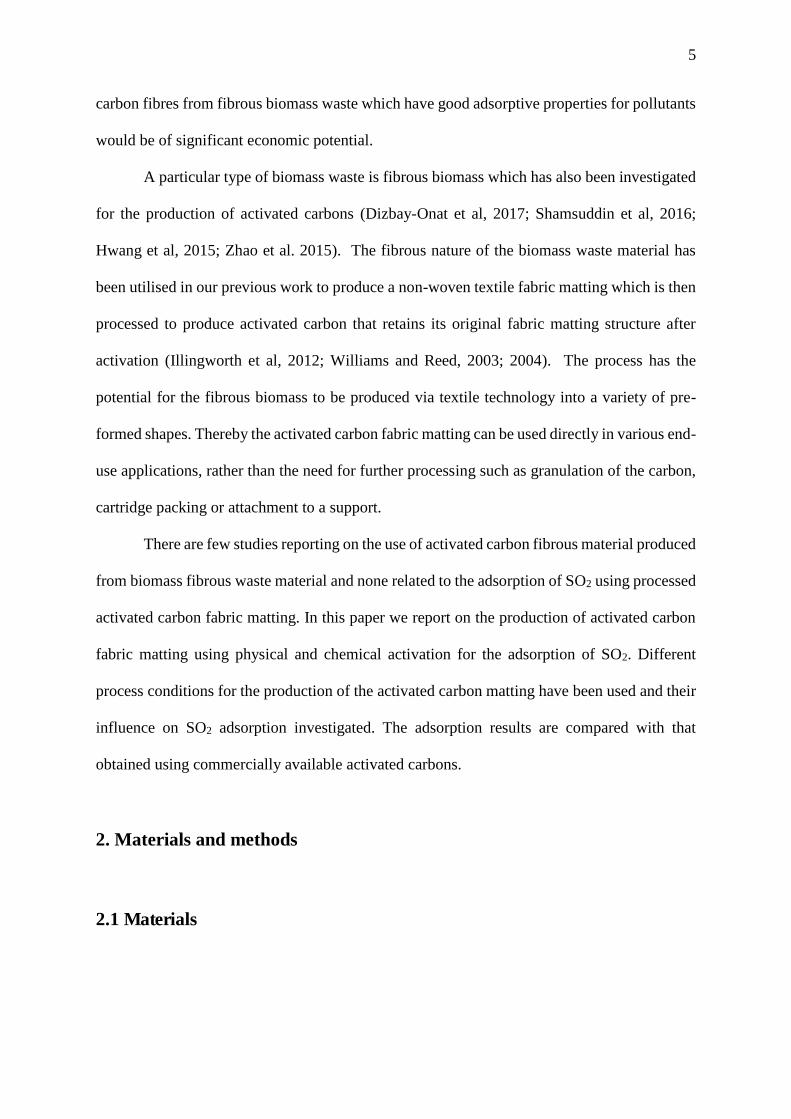
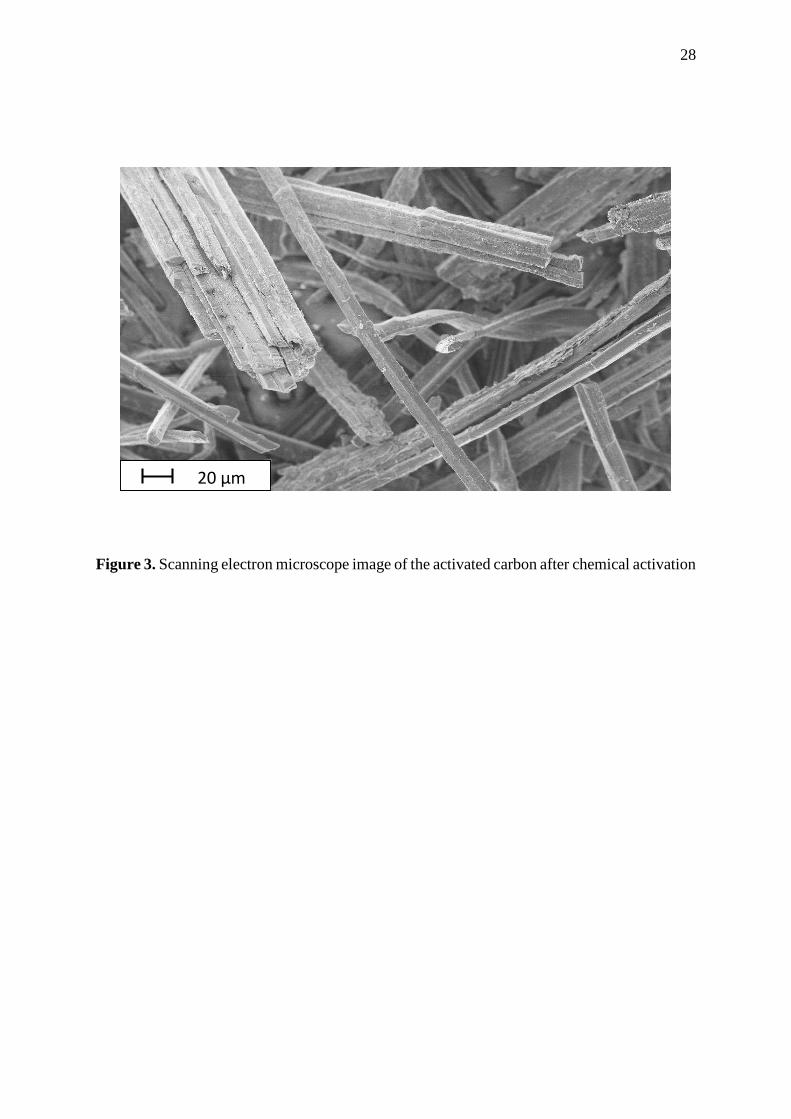
Examination of the activated carbon produced by chemical activation by scanning electron
microscopy (Figure 3) also showed the fibrous nature and fibre shape and structure of the
original flax biomass waste had been retained after the chemical activation procedure.
8
In addition, physical activation of the flax pyrolysis chars was carried out to produce
activated carbons to compare with the activated carbons produced via chemical activation. The
pyrolysis chars produced from the non-woven flax material were heated at 5 °C min-1 to a final
temperature of 825 ºC under a nitrogen flow using the same reactor used for pyrolysis. The
nitrogen flow was then switched to CO2 which acted as the activation gas. Carbon dioxide
activation was carried out at 825 °C for 6 h.
2.3. Characterisation of surface area and porosity of activated carbons
The surface area and porosities of the product activated carbons was determined using a
Quantachrome Autosorb 1-C Instrument. All chars were outgassed prior to analysis and
nitrogen adsorption isotherms were determined over a range of relative pressures from 1x10⁻⁶
to 0.995 and desorption isotherms were measured down to a partial pressure of 0.10. The
surface area of the activated carbons was calculated using the BET procedure and the total
micropore volume using the Dubinin-Radushkevitch (DR) equation (DR-N2). The Dudbinin-
Radushkevitch equation was used to provide an assessment of the volume of very small ultra-
micropores (DR-CO2) (pore size <0.7nm) from adsorption isotherms of CO2 produced at 273K
over the relative pressure range 1x10⁻⁶ to 0.03. Micropore size distributions were constructed
using the Density Functional Theory (DFT) software supplied by Quantachrome Ltd.
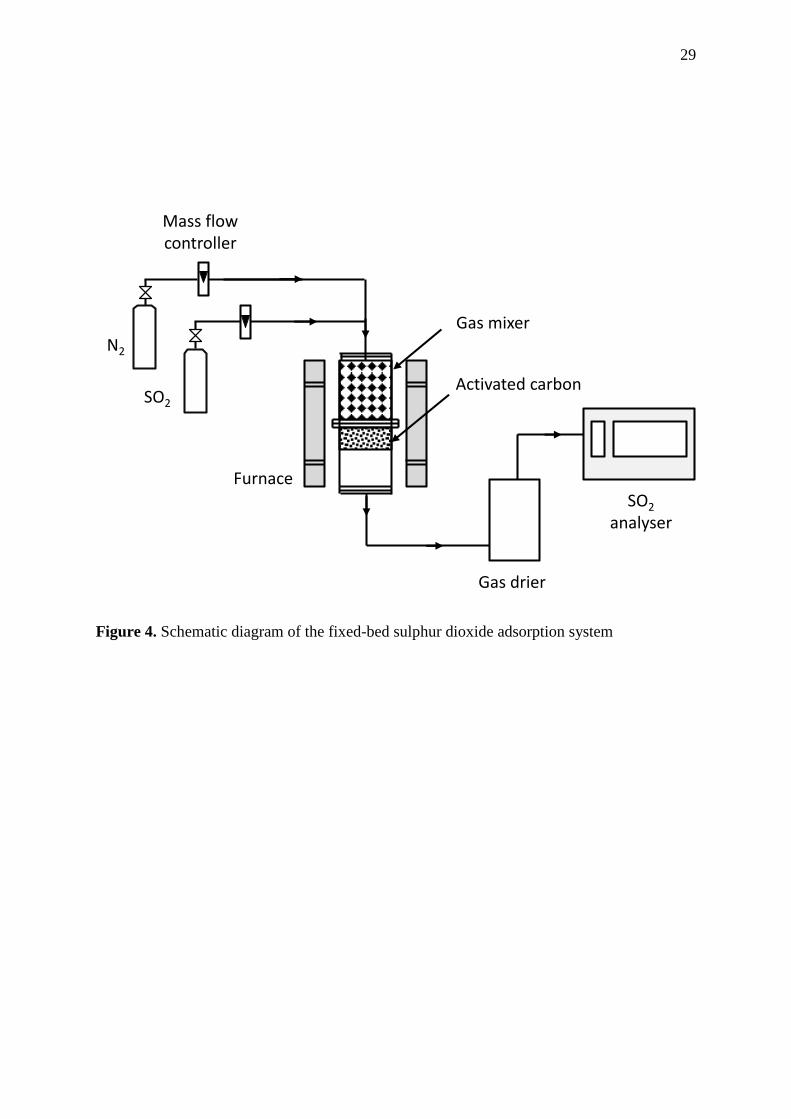
2.4. Sulphur Dioxide Adsorption System
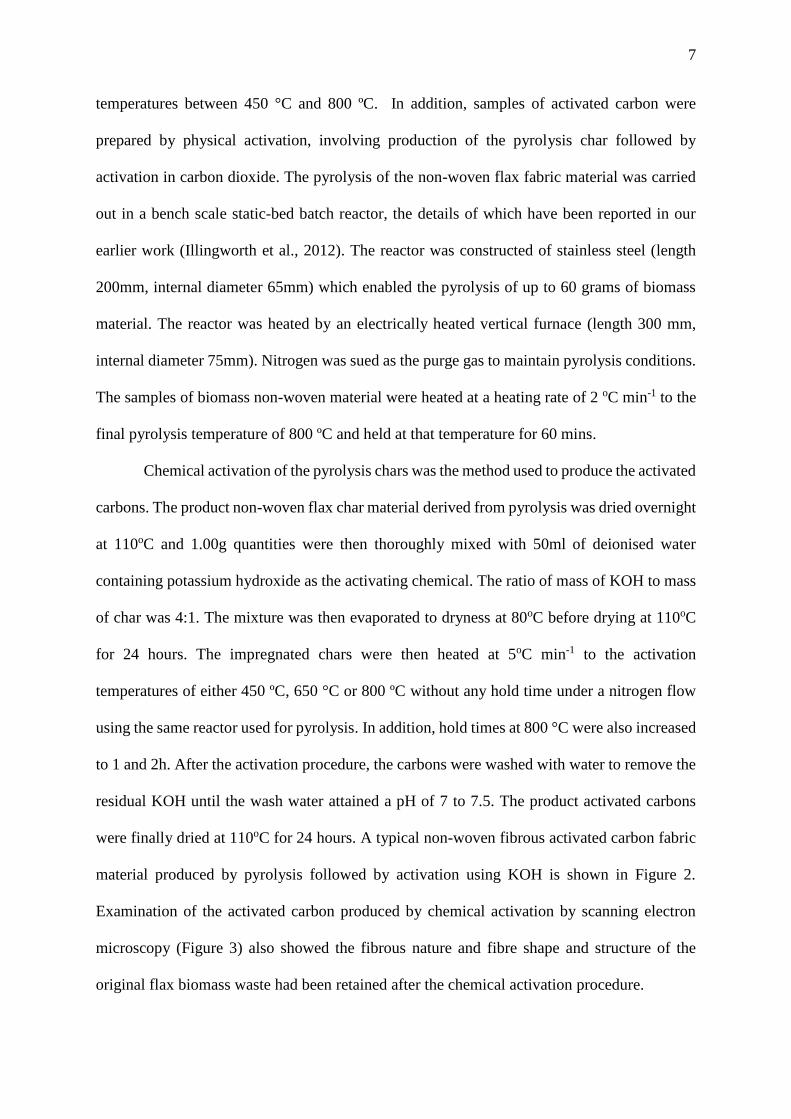
The SO2 adsorption experiments using the product activated carbons and the commercially
obtained activated carbons were investigated using a continuous flow reactor (Figure 4). The
reactor was constructed of stainless steel (120 mm length, 20 mm diameter) and was heated

9
externally by an electrical furnace. A standard SO2 gas mixture was purchased from BOC
Gases Ltd. UK and contained 5000 ppm SO2 balanced by nitrogen. The gas could be mixed
with additional nitrogen to produce different concentrations of SO2 for the adsorption
experiments. The flow of gases was measured by calibrated rotameters. To ensure efficient
mixing of the gases prior to the sample bed, the top half of the reactor unit was packed with
stainless steel grommets.
A sample (250 mg) of the activated carbon was mixed with 5.00g of sand in a removable
sample holder to give a bed depth of ~15 mm and was dried at 120 ºC for 2 hours prior to the
SO2 adsorption experiments. This dispersed bed configuration was used to minimise pressure
drop differences (Li et al. (2002)). Initial experiments showed that the adsorption of SO2 on
the sand was insignificant. The sample bed of activated carbon was fixed in position by fine
wire gauze and glass fibre filters to prevent channelling of the gas flow through the bed. For
all breakthrough experiments, time zero was defined as the time taken for the outlet SO2
concentration to equal the inlet concentration with the sample bed containing only sand. The
SO2 laden gas was then passed through the carbon bed and the outlet concentration was
measured on-line using an Analytical Development Company Ltd, UK infrared SO2 gas
analyser (ppmv). In all cases, the gas flow rate was maintained at 300ml min-1 which was the
minimum flow accepted by the on-line analyser. The adsorption was performed until the bed
reached saturation, i.e. the outlet concentration becoming equal to the inlet concentration.
Following the experiments, breakthrough curves could then be plotted and the total
amount of SO2 adsorbed calculated. The mass of SO2 passing through the sample bed between
each measurement period (1 minute) can be calculated according to equations 1 - 3:
QSO2 = (VSO2 / 100) x Q (1)
where: QSO2 = flow of SO2 through sample bed (l min-1)

10
VSO2 = vol% of SO2 in feed gas
Q = total flow of gas through sample bed (l min-1)
then MSO2 = (Q SO2/24.04) x RMMSO2 (2)
where: MSO2 = mass of SO2 passing through sample bed (g min-1)
RMMSO2 = relative molecular mass of SO2 (64g mol-1)
therefore, the mass of SO2 adsorbed over each measurement period may be defined as:
ASO2 = MSO2 x 1- C/C0(t) + C/C0(t+1) (3)
2
where: ASO2 = mass of SO2 adsorbed over 1 minute measurement period (g)
C/C0(t)= ratio of outlet concentration/inlet concentration of SO2 at time t
C/C0(t+1) = ratio of outlet concentration/inlet concentration at time t + 1 minute
The total mass of SO2 adsorbed during a breakthrough experiment can then be calculated as
follows:
ATOT = (∑ASO2) x 1/WC (4)
where: ATOT = total mass of SO2 adsorbed (g gC-1)
WC = mass of carbon sample in fixed bed (g)
3. RESULTS AND DISCUSSION
3.1 Surface area and porosity characteristics of the activated carbons
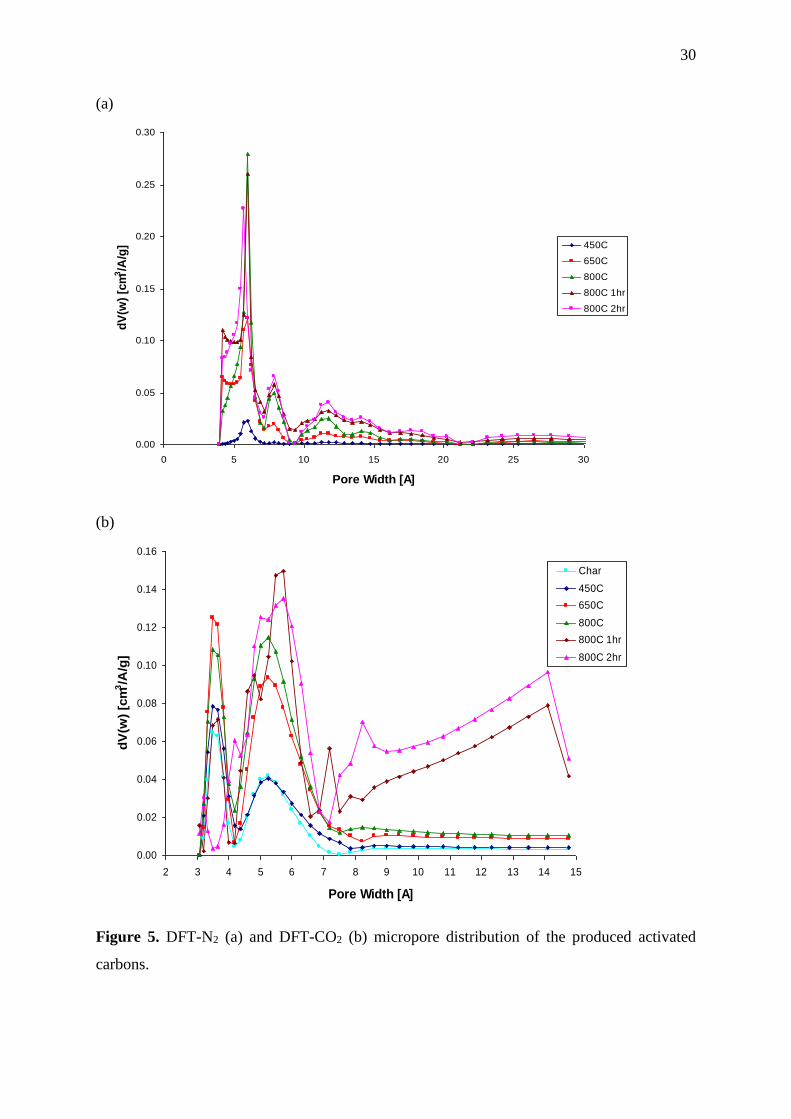
Density Functional Theory (DFT) software was used to determine the micropore size
distributions of the produced activated carbons and the commercially obtained carbons. Figure

11
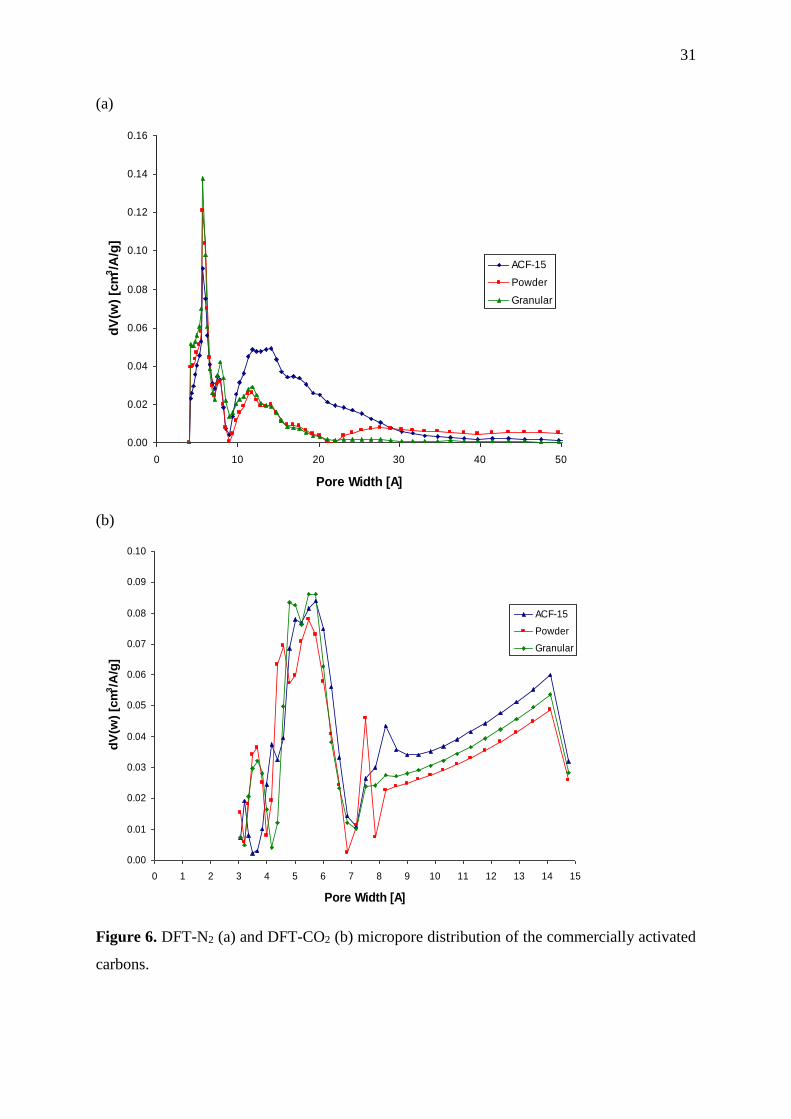
5 shows the DFT-N2 and DFT-CO2 for the produced carbons and Figure 6 for the commercially
obtained carbons respectively. For the produced carbons (Figure 5), there is considerable pore
development during the activation process compared to the pyrolysis char. In particular the
micropores of <7 Å and ultra-micropores of <4 Å show significant increase as the activation
temperature was increased. It is also noteworthy that for longer time duration at 800 °C
activation temperature of 1 h and 2 h, the carbons show the presence of larger pores of >7 Å
suggesting degradation of pore walls and pore widening. Figure 6 shows the DFT micropore
size distributions of the commercially obtained carbons. The results suggest that the
commercially obtained activated carbons have a lower pore size distribution below 7 Å, and
significantly less of the ultra-micropores of <4 Å.
Table 1 shows the surface area and porosity characteristics of the intermediate pyrolysis
char and activated carbons produced in this work and the commercially obtained activated
carbons. The char produced from pyrolysis of the non-woven flax fabric material had a
relatively low surface area of 30 m2 g-1 and low microporosity. The influence of chemical
activation showed an improvement in surface area and development of microporosity in the
product activated carbons. The influence of chemical activation at 450 ºC activation
temperature was modest, but at higher temperatures the development of surface area and
porosity became very marked, such that at 800 ºC and no hold time the surface area reached
1177 m2 g-1 and micropore volume (DR-N2) reached 0.451 cm3 g-1. It is also noteworthy that
the yield of the activated carbon product was 83 wt.% at 800 ºC activation temperature and no
hold time. Increasing the hold time at 800 °C produced very high surface area activated carbon,
at 1564 m2 g1 and 1 h hold time and 1656 m2 g-1 at 2 h hold time and also increased micropore
volumes, however, activated carbon yields decreased to 67 wt.% and 57 wt.% respectively.
The activated carbon produced via physical activation had much lower surface area and lower
micropore volume and lower yield compared with the chemically activated carbons. Table 1
12
also shows the properties of the commercially obtained activated carbons, notable is the high
surface area of the activated carbon fibres (1715 m2 g-1) and high microporosity (0.633 cm3 g-
1 pore volume).
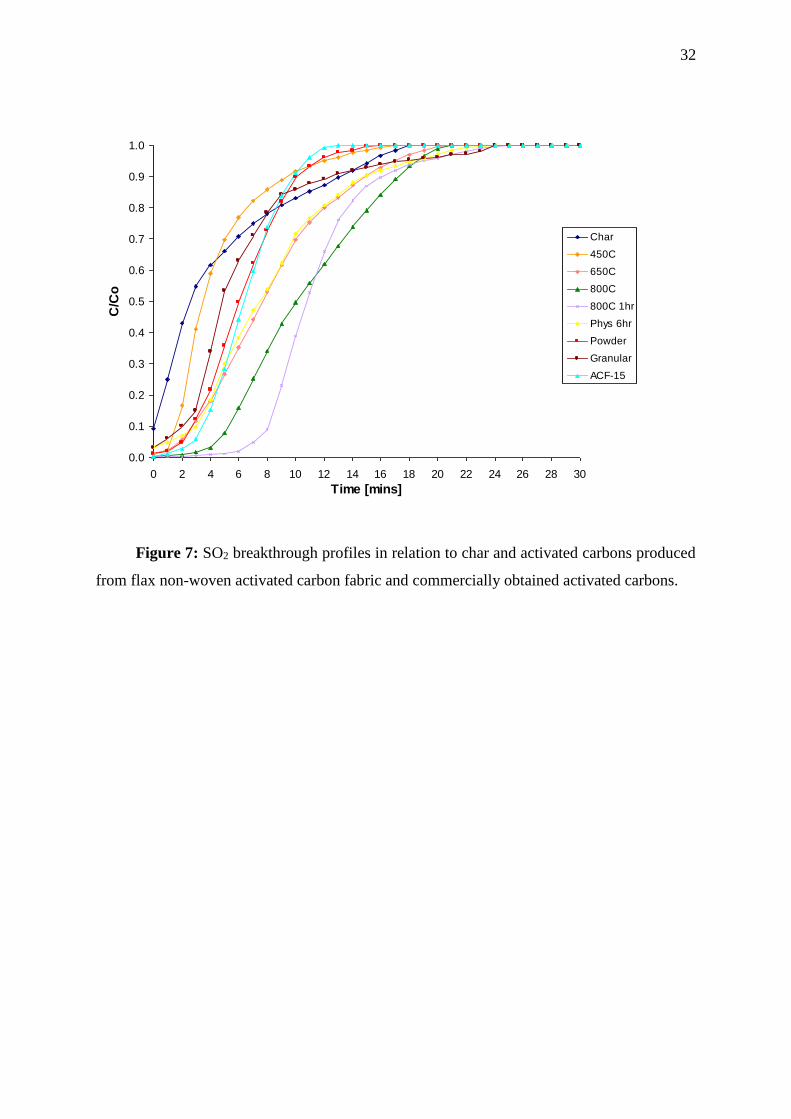
3.2. SO2 adsorption by the activated carbons
Figure 7 shows the SO2 breakthrough curves and Figure 8 shows the cumulative SO2 adsorption
profiles for the pyrolysis char and the activated carbons produced by chemical and physical
activation of the flax non-woven fabric material. Also shown are the SO2 breakthrough curves
and cumulative SO2 adsorption profiles for the commercially obtained activated carbons. Not
tested was the chemically activated carbon at 2 h hold time at 800 ºC as the surface area and
porosity characteristics were similar to the activated carbon produced at 1 h hold time. The SO2
adsorption tests were carried out at a reaction temperature of 25 °C and with an SO2
concentration of 2500ppm, balanced by nitrogen.
The commercially obtained activated carbons showed similar overall adsorptive
capacities for SO2 even though there were large differences in the BET surface area and
micropore volume. However, the characteristics of the microporosity as determined by CO2
adsorption at 273K were similar for the three commercial activated carbons. This seems to
suggest, at the low partial pressures of SO2 employed, that the adsorption was taking place
primarily in the ultra-micropores. Although the adsorption capacity was similar, the rate at
which equilibrium was obtained varied considerably. Figure 8 shows that activated carbon fibre
and powder samples showed the most rapid adsorption, and that saturation of the carbon
adsorption bed was reached in 13 and 16 minutes respectively. The granular activated carbon
showed the slowest rate of adsorption where equilibrium was reached at 23 minutes. This is
most probably related to the slower rates of diffusion of the SO2 to the adsorption sites away

13
from the surface of the carbon granules. The smaller dimensions of the activated carbon fibre
(15-20µm) and powder (ca. 100µm) would allow more efficient access to the adsorption sites.
Lua and Guo (2001) examined the effect of particle size on the uptake of SO2 with physically
activated carbons obtained from oil-palm stones. They found that an increase in particle size
(from 1.0-2.0mm to 2.8-4.0mm) had no effect on the total amount of SO2 adsorbed but the time
taken to reach saturation increased from ~40 to ~80 minutes. It was concluded that the larger
the particle size the longer would be the time required for the SO2 molecules to diffuse into the
pore sites.
Figures 7 and 8 also show the SO2 breakthrough curves and the cumulative SO2
adsorption profiles for the pyrolysis char and also the activated carbons prepared by chemical
activation with KOH, and the physically activated carbon. The pyrolysis char exhibited a
significant SO2 adsorption capacity, representing ~70% of the total adsorption of the
commercial activated carbons. The isotherms of carbon dioxide at 273K allow a more accurate
assessment of the ultra-micropores (DR-CO2). The critical molecular dimensions of N2 and
CO2 gases are similar, however the CO2 molecule has far greater kinetic energy at 273K than
N2 at 77K, thus facilitating entry to very fine pores of molecular dimensions. The uptake of
CO2 by the pyrolysis char as evidenced by the DR-CO2 data of Table 1 suggests that although
inaccessible to N2 at 77K, the flax pyrolysis char shows considerable uptake of CO2 at 273K
indicating the presence of ultra-micropores. These very small micropores would be more
accessible to SO2 at the temperatures used in this study as the dimensions of the two molecules
are quite similar (3.90Å for CO2, 4.29Å for SO2 (Harrison, 1977) as shown in Figure 7.
Figures 7 and 8 show that for the series of chemically activated carbons produced from
the biomass waste flax, non-woven fabric there was a data trend of increasing SO2 adsorption
as the degree of activation in terms of the activation temperature and hold time at the activation
temperature was increased. That is, the activated carbon produced by chemical activation with
14
KOH at 800 °C and with a hold time of 1 h produced the highest uptake of SO2. The chemically
activated carbon produced at 450 °C had a similar adsorption capacity to the pyrolysis char but
showed more rapid uptake in the initial stages of the experiment, suggesting a slight widening
of porosity during the activation process allowing increased access to the adsorption sites. As
the activation temperature was raised to 650 ºC and further to 800 ºC, a large increase in SO2
adsorption was observed coinciding with a substantial increase in the micropore volume as
shown by the DR-N2 micropore volume data of Table 1. The increase in capacity was less
marked for the 800 °C (1hr) activated carbon sample despite a significant increase in the wider
micropore volume (DR-N2). However, the very small micropore volume (DR-CO2) showed
only a slight increase, again indicating that the adsorption is taking place mainly in the ultra-
micropores. The time taken to establish equilibrium (Figure 8) for the chemically activated
carbons was generally longer than for the commercially obtained activated carbon powder and
fibre samples. However, the overall adsorption capacity for SO2 was much higher for the waste
derived flax non-woven activated carbon fabric samples. The flax non-woven fabric activated
carbon produced by physical activation showed similar SO2 adsorption to the 650 °C KOH
chemically activated carbon sample, both of which had similar values for the very small
micropore volume (DR-CO2).
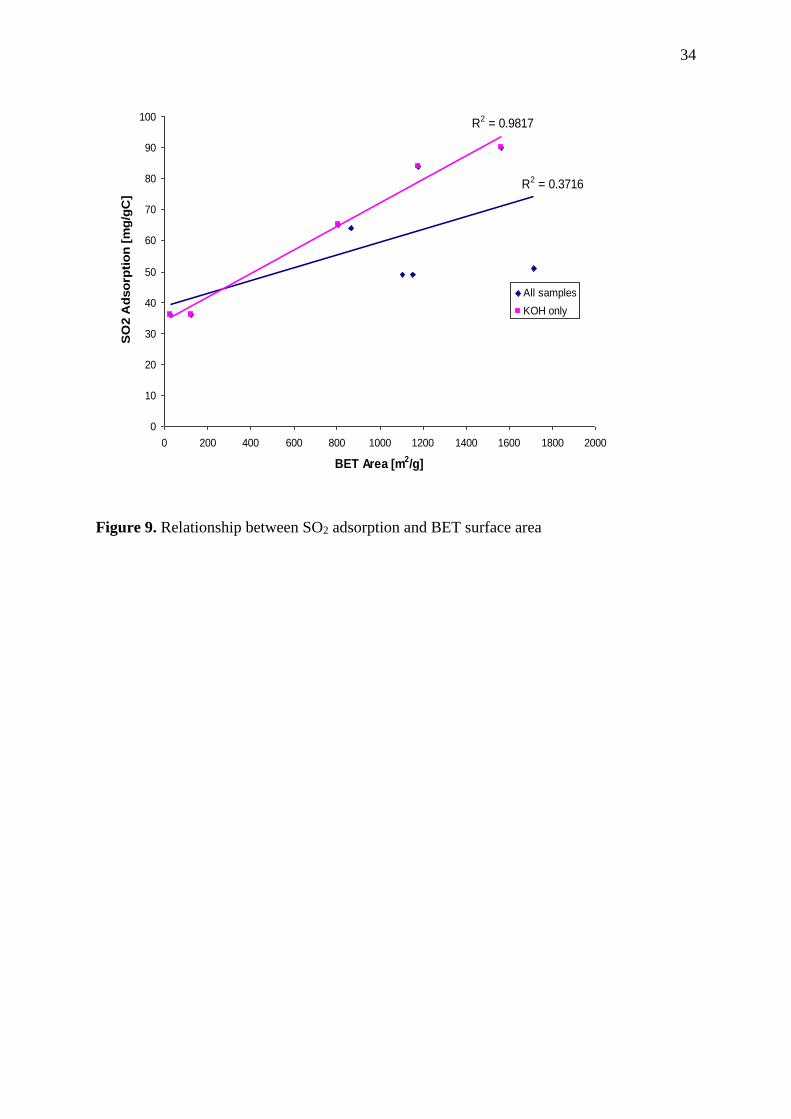
The relationship between the BET surface area and uptake of SO2 (from Figure 8) is
shown in Figure 9. When all of the activated carbon samples investigated are plotted, there was
little relationship between the surface area and the SO2 capacity of the samples. However, when
considering only the KOH chemically activated series of biomass waste derived activated
carbons, a good correlation was observed. It is suggested that this is due to the fibrous nature
of the chemically activated carbons and the high proportion of the very small ultra-micropores
present in these activated carbons, which make up a substantial proportion of the surface area.

15
Figure 10 shows the relationship between SO2 adsorption capacity and the micropore
volume for all of the activated carbon samples examined. There appears to be very little
correlation between the SO2 uptake (from Figure 8) of the samples and the micropore volume
as determined by N2 adsorption (DR-N2). In contrast, an improved correlation was observed
between the SO2 uptake and the micropore volume measured by CO2 adsorption (DR-CO2).
This correlation was improved considerably when the commercially obtained activated carbon
samples were omitted from the data, with an r2 value above 0.99. This suggests a linear
relationship between the ultra-micropore volume as assessed by CO2 adsorption, and the SO2
adsorption capacity.
A further factor which would influence uptake of SO2 of the chemically activated
carbons is the surface chemistry of the carbons. Activation with an alkali activating agent in
the form of KOH would lead to an increase in the basicity of the carbon surface (Xu et al.
2016). The alkaline surface properties would enhance the adsorption of the acidic gas SO2. Xu
et al. (2016), have also noted that char produced from pyrolysis of biomass is quite alkaline
with pH values >8, suggesting that the high activity of the flax non-woven biomass pyrolysis
char for SO2 adsorption shown in this work may also be due to the alkaline properties of the
char. In addition, the presence of surface oxygen in the form of oxygen-containing functional
groups would enhance SO2 uptake (Li et al, 2001, Karatepe et al, 2008).
The adsorption capacities of the non-woven fabric material produced from the flax
biomass waste are similar to other reported data. For example, Guo and Lua (2002) examined
SO2 adsorption (2000 ppm in nitrogen) on oil palm-shell based activated carbons activated
under various conditions. For a given surface area, KOH activated palm-shell chars produced
higher SO2 capacities than physically activated carbons from the same precursor. Uptake of
SO2 by the KOH activated carbons ranged from ~30 ⦆ 70 mg SO2/gC as the surface area was
increased from 350-1400 m2 g-1, with a linear trend observed. The authors suggested that the

16
enhanced uptake of SO2 by the KOH activated carbons was due to the presence of sub-
micropores that were accessible to SO2 at room temperature.
The particular characteristics of the non-woven fabric activated carbon material would
also enhance SO2 uptake, because of the fibrous nature of the activated carbon. Because of the
micron-sized (typically 5 – 20 µm) fibres (Figure 3), the particle size mass transfer resistance
is almost negligible (Gaur et al, 2006)
3.3. Influence of process parameters on SO2 adsorption by the activated
carbons
The influence of activated carbon temperature and SO2 gas concentration in the inlet gases on
adsorption of SO2 by the biomass waste derived activated carbons was investigated. The
influence of temperature was investigated using the activated carbon produced at 800 ºC using
chemical activation with KOH at reactor temperatures of 25 °C, 40 ºC and 100 °C. The SO2
breakthrough curves and the cumulative SO2 adsorption profiles for the activated carbon in
relation to temperature are shown in Figure 11 and Figure 12 respectively. The results show
clearly that there is a marked reduction in the SO2 breakthrough time period as the temperature
of the reactor was increased, similarly the adsorption capacity of the carbon was rapidly
reduced as the temperature was increased to 100 ºC. Karatepe et al, (2008) also showed that
increasing the activated carbon adsorption temperature from 25 °C to 50 ºC resulted in a
significant decrease in the adsorption of SO2 for activated carbon produced from lignite. They
suggested that the reduction was due to the fact that during the adsorption process, the
molecules of SO2 lose their kinetic energy resulting in an exothermic process. Therefore,
increasing the adsorption temperature produces lower SO2 adsorption.
17
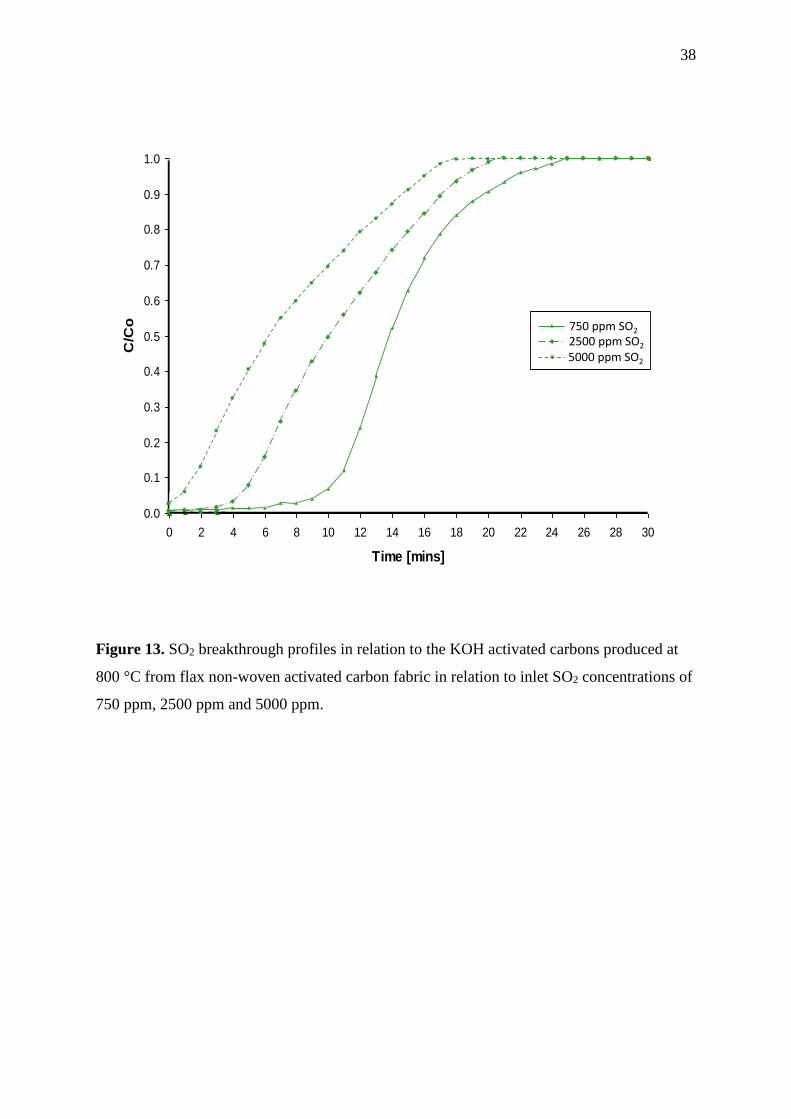
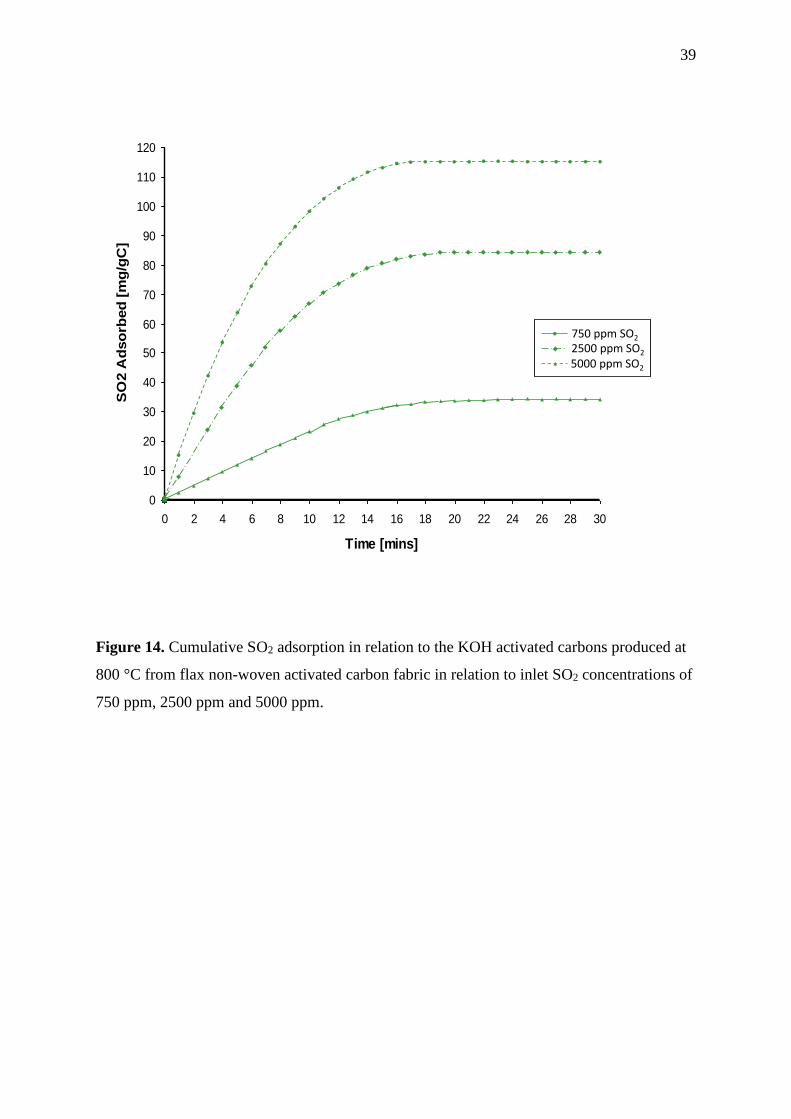
The effect of varying the inlet gas concentration of SO2 on the adsorption capacity of
the activated carbon produced at the activation temperature of 800 ºC using chemical activation
with KOH was investigated. Breakthrough experiments were carried out with SO2
concentrations of 750, 2500 and 5000ppm in the inlet feed gas. The breakthrough curves and
cumulative SO adsorption results are shown in Figures 13 and 14 respectively. For all samples,
the uptake of SO2 increased significantly as the concentration in the feed was increased and
more rapid breakthrough was also observed. Similar trends were observed by Lua and Guo
(2001) as they varied the SO2 inlet gas concentration from 500 to 2000 ppm for activated
carbons produced from oil-palm stones. Karatepe et al. (2008) also showed that higher
concentrations of SO2 inlet gas led to higher adsorption of SO2 onto activated carbon produced
from lignite.
Overall the research has shown that activated carbons in the form of a non-woven fabric
material can be produced from biomass fibrous waste. The production of activated carbons in
the form of textiles, cloths or composites offers materials that are much easier to handle when
compared with loose fibre or powder forms. Non-woven fabrics are strong, adsorbent and
stretchable and can be produced at significantly lower cost than woven textiles. For this study,
the material was produced at a uniform thickness of 8mm, although the thickness and weights
of the non-woven fibrous biomass waste can be adjusted to particular requirements. The
research reported here has also shown that the product activated carbon retains the original
structure of the precursor raw fabric material. Therefore, the fibrous flax waste biomass could
be processed using the described textile techniques to produce a precursor fabric material which
could be formed to produce a wide variety of dimensions and shapes, related to the end-use
application of the activated carbon. Activated carbon was produced by a chemical activation
process using KOH under different process conditions and compared with the properties and
adsorption capacity of physically activated carbon. Chemical activation has some advantages

18
over physical activation in that higher surface areas are produced (Yahya et al, 2015). For
example, the product activated carbon had very high surface areas of up to 1656 m2 g-1 and
where shown to possess a high proportion of very small micropores. The microporous nature
of the activated carbons, coupled with their high surface area made for effective adsorption of
SO2 under the test conditions used in this study. The adsorption of SO2 from the waste derived
activated carbons was found to be similar and in some cases significantly better than the results
obtained with commercially obtained activated carbons. The process of producing activated
carbons that can manipulated and formed into different shapes, sizes and thickness to suit
different waste flue gas (or waste water) cleaning applications has great potential. In addition,
commercial activated carbons are produced from precursors such as wood, but also include
non-renewable fossil fuel sources such as coal, peat and lignite (Yahya et al. 2015). In the
particular case of activated carbon fibres, these are mainly produced from viscose-cellulose,
petroleum pitch fibre and polyacrylonitrile resin fibre (Li et al, 2015). Using a biomass based
waste material such as the agricultural fibrous waste flax would represent a more sustainable
feedstock but also produces a high quality activated carbon product from a waste as an
exemplar of resource recovery.
Whilst an activated carbon produced from waste material for control of a pollutant is
environmentally attractive, the activated carbon becomes saturated and loses efficiency for SO2
capture and therefore the management of the used activated carbon which contains the trapped
SO2, mainly as H2SO4, (Zhang et al. 2012) would be an issue. Therefore, an integrated pollution
prevention and control approach would require consideration of the regeneration or disposal of
the used activated carbon. Salvador et al. (2015a; 2015b) have recently undertaken an extensive
review of the regeneration processes used for used activated carbons. The main methods of
regeneration include thermal processes (Salvador et al, 2015a) and chemical, microbiological
and vacuum processes (Salvador et al. 2015b). The regeneration process ideally removes the
19
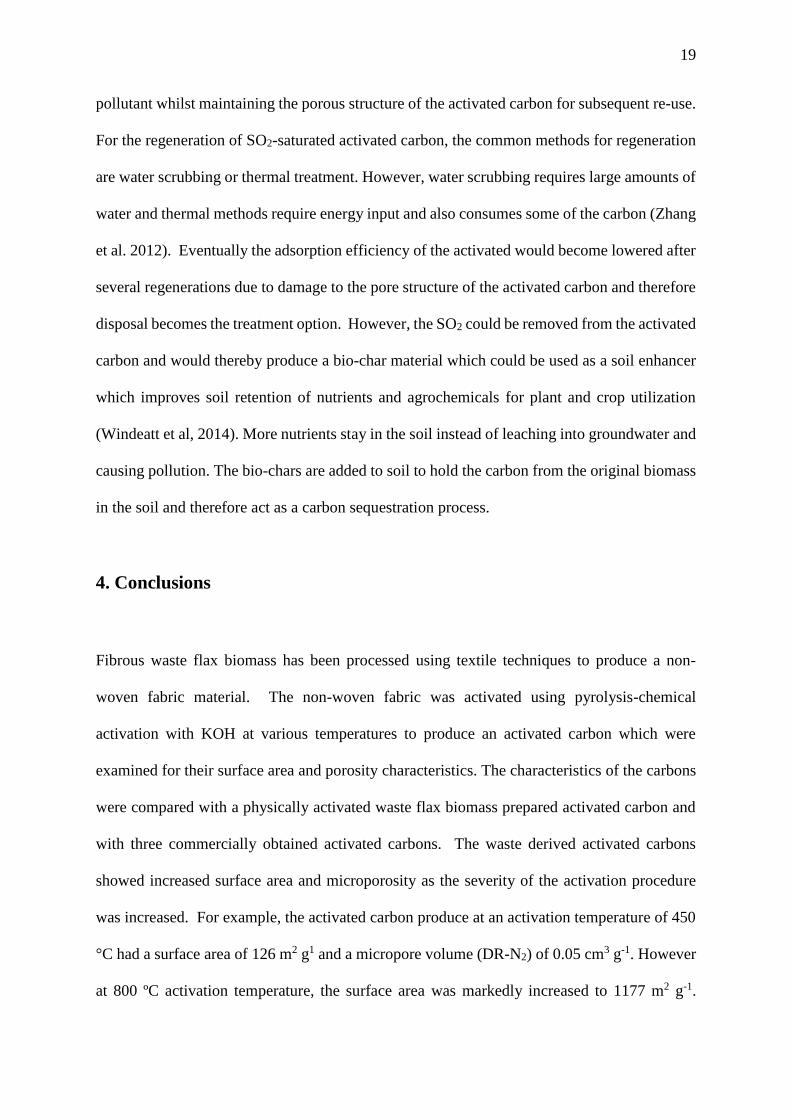
pollutant whilst maintaining the porous structure of the activated carbon for subsequent re-use.
For the regeneration of SO2-saturated activated carbon, the common methods for regeneration
are water scrubbing or thermal treatment. However, water scrubbing requires large amounts of
water and thermal methods require energy input and also consumes some of the carbon (Zhang
et al. 2012). Eventually the adsorption efficiency of the activated would become lowered after
several regenerations due to damage to the pore structure of the activated carbon and therefore
disposal becomes the treatment option. However, the SO2 could be removed from the activated
carbon and would thereby produce a bio-char material which could be used as a soil enhancer
which improves soil retention of nutrients and agrochemicals for plant and crop utilization
(Windeatt et al, 2014). More nutrients stay in the soil instead of leaching into groundwater and
causing pollution. The bio-chars are added to soil to hold the carbon from the original biomass
in the soil and therefore act as a carbon sequestration process.
4. Conclusions
Fibrous waste flax biomass has been processed using textile techniques to produce a non-
woven fabric material. The non-woven fabric was activated using pyrolysis-chemical
activation with KOH at various temperatures to produce an activated carbon which were
examined for their surface area and porosity characteristics. The characteristics of the carbons
were compared with a physically activated waste flax biomass prepared activated carbon and
with three commercially obtained activated carbons. The waste derived activated carbons
showed increased surface area and microporosity as the severity of the activation procedure
was increased. For example, the activated carbon produce at an activation temperature of 450
°C had a surface area of 126 m2 g1 and a micropore volume (DR-N2) of 0.05 cm3 g-1. However
at 800 ºC activation temperature, the surface area was markedly increased to 1177 m2 g-1.

20
Increasing the hold time to 2 h at 800 ºC produced a carbon with a high surface area of 1656
m2 g-1 and a high degree of micropores, at 0.639 cm3 g-1 pore volume (DR-N2).
The product waste derived non-woven fabric activated carbons were examined in
relation to their ability to adsorb SO2 from a continuous gas flow. The high surface area and
microporous nature of the waste derived activated carbons was crucial in allowing the carbons
to adsorb large amounts of SO2. The micropores (<2 nm) included a high proportion of very
small micropores allowing the small SO2 molecule of dimension 0.429 nm to easily enter the
pores of the activated carbon. There was a good correlation between the uptake of SO2 and
surface area for the series of activated carbons produced by KOH chemical activation. In
relation to the microporosity, there was a good correlation between the microporosity and SO2
uptake for the chemically activated waste derived activated carbons using N2 adsorption data
(DR-N2) However, for the small micropores determined using CO2 adsorption (DR-CO2)
which measures the smaller micropores, there was a very good correlation between the ultra-
micropores and SO2 uptake with an r2 value above 0.99. This suggests a linear relationship
between the very small micropore volume as assessed by CO2 adsorption, and the SO2
adsorption capacity (CO has a molecular size of 0.39 nm compared to SO2 at 0.429 nm. The
SO2 adsorption performance of the waste derived activated carbons was compared with three
commercially obtained activated carbons. For the activated carbons produced at 800 ºC with
KOH chemical activation, the SO uptake was greater compared to the commercially activated
carbons, attributed to the large proportion of ultra-micropores. Increasing the reactor
temperature to 100 °C resulted in a marked decrease in the uptake of SO2 by the activated
carbons. Also, higher SO2 concentrations in the inlet gas produced an increase in the amount
of SO2 adsorbed.
The process of producing activated carbons from a fibrous waste biomass have been
demonstrated, particularly since the fibrous biomass can be processed into non-woven fabric

21
material which retains its structure and flexibility after activation. Therefore manipulation of
the process can produce an activated carbon of differing structure, thickness and form directly
related to the requirements of the end-use application. The product activated carbons produced
by chemical activation using KOH have been shown to have high surface area with ultra-
micropores which are effective for SO2 adsorption.
ACKNOWLEDGEMENTS
A scholarship from the UK Engineering & Physical Sciences Research Council is gratefully
acknowledged for one of us (JMI)

22
REFERENCES
Al -Rahbi A.S., Nahil M.A., Wu C., Williams P.T. 2016, Waste derived activated carbons for control of nitrogen oxides. Waste Resour. Manag. 169, 30-41.
Daud W.M.A.W., Ali W.S.W., Suleiman M.Z. 2000. The effects of carbonization temperature
on pore development in palm-shell based activated carbon. Carbon, 38, 1925-1932. Davini P. 2003. Flue gas desulphurisation by activated carbon fibres obtained from
polyacrylonitrile by-product. Carbon, 41, 277-284. Dizbay-Onat M., Vaidya U.K., Lungu C.T. 2017. Preparation of industrial sisal fiber waste
derived activated carbon by chemical activation and effects of carbonization parameters on surface characteristics. Ind. Crops Prod 95, 583-590.
EC Industrial Emissions Directive, 2010. 2010/75/EU. European Commission, Brussels. El-Hendawy A.N.A., Samra S.E. Girgis B.S., 2001. Adsorption characteristics of activated
carbons obtained from corncobs. Colloid Surface A. 180, 209-221. Gaur V. Asthana R., Verma N., 2006. Removal of SO2 by activated carbon fibres in the
presence of O2 and H2O. Carbon 44, 46-60. Guo, J., Lua, A.C. 2002. Textural and chemical characterisations of adsorbent prepared palm
shell by potassium hydroxide impregnation at different stages. J. Colloid Interfac. Sci. 254(2), 227-233.
Guo J., Lua A.C. 2003. Adsorption of sulphur dioxide onto activated carbon prepared from oil-
palm shells with and without pre-impregnation. Sep. Purif. Technol. 30, 265-273. Harrison, R.D.(ed) 1977. Nuffield Advanced Science Book of Data, Longman Group, London.
Hu Z. Srinivasan M.P. 1999. Preparation of high surface area activated carbons from coconut shell. Micropor. Mesopor. Mater. 27, 11-18.
Hwang K.J., Park J.Y., Kim Y.J., Kim G. Choi C., Jin S., Kim N., Lee J.W., Shim W.G. 2015.
Adsorption behaviour of dyestuffs on hollow activated carbon fiber from biomass. Sep. Sci. Technol. 50, 1757-1767.
Illingworth J., Williams P.T. Rand B. 2012. Novel activated carbon fibre matting from biomass
fibre waste. Waste Resourc. Manag. 165, 123-132. Ioannidou O., Zabaniotou, A. 2007. Agricultural residues as precursors for activated carbon-A
review. Renew. Sus. Energ. Rev. 11, 1966-2005. Karatepe N. 2000. A comparison of flue gas desulphurisation processes. Energ. Sourc. 22, 197-
206.
23
Karatepe N., Orbak I., Yavuz R., Oxyuguran A. 2008. Sulfur dioxide adsorption by activated carbons having different textural and chemical properties. Fuel, 87, 3207-3215.
Katada N., Ii Y., Nakamura M., Niwa M. 2003. Oxidation of sulphur dioxide to sulphuric acid
over activated carbon catalyst produced from wood. J. Jpn. Pet. Inst. 46, 392-395. Koseoglu E., Akmil-Basar C. 2015. Preparation, structural evaluation and adsorptive properties
of activated carbon from agricultural biomass. Adv. Powder Technol. 26, 811-818. Lee Y.W., Park J.W., Choung J.H., Choi D.K. 2002. Adsorption characteristics of SO2 on
activated carbon prepared from coconut shell with potassium hydroxide activation. Environ. Sci. Technol. 36, 1086-1092.
Li X., Ling L., Lu C., Qiao W., Liu Z., Liu L., Mochida I. 2001. Catalytic removal of SO2 over
ammonia-activated carbon fibers. Carbon, 39, 1803-1808. Li, Y.H., Lee, C.W., Gullett, B.K. 2002. The effect of activated carbon surface moisture on
low temperature mercury adsorption. Carbon, 40(1), 65-72. Li J., Ng, D.H.L., Song P., Kong C., Song Y., Yang P. 2015. Preparation and characterisation
of high-surface-area activated carbon fibers from silkworm cocoon waste for congo red adsorption. Biomass Bioenerg. 75, 189-200.
Lua, A.C., Guo, J. 2001. Preparation and characterization of activated carbons from oil-palm
stones for gas phase adsorption. Colloid Surface A, 179, 151-162. Mangun C.L., Debarr J.A., Economy J. 2001. Adsorption of sulphur dioxide on ammonia-
treated activated carbon fibres. Carbon, 39, 1689-1696. Mochida I., Korai Y., Shirahama M., Kawano S., Hada T., Seo Y., Yoshikawa M., Yasutake
A. 2000. Removal of SOx and NOx over activated carbon fibers. Carbon 38, 227-239. Nahil M.A., Williams P.T., 2012. Characterisation of activated carbons with high surface area
and variable porosity produced from agricultural cotton waste by chemical activation and co-activation. Waste Biomass Valorisation, 3, 117-130.
Rodriguez-Reinoso, F., Molina-Sabio, M. and Gonzalez, M.T. 1995. The use of steam and CO2
as activating agents in the preparation of activated carbons. Carbon, 33(1), 15-23. Salvador F., Martin-Sanchez, N., Sanchez Hernandez R., Sanchez-Montero M.J., Izuuierdo C.
2015a. Regeneration of carbonaceous adsorbents. Part 1: Thermal regeneration. Micropor. Mesopor. Mat. 202, 259-276.
Salvador F., Martin-Sanchez, N., Sanchez Hernandez R., Sanchez-Montero M.J., Izuuierdo C.
2015b. Regeneration of carbonaceous adsorbents. Part II: Chemical, microbiological and vacuum regeneration. Micropor. Mesopor. Mat. 202, 277-296.
Shamsuddin M.S., Yusoff N.R.N., Sulaiman M.A. 2016. Synthesis and characterisation of
activated carbon produced from kenaf core fiber using H3PO4 activation. Procedia Chem. 19, 558-565.
24
Sun Y., Zwolinska E., Chmielewski A.G. 2016. Abatement technologies for high
concentrations of NOx and SO2 removal from exhaust gases: A review. Crit. Rev. Environ. Sci. Technol. 46, 119-142.
Suzuki R.M., Andrade A.D., Sousa J.C., Rollenberg M.C. 2007. Preparation and
characterisation of activated carbon from rice bran. Bioresource Technol. 98, 1985-1991. Williams P.T. Reed A.R. 2003. Pre-formed activated carbon matting derived from the pyrolysis
of biomass natural fibre textile waste. J. Anal. Appl. Pyrolysis, 70, 563-577. Williams P.T., Reed A.R. 2004. High grade activated carbon matting derived from the chemical
activation and pyrolysis of natural fibre textile waste. J. Anal. Appl. Pyrolysis, 71, 971-986.
Windeatt J.H., Ross A.B., Williams P.T., Forster P.M., Nahil M.A., Singh S. 2014.
Characteristics of biochars from crop residues: Potential for carbon sequestration and soil amendment. J. Environ. Manag. 146, 189-197.
Yahya M.A., Al-Qodah Z., Ngah C.C.Z. 2015. Agricultural bio-waste materials as potential
sustainable precursors used for activated carbon production: A review. Renew. Sus. Energ. Rev. 46, 218-235.
Yalcin N., Sevine V. 2000. Studies of the surface area and porosity of activated carbons
prepared from rice husks. Carbon, 38, 1943-1945. Xu X., Huang D., Zhao L., Kan Y., Cao X. 2016. Role of inherent inorganic constituents in
SO2 sorption ability of biochars derived from three biomass wastes. Environ. Sci. Technol. 50, 12957-12965.
Zhang L.Q., Jiang H.T., Ma C. Dong Y. 2012. Microwave regeneration characteristics of
activated carbon for flue gas desulphurisation. J. Fuel Chem. Technol. 40(11), 1366-1371.
Zhao Y. Fang F., Xiao H.M., Feng Q.P., Xiong L.Y., Fu S.Y. 2015. Preparation of pore-size
controllable activated carbon fibers from bamboo fibers with superior performance for xenon storage. Chem. Eng. J. 270, 528-534.

25
Figure Captions
Figure 1. The non-woven fibrous flax fabric material Figure 2. Non-woven fibrous activated carbon fabric material produced by chemical activation via pyrolysis followed by activation using KOH. Figure 3. Scanning electron microscope image of the activated carbon after chemical activation Figure 4. Schematic diagram of the fixed-bed sulphur dioxide adsorption system. Figure 5. DFT-N2 (a) and DFT-CO2 (b) micropore distribution of the produced activated carbons. Figure 6. DFT-N2 (a) and DFT-CO2 (b) micropore distribution of the commercially activated carbons. Figure 7: SO2 breakthrough profiles in relation to char and activated carbons produced from flax non-woven activated carbon fabric and commercially obtained activated carbons. Figure 8. Cumulative SO2 adsorption in relation to char and activated carbons produced from flax non-woven activated carbon fabric and commercially obtained activated carbons. Figure 9. Relationship between SO2 adsorption and BET surface area. Figure 10. Relationship between SO2 adsorption and micropore volume with nitrogen adsorption (DR-N2) and carbon dioxide adsorption (DR-CO2) (** represents DR-CO2 for the KOH chemically activated non-woven fabric activated carbons only). Figure 11. SO2 breakthrough profiles in relation to the KOH activated carbons produced at 800 °C from flax non-woven activated carbon fabric in relation to reactor temperature of 25 °C, 40 °C and 100 °C. Figure 12. Cumulative SO2 adsorption in relation to the KOH activated carbons produced at 800 °C from flax non-woven activated carbon fabric in relation to reactor temperature of 25 °C, 40 °C and 100 °C. Figure 13. SO2 breakthrough profiles in relation to the KOH activated carbons produced at 800 °C from flax non-woven activated carbon fabric in relation to inlet SO2 concentrations of 750 ppm, 2500 ppm and 5000 ppm. Figure 14. Cumulative SO2 adsorption in relation to the KOH activated carbons produced at 800 °C from flax non-woven activated carbon fabric in relation to inlet SO2 concentrations of 750 ppm, 2500 ppm and 5000 ppm.

26
Figure 1. The non-woven fibrous flax fabric material

27
Figure 2. Non-woven fibrous activated carbon fabric material produced by chemical activation
via pyrolysis followed by activation using KOH.
28
Figure 3. Scanning electron microscope image of the activated carbon after chemical activation
20 µm
29
Figure 4. Schematic diagram of the fixed-bed sulphur dioxide adsorption system
N2
Mass flow
controller
SO2
SO2
analyser
Gas drier
Furnace
Gas mixer
Activated carbon
30
(a)
(b)
Figure 5. DFT-N2 (a) and DFT-CO2 (b) micropore distribution of the produced activated
carbons.
0.00
0.05
0.10
0.15
0.20
0.25
0.30
0 5 10 15 20 25 30
Pore Width [A]
dV(w
) [cm
3 /A/g
] 450C
650C
800C
800C 1hr
800C 2hr
0.00
0.02
0.04
0.06
0.08
0.10
0.12
0.14
0.16
2 3 4 5 6 7 8 9 10 11 12 13 14 15
Pore Width [A]
dV
(w)
[cm
3/A
/g]
Char
450C
650C
800C
800C 1hr
800C 2hr
31
(a)
(b)
Figure 6. DFT-N2 (a) and DFT-CO2 (b) micropore distribution of the commercially activated
carbons.
0.00
0.02
0.04
0.06
0.08
0.10
0.12
0.14
0.16
0 10 20 30 40 50
Pore Width [A]
dV
(w)
[cm
3/A
/g]
ACF-15
Powder
Granular
0.00
0.01
0.02
0.03
0.04
0.05
0.06
0.07
0.08
0.09
0.10
0 1 2 3 4 5 6 7 8 9 10 11 12 13 14 15
Pore Width [A]
dV
(w)
[cm
3/A
/g]
ACF-15
Powder
Granular
32
Figure 7: SO2 breakthrough profiles in relation to char and activated carbons produced
from flax non-woven activated carbon fabric and commercially obtained activated carbons.
0.0
0.1
0.2
0.3
0.4
0.5
0.6
0.7
0.8
0.9
1.0
0 2 4 6 8 10 12 14 16 18 20 22 24 26 28 30Time [mins]
C/C
o
Char
450C
650C
800C
800C 1hr
Phys 6hr
Powder
Granular
ACF-15

33
Figure 8. Cumulative SO2 adsorption in relation to char and activated carbons produced
from flax non-woven activated carbon fabric and commercially obtained activated carbons.
0
10
20
30
40
50
60
70
80
90
100
0 2 4 6 8 10 12 14 16 18 20 22 24 26 28 30
Time [mins}
SO
2 A
dso
rbed
[m
g/g
C]
Char
450C
650C
800C
800C 1hr
Phys 6hr
Powder
Granular
ACF-15
34
Figure 9. Relationship between SO2 adsorption and BET surface area
R2 = 0.3716
R2 = 0.9817
0
10
20
30
40
50
60
70
80
90
100
0 200 400 600 800 1000 1200 1400 1600 1800 2000
BET Area [m2/g]
SO
2 A
dso
rpti
on
[m
g/g
C]
All samples
KOH only

35
Figure 10. Relationship between SO2 adsorption and micropore volume with nitrogen
adsorption (DR-N2) and carbon dioxide adsorption (DR-CO2) (** represents DR-CO2 for the
KOH chemically activated non-woven fabric activated carbons only).
R2 = 0.4148R2 = 0.8305
R2 = 0.9961
0
10
20
30
40
50
60
70
80
90
100
0 0.1 0.2 0.3 0.4 0.5 0.6 0.7
Micropore Volume [cm3/g]
SO
2 A
dso
rpti
on
[m
g/g
C]
DR-N2
DR-CO2
DR-CO2**

36
Figure 11. SO2 breakthrough profiles in relation to the KOH activated carbons produced at
800 °C from flax non-woven activated carbon fabric in relation to reactor temperature of 25
°C, 40 °C and 100 °C.
0.0
0.1
0.2
0.3
0.4
0.5
0.6
0.7
0.8
0.9
1.0
0 2 4 6 8 10 12 14 16 18 20 22 24 26 28 30
Time [mins]
C/C
o
Powder
K650
K800
K800 25 °C
K800 40 °C
K800 100 °C

37
Figure 12. Cumulative SO2 adsorption in relation to the KOH activated carbons produced at
800 °C from flax non-woven activated carbon fabric in relation to reactor temperature of 25
°C, 40 °C and 100 °C.
0
10
20
30
40
50
60
70
80
90
0 2 4 6 8 10 12 14 16 18 20 22 24 26 28 30
Time [mins]
SO
2 A
dso
rbed
[m
g/g
C]
Powder
K650
K800
K800 25 °C
K800 40 °C
K800 100 °C
38
Figure 13. SO2 breakthrough profiles in relation to the KOH activated carbons produced at
800 °C from flax non-woven activated carbon fabric in relation to inlet SO2 concentrations of
750 ppm, 2500 ppm and 5000 ppm.
0.0
0.1
0.2
0.3
0.4
0.5
0.6
0.7
0.8
0.9
1.0
0 2 4 6 8 10 12 14 16 18 20 22 24 26 28 30
Time [mins]
C/C
o
Powder
K650
K800750 ppm SO2
2500 ppm SO2
5000 ppm SO2
39
Figure 14. Cumulative SO2 adsorption in relation to the KOH activated carbons produced at
800 °C from flax non-woven activated carbon fabric in relation to inlet SO2 concentrations of
750 ppm, 2500 ppm and 5000 ppm.
0
10
20
30
40
50
60
70
80
90
100
110
120
0 2 4 6 8 10 12 14 16 18 20 22 24 26 28 30
Time [mins]
SO
2 A
dso
rbed
[m
g/g
C]
Powder
K650
K8002500 ppm SO2
5000 ppm SO2
750 ppm SO2

40
Table 1. Properties of the activated carbons
Carbon Designation
Preparation Surface area (m2 g-1)
Micropore Volume DR-N2
(cm3 g-1)
Micropore Volume DR-CO2
(cm3 g-1)
Yield (wt.%)
Char No activation;
Untreated pyrolysis char, 800 °C
30 0.012 0.151 -
450C Chemical activation;
KOH, at 450 °C, 0 h hold
126 0.050 0.170 98
650C Chemical activation;
KOH, at 650 °C, 0 h hold
807 0.309 0.332 94
800C Chemical activation
KOH, at 800 °C, 0 h hold
1177 0.451 0.422 83
800C 1 hr Chemical activation;
KOH, 800 °C, 1 h hold
1564 0.604 0.458 67
800C 2 hr Chemical activation;
KOH, 800 °C, 1 2 hold
1656 0.639 0.464 57
Phys 6hr Physical activation;
CO2, 825 °C, 6 hr hold
867 0.337 0.281 40
Powder Commercial activated carbon powder 1105 0.418 0.314 -
Granular Commercial activated carbon granular 1154 0.426 0.303 -
ACF15 Commercial activated carbon fibre 1715 0.633 0.328 -