The Effect of Debt Management Tools on Revenue Collection ...

JN BHAGWAN
Non Revenue Water in South Africa and tools to support
improvements

History of WRC activity
Late 80’s attention towards water consumption
GJ Malan : water consumption and savings in apartment buildings
Castle Brass holdings : Water Loss analysis in municipal distribution systems
CSIR : Testing of data logging equipment
SABS : Influence of fittings on domestic meters
Pipelines research in the late (corrosion and biofilms)
Evaluation of metal pipe leaks in JHB area
Corrosion performance of non-metallic pipes
Exposure of generic coatings
Effect of water quality and chemical composition on corrosion

Three responses
Development of aids and tools
Asset management
National surveys

Background Information
Benchmarking of Leakage from Water Reticulation Systems in South Africa (WRC, TT 244/05); March 2005, 27 systems
An assessment of Non-revenue water in South Africa (WRC, TT 300/07); January 2007, 62 systems
National Non-Revenue Water Assessment (DWA,Business Intelligence); April 2010, all municipalities
Latest NRW study, June 2011

Latest National Non-Revenue Water Assessment based on the standard IWA Water
Balance
Commercial losses
System input
Authorised consumption
Water loss
Unbilled
consumption
Physical losses
Billed
consumption
Revenue water
Non-revenue water

NRW Reporting Template
6 years of data
Various sources
Updated and verified by team and municipalities
Most comprehensive database
Province Limpopo WSA
Municipal Code LIM362 Yes
District Municipality Waterberg Category
Municipality Lephalale B3
Settlements ELLISRAS Target
Year ending Jun-05 Jun-06 Jun-07 Jun-08 Jun-09 Jun-10 Jun-11 Jun-14
101 453 102 736 103 349 104 120 104 745 114 595
25 928 26 256 26 410 26 610 26 767 27 950
8 020
19 930
512 297
System input volume kl/annum 3 978 000 3 808 840 4 780 000 4 170 000 5 540 000 5 540 000
Billed metered
consumptionkl/annum 3 134 400 2 636 000 2 535 000 3 377 700 4 487 400 4 044 200
Billed unmetered
consumptionkl/annum 486 900 411 072 1 365 000 235 974 310 698 608 000
Unbilled metered
consumptionkl/annum
Unbilled unmetered
consumptionkl/annum
Revenue water kl/annum 3 621 300 3 047 072 3 900 000 3 613 674 4 798 098 4 652 200 0 0
Non-Revenue water kl/annum 356 700 761 768 880 000 556 326 741 902 887 800 0 0
Water Losses kl/annum 356 700 761 768 880 000 556 326 741 902 887 800 0 0
% Non-revenue water 9.0% 20.0% 18.4% 13.3% 13.4% 16.0% No data No data
% Water Losses 9.0% 20.0% 18.4% 13.3% 13.4% 16.0% No data No data
107 102 127 110 145 132 No data No data
13 12 15 13 17 17 No data No data
98 81 103 95 125 111 No data No data
12 10 12 11 15 14 No data No data
% Population growth 1.26% 0.60% 0.75% 0.60% 9.40%
% Water demand growth -4.25% 25.50% -12.76% 32.85% 0.00%
Source of informationDWA NIS
StatsSA NFC
DWA NIS
StatsSA NFC
DWA NIS
StatsSA NFC
DWA NIS DWA NIS
StatsSA NFC
Comments
Inpu
t Dat
a
Population
Households
Connections - metered
Connections - Unmetered
Length of mains (km)
Wat
er B
alan
ce C
alcu
latio
nsK
ey p
erfo
rman
ce in
dica
tors
Input : Litres / capita / day
Input: m³ / household / month
Billed : Litres / capita / day
Billed : m³ / household / month
0%
10%
20%
30%
40%
50%
60%
70%
80%
90%
100%
0
1 000 000
2 000 000
3 000 000
4 000 000
5 000 000
6 000 000
Jun-05 Jun-06 Jun-07 Jun-08 Jun-09 Jun-10 Jun-11 Jun-14
% N
on-r
even
ue W
ater
Syst
em In
put
Vol
ume
(Kl /
annu
m)
Municipal NRW Water Balance: Lephalale
Billed metered consumption Billed unmetered consumption Non-Revenue water % Non-revenue Water

Common errors / problems
Factor 1000 errors – Mℓ, kℓ, million m3
Corrected errors through annual comparisons, unit consumption or other data sources
Definition confusion
Water “exported” – excluded from input volume but included in billed consumption
Free Basic Water (FBW) – possible duplication in billed consumption
Flat rate consumption – uncertainty on where it fits in the water balance

6 Year Record Keeping Summary

27.8% 29.2% 30.0%33.8% 35.3% 36.8%
0%
10%
20%
30%
40%
50%
60%
70%
80%
90%
100%
0
500 000 000
1 000 000 000
1 500 000 000
2 000 000 000
2 500 000 000
3 000 000 000
3 500 000 000
Jun-05 Jun-06 Jun-07 Jun-08 Jun-09 Jun-10
% N
on
-re
ven
ue
Wat
er
Syst
em
Inp
ut
Vo
lum
e (
Kl
/an
nu
m)
Municipal NRW Water Balance: National
Billed metered consumption Billed unmetered consumption Non-Revenue water % Non-revenue Water
Preliminary National Non-revenue Water Assessment
Non-revenue water
Revenue water
•Based on 132 data sets of a potential 237 municipalities

Current Municipal Environment
Limited skilled resources with high staff turnover
Limited asset management
Poor or no consumer metering and billing
No incentive to conserve water
Lack of WC/WDM knowledge and insight
Insufficient management information

% NRW Distribution / Municipal Category
0%
10%
20%
30%
40%
50%
60%
70%
80%
90%
100%
Cit
y o
f Cap
e T
ow
n M
etr
oN
els
on
Man
de
la B
ay M
etr
oC
ity
of J
oh
ann
esb
urg
Met
roTl
okw
eG
ova
n M
be
kiG
eo
rge
Cit
y o
f Mat
losa
na
Mu
nic
ipal
ity
Ste
ve T
shw
ete
Ru
ste
nb
urg
Bu
ffal
o C
ity
Po
lokw
ane
Ne
wca
stle
Emal
ahle
ni
Kin
g Sa
bat
a D
alin
dye
boM
oss
el B
ayM
akan
aM
ets
imah
olo
Maf
ike
ng
Ou
dts
ho
orn
No
ken
g Ts
a Ta
em
ane
Mid
vaal
Mo
qh
aka
Kn
ysn
aH
ibis
cus
Co
ast
The
Kw
aDu
kuza
Dih
lab
en
gN
dla
mb
eLe
sed
iC
ape
Agu
lhas
uM
uzi
wab
antu
Tsw
elo
pe
leK
ou
gaK
aro
o H
oo
glan
dA
baq
ulu
siH
ess
eq
ua
Mu
sin
aU
mji
nd
iD
elm
asG
reat
Ke
iB
avia
ans
Siya
the
mb
aM
afu
be
Bre
ed
e R
iver
/Win
ela
nds
Ce
de
rbe
rgG
amag
ara
Nko
nko
be
Bit
ou
Man
tso
pa
Lets
em
eng
eD
um
be
Nam
a K
ho
iK
op
ano
ng
eM
adla
nge
ni
Pix
ley
Ka
Sem
eP
ort
St
Joh
ns
Mb
izan
aM
hlo
ntl
oM
bh
ash
eM
ose
s K
ota
ne
Nd
we
dw
eM
nq
um
aO
khah
lam
ba
Man
de
ni
Map
hu
mu
loN
on
gom
aU
lun
di
% N
on
-re
ven
ue
Wa
ter
National Average = 36.8%
41.3%
30.5%
37.0%
72.5%
34.3%
B1 B2 B3 B4ACategory

International NRW benchmark
Source : The International Benchmarking Network for Water and Sanitation Utilities (IBNET)
0
10
20
30
40
50
60
70
80
90
Au
stra
lia
Ne
w Z
eal
and
Cam
bo
dia
Sin
gap
ore
Nam
ibia
Be
laru
sSe
ych
elle
sG
abo
nP
ola
nd
Nig
er
Sen
ega
lC
zech
Re
pu
blic
Ru
ssia
Tun
isia
Bu
rkin
a Fa
soC
hin
aLa
o P
DR
Be
nin
Mal
iLe
soth
oH
un
gary
Sou
th A
fric
aN
eth
erl
ands
An
tille
sM
exi
coA
rge
nti
na
Cap
e V
erd
eB
oli
via
Slo
vaki
aC
hil
eU
gan
da
Vie
tnam
Eth
iop
iaK
azak
hst
anM
adag
asca
rC
on
go, D
em
. Rep
.M
auri
tan
iaB
angl
ade
shP
akis
tan
Taji
kist
anA
vera
geR
wan
da
Uzb
eki
stan
Lib
eri
aB
razi
lB
uru
nd
iP
anam
aK
en
yaM
old
ova
Pe
ruU
krai
ne
Ge
org
iaP
arag
uay
Ro
man
iaZa
mb
iaG
uin
ea
Gh
ana
Mau
riti
us
Uru
guay
Bu
lgar
iaM
oza
mb
iqu
eTu
rke
yM
ace
do
nia
, FYR
Bo
snia
an
d H
erz
ego
vin
aK
yrgy
z R
ep
ub
licA
lban
iaEc
uad
or
Arm
en
ia
% N
on
Re
ven
ue
Wat
er
RSA Average = 36.8%
World Average 36.2%

System Input Volume / Category
0.1
1.0
10.0
100.0
1 000.0N
els
on
Man
de
la B
ay M
etr
o
eTh
ekw
ini M
etr
o
Cit
y o
f Ts
hw
ane
Me
tro
Mb
om
be
la
Po
lokw
ane
Cit
y o
f M
atlo
san
a M
un
icip
alit
y
Mo
gale
Cit
y
Ne
wca
stle
Go
van
Mb
eki
Tlo
kwe
Ste
ve T
shw
ete
Sol P
laat
jie
uM
hla
thu
ze
Msu
kalig
wa
Mo
gala
kwe
na
Maf
ike
ng
The
Kw
aDu
kuza
Emak
haz
en
i
Kn
ysn
a
Mo
qh
aka
Dih
lab
en
g
Bre
ed
e V
alle
y
Emn
amb
ith
i-La
dys
mit
h
Me
tsim
aho
lo
Mid
vaal
Kh
ara
Hai
s
Am
ahla
ti
Gre
at K
ei
eM
adla
nge
ni
Han
tam
Maf
ub
e
Ric
hte
rsve
ld
Lets
em
en
g
Be
rgri
vie
r
Ram
ots
he
re M
oilo
a
Swe
llen
dam
Lep
hal
ale
Pix
ley
Ka
Sem
e
Nd
lam
be
Swar
tlan
d
Um
jind
i
He
sse
qu
a
Be
la B
ela
Bre
ed
e R
ive
r/W
ine
lan
ds
Ngw
ath
e
Nam
a K
ho
i
Kar
oo
Ho
ogl
and
Ko
uga
Lekw
a-Te
em
ane
The
mb
elih
le
Mal
uti
a P
ho
fun
g
Kga
telo
pe
le
Um
tsh
ezi
Gam
agar
a
Nya
nd
en
i
Nta
ban
kulu
Ngq
uza
Hill
Ezin
qo
len
i
Dan
nh
ause
r
No
ngo
ma
Um
zum
be
Okh
ahla
mb
a
uP
ho
ngo
lo
Ulu
nd
i
Mo
ses
Ko
tan
e
Man
de
ni
Syst
em In
pu
t V
olu
me
(mill
ion
m3/a
nnu
m)
B1 B2 B3 B4ACategory
34.85
12.52
4.19 4.05
308.1
0.0
100.0
200.0
300.0
400.0
500.0
600.0N
els
on
Man
de
la B
ay M
etr
o
eTh
ekw
ini M
etr
o
Cit
y o
f Ts
hw
ane
Me
tro
Mb
om
be
la
Po
lokw
ane
Cit
y o
f M
atlo
san
a M
un
icip
alit
y
Mo
gale
Cit
y
Ne
wca
stle
Go
van
Mb
eki
Tlo
kwe
Ste
ve T
shw
ete
Sol P
laat
jie
uM
hla
thu
ze
Msu
kalig
wa
Mo
gala
kwe
na
Maf
ike
ng
The
Kw
aDu
kuza
Emak
haz
en
i
Kn
ysn
a
Mo
qh
aka
Dih
lab
en
g
Bre
ed
e V
alle
y
Emn
amb
ith
i-La
dys
mit
h
Me
tsim
aho
lo
Mid
vaal
Kh
ara
Hai
s
Am
ahla
ti
Gre
at K
ei
eM
adla
nge
ni
Han
tam
Maf
ub
e
Ric
hte
rsve
ld
Lets
em
en
g
Be
rgri
vie
r
Ram
ots
he
re M
oilo
a
Swe
llen
dam
Lep
hal
ale
Pix
ley
Ka
Sem
e
Nd
lam
be
Swar
tlan
d
Um
jind
i
He
sse
qu
a
Be
la B
ela
Bre
ed
e R
ive
r/W
ine
lan
ds
Ngw
ath
e
Nam
a K
ho
i
Kar
oo
Ho
ogl
and
Ko
uga
Lekw
a-Te
em
ane
The
mb
elih
le
Mal
uti
a P
ho
fun
g
Kga
telo
pe
le
Um
tsh
ezi
Gam
agar
a
Nya
nd
en
i
Nta
ban
kulu
Ngq
uza
Hill
Ezin
qo
len
i
Dan
nh
ause
r
No
ngo
ma
Um
zum
be
Okh
ahla
mb
a
uP
ho
ngo
lo
Ulu
nd
i
Mo
ses
Ko
tan
e
Man
de
ni
Syst
em In
pu
t V
olu
me
(mill
ion
m3/a
nnu
m)
B1 B2 B3 B4ACategory
34.85
12.52 4.19 4.05
308.1

Volume NRW / Category
0.1
1.0
10.0
100.0
1 000.0N
els
on
Man
de
la B
ay M
etr
o
eTh
ekw
ini M
etr
o
Cit
y o
f Ts
hw
ane
Me
tro
Mb
om
be
la
Po
lokw
ane
Cit
y o
f M
atlo
san
a M
un
icip
alit
y
Mo
gale
Cit
y
Ne
wca
stle
Go
van
Mb
eki
Tlo
kwe
Ste
ve T
shw
ete
Sol P
laat
jie
uM
hla
thu
ze
Msu
kalig
wa
Mo
gala
kwe
na
Maf
ike
ng
The
Kw
aDu
kuza
Emak
haz
en
i
Kn
ysn
a
Mo
qh
aka
Dih
lab
en
g
Bre
ed
e V
alle
y
Emn
amb
ith
i-La
dys
mit
h
Me
tsim
aho
lo
Mid
vaal
Kh
ara
Hai
s
Am
ahla
ti
Gre
at K
ei
eM
adla
nge
ni
Han
tam
Maf
ub
e
Ric
hte
rsve
ld
Lets
em
en
g
Be
rgri
vie
r
Ram
ots
he
re M
oilo
a
Swe
llen
dam
Lep
hal
ale
Pix
ley
Ka
Sem
e
Nd
lam
be
Swar
tlan
d
Um
jind
i
He
sse
qu
a
Be
la B
ela
Bre
ed
e R
ive
r/W
ine
lan
ds
Ngw
ath
e
Nam
a K
ho
i
Kar
oo
Ho
ogl
and
Ko
uga
Lekw
a-Te
em
ane
The
mb
elih
le
Mal
uti
a P
ho
fun
g
Kga
telo
pe
le
Um
tsh
ezi
Gam
agar
a
Nya
nd
en
i
Nta
ban
kulu
Ngq
uza
Hill
Ezin
qo
len
i
Dan
nh
ause
r
No
ngo
ma
Um
zum
be
Okh
ahla
mb
a
uP
ho
ngo
lo
Ulu
nd
i
Mo
ses
Ko
tan
e
Man
de
ni
Syst
em In
pu
t V
olu
me
(mill
ion
m3/a
nnu
m)
14.13
3.38
1.54
2.93
105.7
B1 B2 B3 B4ACategory
0.0
20.0
40.0
60.0
80.0
100.0
120.0
140.0
160.0
180.0
200.0N
els
on
Man
de
la B
ay M
etr
o
eTh
ekw
ini M
etr
o
Cit
y o
f Ts
hw
ane
Me
tro
Mb
om
be
la
Po
lokw
ane
Cit
y o
f M
atlo
san
a M
un
icip
alit
y
Mo
gale
Cit
y
Ne
wca
stle
Go
van
Mb
eki
Tlo
kwe
Ste
ve T
shw
ete
Sol P
laat
jie
uM
hla
thu
ze
Msu
kalig
wa
Mo
gala
kwe
na
Maf
ike
ng
The
Kw
aDu
kuza
Emak
haz
en
i
Kn
ysn
a
Mo
qh
aka
Dih
lab
en
g
Bre
ed
e V
alle
y
Emn
amb
ith
i-La
dys
mit
h
Me
tsim
aho
lo
Mid
vaal
Kh
ara
Hai
s
Am
ahla
ti
Gre
at K
ei
eM
adla
nge
ni
Han
tam
Maf
ub
e
Ric
hte
rsve
ld
Lets
em
en
g
Be
rgri
vie
r
Ram
ots
he
re M
oilo
a
Swe
llen
dam
Lep
hal
ale
Pix
ley
Ka
Sem
e
Nd
lam
be
Swar
tlan
d
Um
jind
i
He
sse
qu
a
Be
la B
ela
Bre
ed
e R
ive
r/W
ine
lan
ds
Ngw
ath
e
Nam
a K
ho
i
Kar
oo
Ho
ogl
and
Ko
uga
Lekw
a-Te
em
ane
The
mb
elih
le
Mal
uti
a P
ho
fun
g
Kga
telo
pe
le
Um
tsh
ezi
Gam
agar
a
Nya
nd
en
i
Nta
ban
kulu
Ngq
uza
Hill
Ezin
qo
len
i
Dan
nh
ause
r
No
ngo
ma
Um
zum
be
Okh
ahla
mb
a
uP
ho
ngo
lo
Ulu
nd
i
Mo
ses
Ko
tan
e
Man
de
ni
Syst
em In
pu
t V
olu
me
(mill
ion
m3/a
nnu
m)
14.13
3.38 1.54 2.93
105.7
B1 B2 B3 B4ACategory

Estimated National NRW
NRW Based on Available Data Sets
Category Population Input (m3/a) NRW (m3/a) % NRW l/c/d
A 17 420 512 1 849 091 117 634 192 022 34.3% 291
B1 7 756 187 683 667 320 282 585 164 41.3% 241
B2 3 882 070 325 623 095 99 407 207 30.5% 230
Urban 29 058 770 2 858 381 532 1 016 184 393 35.6% 269
B3 3 845 279 230 642 568 85 229 869 37.0% 164
B4 4 245 736 101 138 956 73 334 514 72.5% 65
Rural 8 091 015 331 781 524 158 564 384 47.8% 112
National 37 149 785 3 190 163 057 1 174 748 776 36.8% 235
Extrapolated 48 821 707 4 192 465 880 1 543 837 752 36.8% 235
Estimated Cost of NRW

Conclusions (2) % NRW and l/c/d in line with international trends
103 (44%) of municipalities cannot supply a water balance
36 (15%) of municipalities have never submitted water balance data in a six year period
45 (19%) of municipalities have good water balance data with no gaps or questions

•4 WRC
•MODELS


•WATER AUDIT SOFTWARE: SOUTH AFRICA

WATER AUDIT SOFTWARE

•WATER AUDIT SOFTWARE


Planning, budgeting and evaluation
Design
Procure & construct
Operate
Maintain
Refurbish/rehabilitate
•Infrastructure Asset Management

•Catchment
•Resource
•Water Treatment •Distribution
•Consumer
•Municipalities must
operate, maintain
monitor & manage
assets from resource
to consumer to resource
•Wastewater Treatment
Infr
astructure Asset Management Toolkit
Version 1
TT 413/09 April 2009
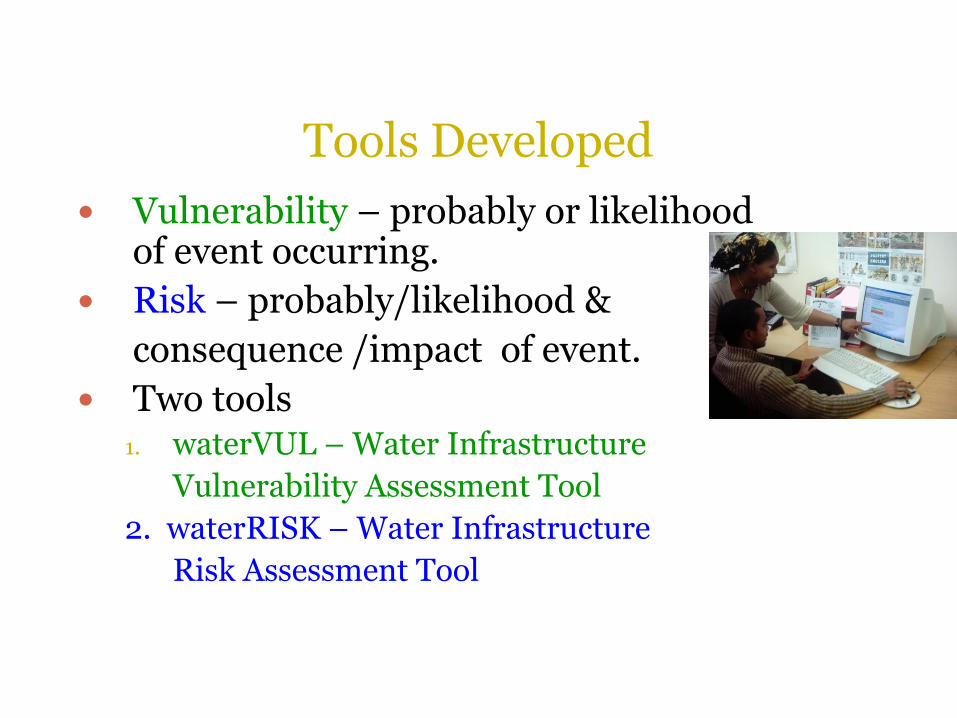
Tools Developed
Vulnerability – probably or likelihood of event occurring.
Risk – probably/likelihood &
consequence /impact of event.
Two tools 1. waterVUL – Water Infrastructure
Vulnerability Assessment Tool
2. waterRISK – Water Infrastructure
Risk Assessment Tool


•KEEP IT
SIMPLE
•THANK
YOU