NON-INVASIVE VISUALIZATION AND QUANTIFICATION OF ...
215
NON-INVASIVE VISUALIZATION AND QUANTIFICATION OF (DISTURBED) HEPATOBILIARY TRANSPORT Sara Neyt Thesis submitted to obtain the degree of Doctor in Pharmaceutical Sciences 2016 Promotor: Prof. dr. Apr. Filip De Vos Copromotor: Prof. dr. ir. Christian Vanhove
Transcript of NON-INVASIVE VISUALIZATION AND QUANTIFICATION OF ...

NON-INVASIVE VISUALIZATION AND QUANTIFICATION OF
(DISTURBED) HEPATOBILIARY TRANSPORT
Sara Neyt
Thesis submitted to obtain the degree of
Doctor in Pharmaceutical Sciences
2016
Promotor: Prof. dr. Apr. Filip De Vos
Copromotor: Prof. dr. ir. Christian Vanhove

Members of the Examination Committee
Prof. dr. Christophe Stove
Faculty of Pharmaceutical Sciences, Ghent University
Prof. dr. Katrien Remaut
Faculty of Pharmaceutical Sciences, Ghent University
Prof. Dr. Bieke Lambert
Faculty of Medicine, Ghent University
Prof. dr. Pieter Annaert
Faculty of Pharmaceutical Sciences, KULeuven
dr. Geert Mannens
Janssen Pharmaceutical Companies of Johnson & Johnson, Beerse

The author and promoters give the authorization to consult and to copy parts of this thesis for
personal use only. Any other use is limited by the Laws of Copyright, especially concerning
the obligation to refer to the source whenever results are cited from this thesis.
De auteur en promotoren geven de toestemming dit proefschrift voor raadpleging ter
beschikking te stellen en delen ervan te kopiëren voor persoonlijk gebruik. Elk ander gebruik
valt onder de beperking van het auteursrecht, in het bijzonder tot de verplichting de bron te
vermelden bij het aanhalen van resultaten uit deze thesis.
Gent, Mei 2016
Sara Neyt


Table of contents
TABLE OF CONTENTS
LIST OF ABBREVIATIONS
Chapter 1. General introduction 1
OVERVIEW 3
PART I: THE LIVER 4
Anatomy and physiology of the liver 4
The enterohepatic cycle 7
Bile acid biosynthesis 10
Initiat ion 11
Ring structure modification 13
Side chain oxidation 14
Conjugation 16
Secondary bile acids 18
Bile acid transporters of the enterohepatic cycle 18
Sinusoidal (basolateral) uptake 19
Alternative basolateral bile acid efflux 22
Canalicular excretion 22
Intestinal bile acid uptake 24
Intestinal bile acid efflux 24
Bile acid transporters in cholangiocytes and renal epithelial cells 25
Drug-induced liver injury 27
PART II: MOLECULAR IMAGING 31
Medical Imaging 31
Multi-modality 32
Molecular imaging 32
Molecular imaging and nuclear medicine 36

PET 36
SPECT 38
Small an imal imaging 40
Dynamic imaging and kinetic modeling 45
REFERENCES 48
Chapter 2. Functional hepatobiliary imaging 55
INTRODUCTION 57
HEPATOBILIARY CONTRAST AGENTS IN MAGNETIC RESONANCE IMAGING 58
Extracellular contrast agents 58
Reticuloendothelial contrast agents 59
Blood pool contrast agents 59
Hepatobiliary contrast agents 60
Hepatobiliary contrast agents used in the clinic – transporter substrates 60
Bile acid analogues 62
FLUORESCENT HEPATOBILIARY CONTRAST AGENTS 65
PET TRACERS 68
Transporter substrates 68
Bile acid analogues 69
SPECT TRACERS 72
[99mTc]mebrofenin 72
[99mTc]Galactosyl serum albumin 73
Bile acid analogues 74
REFERENCES 75
Chapter 3. Scope and aims 79
Chapter 4. Calibration curves 85
NAI(TL) SCINTILLATION DETECTOR 87
µSPECT 87

Chapter 5. In vivo visualization and quantification of normal and
disturbed hepatobiliary transport by means of [99mTc]mebrofenin 89
INTRODUCTION 91
MATERIALS AND METHODS 94
In vitro assays 94
Murine models 95
Radionuclides, radiopharmaceuticals and chemicals 95
Molecular imaging 95
Determination of the [99mTc]mebrofenin blood curve 98
Statistical and kinetic analysis 99
RESULTS 100
In vitro assessment of the potential role of OCT1 100
Interanimal and intra-animal variation of the dynamic µSPECT acquisitions 101
Interanimal variation 101
Intra-animal variation of the dynamic µSPECT acquisit ions 102
Wild-type FVB mice 103
Bile duct ligature: proof-of-principle 105
Role of Oatp1a/1b transporters in the hepatic transport of [99mTc]mebrofenin 107
Role of the Mrp2 transporter in the hepatic transport of [99mTc]-mebrofenin 109
The effect of different rifampicin doses on the hepatic transport of [99mTc]mebrofenin 110
DISCUSSION 114
REFERENCES 117
Chapter 6. Kinetic modeling of [99mTc]mebrofenin as a tool to quantify
altered hepatobiliary transport 119
INTRODUCTION 121
MATERIALS AND METHODS 123
Animal Model 123

Molecular Imaging 123
Correlation of image derived blood function with manual blood samples 125
Kinetic modeling 125
Statistical Analysis 126
RESULTS 127
Correlation of image derived blood function with manual blood samples 127
Kinetic Modeling 128
DISCUSSION 130
REFERENCES 132
Chapter 7. [99mTc]mebrofenin transport in a humanized mouse model 133
INTRODUCTION 135
MATERIALS AND METHODS 138
Animal Model 138
Molecular Imaging 138
Statistical analysis 139
RESULTS 140
[99mTc]MEB disposition in mice with liver disease (heterozygous mice) 140
[99mTc]MEB disposition in chimeric (humanized) mice 141
DISCUSSION 144
REFERENCES 147
Chapter 8. Synthesis, in vitro and in vivo evaluation of technetium labeled
bile acid analogues 149
INTRODUCTION 151
MATERIALS AND METHODS 153
General procedures and materials 153
Animal models 153
Chemistry 153

In vitro uptake assays 156
In vitro vesicular efflux assay 157
Molecular imaging 157
Statistical analysis 158
RESULTS 160
Radiosynthesis 160
In vitro uptake assays 160
In vitro vesicular efflux assay 163
Molecular imaging 163
DISCUSSION 167
REFERENCES 171
Chapter 9. General discussion 173
Chapter 10. Broader international context, relevance, and future
perspectives 181
REFERENCES 189
Chapter 11. Summary – Samenvatting Curriculum Vitae 191
SUMMARY 193
SAMENVATTING 195
CURRICULUM VITAE 198

List of abbreviations %CV Coefficient of variation
%ID/g Percentage injected dose per gram
[11C]TIC-Me [11C]tetranoisocarbacyclin methyl ester
[99mTc]DTPA-CA [99mTc]diethylene triamine pentaacetic acid cholic acid
[99mTc]DTPA-CDCA [99mTc]diethylene triamine pentaacetic acid
chenodeoxycholic acid
[99mTc]GSA [99mTc]diethylenetriamine-pentaacetic acid-galactosyl
human serum albumin
[99mTc]MEB [99mTc]mebrofenin
[99mTc]TcO4- Pertechnetate
µPET Preclinical positron emission tomography
µSPECT Preclinical single photon emission computed tomography
2D Two dimensional
3D Three dimensional
ABC ATP-binding cassette superfamily
AKR1C4 3α-hydroxysteroid dehydrogenase
AKR1D1 Δ4- 3-oxosteroid 5β reductase
ASBT/Asbt Apical sodium dependent bile acid transporter
ATP Adenosine triphosphate
AUC Area under the curve
BA Bile acids
BDL Bile duct ligation

BP Biliary pigments
BSA Bovine serum albumin
BSEP/Bsep Bile salt export pump
C27-3β-HSD=HSD3B7 3β-hydroxy-Δ5-C27-steroid oxidoreductase
CA Cholic acid
CA-lys-TFA Cholic acid-trifluoroacetyl lysine
CDCA Cheodeoxycholic acid
CDC-NBD-L Chenodeoxycholyl-NBD-lysine
CGamF Cholylglycylamidofluorescein
CH25H Cholesterol 25-hydroxylase
CHO Chinese hamster ovary
Chol Cholesterol
CLF Cholyl-lysyl- fluorescein
CO2 carbon dioxide
CT Computed Tomography
CYP27A1 Sterol 27-hydroxylase
CYP39A1 Oxysterol 7α-hydroxylase
CYP46A1 Cholesterol 24-hydroxylase
CYP7A1 Cholesterol 7α-hydroxylase
CYP8B1 Sterol 12α-hydroxylase
Da Dalton
DCM Dichloromethane
DIC Drug induced cholestasis

DILI Drug-induced liver injury
DMEM Dulbecco’s modified Eagle’s medium
DMF Dimethylformamide
DMSO Dimethyl sulfoxide
DTPA Diethylenetriaminepentaacetic acid
E17βG Estradiol-17β-glucuronide
EC Electron capture
FDG Fluoro-2-deoxy-D-glucose
FNH Focal nodular hyperplasia
GBCA Gadolinium based contrast agent
Gd-BOPTA Gadobenate dimeglumine
Gd-EOB-DTPA Gadoxetate disodium
HBSS Hank’s balanced salt solution
HCA Hepatocellular adenoma
HCC Hepatocellular carcinoma
HCl hydrochloric acid
HCO3- Bicarbonate
HEK Human embryonic kidney
HEPES 4-(2-hydroxyethyl)-1-piperazineethanesulfonic acid
HIDA Hepatic imino diacetic acid
HuAlb Human Albumin
IBABP/Ibabp Ileal bile acid binding protein
ICG Indocyanine green

IDIF Image-derived input function
IP Intraperitoneal
IT Isomeric transition
IV Intraveneous
k Kinetic rate constant
K Potassium
kDa kilodalton
km Michaelis menten constant
KO Knock-out
MeCN Acetonitrile
MeOH Methanol
MgSO4 Magnesiumsulphate
MI Molecular imaging
MRI Magnetic Resonance Imaging
MRP/Mrp Multidrug resistance-associated protein
N2 Nitrogen gas
Na Sodium
NaHCO3 Sodium bicarbonate
NaOH Sodium hydroxide
NBD Nitrobenzoaxdiazolyl
NTCP/Ntcp Na+ dependent taurocholate cotransporting protein
O2 Oxygen
OATP/Oatp Organic anion transporting polypeptide

OCT1 Organic cation transporter 1
OI Optical imaging
OSTα/β / Ostα/β Organic solute transporter α and β
PE Polyethylene
PEG Polyethyleneglycol
PET Positron emission tomography
PL Phospholipids
Ri Intrinsic resolution
ROI Region of interest
RP-HPLC Reversed phase high performance liquid chromatography
Rs Spatial resolution
S Sensitivity
SD Standard deviation
SLC Solute carrier family
SLCO Solute carrier organic anion transporter superfamily
SnCl2.2H2O Tin(II) chloride dehydrate
SPECT Single photon emission computed tomography
SPIO Superparamagnetic iron oxide
TAC Time activity curve
t-ASBT Truncated apical sodium dependent bile acid transporter
TCA Taurocholic acid
TEA Tetra-ethyl-ammonium
ToF Time of flight

uPA Urokinase-plasminogen activator
US Ultrasound imaging
Vmax Maximum transport rate
WT Wild type

Chapter 1: General introduction
1
Chapter 1.
General introduction

Chapter 1: General introduction
2

Chapter 1: General introduction
3
Overview The liver is an important organ for homeostasis. Drugs can interfere with the functions of the
liver, which can lead to drug induced liver injury. Drug induced liver injury is a form of
acquired liver disease and is a major cause of safety-related withdrawal of drugs from the
market. Additionally, it is a major cause of attrition during the drug development process.
Therefore, new strategies are needed to identify and characterize interactions of new
candidate drugs with hepatic transporters early in the developmental process. It is important to
improve the currently available prediction methods to identify and mitigate potential
compound-related safety issues. This will result in safer drugs and a more efficient drug
development process.
In the first part of this chapter, an overview of main liver functions is provided, with a focus
on the enterohepatic cycling of bile acids, their biosynthesis and the most common bile acid
transporters. Additionally, an introduction on drug induced liver injury is given. In the second
part, molecular imaging and more specifically Single Photon Emission Tomography will be
discussed, since these techniques will be used in this work to investigate drug-induced liver
injury in a non-invasive manner.

Chapter 1: General introduction
4
Part I: The Liver
Anatomy and physiology of the liver
The liver is the biggest organ in the body and is functionally very complex. It is an important
organ for homeostasis and its most important functions include glycogen storage, production
of plasma proteins and bile acids, elimination of endogenous substances (e.g. cholesterol,
bilirubin and their metabolites) and secretion of toxic compounds (e.g. drugs, carcinogens)
(Kullak-Ublick et al., 2000; Wolkoff et al., 2003; Erlinger et al., 1996)
Figure 1.1: Anatomy of the liver and surroundings (adapted from www.urmc.rochester.edu)
The liver is located in the right upper quadrant of the abdominal cavity and it overlies the
gallbladder (Figure 1.1). It consists of a left and right lobe, which each have an independent
vascular supply and duct drainage. The lobes, in turn, consists of lobules, that form the
functional units of the liver (Roberts et al., 2002) (Figure 1.2).
The blood circuit of the liver is a unique system with a double blood supply: venous blood
from the gut, pancreas and the spleen and arterial blood from the hepatic artery are delivered
to the liver via a highly branched network of fenestrated blood vessels known as the liver
sinusoids. In the liver sinusoids, the blood mixture has a near-direct contact with the
hepatocytes. Processed blood is delivered from the sinusoids to the central veins which empty
into the vena cava inferior (Treyer et al., 2013)

Chapter 1: General introduction
5
Histologically, the liver comprises thousands of nearly identical lobules that are divided by
sheets of connective tissue. The lobule is the structural and functional subunit of the liver and
has a hexagonal structure, 2 mm in height and 1–1.3 mm in diameter (Figure 1.2). The lobule
consists mainly of hepatocytes that are arranged radially in plates from the central vein to the
portal triads. Hepatocytes account for approximately 65% of the nuclear population in the
liver. They are polarized cells since they absorb substrates from the blood and secrete
molecules in the bile (Treyer et al., 2013). They have basolateral (sinusoidal) and apical
(canalicular) plasma membrane domains (Trauner et al., 2003). The sinusoids can be found
between the hepatocyte plates, also arranged radially, and connect the vessels in the portal
triad to the central vein, thus allowing nutrient and oxygen-rich blood to enter the lobule from
the portal vessels and empty into the central vein. The hepatocyte sinusoidal membrane faces
the small perisinusoidal space of Disse, which is located between the hepatocytes and the
endothelium of the sinusoid and gives rise to a two-way exchange between the blood and
hepatocytes (Figure 1.3). The sinusoid lumen houses the mononuclear phagocytic system,
which comprises generally stationary Kupffer cells as well as some migrating macrophages.
These cells play an essential role in host defense mechanisms and the removal of foreign
small particles and substances that enter the liver (Esteller, 2008).
Immediately under the liver, the gallbladder can be found. The gallbladder contains bile that
is produced by hepatocytes and is collected in bile canaliculi, which merge to form bile
ductules (Figure 1.2). These intrahepatic ducts (within the liver) drain into the left and right
hepatic ducts, which merge to form the common hepatic duct. The cystic duct from the
gallbladder joins with the common hepatic duct to form the common bile duct (Figure 1.1).
Bile is a major excretion route for endogenous substances and secretion of toxic compounds
(Hofmann et al., 2008).
The biliary apparatus is a convergent system of canals that begins in the canaliculi, followed
by the bile ducts, and ending with the common bile duct (choledochus) (Figure 1.2). Bile
secretion depends on the function of membrane transport systems in hepatocytes and
cholangiocytes and on the structural integrity of the biliary tree. The hepatocytes generate the
primary bile in their canaliculi (Esteller, 2008). Biliary canaliculi are blind tubular structures
that favor the formation of bile flow by means of osmotic gradients. Osmosis is considered to
be the major mechanism of water movement during bile formation. The osmotic gradient is
provided by organic and inorganic solutes secreted into bile. Therefore, bile formation is
intimately related to hepatobiliary transport of biliary constituents (Strazzabosco et al., 2008).

Chapter 1: General introduction
6
The cholangiocytes, which are epithelial cells that line intrahepatic bile ducts, account for 3 to
5% of the liver cell population. They modify the canalicular bile by secretory and reabsorptive
processes as bile passes through the bile ducts.
Figure 1.2: Microanatomy of the liver. Overview of the hepatic functional subunits or lobules . (Stenvall et al.,
2014)
Figure 1.3: Liver sinusoids and surrounding tissue. Liver sinusoids are lined with fenestrated endothelia and
Kupffer cells. They are separated from hepatocytes by the space of Disse. Stellate cells embrace the sinusoids
inside the space of Disse. The arrows display the flow in the vessel. Hepatocytes form hepatic cords (adapted
from Frevert et al., 2004).

Chapter 1: General introduction
7
The enterohepatic cycle
Bile formation is a unique feature of the liver and is vital for survival of the organism (Boyer,
2013). Bile is a complex fluid that consists of approximately 95% water in which a number of
endogenous molecules, including bile acids, bilirubin, phospholipid, cholesterol, proteins,
peptides, amino acids, steroids, enzymes, vitamins and heavy metals, as well as exogenous
drugs, xenobiotics and environmental toxins are dissolved (Figure 1.4). These compounds
flow through the biliary tract into the small intestine (Pellicoro et al., 2007).
The important functions of bile according to Boyer et al. (Boyer et al., 2013) are:
1) Bile is the major excretory route for potentially harmful exogenous lipophilic
substances and for other endogenous substrates such as bilirubin and bile acids whose
molecular weights are >300 to 500 dalton (Da) and not readily filtered or excreted by
the kidneys.
2) Bile acids are the major organic components in bile and normally function to emulsify
dietary fat, cholesterol and fat-soluble vitamins, and facilitate their intestinal
absorption.
3) Bile is the major elimination route of cholesterol.
4) Bile protects the organism from enteric infections by excreting immunoglobulin A
(IgA), inflammatory cytokines, and by stimulating the innate immune system in the
intestine.
5) Bile is an essential component of the cholehepatic and enterohepatic circulation.
6) Many hormones and pheromones are excreted in bile.
The main driving force of bile flow is the secretion of bile acids. The average bile flow in
humans is 1.5 to 2.0 mL/min/kg body weight (Roberts et al., 2002). In healthy individuals, the
basal concentrations of bile acids in peripheral blood are lower than 10 µM, whereas they are
in the mM range in bile (Marin et al., 2016). These bile acids are synthesized in the liver from
cholesterol or are taken up from the sinusoidal blood as part of the enterohepatic circulation,
and are actively secreted into bile and stored in the gallbladder between meals. Upon food
ingestion, the duodenum secretes cholecystokinine into the blood, which consequently leads
to contraction of the gallbladder and release of bile into the intestines. In the small intestine,
bile has a detergent function to keep fat-soluble compounds in solution for uptake (vitamins)
or excretion (cholesterol, lipophilic toxins/drugs). In the bile, bile acids form mixed micelles

Chapter 1: General introduction
8
with phospholipids and these are the vehicles that carry cholesterol and other lipophilic
compounds through the intestine.
Figure 1.4: Composition of bile. BA=bile acids; PL=phospholipids; Chol=cholesterol; BP=biliary pigments;
proteins (Esteller et al., 2008).
Figure 1.5 displays the enterohepatic cycle of bile acids. The enterohepatic circulation
maintains a bile acid pool size of approximately 2-4 g in humans, and 4 mg in mice. This pool
cycles 3-4 times per day and as such, the intestinal bile acids absorbed may be as much as 30
g per day in humans, and 20 mg/day in mice. This enterohepatic circulation of bile acids is an
extremely efficient process, since less than 5% of the intestinal bile acids escapes reabsorption
and is eliminated in the feces (Hulzebos et al., 2001; Hofmann et al., 1983; Dietschy et al.,
1993; Dietschy et al., 2002). Bile acids are highly albumin bound. However, bile acids in the
sinusoidal blood are efficiently taken up by the hepatocytes from Disse’s space due to the
existence of transporters in the basolateral membrane (Alrefai et al., 2007; Esteller et al.,
2008; Kullak-Ublick et al., 2000; Kosters et al., 2008). After their dissociation from albumin,
bile acids are transported across the hepatocytes to the canaliculus. Bile acid uptake across the
basolateral membrane of the hepatocytes is mainly mediated by the Na+-dependent
Taurocholate Cotransporting Polypeptide (NTCP). Additionally, Organic Anion Transporting
Polypeptides (OATPs) are also responsible for bile acid uptake in a Na+-independent manner.
Efflux to the bile across the canalicular membrane occurs via the Bile Salt Export Pump

Chapter 1: General introduction
9
(BSEP) and Multidrug Resistance-associated Protein 2 (MRP2). The bile acids arrive in the
intestinal lumen via the bile duct. Some of the excreted bile acids are deconjugated there by
the action of the bacterial flora. 95% of bile acids are efficiently reabsorbed from the
intestinal lumen via passive diffusion and actively via Na+-dependent Apical Sodium
Dependent Bile Acid Transporter (ASBT). Whereas passive absorption occurs down the
length of the intestine, active transport of bile acids is restricted to the ileum (Dawson et al.,
2009). The intracellular transport of bile acids across the enterocytes is facilitated by the Ileal
Bile Acid Binding Protein (IBABP), followed by efflux through Organic Solute Transporter α
and β (OSTα/OSTβ). Bile acids then re-enter the portal blood and complete the enterohepatic
cycle. Hepatic conversion of cholesterol to bile acid balances fecal excretion and this process
represents a major route of cholesterol elimination from the body.
Figure 1.5: Enterohepatic circulation of bile acids (adapted from Alrefai et al., 2008).

Chapter 1: General introduction
10
Bile acid biosynthesis
In the 1930s, the steroid structure of bile acids was finally established (Hofmann et al., 2014).
The first ideas came from Nobel Prize winners Heinrich Wieland and Adolf Windaus
(Wieland, 1928; Windaus, 1928). These two chemists had slowly developed the idea that both
cholesterol and bile acids share a four-ring structure with a side chain of five carbon atoms for
bile acids and eight carbons for cholesterol. However, the structures of the steroid nucleus
shown in their Nobel lectures were not correct. The path to the correct structure came from
Desmond Bernal, a physicist, who undertook X-ray diffraction studies of organic molecules.
He studied cholesterol, among other things, and published his findings in Nature in 1932
(Bernal, 1932). Finally, Rosenheim and King in London, and Wieland and Dane in Munich,
published the application of Bernal’s pioneering studies to the extensive literature on bile acid
structure (Rosenheim et al., 1934). Each group proposed the
cyclopentanoperhydrophenanthrene structure for the steroid nucleus. Figure 1.6 shows the
structure of chenodeoxycholic acid (CDCA) and the numbering system for the steroid nucleus
and side chain that was proposed in the 1930s and has been used ever since.
Figure 1.6: Numbering system of bile acids and bile alcohols (A). Frontal view of CDCA (B). The numbering
system was developed in the 1930s when the steroid structure was finally established. (adapted from Hofmann et
al., 2014)

Chapter 1: General introduction
11
Bile acid biosynthesis is an exclusively liver-specific process and starts from cholesterol and
involves 17 different enzymes, many of which are preferentially expressed in the liver
(Pellicoro et al., 2007).
The biosynthesis can be subdivided into a classic or neutral and an alternative or acidic
pathway. The products that derive from these pathways are the primary bile acids. The classic
pathway results in the formation of the primary bile acid cholic acid (CA) and accounts for
90% of bile acid synthesis. In contrast, the alternative pathway, which is initiated in the
plasma, leads to formation of the primary bile acid CDCA. The most important difference
between these two pathways is the order of reactions that transforms cholesterol to CA or
CDCA and the cellular site where the first reactions take place. The chemical diversity of the
bile acid pool is further expanded by the action of anaerobic bacteria in the gut, which convert
primary bile acids into dozens of secondary bile acids (Hofmann et al., 2008).
For the conversion of cholesterol into primary bile acids, different steps can be distinguished:
a) Initiation
b) ring structure modification
c) side chain oxidation and
d) amino acid conjugation.
Initiation
The initiation of the classic pathway includes conversion of cholesterol into 7α-
hydroxycholesterol by the enzyme cholesterol 7α-hydroxylase (CYP7A1), expressed
exclusively in the liver (Figure 1.7, reaction 1). This reaction is considered as the rate-limiting
step in this route.
Cholesterol can be hydroxylated at three different positions on the side chain and this leads to
formation of 24-hydroxycholesterol, 25-hydroxycholesterol and 27-hydroxycholesterol. These
oxysterols serve as substrates for bile acid synthesis. Cholesterol 24-hydroxylase is the
enzyme that synthesizes 24(S)-hydroxycholesterol (Figure 1.7, reaction 2) and is detectable in
neurons of the brain. The enzyme contributes little to overall bile acid synthesis but is
important in the turnover of cholesterol in the brain. Cholesterol 25-hydroxylase (Figure 1.7,
reaction 3) that synthesizes 25-hydroxycholesterol does not contribute significantly to bile

Chapter 1: General introduction
12
acid synthesis, but may play a role in cholesterol catabolism in a tissue-specific fashion, as
does the cholesterol 24-hydroxylase.
Sterol 27-hydroxylase (CYP27A1) synthesizes 27-hydroxycholesterol from cholesterol,
which is the most abundant oxysterol in the plasma of mice and human (Figure 1.7, reaction
4). This reaction is the start of the alternative biosynthesis pathway.
To be converted into bile acids, oxysterols must undergo 7α-hydroxylation. Two enzymes can
catalyze this step, namely CYP39A1 oxysterol 7α-hydroxylase and CYP7B1 oxysterol 7α-
hydroxylase. CYP39A1 acts on 24(S)-hydroxycholesterol (Figure 1.7, reaction 5) and
CYP7B1 acts on 25- and 27-hydroxycholesterol (Figure 1.7, reaction 6). CYP7B1 oxysterol
7α-hydroxylase is expressed at high levels in the adult liver. 5-10% of the bile acid pool in
humans derives from oxysterols. (Russell, 2003)
Figure 1.7: Hydroxylation. Cholesterol can be hydroxylated at 4 different positions. (adapted from Russell,
2003)

Chapter 1: General introduction
13
Ring structure modification
Next, the 7α-hydroxylated intermediates derived from cholesterol and the oxysterols are
converted into their 3-oxo, Δ4 forms (Figure 1.8, reaction 7) by 3β-hydroxy-Δ5-C27-steroid
oxidoreductase (C27-3β-HSD). This enzyme will act only on sterols with a 7α-hydroxyl group,
and thus this step lies downstream of the cholesterol and oxysterol 7α-hydroxylases. The
reaction catalyzed by these enzymes is complex and involves isomerization of the double
bond from 5 to 4 position and the oxidation of the 3β-hydroxyl to a 3-oxo group (Figure 1.8,
reaction 7). Since the C27-3β-HSD enzyme is unique, loss of this enzyme blocks the synthesis
of bile acids.
In a subsequent step, the products of this reaction can take one of the two routes of bile acid
synthesis. In the presence of sterol 12α-hydroxylase, the resulting product will be converted
ultimately into cholic acid (Figure 1.8, reaction 8). In the absence of sterol 12α-hydroxylase,
the intermediates are converted into chenodeoxycholic acid or another bile acid. The
concentration of sterol 12α-hydroxylase in the liver determines the relative amounts of the
two primary bile acids, cholic acid and chenodeoxycholic acid.
Both, the 12α-hydroxylated intermediates and the C27-3β-HSD intermediates that escape the
12α-hydroxylation, are subject to reduction of the double bond in the A-ring by the enzyme
Δ4- 3-oxosteroid 5β reductase (Figure 1.8, reaction 9).
The final step of ring modification is the reduction of the 3-oxo-group to an alcohol in the
alpha stereochemical configuration and is catalyzed by 3α-hydroxysteroid dehydrogenase
(Figure 1.8, reaction 10) (Russell, 2003)

Chapter 1: General introduction
14
Figure 1.8: Ring structure modifications . 7α-hydroxylated intermediates and oxysterols are converted into their
3-oxo, Δ4 forms. In presence of sterol 12α-hydroxylase, the synthesis will result in cholic acid; in the absence, it
will result in chenodeoxycholic acid or another bile acid.Then, the double bonds of the A-ring are reduced. In the
final step, the 3-oxo-group is reduced to an alcohol. (adapted from Russell, 2003).
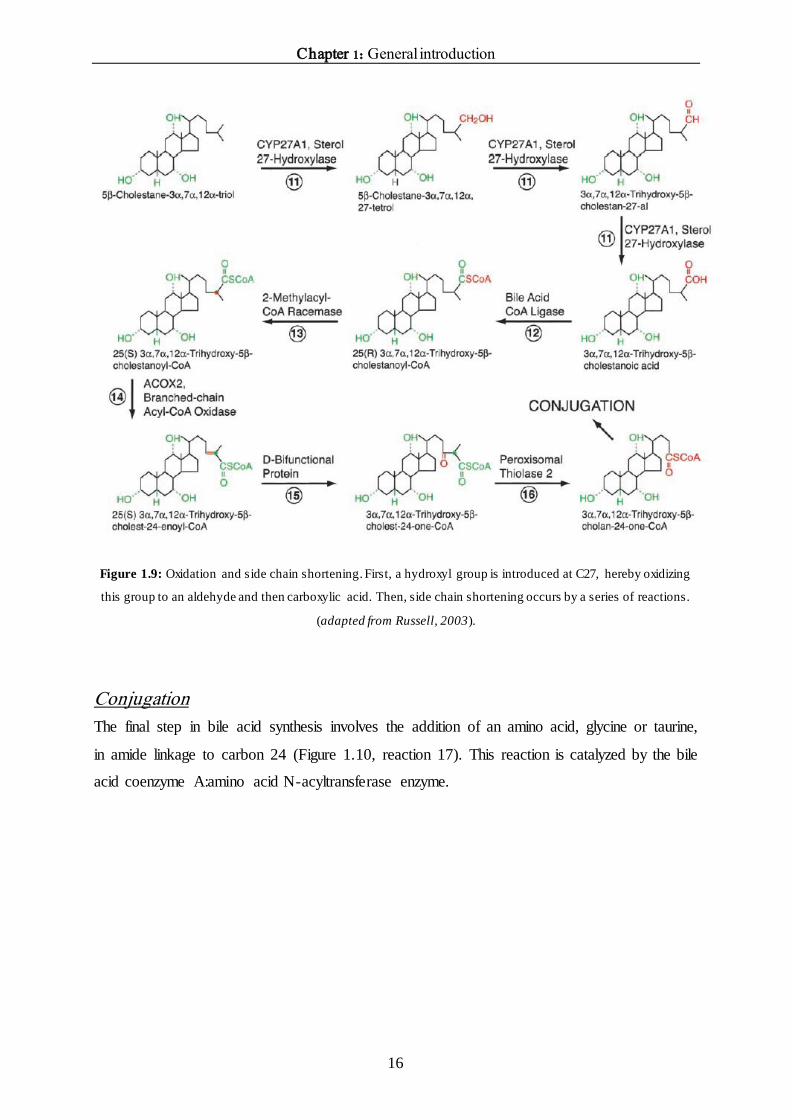
Side chain oxidation
After ring modifications, the bile acid precursors undergo progressive oxidation and
shortening of the sterol side chain. The first few steps are performed by sterol 27-hydroxylase
(Figure 1.9, reaction 11), the same mitochondrial cytochrome P450 (CYP27A1) that initates

Chapter 1: General introduction
15
bile acid synthesis through the formation of 27-hydroxylcholesterol (Figure 1.7, reaction 4).
This enzyme introduces a hydroxyl group at carbon 27, oxidizes this group to an aldehyde and
then to a carboxylic acid.
The oxidized bile acid intermediates are then subject to shortening of the side chain. The
terminal three carbon atoms are removed by a series of reactions. The first reaction is
catalyzed by bile acid coenzyme A ligase (Figure 1.9, reaction 12), which activates the sterol
intermediate by conjugation with coenzyme A. After activation, the 25(R) isomers must be
converted into 25(S) isomers before subsequent steps in side chain shortening can take place.
This reaction is catalyzed by 2-methylacyl-coenzyme A racemase (Figure 1.9, reaction 13).
The sterol products are then subject to dehydrogenation catalyzed by the branched chain acyl
coenzyme A oxidase enzyme (Figure 1.9, reaction 14). The next step involves hydration and
oxidation at the Δ24 bond and is catalyzed by the D-bifunctional protein (Figure 1.9, reaction
15).
The last step in the side chain shortening process is cleaving of the C24-C25 bond to form
propionyl-coenzyme A and a C24-coenzyme A bile acid intermediate (Figure 1.9, reaction 16).
This reaction is catalyzed by peroxisomal thiolase 2 (Russell et al., 2003).
Coenzyme A esterase in the peroxisomes can catalyze the hydrolysis of bile acid thioesters in
free bile acids and CoA, hereby generating cholic acid and chenodeoxycholic acid.
Chapter 1: General introduction
16
Figure 1.9: Oxidation and side chain shortening. First, a hydroxyl group is introduced at C27, hereby oxidizing
this group to an aldehyde and then carboxylic acid. Then, side chain shortening occurs by a series of reactions.
(adapted from Russell, 2003).
Conjugation
The final step in bile acid synthesis involves the addition of an amino acid, glycine or taurine,
in amide linkage to carbon 24 (Figure 1.10, reaction 17). This reaction is catalyzed by the bile
acid coenzyme A:amino acid N-acyltransferase enzyme.

Chapter 1: General introduction
17
Figure 1.10: Conjugation (adapted from Russell, 2003).
Conjugation of bile acids increases the amphipathicity and enhances the solubility of the
molecules, which makes them impermeable to cell membranes. Sulphonic acid group of
taurocholic acid and the carboxyl group of glycocholic acid are ionized at physiological pH,
which renders the bile salt (the ionized form of the bile acid) very amphipathic, together with
the planar structure of the bile acid and the hydroxyl groups on the ring. For example,
conjugation of cholic acid with glycine reduces the pKa from 6.4 to 4.4 ensuring that the bile
acid is completely ionized and highly soluble (Russell et al., 2003).
Additionally, besides conjugation with amino acids, there are four more types of conjugation
(Hofmann et al., 2008):
1) Sulfation
2) Ester glucoronidation at C24
3) Ethereal conjugation at C3
4) N-acetylglucosamination at C7 in bile acids with a β-hydroxyl group
Because conjugated and free bile acids do not cross cell membranes, dedicated transport
systems are required to move bile acids in and out of cells.

Chapter 1: General introduction
18
Secondary bile acids
During the enterohepatic cycle, bile acids are exposed to bacterial enzymes. When primary
bile acids are modified by these enzymes, the resulting bile acid is called a secondary bile
acid. Figure 1.11 shows the chemical structure of the major bile acids present in human bile.
Figure 1.11: Chemical structure of the major bile acids present in human bile (Hofmann et al., 2008).
In the colon of animals with a cecum, anaerobic bacteria remove the hydroxyl group at C7 to
form a new class of bile acids termed 7-deoxy bile acids.
Bile acid transporters of the enterohepatic cycle
To maintain bile acid homeostasis, transport proteins that make the enterohepatic cycle
possible are needed (Figure 1.5). Approximately 95% of the bile acids that are excreted in the
bile derive from the recirculating pool. Therefore, hepatocytes must transport bile acids
efficiently from the portal blood into the bile. This vectorial trans-hepatocellular movement of
bile acids is a concentrative transport process that is driven by a distinct set of transport
systems at the sinusoidal and canalicular plasma membranes (Table 1.1). Three different
groups can be distinguished (Dawson et al., 2009):

Chapter 1: General introduction
19
1) Primary (adenosine triphosphate (ATP)-dependent) transport systems
2) Secondary (Na+ gradient dependent) transport systems
3) Tertiary (OH- or HCO3- dependent anion exchange) transport systems
Table 1.1: Overview of bile acid transporters. (adapted from Marin et al., 2016)
Next, an overview of the transport proteins is given.
Sinusoidal (basolateral) uptake
Bile acids are 100- to 1000-fold concentrated in bile compared to plasma. Therefore,
hepatocellular secretion of bile acids (and their precursors) occurs against a steep
concentration gradient and necessitates active transport (Pellicoro et al., 2007). Uptake is
initiated at the basolateral membrane that is in direct contact with portal blood plasma, via
sodium-dependent and independent mechanisms. The uptake of conjugated bile acids is
predominantly mediated (>75%) by Na+-dependent transport using NTCP. In contrast,

Chapter 1: General introduction
20
unconjugated bile acids are taken up predominantly via Na+-independent transport using
OATPs (Kullak-Ublick et al., 2000).
NTCP
The Na+/taurocholate cotransporting polypeptide (NTCP) is a member of the solute carrier
(SLC) family 10 (SLC10) of sodium/bile salt cotransporters and the NTCP gene has been
mapped to chromosome 14q24 (Hagenbuch et al., 2004). In man, the family includes two
bile acid carriers (SLC10A1/NTCP; SLC10A2/ASBT, see later). NTCP was the first bile acid
carrier identified at both the molecular and functional levels (Alrefai et al., 2007; Hagenbuch
et al., 1994; Hallen et al., 2002). It is expressed exclusively in hepatocytes and is localized at
the basolateral membrane (St-Pierre et al., 2001). The transporter is distributed
homogeneously throughout the liver lobule (Trauner et al., 2003). NTCP consists of 349
amino acids with a mass of 56 kDa (Dawson et al., 2009). The transporter has been cloned
from rat, human, mouse and rabbit liver (Claro da Silva et al., 2013).
NTCP is a secondary transport system. The transport is unidirectional and has two important
driving forces for hepatic uptake: 1) an inwards chemical Na+ gradient that is a result of the
Na efflux out of the cell by the Na/K ATPase pump, where 3 Na+ ions are exchanged for 2 K+
ions and 2) an intracellular negative electrical gradient of about -35 to -40 meV. The outward
conductance of K+ via K+ channels in the basolateral membrane further contributes to the
regulation of this negative membrane potential. Together, the chemical and electrical
gradients produced by the sodium pump are able to move solutes into the hepatocytes against
their concentration gradients, with a 2:1 stoichiometry (Na+:bile acids = 2:1) (Boyer, 2013;
Meier et al., 2002).
NTCP transport activity is highest for glycine and taurine conjugated dihydroxy and
trihydroxy bile acids. Conjugated taurocholate is taken up for more than 80% via NTCP,
unconjugated cholate for less than 50% (Trauner et al., 2003). However, most bile acids are
conjugated and therefore, uptake of bile acids into the hepatocytes occurs predominantly by
NTCP (Anwer et al., 2014). The high level of NTCP expression at the sinusoidal membrane
of hepatocytes and the high affinity for conjugated bile acids promotes their efficient
extraction from portal blood. Thus, NTCP functions to maintain the enterohepatic cycle of
bile acids and keeps plasma concentrations at a minimum (Dawson et al., 2009). Although,
bile acids are the major physiological substrate for NTCP, other compounds can be
transported like estrogen conjugates, bromosulphothalein, thyroid hormones and

Chapter 1: General introduction
21
dehydroepiandrosteron (DHEA) (Kosters et al., 2008). In addition, NTCP also mediates
uptake of drugs such as rosuvastatin and micafungin and drugs that are covalently bound to
taurocholate such as chorambucil-taurocholate (Trauner et al., 2003).
OATPs
Uptake of bile acids into the hepatocytes occurs predominantly by NTCP, and to a lesser
extent by organic anion-transporting polypeptides (OATPs). OATPs are members of the
solute carrier organic anion transporter (SLCO) superfamily. This OATP superfamily consists
of 6 different families, which can be further subdivided into subfamilies based on their amino
acid sequence identity. Currently, 11 human OATPs have been identified (van de Steeg et al.,
2010; Iusuf et al., 2011). The OATP genes of the OATPs expressed in liver can be found on
chromosome 12q12 (Alrefai et al., 2007). OATP1A2, OATP1B1 and OATP1B3 consist of
670, 691 and 702 amino acids and a weight of 85, 84 and 120 kDa, respectively.
OATPs are tertiary transport systems and function as electroneutral anion exchanges. They
are thought to transport bile acids and other solutes in exchange for intracellular anions, such
as glutathione and bicarbonate (Boyer et al., 2013). Four OATPs have been functionally
identified in human liver (OATP1A2, OATP1B1, OATP1B3, OATP2B1) and many are also
expressed in other tissues like the blood-brain barrier, kidney, choroid plexus, lung, heart,
intestine, placenta and testis (Kullak-Ublick, 2001; Tamai et al., 2001). OATP1B1 and 1B3
are hepatocyte specific and functionally most important. OATP1B1 is expressed on the
basolateral membrane throughout the hepatic lobule in human liver, while OATP1B3 is most
strongly expressed in pericentral regions of the hepatic lobule. The highest expression in liver
is found for OATP1B1 and has 80% sequence homology with OATP1B3 (Hagenbuch et al.,
2004; Boyer et al., 2013; Pauli-Magnus et al., 2005).
OATPs mediate the sodium-independent cellular uptake of a wide variety of organic
endogenous and exogenous compounds, such as bile acids, bilirubin, steroid and thyroid
hormones and their conjugates, and numerous drugs, xenobiotics and environmental toxins.
Most OATP substrates are organic anions with molecular weights greater than 300 Da, but
they can also transport cations and neutral compounds (Boyer et al., 2013). In contrast to
NTCP, unconjugated bile acids can be efficiently taken up by the liver by OATPs. Because of
this broad substrate specificity and due to their expression in pharmacokinetically important
tissues (liver, small intestine, kidney), OATPs of the 1A/1B subfamilies are thought to play an

Chapter 1: General introduction
22
important role in drug disposition (van de Steeg et al., 2010; Tamai et al., 2001;Kullak-Ublick
et al., 2001).
Alternative basolateral bile acid efflux
Under normal physiological conditions, bile acid uptake is the predominant transport across
the basolateral membrane of hepatocytes and the basolateral efflux into the sinusoids is
negligible. However, under cholestatic conditions (see later), basolateral bile acid efflux can
be upregulated and can in part compensate for the disturbed canalicular bile acid secretory
pathway (Meier et al., 2002) to protect the liver (Halilbasic et al., 2013). This alternative
basolateral bile acid efflux is mediated by members of the ATP-binding cassette (ABC)
superfamily of transporters, namely the multidrug resistance proteins (MRPs) family. This
subfamily of transporters consists of at least six members (MRP1-6) with four of them
expressed in the liver. MRP3 and MRP4 are expressed in the basolateral membrane of the
hepatocyte, whereas MRP2 is localized on the canalicular membrane (see later) (Alrefai et al.,
2007). MRP1 is almost absent in the liver. In cholestatic conditions, an upregulation of MRP3
and MRP4 can be observed. These transporters are expressed at extremely low levels in
normal hepatocytes. Both are ATP-dependent pumps with a wide range of substrates (Alrefai
et al., 2007; Sievänen, 2007). Additionally, the heterodimeric Organic Solute Transporters α
and β (OSTα/β) participate in this basolateral efflux (Halilbasic et al., 2013).
Canalicular excretion
After uptake in the hepatocytes, bile acids and other organic solutes move across the cell to
the canalicular membrane, where they can be excreted into bile. This can occur by rapid
diffusion in association with cytosolic proteins, in association with intracellular membranes,
or by transcytosis in membrane vesicles associated with microtubules. The hydrophobicity of
the compounds influences which pathway the solute will take. The more hydrophobic the
solute, the more it will associate with intracellular membranes rather than the cytosolic
proteins (Boyer et al., 2012; Trauner et al., 2003).
Canalicular bile acid transport is a critical component of their enterohepatic circulation and
represents the rate-limiting step in hepatic excretion and bile formation. Additionally, it is the
main generator of bile flow (Kosters et al., 2008). Secretion of bile acids into bile across the

Chapter 1: General introduction
23
canalicular membrane occurs against a steep concentration gradient that ranges between 100-
1000 fold. Therefore, the canalicular excretion of bile acids occurs via direct transporter
systems whose function depends on ATP hydrolysis. The most important efflux transporters
are BSEP, which is responsible for the transport of monovalent bile acids, and MRP2, which
is the main transporter of divalent bile acids. (Alrefai et al., 2007; Trauner et al., 2003)
BSEP
The Bile Salt Export Pump (BSEP) is the predominant efflux transporter on the canalicular
membrane. BSEP is a member of the multidrug resistance P-glycoprotein family that belongs
to the ABC superfamily (ABCB11) (Noé et al., 2002). Human BSEP can be found on
chromosomes 2q24. It has been cloned from pig, human, rabbit, rat and mouse (Alrefai et al.,
2007). BSEP is a direct transport system that requires ATP. It consists of 1321 amino acids
and it has a mass of 150-170 kDa. BSEP was also found in human testis (Stieger et al., 2007).
BSEP mediates the transport of mainly monovalent bile acids. BSEP has a poor affinity for
unconjugated bile acids, and a high affinity for conjugated bile acids (Kosters et al., 2008).
Whereas bile acids are the major physiological substrates, BSEP is also able to transport a
limited number of drugs, such as pravastatin. Other drugs like cyclosporine, rifamycin,
troglitazone and glibenclamide are no substrates but interact with BSEP and inhibit bile acid
export (Dawson et al., 2009).
MRP2
The Multidrug Resistance Protein 2 (MRP2) is another transporter of the ABC transporter
superfamily (Nies et al., 2007) and is a unidirectional ATP-dependent efflux pump. Human
MRP2 gene (ABCC2) is mapped on chromosome 10q24.
The gene has been cloned from six mammalian species including human, rhesus monkey, rat,
rabbit, mouse and dog and three other vertebrates. (Fardel et al., 2005).
In the liver, it is predominantly localized in the canalicular membrane of the hepatocytes.
Additionally, this protein can be found in the kidneys and enterocytes of the duodenum and
jejunum. MRP2 mediates the transport of divalent bile acids and it does not have the capacity
to transport monovalent bile acids. It has a wide range of organic substrates (mainly organic
anions), such as glutathione, glucuronide and sulfate conjugates and also some unconjugated
drugs (Alrefai et al., 2007).

Chapter 1: General introduction
24
Intestinal bile acid uptake
Bile acids are reabsorbed in the intestines through a combination of passive absorption in the
proximal small intestine, active transport in the distal ileum, and passive absorption in the
colon. Bile acids are actively transported into the distal ileum by the Apical Sodium
Dependent Bile Acid Transporter (ASBT). (Dawson et al., 2009)
ASBT
ASBT, the ileal counterpart of hepatic NTCP, is also a member of the SLC10 family of
sodium/bile salt cotransporters. The ASBT gene is localized on chromosome 13q33 in human.
NTCP and ASBT are phylogenetically related.
ASBT is, just like NTCP, a secondary transporter system that is driven by sodium and a
negative intracellular potential to move bile acids from the lumen of the small intestine across
the apical brush border. The ASBT mediated transport is electrogenic with 2:1 Na+/bile acid
coupling stoichiometry. It consists of 348 amino acids and has a mass of 48 kDa. It has been
cloned from hamster, human, rat, rabbit and mouse ileum (Alrefai et al., 2007; Dawson et al.,
2009).
ASBT is expressed in the apical membrane of ileal enterocytes, proximal renal convoluted
tubule cells, epithelial cells lining the biliary tract (cholangiocytes) and gallbladder epithelial
cells.
Human ASBT transports both conjugated and unconjugated bile acids with preference for
conjugated. ASBT has a higher affinity for dihydroxy bile acids that are more hydrophobic
than trihydroxy bile acids.
Intestinal bile acid efflux
OSTα/β
Organic solute transporter α/ β (OSTα/β) is a unique heteromeric sterol transporter. Both
subunits are required for the functional expression of this transporter. It was cloned from
human and mice. It is located on chromosome 16B13 (Alrefai et al., 2007; Boyer et al., 2013;
Dawson et al., 2009; Kosters et al., 2008).
OSTα/β is Na+-independent facilitated diffusion transporter. Therefore, in contrast with other
bile acid transporters, substrates can be driven bidirectionally (uptake or efflux) across the

Chapter 1: General introduction
25
membrane of the cell depending on the electrical chemical gradient. The transporters can only
function as heterodimers, secreting bile acids back into the circulation, both in the intestine
and hepatocytes (Kosters et al., 2008).
Human OSTα/β is expressed in a variety of tissues with the highest levels in liver, small
intestine, colon, kidney, adrenal gland, testes and ovary (Kosters et al., 2008). It is also
expressed at lower levels in other tissues like heart, lung, brain, … OSTα is built up of 340
amino acids, while OSTβ is 128 amino acids in size.
Substrates include conjugated bile acids. In addition, OSTα/β transports sterols conjugated
with sulphate or glucuronic acid, including DHEAs, estrone-3-sulfate, digoxin, and
prostaglandin E2 (Ballatori et al., 2013).
Bile acid transporters in cholangiocytes and renal epithelial cells
Besides the expression in cells of the enterohepatic cycle, bile acid transporters are also
expressed in other epithelial cells, such as cholangiocytes and renal proximal tubule cells (Xia
et al., 2006). Between the cholangiocytes and hepatocytes, there is a cholehepatic shunt
(Figure 1.12) in which bile acids are actively absorbed by cholangiocytes lining bile ducts and
then, these bile acids cycle back to the hepatocytes for resecretion (Alrefai et al., 2007). The
exact physiological relevance of this shunt is not clear, but this pathway may play a role in the
modification of bile in the bile ductules and may become important under cholestatic
conditions, providing a mechanism to avoid high levels of intracellular bile acids, or help
improve bile flow within the liver (Kosters et al., 2008). Transport of bile acids in and out the
cholangiocytes is mediated by a similar set of transporters found in the terminal ileum. ASBT
mediates the Na+-dependent uptake of bile acids across the apical membrane (de Lima
Toccafonda Vieira et al., 2014), and OSTα/β, MRP3 or t-ASBT (truncated ASBT) are
potentially responsible for efflux of bile acids through the basolateral membrane into the
blood. The bile acids enter the peribiliary plexus adjacent to intrahepatic bile ducts, and are
then forwarded to the hepatic sinusoids for reuptake in the hepatocytes (Xia et al., 2006).

Chapter 1: General introduction
26
Figure 1.12: Cholehepatic shunting.
Active bile acid transport has also been reported in renal proximal tubule (Figure 1.13)
(Trauner et al., 2003). Reabsorption of bile acids from the glomerular filtrate ensures the
conservation of bile acids that escape hepatic clearance. Under normal conditions, urinary
excretion of bile acids is smaller compared to the amount of bile acids in the glomerular
filtrate due to almost complete renal reabsorption. ASBT, MRP4 and MRP2 were found to be
localized on the apical membrane of renal epithelial cells. Additionally, OSTα/β is also
expressed on the basolateral membrane of proximal tubule suggesting its involvement in bile
acid efflux from renal epithelial cells (Alrefai et al., 2007).
Figure 1.13: Bile acid transporters in the renal proximal tubular cell. (adapted from: Gai et al., 2013)

Chapter 1: General introduction
27
Drug-induced liver injury
Drug-induced liver injury (DILI) is a leading cause for the withdrawal of drugs from the
market. A variety of clinical presentations can be seen in patients, ranging from asymptomatic
mild biochemical abnormalities to an acute illness with jaundice that resembles viral hepatitis
(Pauli-Magnus et al., 2006). Drugs can cause liver injury via different and overlapping
pathologic mechanisms (de Lima Toccafondo Vieira et al., 2014).
DILI can be classified as hepatocellular, cholestatic and mixed type liver injury, depending on
the serum biochemistry markers (Schadt et al., 2016). Hepatocellular injury is mainly
characterized by the elevation of serum aminotransferases, while cholestatic liver damage is
reflected in increased levels of alkaline phosphatase, γ-glutamyltranspeptidase and conjugated
bilirubin in serum. On the one hand, in most hepatocellular forms, most cases are attributed to
idiosyncratic reactions, where immunoallergic mechanisms resulting from hypersensitivity
and unusual metabolism of the drug are the predominant pathophysiological pathways. On the
other hand, cholestatic drug induced injury (also referred to as drug induced cholestasis)
results from a drug- or metabolite-mediated inhibition of hepatobiliary transporters.
Basolateral uptake transporters are important in controlling hepatic drug and toxin exposure,
canalicular (apical) transporters are responsible for drug clearance from the liver as well as for
the secretion of bile acids and other bile constituents. Among 784 DILI cases reported
between 1970 and 2004, almost one-half of the cases had either cholestatic or mixed
cholestatic hepatic toxicity (Yang et al., 2013).
Cholestatic drugs may disturb bile acid homeostatis by direct inhibition of bile acid transport,
or by indirect processes, such as regulation of transporter localization or expression (Yang et
al., 2013). The interactions of drugs with transporters can lead to toxic concentrations of bile
acids, bilirubin or substrate drugs in blood or liver (Figure 1.14) (Pauli Magnus et al., 2006;
Padda et al., 2011), leading to drug-drug interactions, hypercholanemia, hyperbilirubinemia
and cholestasis. (Vaz et al., 2014; Shneider et al., 1997; Keppler et al., 2014; Marin et al.,
2016; Perez et al., 2009). Several transport proteins have been identified as potential targets
of drug-induced cholestasis. These include the basolateral uptake transporters (NTCP and
OATPs), canalicular efflux transporters (BSEP, MRP2) and basolateral efflux transporters
(MRP3 and MRP4). Since hepatic accumulation of compounds is regulated by both uptake
and efflux processes, inhibition of uptake can also exert a protective effect by preventing the
hepatic accumulation.
Chapter 1: General introduction
28
Many drugs can inhibit OATPs. Inhibition of OATPs can lead to drug induced benign isolated
hyperbilirubinemia. This transient jaundice may arise due to inadequate bilirubin clearance
from the body via OATP1B1 and OATP1B3. Drug interference with MRP2 may also be
correlated to clinical hyperbilirubinemia, since MRP2 directly regulates bilirubin elimination
via excretion of glucuronide metabolites into the bile (de Lima Toccafonda Vieira et al.,
2014). Although the inhibition of OATPs and MRP2 in itself possess a moderate risk, it can
increase the concentration of substrate drugs to elevated and toxic levels (e.g. statins)
(Maddrey et al., 2005). Consequently, it can cause drug-drug interactions that result in altered
pharmacokinetics (Maddrey et al., 2005).
Drugs may also inhibit the hepatic uptake and/or efflux of bile acids resulting in an increase in
intracellular concentrations leading to hepatotoxicity. To predict the hepatic exposure to bile
acids, inhibitory effects of drugs on each transport protein, as well as drug concentrations at
the interaction site should be considered. Inhibition of NTCP or BSEP can lead to bile acid
retention that may lead to hypercholanemia and severe cholestasis, resulting in liver failure
(Alrefai et al., 2007; Stieger et al., 2011). Prior to their interference with bile secretion, drugs
with intrahepatic cholestatic potential need to be taken up in the liver cells, which can be
modulated by OATPs or NTCP (de Lima Toccafonda Vieira, 2014). During cholestasis, a 20-
to 100-fold increase in systemic bile acid concentrations have been reported, which is
associated with morbidity (Greupink et al., 2012). Drug-induced cholestasis may mimic other
intrahepatic and extrahepatic cholestatic diseases. Not recognizing a drug as a triggering
factor for cholestasis extends the exposure, which may lead to worse liver injury (Padda et
al., 2011). Basolateral efflux transporters, like MRP3 and MRP4, play a minor role in bile
acid transport in normal conditions. However, in cholestatic condititions, they can be
upregulated to compensate for impaired biliary excretion. Impaired function of these
transporters can thus lead to accumulation of toxic bile acids in hepatocytes and is therefore
also a risk factor for the development of drug-induced cholestasis (Yang et al. 2013).
Given the overlap in substrate specificity of uptake and efflux transporters involved in
vectorial transport of bile acids, it is not unexpected that compounds may modulate multiple
hepatobiliary transport mechanisms. The relative effect of compounds on several processes
should be considered to predict the potential clinical consequences (de Lima Toccafonda
Vieira, 2014).

Chapter 1: General introduction
29
Figure 1.14: Transporter-related mechanisms in the development of liver injury. Red and green rectangles
designate potentially harmful (red) or protective (green) transporter related mechanisms, respectively (adapted
from Pauli-Magnus et al., 2006).
Rifampicin for example, is one of the most commonly used anti-tubercular drugs and is
known to be hepatotoxic. Several studies showed that rifampicin caused a direct toxic injury
to the hepatocytes and that it significantly increases the level of serum conjugated bilirubin
and total bile acids in man (Chen et al., 2009). Rifampicin is known as an OATP1, BSEP and
MRP2 inhibitor (Stieger et al., 2000; Mita et al., 2006; Lengyel et al., 2008; Van de Steeg et
al., 2010).
As previously mentioned, DILI is a major cause of attrition during drug development and is
responsible for drug withdrawals from the market. Additionally, hepatotoxicity is the most
common single adverse drug event leading to refusal for drug approval. DILI also poses a
significant burden to patient safety and to the costs of health care systems. Therefore, it is
important to improve the understanding and characterization, and to develop better prediction
methods to identify possible interactions (de Lima Toccafonda Vieira et al., 2014).
Currently, this possible inhibition of transport proteins by new candidate drugs is investigated
by means of in vitro and invasive, time-consuming and expensive preclinical in vivo tests. In
in vitro tests, mainly BSEP inhibition was investigated, since it can lead to severe cholestasis
(Stieger et al., 2000; Kis et al., 2012). To study transporter activity, two different types of in

Chapter 1: General introduction
30
vitro assay systems can be distinguished: membrane-based and cell-based assays. The two
most commonly used membrane-based assays, which are suitable to investigate hepatobiliary
transporters are the vesicular transport and the ATPase assay (Stieger et al., 2000).
Transfected cell lines can be used to assess the uptake and efflux transporters separately. In
cell-based assays, sandwich-cultured hepatocytes are widely used to assess drug-induced
cholestasis, as they reflect in vivo properties (Annaert et al., 2005; Wolf et al., 2010;
Nakanishi et al., 2011; De Bruyn et al., 2014; Chaterjee et al., 2014; Oorts et al., 2016). In in
vivo toxicity studies, increasing amounts of potential new drugs are administered to animals.
Blood and bile samples are subsequently taken to measure bile acid and bilirubin
concentrations in blood and bile (Bergman et al., 2010). Another approach to study
transporter activity is by using fluorescein conjugated bile acid analogues and fluorescence
microscopy for in vitro (Yamaguchi et al., 2006) and invasive in vivo studies (Milkiewicz et
al., 2001). These in vivo experiments require liver tissue and bile samples and are therefore
very invasive. In addition, these studies cannot distinguish between influx or efflux
interactions. Besides in vitro and in vivo experiments, in silico modeling was used to predict
drug interactions with bile acid transport proteins. These models rely on a series of
experimentally measured interactions of small molecules with membrane transporters and
employ statistical learning approaches, such as quantitative structure-activity relationship.
However, the quantitative models are limited to small sets of compounds (Warner et al.,
2012: Saito et al., 2009; Greupink et al., 2012).

Chapter 1: General introduction
31
Part II: Molecular Imaging
Medical Imaging
Medical imaging began in 1895 when the German physicist Wilhelm Conrad Roentgen
discovered X-rays, an achievement that earned him the first Nobel Prize in Physics in 1901.
While working with a cathode ray tube, he noticed that invisible rays were able to penetrate
some solids better than others. This difference in penetration can be explained by the
difference in density between several materials or tissues. X-rays can be detected on a
photographic plate, providing a two dimensional image that is in accordance with the density
of the material or tissue. In medical imaging, X-ray detection on a photographic plate is
especially useful for the detection of structural skeletal disorders due to the higher density of
bone compared to surrounding soft tissues. (Bradley WG et al., 2008) Consequently, X-ray
imaging can be classified as a structural imaging technique. Nowadays, different imaging
techniques are available that can be divided into two main categories: structural (or
anatomical) and functional imaging.
Structural imaging modalities visualize non-invasively the anatomy of the patient. The best
known modalities are X-ray radiography (Figure 1.15, A), computed tomography (CT)
(Figure 1.15, B), magnetic resonance imaging (MRI) (Figure 1.15, C) and ultrasound imaging
(US) (Figure 1.15, D). These techniques were developed to visualize nonspecific macroscopic
physical and physiological changes in tissues. These techniques were not able to identify the
specific molecular events responsible for disease, although image spatial resolution has been
constantly improved (Tian, 2012).
Figure 1.15: Medical X-ray of the pelvis (A), CT of the head (B), MRI of the brain (C) and ultrasound image of
a fetus (D) (Image obtained from http://commons.wikimedia.org, used under a Creative Commons Attribution-
ShareAlike license: http://creativecommons.org/licenses/by-sa/3.0/)
Functional imaging modalities, such as planar scintigraphy, single photon emission computed
tomography (SPECT), positron emission tomography (PET) and optical imaging (OI) focus
on the study of molecular events in living subjects and are regarded as functional metabolic or

Chapter 1: General introduction
32
molecular imaging. The targets in functional imaging can include transporters, cell surface
receptors, intracellular enzymes, etc.
Nowadays, the traditional distinction between structural and functional imaging has become a
little blurred with the introduction of functional MRI that can provide functional information
as well. Moreover, the introduction of micro-bubbles enables functional imaging in US.
Peptides, antibodies, etc. can be attached to the surface of microbubbles to target specific
biochemical processes.
An overview of the most commonly used preclinical imaging modalities with their main
characteristics is shown in Table 1.2.
Multi-modality
Since none of the imaging modalities is perfect (Table 1.2), these imaging modalities are
often combined into a single imaging device, called multi-modality imaging. For example,
because the molecular imaging modalities SPECT and PET do not provide detailed
anatomical information, they are often combined with CT or MRI. CT and MRI have a high
spatial resolution and serve to identify morphological changes in small structures, however,
they have lower sensitivity compared to SPECT and PET. So when these imaging modalities
are combined into one imaging device, we combine ‘the best of both worlds’ (Khalil et al.,
2011).
Molecular imaging
Molecular imaging (MI) has its roots in functional imaging and is defined by Weissleder and
Mahmood (Weissleder and Mahmood, 2001) as:
“Molecular imaging is the in vivo characterization and measurement of biologic processes on
the cellular and molecular level. In contradistinction to ‘classical’ diagnostic imaging, it sets
forth to probe such molecular abnormalities that are the basis of disease rather than to image
the end results of these molecular alterations”
In other words, it is a non-invasive, real-time visualization of biochemical events at the
cellular and molecular level within living cells, tissues, and/or intact subjects (James et al.,

Chapter 1: General introduction
33
2012). These events can be as simple as location(s) of a specific population of cells or levels
of a given protein receptor on the surface of cells. In addition, it is possible to study more
complex events, such as interaction of two intracellular proteins, cellular metabolic flux, etc.
(Weissleder et al., 2010; Massoud et al., 2003).
The reason for monitoring/imaging/quantifying various molecular targets are related to
characterizing a disease process that may correlate with concentrations of one or more of
these molecular targets. MI allows detection of functional alterations even before anatomical
changes can be observed. Additionally, molecular imaging helps to dissect complex biology.
Another important application is in the process of drug discovery and validation, as well as in
predicting and monitoring response to various types of therapy.
MI modalities include optical imaging that mainly records bioluminescent and fluorescent
light, SPECT and PET that detect γ- and β+ radiation, functional MRI that detects differences
in relaxation time, and US that detects sound waves reflected back from ligand-targeted
acoustic particles (micro-bubbles) (Tian et al., 2012).

Chapter 1: General introduction
34
Table 1.2: Characteristics of preclinical imaging modalities (adapted from Massoud et al., 2003).
PET SPECT OI MRI CT US
Radiation type high-energy γ rays lower-energy γ rays visible light or near
infrared
radiowaves X-rays high-frequency
sound
Spatial resolution 1-2 mm < 1 mm 2-5 mm 25-100 µm 50-200 µm 50-500 µm
Depth no limit no limit 1-2 cm no limit no limit millimeters to
centimeters
Temporal resolution seconds to minutes seconds to minutes seconds to minutes minutes to hours minutes seconds to minutes
Contrast agent
administration
10-11-10-12 M 10-10-10-11 M not well-
characterized
10-3-10-5 M not well
characterized
not well
characterized
Amount of probe used nanograms nanograms micrograms to
milligrams
micrograms to
milligrams
not applicable micrograms to
milligrams
Quantitative degree +++ ++ + to ++ ++ ++ +
Principle use metabolic,
reporter/gene
expression, enzyme
targeting
reporter/gene
expression,
receptor/ligand
reporter/gene
expression, cell
trafficking
morphological
reporter/gene
expression,
receptor/ligand if
many receptors
morphological morphological
Advantages high sensitivity,
Isotopes can
substitute naturally
occurring atoms,
quantitative
translational research
many molecular
probes available, can
image multiple
probes
simultaneously
quick, easy, low
cost, relative high-
throughput
highest spatial
resolution, combines
morphological and
functional imaging
bone, tumor and
anatomical imaging
real-time, low cost
Disadvantages cyclotron needed,
relatively low spatial
resolution, radiation
relatively low spatial
resolution,
collimation,
radiation
low spatial
resolution, 2D
imaging only,
relatively surface-
weighted
relatively low
sensitivity, long scan
and postprocessing
time, mass quantity
of probe may be
needed
limited “molecular”
applications, limited
soft tissue resolution,
radiation
limited spatial
resolution, mostly
morphological
Cost $$$$ $$$ $-$$ $$$$ $$ $$

Chapter 1: General introduction
35
MI uses specific molecules as the source of image contrast. To obtain successful images of
specific molecules in vivo at the molecular level, the following criteria should be met
(Massoud et al., 2003):
(1) availability of high affinity probes with reasonable pharmacodynamics;
(2) the ability of these probes to overcome biological delivery barriers;
(3) use of chemical or biological amplification strategies;
(4) availability of sensitive, fast, high resolution imaging techniques
Consequently, one of the key prerequisites for molecular imaging is the ability to design the
perfect cell or tissue-specific probe. The MI research chain, i.e. the process of developing new
probes/strategies/assays for MI is shown in Figure 1.16. However, not all research in the field
is intended for clinical translation and then, the chain stops at step 10. It is an iterative
process, based on lessons learned in a given application.
Figure 1.16: Molecular imaging research chain. (adapted from James et al., 2012)

Chapter 1: General introduction
36
Molecular imaging and nuclear medicine
Nuclear medicine, in the field of molecular imaging, offers important advantages over other
MI modalities (Zanzonico, 2012):
(1) The specific activity (i.e., activity per unit mass) of radiopharmaceuticals and the
detection sensitivity of the imaging instruments are generally high. In contrast to CT
and MRI, far lower mass doses are administered during nuclear medicine imaging.
These sub-nmol doses correspond to nonpharmacological, non-perturbing mass doses
of the radiopharmaceutical.
(2) Nuclear medicine imaging is non-invasive, hereby allowing serial imaging to
characterize the longitudinal time course of some processes.
(3) Nuclear medicine images are (semi)-quantitative and may be parameterized.
(4) A large number of targeted radiopharmaceuticals have been developed and will be
developed in the future.
However, there are also several drawbacks:
(1) Nuclear imaging techniques have a poorer spatial resolution compared to CT and MRI
(Table 1.2).
(2) Nuclear imaging modalities deliver radiation doses for patients, with effective doses
and maximal organ-absorbed doses per study in the order of ten mSv and up to several
cGy, respectively (Stabin MG et al., 2008).
(3) Only limited anatomical information can be obtained. This drawback is largely
overcome with the introduction of multi-modality devices (e.g. PET-CT, SPECT-CT,
PET-MRI). Here, functional information, obtained from PET or SPECT, is inherently
co-registered with anatomical images.
PET
The principles of PET imaging are summarized in Figure 1.17. PET imaging requires the use
of a cyclotron to generate short-living radionuclides such as 18F, 11C, 13N, 15O. PET uses the
unique properties of these radioisotopes that decay via positron emission, also called β+
decay. An overview of the most common PET isotopes is listed in Table 1.3. Positron emitters
are neutron-deficient isotopes that achieve stability through the nuclear transmutation of a
proton into a neutron. As shown in the right part of Figure 1.17, this process involves the

Chapter 1: General introduction
37
emission of a positive electron (positron) and an electron neutrino. The energy spectrum of
the emitted positron depends on the specific isotope. After emission, the positron will travel a
certain distance that is dependent on the energy of the positron, called the positron range, in
the surrounding tissue and will lose its energy through interactions with the surrounding tissue
until it annihilates with an electron in the tissue. Annihilation is a process in which the
combined energy of the positron and electron will result in the emission of two gamma
photons with an energy of 511 keV that are emitted in opposite directions (180°) and since
they are highly energetic, they are able to leave the subject’s body and can be detected
externally by detectors (Tian et al., 2012). PET detectors take the form of a closed ring, or set
of rings, surrounding the subject to be imaged. This circular configuration of the PET scanner
and its scintillation detectors and photo multiplier tubes (amplifiers) allows simultaneous
detection of these two photons. This detection of a coincidence event allows localization of an
annihilation event somewhere along the line between the two detectors, which received a
signal. A large number of such coincidence lines form the data set. Then, this raw data is
reconstructed in 3D images that allow accurate positioning of the radioisotope in the body.
(James and Gambhir, 2012)
Figure 1.17: Basic principle of PET imaging (adapted from Nguyen et al., 2010).

Chapter 1: General introduction
38
In practice, a specific probe to visualize a specific molecular process is labeled with a
positron-emitting radionuclide that is administered (mostly intravenously) to the subject that
is then positioned into the PET scanner.
Table 1.3: Commonly used radionuclides in PET and SPECT. EC= electron capture; IT= internal transition
(adapted from Lee et al., 2010; Rowland and Cherry, 2008 ).
Radionuclide Decay Mode Half-Life Modality
11C β+ (100%) 20.39 min PET
18F β+ (96.7%) 109.77 min PET
EC (3%)
15O β+ (100%) 2.04 min PET
13N β+ (100%) 9.97 min PET
64Cu β+ (17.6%) 12.70 h PET/therapy
EC (43.4%)
β- (39.0%)
124I β+ (23%) 4.20 days PET
EC (77%)
68Ga β+ (89%) 67.71 min PET
EC (11%)
89Zr β+ (23%) 3.30 days PET
EC (77%)
99mTc IT (100%) 6.02 h SPECT
111In EC (100%) 2.80 days SPECT
123I EC (100%) 13.22 h SPECT
125I EC (100%) 60 days SPECT
131I β- (100%) 8.03 days SPECT/therapy
201Tl EC 3.04 days SPECT
SPECT
SPECT imaging is based on the detection of nuclides that decay via the emission of gamma
photons, called single-photon emitters. The most commonly used radioisotopes for SPECT
imaging are displayed in Table 1.3. The unstable nucleus decays by isomeric transition (IT),
β- decay, or electron capture (EC) into a stable nucleus, hereby emitting photons. A typical
clinical SPECT camera is composed of one or more rotating gamma cameras to obtain
multiple projections around the patient and to eventually obtain a tomographic reconstruction.

Chapter 1: General introduction
39
Since position detection of these photons in SPECT does not provide adequate information
about the origin of the photon, it is not possible to determine a “line of response”, as done
with PET. Therefore, to allow origin determination of the detected signal, a lead or tungsten
collimator is added to the modality, where only photons that travel into a certain direction can
pass through the holes of the collimator. The disadvantage of this is the fact that the
collimator rejects most of the photons that are not traveling at right angles to the detector.
Consequently, the sensitivity is typically two orders of magnitude lower than PET. In clinical
cameras, mostly parallel-hole collimators are used (Figure 1.18), whereas in small-animal
imaging systems, (multi)pinhole collimators are most often used (see later). The photons are
converted into visible light by the NaI(Tl) crystal, and then the light is converted into an
electrical signal by the photomultiplier tubes.
Figure 1.18: Basic principles SPECT imaging.
The gamma photons of SPECT radioisotopes have different energies, in contrast to PET
isotopes where two gamma photons of 511 keV originate after annihilation. During SPECT
image reconstruction, an energy window is determined that is typically 10-20% around the
photon energy peak. A narrow window is chosen to avoid reconstruction of Compton scatter
and to improve energy resolution to allow simultaneous imaging of multiple radionuclides
(Zanzonico et al., 2012). For 99mTc, the energy window is displayed in Figure 1.19. When the
energy window is carefully chosen, multi-radionuclide studies can be performed, in contrast
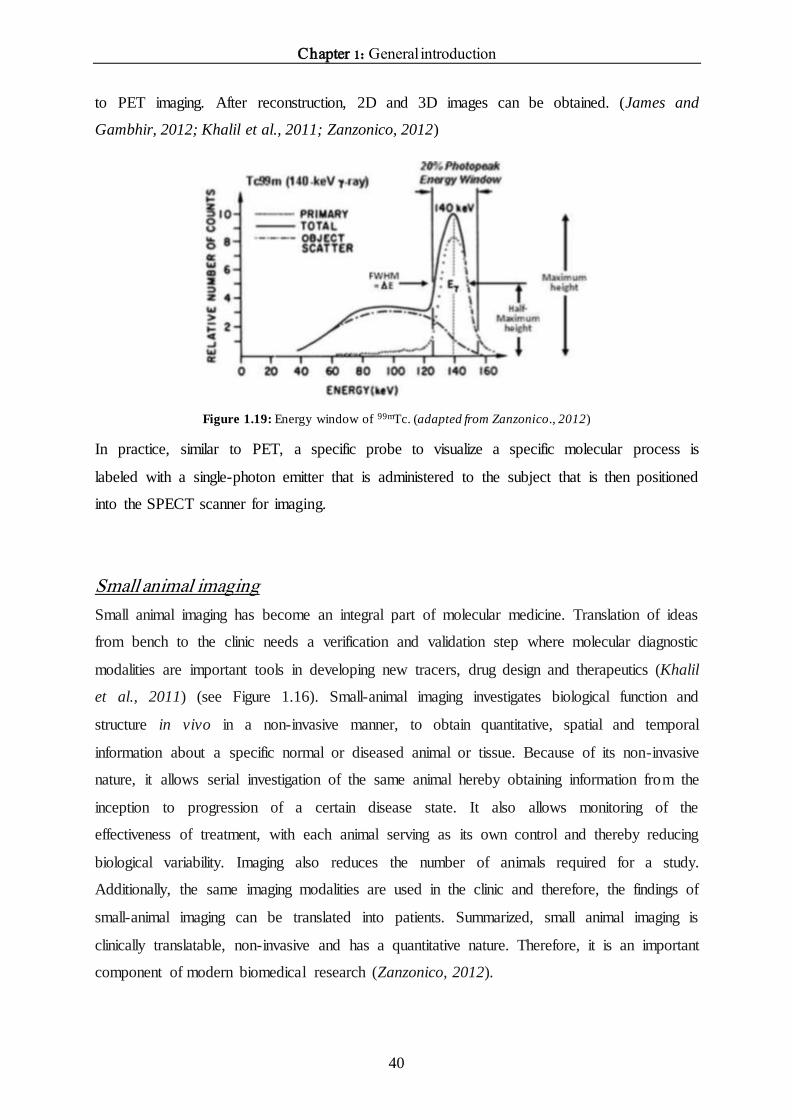
Chapter 1: General introduction
40
to PET imaging. After reconstruction, 2D and 3D images can be obtained. (James and
Gambhir, 2012; Khalil et al., 2011; Zanzonico, 2012)
Figure 1.19: Energy window of 99mTc. (adapted from Zanzonico., 2012)
In practice, similar to PET, a specific probe to visualize a specific molecular process is
labeled with a single-photon emitter that is administered to the subject that is then positioned
into the SPECT scanner for imaging.
Small animal imaging
Small animal imaging has become an integral part of molecular medicine. Translation of ideas
from bench to the clinic needs a verification and validation step where molecular diagnostic
modalities are important tools in developing new tracers, drug design and therapeutics (Khalil
et al., 2011) (see Figure 1.16). Small-animal imaging investigates biological function and
structure in vivo in a non-invasive manner, to obtain quantitative, spatial and temporal
information about a specific normal or diseased animal or tissue. Because of its non-invasive
nature, it allows serial investigation of the same animal hereby obtaining information from the
inception to progression of a certain disease state. It also allows monitoring of the
effectiveness of treatment, with each animal serving as its own control and thereby reducing
biological variability. Imaging also reduces the number of animals required for a study.
Additionally, the same imaging modalities are used in the clinic and therefore, the findings of
small-animal imaging can be translated into patients. Summarized, small animal imaging is
clinically translatable, non-invasive and has a quantitative nature. Therefore, it is an important
component of modern biomedical research (Zanzonico, 2012).
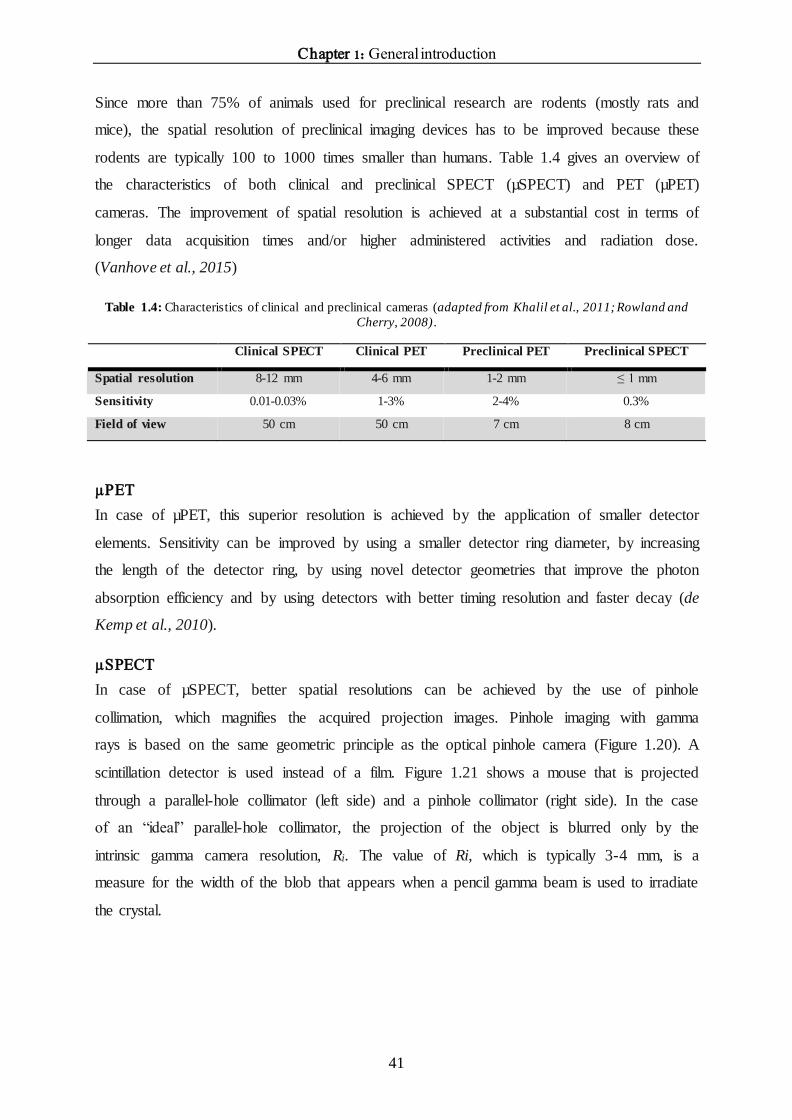
Chapter 1: General introduction
41
Since more than 75% of animals used for preclinical research are rodents (mostly rats and
mice), the spatial resolution of preclinical imaging devices has to be improved because these
rodents are typically 100 to 1000 times smaller than humans. Table 1.4 gives an overview of
the characteristics of both clinical and preclinical SPECT (µSPECT) and PET (µPET)
cameras. The improvement of spatial resolution is achieved at a substantial cost in terms of
longer data acquisition times and/or higher administered activities and radiation dose.
(Vanhove et al., 2015)
Table 1.4: Characteristics of clinical and preclinical cameras (adapted from Khalil et al., 2011; Rowland and
Cherry, 2008).
Clinical SPECT Clinical PET Preclinical PET Preclinical SPECT
Spatial resolution 8-12 mm 4-6 mm 1-2 mm ≤ 1 mm
Sensitivity 0.01-0.03% 1-3% 2-4% 0.3%
Field of view 50 cm 50 cm 7 cm 8 cm
µPET
In case of µPET, this superior resolution is achieved by the application of smaller detector
elements. Sensitivity can be improved by using a smaller detector ring diameter, by increasing
the length of the detector ring, by using novel detector geometries that improve the photon
absorption efficiency and by using detectors with better timing resolution and faster decay (de
Kemp et al., 2010).
µSPECT
In case of µSPECT, better spatial resolutions can be achieved by the use of pinhole
collimation, which magnifies the acquired projection images. Pinhole imaging with gamma
rays is based on the same geometric principle as the optical pinhole camera (Figure 1.20). A
scintillation detector is used instead of a film. Figure 1.21 shows a mouse that is projected
through a parallel-hole collimator (left side) and a pinhole collimator (right side). In the case
of an “ideal” parallel-hole collimator, the projection of the object is blurred only by the
intrinsic gamma camera resolution, Ri. The value of Ri, which is typically 3-4 mm, is a
measure for the width of the blob that appears when a pencil gamma beam is used to irradiate
the crystal.

Chapter 1: General introduction
42
Figure 1.20: Early pinhole imaging.
Figure 1.21: Parallel-hole versus pinhole collimator in small-animal imaging. Through magnification of a small
object at short distance onto a large detector area, pinhole collimation geometry offers substantial increase in
detection efficiency over that of parallel hole collimation geometry. Spatial resolution is determined by size of
pinhole aperture (adapted from de Kemp et al., 2010).
The spatial resolution Rs of a pinhole camera is approximated by the following formula:
𝑅𝑠 = √[𝑑𝑒 (1 +1
𝑀)]
2
+ [𝑅𝑖
𝑀]
2
with 𝑀 =𝑡
𝑏
de is the effective diameter of the pinhole, Ri is the intrinsic spatial resolution of the gamma
detector, M is the pinhole magnification, t is the distance between the pinhole opening and the
detector and b is the distance between the object and the pinhole (Figure 1.22). So when the
distance between the mouse and the pinhole is 7 cm and the distance between the pinhole and
the detector is 35 cm, the magnification of the mouse amounts 5. Therefore, when the size of

Chapter 1: General introduction
43
the projection of the mouse is reduced to its original size, it is not smoothed with an amount
corresponding to Ri, but is smoothed only with Ri/5, thus improving spatial resolution. The
smaller the object, the closer it can be placed to the pinhole and the higher the magnification
can be.
A consequent challenge is to acquire a sufficient number of counts in each individual voxel to
support the high spatial resolution and to obtain a sufficient signal-to-noise ratio. The
sensitivity of a pinhole system is approximated by:
𝑆 = (𝑑𝑒
2
16𝑏2) 𝑁
Where N represents the number of gamma detectors. The sensitivity can be improved by
increasing the diameter of the pinhole opening to allow more gamma photons to pass.
However, this will be at the cost of a poorer spatial resolution. The sensitivity can also be
improved by bringing the object closer to the pinhole opening, however, this will be at the
cost of the size of the field of view.
In conclusion, the choices between spatial resolution, sensitivity and size of the field of view
need to be carefully examined before performing a preclinical animal SPECT experiment.
(Vanhove et al., 2015; Beekman and van der Have, 2006; Nuyts et al., 2009; Franc et al.,
2008; de Kemp et al., 2010)
Figure 1.22: Principle of pinhole collimation. b represents the distance between the object and the pinhole and t
represents the distance between the pinhole opening and the gamma detector. d e= effective diameter of the
pinhole opening (adapted from Vanhove et al., 2016).
When carefully designed, the use of multiple detectors in combination with multi-pinhole
collimators can improve the spatial resolution and sensitivity with one order of magnitude,

Chapter 1: General introduction
44
compared to clinical systems (Figure 1.23). The use of multipinhole collimators and detectors
(and resulting higher sensitivity) also allows dynamic imaging, in contrast to clinical systems.
Today, all commercial µSPECT systems are equipped with multi-detector and multi-pinhole
geometry. In this thesis, an USPECT-II/CT device (MILabs, The Netherlands) was used
(Figure 1.24). The detectors are stationary and the animal bed is moving (van der Have F,
2009).
Figure 1.23: Early small-animal SPECT systems were developed using single scintillation camera with single-
pinhole collimator (A). Modern small-animal SPECT systems use multiple detectors, each with multipinhole
collimators (B). (adapted from Franc et al., 2008)
Figure 1.24: USPECT-II/CT.
After imaging, the acquired projection data need to be reconstructed. In multi-detector multi-
pinhole µSPECT imaging, iterative reconstruction algorithms are routinely used that can take
into account the complex system geometry .

Chapter 1: General introduction
45
Dynamic imaging and kinetic modeling
After injection into the blood stream, the radiotracer is transported to several organs and is
taken up by these organs. Dynamic imaging is an imaging procedure that follows the
distribution of the radiotracer in function of time in different organs of interest: clearance
from the blood, uptake in several tissues, secretion, possible trapping, etc. Both, PET and
SPECT, have the potential to perform dynamic imaging studies.
The uptake of the radiotracer depends on the affinity for the particular compound in the organ.
Additionally, the uptake also depends on delivery of the tracer, which is reflected in the time
course of activity in the blood. Therefore, it is very important to measure the arterial blood
curve during the acquisition. Blood sampling is the gold standard to obtain arterial input
functions. This can be achieved by manual sampling or continuous blood withdrawal and
detection. However, for small animal imaging, this is a problem since the maximal sampling
volume in a mouse of 25g is 0.015 mL (1%) for repeated measures within 24 hours.
Therefore, image derived methods were introduced, where a region of interest (ROI) is drawn
around the heart or an artery (Lammertsma, 2002; Gullberg et al., 2010; Vanhove et al.,
2015). To determine the ROI around the heart, radiotracers can be used that can visualize the
left ventricular cavity. This was demonstrated in a PET study of Moerman et al. (2011), where
[18F] fluoro-2-deoxy-D-glucose ([18F]FDG) was used to visualize the myocardium of the left
ventricle. After the dynamic scan with the tracer of interest, [18F]FDG was administered to the
mice and an additional static scan was done. A ROI around the left ventricle could be drawn
based on the static FDG scan, and this ROI could be easily pasted on the dynamic tracer data,
since the animal was not moved between the dynamic tracer acquisition and the static FDG
scan.
Besides the determination of the arterial input curve, the time course of the tracer in the
organs of interest have to be determined. ROIs are drawn around the organs of interest and the
tracer distributions in function of time are obtained as time activity curves (TACs).
Tracer kinetic or compartmental modeling of these dynamic PET or SPECT measurements
allow calculation of physiological parameters by fitting a mathematical compartmental model
of tracer distribution and metabolism to the data. An example of a general two-tissue
compartment model is given in Figure 1.25.

Chapter 1: General introduction
46
Figure 1.25: General two tissue compartment model. This model consist of a blood compartment, two tissue
compartments and 4 rate constants. GB+I: gallbladder + intestines.
A compartmental model is divided in physiologically separate entities in which the tracer is
distributed. These entities are also called compartments that represent different organs or
different states of the tracer within an organ, for example the bound and unbound fraction of
the tracer. Between these compartments, there can be movements of the tracer, influx and
efflux, which are expressed by means of rate constants, denoted with lower case k. For
example, in Figure 1.25, the first compartment is the arterial blood. From the arterial blood,
the tracer passes into a second compartment, namely the first tissue compartment C1, for
example the liver. Then, the radiotracer can be transported into a second tissue compartment,
C2, for example the gallbladder and intestines. This transport can be an indication of, for
example, functioning hepatobiliary transport proteins. The influx in tissue compartment C1
(liver) is represented by k1 and is an indicator of the blood clearance of the tracer, in this case
from the liver sinusoids into the hepatocytes. k2 then represents the transport of the tracer
from the liver back into the blood. k3 then represents efflux from the liver to the gallbladder
and intestines. No transport from gallbladder and intestines to the liver is observed and
therefore, k4 equals 0 in this specific example. All rate constants (k-values) are expressed as
1/sec or 1/min.
The kinetics of compartmental models can be described by a set of first-order linear
differential equations. We are dealing with first order processes under the assumptions. Tracer
kinetic modeling requires several assumptions: the physiological process of interest is not
influenced by administration of the radiotracer, the physiological process has to remain
constant during the acquisition and each compartment is homogeneous and the tracer is
immediately mixed in the compartment (Watabe et al., 2006; Acton et al., 2004; Innis et al.,
2007; Kutner, 2014).

Chapter 1: General introduction
47
When the first order kinetics are applied to the model depicted in Figure 1.25, the
concentration of the tracer in compartments C1 and C2 in function of time can be described by
two differential equations:
𝑑𝐶1(𝑡)
𝑑𝑡= 𝑘1𝐶𝑎(𝑡) − (𝑘2 + 𝑘3)𝐶1(𝑡) + 𝑘4𝐶2(𝑡)
𝑑𝐶2(𝑡)
𝑑𝑡= 𝑘3𝐶1(𝑡) − 𝑘4𝐶2(𝑡)
Ca is the time course of the tracer in the arterial plasma, also referred as the arterial input
curve. When the TACs, the arterial input function and a proposed model configuration are
given, the underlying rate constants (k1-k4) can be calculated by solving the differential
equations using for example least square methods.

Chapter 1: General introduction
48
References Acton PD, Zhuang H, Alavi A. Quantification in PET. Radiol Clin N Am 2004;42:1055-1062.
Alrefai WA, Gill RK. Bile acid transporters: structure, function, regulation and pathop hysiological implications.
Pharm Res 2007;24:1803-1823.
Annaert PP, Brouwer KL. Assessment of drug interactions in hepatobiliary transport using rhodamine 123 in
sandwich-cultured rat hepatocytes. Drug Metab Dispos 2005;33:388-394.
Anwer MS, Stieger B. Sodium-dependent bile salt transporters of the SLC10A transporter family: more than
solute transporters. Eur J Physiol 2014;466:77-89.
Arrese M, Ananthanarayanan M, Suchy FJ. Hepatobiliary transport: molecular mechanisms of development and
cholestasis. Ped Res 1998;44:141-147.
Ballatori N, Christian WV, Wheeler SG, Hammond CL. The heteromeric organic solute transporter, OSTα -
OSTβ/SLC51: a transporter for steroid-derived molecules. Mol Aspects Med 2013;34:683-692.
Beekman F, van der Have F. The pinhole: gateway to ultra-high-resolution three-dimensional radionuclide
imaging. Eur J Nucl Med Mol Imaging 2007;34:151-161.
Bergman E, Hedeland M, Bondesson U, Lennernas H. The effect of acute administration of rifampicin and
imatinib on the enterohepatic transport of rosuvastatin in vivo. Xenobiotica 2010;40:558-568.
Bernal JD. Crystal structures of vitamin D and related compounds. Nature 1932;129:277–278.
Boyer JL. Bile formation and secretion. Compr Physiol 2013;3:1035-1078.
Bradley WG. History of medical imaging. Proc Am Philos Soc 2008;152:349-361.
Claro da Silva T, Polli JE, Swaan PW. The solute carrier family 10 (SLC10): beyond bile acid transport. Mol
Aspects Med 2013;34:252-269.
Chatterjee S, Richert L, Augustijns P, Annaert P. Hepatocyte-based in vitro model for assessment of drug-
induced cholestasis. Toxicol Appl Pharmacol 2014;274:124-136.
Dawson PA, Lan T, Rao A. Bile acid transporters. J Lipid Res 2009;50:2340-2357.
De Bruyn T, Sempels W, Snoeys J, Holmstock N, Chatterjee S, Stieger B, et al. Confocal imaging with a
fluorescent bile acid analogue closely mimicking hepatic taurocholate disposition. J Pharm Sci 2014;103:1872-
1881.
de Graaf W, Häusler S, Heger M, van Ginhoven TM, van Cappellen G, Bennink RJ, et al. Transporters involved
in the hepatic uptake 99mTc-mebrofenin and indocyanine green. . J Hepatol 2011;54:738-745.

Chapter 1: General introduction
49
De Kemp RA, Epstein FH, Catana C, Tsui BMW, Ritman EL. Small-animal molecular imaging methods. J Nucl
Med 2010;51:18S-32S.
de Lima Toccafonda Vieira M, Tagliati CA. Hepatobiliary transporters in drug-induced cholestasis: a perspective
on the current identifying tools. Expert Opin Drug Metab Toxicol 2014;10:581-597.
Dietschy JM, Turley SD, Spady DK. Role of the liver in the maintenance of cholesterol and low density
lipoprotein homeostasis in different animal species, including humans. J Lipid Res 1993;34:1637-1659.
Dietschy JM, Turley SD. Control of cholesterol turnover in the mouse. J Biol Chem 2002;277:3801-3804.
Erlinger S. New insights into the mechanisms of hepatic transport and bile secretion. J Gastroenterol Hepatol
1996;11:575-579.
Esteller A. Physiology of bile secretion. World J Gastroenterol 2008;14:5641-5649.
Fardel O, Jigorel E, Le Vee M, Payen L. Physiological, pharmacological and clinical features of the multidrug
resistance protein 2. Biomed Pharmacother 2005;59:104-114.
Franc BL, Acton PD, Mari C, Hasegawa BH. Small-animal SPECT and SPECT/CT: important tools for
preclinical investigation. J Nucl Med 2008;49:1651-1663.
Frevert U. Sneaking in through the back entrance: the biology of malaria liver stages. Trends Parasitol
2004;20:417-424.
Gai Z, Chu L, Hiller C, Arsenijevic D, Penno CA, Montani JP, Odermatt A, et al. Effect on chronic renal failure
on the hepatic, intestinal, and renal expression of bile acid transporters. Am J Physiol Renal Physiol
2014;306:F130-F137.
Greupink R, Nabuurs SB, Zarzycka B, Verweij V, Monshouwer M, Huisman MT, et al. In silico identification of
potential cholestasis-inducing agents via modeling of Na+-dependent taurocholate cotransporting polypeptide
substrate specificity. Toxicol Sci 2012;129:35-48.
Hagenbuch B, Dawson P. The sodium bile salt cotransport family SLC10. Eur J Physiol 2004;447:566 -570.
Hagenbuch B, Meier PJ. Molecular cloning, chromosomal localization, and functiona l characterization of a
human liver Na+/bile acid cotransporter. J Clin Invest 1994;93:1326-1331.
Hagenbuch B, Meier PJ. Organic anion transporting polypeptides of the OATP/SLC21 family: phylogenetic
classification as OATP/SLCO superfamily, new nomenclature and molecular/functional properties. Eur J
Physiol 2004;447:653-665.
Halilbasic E, Claudel T, Trauner M. Bile acid transporters and regulatory nuclear receptors in the liver and
beyond. J Hepatol 2013;58:155-168.
Hallen S, Mareninova O, Branden M, Sachs G. Organization of the membrane domain of the human liver
sodium/bile acid cotransporter. Biochemistry 2002;41:7253-7266.

Chapter 1: General introduction
50
Hofmann AF, Hagey LR. Bile acids: chemistry, pathochemistry, biology, pathobiology, and therapeutics. Cell
Mol Life Sci 2008;65:2461-2483.
Hofmann AF, Hagey LR. Key discoveries in bile acid chemistry and biology and their clinical applications:
history of the last eight decades. J Lipid Res 2014;55:1553-1595.
Hofmann AF, Molino G, Milanese M, Belforte G. Description and simulation of a physiological
pharmacokinetic model for the metabolism and enterohepatic circulation of bile acids in man. J Clin Invest
1983;71:1003-1022.
Hulzebos CV, Renfurm L, Bandsma RH, Verkade HJ, Boer T, Boverhof R. Measurement of parameters of
cholic acid kinetics in plasma using a microscale stable isotope dilution technique: application to rodents and
humans. J Lipid Res 2001;42:1923-1929.
Innis RB, Cunningham VJ, Delforge J, Fujita M, Gjedde A, Gunn RN, et al. Consensus nomenclature for in vivo
imaging of reversibly binding radioligands. J Cereb Blood Flow Metab 2007;27:1533-1539.
Iusuf D, van de Steeg E, Schinkel AH. Functions of OATP1A and 1B transporters in vivo: insights from mouse
models. Trends Pharmacol Sci 2012;33:100-108.
James ML, Gambhir SS. A molecular imaging primer: modalities, imaging agents and applications. Physiol Rev
2012;92:897-965.
Keppler D. The roles of MRP2, MRP3, OATP1B1, and OATP1B3 in conjugated hyperbilirubinemia. Drug
Metab Dispos 2014;42:561-565.
Khalil MM, Tremoleda JL, Bayomy TB, Gsell W. Molecular SPECT imaging: an overview. Int J Mol Imaging
2011:Epub 2011.
King MA, Pretorius PH, Farncombe T, Beekman FJ. Introduction to the physics of molecular imaging with
radioactive tracers in small animals. J Cell Biochem Suppl 2002;39:332-230.
Kis E, Ioja E, Rajnai Z, et al. BSEP inhibition - In vitro screens to assess cholestatic potential of drugs. Toxicol
In vitro 2012;26:1294-1299.
Kosters A, Karpen J. Bile acid transporters in health and disease. Xenobiotica 2008;38:1043-1071.
Kullak-Ublick GA, Ismair MG, Stieger B, Landmann L, Huber R, Pizzagalli F, et al. Organic anion-transporting
polypeptide B (OATP-B) and its functional comparison with three other OATPs of human liver.
Gastroenterology 2001;120:525-533.
Kullak-Ublick GA, Stieger B, Hagenbuch B, Meier PJ. Hepatic transport of bile salts. Semin Liver Dis
2000;20:273-292.
Kutner C. Kinetic modeling in pre-clinical positron emission tomography. Z Med Phys 2014;24:274-285.

Chapter 1: General introduction
51
Lammertsma AA. Radioligand studies: imaging and quantitative analysis. Eur Neuropsychopharmacol
2002;12:513-516.
Lee YS. Radiopharmaceuticals for molecular imaging. The Open Nuclear Medicine Journal 2010;2:178-185.
Lengyel G, Veres Z, Tugyi R, et al. Modulation of sinusoidal and canalicular elimination of bilirubin -
glucoronides by rifampicin and other cholestatic drugs in a sandwich culture of rat hepatocytes. Hepatol Res.
2008;38:300-309.
Maddrey WC. Drug-induced hepatotoxicity. J Clin Gastroenterol. 2005;39:S83-S89.
Mareninova O, Shin JM, Vagin O, Turdikulova S, Hallen S, Sachs G. Topography of the membrane domain of
the liver Na+-dependent bile acid transporter. Biochemistry 2005;44:13702-13712.
Marin JJG, Macias RIR, Briz O, Banales JM, Monte MJ. Bile acids in physiology, pathology and pharmacolo gy.
Curr Drug Metab 2016;17:4-29.
Massoud TE, Gambhir SS. Molecular imaging in living subjects: seeing fundamental biological processes in a
new light. Genes Dev 2003;17:545-580.
Meier PJ, Eckhardt U, Schroeder A, Hagenbuch B, Stieger B. Substrate specificity of sinusoidal bile acid and
organic anion uptake systems in rat and human liver. Hepatology 1997;26:1667-1677.
Meier PJ, Stieger B. Bile salt transporters. Annu Rev Physiol 2002;64:635-661.
Mita S, Suzuki H, Akita H, Hayashi H, Onuki R, Hofmann AF, et al. Inhibition of bile acid transport across
Na+/taurocholate cotransporting polypeptide (SLC10A1) and bile salt export pump (ABCB 11)-coexpressing
LLC-PK1 cells by cholestasis-inducing drugs. Drug Metab Dispos. 2006;34:1575-1581.
Moerman L, De Naeyer D, Boon P, De Vos F. Kinetic modeling with 11C-desmethylloperamide to visualize P-
glycoprotein in brain. EJNMMI Research 2011;1:12-20.
Nakanishi T, Shibue Y, Fukuyama Y, Yoshida K, Fukuda H, Shirasaka Y, et al. Quantitative time-lapse
imaging-based analysis of drug-drug interaction mediated by hepatobiliary transporter, multidrug resistance-
associated protein 2, in sandwich-cultured rat hepatocytes. Drug Metab Dispos. 2011;39:984-991.
Nguyen QD, Aboagye EO. Imaging the life and death of tumors in living subjects : preclinical PET imaging of
proliferation and apoptosis. Integr Biol (Camb) 2010;2:483-495.
Nies AT, Keppler D. The apical conjugate efflux pump ABCC2 (MRP2). Eur J Physiol 2007;463:643-659.
Noé J, Stieger B, Meier PJ. Functional expression of the canalicular bile salt export pump of human liver.
Gastroenterology 2002;123:1659-1666.
Nuyts J, Vunckx K, Defrise M, Vanhove C. Small animal imaging with multi-pinhole SPECT. Methods
2009;48:83-91.

Chapter 1: General introduction
52
Oorts M, Baze A, Bachelier P, Heyd B, Zacharias T, Annaert P, et al. Drug-induced cholestasis risk assessment
in sandwich-cultured human hepatocytes. Toxicol in vitro 2016;34:179-186.
Padda MS, Sanchez M, Akhtar AJ, Boyer JL. Drug-induced cholestasis. Hepatology. 2011;53:1377-1387.
Pauli-Magnus C, Meier PJ. Hepatobiliary transporters and drug-induced cholestasis. Hepatology 2006;44:778-
787.
Pellicoro A, Faber KN. The function and regulation of proteins involved in bile salt biosynthesis and transport.
Aliment Pharmacol Ther 26:149-160.
Perez MJ, Briz O. Bile-acid-induced cell injury and protection. World J Gastroenterol 2009;15:1677-1689.
Roberts MS, Magnusson BM, Burczynski FJ, Weiss M. Enterohepatic circulation . Clin Pharmacokinet
2002;41:751-790.
Rosenheim O, King H. The chemistry of the sterols, bile acids, and other cyclic constituents of natural fats and
oils. Annu Rev Biochem 1934;3:87-110.
Rowland DJ, Cherry SR. Small-animal preclinical nuclear medicine instrumentation and methodology. Semin
Nucl Med 2008;38:209-222.
Russell DW. The enzymes, regulation, and genetics of bile acid synthesis. Annu Rev Biochem 2003;72:137-174.
Saito H, Osumi M, Hirano H, Shin W, Nakamura R, Ishikawa T. Technical pitfalls and improvements for high -
speed screening and QSAR analysis to predict inhibitors of the human bile salt export pump. AAPS J
2009;11:581-589.
Schadt HS, Wolf A, Pognan F, Chibout SD, Merz M, Kullak-Ublick GA. Bile acids in drug induced liver injury:
key players and surrogate markers. Clin Res Hepatol Gastroenterol 2016; in press.
Shneider BL, Fox VL, Schwarz KB, Watson CL, Ananthanarayanan M, Thevananther S, et al. Hepatic
basolateral sodium-dependent-bile acid transporter expression in two unusual cases of hypercholanemia and in
extrahepatic biliary atresia. Hepatology 1997;25:1176-1183.
Stabin MG, Brill AB. Radiation dosimetry and exposure in nuclear medicine. Semin Nucl Med 2008;38:306-
307.
Stenvall A, Larsson E, Strand SE, Jönsson BA. A small-scale anatomical dosimetry model of the liver. Phys
Med Biol 2014;59:3353-3371.
Stieger B, Fattinger K, Madon J, Kullak-Ublick GA, Meier PJ. Drug-and Estrogen-Induced Cholestasis Through
Inhibition of the Hepatocellular Bile Salt Export Pump (Bsep) of Rat Liver. Gastroenteroloy. 2000;118:422 -430.
Stieger B, Geier A. Genetic variations of bile salt transporters as predisposing factors for drug-induced
cholestasis, intrahepatic cholestasis of pregnancy and therapeutic response of viral hepatitis. Expert Opin Drug
Metab Toxicol. 2011;7:411-425.

Chapter 1: General introduction
53
Stieger B, Meier Y, Meier PJ. The bile salt export pump. Eur J Physiol 2007;453:611-620.
St-Pierre M, Kullak-Ublick GA, Hagenbuch B, Meier PJ. Transport of bile acids in hepatic and non -hepatic
tissues. J Exp Biol 2001;204:1673-1686.
Strazzabosco M, Fabris L. Functional anatomy of normal bile ducts. Anat Rec 2008;291:653-660.
Tamai I, Nozawa T, Koshida M, Nezu J, Sai Y, Tsuji A. Functional characterization of human organic anion
transporting polypeptide B (OATP-B) in comparison with liver-specific OATP-C. Pharm Res 2001;18:1262-
1269.
Thomas C, Pellicciari R, Pruzanski M, Auwerx J, Schoonjans K. Targeting bile-acid signaling for metabolic
diseases. Nat Rev Drug Discov 2008;7:678-669.
Tian J. Molecular imaging: Fundamentals and applications. Elsevier 2012. E-book.
Trauner M, Boyer JL. Bile salt transporters: molecular characterization, function and regulation. Physiol Rev
2003;83:633-671.
Treyer A, Müsch A. Hepatocyte polarity. Compr Physiol 2013;3:243-287.
Van de Steeg E, Wagenaar E, van der Kruijssen CMM, Burggraaff JEC, de Waart DR, Oude Elferink RPJ, et al.
Organic anion transporting polypeptide 1a/1b-knockout mice provide insights into hepatic handling of bilirubin,
bile acids, and drugs. J Clin Invest 2010;120:2942-2952.
Van der Have F, Vastenhouw B, Ramakers RM, Branderhorst W, Krah JO, Ji C, Staelens SG, Beekman FJ. U-
SPECT-II: an ultra-high-resolution device for molecular small-animal imaging. J Nucl Med 2009;50:599-605.
Vanhove C, Bankstahl JP, Krämer SD, Visser E, Belcari N, Vandenberghe S. Accurate molecular imaging of
small animals taking into account animal models, handling, anaesthesia, quality control and imaging system
performance. EJNMMI Physics 2015;2:EPub.
Vaz FM, Paulusma CC, Huidekoper H, de Ru M, Lim C, Koster J, Ho-Mok K, et al. Sodium taurocholate
cotransporting polypeptide (SLC10A1) deficiency: conjugated hypercholanemia without a clear clinical
phenotype. Hepatology 2015;61:260-267.
Warner DJ, Chen H, Cantin LD, Kenna JG, Stahl S, Walker CL, et al. Mitigating the inhibition of human bile
salt export pump by drugs: opportunities provided by physicochemical property modulation, in silico modeling,
and structural modifications. Drug Metab Dispos 2012;40:2332-2341.
Watabe H, Ikoma Y, Kimura Y, Naganawa M, Shidahara M. PET kinetic analysis – compartmental model.
Annal Nucl Med 2006;20:583-588.
Weissleder R, Ross BD, Rehemtulla A, Gambhir SS. 2010. Molecular imaging: principles and practice. People’s
Medical Publishing House – USA

Chapter 1: General introduction
54
Wieland H. 1928. The chemistry of the bile acids. In Nobel Lectures, Chemistry 1922–1941. Elsevier Publishing
Company, Amsterdam, The Netherlands. 94–102.
Windaus A. 192 . Constitution of sterols and their connection with other substances occurring nature. In Nobel
Lectures, Chemistry 1922–1941. Elsevier Publishing Company, Amsterdam, The Netherlands. 105–121.
Wolf KK, Vora S, Webster LO, Generaux GT, Polli JW, Brouwer KLR. Use of cassette dosing in sandwich-
cultured rat and human hepatocytes to identify drugs that inhibit bile acid transport Toxicol In vitro.
2010;24:297-309.
Wolkoff, AW, DE Cohen. Bile acid regulation of hepatic physiology: Hepatocyte transport of bile acids. Am J
Physiol Gastrointest Liver Physiol. 2003;284:G175-G179.
Xia X, Francis H, Glaser S, Alpini G, LeSage G. Bile acid interactions with cholangiocytes. World J
Gastroenterol 2006;12:3553-3563.
Yamaguchi H, Okada M, Akitaya S, et al. Transport of fluorescent chenodeoxycholic acid via the human organic
anion transporters OATP1B1 and OATP1B3. J Lipid Res. 2006;47:1196-1202.
Yang K, Köck K, Sedykh A, Tropsha A, Brouwer KLR. An updated review on drug -induced cholestasis:
mechanisms and investigation of physiochemical properties and pharmacokinetic parameters. J Pharm Sci
2013;102:3037-3057.
Zanzonico P. Principles of nuclear medicine imaging: planar, SPECT, PET, multi-modality, and autoradiography
systems. Radiat Res 2012;177:349-364.
Zwicker BL, Agellon LB. Transport and biological activities of bile acids. Int J Biochem Cell Biol
2013;42:1389-1398
.

Chapter 2: Functional hepatobiliary imaging
55
Chapter 2. Functional hepatobiliary
imaging

Chapter 2: Functional hepatobiliary imaging
56

Chapter 2: Functional hepatobiliary imaging
57
Introduction Functional liver assessment is of great importance and the determination of clearance of
hepatobiliary transport proteins substrates could be used as a measure for liver function. There
are three factors that can modify the transport of hepatobiliary imaging agents through
hepatocytes:
1) Interindividual variability of transporters in the normal liver
2) Modifications of transporter expression in diseased liver tissue and focal lesions
3) Drug interactions.
Prognostic tools are also important for the management of patients with severe chronic liver
disease or liver failure, which is the major cause of mortality and morbidity after partial liver
resection and is a result of insufficient functional remnant liver mass. Additionally, the
investigation of liver function is important in the development of new drug candidates, the
inhibition of hepatobiliary transporters, for example, can lead to drug induced liver injury (see
Chapter 1). Several liver function tests have been developed. In this chapter, we will focus on
molecular imaging techniques as useful tool to investigate hepatobiliary function in which
measurement of hepatobiliary compounds in the liver may serve as biomarkers. An overview
on the molecular imaging techniques and specific hepatobiliary contrast agents for the
assessment of hepatobiliary function will be given (Hoekstra et al., 2013; Sakka, 2007;
Stieger et al., 2012).

Chapter 2: Functional hepatobiliary imaging
58
Hepatobiliary contrast agents in magnetic resonance
imaging Magnetic resonance imaging (MRI) is a technique that uses a powerful magnet to aligh the
nuclei of atoms (mainly H) inside the body, and a variable magnetic field that causes the
atoms to resonate. Two relaxation times, the longitudinal relaxation T1 and spin-spin
relaxation T2 (caused by interactions between neighbouring protons), can be used for image
reconstruction.
MRI of the liver is used for the characterization of masses, detection of primary and
metastatic lesions, assessment of vascular structures, investigation of lesion vascularity and
evaluation of the biliary tree. In MRI of the liver, several classes of contrast agents can be
distinguished:
1) Extracellular or nonspecific contrast agents
2) Reticuloendothelial contrast agents
3) Blood pool agents
4) Hepatobiliary contrast agents
A short description of the first three groups will be given, but the focus will be on the last
group, since this group allows functional imaging of hepatobiliary transport because these
agents are taken up by the hepatocytes.
Most contrast agents are composed of gadolinium bound within an organic chelate, which
makes them paramagnetic substances that can induce changes in the local magnetic field. The
T1 shortening property of gadolinium based contrast agents (GBCAs) is the most useful and
the contrast enhancement is used to detect the presence of the GBCAs. Other types of contrast
agents are manganese and iron based (Bashir, 2014; Gandhi et al., 2006).
Extracellular contrast agents
Extracellular contrast agents, for example gadobutrol, are GBCAs that are distributed within
the extracellular interstitial space. After intravenous injection, these contrast agents reach the
liver via the hepatic arteries, which results in mild enhancement of the hepatic parenchyma.
Solid liver lesions with an arterial-dominant vascular supply will have an arterial

Chapter 2: Functional hepatobiliary imaging
59
hyperenhancement which is important for lesion detection and characterization. Additionally,
the arterial hyperenhancement is important for the delineation of normal and variant hepatic
arterial anatomy. After the arterial phase, further hepatic enhancement can be observed due to
additional contrast medium that arrives in the liver via the portal vein, called the portal venous
phase which occurs 60 to 70 seconds after intravenous injection of the contrast agent. In this
phase, a washout appearance can be observed in liver lesions, since there is a weak additional
enhancement of these lesions from the portal venous supply. After the portal venous phase,
the equilibrium phase can be observed after 90 seconds, in which the contrast agent
equilibrates between the arterial and venous distributions, as well as the extravascular and
extracellular interstitium.
Reticuloendothelial contrast agents
These contrast agents target the reticuloendothelial system, particularly the liver and spleen.
The uptake is a measure for the number of functioning macrophages. Examples of
reticuloendothelial contrast agents are superparamagnetic iron oxide (SPIO) particles, which
are phagocytosed by macrophages, and preferentially by Kupfer cells, which line the liver
sinusoids. The reason for this affinity is unclear, but it may be related to particle size. SPIOs
are negative contrast agents that reduce signal intensity, particularly on T2 and T2*. Most
liver tumors (benign and malignant, primary or metastatic) are deficient in Kupffer cells and
do not exhibit SPIO uptake, so tumors appear relatively hyperintense compared to normal
tissue (Gandhi et al., 2006).
Blood pool contrast agents
The blood pool agents, for example gadofosveset trisodium, remain longer in the intravascular
space than extracellular agents. Because of strong binding to serum albumin, they are cleared
slowly and there is little leakage into the interstitial compartment. Due to the long serum half-
lives, there is only little parenchymal enhancement and therefore, they can be used for
imaging vascular abnormalities in the equilibrium phase. There are three main categories:
ultrasmall SPIO particles, agents that reversibly bind to plasma proteins and macromolecules
(Gandhi et al., 2006; Bashir, 2014).

Chapter 2: Functional hepatobiliary imaging
60
Hepatobiliary contrast agents
Hepatobiliary contrast agents used in the clinic – transporter substrates
There are two hepatobiliary contrast agents available in the clinic: Gadobenate dimeglumine
(Gd-BOPTA, MultiHance, Bracco Diagnostics), which shows 5% uptake in a normal human
liver, and Gadoxetate disodium (Gd-EOB-DTPA, Eovist, Bayer Healthcare), which shows
50% uptake in normal liver, via OATPs and MRP2 (Ulloa et al., 2013; Nassif et al., 2012;
Leonhardt et al., 2010; de Haën et al., 1995).
Figure 2.1 displays representative images of the different phases from a liver MRI
examination with gadoxetate disodium as contrast agent. Initially, these contrast agents
distribute in a similar manner compared to extracellular contrast agents. There is both an
arterial phase with enhancement (Figure 2.1, A), followed by a portal venous phase (Figure
2.1, B) with washout features of liver lesions. Additionally, after the dynamic phase,
hepatocyte uptake and biliary excretion can be observed (Figure 2.1, C). The contrast agents
are taken up by the hepatocytes and are excreted to the gallbladder and intestines, reaching
the hepatobiliary phase (Figure 2.1, D). In this phase, the liver and bile ducts are enhanced on
T1-weighted images, due to accumulation of the contrast agents, and the blood vessels are
dark. The hepatobiliary phase is typically reached between 20 and 120 minutes for gadoxetate
disodium, and between 45 and 120 minutes for gadobenate dimeglumine and has an optimal
uptake into hepatocytes and excretion into bile to allow visualization of both the biliary
system and liver.

Chapter 2: Functional hepatobiliary imaging
61
Figure 2.1: MRI images of the different phases from a liver MRI examination with gadoxetate disodium as
contrast agent. A: late hepatic arterial phase with enhancement of the hepatic artery and early enhancement of
the portal vein. B: portal venous phase with enhancement of the portal and hepatic veins, and also a strong
enhancement of the hepatic parenchyma, due to early hepatocyte uptake of the contrast agent. C: late dynamic
phase with strong enhancement of the liver with relative washout in the vessels. The liver enhancement is caused
by a combination of residual intravascular enhancement, leakage to the extravascular extracellular interstitial
space and active hepatocyte uptake by OATPs. D: Hepatobiliary phase with strong enhancement of liver,
washout of the blood vessels and excretion into the bile ducts (adapted from Bashir, 2014).
Additionally, hepatocyte-containing lesions will also be enhanced. This contrast enhancement
pattern depends on:
1) the presence of functioning hepatocytes
2) vascular supply of the lesion
3) characteristics of the biliary structures within the lesions.
These hepatobiliary imaging agents can be used as biomarker of hepatobiliary transporter
function in a noninvasive manner. The majority of the liver function tests measures the global
function of the liver, with no consideration for segmental variations in function or
dysfunction. Liver-specific MR contrast agents can assess liver function at segmental level,
with an excellent anatomical resolution. This can be important in the treatment planning
before liver resection for example in liver cirrhosis and hepatocellular carcinomas (HCC),
which do not have a normal liver parenchyma. However, further technical development and
clinical validation of this method is needed (Serlin et al., 2014; Pastor et al., 2014).

Chapter 2: Functional hepatobiliary imaging
62
In the clinic, hepatobiliary imaging agents are mostly used for the characterization of liver
lesions of hepatocellular origin (HCC, focal nodular hyperplasia (FNH), hepatocellular
adenoma (HCA)) and of nonhepatocellular origin (cavernous hemangioma, cysts, metastases).
FNH and HCA are often difficult to differentiate by conventional MRI. However, the
distinction is important since FNH needs no therapeutic intervention but HCA does, due to its
potential for malignant transformation and bleeding. Hepatobiliary contrast agents accumulate
differently in these lesions: in FNHs, there is an accumulation of the contrast agents, since the
bile ducts are not connected to the biliary tree.
Additionally, biliary tree imaging can be performed in the hepatobiliary phase to give both
anatomical and functional information, which can be useful for identifying sites of bile duct
injury and bile leakage. For example, cholestasis can be detected by a decrease, delay or total
lack of contrast excretion into the biliary track (Frydrychowicz et al., 2012; Gandhi et al.,
2006; Bashir et al., 2014; Pascolo et al., 1999; Zech et al., 2007; Choi et al., 2014).
Bile acid analogues
In addition to the two hepatobiliary contrast agents used in the clinic, several experimental
liver-specific MR contrast agents were developed. In the scope of this thesis, the focus will be
on bile acid analogues.
In 2004, Anelli et al. (Anelli et al., 2004) published 12 bile acid analogues (Figure 2.2) that
formed a complex with gadolinium in order to become contrast agents that were actively
taken up by the hepatocytes at higher rates compared to Gd-EOB-DTPA and Gd-BOPTA. All
agents showed biliary and renal excretion in different ratios. Different configurations were
investigated and the extent of biliary excretion depends on several structural features such as
the nature of the bile acid, the site of conjugation of the gadolinium complex and the global
charge of the conjugate. One conjugate, compound 1j (Figure 2.2), was identified as possible
NTCP substrate.

Chapter 2: Functional hepatobiliary imaging
63
Figure 2.2: Bile acid analogues synthesized by Anelli et al. Bile acid analogues are indicated by the numbers 1a-
1j (adapted from Anelli et al., 2004).
Gadocoletic acid trisodium salt (B22956/1; compound 1g in Figure 2.2), used as blood pool
agent, was investigated by Libra et al. (Libra et al., 2006) as hepatobiliary imaging agent. The
aim of the incorporation of a bile acid in the structure of B22956/1 was to increase plasma
protein binding and so increasing the blood half-life. Biliary excretion is the primary
elimination route of this compound, in contrast to Gd-BOPTA and Gd-EOB-DTPA. Libra et
al. revealed that OATPs and MRP2 are involved in the uptake and efflux of B22956/1.
Vivian et al. published trifluorinated bile acid analogues for 19F magnetic resonance imaging
in the context of diagnosing bile acid malabsorption (Figure 2.3). First, cholic acid-
trifluoroacetyl lysine (CA-lys-TFA) was synthesized and NTCP and ASBT were identified as
the involved transport proteins (Vivian et al., 2013). A limitation of this imaging probe is that
the molecule is deconjugated by gut bacterial enzymes (Vivian et al., 2014). Therefore, an
additional bile acid analogue was synthesized to diminish the potential for differences in
intestinal microbiota to alter probe concentrations and also increase the probe half-life (Vivian
et al., 2014). In this context, CA-sar-TFMA was synthesized, a compound that is structurally

Chapter 2: Functional hepatobiliary imaging
64
similar to cholylsarcosine. NTCP and ASBT were also identified as the involved transporters
and no bacterial metabolization was observed in vitro.
Figure 2.3: Structures of CA-lys-TFA (A) and CA-sar-TFMA(B) (adapted from Vivan et al., 2013; Vivian et al.,
2014).
Chapter 2: Functional hepatobiliary imaging
65
Fluorescent hepatobiliary contrast agents Fluorescent indocyanine green (ICG) imaging is used in the operating room to assess the
function of liver segments. ICG is transported via OATPs, NTCP and MRP2. The vascular
clearance of ICG over time is a measure for hepatic function. ICG clearance was mostly
measured by blood sampling after intravenous injection. Today, ICG plasma clearance can be
measured noninvasively at the bedside. It is for example used in the operating room to
visualize the resection limits of HCCs by using a fluorescence camera. However, ICG is of
concern for patients with iodine allergy (Sakka et al., 2007).
Besides ICG, mainly bile acid analogues were developed as fluorescent hepatobiliary agents.
Plasma clearance of bile acids is a quantitative measure of liver function and is based on the
principle that bile acid uptake and metabolism is a liver specific function. Two main classes
can be distinguished: 1) (amino)fluorescein coupled to the carboxylic group of a bile acid and
2) nitrobenzoaxdiazolyl (NBD) coupled to the ε-amino group of a conjugated bile acid
(Holzinger et al., 1997).
A first group, fluorescein conjugated bile acid analogues (Figure 2.4), express several
physicochemical and biological properties similar to endogenous bile acids, including rapid
secretion into bile. These imaging agents have been used in several studies to investigate the
(patho)physiology of bile acid transport both in vitro and in vivo. Milkiewicz et al.
(Milkiewicz et al., 2000), for example, performed a pilot study that revealed that there was a
reduced clearance of cholyl-lysyl-fluorescein (CLF) in patients with liver cirrhosis. CLF is an
OATP1B1, weak OATP1B3, MRP2 and MRP3 substrate (de Waart et al., 2010). Therefore,
CLF was suggested as imaging agent for the assessment of liver function. Additionally,
aminofluorescein (amF) bile acid analogues are used to assess liver function. Holzinger et al.
(Holzinger et al., 1997) proposed amF conjugated cholylglycine,
cholylglycylamidofluorescein (CGamF) as characterizing agent for hepatocyte transport
function in health and disease. This contrast agent is mainly used in in vitro studies.

Chapter 2: Functional hepatobiliary imaging
66
Figure 2.4: Structure of CLF and CGamF (adapted from de Waart et al., 2010).
Secondly, an NBD amino-group was used as fluorophore and was introduced in different
positions of the steroid nucleus. 3-, 7-, and 12-α and -β NBD analogues of cholic acid and its
tauro conjugates (Figure 2.5) have been synthesized and were evaluated in vitro and in
invasive in vivo studies (Schramm et al., 1991; Schneider et al., 1991; Schramm et al., 1993).
Figure 2.5: Structures of taurine-conjugated bile salt derivatives 3β-NBD-NCT (A), 7β-NBD-NCT and 12β-
NBD-NCT (adapted from Schneider et al., 1991).
NBD labeled 24-lysyl conjugates have been studied as substrates for hepatic and intestinal
transport proteins (Holzinger et al., 1996; Maglova et al., 1995) (Figure 2.6). Yamaguchi et
al. (Yamaguchi et al., 2006) identified OATP1B1 and OATP1B3 as the involved uptake
transporters of chenodeoxycholyl-NBD-lysine (CDC-NBD-L).

Chapter 2: Functional hepatobiliary imaging
67
Figure 2.6: Structures of chenodeoxycholyl-NBD-lysine (CDC-NBD-L) and cholyl-NBD-lysice (C-NBD-L)
(adapted from Maglova et al., 1995).
In 2012, Májer et al. (Májer et al., 2012) reported two new isomeric 3-deoxy 3-NBD-amino
derivatives of UDCA and DCA (Figure 2.7).
Figure 2.7: Structures of 3-deoxy 3-NBD-amino deoxycholic (left) and ursodeoxycholic acid (right) (adapted
from Májer et al., 2012).
Additionally, Tauro-nor-THCA-24-DBD, a synthetic fluorescent bile acid analogue with a
fluorophore at the side chain of the taurine conjugated bile acid (Figure 2.8), was synthetized
by Yamaguchi et al. (Yamaguchi et al., 2010) and was used by De Bruyn et al. (De Bruyn et
al., 2014) to study interference of drugs with NTCP and BSEP in a fluorescence-based in
vitro assay. However, to the best of our knowledge, none of these agents were used in
humans.
Figure 2.8: Structure of tauro-nor-THCA-24-NBD (adapted from Yamaguchi et al., 2010).

Chapter 2: Functional hepatobiliary imaging
68
PET tracers Several PET tracers were developed to study hepatic bile acid transporters (Testa et al., 2015).
Table 2.1 displays an overview of these tracers. The bile acid analogues are indicated in
underlined italic font.
Table 2.1: Hepatobiliary PET tracers (adapted from Testa et al., 2015).
PET tracer Bile acid
transporters studied
Preclinically/clinically References
[11C]dehydropravastatin OATPs, MRP2 Preclinical Shingaki et al., 2013
[11C]rosuvastatin OATPs, NTCP, MRP2
Preclinical
He et al., 2014
[11C]TIC-Me OATP1B1, OATP1B3, MRP2
Preclinical Clinical
Takashima et al., 2010
Takashima et
al., 2014 [11C]glyburide OATPs Preclinical Tournier et
al., 2013 [11C]telmisartan OATP1B3 Preclinical
Clinical Shimizu et al., 2012; Iimori
et al., 2011 [11C]cholylsarcosine Bile acid transporters Preclinical
Clinical
Frisch et al.,
2012 [18F]CDCA Bile acid transporters Preclinical Jia et al., 2014 [11C]MTCA
[11C]MTCDCA
[11C]MTDCA
[11C]MTUDCA
[11C]MTLCA
Bile acid transporters Preclinical Schacht et al.,
2016
Transporter substrates
[11C]dehydropravastatin is a pravastatin analogue and is taken up into the hepatocytes by
OATPs and excreted into the biliary system via MRP2. This compound was investigated in
vitro, in cryopreservated rat and human hepatocytes and also in control, rifampicin-treated
and MRP2 knock-out rats (Shingaki et al., 2013).
Rosuvastatin is a known OATPs, NTCP and MRP2 substrate. Therefore, its [11C]-analogue
was synthesized as imaging agent of hepatobiliary rosuvastatin transport. In rats,
[11C]rosuvastatin was transported by Oatps, but not by Ntcp. It is then metabolized in the liver
and/or excreted by Mrp2 and Bcrp. The inhibitory effect of rifampicin was also demonstrated.
It was suggested as a useful PET probe for human hepatic transporters (He et al., 2014).

Chapter 2: Functional hepatobiliary imaging
69
[11C]tetranoisocarbacyclin methyl ester ([11C]TIC-Me) is a prostaglandin E2 analogue and is
taken up in the liver via OATP1B1 and OATP1B3 and excreted via MRP2. The metabolite
profile and biliary clearance of this tracer was determined in vitro and in vivo in normal rats,
Mrp2 knock-out rats and in humans. Additionally, the effects of rifampicin on hepatobiliary
functionality were assessed in humans (Takashima et al., 2010; Takashima et al., 2012; Testa
et al., 2015).
Glyburide is a antidiabetic agent, used in the treatment of type 2 diabetes. It is a substrate of
several ABC transporters but it is also a substrate of OATP1B1, OATP2B1 and OATP1A2.
Its [11C]-labeled form (Tournier et al., 2013) demonstrated the pharmacological consequences
of the interaction between glyburide and inhibitors of OATP and ABC transporters in vivo.
[11C]telmisartan is a radiolabeled angiotensin receptor antagonist. It is transported into the
liver mainly by OATP1B3. Its transport was investigated in normal and rifampicin-treated rats
and then in healthy volunteers. Uptake in the liver was observed with gradual elimination to
the gallbladder and intestine and the tracer was found to be safe and promising in order to
study OATP1B3 in humans (Shimizu et al., 2012; Iimori et al., 2011).
Bile acid analogues
Cholylsarcosine is an analogue of the conjugated bile acid cholyl-glycine and is formed by
cholic acid and the amino acid N-methylglycine (sarcosine). Frisch et al. (Frisch et al., 2012)
introduced [11C]cholylsarcosine (Figure 2.9) as an imaging agent for the visualization and
quantification of normal and pathologic hepatic excretory functions. NTCP and BSEP are the
expected transporters, because of the high similarity between cholylsarcosine and
cholylglycine. However, no in vitro transporter characterization was performed. This
radiotracer was investigated in pigs and hepatic uptake and biliary excretion was observed.
After administration of cholyltaurine, both hepatic uptake and biliary excretion were inhibited
in vivo.

Chapter 2: Functional hepatobiliary imaging
70
Figure 2.9: Structure of [11C]-cholylsarcosine (adapted from Frisch et al., 2012).
An 18F labeled chenodeoxycholic acid analogue was proposed by Jia et al. (Jia et al., 2014).
No characterization of the involved uptake and efflux transporters was done, but in vivo
evaluation in mice showed that this tracer had a similar uptake and efflux pattern as
[11C]cholylsarcosine. This tracer was proposed as PET tracer FXR in related disease.
Figure 2.10: Structure of [18F]CDCA (adapted from Jia et al., 2014).
Recently, Schacht et al. (Schacht et al., 2016), inspired by the research of Frisch et al. (Frisch
et al., 2012), proposed five methyl-taurine-conjugated bile acids. In vivo studies in pigs
revealed that these tracers behave in a similar manner as endogenous taurine-conjugated bile
acids, and therefore, they identified these agents as promising tracers for functional PET
imaging of patients with cholestatic liver disease. However, no in vitro experiments were
performed to identify the involved uptake and efflux transporters.

Chapter 2: Functional hepatobiliary imaging
71
Figure 2.11: Structures of [18F] bile acid analogues (adapted from Schacht et al., 2014).

Chapter 2: Functional hepatobiliary imaging
72
SPECT tracers
[99mTc]mebrofenin
[99mTc]mebrofenin ([99mTc]MEB) is a second-generation hepatic imino diacetic acid (HIDA)
derivative and lidocaine analogue (Figure 2.12).
Figure 2.12: Structure of [99mTc]mebrofenin.
After intravenous injection, this ionic tracer binds to plasma proteins (mainly albumin) and
circulates to the liver, where it dissociates in the space of Disse and is taken up by the
hepatocytes via OATP1 (Morandi et al., 2005; Ghibellini et al., 2008). Subsequently,
[99mTc]MEB is transported through the hepatocytes, and is then secreted in the gallbladder
through MRP2 (Nies et al., 2007). Finally, [99mTc]MEB is eliminated into the small intestine.
In the clinic, it is used to assess many clinical indications, for example acute cholecystitis,
biliary leak, complications after liver transplantation, prediction of remnant liver function,
differential diagnosis of hepatic tumors, … (Ziessman, 2014; Lambie et al., 2011). Because of
the high hepatic clearance rate via the biliary system, mainly dynamic assessment of
[99mTc]MEB is performed using planar scintigraphy. To measure global liver function,
regions of interest are drawn around the heart, liver and total field of view. Out of these
measures, the total uptake rate corrected for the patient’s body surface area (%/min/m²) can be
calculated. Remnant liver function can also be calculated by dividing the summed counts
within the delineated functional remnant liver by the total liver counts within the same time
frame and multiplying this factor with total liver uptake rate (Erdogan et al., 2004).

Chapter 2: Functional hepatobiliary imaging
73
Figure 2.13 shows an example of [99mTc]MEB hepatobiliary dynamic scintigraphy. Figure
2.13 A depicts [99mTc]MEB uptake in a superimposed image of the dynamic scintigraphy. A
region of interest can be drawn around the entire liver (dark grey line), the heart (white line),
the future remnant liver (light grey line) and the total field of view (not shown). The
corresponding time activity curves are shown in Figure 2.13 B. The region of interest around
the heart can be obtained from the first time frames after injection of the radiotracer (Figure
2.13 C). The uptake of [99mTc]-MEB by the liver (slope, D) is calculated as an increase in
[99mTc]MEB uptake (y), over a predefined time interval (x), usually 200 seconds.
Figure 2.13: [99mTc]MEB hepatobiliary scintigraphy (adapted from Hoekstra et al., 2013).
[99mTc]Galactosyl serum albumin
[99mTc]diethylenetriamine-pentaacetic acid-galactosyl human serum albumin ([99mTc]GSA) is
an asialoglycoprotein analogue that binds to the asialoglycoprotein receptors on the
hepatocyte and is then exclusively taken up in the hepatocytes via receptor-mediated
endocytosis. This tracer is used for functional liver scintigraphy, however, it is not suitable for
the evaluation of the biliary tract, since there is no biliary excretion. Evaluation of liver
function via [99mTc]GSA shows a good relationship with conventional liver function tests (e.g.
total and direct bilirubin, antithrombin, prothrombin time, etc.). After dynamic [99mTc]GSA
scintigraphy with the gamma camera positioned over the heart and liver region, regions of
interest are drawn around the heart and liver and blood clearance ratio (ratio of the heart
uptake after 15 minutes and heart uptake after 3 minutes; HH15=H15/H3) and hepatic uptake
ratio (LHL15= L15/(L15+H15); liver uptake after 15 min divided by the sum of the liver and
heart uptake after 15 minutes) values are calculated, which are the two most commonly used
parameters in planar [99mTc]GSA scintigraphy. In the clinic, the preoperative hepatic uptake
ratio is used as reliable indicator for predicting postoperative complications in patients with

Chapter 2: Functional hepatobiliary imaging
74
HCC and chronic liver disease that have a significantly lower LHL15. However,
postoperative liver failure was also observed in patients with normal LHL15 values. This can
be explained by the fact that LHL15 only measures total liver function and not the function of
the functional remnant liver.
To overcome this shortcoming, static and dynamic SPECT imaging can be performed to
measure segmental liver function and functional liver volume. Planar scintigraphy images are
two dimensional reconstructions of the tracer distribution in a field of view leading to
superposition of tissue or tissue segments. SPECT imaging, in contrast, offers three
dimensional tomographic images that allow measurements of radioactivity in volumes of
interest, for example liver segments. Therefore, [99mTc]GSA SPECT can be used to assess
specifically the functional remnant liver. In cirrhotic patients for example, advanced fibrosis
is accompanied by a reduction in functional hepatocytes (Hoekstra et al., 2013).
Bile acid analogues
Huang et al. (Huang et al., 2009) synthesized rhenium and technetium labeled bile acid
tricarbonyl complexes (Figure 2.14). However, no in vitro or in vivo evaluation of these
compounds was done. To the best of our knowledge, these were the only technetium labeled
bile acids reported to date.
Figure 2.14: Structures of technetium labeled bile acid analogues (adapted from Huang et al., 2009).

Chapter 2: Functional hepatobiliary imaging
75
References Anelli PL, Lattuada L, Lorusso V, Lux G, Morisetti A, Morosini P, et al. Conjugates of gadolinium complexes to
bile acids as hepatocyte-directed contrast agents for magnetic resonance imaging. J Med Chem 2004;27:3629-
3641.
Bashir MR. Magnetic resonance contrast agents for liver imaging. Magn Reson Clin N Am 2014;22:283 -293.
Burke C, Grant LA, Goh V, Griffin N. The role of hepatocyte-specific contrast agents in hepatobiliary magnetic
resonance imaging. Semin Ultrasound CT MRI 2013;34:44-53.
Choi SH, Byun JH, Kwon HJ, Ha HI, Lee SJ, Kim SY, et al. The usefulness of gadoxetic acid -enhanced
dynamic magnetic resonance imaging in hepatocellular carcinoma: toward improving staging. Ann Surg Oncol
2014;ePub.
De Bruyn T, Sempels W, Snoeys J, Holmstock N, Chatterjee S, Stieger B, et al. Confocal imaging with a
fluorescent bile acid analogue closely mimicking hepatic taurocholate disposition. J Pharm Sci 2014;103:1872-
1881.
de Haën C, Lorusso V, Luzzani F, Tirone P. Hepatic transport of the magnetic resonance imaging contrast agent
gadobenate dimeglumine in the rat. Acad Radiol 1995;2:232-238.
De Waart DR, Häusler S, Vlaming ML, Kunne C, Hänggi E, Gruss HJ, Oude Elferink RP, Stieger B. Hepatic
transport mechanisms of cholyl-L-lysyl-fluorescein. J Pharmacol Exp Ther 2010;334;78-86.
Frisch K, Jakobsen S, Sorenson M, Munk OL, Alstrup AKO, Ott P, et al. [N-methyl-11C]cholylsarcosine, a
novel bile acid tracer for PET/CT of hepatic excretory function: radiosynthesis and proof-of-concept studies in
pigs. J Nucl Med 2012;53:772-778.
Frydrychowicz A, Lubner MG, Brown JJ, Merkle EM, Nagle SK, Rofsky NM, et al. Hepatobiliary MR imaging
with gadolinium-based contrast agents. J Magn Reson Imaging 2012;35:492-511.
Gandhi SN, Brown MA, Wong JG, Aguirre DA, Sirlin CB. MR contrast agents for liver imaging: what, when,
how. Radiographics 2006;26:1621-1637.
Ghibellini G, Leslie EM, Pollack GM, Brouwer KLR. Use of Tc-99m Mebrofenin as a Clinical Probe to Assess
Altered Hepatobiliary Transport: Integration of In Vitro, Pharmacokinetic Modeling, and Simulation Studies.
Pharm Res. 2008;25:1851-60.
He J, Yu Y, Prasad B, Link J, Miyaoka RS, Chen X, et al. PET imaging of Oatp -mediated hepatobiliary transport
of [11C]-rosuvastatin in the rat. Mol Pharm 2014;11:2745-2754.
Hoekstra LT, de Graaf W, Nibourg GAA, Heger M, Bennink RJ, Stieger B, et al. Physiological and biochemical
basis of clinical liver function tests. Ann Surg 2013;257:27-36.

Chapter 2: Functional hepatobiliary imaging
76
Holzinger F, Schteingart CD, Ton-Nu HT, Eming SA, Monte MJ, Hagey LR, Hofmann AF. Fluorescent bile acid
derivatives: relationship between chemical structure and hepatic and intestinal transport in the rat. Hepatology
1997;26:1263-1271.
Iimori H, Hashizume Y, Sasaki M, Kajiwara Y, Sugimoto Y, Sugiyama Y, et al. First automatic radiosynthesis
of 11C labeled telmisartan using a multipurpose synthesizer for clinical research use. Ann Nucl Med
2011;25:333-337.
Jia L, Jiang D, Hu P, Li X, Shi H, Cheng D, et al. Synthesis and evaluation of 18F-labeled bile acid compound: a
potential PET imaging agent for FXR-related diseases. Nucl Med Biol 2014;41:495-500.
Lambie H, Cook AM, Scarsbrook AF, Lodge JPA, Robinson PJ, Chowdhury FU. 99mTc-hepatobiliary
iminodiacetic acid (HIDA) scintigraphy in clinical practice. Clin Radiol 2011;66:1094-1105.
Leonhardt M, Keiser M, Oswald S, Kühn J, Jia J, Grube M, et al. Hepatic uptake of the magnetic resonance
imaging contrast agent Gd-EOB-DTPA: role of human organic anion transporters. Drug Metab Dispos
2010;38:1024-1028.
Libra A, Fernetti C, Lorusso V, Visigalli M, Anelli PL, Staud F, et al. Molecular determinants in the transport of
a bile acid-derived diagnostic agent in tumoral and nontumoral cell lnies of human liver. J Pharmacol Exp Ther
2006;319:809-817.
Maglova LM, Jackson AM, Meng XJ, Carruth MW, Schteingart CD, Ton-Nu HT, Hofmann AF, Weinman SA.
Transport characteristics of three fluorescent conjugated bile acid analogs in isolated rat hepatocytes and
couplets. Hepatology 1995;22:637-647.
Májer F, Salomon JJ, Sharma R, Etzbach SV, Nadzri Mohd Jajib M, Keaveny R, et al. New fluorescent bile
acids: synthesis, chemical characterization, and disastereoselective uptake by Caco -2 cells of 3-deoxy-3-NBD-
amino deoxycholic and ursodeoxycholic acid. Bioorg Med Chem 2012;20:1767-1778.
Milkiewicz P, Saksena S, Cardenas T, Mills CO, Elias E. Plasma elimination of cholyl-lysyl-fluorescein (CLF):
a pilot study in patients with liver cirrhosis. Liver 2000;20:330-334.
Morandi F, Frank N, Avenell J, Daniel GB. Quantitative assessment of hepatic function by means of 99m Tc-
Mebrofenin in healthy horses. J Vet Intern Med. 2005;19:751-5.
Nassif A, Jia J, Keiser M, Oswald S, Modess C, Nagel S, et al. Visualization of hepatic uptake transporter
function in healthy subjects by using gadoxetic acid-enhanced MR imaging. Radiology 2012;264:741-750.
Nies AT, Keppler D. The apical conjugate efflux pump ABCC2 (MRP2). Pflugers Arch. 2007;453:643-59.
Pascolo L, Cupelli F, Anelli PL, Lorusso V, Visigalli M, Uggeri F, et al. Molecular mechanisms for the hepatic
uptake of magnetic resonance imaging contrast agents. Biochem Biophys Res Commun 1999;257:746 -752.
Pastor CM, Müllhaupt B and Stieger B. The role of organic anion transporters in diagnosing liver diseases by
magnetic resonance imaging. Drug Metab Dispos 2014;42:675-684.

Chapter 2: Functional hepatobiliary imaging
77
Sakka SG. Assessing liver function. Curr Opin Crit Care 2007;13:207-214.
Schacht C, Sorensen M, Munk OL, Frisch. Radiosynthesis of N-11C-methyl-taurine-conjugated bile acids and
biodistribution studies in pigs by PET/CT. J Nucl Med 2016;57:628-633.
Schneider S, Schramm U, Schreyer A, Buscher HP, Gerok W, Kurz G. Fluorescent derivatives of bile salts. I.
Synthesis and properties of NBD-amino derivatives of bile salts. J Lipid Res 1991;32:1755-1767.
Schramm U, Dietrich A, Schneider S, Buscher HP, Gerok W, Kurz G. Fluorescent derivatives of bile salts. II.
Suitability of NBD-amino derivatives of bile salts for the study of biological transport. J Lipid Res
1991;32;1769-1779.
Schramm U, Fricker G, Buscher HP, Gerok W, Kurz G. Fluorescent derivatives of bile salts. III. Uptake of 7β-
NBD-NCT into isolated hepatocytes by the transport systems for cholyltaurine. J Lipid Res 1993;34:741-757.
Serlin CB, Hussain HK, Jonas E, Kanematsu M, Lee JM, Merkle EH, et al. Consensus report from the 6th
international forum for liver MRI using gadoxetic acid. J Magn Reson Imaging 2014;40:516 -529.
Shimizu K, Takashima T, Yamane T, Sasaki M, Kageyama H, Hashizume Y, et al. Whole-body distribution and
radiation dosimetry of [11C]telmisartan as a biomarker for hepatic organic anion transporting polypeptide
(OATP) 1B3. Nucl Med Biol 2012;39:847-853.
Shingaki T, Takashima T, Ijuin R, Zhang X, Onoue T, Katayama Y, et al. Evaluation of Oatp and Mrp2
activities in hepatobiliary excretion using newly developed positron emission tomography tracer [11C]-
dehydropravastatin in rats. J Pharmacol Exp Ther 2013; 347:193-202.
Stieger B, Heger M, de Graaf W, Paumgartner G, van Gulik T. The emerging role of transport systems in liver
function tests. Eur J Pharmacol 2012:675:1-5.
Takashima T, Kitamura S, Wada Y, Tanaka M, Shigihara Y, Ishii H, Ijuin R, et al. PET imaging -based
evaluation of hepatobiliary transport in humans with (15R)-11C-TIC-Me. J Nucl Med 2012;53:741-748.
Takashima T, Nagata H, Nakae T, Cui Y, Wada Y, Kitamura S, et al. Positron emission tomography studies
using (15R)-16-m-[11C]tolyl-17,18,19,20-tetranorisocarbacyclin methyl ester for the evaluation of hepatobiliary
transport. J Pharmacol Exp Ther 2010;335:314-323.
Testa A, Zando M, Elmore CS, Sharma P. PET tracers to study clinically relevant hepatic transporters. Mol
Pharmaceutics 2015;12:2203-2216.
Tournier N, Saba W, Cisternino S, Peyronneau MA, Damont A, Goutal S, et al. Effects of selected OATP and/or
ABC transporter inhibitors on the brain and whole-body distribution of glyburide. AAPS J 2013;15:1082-1090.
Ulloa JL, Stahl S, Yates J, Woodhouse N, Kenna JG, Jones HB, et al. Assessment of gadoxetate DCE-MRI as a
biomarker of hepatobiliary transporter inhibition. NMR Biomed 2013;26:1258-1270.

Chapter 2: Functional hepatobiliary imaging
78
Vivian D, Cheng K, Khurana S, Xu S, Dawson PA, Raufman JP, et al. Design and evaluation of a novel
trifluorinated imaging agent for assessment of bile acid transport using fluorine magnetic resonance imaging. J
Pharm Sci 2014;103:3782-3792.
Vivian D, Cheng K, Khurana S, Xu S, Kriel EH, Dawson PA, et al. In vivo performance of a novel fluorinated
magnetic resonance imaging agent for functional analysis of bile acid transport. Mol Pharm 2014;11:1575-1582.
Vivian D, Cheng K, Khurana S, Xu S, Whiterock V, Witter D, et al. Design and characterization of a novel
fluorinated magnetic resonance imaging agent for functional analysis of bile acid transporter activity. Pharm Res
2013;30:1240-1251.
Yamaguchi H, Okada M, Akitaya S, Ohara H, Mikkaichi T, Ishikawa H, et al. Transport of fluorescent
chenodeoxycholic acid via the human organic anion transporters OATP1B1 and OATP1B3. J Lipid Res
2006;47:1196-1202.
Yamaguchi K, Murai T, Yabuuchi H, Hui SP, Kurosawa T. Measurements of bile salt export pump transport
activities using a fluorescent bile acid derivative. Drug Metab Pharmacokinet 2010;25:214 -219.
Zech CJ, Hermann KA, Reiser MF, Schoenberg SO. MR imaging in patients with susp ected liver metastases:
value of liver-specific contrast agent Gd-EOB-DTPA. Magn Reson Med Sci 2007;6:43-52.
Ziessman HA. Hepatobiliary scintigraphy in 2014. J Nucl Med 2014;55:967-975.

Chapter 3: Scope and aims
79
Chapter 3.
Scope and aims

Chapter 3: Scope and aims
80

Chapter 3: Scope and aims
81
Drug induced liver injury (DILI) is responsible for up to 15% of cases of acute liver failure in
Europe and US, and is a one of the leading causes of drug withdrawal from the market and
attrition in the development process of new drug candidates. Therefore, it is important to
understand, characterize, and develop prediction methods to identify possible interactions.
One of the involved causes of DILI is drug induced cholestasis and many cases are caused by
inhibition of hepatic transporters by drugs. Clinically relevant hepatic transport systems
include the Organic Anion Transporting Polypeptides (OATPs), sodium Taurocholate
Cotransporting Protein (NTCP), Multidrug Resistance-associated Protein-2 (MRP2) and bile
salt export pump (BSEP). Cholestatic drugs may disturb bile acid homeostatis by direct
inhibition of bile acid transport, or by indirect processes, such as regulation of transporter
localization or expression Inhibition of these transporters for example, can lead to toxic
concentrations of bile acids, bilirubin or substrate drugs in blood or liver, which can lead to
hypercholanemia, hyperbilirubinemia, cholestatic liver injury and drug-drug interactions.
Currently, these interactions are investigated by in vitro and invasive, time consuming, and
expensive preclinical in vivo experiments. Therefore, the overall aim of this thesis is the
development of non-invasive predictive methods to visualize and quantify disturbed
hepatobiliary transport by drugs in preclinical animal species as an alternative to the invasive
methods. An additional advantage is that the number of sacrificed animals can be reduced.
This overall aim can be subdivided in four research questions.
Question 1: Is it possible to visualize and quantify altered hepatobiliary transport in
mice? (Chapter 5)
[99mTc]mebrofenin ([99mTc]MEB) is a second-generation hepatic imino diacetic acid (HIDA)
derivative, which is commonly used in hepatobiliary scintigraphy to investigate the function
and dysfunction of the liver. After intravenous injection, this ionic tracer binds to plasma
proteins (mainly albumin) and circulates to the liver, where it dissociates and is taken up by
the hepatocytes, through a carrier-mediated, sodium-independent transport mechanism, the
organic anion transport protein 1 (OATP1/Oatp1). Subsequently, [99mTc]MEB is transported
through the hepatocytes, and is then secreted in the gallbladder through MRP2/Mrp2. Finally,
[99mTc]MEB is eliminated into the small intestine. Therefore, this radiotracer was chosen as
biomarker to study hepatobiliary transporter function in vivo and will be evaluated in a non-
invasive manner by dynamic SPECT imaging in mice. Wild type mice will be evaluated to
Chapter 3: Scope and aims
82
determine the coefficient of variation of the measurements. As proof-of-principle, a bile duct
ligated animal (mechanical inhibition of hepatobiliary efflux) will be investigated. In addition,
transporter knock-out (KO) mice models will be used to study altered uptake and efflux
transporter function. Slco1a/1b and Abcc2 KO mice will be evaluated. These mice lack the
Oatp1a/1b and Mrp2 transporters, respectively. Lastly, rifampicin will be used as model drug
to visualize and quantify pharmacological inhibition of transporters. It has been shown that
rifampicin mediates the inhibition of OATP1B1 in vitro, mouse Oatp1a/1b in vivo and Mrp2
in vitro.
Question 2: Can this quantification be further refined by kinetic modeling of
[99mTc]MEB? (Chapter 6)
Tracer kinetic or compartmental modeling of dynamic SPECT measurements allows
calculation of physiological parameters by fitting a mathematical compartmental model of
tracer distribution and metabolism to the data. We will investigate if tracer kinetic modeling
can be used to absolutely quantify altered hepatobiliary transport in Mrp2 KO and rifampicin
treated mice. A two-tissue compartmental model will be proposed. Additionally, a non-
invasive method to obtain the blood input function will be evaluated.
Question 3: Is a humanized mouse model useful for the prediction of disturbed human-
type hepatobiliary transport? (Chapter 7)
Due to species differences, many hepatotoxicants remain undetected in preclinical safety
studies. Therefore, a chimeric mouse model with a humanized liver will be evaluated to study
human-type hepatobiliary transport. [99mTc]MEB transport will be assessed to characterize the
chimeric “humanized” model.
Question 4: Can bile acid analogues serve as biomarkers for DILI? (Chapter 8)
To investigate non-invasively the effect of inhibition of hepatobiliary transporters on the
transport of bile acids, there is a need for labeled bile acid analogues since [99mTc]MEB has
no chemical similarities with endogenous bile acids. Therefore, radiolabeled primary bile acid

Chapter 3: Scope and aims
83
analogues will be synthesized. We will investigate a technetium labeled chenodeoxycholic
and cholic acid analogue: technetium labeled diethylene triamine pentaacetic acid
chenodeoxycholic acid ([99mTc]DTPA-CDCA) and technetium labeled diethylene triamine
pentaacetic acid cholic acid, ([99mTc]DTPA-CA), respectively. Technetium will be used as
radioisotope since it is easily produced (it can be eluted from a generator), its suitable half-life
(6 hours) and its limitless depth of penetration. Additionally, in vitro assays will be performed
to identify the involved uptake and efflux transporters. Lastly, in vivo SPECT evaluation of
normal and disturbed hepatobiliary transport will be performed to illustrate the ability of these
agents to visualize and quantify (altered) hepatobiliary transport in vivo.

Chapter 3: Scope and aims
84

Chapter 4: Calibration curves
85
Chapter 4.
Calibration curves

Chapter 4: Calibration curves
86

Chapter 4: Calibration curves
87
NaI(Tl) scintillation detector 10 samples with 100 µL [99mTc]TcO4
- ranging from 0.37 to 45 kBq and determined with a
conventional CRC-15R dose calibrator (Capintec, Ramsay, NJ) are measured with the NaI(Tl)
scintillation detector (in cps) (Perkin Elmer, Waltham, USA) to obtain a calibration curve
from cps to MBq/mL with the following equation:
Radioactivity in kBq= 0.00013*(counts/30sec) R²= 0.9983
This calibration curve will be used in Chapter 5 to measure the exact amount of radioactivity
in the manual blood samples.
µSPECT To obtain quantitative measurements from the µSPECT camera (USPECT-II, MILabs,
Utrecht, The Netherlands), 8 samples with predetermined amounts of [99mTc]TcO4- ranging
from 0.37 MBq to 74 MBq, measured with a CRC-15R dose calibrator were acquired during
10 minutes. The field of view was determined by means of a 30 seconds CT acquisition. ROIs
were manually drawn around the content of the syringe (approximately 1 mL), to determine
the total amount of radioactivity and in the middle of the syringe, to determine the activity
concentration (Figure 4.1). The resulting output, measured in counts or counts/mL, was
expressed as a function of the true activity (MBq or MBq/mL) as measured by the dose
calibrator. The resulting calibration curve was used to quantify the amount of radioactivity in
MBq or concentration of radioactivity in MBq/mL in specific organs (Chapter 5, 6, 7 and 8).
The calibration curves were obtained with the following equations:
Total amount of radioactivity (MBq)= 1095*counts R²= 0.9986
Concentration of radioactivity (MBq/mL)= 2.646*106*counts/mL R²= 0.9987

Chapter 4: Calibration curves
88
Figure 4.1: ROIs around syringe which is used for the calibration curve of the USPECT-II imaging system. Red:
ROI that is used for determination of total amount of radioactivity (in MBq). Blue: ROI that is used for the
determination of the radioactivity concentration (in MBq/mL).

Chapter 5: In vivo visualization and quantification of normal and disturbed hepatobiliary transport by means of [99mTc]mebrofenin
89
Chapter 5.
In vivo visualization and
quantification of normal and
disturbed hepatobiliary
transport by means of
[99mTc]mebrofenin
Parts have been adapted from
Neyt S1, Huisman MT2, Vanhove C3, De Man H2, Vliegen M2, Moerman L1, Dumolyn C1, Mannens G2, De Vos
F1. Journal of Nuclear Medicine 2013; 54 (4): 624-630.
1Laboratory of Radiopharmacy, Ottergemsesteenweg 460, Ghent University, Ghent, Belgium
2Preclinical Development & Safety, Janssen Pharmaceutical Companies of Johnson & Johnson, Beerse, Belgium
3iMinds Medical IT-IBITech-MEDISIP-INFINITY, Ghent University, Ghent, Belgium

Chapter 5: In vivo visualization and quantification of normal and disturbed hepatobiliary transport by means of [99mTc]mebrofenin
90

Chapter 5: In vivo visualization and quantification of normal and disturbed hepatobiliary transport by means of [99mTc]mebrofenin
91
Introduction
As outlined in Chapter 1, the liver is an important organ for homeostasis. Hepatobiliary
transport processes are essential for these key functions and therefore, hepatocytes express
several transport systems (Kullak-Ublick et al., 2000; Wolkoff et al., 2003).
Clinically relevant hepatic transport systems include the organic anion transport pumps
(OATPs), sodium taurocholate cotransporting protein (NTCP), multidrug resistance protein 2
(MRP2) and bile salt export pump (BSEP) (Kosters et al., 2008; Kullak-Ublick et al.,2000;
Meier et al., 2002; Trauner et al., 2003). Numerous drugs are substrates or inhibitors of these
hepatic transporters and therefore, unexpected and unwanted interactions are frequently
observed as stated in Chapter 1 (Shitara et al., 2005; Maddrey, 2005). Therefore, in drug
research, it is important to assess the inhibition of hepatic transporters at an early
developmental phase. Currently, this possible inhibition is investigated by means of in vitro
and invasive, time-consuming and expensive preclinical in vivo tests (Chapter 1).
The current study, in contrast, describes a non-invasive in vivo method to assess the effect of
drugs on the hepatobiliary transport mechanisms in mice as an alternative for invasive
methods. Consequently, the number of sacrificed animals and costs can be reduced. In
addition, the proposed method can be used in both preclinical and clinical settings. We aim to
introduce a radioactive labeled substrate for the hepatic transporters, which can be used to
visualize the hepatic uptake, efflux and possible inhibition of these processes with molecular
imaging techniques, such as Single Photon Emission Computed Tomography (SPECT). In
this context, we propose the second-generation hepatic imino diacetic acid (HIDA) derivative
mebrofenin (MEB), which is commonly used in hepatobiliary scintigraphy to investigate the
function and dysfunction of the liver as outlined in Chapter 2 (Bujanover et al., 1983; Newell
et al., 2000; Morandi et al., 2005; Ghibellini et al., 2008). Normal transport of [99mTc]MEB is
shown in Figure 5.1, A.
First, we will evaluate the possibility of visualizing and quantifying normal hepatobiliary
transport in mice. The interanimal and intra-animal variability of the dynamic imaging
procedure will be evaluated.
Following the study of [99mTc]MEB as a suitable SPECT tracer for the evaluation of
hepatobiliary transport, the effect of altered hepatobiliary transport on [99mTc]MEB kinetics

Chapter 5: In vivo visualization and quantification of normal and disturbed hepatobiliary transport by means of [99mTc]mebrofenin
92
will be investigated in mice. Based on the results, a non-invasive in vivo method is proposed
to assess disturbances in the transport of [99mTc]MEB in mice.
As proof-of-principle, mechanical inhibition will be obtained by placing a ligation around the
bile duct. Pharmacological inhibition will be achieved by administration of rifampicin, an
antibiotic that is often used to treat tuberculosis and other bactericidal infections. Rifampicin
is known to mediate the inhibition of OATP1B1, OATP1B3 in vitro (de Graaf et al., 2011;
Ghibellini et al., 2008), mouse Oatp1a/1b in vivo (Van de Steeg et al., 2010) and Mrp2 in
sandwich-cultured rat hepatocytes (Lengyel et al., 2008). However, less is known about the
effects of rifampicin on the function of hepatic MRP2 in humans, as these may be hard to
detect in circulating blood, since inhibition of MRP2 leads to an accumulation of substrates in
the liver. Thus, rifampicin provided an ideal test compound for this study. We hypothesized
that rifampicin inhibits Oatp1a/1b as well as Mrp2, with inhibition reflected in altered time–
activity curves (TACs) for the blood, liver, and gallbladder+intestines (Figure 5.1 D) (Kosters
et al., 2008; Kullak-Ublick et al., 2000). As a reference, and to investigate in vivo the relative
contributions of uptake and efflux transporters in [99mTc]MEB handling, dynamic µSPECT
imaging was used to characterize the behavior of [99mTc]MEB in mice unable to express the
uptake transporters Oatp1a/1b (Slc1a/1b-/-/-/-, Oatp1a/1b knock-out (KO)) (Van de Steeg et al.,
2010) or the efflux transporter Mrp2 (Abcc2-/-, Mrp2 KO) (Vlaming et al., 2006). It was
further hypothesized that elevated concentrations of [99mTc]MEB would be detected in the
blood of Oatp1a/1b KO mice and in the liver of Mrp2 KO mice (Figure 5.1 B and C,
respectively).
Critical for the interpretation and translation of the data in such experiments is a
comprehensive mechanistic understanding of the hepatic handling of [99mTc]MEB.
[99mTc]MEB is an in vitro substrate of OATP1B1, OATP1B3, MRP2, and MRP3, but not of
OATP2B1 and NTCP (Ghibellini et al., 2008, de Graaf et al., 2011). Although unlikely, it is
not yet known whether [99mTc]MEB (an anion) is a substrate for OCT1 (organic cation
transporter 1). Considering the high-level expression of OCT1 in the sinusoidal membrane, in
the present work it was also important to formally exclude OCT1-mediated [99mTc]MEB
transport.
In summary, the possibility of non-invasive visualizing and quantifying transporter activity in
a reproducible manner will be examined. Furthermore, we will examine whether we can
quantify altered hepatobiliary transport and whether we can distinct the effect on the

Chapter 5: In vivo visualization and quantification of normal and disturbed hepatobiliary transport by means of [99mTc]mebrofenin
93
sinusoidal uptake into the liver and efflux into the bile. If these aims will be fulfilled, one will
have a possible model to predict the effects of drugs in a (pre-)clinical setting. Since this
method could be used in preclinical and clinical research, the translation from animal to
human could be made more easily.
Figure 5.1: Study hypothesis for [99mTc]MEB transport in wild-type (A), Oatp1a/1b KO (B), BDL and Mrp2 KO
(C) and rifampicin-treated (D) mice. In wild-type mice, rapid uptake in the liver and efflux to the gallbladder and
intestines are expected, in contrast to Oatp1a/1b KO mice, in which no noteworthy uptake is anticipated. In
Mrp2 KO mice, normal uptake in the liver and the absence of efflux to the gallbladder and intestines is
hypothesized whereas in rifampicin-treated mice, decreased uptake and efflux are assumed.

Chapter 5: In vivo visualization and quantification of normal and disturbed hepatobiliary transport by means of [99mTc]mebrofenin
94
Materials and methods
In vitro assays
Chinese hamster ovary (CHO) cells, CHO-OCT, Human Embryonic Kidney (HEK),
HEK293-OATP1B3 cells were purchased from Solvo Biotechnologies (Hungary); CHO-
NTCP and HEK293-OATP1B1 cells were a kind gift from the same company. The cells were
stably transfected with genes encoding human NTCP (SLC10A1), OATP1B1 (SLCO1B1),
OATP1B3 (SLCO1B3) and OCT1 (SLC22A1). The cell lines were cultured in a humidified
atmosphere at 37°C in the presence of 5% CO2. The culture medium of the CHO cells
consisted of Dulbecco’s modified Eagle’s medium (DMEM)/F12, supplemented with 10%
fetal calf serum, 2 mM L-glutamine, 0.3 mM L-proline, and antibiotics
(Penicillin/Streptomycin; 50 U/mL; 50 µg/mL). The culture medium of the HEK293 cells
consisted of DMEM glutamax; high glucose; pyruvate supplemented with 10% fetal calf
serum, 5 mL MEM-non essential amino acid solution, and antibiotics
(Penicillin/Streptomycin; 50 U/mL; 50 µg/mL).
For transport experiments, all CHO and HEK cells were seeded in 24-well plates (6.0×10⁵
cells/well) in 1 mL of culture medium. After 18–24 h, the medium was removed and the cells
were washed twice with washing buffer (1.25 mL sterile HBSS+/+ (HBSS with Ca2+ and
Mg2+), 10 mM HEPES, pH=7.4, 37°C). Incubation buffers (500 µL/well) were obtained by
adding the (radiolabeled) compounds to the washing buffer. Final concentrations were 1 µM
3H-estradiol-17β-glucuronide (E17βG, for OATP1B1), 1 µM 3H-taurocholic acid (TCA, for
NTCP), 1 µM 14C-tetra-ethyl-ammonium (TEA, for OCT1), and 100 µM [99mTc]MEB (for all
cell lines). The plates were incubated at 37°C and 5% CO2. The incubation was stopped by
adding 1.5 mL of ice-cold HBSS+/+ (1% BSA) after which the wells, containing the cells,
were washed twice more with HBSS+/+. Next, the cells were lysed with 200 µL mammalian
protein extraction reagent (MPer, Invitrogen, Belgium) and the plates were shaken for 10 min
at 120 rpm. A 150 µL aliquot of this solution was used for NaI(Tl) scintillation counting and
liquid scintillation counting.

Chapter 5: In vivo visualization and quantification of normal and disturbed hepatobiliary transport by means of [99mTc]mebrofenin
95
Murine models
FVB wild-type (WT) mice (♀, 5 weeks, 20–25 g) were from Janvier (France) and Slco1a/1b-
/-/-/- (♂, 5 weeks, 25–30 g; Oatp1a/1b KO mice) and Abcc2-/- (♀, 5 weeks, 20–25 g; Mrp2
KO mice) animals were from Taconic Farms (USA). The mice were housed and handled
according to guidelines approved by the European Ethics Committee and acclimatized for at
least one week before the experiments. All of the animals were kept under environmentally
controlled conditions (12 h normal light/dark cycles, 20–22°C and 60% relative humidity)
with food and water ad libitum. The study protocol was approved by the Animal
Experimental Ethical Committee of Ghent University (ECD10/39).
Radionuclides, radiopharmaceuticals and chemicals
Mebrofenin (N-(3-bromo-2,4,6 trimethylphenylcarbamoylmethyl)-iminodiacetic acid) was
obtained as a commercial kit from GE Healthcare (Bridatec®, Belgium) in a preparation
containing 40 mg of mebrofenin and 0.3 mg of tin(II)chloride-dihydrate. [99mTc]TcO4- was
eluted from a sterile 99mTc-generator (DrytecTM, GE Healthcare). The Bridatec kit was
reconstituted according to the manufacturer’s recommendations with 1480 MBq [99mTc]TcO4-
in 4 mL saline. Radiochemical purity was determined according to Billinghurst et al.
(Billinghurst et al., 2004). The formulations employed had a radiochemical purity of ≥ 95%.
Rifampicin and polyethyleneglycol 400 (PEG400) were obtained from Sigma Aldrich
(Belgium), and dimethyl sulfoxide (DMSO) from Acros Organics (Belgium).
Molecular imaging
Dynamic µSPECT/CT acquisitions were acquired on a USPECT-II/CT device (MILabs,
Utrecht, The Netherlands) (van der Have et al., 2009) equipped with a cylindrical collimator
containing 75 pinholes of 1 mm diameter (rat whole-body collimator; spatial resolution, 0.8
mm). All acquisitions were acquired in list mode.
After an overnight fast (minimum 6 h), the WT, Oatp1a/1b KO and Mrp2 KO mice were
anesthetized with a mixture of isoflurane (1.5%) and medical O2 to allow placement of an
intravenous needle (30G) and polyethylene (PE10) tubing (Becton Dickinson, Belgium) in a
lateral tail vein. The mice were placed in a prone position on the mouse scan bed. 200 µL (37-

Chapter 5: In vivo visualization and quantification of normal and disturbed hepatobiliary transport by means of [99mTc]mebrofenin
96
74 MBq; 2 mg MEB) [99mTc]MEB was injected via the intravenous PE10 tubing, directly
after scan initiation (IV, intraveneous).
One hour before tracer injection, rifampicin-treated mice were pre-treated with five different
rifampicin doses (100, 50, 37.5, 25, or 12.5 mg/kg in 100 µL DMSO, intraperitoneal (IP)) and
the vehicle-control mice with vehicle (100 µL DMSO, IP). Then, the mice were anesthetized
and a PE10 tubing was placed intravenously. 200 µL (37-74 MBq; 2 mg MEB) [99mTc]MEB
was injected directly after scan initation. During tracer injection, a second dose of rifampicin
(25, 12.5, 9.37, 6.25, or 3.12 mg/kg in 100 µL PEG400:saline, 30:70, v:v) or vehicle (100 µL
PEG400:saline, 30:70, v:v) was intravenously co-administered.
In one WT animal, after anesthesia, bile duct ligatures (BDL) were placed posterior and
anterior to the gallbladder to obstruct bile flow completely (Figure 5.2). Immediately after
surgery, a PE10 tubing was placed in a lateral tail vein and the bile duct-ligated mouse was
placed in a supine position on the mouse scan bed. [99mTc]MEB was injected via the
intravenous PE10 tubing, directly after scan initiation.
Figure 5.2: Placement of a bile duct ligature in a mouse. The ligature is placed around the bile duct.
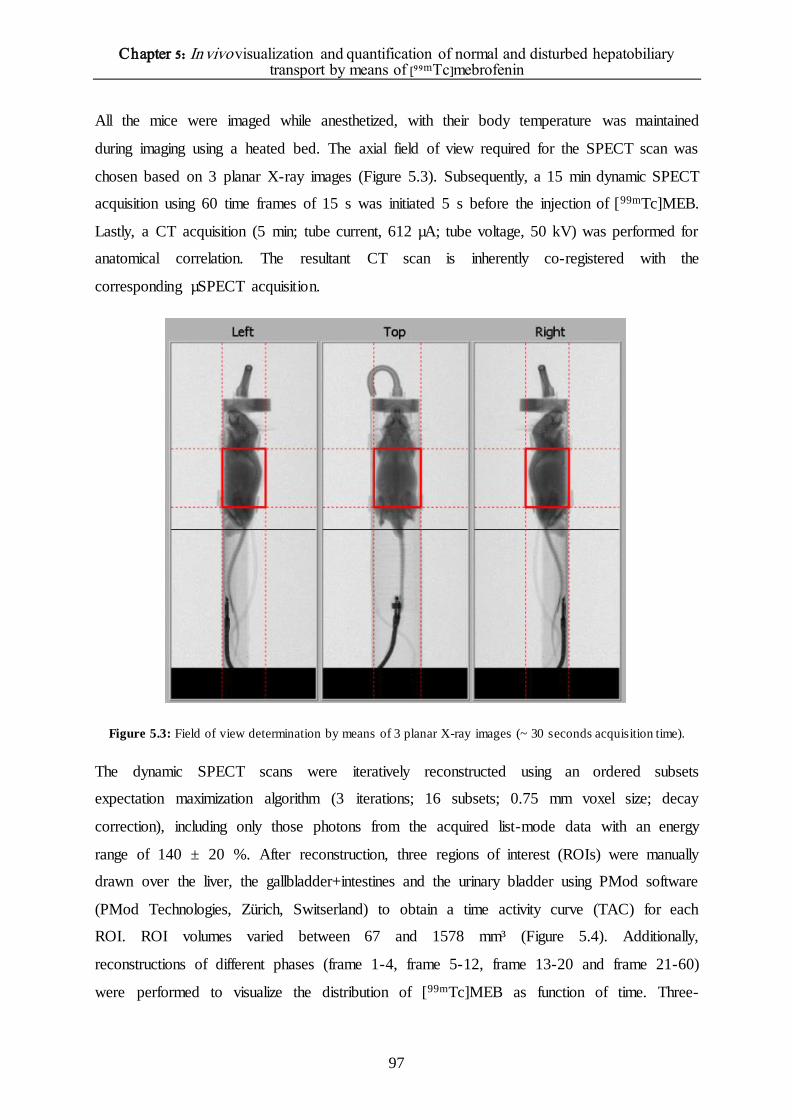
Chapter 5: In vivo visualization and quantification of normal and disturbed hepatobiliary transport by means of [99mTc]mebrofenin
97
All the mice were imaged while anesthetized, with their body temperature was maintained
during imaging using a heated bed. The axial field of view required for the SPECT scan was
chosen based on 3 planar X-ray images (Figure 5.3). Subsequently, a 15 min dynamic SPECT
acquisition using 60 time frames of 15 s was initiated 5 s before the injection of [99mTc]MEB.
Lastly, a CT acquisition (5 min; tube current, 612 µA; tube voltage, 50 kV) was performed for
anatomical correlation. The resultant CT scan is inherently co-registered with the
corresponding µSPECT acquisition.
Figure 5.3: Field of view determination by means of 3 planar X-ray images (~ 30 seconds acquisition time).
The dynamic SPECT scans were iteratively reconstructed using an ordered subsets
expectation maximization algorithm (3 iterations; 16 subsets; 0.75 mm voxel size; decay
correction), including only those photons from the acquired list-mode data with an energy
range of 140 ± 20 %. After reconstruction, three regions of interest (ROIs) were manually
drawn over the liver, the gallbladder+intestines and the urinary bladder using PMod software
(PMod Technologies, Zürich, Switserland) to obtain a time activity curve (TAC) for each
ROI. ROI volumes varied between 67 and 1578 mm³ (Figure 5.4). Additionally,
reconstructions of different phases (frame 1-4, frame 5-12, frame 13-20 and frame 21-60)
were performed to visualize the distribution of [99mTc]MEB as function of time. Three-

Chapter 5: In vivo visualization and quantification of normal and disturbed hepatobiliary transport by means of [99mTc]mebrofenin
98
dimensional projection images of the co-registered CT and µSPECT images were performed
using ImageJ software.
Figure 5.4: ROI determination using the PMOD software. Coronal views of the sum of the 10 first frames (2.5
minutes; A) and all 60 frames (0-15minutes; B). The sum of the first 10 frames can be used to draw the ROI
around the liver (blue), the sum of all the frames can be used to draw the ROI around the gallbladder and
intestines (red).
For WT mice, the interanimal and intra-animal variation was investigated, to determine the
reproducibility of the imaging experiments.
The total activity in each organ, expressed in MBq (normalized to an injection of 37 MBq and
a mouse weight of 20 g), was expressed as a function of time (in seconds).
Determination of the [99mTc]mebrofenin blood curve
After an overnight fast, the mice were injected with 200 µL of [99mTc]MEB (2.7 mg, 74 MBq)
through a lateral tail vein. Blood samples (30 µL) were taken by intravenous puncture in the
contralateral tail vein at 1, 2, 5, 7, 10, and 15 min post-injection. The radioactivity in these
samples was counted in a calibrated NaI(Tl) scintillation counter (Perkin Elmer, Belgium). A
calibration curve was used to determine the activity in MBq.
To determine the blood curve of rifampicin-treated mice, the animals were pre-treated with
the drug (100, 50, 37.5, 25, or 12.5 mg/kg in 100 µL DMSO, IP) or with vehicle (100 µL
DMSO). Rifampicin (25, 12.5, 9.37, 6.25, or 3.12 mg/kg in 100 µL PEG400:saline, 30:70,

Chapter 5: In vivo visualization and quantification of normal and disturbed hepatobiliary transport by means of [99mTc]mebrofenin
99
v:v) or vehicle was also co-injected with the tracer. Blood samples were then taken as
described above and used to determine the % injected dose per gram blood (%ID/g) in
function of time, to calculate the area under the blood curve (AUCblood curve) and the T1/2 values
of the distribution and elimination× phases, T1/2,α and T1/2,β, respectively.
Statistical and kinetic analysis
Statistical analysis was performed using Prism, version 3.00 (GraphPad), and SPSS, version
19, for Windows (Microsoft). The TACs were described by calculating the maximal activity
in liver and gallbladder, time-to-peak of the liver (i.e. the time point at which the maximal
tracer amount or plateau was reached), and AUC liver and AUCgallbladder+intestines. Additionally, as
a measure of Mrp2 transport, the tracer emergence time in the gallbladder was determined,
defined as the time point when radioactivity in the gallbladder appeared in the dynamic
SPECT data. AUCs were calculated using the trapezoidal method. To obtain rifampicin dose–
response curves, time-to-peak of the liver and AUCgallbladder+intestines were expressed as a
function of the administered doses. Time-to-peak of the liver was a measure of [99mTc]MEB
uptake and AUCgallbladder+intestines a measure of [99mTc]MEB efflux. Bi-exponential curve fitting
was applied to generate the blood curves. T1/2 values were computed using the method of least
squares.
𝐶𝑝 = 𝐶1𝑒−𝛼𝑡 + 𝐶2𝑒−𝛽𝑡
Clearance values were calculated according to Ghibellini et al. (Ghibellini et al., 2004;
Ghibellini et al., 2008).
𝑇𝑜𝑡𝑎𝑙 𝑐𝑙𝑒𝑎𝑟𝑎𝑛𝑐𝑒 =𝐷𝑜𝑠𝑒
𝐴𝑈𝐶𝑏𝑙𝑜𝑜𝑑 ,0→∞
𝐻𝑒𝑝𝑎𝑡𝑖𝑐 𝑐𝑙𝑒𝑎𝑟𝑎𝑛𝑐𝑒 = 𝐶𝑢𝑚𝑢𝑙𝑎𝑡𝑖𝑣𝑒 𝑎𝑚𝑜𝑢𝑛𝑡 𝑖𝑛 𝑙𝑖𝑣𝑒𝑟
𝐴𝑈𝐶𝑏𝑙𝑜𝑜𝑑,0→180
𝐵𝑖𝑙𝑖𝑎𝑟𝑦 𝑐𝑙𝑒𝑎𝑟𝑎𝑛𝑐𝑒 = 𝐶𝑢𝑚𝑢𝑙𝑎𝑡𝑖𝑣𝑒 𝑎𝑚𝑜𝑢𝑛𝑡 𝑖𝑛 𝐺𝐵 + 𝐼
𝐴𝑈𝐶𝑏𝑙𝑜𝑜𝑑 ,0→180
Differences between two groups were tested for significance using the nonparametric Mann–
Whitney test for two groups. All experiments were performed at n=3 (unless stated
otherwise); P ≤ 0.05 was considered significant.

Chapter 5: In vivo visualization and quantification of normal and disturbed hepatobiliary transport by means of [99mTc]mebrofenin
100
Results
In vitro assessment of the potential role of OCT1
Small-scale in vitro experiments using stably transfected cells and parental or mock-
transfected controls confirmed the OATP1B1- and OATP1B3-mediated transport of
[99mTc]MEB and a lack of detectable transport by NTCP (Figure 5.6) (Ghibellini et al., 2008;
Lengyel et al., 2008). Not unexpectedly, in the transfected cells OCT1-mediated transport of
[99mTc]MEB could not be demonstrated, whereas 14C-TEA uptake was 33 ± 6.0-fold higher
than in the parental controls (Figure 5.5).
Figure 5.5: Positive controls: (A) 3H-taurocholate uptake (A), 14C-tetra-ethyl-ammonium uptake (B) and 3H-
estradiol-17β-glucuronide uptake (C, D) (n=3).

Chapter 5: In vivo visualization and quantification of normal and disturbed hepatobiliary transport by means of [99mTc]mebrofenin
101
Figure 5.6: [99mTc]MEB uptake in function of time. The tracer is only transported through OATP1B1 and
OATP1B3. Data are mean±SD (n=3).
Interanimal and intra-animal variation of the dynamic µSPECT
acquisitions
Interanimal variation
In order to investigate the variation between several animals; we imaged 3 WT animals on the
same day. The time activity curves are displayed in Figure 5.7, and the corresponding metrics
with their mean, standard deviation (SD) and coefficient of variation (% CV) are shown in
Table 5.1. The coefficient of variation was maximally 11.5%.
Figure 5.7: TACs of [99mTc]MEB in the liver (A) and gallbladder and intestines (B) of 3 wild type FVB mice.
Mice were imaged on the same day.

Chapter 5: In vivo visualization and quantification of normal and disturbed hepatobiliary transport by means of [99mTc]mebrofenin
102
Table 5.1: Metrics of the time activity curves of [99mTc]MEB of 3 wild type mice
Mouse 1 Mouse 2 Mouse 3 Mean SD % CV
Maximal activity liver (MBq) 22.61 21.14 23.26 22.34 1.09 4.87
Time to peak liver (seconds) 143 128 157 143 15 10.5
AUC liver (MBq*sec) 7786 6718 6920 7141 821 11.5
Maximal activity
gallbladder+intestines (MBq)
30.59 31.16 30.91 30.90 0.30 1.00
AUC gallbladder+intestines
(MBq*sec)
17290 18900 17810 18000 821 4.56
Intra-animal variation of the dynamic µSPECT acquisitions
In order to investigate the variation within one animal; we imaged one animal on 3 different
days. The time activity curves and corresponding metrics are shown in Figure 5.8 and Table
5.2, respectively. The coefficient of variance was maximally 12.6%.
Figure 5.8: TACs of [99mTc]MEB in the liver (A) and gallbladder and intestines (B) of one mouse (Mouse 3) on
three different days.

Chapter 5: In vivo visualization and quantification of normal and disturbed hepatobiliary transport by means of [99mTc]mebrofenin
103
Table 5.2: Metrics of the time activity curves of [99mTc]MEB of one WT mouse (Mouse 3) on three different
days
Day 1 Day 2 Day 3 Mean SD % CV
Maximal activity liver (MBq) 18.96 23.17 23.26 21.80 2.46 11.28
Time to peak liver (seconds) 158 158 158 158 0 0
AUC liver (MBq × sec) 6344 8128 6920 7130 910 12.6
Maximal activity
gallbladder+intestines (MBq)
31.37 32.46 30.91 31.58 0.80 2.5
AUC gallbladder+intestines
(MBq × sec)
19960 19480 17810 19083 1128 5.9
Wild-type FVB mice
Figure 5.9 shows the projection images of the co-registered CT and SPECT images of the first
four time frames (Figure 5.9 A, 0-1 minutes), frame 5-12 (Figure 5.9 B, 1-3 minutes), frame
13-20 (Figure 5.9 C, 3-5 minutes) and frame 21-60 (Figure 5.9 D, 5-15 minutes). In the first
minute, after injection, mainly the blood pool is visible, including the abdominal aorta and the
heart. In the next phase (1-3 minutes), mainly the liver is visible, which can be explained by
the fact that [99mTc]MEB is taken up from the blood into the hepatocytes. Additionally, the
gallbladder can be observed, indicating that the efflux is already initiated. Then (3-5 minutes),
the liver, gallbladder and intestines are visible, indicating efflux. In the last phase (5-15
minutes), only the intestines are visible, indicating that all the radioactivity is transported to
the intestines.
Figure 5.10 depicts the mean TACs of [99mTc]MEB of 3 WT FVB mice. Corresponding
metrics are shown in Table 5.3. The maximal activity in the liver (19.2 ± 2.4 MBq) was
reached after 134 ± 41 s (time-to-peak liver) and was followed by a rapid exponential decrease
to the background level within 15 min (900 s). According to the dynamic SPECT data, the
mean appearance time of [99mTc]MEB in the gallbladder was 147 ± 26 s (Table 5.3). At the
end of the acquisition, the majority of [99mTc]MEB was found in the intestines.
The venous blood curve was consistent with a two-phase model, characterized by an initial
rapid decline of the radiopharmaceutical from the blood (distribution phase), with a T1/2,α of
17 ± 2 s, due to its distribution within the vascular space and the high extraction rate of

Chapter 5: In vivo visualization and quantification of normal and disturbed hepatobiliary transport by means of [99mTc]mebrofenin
104
[99mTc]MEB by the liver. This initial decline was followed by a slower decline (elimination
phase) with a T1/2,β of 332 ± 121 s (Table 5.3).
Figure 5.9: Projection images of co-registered CT and µSPECT images of [99mTc]MEB of WT mouse of the first
minute (A, frame 1-4); 1-3 minutes (B, frame 5-12), 3-5 minutes (C, frame 13-20); and the last 10 minutes (D,
frame 21-60). 1= heart; 2= abdominal aorta; 3= liver; 4= gallbladder; 5= intestines.

Chapter 5: In vivo visualization and quantification of normal and disturbed hepatobiliary transport by means of [99mTc]mebrofenin
105
Figure 5.10: Mean TACs ±SD (n=3) of [99mTc]MEB in wild type mice. TACliver and TACgallbladder+intestines are
expressed in MBq. Blood curves are expressed in %ID/g.
Bile duct ligature: proof-of-principle
Next, we investigated the effect of complete obstructive cholestasis, induced by BDL in a WT
animal, on [99mTc]MEB transport (Figure 5.11, Figure 5.12).
The effect of BDL, i.e., obstructive cholestasis and thus a higher concentration of
[99mTc]MEB in the liver, is clearly seen by comparing Figure 5.10 with Figure 5.12. While in
the TAC of WT mice a peak in the liver was followed by a rapid decrease to background
levels, in the TAC of the BDL animal there was a continuous increase of [99mTc]MEB uptake
in the liver, with a maximum of 28.39 MBq. The tracer was not subsequently cleared but
instead remained in the liver until the end of the SPECT scan. Expressed as AUC liver (MBq ×
s), the activity in the liver of the BDL animal was 3.5-fold higher than that in non-treated
animals (non-BDL and BDL: 6417 MBq × s and 22202 MBq × s, respectively). The
AUCgallbladder+intestines was 17808 MBq × s in the non-treated animal and undetectable in the
BDL animal. Taken together, the total activity in the liver and gallbladder+intestines was
nearly identical in the two treatment groups (non-BDL 24225 MBq × s versus BDL 22202
MBq × s).

Chapter 5: In vivo visualization and quantification of normal and disturbed hepatobiliary transport by means of [99mTc]mebrofenin
106
Figure 5.11: Projection images of co-registered CT and µSPECT images of [99mTc]MEB of a mouse with a bile
duct ligature of the first minute (A, frame 1-4); 1-3 minutes (B, frame 5-12), 3-5 minutes (C, frame 13-20); and
the last 10 minutes (D, frame 21-60). 1= heart; 2= abdominal aorta; 3= liver; 4= gallbladder; 5= intestines.
Figure 5.12: Proof of principle: TAC (n=1) of [99mTc]MEB in 1 bile duct ligated mouse. TACliver is expressed in
MBq.

Chapter 5: In vivo visualization and quantification of normal and disturbed hepatobiliary transport by means of [99mTc]mebrofenin
107
Role of Oatp1a/1b transporters in the hepatic transport of
[99mTc]mebrofenin
Subsequently, the relative role of the uptake transporter family Slc01a/1b on the hepatic
handling of [99mTc]MEB was determined. The projection images of the different phases are
shown in Figure 5.13. The majority of the tracers remains in the blood pool. The mean TACs
of the Oatp1a/1b KO animals are shown in Figure 5.14.
The majority of [99mTc]MEB activity was located in the blood and urinary bladder, with only
a small amount of activity detected in the liver. [99mTc]MEB levels in the
gallbladder+intestines did not exceed the limit of quantification. This was in contrast to the
WT mice, in which the majority of the [99mTc]MEB was found in the gallbladder+intestines.
Specifically, the mean TACliver of the Oatp1a/1b KO mice did not exceed baseline levels. The
AUCliver was 3.4-fold lower in Oatp1a/1b KO mice than in WT animals (p= 0.014) (Table
5.3). At the final time point, 3.6±1.5% of the injected dose was present in the urinary bladder.
In the blood, the mean AUC in the Oatp1a/1b KO mice was 5.1-fold larger than in their WT
counterparts (p≤0.05) (Figure 5.14, Table 5.3). Hepatic clearance was lower compared to WT
mice.

Chapter 5: In vivo visualization and quantification of normal and disturbed hepatobiliary transport by means of [99mTc]mebrofenin
108
Figure 5.13: Projection images of co-registered CT and µSPECT images of [99mTc]MEB of an Oatp1a/1b KO
mouse of the first minute (A, frame 1-4); 1-3 minutes (B, frame 5-12), 3-5 minutes (C, frame 13-20); and the last
10 minutes (D, frame 21-60). 1= heart; 2= abdominal aorta.
Figure 5.14: Mean TACs ± SD (n=3) of [99mTc]MEB in Oatp1a/1b KO mice. TACliver and TACurinary bladder are
expressed in MBq. Blood curves are expressed in %ID/g.
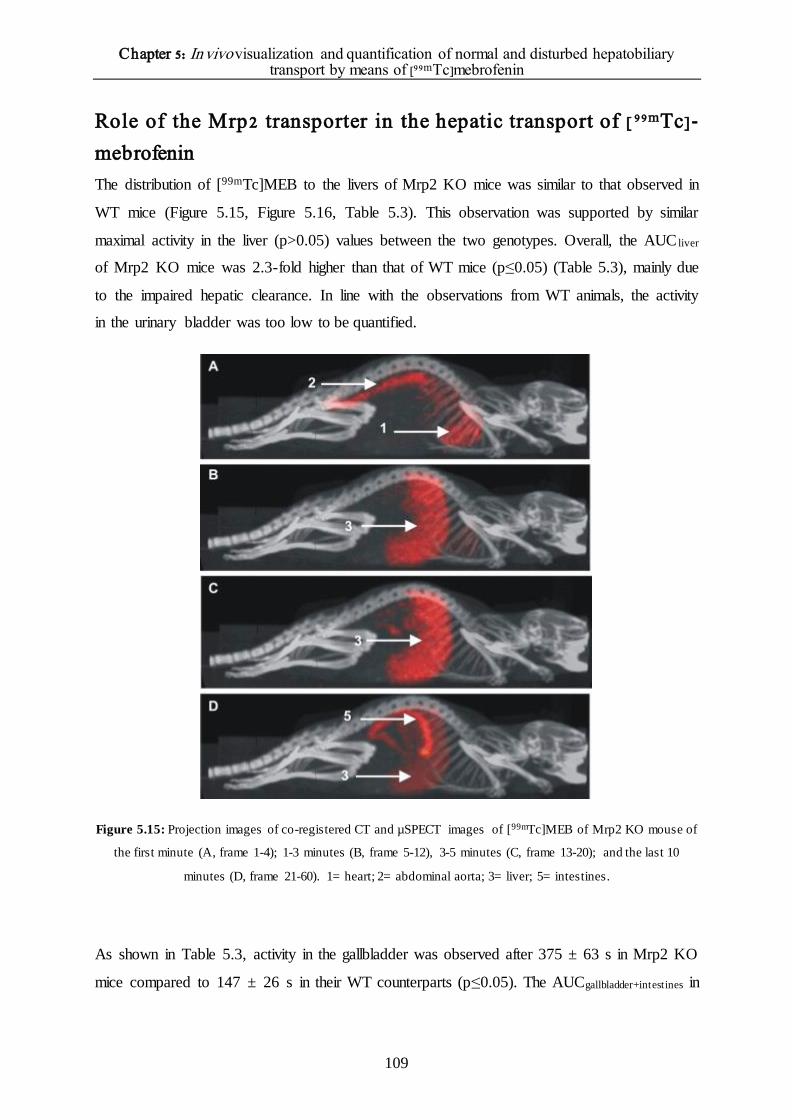
Chapter 5: In vivo visualization and quantification of normal and disturbed hepatobiliary transport by means of [99mTc]mebrofenin
109
Role of the Mrp2 transporter in the hepatic transport of [ 99mTc]-
mebrofenin
The distribution of [99mTc]MEB to the livers of Mrp2 KO mice was similar to that observed in
WT mice (Figure 5.15, Figure 5.16, Table 5.3). This observation was supported by similar
maximal activity in the liver (p>0.05) values between the two genotypes. Overall, the AUC liver
of Mrp2 KO mice was 2.3-fold higher than that of WT mice (p≤0.05) (Table 5.3), mainly due
to the impaired hepatic clearance. In line with the observations from WT animals, the activity
in the urinary bladder was too low to be quantified.
Figure 5.15: Projection images of co-registered CT and µSPECT images of [99mTc]MEB of Mrp2 KO mouse of
the first minute (A, frame 1-4); 1-3 minutes (B, frame 5-12), 3-5 minutes (C, frame 13-20); and the last 10
minutes (D, frame 21-60). 1= heart; 2= abdominal aorta; 3= liver; 5= intestines.
As shown in Table 5.3, activity in the gallbladder was observed after 375 ± 63 s in Mrp2 KO
mice compared to 147 ± 26 s in their WT counterparts (p≤0.05). The AUCgallbladder+intestines in

Chapter 5: In vivo visualization and quantification of normal and disturbed hepatobiliary transport by means of [99mTc]mebrofenin
110
the Mrp2 KO mice was 4.7-fold lower than in the WT mice (p≤0.05). Total clearance and
hepatic clearance was similar compared to WT mice. However, biliary clearance was lower.
The blood curve and corresponding metrics of the Mrp2 KO mice were comparable to those
of the WT mice (p>0.05).
Figure 5.16: Mean TACs ± SD (n=3) of [99mTc]-MEB in Mrp2 KO mice. TACliver, TACgallbladder+intestines and
TACurinary bladder are expressed in MBq. Blood curves are expressed in %ID/g.
The effect of d ifferent r ifampicin d oses o n the hepatic t ransport o f
[99mTc]mebrofenin
The data generated thus far allowed us to investigate mechanistically the role of uptake and
efflux transporters in the in vivo disposition of [99mTc]MEB. With this framework established,
we aimed to determine whether it was possible to discriminate dose-dependently between the
inhibition of hepatic uptake transporters and that of efflux transporters. Since rifampicin is
both a substrate and an inhibitor of OATPs/Oatps and MRP2/Mrp2, it was selected as the test
agent.
In Figure 5.17, the projection images of the co-registered CT and µSPECT acquisitions are
shown. Again, divided in different phases.
The mean TACs of the vehicle-control and rifampicin-treated (highest dose, 100 mg/kg IP, 25
mg/kg IV) mice are shown in Figure 5.18A and Figure 5.18B, respectively. In the control

Chapter 5: In vivo visualization and quantification of normal and disturbed hepatobiliary transport by means of [99mTc]mebrofenin
111
mice, the TACs were similar to those of the untreated WT mice. The metrics of the different
rifampicin doses are shown in Table 5.3.
Figure 5.17: Projection images of co-registered CT and µSPECT image of [99mTc]MEB of a rifampicin treated
mouse of the first minute (A, frame 1-4); 1-3 minutes (B, frame 5-12), 3-5 minutes (C, frame 13-20); and the last
10 minutes (D, frame 21-60). 1= heart; 2= abdominal aorta; 3= liver; 5= intestines.
Figure 5.18: Mean TACs ±SD in the vehicle-control mice (n=3) (A) and in rifampicin-treated mice (n=3) (B).
TACliver, TACgallbladder+intestines, and TACurinary bladder are expressed in MBq. Blood curves are expressed in %ID/g.
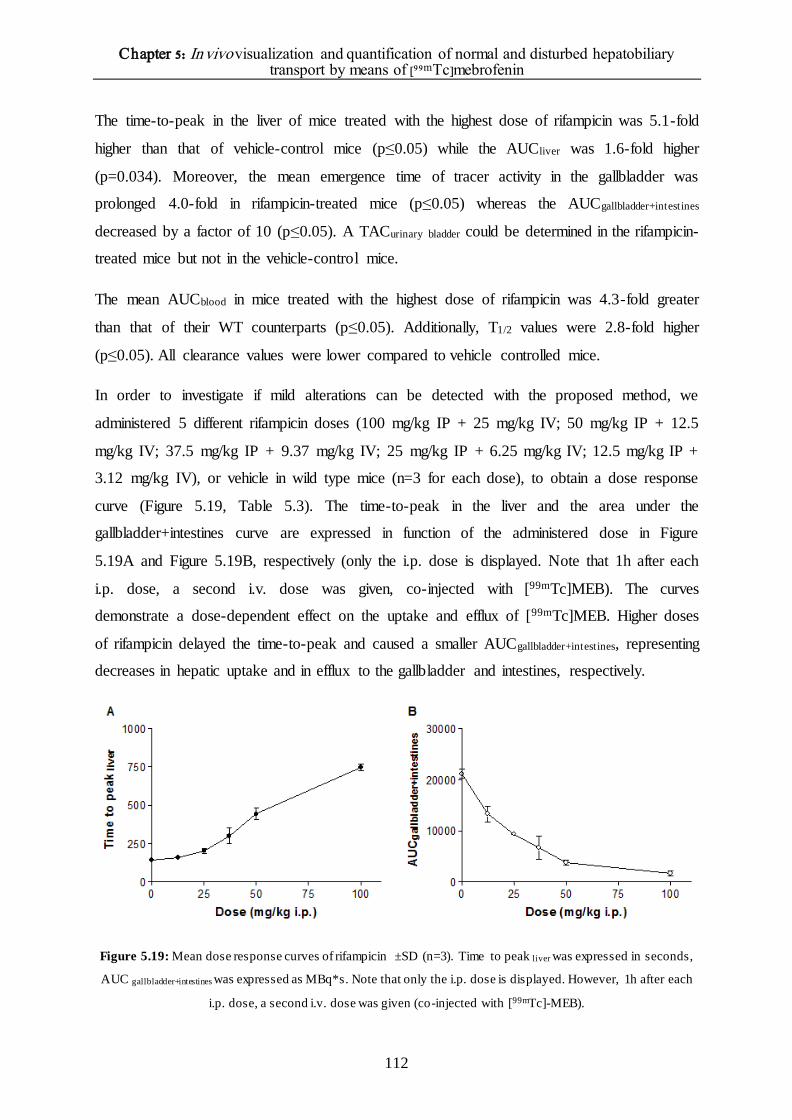
Chapter 5: In vivo visualization and quantification of normal and disturbed hepatobiliary transport by means of [99mTc]mebrofenin
112
The time-to-peak in the liver of mice treated with the highest dose of rifampicin was 5.1-fold
higher than that of vehicle-control mice (p≤0.05) while the AUCliver was 1.6-fold higher
(p=0.034). Moreover, the mean emergence time of tracer activity in the gallbladder was
prolonged 4.0-fold in rifampicin-treated mice (p≤0.05) whereas the AUCgallbladder+intestines
decreased by a factor of 10 (p≤0.05). A TACurinary bladder could be determined in the rifampicin-
treated mice but not in the vehicle-control mice.
The mean AUCblood in mice treated with the highest dose of rifampicin was 4.3-fold greater
than that of their WT counterparts (p≤0.05). Additionally, T1/2 values were 2.8-fold higher
(p≤0.05). All clearance values were lower compared to vehicle controlled mice.
In order to investigate if mild alterations can be detected with the proposed method, we
administered 5 different rifampicin doses (100 mg/kg IP + 25 mg/kg IV; 50 mg/kg IP + 12.5
mg/kg IV; 37.5 mg/kg IP + 9.37 mg/kg IV; 25 mg/kg IP + 6.25 mg/kg IV; 12.5 mg/kg IP +
3.12 mg/kg IV), or vehicle in wild type mice (n=3 for each dose), to obtain a dose response
curve (Figure 5.19, Table 5.3). The time-to-peak in the liver and the area under the
gallbladder+intestines curve are expressed in function of the administered dose in Figure
5.19A and Figure 5.19B, respectively (only the i.p. dose is displayed. Note that 1h after each
i.p. dose, a second i.v. dose was given, co-injected with [99mTc]MEB). The curves
demonstrate a dose-dependent effect on the uptake and efflux of [99mTc]MEB. Higher doses
of rifampicin delayed the time-to-peak and caused a smaller AUCgallbladder+intestines, representing
decreases in hepatic uptake and in efflux to the gallbladder and intestines, respectively.
Figure 5.19: Mean dose response curves of rifampicin ±SD (n=3). Time to peak liver was expressed in seconds,
AUC gallbladder+intestines was expressed as MBq*s. Note that only the i.p. dose is displayed. However, 1h after each
i.p. dose, a second i.v. dose was given (co-injected with [99mTc]-MEB).
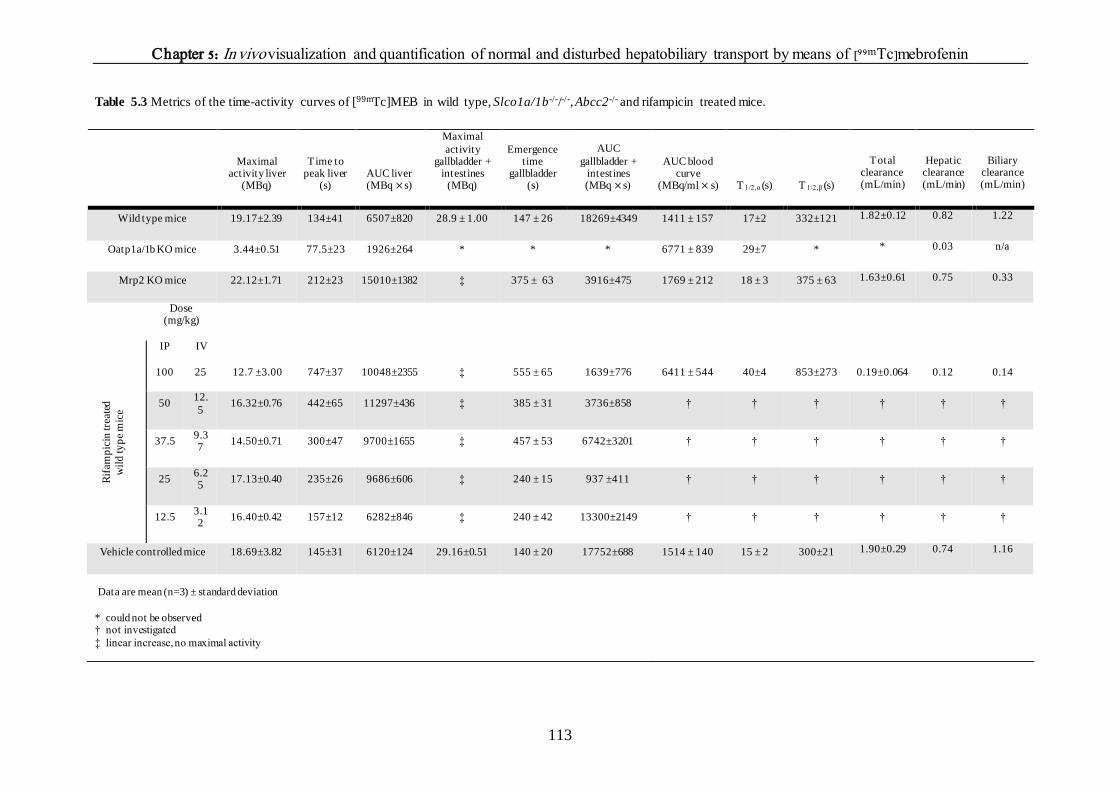
Chapter 5: In vivo visualization and quantification of normal and disturbed hepatobiliary transport by means of [99mTc]mebrofenin
113
Table 5.3 Metrics of the time-activity curves of [99mTc]MEB in wild type, Slco1a/1b-/-/-/-, Abcc2-/- and rifampicin treated mice.
Maximal activity liver
(MBq)
T ime to peak liver
(s) AUC liver (MBq × s)
Maximal
activity gallbladder +
intestines (MBq)
Emergence time
gallbladder (s)
AUC
gallbladder + intestines (MBq × s)
AUC blood curve
(MBq/ml × s) T 1/2,α (s) T 1/2,β (s)
Total clearance (mL/min)
Hepatic clearance (mL/min)
Biliary clearance (mL/min)
Wild type mice 19.17±2.39 134±41 6507±820 28.9 ± 1.00 147 ± 26 18269±4349 1411 ± 157 17±2 332±121 1.82±0.12 0.82 1.22
Oatp1a/1b KO mice 3.44±0.51 77.5±23 1926±264 * * * 6771 ± 839 29±7 * * 0.03 n/a
Mrp2 KO mice 22.12±1.71 212±23 15010±1382 ‡ 375 ± 63 3916±475 1769 ± 212 18 ± 3 375 ± 63 1.63±0.61 0.75 0.33
Dose (mg/kg)
Rif
amp
icin
tre
ated
wil
d ty
pe
mic
e
IP IV
100 25 12.7 ±3.00 747±37 10048±2355 ‡ 555 ± 65 1639±776 6411 ± 544 40±4 853±273 0.19±0.064 0.12 0.14
50 12.
5 16.32±0.76 442±65 11297±436 ‡ 385 ± 31 3736±858 † † † † † †
37.5 9.37
14.50±0.71 300±47 9700±1655 ‡ 457 ± 53 6742±3201 † † † † † †
25 6.25
17.13±0.40 235±26 9686±606 ‡ 240 ± 15 937 ±411 † † † † † †
12.5 3.12
16.40±0.42 157±12 6282±846 ‡ 240 ± 42 13300±2149 † † † † † †
Vehicle controlled mice 18.69±3.82 145±31 6120±124 29.16±0.51 140 ± 20 17752±688 1514 ± 140 15 ± 2 300±21 1.90±0.29 0.74 1.16
Data are mean (n=3) ± standard deviation
* could not be observed † not investigated
‡ linear increase, no maximal activity

Chapter 5: In vivo visualization and quantification of normal and disturbed hepatobiliary transport by means of [99mTc]mebrofenin
114
Discussion Drug-induced liver injury is one of the leading causes for the withdrawal of approved drugs
from the market (Maddrey et al., 2005), highlighting the importance of assessing this effect
early on in drug research. One of the underlying causes of drug-induced liver injury is an
altered functional activity of hepatic uptake or efflux transporters. In this study, we
investigated [99mTc]MEB transport through Oatp and Mrp2. Based on the results, we were
able to propose a non-invasive method to visualize and quantify altered hepatobiliary
transporter activity. Moreover, the proposed method enables the differentiation between
altered influx and efflux. By using dynamic SPECT measurements to calculate TACs of
[99mTc]MEB that quantify transport via the liver to the gallbladder and intestines, our method
offers a novel approach, as thus far it has not been possible either to visualize or quantify in
vivo hepatic drug interactions and the differentiation between uptake and efflux alterations.
First, the specificity for [99mTc]MEB for the human transport proteins was investigated by
means of CHO cell lines expressing these human transporters. Our data confirmed the results
of Ghibellini et al. that identified OATP1B1 and OATP1B3 as uptake transporters of
[99mTc]MEB (Ghibellini et al.; 2008). Additionally, the current study was able to exclude
OCT1 as a [99mTc]MEB transporter.
Then, we clearly demonstrated the possibility to non-invasively visualize and quantify the in
vivo hepatobiliary transport in a reproducible manner. Repeated measurements were
performed in different animals and on different days. Out of these measurements, TACs were
calculated to quantify the transport over the liver or in the gallbladder and intestines. The
ROIs of the gallbladder and intestines were considered together as one ROI. The rationale
behind this is the common bile duct, forming a direct connection between the liver and
intestines. As a consequence, not all the bile flow to the gallbladder for temporary storage, but
some bile flow directly to the intestines. The interanimal and the intra-animal measurements
of the maximal activity in the liver and areas under the curve were not significantly different.
Furthermore, the coefficient of variation did not exceed 13%. Consequently, these results
indicate that it is possible to visualize and quantify the activity of hepatic transporters with
[99mTc]MEB in a reproducible manner. Secondly, we set out a mean TAC of the liver and
gallbladder+intestines in wild type FVB mice. Significant differences in the following
experiments will be due to altered hepatobiliary transport.

Chapter 5: In vivo visualization and quantification of normal and disturbed hepatobiliary transport by means of [99mTc]mebrofenin
115
The primary aim of our study was the visualization of disturbed hepatobiliary transporter
function. As proof-of-principle, a BDL was placed so as to simulate extrahepatic cholestasis.
This mechanical inhibition caused the complete obstruction of bile flow and subsequently the
accumulation of [99mTc]MEB in the liver, thus demonstrating the ability of the proposed
method to visualize and quantify disturbances in hepatobiliary transport.
To examine the possibility of distinguishing between uptake and efflux transporter alterations,
Oatp1a/1b KO and Mrp2 KO mice were investigated. Experiments in the Oatp1a/1b KO mice
confirmed the critical role played by transporters of the Oatp1a/1b family in the hepatic
uptake of [99mTc]MEB, consistent with the findings of Van de Steeg et al. (Van de Steeg et al.,
2010). The liver TACs of Oatp1a/1b KO mice did not exceed baseline levels, due to the
impaired hepatic uptake of [99mTc]MEB. Consequently, blood concentrations remained
elevated in comparison with WT mice, due to absence of Oatp1a/1b.
We were also able to demonstrate in vivo that the biliary efflux transporter Mrp2 is involved
in [99mTc]MEB transport. Specifically, in Mrp2 KO mice the absence of the efflux transporter
led to the hepatic accumulation of [99mTc]MEB, reflected in a higher AUCliver. Consequently,
less [99mTc]MEB reached the gallbladder and intestines, resulting in a lower
AUCgallbladder+intestines and a delayed tracer emergence time. The corresponding blood
concentrations were comparable to those of the WT animals, since hepatic uptake was not
disturbed.
To assess the effect of pharmacological inhibition on transporter activity, rifampicin was
administered to WT mice, by both the IP and the IV routes. This double administration led to
the impaired uptake and efflux of [99mTc]MEB. Inhibition of [99mTc]MEB uptake occurs at the
level of the basolateral (sinusoidal) Oatps, with rifampicin acting as a competitive inhibitor of
the transporters (Vavricka et al., 2002). Since hepatic uptake was impaired, the time-to-peak
in the liver of [99mTc]MEB was delayed and blood concentrations of the tracer were elevated.
Additionally, urinary elimination of [99mTc]MEB was increased in rifampicin-treated mice.
This increase in renal excretion reflected the decreased uptake of [99mTc]MEB through
Oatp1a/1b and the increased blood concentrations (higher AUCblood). Rifampicin is both a
substrate and an inhibitor of Oatps. Therefore, a certain amount of rifampicin is able to enter
the hepatocytes, where it inhibits the Mrp2 transporter at the level of the canalicular
membrane. Consequently, an accumulation of [99mTc]MEB in the liver (higher AUCliver) can
be detected whereas the decreased amounts of [99mTc]MEB in the intestines are due to a

Chapter 5: In vivo visualization and quantification of normal and disturbed hepatobiliary transport by means of [99mTc]mebrofenin
116
combination of Oatp and Mrp2 inhibition (lower AUCgallbladder+intestines). These observations
suggest that the impaired liver uptake and efflux is caused by a combination of rifampicin-
mediated Oatp1a/1b and Mrp2 inhibition (Lengyel et al., 2008; Mita et al., 2006). To the best
of our knowledge, Mrp2 inhibition has not been previously shown in vivo. Our study
demonstrates the feasibility of visualizing and quantifying the effect of Oatp1a/1b and Mrp2
modulation by various drugs in vivo, with rifampicin as a model drug, and confirms the
findings of Van de Steeg et al. (Van de Steeg et al., 2010) with methotrexate and tritium-
labeled fexofenadine.
Additionally, we were able to show that slight alterations in transporter activity can be
detected with the proposed imaging method. Using five different rifampicin doses, a dose-
response curve of the rifampicin-mediated inhibition of [99mTc]MEB transport was obtained.
The data demonstrated a dose-dependent effect on the uptake and efflux of [99mTc]MEB.
Higher doses of rifampicin delayed time-to-peak in the liver and caused a smaller
AUCgallbladder+intestines, representing decreases in hepatic uptake and in efflux to the gallbladder
and intestines, respectively. While Mrp2 inhibition occurred at low rifampicin concentrations
(12.5 mg/kg IP, 6.25 mg/kg IV), Oatp inhibition was seen at higher concentrations of the drug
(37.5 mg/kg IP, 9.37 mg/kg IV).
In summary, this study shows that it is possible to quantitatively discriminate between the
lack of functional activity of sinusoidal uptake and that of biliary efflux transporters.
Therefore, the method described in this chapter offers a promising approach to investigate the
interaction between new chemical entities and hepatobiliary transporters.

Chapter 5: In vivo visualization and quantification of normal and disturbed hepatobiliary transport by means of [99mTc]mebrofenin
117
References Billinghurst MW, Eckert K, Mang'era K. Alternative quality control for technetium-99m IDA complexes. Appl
Radiat Isot 2004;61:1151-1155.
Bujanover Y, Bar-Meir S, Hayman I, Baron J. 99mTc-HIDA cholescintigraphy in children with Dubin-Johnson
syndrome. J Pediatr Gastroenterol Nutr 1983;2:311-2.
de Graaf W, Häusler S, Heger M, et al. Transporters involved in the hepatic uptake 99mTc-mebrofenin and
indocyanine green. . J Hepatol 2011;54:738-745.
Ghibellini G, Leslie EM, Pollack GM, Brouwer KLR. Use of Tc-99m Mebrofenin as a Clinical Probe to Assess
Altered Hepatobiliary Transport: Integration of In vitro, Pharmacokinetic Modeling, and Simulation Studies.
Pharm Res 2008;25:1851-60.
Kosters, A, Karpen SJ. Bile acid transporters in health and disease. Xenobiotica 2008;38:1043-1071.
Kullak-Ublick G, Beuers U, Paumgartner G. Hepatobiliary transport. J Hepatol 2000;32:3-18.
Kullak-Ublick GA, Stieger B, Hagenbuch B, Meier PJ. Hepatic transport of bile salts. Semin Liver Dis
2000;273-92.
Lengyel G, Veres Z, Tugyi R, et al. Modulation of sinusoidal and canalicular elimination of bilirubin -
glucoronides by rifampicin and other cholestatic drugs in a sandwich culture of rat hepatocytes. Hepatol Res
2008;38:300-309.
Maddrey WC. Drug-induced hepatotoxicity. J Clin Gastroenterol 2005;39:S83-S89.
Meier PJ, Stieger B. Bile salt transporters. Annu Rev Physiol 2002;64:635-61.
Mita S, Suzuki H, Akita H, Hayashi H, Onuki R, Hofmann AF, et al.. Inhibition of bile acid transport across
Na+/taurocholate cotransporting polypeptide (SLC10A1) and bile salt export pump (ABCB 11)-coexpressing
LLC-PK1 cells by cholestasis-inducing drugs. Drug Metab Dispos 2006;34:1575-81.
Morandi F, Frank N, Avenell J, Daniel GB. Quantitative assessment of hepatic function by means of 99m Tc-
Mebrofenin in healthy horses. J Vet Intern Med 2005;19:751-5.
Newell SM, Graham JP, Roberts GD, et al. Quantitative hepatobiliary scintigraphy in normal cats and in cats
with experimental cholangiohepatitis. Vet Radiol Ultrasound 2000;42:70-6.
Padda MS, Sanchez M, Akhtar AJ, Boyer JL. Drug-induced cholestasis. Hepatology 2011;53:1377-87.
Shitara Y, Sato H, Sugiyama Y. Evaluation of Drug-Drug Interaction in the Hepatobiliary and Renal Transport
of Drugs. Annu Rev Pharmacol Toxicol 2005;45:689-723.
Trauner M, Boyer JL. Bile salt transporters: molecular characterization, function and regulation. Physiol Rev
2003;83:633-71.

Chapter 5: In vivo visualization and quantification of normal and disturbed hepatobiliary transport by means of [99mTc]mebrofenin
118
Van de Steeg E, Wagenaar E, van der Kruijssen CMM, et al. Organic anion transporting polypeptide 1a/1b–
knockout mice provide insights into hepatic handling of bilirubin, bile acids, and drugs. J Clin Invest
2010;120:2942-2952.
Vavricka SR, Van Montfoort J, Riem Ha H, Meier PJ, Fattinger K. Interactions of rifamycin SV and rifampicin
with organic anion uptake systems of human liver. Hepatology 2002;36:164-172.
Vlaming ML, Mohrmann K, Wagenaar E, et al. Carcinogen and anticancer d rug transport by Mrp2 in vivo:
studies using Mrp2 (Abcc2) knockout mice. J Pharmacol Exp Ther 2006;318:319-327.
Wolkoff, AW, DE Cohen. Bile acid regulation of hepatic physiology: Hepatocyte transport of bile acids. Am J
Physiol Gastrointest Liver Physiol 2003;284:G175-G179.
van der Have F, Vanstenhouw B, Ramakers R, Branderhorst W, Krah JO, Ji C, et al. U-SPECT-II: An ultra-high-
resolution device for molecular small-animal imaging. J Nucl Med 2009;50:599-605.

Chapter 6: Kinetic modeling of [99mTc]mebrofenin as a tool to quantify altered hepatobiliary transport
119
Chapter 6.
Kinetic modeling of
[99mTc]mebrofenin as a tool to
quantify altered hepatobiliary
transport
Parts have been adapted from
Neyt S1, Vanhove C2, De Lombaerde S1, Deblaere K3, De Vos F1. Submitted to Contrast Media Mol Imaging
2016.
1Laboratory of Radiopharmacy, Ottergemsesteenweg 460, Ghent University, Ghent, Belgium
2iMinds Medical IT-IBITech-MEDISIP-INFINITY, Ghent University, Ghent, Belgium
3 Department of Radiology, Ghent University Hospital, Ghent, Belgium

Chapter 6: Kinetic modeling of [99mTc]mebrofenin as a tool to quantify altered hepatobiliary transport
120
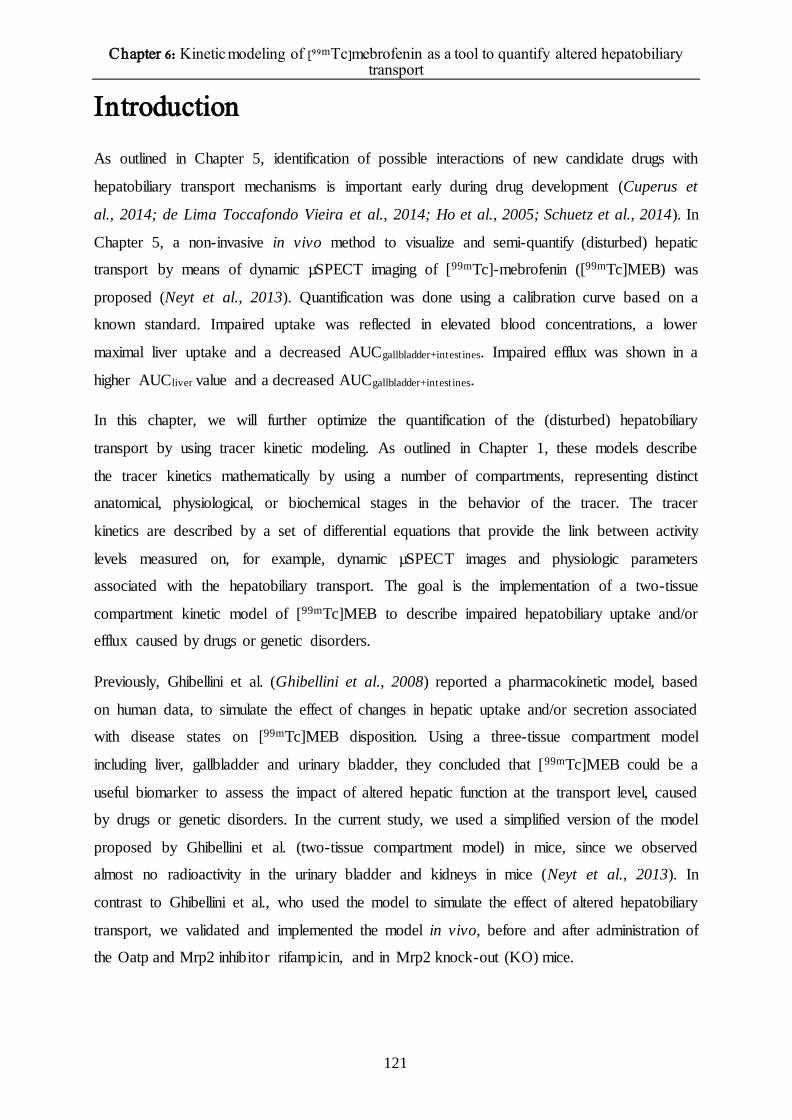
Chapter 6: Kinetic modeling of [99mTc]mebrofenin as a tool to quantify altered hepatobiliary transport
121
Introduction
As outlined in Chapter 5, identification of possible interactions of new candidate drugs with
hepatobiliary transport mechanisms is important early during drug development (Cuperus et
al., 2014; de Lima Toccafondo Vieira et al., 2014; Ho et al., 2005; Schuetz et al., 2014). In
Chapter 5, a non-invasive in vivo method to visualize and semi-quantify (disturbed) hepatic
transport by means of dynamic µSPECT imaging of [99mTc]-mebrofenin ([99mTc]MEB) was
proposed (Neyt et al., 2013). Quantification was done using a calibration curve based on a
known standard. Impaired uptake was reflected in elevated blood concentrations, a lower
maximal liver uptake and a decreased AUCgallbladder+intestines. Impaired efflux was shown in a
higher AUCliver value and a decreased AUCgallbladder+intestines.
In this chapter, we will further optimize the quantification of the (disturbed) hepatobiliary
transport by using tracer kinetic modeling. As outlined in Chapter 1, these models describe
the tracer kinetics mathematically by using a number of compartments, representing distinct
anatomical, physiological, or biochemical stages in the behavior of the tracer. The tracer
kinetics are described by a set of differential equations that provide the link between activity
levels measured on, for example, dynamic µSPECT images and physiologic parameters
associated with the hepatobiliary transport. The goal is the implementation of a two-tissue
compartment kinetic model of [99mTc]MEB to describe impaired hepatobiliary uptake and/or
efflux caused by drugs or genetic disorders.
Previously, Ghibellini et al. (Ghibellini et al., 2008) reported a pharmacokinetic model, based
on human data, to simulate the effect of changes in hepatic uptake and/or secretion associated
with disease states on [99mTc]MEB disposition. Using a three-tissue compartment model
including liver, gallbladder and urinary bladder, they concluded that [99mTc]MEB could be a
useful biomarker to assess the impact of altered hepatic function at the transport level, caused
by drugs or genetic disorders. In the current study, we used a simplified version of the model
proposed by Ghibellini et al. (two-tissue compartment model) in mice, since we observed
almost no radioactivity in the urinary bladder and kidneys in mice (Neyt et al., 2013). In
contrast to Ghibellini et al., who used the model to simulate the effect of altered hepatobiliary
transport, we validated and implemented the model in vivo, before and after administration of
the Oatp and Mrp2 inhibitor rifampicin, and in Mrp2 knock-out (KO) mice.

Chapter 6: Kinetic modeling of [99mTc]mebrofenin as a tool to quantify altered hepatobiliary transport
122
Kinetic parameters of wild type (WT), Mrp2 KO and rifampicin treated mice are compared.
The kinetic parameters can offer a detailed quantitative description of altered hepatobiliary
transport, in addition to the metrics of the time activity curves (TACs) as performed before
(Neyt et al., 2013).
Moreover, a novel non-invasive method was used to obtain an image derived input function of
[99mTc]MEB. As outlined in Chapter 1, the biggest challenge in preclinical kinetic modeling is
the determination of the arterial input function. The “gold standard” in the clinic is arterial
blood sampling. However, in rodents, invasive blood sampling is restricted to a small fraction
of the total blood (Parasuraman, 2010). According to Diehl et al. (Diehl et al., 2001), it is
limited to 7.5% of the circulatory blood volume corresponding to 100 µL for a 25g mouse.
Apart from manual sampling, automated on-line blood sampling can be used during
preclinical imaging. However, this technique only exists for tracers using positron emitters.
To generate the arterial input function in a non-invasive way, image-derived methods were
introduced that obtain the blood TACs from a region of interest (ROI) in the blood pool, such
as the left ventricular cavity. However, the definition of the heart is sometimes challenging
when no detailed anatomical information is present. Therefore, in the current study,
[99mTc]tetrofosmin was introduced as imaging agent to visualize the perfusion of the
myocardium. On the static [99mTc]tetrofosmin scan, a ROI can be drawn into the left ventricle
and this ROI can be easily copy-pasted on the dynamic [99mTc]MEB data, when
[99mTc]tetrofosmin and [99mTc]MEB are acquired sequentially without changing the position
of the animal between the two acquisitions.

Chapter 6: Kinetic modeling of [99mTc]mebrofenin as a tool to quantify altered hepatobiliary transport
123
Materials and Methods
Animal Model
FVB wild-type (WT) mice (♀, 5 weeks, 20–25 g) were from Janvier (France) and Abcc2-/-
(♀, 5 weeks, 20–25 g; Mrp2 KO mice) mice were from Taconic Farms (USA). The mice were
housed and handled according to guidelines approved by the European Ethics Committee and
acclimatized for at least one week before the experiments. All of the animals were kept under
environmentally controlled conditions (12 h normal light/dark cycles, 20–22°C and 60%
relative humidity) with food and water ad libitum. The study protocol was approved by the
Animal Experimental Ethical Committee of Ghent University (ECD10/39). n=5 per group.
Molecular Imaging
Dynamic µSPECT/CT acquisitions were acquired on a USPECT-II/CT device (MILabs,
Utrecht, The Netherlands) (van der Have et al., 2009) equipped with a cylindrical collimator
containing 75 pinholes of 1 mm diameter (rat whole-body collimator; spatial resolution, 0.8
mm). All acquisitions were acquired in list mode.
After an overnight fast (minimum 6 h), the WT and Mrp2 KO mice were anesthetized with a
mixture of isoflurane (1.5%) and medical O2 to allow placement of an intravenous needle
(30G) and polyethylene (PE10) tubing (Becton Dickinson, Belgium) in a lateral tail vein. The
mice were placed in a prone position on the mouse scan bed. 200 µL (37-74 MBq; 2 mg
MEB) [99mTc]MEB was injected via the intravenous PE10 tubing, directly after scan
initiation.
One hour before tracer injection, rifampicin-treated mice were pre-treated with rifampicin
(100 mg/kg in 100 µL DMSO, IP). Then, the mice were anesthetized and a PE10 tubing was
placed intravenously. 200 µL (37-74 MBq; 2 mg MEB) [99mTc]MEB was injected directly
after scan initation. During tracer injection, a second dose of rifampicin (25 mg/kg in 100 µL
PEG400:saline, 30:70, v:v) was intravenously co-administered.
All the mice were imaged while anesthetized, with their body temperature maintained during
imaging using a heated bed. The axial field of view required for the SPECT scan was chosen
based on 3 planar X-ray images. Subsequently, a 15 min dynamic SPECT acquisition using
60 time frames of 15 s was initiated 5 s before the injection of [99mTc]MEB.

Chapter 6: Kinetic modeling of [99mTc]mebrofenin as a tool to quantify altered hepatobiliary transport
124
Immediately after dynamic scan termination and without repositioning the animal, 185 MBq
of [99mTc]tetrofosmin was injected. 20 minutes post-injection, with the animal still in the same
position, a static SPECT scan of 30 minutes was performed. Lastly, a CT acquisition (5 min;
tube current, 612 µA; tube voltage, 50 kV) was performed for anatomical correlation. The
resultant CT scan is inherently co-registered with the corresponding µSPECT acquisition.
On the dynamic [99mTc]MEB data, ROIs were manually drawn over the liver and
gallbladder+intestines using PMOD software (PMOD technologies, Switserland). On the
static [99mTc]tetrofosmin data, a ROI was manually drawn over the left ventricle of the heart.
Since the position of the mice was unaffected between the two acquisitions, the ROI drawn
around the left ventricle (Figure 6.1), was copied to the dynamic [99mTc]MEB images to
obtain an image derived input function (IDIF) (Figure 6.2). Using the changing activity levels
measured in liver, gallbladder+intestines and blood pool, TACs were obtained.
The U-SPECT-II calibration curves (Chapter 4) were used to determine the total amount or
concentration of the radiotracer. The total activity in each organ, expressed in MBq
(normalized to an injection of 37 MBq), was expressed as a function of time (in seconds). The
image derived blood function was expressed as MBq/mL as a function of time (in seconds).
Figure 6.1: Slice through the heart on the [99mTc]tetrofosmin SPECT scan. ROI drawn around the left ventricle.
1: left ventricle; 2: right ventricle.

Chapter 6: Kinetic modeling of [99mTc]mebrofenin as a tool to quantify altered hepatobiliary transport
125
Figure 6.2: An overview of the processing used to obtain all the time activity curves that are needed to obtain a
pharmacokinetic model of [99mTc]MEB.
Correlation of image derived blood function with manual blood samples
The image derived input functions were correlated with the blood curve obtained from manual
samples (both expressed as MBq/mL).
Kinetic modeling
A two-tissue compartment kinetic model of [99mTc]MEB is used, based on the model
presented by Ghibellini et al., (Ghibellini et al., 2008) to describe impaired hepatobiliary
uptake and/or efflux caused by drugs or genetic disorders (Figure 6.3).
The differential equations of the model are shown below (Eq. 1-3). X0 represents the activity
of the bolus injection of [99mTc]MEB in MBq, Vc the volume of the central blood pool
compartment in mL and Cc the activity concentration of [99mTc]MEB (in MBq/mL) in the
blood at a certain time point t. The activity level in the liver and gallbladder+intestines (in
MBq), at a certain time point t, is represented by Xliver and Xbile, respectively. 𝐶𝑐0, 𝑋𝑙𝑖𝑣𝑒𝑟
0 and
𝑋𝑏𝑖𝑙𝑒0 represent activity concentration and level directly after tracer injection (time point 0) for

Chapter 6: Kinetic modeling of [99mTc]mebrofenin as a tool to quantify altered hepatobiliary transport
126
the blood, liver and gallbladder+intestines, respectively. All rate constants were assumed to
be first order: k12 represents hepatic basolateral uptake; k21 hepatic basolateral excretion and
k20 hepatic canalicular efflux.
𝑑𝐶𝑐
𝑑𝑡= −𝑘12 ×𝐶𝑐 + 𝑘21 ×
𝑋𝑙𝑖𝑣𝑒𝑟
𝑉𝑐 𝐶𝑐
0 = 𝑋0
𝑉𝑐
[𝐸𝑞.1]
𝑑𝑋𝑙𝑖𝑣𝑒𝑟
𝑑𝑡= 𝑘12 ×𝑉𝑐×𝐶𝑐 − 𝑘20 ×𝑋𝑙𝑖𝑣𝑒𝑟 − 𝑘21 ×𝑋𝑙𝑖𝑣𝑒𝑟 𝑋𝑙𝑖𝑣𝑒𝑟
0 = 0 [𝐸𝑞. 2]
𝑑𝑋𝑏𝑖𝑙𝑒
𝑑𝑡= 𝑘20×𝑋𝑙𝑖𝑣𝑒𝑟 𝑋𝑏𝑖𝑙𝑒
0 = 0 [𝐸𝑞.3]
The rate constants were obtained by solving the differential equations that were fit
simultaneously to blood, liver and gallbladder+intestines TACs using nonlinear least-squares
regression. Kinetic parameters of WT, rifampicin treated and Mrp2 KO mice are compared.
Additionally, the model fit is investigated by fitting the measurements in blood pool and
gallbladder+intestines to the calculated model curves. The model curves are calculated from
the measurements in the liver.
Besides the kinetic rate constants, total clearance rates were calculated as described by
Ghibellini et al. (Ghibellini et al., 2008).
Figure 6.3: Scheme of the pharmacokinetic model describing the disposition and elimination of [99mTc]MEB in
mice. X0 represents the IV bolus of [99mTc]MEB; Cc is the concentration of [99mTc]MEB in the blood (MBq/mL)
and Vc is the central compartment volume (mL). The activity levels in the liver and the gallbladder+intestines,
expressed in MBq, is represented by Xliver and Xbile, respectively. All rate constants were assumed to be first
order: k12 represents hepatic basolateral uptake; k21 represents hepatic basolateral excretion and k20 represents
hepatic canalicular efflux.
Statistical Analysis
Statistical analysis was performed using SPSS, version 22, for Windows (Microsoft).
Differences between two groups were tested for significance using the nonparametric Mann–
Whitney test for two groups. All experiments were performed at n=5 (unless stated
otherwise); a p-value of 0.05 or smaller was considered significant.
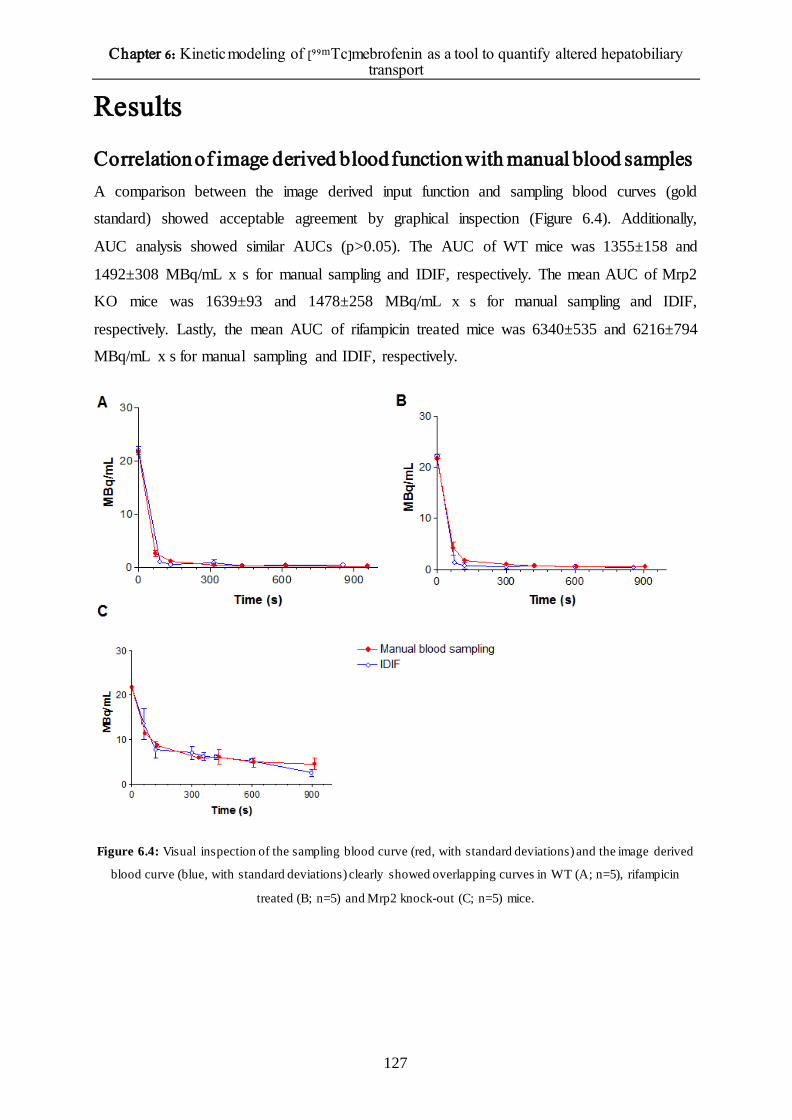
Chapter 6: Kinetic modeling of [99mTc]mebrofenin as a tool to quantify altered hepatobiliary transport
127
Results
Correlation of image derived blood function with manual blood samples
A comparison between the image derived input function and sampling blood curves (gold
standard) showed acceptable agreement by graphical inspection (Figure 6.4). Additionally,
AUC analysis showed similar AUCs (p>0.05). The AUC of WT mice was 1355±158 and
1492±308 MBq/mL x s for manual sampling and IDIF, respectively. The mean AUC of Mrp2
KO mice was 1639±93 and 1478±258 MBq/mL x s for manual sampling and IDIF,
respectively. Lastly, the mean AUC of rifampicin treated mice was 6340±535 and 6216±794
MBq/mL x s for manual sampling and IDIF, respectively.
Figure 6.4: Visual inspection of the sampling blood curve (red, with standard deviations) and the image derived
blood curve (blue, with standard deviations) clearly showed overlapping curves in WT (A; n=5), rifampicin
treated (B; n=5) and Mrp2 knock-out (C; n=5) mice.

Chapter 6: Kinetic modeling of [99mTc]mebrofenin as a tool to quantify altered hepatobiliary transport
128
Kinetic Modeling
The model depicted in Figure 6.3 was suitable for describing [99mTc]MEB disposition in all
groups. The corresponding mean kinetic parameters, k12, k21 and k20 and standard deviations
that were obtained per group are shown in Table 6.1.
k12, and k20 values were 3- and 9-fold smaller in rifampicin treated mice compared to vehicle
controlled mice (p≤0.05), respectively. k21 values were larger in rifampicin treated mice
(p≤0.05). In Mrp2 KO mice, k12 and k21 values were similar to those of WT mice. In contrast,
k20 values were 8- fold lower compared to WT mice (p≤0.05) (Table 6.1).
The goodness of fit of the model to three data sets is shown in Figure 6.5. Measurements are
shown as symbols, the model is shown as solid lines. The cumulative amounts of [99mTc]MEB
in the liver are also depicted on the graph.
Figure 6.5: Goodness of fit. The kinetic model was fitted to the measured values in a WT (A), Mrp2 KO and
rifampicin treated (C) mouse (n=1).

Chapter 6: Kinetic modeling of [99mTc]mebrofenin as a tool to quantify altered hepatobiliary transport
129
Table 6.1: Mean kinetic parameters and standard deviations of WT, Mrp2 KO and rifampicin treated
mice.*:significantly different compared to WT (p≤0.05) (n=5 per group).
k12 (1/min) k21 (1/min) k20 (1/min) Total clearance (mL/min)
WT (n=5) 0.984±0.356 0.000±0.000 0.351±0.021 1.67±0.61
Mrp2 KO (n=5) 0.782±0.347 0.000±0.000 0.042±0.005* 1.32±0.55
RIF treated
(n=5)
0.363±0.161* 0.119±0.086* 0.038±0.006* 0.17±0.039*

Chapter 6: Kinetic modeling of [99mTc]mebrofenin as a tool to quantify altered hepatobiliary transport
130
Discussion As stated in Chapter 5, numerous drugs can interact with hepatobiliary transport mechanisms
and can lead to toxic concentrations of bile acids or substrate drugs in blood or liver (Cuperus
et al., 2014; Ho et al., 2005; Schuetz et al., 2014). Therefore, it is important to detect these
interactions from early on in drug research (de Lima Toccafondo Vieira et al., 2014). In
Chapter 5, these interactions were visualized and quantified by means of metrics of the time
activity curves. Impaired uptake was reflected in elevated blood concentrations, a lower
maximal tracer uptake in the liver and decreased AUCgallbladder+intestines. Impaired efflux was
shown in a higher AUCliver value and a decreased AUCgallbladder+intestines. In addition to these
metrics, the aim of the current study was to evaluate altered hepatobiliary transport by means
of kinetic modeling of [99mTc]MEB, based on the kinetic model of [99mTc]MEB that was
developed by Ghibellini et al. (Ghibellini et al., 2008).
A kinetic modeling approach requires bolus administration of a radiotracer immediately
followed by dynamic recordings of the time activity curves of the radiotracer in tissues and
blood pool. The gold standard to obtain dynamic recordings of the activity level in the blood
pool is arterial blood sampling, however, this is very challenging in mice. Therefore, an
image-derived method has been applied in the current study. [99mTc]tetrofosmin was used as
imaging agent to visualize the myocardium. After intravenous injection, [99mTc]tetrofosmin is
rapidly cleared from the blood and accumulates in the myocardium, skeletal muscle, spleen,
liver and kidneys. Uptake in the myocardium is approximately 1% of the injected dose after 2
hours and is a consequence of passive diffusion of [99mTc]tetrofosmin in the myocardial cells,
followed by mitochondrial uptake and is proportional to the flow.
Application of this approach to the liver is very challenging, due to the dual input of the tracer
from the portal vein and hepatic artery, compromising 75% and 25%, respectively (Keiding et
al., 2012; Winterdahl et al., 2011). However, in the current study, our goal is not to obtain
exact kinetic parameters of [99mTc]MEB in mice, but to detect differences in kinetic
parameters between wild type and rifampicin treated or Mrp2 KO mice. In this context, it is
important to use the same input source in all subjects, i.e. blood pool in the heart, which is in
line with the kinetic model of Ghibellini et al., where they performed blood sampling in the
arm to obtain the input function (Ghibellini et al., 2008).
After generation of the TACs, physiological parameters can be calculated by fitting a
mathematical model of tracer distribution and metabolism to the data. Previously, Ghibellini

Chapter 6: Kinetic modeling of [99mTc]mebrofenin as a tool to quantify altered hepatobiliary transport
131
et al. (Ghibellini et al., 2008) reported a pharmacokinetic model to simulate the effect of
changes in hepatic uptake and/or secretion of [99mTc]MEB associated with disease states in
humans. In the current study, we used a simplified version of this model in mice by excluding
the urine compartment, since no radioactivity was observed in the urinary bladder and kidneys
in previous experiments. Additionally, an adjustment was done by evaluating the gallbladder
and intestines as one compartment, in comparison with Ghibellini et al., who only used the
gallbladder as second tissue compartment. The rationale behind this is outlined in Chapter 5.
Disturbed hepatobiliary transport was investigated by means of pharmacological inhibition
with rifampicin, a known Oatp and Mrp2 inhibitor and in Mrp2 KO mice, which lack the
Mrp2 transporter.
In rifampicin treated mice, significantly decreased k12 and k20 values were observed, as
expected, since rifampicin is an Oatp and Mrp2 inhibitor (Neyt et al., 2013). Additionally,
k21values were increased, which can be explained by a shortcoming of the proposed model.
During the acquisition time used in this study, no urinary excretion was observed. However,
due to inhibition of Oatp, urinary excretion will probably occur, but we were not able to
detect this in the current study, due to the short acquisition time. Since we were not able to
include the urinary bladder in the model, there is an overestimation of k21.
Mrp2 KO mice show a similar uptake in comparison with WT mice, which is reflected in
similar k12 en k21 values. In contrast, the efflux is as expected significantly decreased (lower
k20 values.
In conclusion, kinetic parameters obtained using a two-tissue compartment model of
[99mTc]MEB can be used to quantify (altered) hepatobiliary transport, which can be suitable
during drug development.

Chapter 6: Kinetic modeling of [99mTc]mebrofenin as a tool to quantify altered hepatobiliary transport
132
References Chu X, Strauss JR, Mariano MA, Li J, Newton DJ, Cai X, et al. Characterization of mice lacking the multidrug
resistance protein Mrp2 (Abcc2). J Pharmacol Exp Ther 2006;317:579-589.
Cuperus FJC, Claudel T, Gautherot J, Halibasic E, Trauner M. The role of canalicular ABC transporters in
cholestasis. Drug Metab Dispos 2014;42;546-560.
De Lima Toccafondo Vieira M, Tagliati CA. Hepatobiliary transporters in drug-induced cholestasis: a
perspective on the current identifying tools. Expert Opin Drug Metab Toxicol 2014;10:581-597.
Diehl KH, Hull R, Morton D, Pfister R, Rabemampianina Y, Smith D, et al. A good practice guide to the
administration of substances and removal of blood, including routes and volumes. J Appl Toxicol 2001;21:15–
23.
Ghibellini G, Leslie EM, Pollack GM, Brouwer KLR. Use of Tc-99m Mebrofenin as a Clinical Probe to Assess
Altered Hepatobiliary Transport: Integration of In vitro, Pharmacokinetic Modeling, and Simulation Studies.
Pharm Res. 2008;25:1851-60.
Hendrikse NH, Kuipers F, Meijer C, Havinga R, Bijleveld CMA, van der Graaf WTA et al. In vivo imaging of
hepatobiliary transport mediated by multidrug resistance associated protein and P-glycoprotein. Cancer
Chemother Pharmacol 2004;54:131-138.
Ho RH, Kim RB. Transporters and drug therapy: implications for drug disposition and disease. Clin Pharmacol
Ther 2005;78:260-277.
Keiding S. Bringing physiology into PET of the liver. J Nucl Med 2012;53:425-433.
Kutner C. Kinetic modeling in pre-clinical PET. Z Med Phys 2014;24:274-285.
Neyt S, Huisman MT, Vanhove C, De Man H, Vliegen M, Moerman L, et al. In vivo visualization and
quantification of (disturbed) Oatp-mediated hepatic uptake and Mrp2-mediated biliary excretion of 99mTc-
mebrofenin in mice. J Nucl Med 2013;54:624-630.
Parasuraman S, Raveendran R, Kesavan R. Blood sample collection in small laboratory animals. J Pharmacol
Pharmacother 2010;1:87-93.
Schrenk D, Baus PR, Ermel N, Klein C, Vorderstemann B, Kauffmann HM. Up-regulation of transporters of the
MRP family by drugs and toxins. Toxicol Lett 2001;120:51-57.
Schuetz JD, Swaan PW, Tweedie DJ. The role of transporters in toxicity and disease. Drug Metab Dispos
2014;42:541-545.
Winterdahl M, Keiding S, Sorensen M, Mortensen FV, Alstrup AKO, Munk OL. Tracer input for kinetic
modelling of liver physiology determined without sampling portal venous blood in pigs. Eur J Nucl Med Mol
Imaging 2011;38:263-270.

Chapter 7: [99mTc]mebrofenin transport in a humanized mouse model
133
Chapter 7.
[99mTc]mebrofenin transport in a
humanized mouse model

Chapter 7: [99mTc]mebrofenin transport in a humanized mouse model
134

Chapter 7: [99mTc]mebrofenin transport in a humanized mouse model
135
Introduction One of the underlying causes of drug-induced liver cholestasis is an altered functional activity
of hepatic uptake or efflux transporters. In chapter 5, we demonstrated that dynamic µSPECT
imaging of [99mTc]MEB is a useful method to discriminate quantitatively between the lack of
functional activity of sinusoidal uptake and biliary efflux transporters. Therefore, this method
can be used to investigate the interaction between new chemical entities and hepatobiliary
transporters (Neyt et al., 2013).
During drug development, the FDA requires in vivo toxicity studies conducted in at least two
different animal species before human studies can be performed. In these preclinical
toxicology studies, many hepatotoxicants remain undetected due to species differences, also
known as the “preclinical species specificity issue”. There can be a difference in transporter
expression, substrate affinity, physiological function, compensatory mechanisms and
metabolic pathways, and this can lead to a difference in hepatotoxicant tolerance. Therefore,
in the context of interpreting hepatotoxicity data from animal models, it is important to assess
and understand the potential interspecies differences in mechanisms of drug toxicity. One of
these mechanisms is hepatobiliary transport of drugs. Interspecies differences in transporter
expression and substrate affinity can lead to interspecies differences in hepatic concentration
of the drugs. For example, Wang et al. (Wang et al., 2015) compared and quantified
interspecies differences in expression of the hepatobiliary transporters in liver tissue and
hepatocytes of beagle dogs, cynomolgus monkeys, Sprague-Dawley rats and Wistar rats.
They found that there were notable interspecies differences in the relative abundance of
hepatic transporters. Li et al. (Li et al., 2008) also reported a 10-fold higher hepatic Mrp2
expression in rats compared to humans. Therefore, species differences should be considered
carefully during the interpretation of preclinical data and in translating the preclinical findings
to the clinic.
In Chapter 5 and 8, the effect on human transporters was tested by means of CHO- and HEK-
cell lines that were transfected with the human transport proteins. However, there is a need for
in vivo human-specific identification tools. Investigations of new drug candidates in human
subjects is expensive, time-consuming and regulatory complex and therefore, there is a need
for the development of preclinical methodologies and models that provide more predictive
information about human drug metabolism or pharmacodynamic responses (de Lima
Toccafondo Vieira and Tagliati, 2014; Xu et al., 2014; Peltz et al., 2013).

Chapter 7: [99mTc]mebrofenin transport in a humanized mouse model
136
Consequently, chimeric mice models with a humanized liver were introduced to overcome
this issue. In this chapter, we investigate human-type hepatobiliary transport of
[99mTc]mebrofenin ([99mTc]MEB) in vivo in chimeric urokinase-type Plasminogen Activator
SCID mice, since this model could offer a better understanding of interactions of drugs on
[99mTc]MEB transport via mainly human transporters in vivo.
The mice that were used in the current study were transplanted with human hepatocytes at the
Center of Vaccinology at Ghent University. To allow successful repopulation of human
primary hepatocytes into mice, rejection of the graft by the host’s immune system must be
avoided and an environment that promotes engraftment and expansion of liver cells must be
created. (Meuleman et al., 2005; Meuleman and Leroux-Roels, 2008) Therefore, urokinase-
type plasminogen activator (uPA)-transgenic mice were created. The liver-specific (albumin-
promoter) overexpression of the uPA-transgene causes a severe chronic liver disease, hereby
creating an environment that favors hepatocyte engraftment. These mice were backcrossed
with immunodeficient SCID mice, thereby avoiding rejection of the transplanted xenogeneic
human hepatocytes (Yoshizato et al., 2013). The success of human liver cell engraftment and
expansion in the transplanted uPA+/+ transgenic SCID mice can be evaluated by quantifying
human albumin levels in mouse plasma (HuAlb, in mg/mL) at regular intervals. Several
weeks after transplantation, a high proportion of diseased liver tissue, sometimes exceeding
90%, is replaced by human hepatocytes (Meuleman and Leroux-Roels, 2009).
Figure 7.1: Generation of a humanized mouse model. (a) Human hepatocytes are obtained and isolated via the
collagenase perfusion method. (b) intrasplenic transplant of the human hepatocytes in 10-14 day old mice (d)
After transplantation, chimerism is evaluated by determination of human albumin in mouse serum samples
(adapted from Moreno et al., 2007).

Chapter 7: [99mTc]mebrofenin transport in a humanized mouse model
137
In these humanized mice, normal [99mTc]MEB transport was investigated to characterize the
chimeric model. To study the effect of liver disease in itself, heterozygous mice of 5 and 8
weeks, which experience spontaneous somatic deletion of the transgene, thereby generating
healthy mouse hepatocytes that can quickly repopulate the diseased liver, were used as
controls.

Chapter 7: [99mTc]mebrofenin transport in a humanized mouse model
138
Materials and Methods
Animal Model
Chimeric uPA+/+ SCID (“humanized mice”, n= 11) and uPA+/- SCID (heterozygous) mice of 5
and 8 weeks (n=3 per group) were obtained from the Center of Vaccinology at Ghent
University. The chimeric mice were produced as described previously (Meuleman et al.,
2005). Briefly, uPA+/+ SCID mice were transplanted with primary human hepatocytes within
2 weeks after birth. uPA+/- SCID mice were not transplanted and served as control animals.
WT mice were obtained from Janvier (France). The mice were housed and handled according
to guidelines approved by the European Ethics Committee and acclimatized for at least one
week before the experiments. All the animals were kept under environmentally controlled
conditions (12 h normal light/dark cycles, 20–22°C and 60% relative humidity) with food and
water ad libitum. The study was approved by the Animal Experimental Ethical Committee of
Ghent University (ECD13/01).
Molecular Imaging
Dynamic µSPECT/CT acquisitions were acquired on a USPECT-II/CT device (MILabs,
Utrecht, The Netherlands) equipped with a cylindrical collimator containing 75 pinholes of 1
mm diameter (rat whole-body collimator; spatial resolution, 0.8 mm). All acquisitions were
acquired in list mode.
After an overnight fast (minimum 6 h), the mice were anesthetized with a mixture of
isoflurane (1.5%) and medical O2 to allow placement of an intravenous needle (30G) and
polyethylene (PE10) tubing (Becton Dickinson, Belgium) in a lateral tail vein. The mice were
placed in a prone position on the mouse scan bed. 200 µL (37-74 MBq; 2 mg MEB)
[99mTc]MEB was injected via the intravenous PE10 tubing, directly after scan initiation.
Mice were imaged while anesthetized, with their body temperature maintained during
imaging using a heated bed. The axial field of view required for the SPECT scan was chosen
based on 3 planar X-ray images. Subsequently, a 15 min dynamic SPECT acquisition using
60 time frames of 15 s was initiated 5 s before the injection of [99mTc]MEB. Lastly, a CT
acquisition (5 min; tube current, 612 µA; tube voltage, 50 kV) was performed for anatomical

Chapter 7: [99mTc]mebrofenin transport in a humanized mouse model
139
correlation. The resultant CT scan is inherently co-registered with the corresponding µSPECT
acquisition.
The dynamic SPECT scans were iteratively reconstructed using an ordered subsets
expectation maximization algorithm (3 iterations; 16 subsets; 0.75 mm voxel size; decay
correction), including only those photons from the acquired list-mode data with an energy
range of 140 keV ± 20 %. After reconstruction, three regions of interest (ROIs) were
manually drawn over the liver, the gallbladder+intestines and the urinary bladder using PMod
software (PMod Technologies, Zürich, Switserland) to obtain a time activity curve (TAC) for
each ROI. The total activity in each organ, expressed in MBq (normalized to an injection of
37 MBq and a mouse weight of 20 g), was expressed as a function of time (in seconds).
Statistical analysis
Statistical analysis was performed using Prism, version 3.00 (GraphPad, USA), and SPSS,
version 22, for Windows (IBM, USA). The TACs were described by calculating the maximal
activity in the liver and time-to-peak of the liver (i.e. the time point at which the maximal
tracer amount or plateau was reached) as indicators of the uptake, and maximal activity in the
gallbladder+intestines and area under the gallbladder and intestines curve
(AUCgallbladder+intestines) as indicators of the efflux. AUCs were calculated using the trapezoidal
method. The humanized mice were divided in 4 groups:
1) Human albumin level > 5 mg/mL, weight ≤ 11g (n=1)
2) Human albumin level > 5 mg/mL, weight > 11g (n=2)
3) Human albumin level < 5 mg/mL, weight ≤ 11g (n=4)
4) Human albumin level < 5 mg/mL, weight > 11g (n=4)
Differences between the groups were tested for significance using the nonparametric Mann-
Whitney U or Kruskal-Wallis test. A p-value of 0.05 was considered as significant. Due to the
small sample size in certain groups (n=2) in combination with the nonparametric test, a p-
value between 0.05 and 0.1 was considered as marginally significant.

Chapter 7: [99mTc]mebrofenin transport in a humanized mouse model
140
Results
[99mTc]MEB disposition in mice with liver disease (heterozygous mice)
Figure 7.2 displays the time activity curves of [99mTc]MEB of the liver (Figure 7.2, A) and
gallbladder+intestines (Figure 7.2, B) in heterozygous mice (uPA+/- SCID) of 5 and 8 weeks,
compared to that in WT mice. The corresponding metrics are shown in Table 7.1. A
significant difference was found between the time-to-peak in the liver, maximal activity in the
gallbladder and the AUCgallbladder+intestines between WT and heterozygous mice of 5 weeks
(Mann Whitney U test, p≤0.05), and between WT and heterozygous mice of 8 weeks (Mann
Whitney U test, p≤0.05). The boxplots are shown in Figure 7.3.
Figure 7.2 Mean time activity curves + SD (n=3) of liver (A) and gallbladder + intestines (B) of wild type, 8-
week-old heterozygous and 5-week-old heterozygous mice.
Table 7.1: Metrics of the TACs of heterozygous mice. Data are mean ± SD (n=3).
Maximal activity
liver (MBq)
Time-to-peak
liver (s)
Maximal activity
gallbladder+intestines (MBq)
AUCgallbladder+intestines
(MBq x s)
uPA+/- 8 weeks 20.19 ± 1.86 233 ± 15 24.74 ± 1.25 11957 ± 2053
uPA+/- 5 weeks 17.90 ± 4.22 413 ± 79 14.03 ± 3.95 5634 ± 2669
WT 21.88 ± 2.95 168 ± 17 35 ± 1.76 20100 ± 1028
In heterozygous mice of 5 weeks, the time-to-peak was 2.5 times later, the maximal activity in
the gallbladder and intestines 2.5 times lower, and the AUCgallbladder+intestines 3.6 times smaller
compared to WT mice (all p-values ≤ 0.05). In heterozygous mice of 8 weeks, the time to

Chapter 7: [99mTc]mebrofenin transport in a humanized mouse model
141
peak was 1.4 times later, the maximal activity in the gallbladder and intestines 1.5 times
lower, and the AUCgallbadder+intestines 1.7 times smaller compared to WT mice (all p-values ≤
0.05).
Figure 7.3: Boxplots of the maximal liver activity (A), time-to-peak in the liver (B), the maximal activity in
gallbladder+intestines (C) and the AUC of gallbladder+intestines (D) in heterozygous mice (n=3 per group).
[99mTc]MEB disposition in chimeric (humanized) mice
Figure 7.4 displays the time activity curves of [99mTc]MEB of the liver and
gallbladder+intestines in chimeric “humanized” mice. The corresponding metrics are shown
in Table 7.2. A significant difference was found in efflux metrics, namely the maximal
activity in gallbladder+intestines, and the AUCgallbladder+intestines (Kruskal-Wallis test; p≤0.05).
Boxplots are shown in Figure 7.5.

Chapter 7: [99mTc]mebrofenin transport in a humanized mouse model
142
Figure 7.4: Time activity curves of liver (A) and gallbladder + intestines (B) of humanized mice.
Figure 7.5: Boxplot of the maximal liver activity (A), time-to-peak in the liver (B), the maximal activity in
gallbladder+intestines (C) and the AUC of the gallbladder+intestines (D) in humanized mice. Significant
differences are indicated. *: p≤0.05; Δ: 0.05<p<0.1.

Chapter 7: [99mTc]mebrofenin transport in a humanized mouse model
143
Table 7.2: Metrics of TACs of humanized mice.
Maximal activity
liver (MBq)
Time-to-
peak liver (s)
Maximal activity
gallbladder+intestines (MBq)
AUCgallbladder+intestines
(MBq x s)
HuAlb>5 mg/mL,
weight≤11g
(n=1)
22.76* 278* 14.08* 6068*
HuAlb<5 mg/mL,
weight≤11g (n=4)
18.36 ± 1.39 180 ± 40 21.13 ± 2.25 9799 ± 1234
HuAlb>5 mg/mL,
weight>11g
(n=2)
22.15 ± 3.30 218 ± 85 17.64 ± 5.59 7888 ± 2534
HuAlb<5 mg/mL,
weight>11g
(n=4)
19.70 ± 1.70 169 ± 31 27.20 ± 2.07 14642 ± 1704
WT (n=3) 21.88 ± 2.95 168 ± 17 35 ± 1.76 20100 ± 1028
After pairwise comparison of the significant different parameters (the efflux metrics: maximal
activity in gallbladder+intestines, and AUCgallbladder+intestines), a significant lower maximal
activity in gallbladder+intestines, and a significant lower AUCgallbladder+intestines was found for
both parameters in 1) all the humanized mice (≤ 11g and > 11g) with human albumin levels
larger than 5 mg/mL compared to WT mice and 2) mice with human albumin levels below 5
mg/mL and weight lower or equal than 11g, compared to WT mice (p≤0.05).
Additionally, a marginally significantly lower maximal activity in the gallbladder and
intestines, and smaller AUCgallbladder+intestines (0.05<p<0.1) was found in mice with a weight
larger than 11g and a high human albumin level, compared to mice with a weight larger than
11g and a low human albumin level. Lastly, a marginally significantly lower maximal uptake
in liver and gallbladder+intestines, and smaller AUCgallbladder+intestines was found in mice with
high human albumin level and low weight, compared to mice with a low human albumin level
and high weight.

Chapter 7: [99mTc]mebrofenin transport in a humanized mouse model
144
Discussion In the current study, the aim was to investigate human-type [99mTc]MEB transport by means
of SPECT imaging in mice with a humanized liver, expressing human OATPs and MRP2.
Consequently, this model could offer a better understanding of interactions of drugs with
human transporters, since species differences are avoided. Heterozygous mice were used as
controls, to assess the effect of the liver disease in itself (Wang et al., 2015; Yoshizato et al.,
2013; Peltz et al., 2013; Xu et al., 2015).
First, we demonstrated that the heterozygous mice have impaired liver function, which is
reflected in decreased maximal uptake value in the liver, decreased AUCliver and decreased
AUCgallbladder+intestines. Additionally, we demonstrated that the liver function improved in time.
This can be explained by the fact that the heterozygous mice experience a spontaneous
somatic deletion of the transgene, thereby generating healthy mouse hepatocytes that can
quickly repopulate the diseased liver and that can restore liver function. Liver function can
thus be followed in time by means of repeated SPECT imaging of [99mTc]MEB.
Molecular SPECT imaging of the chimeric “humanized” mice demonstrated that the liver
function, and more in particular liver efflux of [99mTc]MEB, is dependent on the weight of the
animal and the human albumin level in mouse plasma, since these mice exhibit different
amounts of human and murine hepatocytes. uPA+/+ SCID mice have high uPA activity, which
leads to a lower weight. The lower the weight, the higher the uPA activity and the higher the
effect of the liver disease in itself (cf. heterozygous mice) (Tateno et al., 2015). Additionally,
it has been demonstrated that mice with a high human serum albumin level have more
functional human hepatocytes compared to mice with low human serum albumin levels. The
repopulation indexed (RI%) is higher in mice with high human albumin levels (Tateno et al.,
2004; Okumura et al., 2007; Tateno et al., 2015). Normal hepatic uptake of [99mTc]MEB was
observed in all groups, and this was reflected in similar uptake metrics in all the “humanized”
mice compared to WT mice. This indicates that there is a normal hepatic blood flow and
functioning of the human hepatic uptake transporters, OATP1B1 and OATP1B3. However,
efflux parameters are significantly decreased in “humanized” mice compared to WT mice.
Additionally, marginally significant differences are found in the efflux parameters between
several groups. This can be explained by differences in efflux between rodents and humans.
Arguments for this hypothesis can be found in the literature. In 2008, Li et al. (Li et al., 2008)
reported a fourfold higher elimination rate of Mrp substrates in rats compared to humans.

Chapter 7: [99mTc]mebrofenin transport in a humanized mouse model
145
They used hepatocyte fluorescent dye efflux assays and demonstrated marked species
differences on MRP/Mrp function between rat and human, with a higher elimination rate
observed in rat hepatocytes. In 2009, Li et al. (Li et al., 2009) reported and even quantified the
absolute species difference in Mrp2 expression. They found a 10-fold higher Mrp2 amount in
the liver of rats compared to humans.
Wang et al. (Wang et al., 2015) also reported a lower MRP2 abundance in human hepatocytes
compared to rat hepatocytes. They studied and quantified transporter abundances of
hepatobiliary transporters in human, beagle dogs, cynomolgus monkeys, Sprague-Dawley rats
and Wistar rats. They found interspecies differences in the transporter abundances. The
findings of Li et al. and Wang et al. are in accordance with our findings: decreased efflux in
mice with a humanized liver.
Ohtsuki et al. (Ohtsuki et al., 2014) determined the protein expression levels of transporters in
the uPA/SCID “humanized” mouse model in order to validate the model. They found that
protein expression levels in plasma membrane fractions of humanized mice were similar
compared to protein expression levels in plasma membrane fraction of the corresponding
human liver. However, they found a difference in expression level between several subjects
and also found these differences in the corresponding transplanted mice. Consequently,
differences between several humanized mice could be explained by inter-donor differences on
the protein expression level. However, the humanized mice in the current study received
hepatocytes from the same donor, so the inter-subject difference cannot be the cause of altered
efflux.
Additionally, differences in Mrp2/MRP2 transporter affinities for numerous substrates were
previously reported (Takekuma et al., 2007; Ishizuka et al., 1999; Ninomiya et al., 2005;
Shilling et al., 2006). For example, Ishizuka et al. (Ishizuka et al., 1999) reported a 12.9-fold
lower Km value of 2,4-dinitrophenyl-S-glutathione into canalicular membrane vesicles of
mice compared to humans, which is a measure for a higher affinity. Takekuma et al.
(Takekuma et al., 2007) reported a 3.6-fold higher affinity for glucuronized mycophenolic
acid of rat Mrp2 compared to humans.
The pronounced interspecies difference in the biliary excretion of Mrp2/MRP2 substrates can
thus result from a combination of the protein expression level (Vmax) and the intrinsic
transporter affinity (Km) for its substrates.

Chapter 7: [99mTc]mebrofenin transport in a humanized mouse model
146
We can conclude that functional liver imaging in the current study revealed differences in
liver functionality between WT and humanized uPA+/+ SCID mice, and between the different
groups of humanized mice. Consequently, the selection of mice for the mechanistic evaluation
of new drug candidates or metabolism studies must be handled with care. Molecular SPECT
imaging can thus be a useful screening method to carefully select a homogenous group of
chimeric mice with similar liver function.

Chapter 7: [99mTc]mebrofenin transport in a humanized mouse model
147
References de Lima Toccafondo Vieira M, Tagliati CA. Hepatobiliary transporters in drug -induced cholestasis: a
perspective on the current identifying tools. Expert Opin Drug Metab Toxicol 2014;10:581 -597.
Ghibellini G, Leslie EM, Pollack GM, Brouwer KLR. Use of Tc-99m mebrofenin as a clinical probe to assess
altered hepatobiliary transport: integration of in vitro, pharmacokinetic modeling, and simulation studies. Pharm
Res. 2008;25:1851–1860.
Ishizuka H, Konno K, Shiina T, Naganuma H, Nishimura K, Ito K, et al. Species differences in the transport
activity for organic anions across the bile canalicular membrane. J Pharmacol Exp Ther 1999;290:1324 -1330.
Li M, Yuan H, Li N, Song G, Zheng Y, Baratta M, Hua F, Thurston A, Wang J, Lai Y. Identification of
interspecies difference in efflux transporters of hepatocytes from dog, rat, monkey and human. Eur J Pharm Sci
2008;35:114-126.
Li N, Zhang Y, Hua F, Lai Y. Abslute difference of hepatobiliary transporter multidrug resistance -associated
protein (MRP2/Mrp2) in liver tissues and isolated hepatocytes from rat, dog, monkey and human. Drug Metab
Dispos 2009;37:66-73.
Maddrey WC. Drug-induced hepatotoxicity. J Clin Gastroenterol. 2005;39:S83–S89.
Meuleman P, Leroux-Roels G. HCV animal models: a journey of more than 30 years. Viruses. 2009;1:222-240.
Meuleman P, Leroux-Roels G. The human liver-uPA-SCID mouse: A model for evaluation of antiviral
compounds against HBV and HCV. Antiviral research. 2008;80:231-238.
Meuleman P, Libbrecht L, De Vos R, de Hemptinne B, Gevaert K, Vandekerckho ve J, Roskams T, Leroux-
Roels G. Morphological and biochemical characterization of a human liver in a uPA -SCID mouse chimera.
Hepatology. 2005;41:847-856.
Moreno A, Pérignon JL, Morosan S, Mazier D, Benito A. Plasmodium falciparum-infected mice: more than a
tour de force. Trends Parasitol 2007;23:254-259.
Neyt S, Huisman MT, Vanhove C, De Man H, Vliegen M, Moerman L, Dumolyn C, Mannens G, De Vos F. In
vivo visualization and quantification of (disturbed) Oatp-Mediated Hepatic Uptake and Mrp2-Mediated Biliary
Excretion of 99mTc-mebrofenin in mice. Journal of Nuclear Medicine. 2013;54: 624-630.
Ninomiya M, Ito K, Horie T. Functional analysis of dog multidrug resistance-associated protein 2 (MRP2) in
comparison with rat Mrp2. Drug Metab Dispos 2005;33:225-232.
Ohtsuki S, Kawakami H, Inoue T, Nakamura K, Tateno C, Katsukura Y, et al. Validation of uPA/SCID mouse
with humanized liver as a human liver model: protein quantification of transporters, cytochromes P450, and
UDP-glucuronosyltransferases by LC-MS/MS. Drug Metab Dispos 2014;42:1039-1043.

Chapter 7: [99mTc]mebrofenin transport in a humanized mouse model
148
Okumura H, Katoh M, Sawada T, Nakajima M, Soeno Y, Yabuuchi H, et al. Humanization of excretory pathway
in chimeric mice with humanized liver. Toxicol Sci 2007;97:533-538.
Padda MS, Sanchez M, Akhtar AJ, Boyer JL. Drug-induced cholestasis. Hepatology. 2011;53:1377–1387.
Peltz G. Can ‘humanized’ mice improve drug development in the 21st century? Trends Pharmacol Sci
2013;34:255-260.
Shilling AD, Azam , Leung L. Use of canalicular membrane vesicles (CMVs) from rats, dogs, monkeys and
humans to assess drug transport across the canalicular membrane. J Pharmacol Toxicol Methods 2006;53:186-
197.
Takekuma Y, Kakiuchi H, Yamazaki K, Miyauchi S, Kikukawa T, Kamo N, et al. Differences between
pharmacokinetics of mycophenolic acid (MPA) in rats and that in humans is caused by different affinities of
MRP2 to a glucuronized form. J Pharm Pharm Sci 2007;10:71-85.
Tateno C, Yoshizane Y, Saito N, Kataoka M, Utoh R, Yamasaki C, et al. Near completely humanized liver in
mice shows human-type metabolic responses to drugs. Am J Pathol 2004;165:901-912.
Tateno C, Kawase Y, Tobita Y, Hamamura S, Ohshita H, Yokomichi H, et al. Generation of novel chimeric mice
with humanized livers by using hemizygous cDNA-uPA/SCID mice. Plos One 2015;10:e0142145.
Wang L, Prasad B, Salphati L, Chu X, Gupta A, Hop CECA, et al. Interspecies variability in expression of
hepatobiliary transporters across human, dog, monkey, and rat as determined by quantitative proteomics. Drug
Metab Dispos 2015;43:367-374.
Xu D, Wu M, Nishimura S, Nishimura T, Michie SA, Zheng M, et al. Chimeric TK-NOG mice: a predictive
model for cholestatic human liver toxicity. J Pharmacol Exp Ther 2015;352:274-280.
Yoshizato K, Tateno C. A mouse with humanized liver as an animal model for predicting drug effects and for
studying viral infection: where to next? Expert Opin. Metab. Toxicol. 2013;9:1-17.

Chapter 8: Synthesis, in vitro and in vivo evaluation of technetium labeled bile acid analogues
149
Chapter 8.
Synthesis, in vitro and in vivo
evaluation of technetium
labeled bile acid analogues
Parts have been adapted from
Neyt S1, Vliegen M2, Verreet B2, De Lombaerde S1, Braeckman K1,3, Vanhove C3, Huisman MT2, Dumolyn C1,
Kersemans K1, Hulpia F4, Van Calenbergh S4, Mannens G2, De Vos F1. Nucl Med Biol 2016; 43:642-649.
1Laboratory of Radiopharmacy, Ottergemsesteenweg 460, Ghent University, Ghent, Belgium
2Preclinical Development & Safety, Janssen Pharmaceutical Companies of Johnson & Johnson, Beerse, Belgium
3iMinds Medical IT-IBITech-MEDISIP-INFINITY, Ghent University, Ghent, Belgium
4Laboratory for Medicinal Chemistry, Ottergemsesteenweg 460, Ghent University, Ghent, Belgium

Chapter 8: Synthesis, in vitro and in vivo evaluation of technetium labeled bile acid analogues
150

Chapter 8: Synthesis, in vitro and in vivo evaluation of technetium labeled bile acid analogues
151
Introduction As outlined in Chapter 1, bile acids play an essential role in the absorption of lipids,
cholesterol and lipid-soluble vitamins in the intestinal lumen. The majority of the bile acids
undergo efficient enterohepatic cycling, whereas only 5% of the bile acids enter the colon and
are excreted from the body. Hepatobiliary transport proteins are essential for this
enterohepatic cycling of bile acids. The most important bile acid transporters in the liver are
OATPs, NTCP, BSEP and MRP2. A detailed discussion is given in Chapter 1.
Additionally, these hepatobiliary transport mechanisms are crucial for the overall excretion
process of substrate toxic compounds, such as drugs, xenobiotics and toxins. This essential
function makes the liver vulnerable to drug toxicity, since numerous drugs are substrates or
inhibitors of hepatic transporters and hence, unexpected and unwanted interactions are
frequently observed (Maddrey, 2005; Shitara et al., 2005). As stated in Chapter 1 and 5, it is
important to assess the inhibition of hepatic transporters early in the development of new drug
candidates. In Chapter 5, dynamic µSPECT scanning of [99mTc]mebrofenin ([99mTc]MEB)
was proposed as non-invasive method to visualize and quantify normal and disturbed
hepatobiliary transport in a non-invasive manner (Neyt et al., 2013). However, [99mTc]MEB
has no chemical similarities with endogenous bile acids. To assess non-invasively the effect
of inhibition of hepatobiliary transporters on endogenous bile acids, there is a need for labeled
bile acid analogues.
Previously, Gadolinium (Gd)(III), fluorescent, 18F and 11C labeled bile acid analogues were
synthetized, as discussed in Chapter 2. Typically, these tracers have some shortcomings:
Gd(III) labeled contrast agents do not allow dynamic imaging and larger amounts have to be
administered. The fluorescently labeled bile acid analogues have a lower tissue depth, the
radioactive tracers labeled with 18F and 11C are difficult to synthetize (e.g. need for cyclotron)
and 11C tracers have a short half-life.
The aim of the current study is the (radio)synthesis of a technetium labeled chenodeoxycholic
and cholic acid analogue: technetium labeled diethylene triamine pentaacetic acid
chenodeoxycholic acid ([99mTc]DTPA-CDCA) and technetium labeled diethylene triamine
pentaacetic acid cholic acid, ([99mTc]DTPA-CA), respectively. Technetium was used as
radioisotope since it is easily produced (it can be eluted from a generator), its suitable half-life
(6 hours) and its limitless depth of penetration. Additionally, in vitro assays have been
performed to identify the involved uptake and efflux transporters. Lastly, in vivo µSPECT

Chapter 8: Synthesis, in vitro and in vivo evaluation of technetium labeled bile acid analogues
152
evaluation of normal and disturbed hepatobiliary transport have been performed to illustrate
the ability of these agents to visualize and quantify (altered) hepatobiliary transport in vivo.

Chapter 8: Synthesis, in vitro and in vivo evaluation of technetium labeled bile acid analogues
153
Materials and methods
General procedures and materials
Unless stated otherwise, all chemical reagents were obtained from commercial sources and
used without further purification. Mebrofenin (N-(3-bromo-2,4,6
trimethylphenylcarbamoylmethyl)-iminodiacetic acid) was obtained as a commercial kit from
GE Healthcare (Bridatec®) in a preparation containing 40 mg of mebrofenin and 0.3 mg of
tin(II)chloride-dihydrate. [99mTc]TcO4- was eluted from a sterile [99mTc]-generator (Drytec;
GE Healthcare). Exact mass measurements were performed on a Waters LCT Premier XETM
Time of Flight (ToF) mass spectrometer equipped with a standard electrospray (ESI) and
modular Lockspray TM interface. Samples were infused in a acetonitrile (MeCN) / water
(1:1) + 0.1 % formic acid mixture at 100 µL/min. Where reversed phase flash purification was
performed, Reveleris C18 RP 12g cartridges were used on a Reveleris X2 device (Grace) with
a flow rate of 20 mL/min and a water:acetonitrile gradient (from 10 to 95% acetonitrile in 20
minutes; with 0.1% formic acid added to the solvents). Radiochemical yield/purity was
determined by means of RP-HPLC (Econosphere C18 10 µm, length 250 mm, ID 10.0 mm
(Grace)) with radiodetection (Ludlum Measurments Inc., Model 2200). A 20 minutes gradient
was used at a flow rate of 6 mL/min (from 10 to 95% acetonitrile in 20 minutes; 0.1% formic
acid). Radioactivity in cell lysates was acquired on an automatic gamma counter (COBRA,
Perkin Elmer).
Animal models
FVB mice (female; age: 5 weeks; weight: 20–25 g) were purchased from Janvier, and were
housed and handled according to guidelines approved by the European Ethics Committee and
acclimatized for at least 1 week before the experiments. All animals were kept under
environmentally controlled conditions (12-h normal light/dark cycles, 20°C–24°C, and 40-
70% relative humidity) with food and water ad libitum. The study protocol was approved by
the Animal Experimental Ethical Committee of Ghent University (ECD12/62).
Chemistry
A summary of the (radio)synthesis is displayed in Figure 8.1.

Chapter 8: Synthesis, in vitro and in vivo evaluation of technetium labeled bile acid analogues
154
Figure 8.1: Overview of the (radio)synthesis of the technetium labeled chenodeoxycholic acid analogue,
[99mTc]DTPA-CDCA ([99mTc]-3a) and cholic acid analogue, [99mTc]DTPA-CA ([99mTc]-3b). Reagents and
conditions: (a) dimethoxypropane, methanol, hydrochloric acid, 91% (1a), 83% (1b); (b) ethylenediamine,
methanol, 98% (2a), 98% (2b); (c) dimethylformamide, triethylamine, DTPA(bis)anhydride, 26% (3a) and 16%
(3b); (d) stannous chloride, pertechnetate ([[99mTc]]O4-), radiochemical purity >95%.
Synthesis of methyl (R)-4-((3R,5S,7R,8R,9S,10S,13R,14S,17R)-3,7-dihydroxy-10,13-
dimethylhexadecahydro-1H-cyclopenta[a]phenanthren-17-yl)pentanoate (1a) and
methyl (R)-4-((3R,5S,7R,8R,9S,10S,12S,13R,14S,17R)-3,7,12-trihydroxy-10,13-
dimethylhexadecahydro-1H-cyclopenta[a]phenanthren-17-yl)pentanoate (1b)
Chenodeoxycholic and cholic acid (1g, 2.55 and 2.45 mmol respectively) were dissolved in
MeOH (5mL). 2,2-dimethoxypropane (2.5 mL) and 0.15 mL 12M hydrochloric acid were
added. The resulting mixture was stirred at room temperature overnight and subsequently
evaporated under reduced pressure (Rohacova et al., 2009). Next, the residue was dissolved in
EtOAc, washed with saturated NaHCO3, brine, dried over MgSO4, filtered and evaporated
under reduced pressure till dryness to obtain 1a and 1b (91% and 83% yield, respectively),
which were used in the next step without further purification. MRMS (ESI) calculated for 1a
[C25H42O4] [M+H]+: 407.3161, found: 407.3159; [2M+H]+: 813.6249, found: 813.6251.
MRMS (ESI) for 1b [C25H42O5] [M+H]+: 423.3110, found: 423.3118; [2M+H]+: 845,6137,
found: 845,6198.

Chapter 8: Synthesis, in vitro and in vivo evaluation of technetium labeled bile acid analogues
155
Synthesis of (R)-N-(2-aminoethyl)-4-((3R,5S,7R,8R,9S,10S,13R,14S,17R)-3,7
dihydroxy-10,13-dimethylhexadecahydro-1H-cyclopenta[a]phenanthren-17-
yl)pentanamide (2a) and (R)-N-(2-aminoethyl)-4-((3R,5S,7R,8R,9S,
10S,12S,13R,14S,17R)-3,7,12 -trihydroxy-10,13-dimethylhexadecahydro-1H-
cyclopenta[a]phenanthren-17-yl)pentanamide (2b)
1a and 1b (300 mg, 0.738 mmoles and 0.710 mmol respectively) were dissolved in 10 mL
MeOH and an excess of ethylenediamine (0.45 mL, 6.711 mmol) was added (Pandey et al.,
2002). The reaction mixtures were stirred overnight at 50°C. The solvents were evaporated
under reduced pressure and the crude products were purified by column chromatography
(20% (NH3 7M in MeOH) in DCM (v/v)) to give 2a and 2b. Compounds containing fractions
were pooled and evaporated under reduced pressure. The resulting residue was stirred in di-
isopropylether overnight, after which the materials were filtered and dried in vacuo to obtain
2a and 2b in 98% and 98% yield, respectively. MRMS (ESI) for 2a [C26H46N2O4] [M+H]+:
435.3581, found: 435.3585. MRMS (ESI) for 2b [C26H46N2O3] [M+H]+: 451.3531, found:
451.3488.
Synthesis of (R)-3,6,9-tris(carboxymethyl)-19-((3R,5S,7R,8R,9S,10S,13R,14S,17R)-
3,7-dihydroxy-10,13-dimethylhexadecahydro-1H-cyclopenta[a]phenanthren-17-
yl)-11,16-dioxo-3,6,9,12,15-pentaazaicosanoic acid (3a) and (R)-3,6,9-
tris(carboxymethyl)-11,16-dioxo-19-((3R,5S,7R,8R,9S,10S,12S,13R,14S,17R)-3,7,12-
trihydroxy-10,13-dimethylhexadecahydro-1H-cyclopenta[a]phenanthren-17-yl)-
3,6,9,12,15-pentaazaicosanoic acid (3b)
2a and 2b (97 mg;0.450 mmol and 101 mg;0.450 mmol respectively) were coupled to DTPA-
bis-anhydride (120 mg, 0.338 mmol) (Anelli et al., 2004). Towards this end 5.5 µL (0.3
mmol) of water was added to a solution of DTPA-bis-anhydride and triethylamine (0.2 mL) in
anhydrous DMF (10 mL). After 2 hours of stirring at room temperature, 2a or 2b was added
and stirring continued for 72 hours. Then, the pH was adjusted to 7 with 6 M HCl. The
solvent was evaporated under reduced pressure and the crude product was redissolved in
50:50 (v:v) MeCN:H2O. Subsequently, the products were purified by RP-flash
chromatography (Reveleris X2; ELSD detection; column: Reveleris C18, 12g (Grace)) to give
DTPA-CDCA (3a) and DTPA-CA (3b) in 26% and 16% yield, respectively. MRMS (ESI) for
3a [C40H67N5O12] [M+H]+: 810.4859, found: 810.4952. MRMS (ESI) for 3b [C40H67N5O13]

Chapter 8: Synthesis, in vitro and in vivo evaluation of technetium labeled bile acid analogues
156
[M+H]+: 826.4808, found: 826.4789. The total yield was 23% and 13% yield for 3a and 3b,
respectively.
Radiosynthesis
[99mTc]-incorporation was done by a direct labeling method (Sinha et al., 2009) giving
[99mTc]DTPA-CDCA ([99mTc]-3a) and [99mTc]DTPA-CA ([99mTc]-3b). To 2.25±0.25 mg of
compound dissolved in 50 µL saline in a shielded lead vial, 60 µL of 10-2 M SnCl2.2H2O
solution (dissolved in N2 purged 10% acetic acid) was added. Then, pH was adjusted to 6.5
with 0.2 M NaHCO3, followed by addition of freshly eluted saline solution of sodium
pertechnetate (185 MBq, 50 µL). Subsequently, the pH was again adjusted to 6.5 with 0.2 M
NaHCO3. The vial was allowed to incubate for 30 minutes at room temperature.
Radiochemical purity was determined by means of RP-HPLC.
In vitro uptake assays
Chinese hamster ovary (CHO) cells, CHO-OCT, Human Embryonic Kidney (HEK),
HEK293-OATP1B3 cells were purchased from Solvo Biotechnologies (Hungary); CHO-
NTCP and HEK293-OATP1B1 cells were a kind gift from the same company. CHO-NTCP,
CHO-OCT1, HEK293-OATP1B1 and HEK293-OATP1B3 cells were stably transfected with
genes encoding human NTCP (SLC10A1), OCT1 (SLC22A1), OATP1B1 (SLCO1B1), and
OATP1B3 (SLCO1B3), respectively. The cell lines were cultured in a humidified atmosphere
at 37°C in the presence of 5% CO2. The culture medium of the CHO cells consisted of
Dulbecco’s modified Eagle’s medium (DMEM)/F12, supplemented with 10% fetal calf
serum, 2 mM L-glutamine, 0.3 mM L-proline, and antibiotics (Penicillin/Streptomycin; 50
U/mL; 50 µg/mL). The culture medium of the HEK293 cells consisted of DMEM glutamax;
high glucose; pyruvate supplemented with 10% fetal calf serum, 5 mL MEM-non essential
amino acid solution, and antibiotics (Penicillin/Streptomycin; 50 U/mL; 50 µg/mL).
For transport experiments, all CHO and HEK cells were seeded in 24-well plates (4.0×10⁵
cells/well; n=3/cell line) in 1 mL of the corresponding culture medium. After 18–24 h,
medium was removed and cells were washed twice with washing buffer (1 mL sterile
HBSS+/+ (HBSS with Ca2+ and Mg2+), 10 mM HEPES, pH=7.4, 37°C). Incubation buffers
(250 µL/well) were obtained by adding the radiolabeled compounds to the washing buffer.

Chapter 8: Synthesis, in vitro and in vivo evaluation of technetium labeled bile acid analogues
157
Final concentrations of the positive controls were 1 µM [3H]-estradiol-17β-glucuronide
(E17βG, for OATP1B1), 1 µM [3H]-taurocholic acid (TCA, for NTCP) and 1µM [14C]-tetra-
ethyl-ammonium (TEA, for OCT1). Concentrations of the test compounds ([99mTc]DTPA-
CDCA and [99mTc]DTPA-CA) were 1, 2, 5, 10, 20, 50, 100 µM (for all cell lines). The plates
were incubated at 4°C or 37°C and 5% CO2 for 5, 10, 20, 30, 60, 90, 120, 180 minutes. The
incubation was stopped by placing the plates on ice and adding 1 ml of ice-cold HBSS+/+
with 1% BSA. Next, the cells were washed twice more with 2 mL HBSS+/+ and the
supernatant was removed. The cells were lysed with 250 µL mammalian protein extraction
reagent and the plates were shaken for 10 minutes at 400 rpm at room temperature. A 150 µL
aliquot of this solution was used for gamma counting. Protein content was determined by
means of a BCA kit (Thermo Scientific).
In vitro vesicular efflux assay
HEK293-MRP2, HEK293-BSEP and HEK293-CTRL vesicles were purchased from
PharmTox (The Netherlands). To determine the involved efflux transporters, ATP-binding
cassette transporter vesicles transfected with human MRP2 or BSEP were used. Membrane
vesicles (7.5 µg of protein per well) were incubated at 37°C in a final volume of 30 µL. The
buffer used was Tris (10 mM)/sucrose (250 mM) with or without 4mM ATP, MgCl2 (10 mM)
and [99mTc]DTPA-CDCA or [99mTc]DTPA-CA (20 µM) and incubated for 15, 30, 60 or 90
minutes. The reaction was stopped by addition of 150 µL of ice-cold buffer and the well
content was transferred to a glass fiber filter plate (Multiscreen HTS plates; Merck Millipore)
and washed 3 times with buffer. Then, 100 µL 0.1 M NaOH was added and incubated at room
temperature for 10 minutes to lyse the vesicles. An 80 µL aliquot of this solution was used for
gamma counting.
Molecular imaging
Whole-body µSPECT/CT acquisitions were acquired on a USPECTII/CT device (MILabs)
equipped with a cylindrical collimator containing 75 pinholes of 1 mm diameter (rat whole-
body collimator; spatial resolution, 0.8 mm). All acquisitions were acquired in list mode.
After an overnight fast (minimum 6 hours), mice (n=6) were anesthetized with a mixture of
1.5% isoflurane and medical O2 to allow placement of intravenous needle (30G) and

Chapter 8: Synthesis, in vitro and in vivo evaluation of technetium labeled bile acid analogues
158
polyethylene (PE10) tubing (Becton Dickinson) in a lateral tail vein. The mice were placed in
a prone position on the mouse scan bed and were imaged while anesthetized, with their body
temperature maintained during imaging using a heated bed. Subsequently, in untreated mice
(n=3) a 120 minutes dynamic whole-body SPECT acquisition using 120 time frames of 1
minute was initiated 5 seconds before the injection of 200 µL of [99mTc]DTPA-CDCA or
[99mTc]DTPA-CA (37 MBq). Finally, a CT acquisition (5min; tube voltage, 50 kV; tube
current, 612 µA) was performed for anatomical correlation. The resultant CT scan is
inherently co-registered with the corresponding µSPECT acquisition. Additionally, an in vivo
inhibition experiment was performed. Mice (n=3) were injected with rifampicin (100 mg/kg;
IP) 60 minutes before tracer injection. Another dose of 25 mg/kg rifampicin was co-
administered with the radiotracer (IV) and the same imaging protocol was performed.
All dynamic SPECT scans were iteratively reconstructed using an ordered subsets expectation
maximization algorithm (3 iterations; 16 subsets; 0.75 mm voxel size; decay correction),
including only those photons from the acquired list-mode data with an energy range of 140
keV±20%. After reconstruction, regions of interest (ROIs) were manually drawn over the
heart, liver, gallbladder+intestines and urinary bladder using PMod software (PMod
Technologies) to obtain a time activity curve (TAC) for each ROI. ROI volumes varied
between 67 and 1578 mm³. Additionally, reconstructions of different phases (early phase: 0 -
10 minutes; late phase: 10 – 120 minutes) were performed to visualize the distribution of
[99mTc]MEB as function of time. Three-dimensional projection images of the co-registered
CT and µSPECT images were performed using ImageJ software.
Statistical analysis
Statistical analysis was performed using Prism, version 3.0 (GraphPad), and SPSS version 22,
for Windows (Microsoft). For the in vitro uptake assays, uptake in function of time was
determined. Additionally, Michaelis Menten constants and associated maximum transport
rates were calculated by means of GraphPad Prism (nonlinear regression). The time–activity
curves were described by calculating the maximal tracer amount in the liver and in the
gallbladder and intestines, the time point at which tracer maximized (time to peak) in the
liver, and the AUC in the blood, liver and gallbladder and intestines. AUCs were calculated
using the trapezoidal method. Total, hepatic, biliary and urinary clearance rates were
calculated.
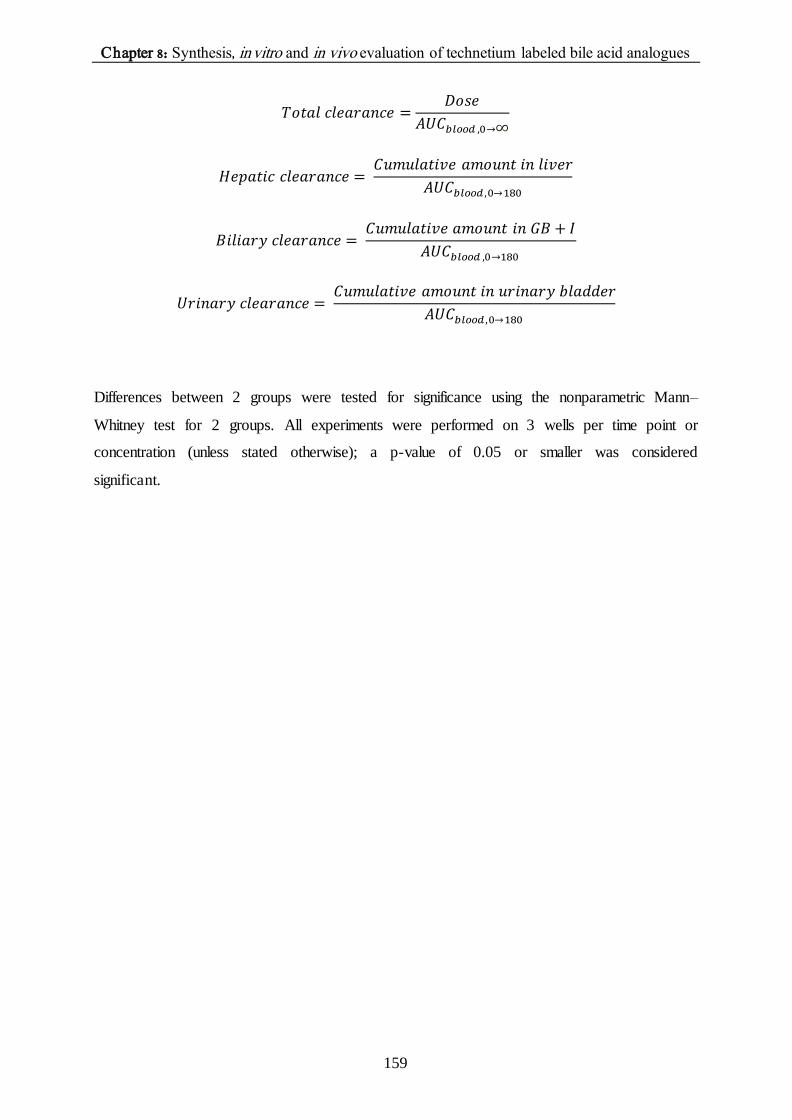
Chapter 8: Synthesis, in vitro and in vivo evaluation of technetium labeled bile acid analogues
159
𝑇𝑜𝑡𝑎𝑙 𝑐𝑙𝑒𝑎𝑟𝑎𝑛𝑐𝑒 =𝐷𝑜𝑠𝑒
𝐴𝑈𝐶𝑏𝑙𝑜𝑜𝑑 ,0→∞
𝐻𝑒𝑝𝑎𝑡𝑖𝑐 𝑐𝑙𝑒𝑎𝑟𝑎𝑛𝑐𝑒 = 𝐶𝑢𝑚𝑢𝑙𝑎𝑡𝑖𝑣𝑒 𝑎𝑚𝑜𝑢𝑛𝑡 𝑖𝑛 𝑙𝑖𝑣𝑒𝑟
𝐴𝑈𝐶𝑏𝑙𝑜𝑜𝑑,0→180
𝐵𝑖𝑙𝑖𝑎𝑟𝑦 𝑐𝑙𝑒𝑎𝑟𝑎𝑛𝑐𝑒 = 𝐶𝑢𝑚𝑢𝑙𝑎𝑡𝑖𝑣𝑒 𝑎𝑚𝑜𝑢𝑛𝑡 𝑖𝑛 𝐺𝐵 + 𝐼
𝐴𝑈𝐶𝑏𝑙𝑜𝑜𝑑 ,0→180
𝑈𝑟𝑖𝑛𝑎𝑟𝑦 𝑐𝑙𝑒𝑎𝑟𝑎𝑛𝑐𝑒 = 𝐶𝑢𝑚𝑢𝑙𝑎𝑡𝑖𝑣𝑒 𝑎𝑚𝑜𝑢𝑛𝑡 𝑖𝑛 𝑢𝑟𝑖𝑛𝑎𝑟𝑦 𝑏𝑙𝑎𝑑𝑑𝑒𝑟
𝐴𝑈𝐶𝑏𝑙𝑜𝑜𝑑,0→180
Differences between 2 groups were tested for significance using the nonparametric Mann–
Whitney test for 2 groups. All experiments were performed on 3 wells per time point or
concentration (unless stated otherwise); a p-value of 0.05 or smaller was considered
significant.

Chapter 8: Synthesis, in vitro and in vivo evaluation of technetium labeled bile acid analogues
160
Results
Radiosynthesis
Radiochemical purities were higher than 95% within 30 minutes. In its final formulation or
dissolved in the appropriate buffer for the in vitro experiment, the tracers showed no
alterations in radiochemical purity for up to 4h after the end of the synthesis.
In vitro uptake assays
The transfected cell lines are fully functional, which is confirmed by the uptake of positive
controls (cf. Figure 5.5, Chapter 5). The uptake of [3H]-TCA, [14C]-TEA and [3H]-E17-BG is
respectively 255-, 11-, 256- and 50-fold higher in CHO-NTCP, CHO-OCT1, HEK293-
OATP1B1 and HEK293-OATP1B3 compared to their parent/mock cell line.
Figure 8.2 shows the in vitro uptake of 20 µM [99mTc]DTPA-CDCA ([99mTc]-3a) and
[99mTc]DTPA-CA ([99mTc]-3b) after 60 minutes (Figure 8.2 A and C, respectively) and with
or without rifampicin co-incubation (Figure 8.2 B and D, respectively). Without inhibitor,
significantly higher uptake is observed for both tracers in HEK293-OATP1B1 and HEK293-
OATP1B3 compared to their controls, HEK293-MOCK. After 60 minutes, the uptake of
[99mTc]DTPA-CDCA is 534.2±6.0 and 316.8±8.1 pmol/mg protein in OATP1B1 and
OATP1B3 transfected cell lines, respectively. The uptake in the MOCK transfected cell lines
was 82.2±4.9 pmol/mg protein. The uptake of [99mTc]DTPA-CA was 212±7.6, 110.9±2.1 and
50.8±1.7 pmol/mg protein in OATP1B1, OATP1B3 and MOCK transfected cell lines,
respectively. For both tracers, no significantly higher uptake was observed in NTCP and
OCT1 transfected cell lines.
After co-incubation with 100 µM rifampicin, a known OATP inhibitor, the uptake is
significantly lower for both tracers in the OATP transfected cell lines. The uptake of
[99mTc]DTPA-CDCA after rifampicin administration amounts to 100.2±13.9 and 87.9±13.4
pmol/mg protein in OATP1B1 and OATP1B3 cell lines, respectively. The uptake of
[99mTc]DTPA-CA after rifampicin administration amounts to 72.4±1.6 and 85.8±1.9 pmol/mg
protein in OATP1B1 and OATP1B3 cell lines, respectively.

Chapter 8: Synthesis, in vitro and in vivo evaluation of technetium labeled bile acid analogues
161
Figure 8.2: In vitro uptake of 20 µM[99mTc]DTPA-CDCA ([99mTc]-3a) (A) and [99mTc]DTPA-CA ([99mTc]-3b)
(C) after 60 minutes. Uptake of 20 µM[99mTc]DTPA-CDCA ([99mTc]-3a) and [99mTc]DTPA-CA ([99mTc]-3b)
after 60 minutes with or without co-incubation with 100 µM rifampicin (B, D, respectively) (n=3). Data are
mean ± SD. *= significant difference (p ≤ 0.05).
Figure 8.3 depicts uptake kinetics for [99mTc]DTPA-CDCA ([99mTc]-3a, Figure 8.3 A);
[99mTc]DTPA-CA ([99mTc]-3a), Figure 8.3 B) and [99mTc]MEB (Figure 8.3 C). The uptake
increased and saturated with increasing concentrations of substrate for all three tracers and for
both cell lines (OATP1B1 and OATP1B3 transfected cell lines). The Michaelis-Menten
constants (Km) with associated maximum transport rates (Vmax) were calculated (Table 8.1).
Both tracers show a higher affinity compared to [99mTc]MEB. The lower Km of [99mTc]DTPA-
CDCA indicates a higher affinity for both OATP1B1 and OATP1B3 compared to
[99mTc]DTPA-CA. The affinity for OATP1B1 is higher than the affinity for OATP1B3, for all
the tracers. Vmax values of [99mTc]DTPA-CDCA and [99mTc]DTPA-CA were lower compared
to Vmax value of [99mTc]MEB, indicating a lower transport capacity, which can also be
concluded from the in vitro clearance values (Table 8.1).

Chapter 8: Synthesis, in vitro and in vivo evaluation of technetium labeled bile acid analogues
162
Figure 8.3: In vitro uptake of [99mTc]DTPA-CDCA ([99mTc]-3a, A), [99mTc]DTPA-CA ([99mTc]-3b, B) and
[99mTc]MEB (C) (n=3). Data are mean ± SD.
Table 8.1: Michaelis Menten constants and associated maximum transport rates of [99mTc]DTPA-CDCA
([99mTc]-3a) and [99mTc]DTPA-CA ([99mTc]-3b) and [99mTc]MEB. Data are mean ± SD (n=3).
Cell line Km (µM) Vmax (pmol/mg
protein/min)
Clearance
(Vmax/Km;
mL/mg/min)
[99mTc]DTPA-CDCA HEK293-OATP1B1 8.45±0.75 11.3±0.29 0.0013
HEK293-OATP1B3 13.7±1.24 9.10±0.27 0.00066
[99mTc]DTPA-CA HEK293-OATP1B1 61.7±5.25 13.6±0.36 0.00022
HEK293-OATP1B3 162±16.9 14.1±0.70 0.000087
[99mTc]MEB HEK293-OATP1B1 958±78.8 (60.5±1.70) x 103 0.063
HEK293-OATP1B3 3547±294 (90.2±3.97) x 103 0.025

Chapter 8: Synthesis, in vitro and in vivo evaluation of technetium labeled bile acid analogues
163
In vitro vesicular efflux assay
To determine the involved efflux transporters, ATP-binding cassette transporter vesicles
transfected with human MRP2 or BSEP were used. The ATP-dependent [99mTc]DTPA-CDCA
and [99mTc]DTPA-CA uptake was determined in canalicular inside-out membrane vesicles by
a rapid filtration method. A time dependent uptake of the tracers was observed in presence of
ATP in MRP2 vesicles (Figure 8.4). We observed a significantly higher uptake in MRP2
vesicles in ATP+ conditions compared to ATP- conditions after 15, 30, 60 and 90 minutes for
[99mTc]DTPA-CDCA; and after 30, 60 and 90 minutes for [99mTc]DTPA-CA (p≤0.05). There
was no difference in uptake in ATP+ and ATP- conditions for control and BSEP vesicles at
all time points.
Figure 8.4: In vitro vesicular efflux assay. Uptake of 20 µM [99mTc]DTPA-CDCA ([99mTc]-3a, A) and
[99mTc]DTPA-CA ([99mTc]-3b, B) after 15, 30, 60 and 90 minutes. Data are mean ± SD (n=3). *= significant
difference (p ≤ 0.05).
Molecular imaging
In vivo µSPECT imaging of mice revealed uptake of both radiotracers in liver, gallbladder,
intestines and urinary bladder. Figure 8.5 shows 3D projection images of co-registered CT
and µSPECT images of [99mTc]DTPA-CDCA (Figure 8.5 A, B) and [99mTc]DTPA-CA
(Figure 8.5 C, D) during the first 10 minutes (early phase, Figure 8.5 A and C) and during the
last 110 minutes (late phase, Figure 8.5 B and D). In the early phase, [99mTc]DTPA-CDCA is
taken up in the liver, gallbladder and urinary bladder. [99mTc]DTPA-CA is taken up in liver
and urinary bladder. In the late phase, the mean distribution of the tracers show mainly uptake
in the intestines and urinary bladder.

Chapter 8: Synthesis, in vitro and in vivo evaluation of technetium labeled bile acid analogues
164
Figure 8.5: Projection images of co-registered CT and µSPECT images of 37 MBq of [99mTc]DTPA-CDCA
([99mTc]-3a) (A, B) and [99mTc]DTPA-CA ([99mTc]-3b) (C, D) in a WT mouse during the first 10 minutes (A, C)
and during the last 110 minutes (B, D) of the dynamic µSPECT acquisition (120 frames, 1 minute/frame).
Time activity curves of [99mTc]DTPA-CDCA and [99mTc]DTPA-CA in WT and rifampicin
treated mice are shown in Figure 8.7 and the corresponding metrics are shown in Table 8.2.
[99mTc]DTPA-CDCA (Figure 8.7 A) and [99mTc]DTPA-CA (Figure 8.7 C) show a maximal
liver uptake of respectively 13.83±0.58 MBq and 9.50±1.45 MBq after 12.67±1.53 and
12.00±1.00 minutes, followed by a decrease to baseline levels, indicating secretion.
A secretion maximum to gallbladder and intestine of 23.00±2.00 MBq and 17.67±2.61 MBq
for [99mTc]DTPA-CDCA and [99mTc]DTPA-CA, respectively, indicates secretion of the
radiotracer to gallbladder and intestines. Additionally, in the urinary bladder, an accumulation
of activity was observed with a maximal uptake of respectively 5.10±0.71 and 13.00±1.98
MBq (Figure 8.7 A and B, Table 8.2). After 4 hours, the remaining radioactivity was located
in the intestines and no activity was observed in the urinary bladder, since the urinary bladder
was emptied.
Next, we investigated the effect of rifampicin administration on [99mTc]DTPA-CDCA and
[99mTc]DTPA-CA transport. Rifampicin is both a substrate and an inhibitor of OATPs and
MRP2, and therefore, it was selected as test agent. Figure 8.6 shows 3D projection images of
co-registered CT and µSPECT images of [99mTc]DTPA-CDCA (Figure 8.6 A, B) and
[99mTc]DTPA-CA (Figure 8.6 C and D) after rifampicin administration during the first 10
minutes (early phase, Figure 8.6 A and C) and during the last 110 minutes (late phase, Figure
8.6 B and D). In the early phase, less liver uptake of [99mTc]DTPA-CDCA and [99mTc]DTPA-
CA is observed; mainly the blood pool and heart are visible. Additionally, the urinary bladder
is visible. In the late phase, the mean distribution of the tracers shows mainly uptake in the
urinary bladder, in contrast to the WT mouse (Figure 8.5).

Chapter 8: Synthesis, in vitro and in vivo evaluation of technetium labeled bile acid analogues
165
Figure 8.6: Projection images of co-registered CT and µSPECT images of 37 MBq of [99mTc]DTPA-CDCA
([99mTc]-3a) (A, B) and [99mTc]DTPA-CA ([99mTc]-3b) (C, D) in a rifampicin treated WT mouse during the first
10 minutes (A, C) and during the last 110 minutes (B, D) of the dynamic µSPECT acquisition (120 frames, 1
minute/frame).
Figure 8.7: Time activity curves (TACs) of [99mTc]DTPA-CDCA ([99mTc]-3a) (A, B) and [99mTc]DTPA-CA
([99mTc]-3b) (C, D) in WT (n=3) (A, C) and RIF treated (n=3; 100 mg/kg IP, 60 minutes before imaging; 25
mg/kg IV, coinjected with tracer) (B, D) mice after intravenous injection of 37 MBq radiotracer and dynamic
µSPECT imaging (120 frames; 1 minute/frame). TACheart (blood) is expressed as MBq/mL (left y-axis); all other
TACs are expressed as MBq (right y-axis). Data are mean±SD. Green= liver, blue= gallbladder+intestines,
black= urinary bladder, red= blood.
The time-activity curves of the rifampicin treated mice (100 mg/kg intraperitoneally, 25
mg/kg intravenously) are shown in Figure 8.7 B D. Corresponding metrics are shown in Table
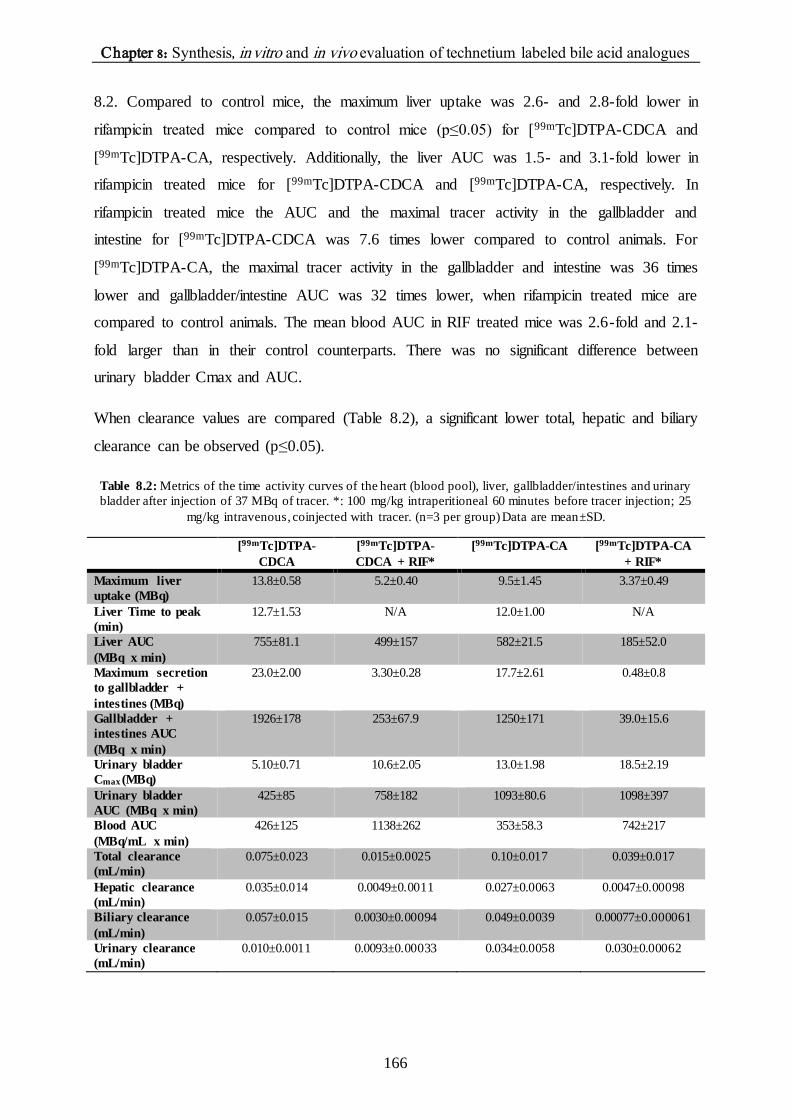
Chapter 8: Synthesis, in vitro and in vivo evaluation of technetium labeled bile acid analogues
166
8.2. Compared to control mice, the maximum liver uptake was 2.6- and 2.8-fold lower in
rifampicin treated mice compared to control mice (p≤0.05) for [99mTc]DTPA-CDCA and
[99mTc]DTPA-CA, respectively. Additionally, the liver AUC was 1.5- and 3.1-fold lower in
rifampicin treated mice for [99mTc]DTPA-CDCA and [99mTc]DTPA-CA, respectively. In
rifampicin treated mice the AUC and the maximal tracer activity in the gallbladder and
intestine for [99mTc]DTPA-CDCA was 7.6 times lower compared to control animals. For
[99mTc]DTPA-CA, the maximal tracer activity in the gallbladder and intestine was 36 times
lower and gallbladder/intestine AUC was 32 times lower, when rifampicin treated mice are
compared to control animals. The mean blood AUC in RIF treated mice was 2.6-fold and 2.1-
fold larger than in their control counterparts. There was no significant difference between
urinary bladder Cmax and AUC.
When clearance values are compared (Table 8.2), a significant lower total, hepatic and biliary
clearance can be observed (p≤0.05).
Table 8.2: Metrics of the time activity curves of the heart (blood pool), liver, gallbladder/intestines and urinary
bladder after injection of 37 MBq of tracer. *: 100 mg/kg intraperitioneal 60 minutes before tracer injection; 25
mg/kg intravenous, coinjected with tracer. (n=3 per group) Data are mean±SD.
[99mTc]DTPA-
CDCA
[99mTc]DTPA-
CDCA + RIF*
[99mTc]DTPA-CA [99mTc]DTPA-CA
+ RIF*
Maximum liver
uptake (MBq)
13.8±0.58 5.2±0.40 9.5±1.45 3.37±0.49
Liver Time to peak
(min)
12.7±1.53 N/A 12.0±1.00 N/A
Liver AUC
(MBq x min)
755±81.1 499±157 582±21.5 185±52.0
Maximum secretion
to gallbladder +
intestines (MBq)
23.0±2.00 3.30±0.28 17.7±2.61 0.48±0.8
Gallbladder +
intestines AUC
(MBq x min)
1926±178 253±67.9 1250±171 39.0±15.6
Urinary bladder
Cmax (MBq)
5.10±0.71 10.6±2.05 13.0±1.98 18.5±2.19
Urinary bladder
AUC (MBq x min)
425±85 758±182 1093±80.6 1098±397
Blood AUC
(MBq/mL x min)
426±125 1138±262 353±58.3 742±217
Total clearance
(mL/min)
0.075±0.023 0.015±0.0025 0.10±0.017 0.039±0.017
Hepatic clearance
(mL/min)
0.035±0.014 0.0049±0.0011 0.027±0.0063 0.0047±0.00098
Biliary clearance
(mL/min)
0.057±0.015 0.0030±0.00094 0.049±0.0039 0.00077±0.000061
Urinary clearance
(mL/min)
0.010±0.0011 0.0093±0.00033 0.034±0.0058 0.030±0.00062
Chapter 8: Synthesis, in vitro and in vivo evaluation of technetium labeled bile acid analogues
167
Discussion [99mTc]MEB is an OATP1 and MRP2 substrate that is used in nuclear medicine to investigate
the (dys)function of liver and gallbladder. In Chapter 5, we demonstrated the ability of non-
invasively visualizing and quantifying disturbed hepatic transport by drugs or genetic defects
by means of µSPECT imaging of [99mTc]MEB (Neyt et al., 2013). However, [99mTc]MEB is a
lidocain analogue and has no similarities with endogenous bile acids. Therefore, in the current
study, a procedure for the synthesis and radiolabeling of two bile acid analogues was
developed, which resemble endogenous primary bile acids, for in vitro uptake and efflux
experiment and in vivo µSPECT studies. These compounds can possibly be used to
investigate the disturbances of hepatobiliary transport mechanisms by drugs in vivo. DTPA-
chenodeoxycholic acid (DTPA-CDCA, 3a) and DTPA-cholic acid (DTPA-CA, 3b) were
synthetized from respectively chenodeoxycholic and cholic acid by esterification with
methanol, exchange of the methylester with ethylenediamine and subsequent coupling with
DTPA-bis-anhydride as chelating agent. Finally, these bile acid analogues were successfully
labeled by technetium incorporation.
In vitro evaluation of both compounds showed that the human uptake transporters OATP1B1
and OATP1B3 are involved in the uptake of both tracers. For [99mTc]DTPA-CDCA, Km
values of 8.45±0.75 µM and 13.7±1.24 µM were obtained for OATP1B1 and OATP1B3,
respectively, while for [99mTc]DTPA-CA, these values were 61.7±5.25 µM and 162±16.9 µM,
respectively. When these Km values are compared to the Km values of endogenous bile acids,
values which were in the same range were observed (Km OATP1B1 cholate: 11.4±2.3 µM for
OATP1B1 (Cui et al., 2001); Km Oatp1 taurocholic acid= 19.4 ±3.3 µM, Km
taurodeoxycholic acid: 3.5±0.25 µM (Hata et al., 2003)). Additionally, similar transport was
observed of the previously reported fluorescent tracer cholyl-l-lysyl-fluorescein (CLF) (de
Waart et al., 2010; Milkiewicz et al., 2001). Indeed, the structures of [99mTc]DTPA-(CD)CA
are comparable to that of CLF in that, all three structures are primary bile acids with
modifications on the carboxyl moiety. Km values of CLF were in the same range as
[99mTc]DTPA-(CD)CA (Km for OATP1B3 of CLF: 4.6±2.7 µM; no Km of OATP1B1 was
reported). When the newly synthetized tracers were compared with the lidocain analogue
[99mTc]MEB, which is commonly used in nuclear medicine for hepatobiliary imaging, lower
Km values were observed (Km values of [99mTc]MEB of 957±78.8 µM and 3547±294 µM; for
OATP1B1 and OATP1B3, respectively).
Chapter 8: Synthesis, in vitro and in vivo evaluation of technetium labeled bile acid analogues
168
Vmax values of [99mTc]DTPA-CDCA and [99mTc]DTPA-CA were lower compared to that of
[99mTc]MEB, indicating that the efficiency of the active transport is much lower for the bile
acid analogues (Table 8.1). However, the transport rates that are observed for [99mTc]DTPA-
CDCA and [99mTc]DTPA-CA are in the same range as the transport rates of endogenous
chenodeoxycholic acid and cholic acid (Vmax Oatp1 taurocholic acid: 62±1.4 pmol/mg
protein/min; Vmax Oatp1 taurodeoxycholic acid: 199±27 pmol/mg protein/min (Hata et al.,
2003)). In conclusion, the synthesized bile acid analogues show more similarities with
endogenous bile acid transport, in comparison with [99mTc]MEB.
To summarize, the new tracers have a higher affinity (Km) and a lower transporter capacity
(Vmax). The clearance (Vmax/Km) is slower for both compounds compared to [99mTc]MEB.
Additionally, our data confirm previous studies that the side chain of bile acids is essential for
NTCP transport. Baringhaus et al. (Baringhaus et al., 1999) determined the pharmacophore of
both NTCP and ASBT (ASBT is the ileal counterpart, NTCP and ASBT are homologous bile
salt transporters), and found that the 3-OH group is not essential for transport by these
transporters, in contrast to the acidic side chain. Our data are completely in line with this
model. In contrast to [99mTc]DTPA-(CD)CA, a fluorescent bile salt conjugate,
taurocholylchlorambucil, was found to be a substrate for human NTCP (Kullak-Ublick et al.,
1997). This compound is conjugated at the 3-OH position of the bile acid, whereas our
compounds are conjugated at the side chain. This confirms that the 3-OH position is not
essential for transport, whereas the side chain is. The less specific bile salt transporters,
OATP1B1 and OATP1B3, are more likely to be involved in uptake of [99mTc]DTPA-(CD)CA
into the hepatocyte, which is in line with the broad substrate specificity of these transporters
(de Graaf et al., 2011). After co-incubation with rifampicin, a known OATP inhibitor, uptake
of [99mTc]DTPA-CDCA in OATP1B1 and OATP1B3 transfected cell lines was 5- and 4- fold
reduced, respectively. Uptake of [99mTc]DTPA-(CD)CA was 2 and 1.3-fold reduced,
respectively. Consequently, this also confirms that these two transporters are involved in the
uptake of [99mTc]DTPA-CDCA and [99mTc]DTPA-CA, since rifampicin is a known OATP
inhibitor (Neyt et al., 2013).
Finally, a difference in in vitro uptake between the two analogues was observed, probably due
to the presence or absence of the hydroxyl group at the C12 position. Our findings are in
agreement with Hata et al. (Hata et al., 2004), who stated that the transport of trihydroxy bile
acids was below that of dihydroxy bile acids. Indeed, we also reported that the transport of the

Chapter 8: Synthesis, in vitro and in vivo evaluation of technetium labeled bile acid analogues
169
trihydroxy analogue, [99mTc]DTPA-CA is 2.5- and 3-fold lower in OATP1B1 and OATP1B3
transfected cell lines, respectively, compared to the transport of the dihydroxy analogue
[99mTc]DTPA-CDCA. This difference in transport was also reflected in the in vivo results.
Vesicular efflux experiments identified MRP2 as the involved efflux transporter, and not
BSEP. Uptake in MRP2 transfected inside-out vesicles at 60 minutes was respectively 2- and
1.5-fold higher in presence of ATP, compared to conditions without ATP. This is in
accordance with the findings of Gerloff et al. (Gerloff et al., 1998), who demonstrated that
unconjugated cholate is not transported by rat Bsep. This is also supported by the observation
that in patients with a defect in bile acid conjugation practically no unconjugated bile acids
are found in bile (Carlton et al., 2003). Additionally, de Waart et al. (de Waart et al., 2010)
stated that CLF is no BSEP substrate. There seems to be a negative correlation between BSEP
substrates and molecular weight. MRP2, in contrast, can accommodate larger molecules than
BSEP. Since the molecular weight of the bile acid analogues in this study was almost doubled
due to DTPA coupling to the primary bile acid, efflux transport by MRP2 and not BSEP can
be explained by the size of the analogues. Our findings are thus completely in line.
Preclinical in vivo evaluation revealed that both compounds showed uptake in the liver and
efflux to gallbladder and intestines. [99mTc]DTPA-CDCA showed more uptake in the liver
and efflux to gallbladder and intestines compared to [99mTc]DTPA-CA that is cleared in a
higher extent by the kidneys. This is in line with the findings of Hata et al. (Hata et al., 2003),
who stated that dihydroxy bile acids show better transport compared to trihydroxy bile acids.
Additionally, our in vitro data also support these in vivo findings: uptake of [99mTc]DTPA-CA
was lower compared to [99mTc]DTPA-CDCA in transfected OATP1B1 and OATP1B3 cells.
No enterohepatic recirculation was observed for both compounds. Asbt is the ileal counterpart
(homologous bile salt transporters) of Ntcp (Dawson et al., 2009), and consequently, these in
vivo data, together with the finding that rifampicin can inhibit transport of both tracers,
support the finding that Ntcp is not involved in transport of [99mTc]DTPA-(CD)CA. Since
there is no recirculation of these bile acids analogues, the radiation dose is reduced.
Our in vitro data also supports the in vivo findings of the current study and a previous study in
which we investigated the hepatobiliary transport of [99mTc]MEB (Neyt et al., 2013). We
observed lower Vmax values for [99mTc]DTPA-(CD)CA compared to [99mTc]MEB. In vivo, we
also observed slower transport compared to [99mTc]MEB. The time to peak in the liver was

Chapter 8: Synthesis, in vitro and in vivo evaluation of technetium labeled bile acid analogues
170
2.5 minutes for [99mTc]MEB, whereas the time to peak was 12.0 and 12.7 minutes for
[99mTc]DTPA-CDCA and [99mTc]DTPA-CA, respectively.
Determination of the influence of newly synthetized drugs on liver transporters is important to
detect possible pharmacological inhibition that can lead to hepatotoxicity. To assess the effect
of pharmacological inhibition on transporter activity, rifampicin was administered as model
drug, by both the intraperitoneal and the intravenous routes. This double administration led to
impaired uptake of both tracers. This was reflected in a low maximum uptake value in the
liver and elevated blood concentrations. These tracers allow the detection and quantification
of impaired hepatobiliary transport.
To conclude, the current study showed that [99mTc]DTPA-CDCA as an imaging probe shows
better in vitro and in vivo characteristics compared to [99mTc]DTPA-CA. It is mainly taken up
in the hepatocytes by OATP1B1 and OATP1B3; and is secreted into bile canaliculi via
MRP2. Dynamic µSPECT imaging can be a useful noninvasive method of visualizing and
quantifying hepatobiliary transporter functionality and disturbances thereof in vivo, which
could predict drug pharmacokinetics.

Chapter 8: Synthesis, in vitro and in vivo evaluation of technetium labeled bile acid analogues
171
References Anelli PL, Lattauda L, Lorusso V, Lox G, Morisetti A, Morosini P, et al. Conjugates of gadolinium complexes to
bile acids as hepatocyte-directed contrast agents for magnetic resonance imaging. J Med Chem 2004;47:3629-
2641.
Baringhaus KH, Matter H, Stengelin S, Kramer W. Substrate specificity of the ileal and the hepatic Na+/bile acid
cotransporters of the rabbit. II. A reliable 3D QSAR pharmacophore model for the ileal Na+/bile acid
cotransporter. J Lipid Res 1999;40:2158-2168.
Carlton VE, Harris BZ, Puffenberger EG, Batta AK, Knisely AS, Robinson DL, et al. Complex inheritance of
familial hypercholanemia with associated mutations in TJP2 and BAAT1. Nat Genet 2003;34:91–96.
Cui Y, König J, Leier I, Buchholz U, Keppler D. Hepatic uptake of bilirubin and its conjugates by the human
organic anion transporter SLC21A6. J Biol Chem 2001;273:9626-9630.
Dawson PA, Lan T, Rao A. Bile acid transporters. J Lipid Res 2009;50:2340–2357.
de Graaf W, Häusler S, Heger M, van Ginhoven TM, van Cappellen G, Benink RJ, et al. Transporters involved
in the hepatic uptake of [99mTc]-mebrofenin and indocyanine green. J Hepatol 2011;54:738–745.
de Waart DR, Häusler S, Vlaming MLH, Kunne C, Hänggi E, Gruss HJ, et al. Hepatic transport mechanisms of
cholyl-L-lysyl-fluorescein. Journal Pharmacol Exp Ther 2010;334:78-86.
Gerloff T, Stieger B, Hagenbuch B, Madon J, Landmann L, Roth J, et al. The sister of P-glycoprotein represents
the canalicular bile salt export pump of mammalian liver. J Biol Chem 1998; 273:10046–10050.
Hata S, Wang P, Eftychiou N, Ananthanarayanam M, Batta A, Salen G, et al. Substrate specificities of rat oatp1
and ntcp: implications for hepatic organic anion uptake. Am J Physiol Gastrointest Liver Physiol
2003;285:G829-G839.
Kullak-Ublick GA, Glasa J, Böker C, Oswald M, Grützer U, Hagenbuch B, et al. Chlorambucil-taurocholate is
transported by bile acid carriers expressed in human hepatocellular carcinomas. Gastroenterology
1997;113:1295-1305.
Maddrey WC. Drug-induced hepatotoxicity. J Clin Gastroenterol. 2005;39:S83-S89.
Milkiewicz P, Mills CO, Hubscher SG, Cardenas R, Cardenas T, Williams A, et al. Visualization of the transport
of primary and secondary bile acids across liver tissue in rats: in vivo study with fluorescent bile acids. J Hepatol
2001;34:4-10.
Neyt S, Huisman MT, Vanhove C, De Man H, Vliegen M, Moerman L et al. In vivo visualization and
quantification of (disturbed) Oatp mediated hepatic uptake and Mrp2 mediated biliary excretion of [99mTc]-
mebrofenin in mice. J Nucl Med 2013;54:624-630.

Chapter 8: Synthesis, in vitro and in vivo evaluation of technetium labeled bile acid analogues
172
Pandey PS, Rai R, Singh RB. Synthesis of cholic acid-based molecular receptors : head-to-head cholaphanes. J
Chem Soc 2002;1:918-923.
Rohacova J, Marin ML, Martinez-Romero A, O’Connor JE, Gomez-Lechon MJ Donato MT et al. Synthesis of
new, UV-photoactive dansyl derivatives for flow cytometric studies on bile acid uptake. Org Biomol Chem
2009;7:4973-4980.
Shitara Y, Sato H, Sugiyama Y. Evaluation of Drug-Drug Interaction in the Hepatobiliary and Renal Transport
of Drugs. Annu Rev Pharmacol Toxicol. 2005;45:689-723.
Sinha D, Shukla S, Chuttani K, Chandra H, Mishra AK. Synthesis and biological evaluation of (99m)Tc -DTPA-
bis(His) as a potential probe for tumor imaging with SPECT. Cancer Biother Radiopharm 2009, 24:615-620.

Chapter 9: General discussion
173
Chapter 9.
General discussion

Chapter 9: General discussion
174

Chapter 9: General discussion
175
Drug induced liver injury (DILI) is the most frequent single cause of safety-related
withdrawal of drugs from the market (for example iproniazid, troglitazone, benoxaprofen,
etc.). Additionally, it is a major cause of attrition in the drug development process. Therefore,
it is important to assess these interactions early in the drug development process.
Drug-induced cholestasis is a type of DILI that can result from defects in bile formation in the
hepatocytes or flow at the bile duct level and the retention of bile acids leads to liver injury. It
presents as an acute or chronic illness that will fade out after termination of the medication.
Many cases of drug-induced cholestasis are a result from functional inhibition of
hepatobiliary transporter by the drug or its metabolites. When hepatobiliary uptake
transporters are inhibited, it can cause drug-drug interactions, bilirubinemia or
hypercholanemia. For example, OATPs mediate the uptake of antibiotics, statins,
chemotherapeutic agents, which are associated with cholestatic liver injury. A significant
increase in statin concentration in blood is observed after cyclosporine administration, due to
OATP1B1 inhibition. Additionally, OATPs are associated with drug-induced
hyperbilirubinemia, which causes transient jaundice due to impaired bilirubin clearance.
Drugs that can cause hyperbilirubinemia are for example atazanavir, rifampicin, cyclosporine
A, saquinavir, etc. Drug interference with MRP2 can cause hyperbilirubinemia. BSEP
inhibition is also a major cause of drug-induced cholestasis: cyclosporine A, glibenclamide,
troglitazone, rifampicin, etc. for example exibit cis-inhibition of BSEP in a concentration
dependent manner. Inhibition of NTCP can lead to hypercholanemia. As stated before, it is
important to detect these interactions from early on.
Therefore, in this work our aim was to develop non-invasive predictive methods to visualize
and quantify disturbed hepatobiliary transport by drugs in mice as an alternative to the
existing invasive techniques. Rifampicin was used as model compound, since it is a known in
vitro and in vivo OATPs/Oatps and in vitro Mrp2 inhibitor. Rifampicin is both substrate and
inhibitor of OATP/Oatps. 1 oral dose of 10 mg/kg in mice ensures plasma and liver
concentrations of 11,9 and 35 µM, respectively. Double administration of rifampicin (100
mg/kg i.p. and 25 mg/kg i.v.), which was used in this work, ensures high rifampicin levels in
blood and liver during the dynamic SPECT measurements, which in turn ensures Oatp and
Mrp2 inhibition.
In this work, our goal was to answer four research questions.

Chapter 9: General discussion
176
Question 1: Is it possible to visualize and quantify altered hepatobiliary transport in
mice? (Chapter 5)
We proposed a non-invasive method to visualize and quantify altered hepatobiliary
transporter function by means of SPECT imaging of [99mTc]MEB in mice. Out of dynamic
SPECT measurements, time activity curves (TACs) of the liver, gallbladder+intestines and
blood pool were calculated and several metrics were obtained derived from these curves. The
maximal liver uptake, time-to-peak in the liver and the area under the blood curve (AUCblood)
could be used to quantify normal and disturbed hepatic uptake of [99mTc]MEB from the liver
sinusoids into the hepatocytes via Oatp. The maximal activity in the gallbladder+intestines,
emergence time of the gallbladder and AUCgallbladder+intestines could be used to describe and
quantify normal and altered efflux from the hepatocytes to the gallbladder and intestines, via
Mrp2. Repeated measurements were performed and interanimal and intra-animal variation
was lower than 13% for all metrics. Experiments performed in Oatp1a/1b and Mrp2 knock-
out (KO) mice showed the critical roles of Oatp1a/1b and Mrp2, respectively, in the hepatic
handling of [99mTc]MEB. Differences in metrics between Oatp1a1/1b KO and Mrp2 KO mice
on the one hand and WT mice on the other hand are shown in Table 9.1. Pharmacological
inhibition was achieved by rifampicin administration, a known Oatp and Mrp2 inhibitor.
Rifampicin is both a substrate and inhibitor of Oatp. Therefore, a certain amount of rifampicin
is able to enter the hepatocytes, where it can inhibit Mrp2, which was demonstrated by an
accumulation of [99mTc]MEB in the liver. A comparison of the metrics of rifampicin treated
mice with their vehicle controls is also shown in Table 9.1. To the best of our knowledge, we
were the first to demonstrate in vivo Mrp2 inhibition. Our method offers a novel approach for
in vivo visualizing and quantifying disturbed hepatobiliary transport, and the differentiation
between uptake and efflux alterations. We demonstrated the feasibility of visualizing and
quantifying the effect of Oatp1a/1b and Mrp2 modulation by various drugs in vivo, with
rifampicin as model drugs. Additionally, we were able to show that slight alterations in
transporter activity can be detected with the proposed imaging method. Therefore, this
method offers a promising approach to investigate the interaction between new chemical
entities and hepatobiliary transporters.

Chapter 9: General discussion
177
Table 9.1: Summary of results: comparison of Oatp1a/1b KO, Mrp2 KO and rifampicin treated mice with their
control mice (vehicle controlled or WT mice). GB: gallbladder, GB+I: gallbladder+intestines, *: could not be
observed, nd: not determined.
AUCblood Maximal
activity
liver
Time-
to-
peak
liver
AUCliver Mean
emergence
time GB
Maximal
activity
GB+I
AUCGB+I k12 k21 k20
Oatp1a/1b
KO
↑ ↓ * ↓ * * * nd nd nd
Mrp2 KO = = = ↑ ↑ ↓ ↓ = = ↓
Rifampicin
treated
↑ ↓ ↓ ↑ ↑ ↓ ↓ ↓ ↑ ↓
Question 2: Can this quantification be further refined by kinetic modeling of
[99mTc]MEB? (Chapter 6)
Normal and disturbed hepatobiliary transport of [99mTc]MEB in mice were absolutely
quantified by calculating kinetic parameters from a two-tissue compartmental model. Tracer
kinetic modeling of [99mTc]MEB was performed and the following kinetic parameters were
calculated: k12 that is a measure for the hepatic uptake of [99mTc]MEB from the liver sinusoids
into the hepatocytes via Oatp, k21 that is a measure for the basolateral efflux of [99mTc]MEB
and k20 that is a measure for the canalicular efflux of [99mTc]MEB from the liver to the
gallbladder and intestines via Mrp2. Discrimination on a quantitative level between
pharmacological inhibition of uptake and efflux was possible. Similar results were obtained
compared to the study in Chapter 5: Mrp2 KO mice showed normal uptake and decreased
efflux of [99mTc]MEB. Rifampicin treated mice showed decreased uptake and efflux of
[99mTc]MEB. A comparison of the k-values of Mrp2 KO and rifampicin treated mice with
their controls is shown in Table 9.1. Kinetic modeling enables a more robust estimation of
disturbed hepatobiliary transport and estimation of k21, which is a measure for basolateral
efflux. Additionally, a non-invasive image derived method was evaluated to obtain the input
function, using [99mTc]tetrofosmin to visualize the left ventricle. A comparison between the
image derived input function and the sampling blood curve showed similar curves. We can
conclude that these kinetic parameters can also be used to describe disturbed hepatobiliary
transport.

Chapter 9: General discussion
178
Question 3: Is a humanized mouse model useful for the prediction of disturbed human-
type hepatobiliary transport? (Chapter 7)
It was demonstrated that the heterozygous mice, i.e. the mice that exhibit the liver disease
caused by the uPA transgene, had an impaired Oatp and Mrp2 transporter function that was
reflected in a lower maximal liver uptake, a decreased AUC liver and a decreased
AUCgallbladder+intestines. The older the mice get, the better the liver function, due to a spontaneous
somatic deletion of the transgene. Thus, the liver disease in itself causes an impaired liver
function. Chimeric, “humanized” mice exhibited normal uptake values, indicating normal
hepatic blood flow and functional human hepatic uptake transporters of [99mTc]MEB, namely
OATP1B1/3. However, impaired liver efflux of [99mTc]MEB compared to WT mice was
observed. The degree of impaired efflux was dependent on the human albumin level in mouse
serum sample and the weight of the animal. The higher the human serum albumin level, the
higher the repopulation index of the human hepatocytes and the more the efflux was impaired.
This impaired efflux function can be caused by a pronounced interspecies difference in the
biliary excretion of Mrp2/MRP2 at the level of the protein (Vmax) or at the level of the
intrinsic transporter affinity (km) of the substrates, or a combination of both factors. It was
concluded that the chimeric “humanized” mouse model could be useful to study
pharmacologically disturbed hepatobiliary transport. However, the selection of mice must be
handled with care, due to differences between several groups of humanized mice. Molecular
SPECT imaging can be a useful screening method to select a homogenous group of
humanized mice.
Question 4: Can bile acid analogues serve as biomarkers for DILI? (Chapter 8)
Technetium labeled diethylene triamine pentaacetic acid chenodeoxycholic acid
([99mTc]DTPA-CDCA) and technetium labeled diethylene triamine pentaacetic acid cholic
acid ([99mTc]DTPA-CA) were successfully synthesized and radiolabeled with radiochemical
purities higher than 95% within 30 minutes. Both tracers remain stable in their final
formulation or dissolved in the appropriate buffer for up to 4 hours. In vitro cellular uptake
assays showed that OATP1B1 and OATP1B3 were involved in the uptake of both tracers. km
values were in the same range of endogenous bile acids. When these bile acid analogues were
compared to [99mTc]MEB, lower km values were observed, indicating that the active

Chapter 9: General discussion
179
components are larger for the bile acid analogues compared to [99mTc]MEB, resulting in a
higher affinity. Vmax values were lower compared to [99mTc]MEB, which indicates that the
efficiency of the active transport is much lower for the bile acid analogues. However,
transport rates were in the same range as endogenous bile acids. When these bile acid
analogues were compared to each other, less uptake was observed in the cholic acid analogue.
This was also shown in the in vivo results and indicates that the transport of trihydroxy bile
acids, like cholic acid, was below that of dihydroxy bile acids, like chenodeoxycholic acid.
Vesicular efflux experiments identified MRP2 as the involved efflux transporter. In vivo
evaluation in mice showed that both tracers are taken up in the liver and are then transported
to gallbladder and intestines. Additionally, urinary clearance was observed and was larger in
the cholic acid analogue, compared to the chenodeoxycholic acid analogue. After
administration of rifampicin, almost no hepatic uptake and efflux was observed, due to Oatp
and Mrp2 inhibition. Slower transport of both compounds compared to [99mTc]MEB was also
observed in vivo that was in line with the in vitro findings. To the best of our knowledge,
these were the first radiolabeled bile acid analogues that were fully characterized both in vitro
and in vivo.

Chapter 9: General discussion
180

Chapter 10: Broader international context, relevance, and future perspectives
181
Chapter 10.
Broader international context,
relevance, and future
perspectives

Chapter 10: Broader international context, relevance, and future perspectives
182

Chapter 10: Broader international context, relevance, and future perspectives
183
The drug development process is lengthy, costly and takes about 14 years from synthesis to
marketing approval (Figure 10.1). Therefore, new strategies that aid the early detection of
promising candidates or early termination of candidates that are unlikely to be successful,
could improve the drug development process.
Figure 10.1: The drug development pipeline (source: Janssen Pharmaceutica)
Drug induced liver injury (DILI) is a form of acquired liver disease and is a major cause of
safety-related withdrawal of drugs from the market (Figure 10.2). Additionally, it is a major
cause of attrition during the drug development process. Although DILI is a rare event, it still
represents a significant health problem because of its unpredictable nature, poorly understood
pathogenesis and potential to cause a fatal outcome. Since DILI poses a significant burden to
patient safety and to the cost of health care systems, it is crucial to assess the hepatotoxic
potential of new candidate drugs early in the drug development process. It is important to
improve the currently available prediction methods to identify and mitigate potential
compound-related safety issues. This will result in safer drugs and a more efficient drug
development process (Regev et al., 2014; Stevens et al., 2009).

Chapter 10: Broader international context, relevance, and future perspectives
184
Figure 10.2: Summary of target organ contributions to drug withdrawals from 1975-2007. Target organs were
identified on the basis of the reasons for withdrawal. CV: cardiovascular; CNS: central nervous system; GI:
gastrointestinal (adapted from Stevens et al., 2009).
Drug-induced cholestasis is one of the major mechanisms in DILI and many cases are a result
from functional inhibition of hepatobiliary transporters by the drug or its metabolites.
Cholestasis occurs when there is a disturbance, metabolic or mechanical, in bile acid
homeostasis. The accumulation of bile acids in hepatocytes can become cytotoxic and cause
liver injury. Table 10.1 provides an overview of drugs that are associated with induced
cholestatic syndromes (de Lima Toccafondo Vieira et al., 2014; Schadt et al., 2016; Padda et
al., 2011; Maddrey et al., 2005).
Table 10.1: Drugs associated with induced cholestatic syndromes. Listed drugs with at least 1000 reported cases
of liver adverse events in the WHO database (adapted from de Lima Toccafondo Vieira et al., 2014 ).
Clinical manifestation List of causative drugs
Bland cholestasis Anabolic steroids, azathioprine, cetirizine, cyclosporine A, glimepiride,
nevirapine, tamoxifen
Cholestatic hepatitis Acitretin, amoxicillin-clavulanic acid, atorvastatin, azathioprine, bupropion,
captopril, celecoxib, carbamazepine, chlorpromazine, fenofibrate,
gabapentin, glimepiride, isoniazid, itraconazole, metformin, methyldopa,
macrolide antibiotics, orlistat, propafenone, propylthiouracil, risperidone,
terbinafine, ticlopidine, tricyclic antidepressants, troglitazone
Cholestatic hepatitis
associated with bile duct
injury
Amoxicillin-clavulanic acid, dextropropxyphene, flucoxacillin, pioglitazone
Vanishing bile duct syndrome Amitriptyline, amoxicillin/clavulan ic acid, azathioprine, barbiturates,
carbamazepine, chlorpromazine, cimetidine, ciprofloxacin, clindamycin,

Chapter 10: Broader international context, relevance, and future perspectives
185
diazepam, erythromycin, estradiolb, flucloxacillin, glibenclamide,
haloperidol, ibuprofen, imipramine, methyltestosterone, phenytoin,
terbinafine, tetracyclines, trimethoprim sulfamethoxazole
Unconjugated
hyperbilirubinemia
Cyclosporine A, indinavir, rifampicin
Currently, interactions of candidate drugs with hepatic transporters are investigated by means
of in vitro, in silico and invasive, expensive and time-consuming in vivo experiments. An
overview of the available methods is given in Table 10.2.
Table 10.2: Current methods for the identification of drugs with cholestatic poten tial (adapted from de Lima
Toccafondo Vieira et al., 2014).
In vitro methods Vesicular transport assay using membrane vesicles
Transfected cell lines
Suspended hepatocytes
In vitro biliary clearance technique using accumulation studies in
sandwich-cultured hepatocytes (human and preclinical species)
Sandwich-cultured hepatocyte uptake and efflux assays
Ex vivo liver perfused technique
Xenobiotic metabolism
In vivo based-methods Blood chemistry (bile acids, bilirubin, etc.)
Hepatobiliary transporters rodent wild-type and knock-out models
Bile duct-cannulated rodent models
In silico methods Structure-activity relationship (SAR) and quantitative SAR modeling
3D-pharmacophore modeling
Chemical category approach
Analogue/read-across approach
In vitro methods are valuable to provide an efficient development of safer drugs by
identifying hepatotoxic potential during early stages. Additionally, these assays contribute to
the understanding of the pathogenic mechanisms, and can assist in the design and testing of
alternative compounds. An ideal in vitro model resembles the in vivo situation with relevant
liver functions and mechanisms of hepatotoxicity. In vitro high-throughput assays allow early
estimation of the potential cytotoxic effect that might otherwise go undetected during
preclinical development (de Lima Toccafonda Vieira et al., 2014).

Chapter 10: Broader international context, relevance, and future perspectives
186
Two different types of in vitro assay systems can be distinguished: membrane-based and cell-
based assays. Membrane based assays use for example membranes isolated from baculovirus-
infected cells overexpressing BSEP/Bsep. BSEP inhibition was considered as the major
mechanism of drug induced cholestasis and therefore, the majority of the in vitro models rely
on detection of BSEP inhibition. However, other mechanisms (for example inhibition of other
bile acid transporters) are involved. Therefore, cell lines transfected with human hepatic
transporters were widely used. Additionally, cell-based assays were introduced as in vitro
model to assess drug-induced toxicity caused by bile acid accumulation as a result of
disturbed bile acid homeostasis, such as suspended hepatocytes and sandwich-cultured human
hepatocytes (SCHH). SCHH allow simultaneous evaluation of hepatic uptake and efflux
transport at the basolateral membrane, as well as biliary secretion at the canalicular membrane
(Oorts et al., 2016; de Lima Toccafonda Vieira et al., 2014; Annaert et al., 2005; Wolf et al.,
2010; Nakanishi et al., 2011).
In silico methods use computational modeling algorithms to gain insight into transporter-
substrate interactions. These models can identify chemical components that are important for
interaction with hepatic transporters.
During drug development, preclinical in vivo safety experiments are required. In these toxicity
studies, increasing amounts of potential new drugs are administered to animals. Blood and
bile samples are subsequently taken to measure bile acid and bilirubin concentrations in blood
and bile (Bergman et al., 2010). These in vivo experiments require liver tissue and bile
samples and are therefore very invasive. In addition, these studies cannot distinguish between
uptake or efflux interactions.
In this thesis, non-invasive in vivo methods were proposed as an alternative to the invasive,
time-consuming and expensive in vivo models that are currently available to study drug
induced cholestasis. The presented methods offer pharmaceutical companies a powerful non-
invasive tool to visualize and quantify possible interactions of new candidate drugs with
hepatic transporters and to identify drug-drug interactions by means of molecular SPECT
imaging.

Chapter 10: Broader international context, relevance, and future perspectives
187
Our methods are innovative, since we are using a combination of dynamic SPECT imaging
and biomarkers (mebrofenin and bile acid analogues, both labeled with technetium) for
visualizing and quantifying normal and disturbed hepatobiliary transport. Additionally, we
were able to quantitatively discriminate between uptake and efflux alterations. We identified
several parameters that were able to quantify alterations in hepatic uptake and/or efflux using
[99mTc]MEB, [99mTc]DTPA-CDCA and [99mTc]DTPA-CA. Here, [99mTc]DTPA-CDCA and
[99mTc]DTPA-CA were the first radiolabeled bile acid analogues that were completely
characterized both in vitro and in vivo.
Previously, Frisch et al. (Frisch et al., 2013), Jia et al. (Jia et al., 2014) and Schacht et al.
(Schacht et al., 2016) also developed radiolabeled bile acid analogues to study drug-induced
cholestasis or FXR-related diseases. However, no inhibitors were evaluated and no in vitro
characterization was done. In this context, our technetium labeled bile acid analogues are the
first analogues that were fully evaluated.
The non-invasive SPECT imaging protocol of [99mTc]MEB can also be applied for the
screening of the chimeric, “humanized” mouse model to carefully select a homogenous group
of mice that can be used for the assessment of new candidate drugs in pharmacokinetic and
metabolism studies. To detect small alterations between two groups, it is important to have a
homogenous group of mice (Sanoh et al., 2014; Jaiswal et al., 2014). This chimeric model
also offers advantages compared to normal mice, due to the preclinical species specificity
issue in which many hepatotoxicants remain undetected in preclinical toxicity studies.
Besides drug induced cholestasis, the bile acid analogues proposed in this thesis can also be
used for other applications like functional liver assessment in cirrhosis, fibrosis, radiation
induced liver injury, etc. Additionally, these analogues can be used to evaluate specific
tumors. For example, OATP1B1 and OATP1B3 is downregulated in liver tumors, and
OATP1B3 is frequently expressed in cancers of the gastrointestinal tract, breast, prostate and
lung and may be assoiciated with different clinical outcomes. For example, OATP expression
in breast cancer is significantly associated with a hormone-dependent growth mechanism of
the breast cancer, but patients expressing this OATP had a better prognosis. This can be
explained by the fact that OATP also transports anticancer drugs, and this leads to a better
response to anticancer therapy. Therefore, identification of OATP expression in these tumors
can be beneficial and since [99mTc]DTPA-CDCA and [99mTc]DTPA-CA are substrates of

Chapter 10: Broader international context, relevance, and future perspectives
188
OATP1B1 and OATP1B3, these tracers can be used to visualize these tumors (Yamaguchi et
al., 2006; Abe et al., 2001; Buxohofer-Ausch et al., 2013).
However, there is still a need to investigate drug-induced cholestasis that is caused by NTCP
and/or BSEP inhibition. The bile acid analogues used in this thesis are OATP and MRP2
substrates, possibly due to large modifications that were done on the structure of the bile acids
to allow 99mTc labeling. Therefore, 18F labeled bile acid analogues that require only minor
modification on the bile acid structure are currently in development at our laboratory by Stef
De Lombaerde and are very promising. These tracers can be used to assess pharmacological
inhibition of NTCP and BSEP. An additional advantage of these bile acid analogues is their
applicability in PET imaging. Dynamic PET imaging is more feasible in humans compared to
dynamic SPECT and absolute quantification can be easily achieved. A disadvantage is the
need of a cyclotron and the shorter half-life of the 18F isotope.
To conclude, the future perspectives of this work are:
(1) Mechanistic evaluation of new candidate drugs for OATP and/or MRP2 interactions
by means of µSPECT imaging of [99mTc]MEB, [99mTc]DTPA-CDCA or
[99mTc]DTPA-CA in normal or “humanized” mice.
(2) Screening of “humanized” mice to obtain a homogenous animal group for further
studies.
(3) Evaluation of [99mTc]DTPA-CA and [99mTc]DTPA-CDCA for cancers that have
decreased or increased OATP1 expression.
(4) Synthesis, in vitro and in vivo evaluation of 18F labeled bile acid analogues, in order to
search for NTCP and BSEP biomarkers.
(5) Evaluation of radiolabeled bile acid analogues for functional liver assessment in liver
diseases.

Chapter 10: Broader international context, relevance, and future perspectives
189
References Abe T, Unno M, Onogawa T, Tokui T, Kondo TN, Nakagomi R, et al. LST-2, a human liver-specific organic
anion transporter, determines methotrexate sensitivity in gastrointestinal cancers. Gastroenterology
2001:120:1689-1699.
Annaert PP, Brouwer KL. Assessment of drug interactions in hepatobiliary transport using rhodamine 123 in
sandwich-cultured rat hepatocytes. Drug Metab Dispos. 2005;33:388-394.
Buxhofer-Ausch V, Secky L, Wlcek K, Svoboda M, Kounnis V, Briasoulis E, et al. Tumor-specific expression
of organic anion-transporting polypeptides: transporters as novel targets for cancer therapy. J Drug Deliv
2013;Epub.
de Lima Toccafonda Vieira M, Tagliati CA. Hepatobiliary transporters in drug-induced cholestasis: a perspective
on the current identifying tools. Expert Opin Drug Metab Toxicol 2014;10:581-597.
Frisch K, Jakobsen S, Sorenson M, Munk OL, Alstrup AKO, Ott P, et al. [N-methyl-11C]cholylsarcosine, a
novel bile acid tracer for PET/CT of hepatic excretory function: radiosynthesis and proof-of-concept studies in
pigs. J Nucl Med 2012;53:772-778.
Jaiswal S, Sharma A, Shukla M, Vaghasiya K, Rangaraj N, Lal J. Novel pre-clinical methodologies for
pharmacokinetic drug-drug interaction studies: spotlight on “humanized” animal models. Drug Metab Rev
2014;46:475-493.
Jia L, Jiang D, Hu P, Li X, Shi H, Cheng D, et al. Synthesis and evaluation of 18F-labeled bile acid compound: a
potential PET imaging agent for FXR-related diseases. Nucl Med Biol 2014;41:495-500.
Maddrey WC. Drug-induced hepatotoxicity. J Clin Gastroenterol. 2005;39:S83-S89.
Nakanishi T, Shibue Y, Fukuyama Y, et al. Quantitative time-lapse imaging-based analysis of drug-drug
interaction mediated by hepatobiliary transporter, multidrug resistance-associated protein 2, in sandwich-
cultured rat hepatocytes. Drug Metab Dispos . 2011;39:984-991.
Oorts M, Baze A, Bachellier P, Heyd B, Zacharias T, Annaert P, et al. Drug-induced cholestasis risk assessment
in sandwich-cultured human hepatocytes. Tox in Vitro 2016:34:179-186.
Padda MS, Sanchez M, Akhtar AJ, Boyer JL. Drug-induced cholestasis. Hepatology. 2011;53:1377-1387.
Regev A. Drug-induced liver injury and drug development: industry perspective. Semin Liver Dis 2014;34:227-
239.
Sanoh S, Ohta S. Chimeric mice transplanted with human hepatocytes as a model for prediction of human drug
metabolism and pharmacokinetics. Biopharm Drug Dispos 2014;35:71-86.
Schacht C, Sorensen M, Munk OL, Frisch. Radiosynthesis of N-11C-methyl-taurine-conjugated bile acids and
biodistribution studies in pigs by PET/CT. J Nucl Med 2016;57:628-633.
Chapter 10: Broader international context, relevance, and future perspectives
190
Schadt HS, Wolf A, Pognan F, Chibout SD, Merz M, Kullak-Ublick GA. Bile acids in drug induced liver injury:
key players and surrogate markers. Clin Res Hepatol Gastroenterol 2016; in press.
Stevens JL, Baker TK. The future of drug safety testing: expanding the view and narrowing the focus. Drug
Discov Today 2009;14:163-167.
Wolf KK, Vora S, Webster LO, Generaux GT, Polli JW, Brouwer KLR. Use of cassette dosing in sandwich-
cultured rat and human hepatocytes to identify drugs that inhibit bile acid transport Toxicol In vitro.
2010;24:297-309.
Yamaguchi H, Okada M, Akitaya S, Ohara H, Mikkaichi T, Ishikawa H, et al. Transport of fluorescent
chenodeoxycholic acid via the human organic anion transporters OATP1B1 and OATP1B3. J Lipid Res
2006;47:1196-1202.

Chapter 11: Summary - Samenvatting - Curriculum Vitae
191
Chapter 11.
Summary – Samenvatting
Curriculum Vitae

Chapter 11: Summary - Samenvatting - Curriculum Vitae
192

Chapter 11: Summary - Samenvatting - Curriculum Vitae
193
Summary The liver is an important organ for homeostasis. Its most important functions include
glycogen storage, production of plasma proteins and bile acids, elimination of endogenous
substances and secretion of toxic compounds like drugs, carcinogens, etc. Drugs can interfere
with these important functions, which can lead to drug induced liver injury. Drug induced
liver injury is a major cause for the withdrawal of drugs from the market or for the
termination of the development of a new candidate drug. Additionally, up to 15% of the cases
of acute liver failure in Europe and the United States is caused by drug induced liver injury.
An example of interference of new candidate drugs with liver functionality is inhibition of
hepatic transporters. Therefore, new strategies are needed to identify and characterize
interactions of new candidate drugs with hepatic transporters early in the developmental
process. In this thesis, we propose non-invasive methods to assess altered transporter function,
as an alternative of the invasive, time-consuming and expensive preclinical in vivo tests.
Chapter 1 provided an overview of the function of the liver, with a focus on the enterohepatic
cycling of bile acids and their biosynthesis, the most common bile acid transporters and an
introduction on drug induced liver injury. Additionally, the main characteristics of molecular
imaging, and more specifically, preclinical functional SPECT and PET imaging were given.
Dynamic imaging and tracer kinetic modeling was also discussed. Chapter 2 focused on
functional liver imaging and hepatobiliary imaging agents for MR, optical imaging
(fluorescence), PET and SPECT imaging. Bile acid analogues were discussed in detail. The
scope and aims of this thesis were outlined in Chapter 3.
In Chapter 4, the calibration curves of the NaI(Tl) scintalliation detector and SPECT camera
were given. These calibration curves were used in the experimental sections to calculate exact
radioactivity amounts and concentrations from the output of these two devices.
Chapter 5 proposed a non-invasive in vivo method to visualize and quantify normal and
disturbed hepatobiliary transport using [99mTc]mebrofenin ([99mTc]MEB), a tracer that is
routinely used in the clinic to study function and dysfunction of the liver by planar
scintigraphy. Wild type, bile duct ligated (mechanical inhibition), Oatp1a/1b knock-out (KO),
Mrp2 KO and rifampicin treated (pharmacological inhibition) mice were evaluated by means
of dynamic SPECT imaging after [99mTc]MEB injection. It was demonstrated that the
transport activities of Oatp1a/1b (hepatic uptake) and Mrp2 (biliary efflux) could be

Chapter 11: Summary - Samenvatting - Curriculum Vitae
194
quantified simultaneously in vivo. Moreover, pharmacological modulation of these activities
was demonstrated in a dose-dependent manner using rifampicin as a model drug.
In Chapter 6, the quantification of normal and disturbed hepatobiliary transport was further
refined by using tracer kinetic modeling of [99mTc]MEB. A two-tissue compartmental model
was proposed and the dynamic SPECT data of WT, Mrp2 KO and rifampicin treated mouse
was analyzed. Additionally, a non-invasive image-derived method was evaluated to obtain the
blood input function and showed similar metrics compared to manual blood sampling, which
is the gold standard. The kinetic parameters were also able to quantify altered hepatobiliary
transport by Oatp and Mrp2, and to discriminate between altered uptake and efflux.
Chapter 7 characterized [99mTc]MEB transport in chimeric mice with a humanized liver.
These mice were transplanted with human hepatocytes and due to their liver disease and
immunodeficiency successful engraftment was possible. SPECT imaging demonstrated that
humanized mice showed normal hepatic uptake of [99mTc]MEB. However, efflux to
gallbladder and intestines was impaired compared to WT mice. Additionally, when the
different groups (based on different human albumin levels and different weights) of
humanized mice were compared, differences were also observed. Consequently, [99mTc]MEB
SPECT imaging was proposed as non-invasive method to select a homogenous group of
humanized mice for metabolization studies.
In Chapter 8, two primary bile acid analogues were synthesized and evaluated both in vitro
and in vivo to study the effect of pharmacological inhibition on bile acid transport.
Additionally, these compounds were compared to [99mTc]MEB. A technetium labeled
chenodeoxycholic and cholic acid analogue were evaluated: technetium labeled diethylene
triamine pentaacetic acid chenodeoxycholic acid ([99mTc]DTPA-CDCA) and technetium
labeled diethylene triamine pentaacetic acid cholic acid ([99mTc]DTPA-CA). OATP1B1/3 and
MRP2 were identified as the involved transporters of both compounds. In vivo SPECT
evaluation showed uptake in the liver and efflux to gallbladder and intestines.
Pharmacological inhibition with rifampicin blocked almost all the transport of the
compounds.
A general conclusion and an overview of the broader international context, relevance, and
future perspectives were given in Chapter 9 and Chapter 10, respectively.

Chapter 11: Summary - Samenvatting - Curriculum Vitae
195
Samenvatting De lever is een belangrijk orgaan voor homeostase. De meest belangrijke functies van de lever
zijn glycogeen opslag, productie van plasmaproteïnen en galzuren, eliminatie van endogene
stoffen en secretie van toxische stoffen zoals geneesmiddelen, carcinogenen, etc.
Geneesmiddelen kunnen interfereren met deze belangrijke functies, en dat kan dan leiden tot
geneesmiddel geïnduceerde leverschade. Geneesmiddel geïnduceerde leverschade is één van
de voornaamste oorzaken van het uit de handel nemen van geneesmiddelen of van de
vroegtijdige stopzetting van de ontwikkeling van nieuwe geneesmiddelkandidaten.
Daarenboven is meer dan 15% van de gevallen van acute leverschade in Europa en de
Verenigde Staten een gevolg van geneesmiddel geïnduceerde leverschade. Een voorbeeld van
interferentie van geneesmiddelen met leverfunctionaliteit is via inhibitie van transporters die
aanwezig zijn in de lever. Bijgevolg is er een nood aan nieuwe strategieën om interactie van
mogelijks nieuwe geneesmiddelen met deze transporters vroegtijdig te identificeren en te
kwantificeren. In deze thesis worden niet-invasieve methodes om normaal en verstoord
hepatobiliair transport te onderzoeken voorgesteld, als alternatief voor de bestaande invasieve,
tijdrovende en dure preklinische in vivo experimenten.
Hoofdstuk 1 gaf een overzicht van de leverfuncties. De nadruk lag op de enterohepatische
cyclus van galzuren en hun biosynthese, de meest voorkomende galzuurtransporters en een
introductie in verband met geneesmiddel geïnduceerde leverschade. Daarenboven werden de
voornaamste eigenschappen van moleculaire beeldvorming besproken, en meer specifiek, van
preklinische functionele SPECT en PET beeldvorming. Dynamische beeldvorming en
kinetische modelering aan de hand van tracers werd ook uiteen gezet. In Hoofdstuk 2 lag de
focus op functionele lever beeldvorming en hepatobiliary speurstoffen voor MR, optische
beeldvorming (fluorescentie), PET en SPECT beeldvorming. Galzuuranalogen werden in
detail besproken. In Hoofdstuk 3 werden de doelstellingen van deze thesis overlopen.
In Hoofdstuk 4 werd een overzicht gegeven van de kalibratie curves van de NaI(Tl)
scintillatie detector en de SPECT camera. Deze kalibratiecurves werden in de experimentele
hoofdstukken gebruikt worden om de output van de meettoestellen om te zetten naar exacte
hoeveelheden en concentraties radioactiviteit.
Hoofdstuk 5 beschreef een niet-invasieve in vivo methode om normaal en verstoord
hepatobiliair transport te visualiseren en te kwantificeren gebruik makende van
[99mTc]mebrofenin ([99mTc]MEB). [99mTc]MEB wordt routinematig gebruikt in de nucleaire

Chapter 11: Summary - Samenvatting - Curriculum Vitae
196
geneeskunde om de functie en disfunctie van de lever te onderzoeken met behulp van planaire
scintigrafie. Wild type muizen, muizen met een galwegligatie (mechanische inhibitie),
Oatp1a/1b knock-out (KO), Mrp2 KO en rifampicine behandelde (farmacologische inhibitie)
muizen werden onderzocht met behulp van dynamische SPECT beeldvorming na
[99mTc]MEB injectie. Het werd aangetoond dat het mogelijk is om de transportactiviteiten van
Oatp1a/1b (lever opname) en Mrp2 (biliaire efflux) simultaan te kwantificeren in vivo.
Daarenboven kon farmacologische modulatie van deze transporters aangetoond worden op
een dosisafhankelijke manier met rifampicine als modelgeneesmiddel.
In Hoofdstuk 6 werd nagegaan of de kwantificatie van normaal en verstoord hepatobiliair
transport kon uitgebreid worden via kinetische modelering van [99mTc]MEB. Een twee
compartimenteel model werd voorgesteld en de dynamische SPECT data van WT, Mrp2 KO
en rifampicine behandelde dieren werden geëvalueerd met behulp van dit model.
Daarenboven werd een niet-invasieve methode geëvalueerd om de bloedcurve te bekomen
van [99mTc]MEB. Deze curve werd vergeleken met degene die verkregen werd na manuele
bloedname, welke de gouden standaard is, en gelijkaardige curves werden bekomen. De
kinetische parameters die berekend werden met behulp van het model konden gebruikt
worden om normaal en verstoord hepatobiliair transport te kwantificeren. Daarnaast was deze
methode ook in staat verstoorde opname en efflux van elkaar te onderscheiden.
Hoofdstuk 7 karakteriseerde [99mTc]MEB transport in een chimeer muismodel met een
gehumaniseerde lever. Deze muizen werden getransplanteerd met humane levercellen, en
door het feit dat ze immunodeficiënt zijn en een leverziekte hebben, was succesvolle
transplantatie mogelijk. Na SPECT beeldvorming werd aangetoond dat deze muizen normale
opname vertoonden van [99mTc]MEB. Efflux naar galblaas en darmen was echter verstoord in
vergelijking met wild type muizen. Daarenboven werd er een verschil in efflux waargenomen
tussen de verschillende groepen (indeling gebaseerd op hun verschillend humaan
albuminegehalte en gewicht) van gehumaniseerde muizen. Bijgevolg werd SPECT
beeldvorming van [99mTc]MEB voorgesteld als niet-invasieve method om een homogene
groep van gehumaniseerde muizen te selecteren voor metabolisatie studies.
In Hoofdstuk 8 werden twee primaire galzoutanalogen gesynthetiseerd en in vitro en in vivo
geëvalueerd. Daarnaast werden beide stoffen vergeleken met [99mTc]MEB. Een technetium
gelabeld chenodeoxycholzuur and cholzuur analoog werden geëvalueerd: technetium gelabeld
diethylene triamine pentaacetic acid chenodeoxycholic acid ([99mTc]DTPA-CDCA) en

Chapter 11: Summary - Samenvatting - Curriculum Vitae
197
technetium gelabeld diethylene triamine pentaacetic acid cholic acid, ([99mTc]DTPA-CA).
OATP1B1/3 en MRP2 werden geïndentificeerd als betrokken transporters van beide stoffen.
SPECT evaluatie toonde opname in de lever en efflux naar galblaas en darmen aan.
Farmacologische inhibtie met rifampicine blokkeerde bijna al het levertransport van de
stoffen.
Een algemene conclusie en een overzicht van de bredere internationale context, relevantie en
toekomstperspectieven zijn beschreven in Hoofdstuk 9 en Hoofdstuk 10, respectievelijk.

Chapter 11: Summary - Samenvatting - Curriculum Vitae
198
Curriculum Vitae PERSONALIA
Sara Neyt
Born: January 18th 1987, Gent (Belgium)
EDUCATION
1999-2005 Wetenschappen – modern talen
Sint-Franciscusinstituut Evergem
2005-2008 Bachelor in Sciences: Biomedical Sciences
Ghent University, cum laude
2008-2010 Master in Sciences: Biomedical Sciences
Ghent University, magna cum laude
2010-Today PhD in Pharmaceutical Sciences
Ghent University
COURSES/TRAINING
2015 Project Management – T.O.M., Tom Jacobs
Translational Biomedical In vivo Imaging, Ghent University
2013 Effective Scientific Communication, Principae
Basic Kinetic Modelling in Molecular Imaging, Copenhagen University
Hospital
2012 Statistics, Ghent University
2011 Basic course in laboratory animal sciences, FELASA B+C, Ghent University
Avanced Academic Englisch: Writing Skills, Ghent University
PMOD Small Animal Imaging and Analysis Course, Zürich
Experimental design and practical data analysis in Positron Emission
Tomography, Imperial College London
2008 Business English, Ghent University

Chapter 11: Summary - Samenvatting - Curriculum Vitae
199
PEER REVIEWED PUBLICATIONS
Neyt S., Huisman M., Vanhove C., De Man H., Vliegen M., Moerman L., Dumolyn C., Mannens G., and De
Vos F. In vivo visualization and quantification of (disturbed) Oatp mediated hepatic uptake and Mrp2 mediated
biliary excretion. Journal of Nuclear Medicine. 2013; 54 (4): 624-630.
Neyt S., Vliegen M, Verreet B, De Lombaerde S, Braeckman K, Vanhove C, Huisman MT, Dumolyn C,
Kersemans K, Hulpia F, Van Calenbergh S, Mannens G, De Vos F. Synthesis, in vitro and in vivo evaluation of
technetium labeled bile acid analogues to study (altered) hepatic transporter function. Nucl Med Biol 2016;
43:642-649.
Neyt S, Vanhove C, De Lombaerde S, Deblaere K, De Vos F. Kinetic modeling of 99mTc-Mebrofenin to
quantify altered hepatobiliary transport in wild type, Mrp2 knock-out and rifampicin treated mice. Submitted to
Contrast Media & Molecular imaging.
Van Laeken N, Taylor O, Polis I, Neyt S, Kersemans K, Dobbeleir A, Saunders J, Goethals I, Peremans K, De
Vos F. In vivo Evaluation of Blood Based and Reference Tissue Based PET Quantifications of [11C]DASB in
the Canine Brain. Plos One. 2016;11(2):eCollection 2016.
Dumolyn C., Schoonooghe S., Moerman, L., Neyt S., Haustraete J. and De Vos F. Generation and in vivo
characterization of a chimeric alphavbeta5-targeting antibody 14C5 and its derivatives. European Journal of
Nuclear Medicine and Molecular Imaging Research. 2013; 3 (1): 25.
De Lombaerde S, Neyt S, Kersemans K, Verhoeven J, Devisscher L, Van Vlierberghe H, Vanhove C, De Vos F.
Synthesis, in vitro and in vivo evaluation of 3B-18F-fluorocholic acid to detect drug-induced cholestasis in mice.
Submitted to J Nucl Med 2016.
Van Welden S, De Vos M, Wielockx B, Tavernier S, Dullaers M, Neyt S, et al. Hematopoietic prolyl
hydroxylase-1 deficiency promotes M2 macrophage polarization and is both necessary and sufficient to protect
against experimental colitis. Submitted to J Pathol 2016.
ORAL PRESENTATIONS
Neyt S, Vliegen M, Verreet B, De Lombaerde S, Braeckman K, Vanhove C, Huisman MT, Dumolyn C,
Kersemans K, Mannens G, De Vos F. Technetium labeled bile acid analogues: synthesis, in vitro and in vivo
evaluation to study (altered) hepatic transporter function. Knowledge for Growth 2016, Gent, Belgium.
Neyt S., Vliegen M, Verreet B, Kersemans B, Huisman MT, Mannens G, De Vos F. Synthesis of technetium
labeled bile acid analogue to study hepatic transporter function. IIS-CED Meeting, 2013, Heidelberg, Germany.
Neyt S., Huisman M.T., Mannens G., De Man H., Vliegen M., Moerman L., Bruneel S, De Vos F. In vivo
µSPECT visualisation of transport-mediated hepatic uptake and efflux of a Tc-labeled HIDA analogue, and
inhibition thereof. 15th Forum of Pharmaceutical Sciences, 2011, Spa, Belgium.

Chapter 11: Summary - Samenvatting - Curriculum Vitae
200
POSTER PRESENTATIONS
Neyt S, Vliegen M, Verreet B, Huisman MT, Braeckman K, Dumolyn C, Vanhove C, Steemans K, Kersemans
K, Denecker N, Vandendriessche V, Mannens G, De Vos F. Technetium labeled (deoxy)cholic acid analogues:
Synthesis, in vitro and in vivo evaluation to study (altered) hepatic transporter function. World Molecular
Imaging Congress, 2015, Honolulu, USA.
Neyt S, Vanhove C, Huisman MT, Mannens G, De Vos F. In vivo µSPECT imaging of 99mTc-mebrofenin to
assess impaired hepatobiliary transport: a pharmacokinetic modeling study. World Molecular Imaging Congress,
2015, Honolulu, USA.
Neyt S., Vliegen M, Verreet B, Huisman MT, Kersemans K, Dumolyn C, Vanhove, Geert Mannens C, De Vos
F. Synthesis of technetium labeled bile acid analogues to study hepatic transporte r function in mice. World
Molecular Imaging Congress, 2014, Seoul, Korea.
Neyt S., Meuleman P., Verhoye L., Vanhove C., Mannens G., De Vos F. (2013). 99mTc-mebrofenin disposition
in human liver uPA SCID mice. World Molecular Imaging Congress, 2013, Savannah, USA.
Neyt S., Huisman M.T., Dumolyn C., Vliegen M., Van hove C., Mannens G., De Vos F. Non-invasive method to
obtain blood curves of 99mTc-mebrofenin (2013). World Molecular Imaging Congress, 2013, Savannah, USA.
Neyt S., Huisman M., Mannens G., De Man H., Vliegen M., Dumolyn C., Vanhove C., De Vos F. (2012).
Molecular imaging as a non-invasive tool to visualize impaired hepatobiliary transporter function in slco1a/1b
and abcc2 knock-out mice. Society of Nuclear Medicine and Molecular Imaging, 2012, Miami. USA. 3rd place
poster award winner
Neyt S., Huisman M.T., Mannens G., De Man H., Vliegen M., Moerman L., De Vos F. (2011). In vivo µSPECT
visualisation of transport-mediated hepatic uptake and efflux of 99mTc-mebrofenin, and inhibition thereof with
rifampicin. World Molecular Imaging Congress, 2011, San Diego, USA.