Non-individual transport Paving the way for renewable...
89
Non-individual transport – Paving the way for renewable power-to-gas (RE-P2G) SECTOR ANALYSIS AND POLICY RECOMMENDATION July 2016
-
Upload
phungthuan -
Category
Documents
-
view
214 -
download
0
Transcript of Non-individual transport Paving the way for renewable...

Non-individual transport – Paving the way for renewable power-to-gas (RE-P2G) S E C TO R A N A LY S I S A N D P O L I C Y R E C O M M E N D AT I O N
July 2016

A B O U T T H E I E A R E T D T E C H N O L O G Y
C O L L A B O R AT I O N P R O G R A M M E
The IEA Renewable Energy Technology Deployment Technology Collaboration Programme (IEA RETD
TCP) provides a platform for enhancing international cooperation on policies, measures and market
instruments to accelerate the global deployment of renewable energy technologies.
IEA RETD TCP aims to empower policy makers and energy market actors to make informed decisions by:
(1) providing innovative policy options; (2) disseminating best practices related to policy measures and
market instruments to increase deployment of renewable energy, and (3) increasing awareness of the
short-, medium- and long-term impacts of renewable energy action and inaction.
For further information please visit: http://iea-retd.org or contact [email protected].
Twitter: @IEA_RETD
IEA RETD TCP is part of the IEA Energy Technology Network.
D I S C L A I M E R
The IEA RETD TCP, formally known as the Technology Collaboration Programme for Renewable Energy
Technology Deployment, functions within a Framework created by the International Energy Agency
(IEA). Views, findings and publications of IEA RETD TCP do not necessarily represent the views or
policies of the IEA Secretariat or of its individual Member Countries.
C O P Y R I G H T
This publication should be cited as:
IEA-RETD (2016), Non-individual transport – Paving the way for renewable power-to-gas (RE-P2G), [de
Bucy, J. et al., ENEA Consulting and Fraunhofer IWES], IEA Technology Collaboration Programme for
Renewable Energy Technology Deployment (IEA RETD TCP), Utrecht, 2016.
Copyright © IEA RETD TCP 2016
(Stichting Foundation Renewable Energy Technology Deployment)

A C K N O W L E D G E M E N T S
The Authors would like to thank the IEA RETD TCP RE-P2G Project Steering Group (PSG) members for
their guidance and support throughout the project.
Project Steering Group
Sarina Keller DLR, Project Steering Group Chair
Dirk Peters BMWI, Germany
Jimmy Royer NRCan, Canada
Mary-Rose Valladares IEA HIA, USA
Pauk Lucchese CEA, France
Hannula Ikka VTT, Finland
Andreas Lischke DLR, Germany
Fabian Burggraf DLR, Germany
Cedric Thoma DGEC, France
David de Jager IEA RETD TCP Operating Agent, Ecofys
Kristian Petrick IEA RETD TCP Operating Agent, All Green Energies
A U T H O R S
Lead Author
Jacques de Bucy (ENEA Consulting)
Contributing Authors
Power-to-gas technologies description, case studies and impact of policies, conclusions &
recommendations: Pierre Dennery, Fabiola Graveaud (ENEA Consulting)
Policies: Ramona Schröer, Henning Hahn, Jochen Bard (Fraunhofer IWES).

RE-P2G – Renewable power-to-gas for the non-individual road transport sector, 2016
TA B L E O F C O N T E N T S
Summary of Findings ............................................................................................................................... 1
Context and approach .......................................................................................................................... 1
Energy efficiency and environmental performance ............................................................................. 1
Potential early adopters and mass markets for “power-to-gas”in the non-individual transport ........ 3
market introduction strategy ............................................................................................................... 4
Recommended policy instruments ...................................................................................................... 4
Glossary ................................................................................................................................................... 6
Introduction ............................................................................................................................................. 7
Context ................................................................................................................................................. 7
Objectives ............................................................................................................................................ 7
1. Power-to-gas Technologies ........................................................................................................... 8
1.1. Description of Technologies ...................................................................................................... 8
1.1.1. Power-to-gas production plants ........................................................................................ 9
1.1.2. Fuel infrastructures for distribution .................................................................................. 10
1.1.3. Vehicles .............................................................................................................................. 12
1.2. Constraints on electricity supply for renewable power-to-gas ................................................. 14
1.2.1. CO2 emissions of power-to-gas mobility ............................................................................ 14
1.2.2. Conditions to renewable electricity access ....................................................................... 15
1.3. Demand ..................................................................................................................................... 16
1.3.1. Review of rationale and demand drivers from early adopters .......................................... 16
1.3.2. Review of current leading initiatives on power-to-gas mobility ........................................ 17
1.3.3. Market segmentation and identification of the most promising segments ...................... 20
2. Preliminary comparison of case studies ....................................................................................... 25
2.1. Method ..................................................................................................................................... 25
2.1.1. Total Cost of Ownership ..................................................................................................... 25
2.1.2. Assumptions for the preliminary comparison ................................................................... 28
2.2. Results ....................................................................................................................................... 28
3. Detailed cases and impact of policies ........................................................................................... 33
3.1.1. Method .............................................................................................................................. 33
3.1.2. Specific assumptions for the market uptake scenario ....................................................... 33
3.1.3. Method for modelling the learning curve of FCEV and infrastructure costs ..................... 33
3.1.4. Specific assumptions for the large scale deployment scenario ......................................... 34
3.2. Results ....................................................................................................................................... 35
3.2.1. Long Range Captive Light Duty Vehicle Fleets ................................................................... 35
3.2.2. Inter-City Buses .................................................................................................................. 42
4. Policies .......................................................................................................................................... 47
4.1. Screening of policy instruments ................................................................................................ 47
4.2. Selected set of policies .............................................................................................................. 50
4.2.1. Overview of relevant policy instruments ........................................................................... 50
4.2.2. Main policy instruments to support P2G in non-individual transport ............................... 51
4.2.3. Supporting policy instruments ........................................................................................... 57
4.2.4. The role of the country context and governments’ vision ................................................. 58
5. Conclusions& recommendations .................................................................................................. 59
6. Bibliography .................................................................................................................................. 62
7. Appendix ....................................................................................................................................... 65
7.1. Block diagram of power-to-gas technologies in case studies modelled ................................... 65

RE-P2G – Renewable power-to-gas for the non-individual road transport sector, 2016
7.2. Overview of Relevant policy instrumenTS ................................................................................ 66
7.1. Input data for the case studies ................................................................................................. 67
7.2. Input data and cost comparison between range extended and full H2 LDVs ........................... 70
7.3. Sensitivity analysis on 2015 and 2030 LDV TCOs for hydrogen and sng vehicles ..................... 72
7.4. Detailed description of the supporting policy measures .......................................................... 73
7.4.1. Regulation .......................................................................................................................... 73
7.4.2. Financial support ............................................................................................................... 76
7.4.3. Technology development and acceptance ........................................................................ 78
7.5. Short description of unselected policy measures ..................................................................... 79
7.5.1. Regulation .......................................................................................................................... 79
7.5.2. Financial support ............................................................................................................... 80
7.5.3. Technology development and acceptance ........................................................................ 81
Member countries oF the IEA RETD Technology Collaboration Programme........................................... 83

RE-P2G – Renewable power-to-gas for the non-individual road transport sector, 2016
1
S U M M A RY O F F I ND I N GS
C O N T E X T A N D A P P R O A C H
The transport sector is a major contributor to CO2 emissions, accounting for 23% of CO2 emissions
worldwide in 2013, with 75% of these emissions coming from road transportation1. An array of
alternative technologies to conventional fossil fuels internal combustion engines will be needed to
decarbonise the sector. Among them, power-to-hydrogen2 and power-to-SNG3 represent relevant
technical solutions if the power used is produced from renewable energies. They also represent an
opportunity for large scale storage of renewable electricity in a context of high penetration of
renewables in the electric grid.
Should power-to-gas technology be pursued as an option for decarbonising the transport sector and if
so, how can policy makers economically promote its development?
To answer this question, non-individual transport sector market segments were first evaluated
qualitatively to assess their potential for renewable power-to-gas. City and Inter-Urban Buses (i.e. short
and long distance city buses), Captive Light Duty Vehicle fleets and City Delivery Trucks segment were
found to be the most promising in terms of attractiveness, overall potential for CO2 reduction, power of
public authorities, competition and development status of the fuel cell mobility option and selected for
further analysis. A detailed modelling of the Total Cost of Ownership (TCO) on those market segments,
including costs of vehicles, infrastructure, fuel, electricity (etc.), was carried out and TCOs were
compared with those of other competing options (diesel, CNG, biomethane and battery electric
vehicles). Finally, a selection of the most suited policy instruments was made and the amount of public
funding required to launch power-to-gas technologies on those market segments was evaluated.
E N E R G Y E F F I C I E N C Y A N D E N V I R O N M E N TA L P E R F O R M A N C E
Power-to-hydrogen and power-to-SNG carbon footprints depend on the footprint of the electricity with
which they are produced and the overall energy efficiencies of power-to-gas paths. Power-to-hydrogen
and power-to-SNG’s CO2performance through their value chains were thus estimated through the
carbon footprint of the required electricity to produce enough hydrogen/SNG for a given vehicle to
travel 100 km (scope 2 approach), and benchmarked with the footprint of travelling 100 km using other
competing solutions (diesel and CNG vehicles).
1IEA 2015 report on CO2 emissions from fuel combustion.
2Production of hydrogen through the electrolysis of water.
3 Production of synthetic natural gas (SNG) through the methanation of hydrogen, itself produced from the electrolysis of water.

RE-P2G – Renewable power-to-gas for the non-individual road transport sector, 2016
2
To be environmentally sound, power-to-gas must be based on fully, or close to fully, renewable
electricity.
This is particularly true for power-to-SNG, which is at a disadvantage when compared to the hydrogen
path from a CO2 footprint point of view. As shown in Figure 1, compared to diesel vehicles, hydrogen
vehicles provide CO2 reduction potential if the carbon footprint of the grid electricity used to produce
hydrogen is less than 180 kg of CO2/MWh. As an example, despite a high penetration of wind energy,
Denmark’s grid electricity footprint still stood at 285 kg CO2/MWh in 2014, which is insufficient for
hydrogen vehicles to be less emissive than diesel vehicles.
To be less emissive than diesel vehicles, SNG vehicles require that SNG is produced from electricity with
a carbon footprint three times lower than required in the power-to-hydrogen path (Figure 1). This is due
to the low overall energy efficiency of the SNG path. Although power-to-SNG is easier to implement
than power-to-hydrogen thanks to existing CNG infrastructure and vehicles, obtaining positive impacts
on climate requires a renewable content of electricity used close to 100%. Furthermore, its costs are
much higher than power-to-hydrogen when running on renewable electricity at low load factors4
(e.g. power-to-SNG costs about twice as power-to-hydrogen when fuel production plants are operated
3,000 hours per year).
Figure 1: 2011 CO2 equivalent emissions of fuel cell LDVs and SNG LDVs by countries of the IEA RETD if the power-to-gas process uses grid electricity. Tank-to-wheel diesel emissions are provided for comparison5. Numbers in parenthesis indicate the carbon footprint of electricity in each country in g/kWh6.
4 Power-to-SNG is less efficient than power-to-hydrogen and additional production CAPEX are required (methanation reactor, injection station, compression). Thus, it is much more affected by reduced load factors than power-to-hydrogen.
5 Diesel CO2 emission figures are tank-to-wheel. Well-to-tank figures would be around 20 kgCO2/100 km, but would not change the overall result of comparison with fuel cell and SNG vehicles, since most emissions of diesel are in the use phase.
6 IEA 2016, CO2 Emissions from fuel combustion
0
20
40
60
80
100
120
Germany (461)
Ireland (458)
UK(457)
Japan (416)
Denmark (360)
Canada (186)
France (61)
Norway (13)
Ve
hic
le e
mis
sio
ns
In k
g o
f C
O2
/10
0km
Countries(2011 Carbon footprint of grid electricity in kg of CO2/MWh)
FCEV
SNG
Diesel

RE-P2G – Renewable power-to-gas for the non-individual road transport sector, 2016
3
P O T E N T I A L E A R LY A D O P T E R S A N D M A S S M A R K E T S F O R “ P O W E R - T O - G A S ” I N T H E N O N - I N D I V I D U A L T R A N S P O R T
Compared to other non-individual transport options, captive fleets of long range light duty vehicles
are the most promising market segment for early adoption of power-to-gas technology, due to lower
TCO difference to diesel, potential for high volumes being reached faster and synergies with FCEVs for
individual uses.
The non-individual sector is highly suited for early adoption of power-to-gas technology. Uses of vehicles
are more predictable, and refuelling infrastructure can thus be deployed at a local scale, at a reduced
cost compared to full meshing of the territory.
Buses, city delivery trucks and captive fleets of light duty vehicles were the three main vehicle segments
identified as most relevant for developing power-to-gas mobility through policy support. Other non-
individual transport market segments (vocational trucks, regional and long haul distribution trucks, rural
delivery trucks, shuttle buses and small business vehicles) were not investigated in detail.
On short ranges, SNG and hydrogen vehicles in the selected market segments are out-competed by their
battery electric counterparts due to lower fuel costs7. Within the non-individual sector, the development
of SNG and hydrogen vehicles should thus focus on long range uses where battery-electric vehicles are
not suited due to range constraints (between 100 km and 400 km).
The TCO analysis (Figure 2) reveals that captive fleets of light duty vehicles are better suited for initiating
the market compared to inter-city buses and city delivery trucks: the TCO difference between hydrogen
and diesel vehicles is smaller for LDVs compared to buses and trucks, which means that the level of
subsidies for developing hydrogen LDVs is smaller compared to buses and trucks. Moreover, economies
of scale on the cost of vehicles8 can be achieved at a reduced cost compared to other options due to the
smaller per unit cost of each vehicle. Lastly, captive fleets of LDVs would benefit from the simultaneous
development of FCEVs for individual uses, and, conversely, once developed, they are ideally positioned
to create synergies for individual cars, which will allow tapping into the segment which is the largest
contributor of CO2 emissions within the road transport sector.
Figure 2: Comparison of long range H2 buses, trucks and LDVs TCO differences with their diesel option
7 The battery electric cycle is more efficient than the power-to-gas cycles so less electricity is used in the process. Moreover, battery electric vehicles do not require expensive production infrastructure like power-to-hydrogen and power-to-SNG vehicles.
8Economies of scale in this context mean economies due to a larger volume of units produced, not to a larger size of each unit.
0%
50%
100%
150%
200%
250%
2015 2030
TCO
gap
of
H2
ve
hic
les
com
par
ed
to
die
sel
Buses Trucks LDVs

RE-P2G – Renewable power-to-gas for the non-individual road transport sector, 2016
4
In the longer term, renewable power-to-hydrogen is a promising solution for the decarbonisation of long
range heavy duty vehicles (HDVs); and within those, inter-city buses and long range city delivery trucks
are better suited than other HDVs for launching the market. Promoting and subsidizing long range inter-
urban buses and long range city delivery trucks is not expected to bring their TCO down to full
competitiveness with diesel over the next 15 years and would cost more than €40bn, with uncertain
success and limited environmental impact. However, subsidising early series of production (until 2020)
would significantly improve their TCO (down to less than 50% more than diesel vehicles) and would cost
less than €10bn over the next five years. As closing the TCO difference between hydrogen and diesel
buses and trucks is not achievable in the next 15 years, any market uptake of these vehicles will require
policy makers to help move diesel buses and trucks out of the market, for instance through stricter
regulation.
M A R K E T I N T R O D U C T I O N S T R AT E G Y
The overall cost to achieve competitiveness for fuel cell LDVs in markets similar to European markets
(high diesel prices and high targets of renewable penetration) was estimated to be €10bn to €20bn
between 2016 and 2030. This is the amount needed to subsidize the production of 1.3 million fuel-cell
LDVs9between 2016 and 2030 so as to lower the cost of vehicles through volume effects.
Simultaneously, the costs of power-to-gas production and distribution infrastructures are expected to go
down thanks to learning effects.
Similar developments for range-extended LDVs10 would be ten times cheaper and competitiveness of
range-extended LDVs could be achieved between 2020 and 2022 through the deployment of 150,000
vehicles. Market introduction of full H2 LDVs thus comes at a higher cost than range extended LDVs but it
is a valuable strategy if used in the perspective of technology transfer to the mass market of passenger
cars that are most suited to the full H2 option and will thus benefit from technology and infrastructures
previously developed.
Market introduction of range extended LDVs would poorly benefit to the passenger cars market, mostly
due to the difference in hydrogen pressure level between the two options, in the vehicle and at the
refuelling station. Range extended vehicles should thus be seen as transitory solution, which requires
less complex and costly technology developments for vehicles. Nevertheless, choosing this strategy
option can be relevant to test social acceptance and market response on power-to-hydrogen mobility at
a limited cost.
R E C O M M E N D E D P O L I C Y I N S T R U M E N T S
Whatever the market segment, renewable power-to-gas mobility will hardly compete with fossil options
or with the cheapest renewable options (i.e. BEVs and biomethane) without significant policy support.
Therefore, setting an ambitious and binding regulation in favour of renewable mobility is a prerequisite
to the development of renewable power-to-gas in the transport sector.
An appropriate regulatory framework to provide confidence to power-to-gas mobility value chain
stakeholders should be set up.
9To reach this target of 1.3 million fuel-cell LDVs deployed, the deployment of hydrogen LDVs should apply to several countries (as an example, only 2.2 millions of van vehicles with GWVR <3.5 ton are currently used in Germany).
10 Range extended vehicles are battery electric vehicles equipped with a fuel cell and a hydrogen tank. The vehicle can run alternatively on the battery or the fuel cell, allowing for additional range.

RE-P2G – Renewable power-to-gas for the non-individual road transport sector, 2016
5
Figure 3 displays the set of five main policy instruments and six supporting instruments recommended
to support the development of power-to-hydrogen mobility in the non-individual transport sector.
The regulation on RES fuel in transport should at least include higher requirements in terms of share of
renewable fuels at the distribution infrastructure level. Certification schemes for renewable fuels,
including fuels produced from electricity could be used as a complementary instrument to improve the
ease of e-fuels deployment monitoring.
In parallel, an exemption of taxes on electricity consumed and on fuel produced should be granted to
power-to-gas plants running on renewable electricity. This instrument comes at a very low cost: if policy
makers don’t implement it, power-to-gas development is slowed or halted and few or no taxes are
levied; if policy makers implement it, no taxes are levied but power-to-gas development can be
accelerated. Subsidies could be used as a temporary and complementary instrument on the CAPEX of
the first series of power-to-gas plants if their business case must be improved before learnings of the
first units installed result in cost decrease.
Figure 3: Main and supporting policy instruments to support the market uptake of power-to-gas in the non-individual transport sector.
Hydrogen distribution infrastructure deployment should be promoted through subsidies in order to
create a business case for building and operating refuelling stations, as such an infrastructure is a
prerequisite to vehicle adoption. Specific regulation on distribution infrastructure can help planning the
appropriate meshing of target territories.
Simultaneously, hydrogen vehicles’ market uptake should intensively be fostered to reduce
manufacturing costs as vehicle costs represent an overwhelming share of today’s TCO. Green Public
Procurement is recommended at first, for early adoption with public-owned fleets. As the volume of
vehicles sold increases, direct financial support to private fleet operators through subsidies on vehicle
purchase should be used for technology deployment at larger scale. VRT and VAT exemption could be
used alternatively if their impact on the purchasing cost is sufficient to make hydrogen vehicles an
attractive option for the end-user. Zero emissions vehicles mandates could also be used as a
complementary tool to foster the deployment of vehicles.
RE-P2G – Renewable power-to-gas for the non-individual road transport sector, 2016
6
G LO S SA RY
BEV: Battery Electric Vehicle
CAPEX: Capital Expenditures
CNG: Compressed Natural Gas
DC: Direct Current
DME: DiMethyl Ether
EU: European Union
FCEV: Fuel Cell Electric Vehicle
FCHJU: Fuel Cells and Hydrogen Joint Undertaking
FH2: Full Hydrogen
GPP: Green Public Procurement
GVWR: Gross Vehicle Weight Rating
H2RE: Hydrogen Range extender
HDV: High Duty Vehicle
ICE: Internal Combustion Engine
LDV: Light Duty Vehicle
MeOH: Methanol
OPEX: Operational Expenditures
RE: Range extended
RES: Renewable Energy Sources
RWGS: Reverse Water Gas Shift
SNG: Synthetic Natural Gas
TCO: Total Cost of Ownership
VAT: Value Added Tax
WACC: Weighted Average Cost of Capital

RE-P2G – Renewable power-to-gas for the non-individual road transport sector, 2016
7
I N T RO D UC TI O N
C O N T E X T
The transport sector is a major contributor to CO2 emissions, accounting for 23% of CO2 emissions
worldwide in 2013, with 75% of these emissions coming from road transportation [1].
Most progress has been made on reducing the consumption of diesel and gasoline vehicles by improving
motorization efficiency. But in order to achieve greater reductions in CO2 emissions, alternative clean
power-train technologies will have to be deployed at large scale.
Currently, these alternative technologies are mainly driven by other trends such as growing restrictions
on particulate emissions in urban environments. Biomethane and battery electric vehicles have been
benefitting from these air quality regulations. While both technologies have emerged in the recent
years11, their potential is limited: BEVs have a limited range of application due to autonomy constraints
and biomethane can only be produced in relatively low quantities.
Renewable power-to-gas offers an alternative technological option for the transport sector: because the
gas is produced from the electrolysis of water using renewably sourced electricity, the supply is
potentially unlimited. Hydrogen and SNG vehicle technologies have already been developed and can be
used for any type of use.
The non-individual sector is highly suited for early adoption of the power-to-gas technology: uses of
vehicles are more predictable, and refuelling infrastructure can be deployed accordingly at a local scale,
at a reduced cost compared to full meshing of the territory.
O B J E C T I V E S
The objective of this study is to identify how renewable power-to-gas technologies could contribute to
the significant decarbonisation of the non-individual transport sector, what would be the possible
limitations on electricity supply and what policy instruments would most efficiently support market
uptake. In order to do so, the study will focus on large scale deployment opportunities for renewable
power-to-gas, rather than niche applications in project specific contexts.
The first part of this report consists of a review of existing technologies, projects, and demand drivers for
power-to-gas mobility in the non-individual road transportation sector, in order to select the most
promising market segments for further analysis.
An economic analysis is presented in the second part on the previously selected market segments in
order to choose case studies for detailed analysis.
The detailed analysis, including an evaluation of 2015 and forecasted 2030 economics, as well as the
evaluation of policy measures effectiveness and costs is done in the third part.
The last part of this report takes a step back from quantitative modelling and defines an appropriate set
of policy measures to be used for the required purpose of accelerating power-to-gas for mobility.
11 Year-on-year growth of battery electric vehicles was close to 100% from 2010 to 2014 [49]
RE-P2G – Renewable power-to-gas for the non-individual road transport sector, 2016
8
1 . P OW E R - TO - G A S T EC H NO LO G I ES
1 . 1 . D E S C R I P T I O N O F T E C H N O L O G I E S
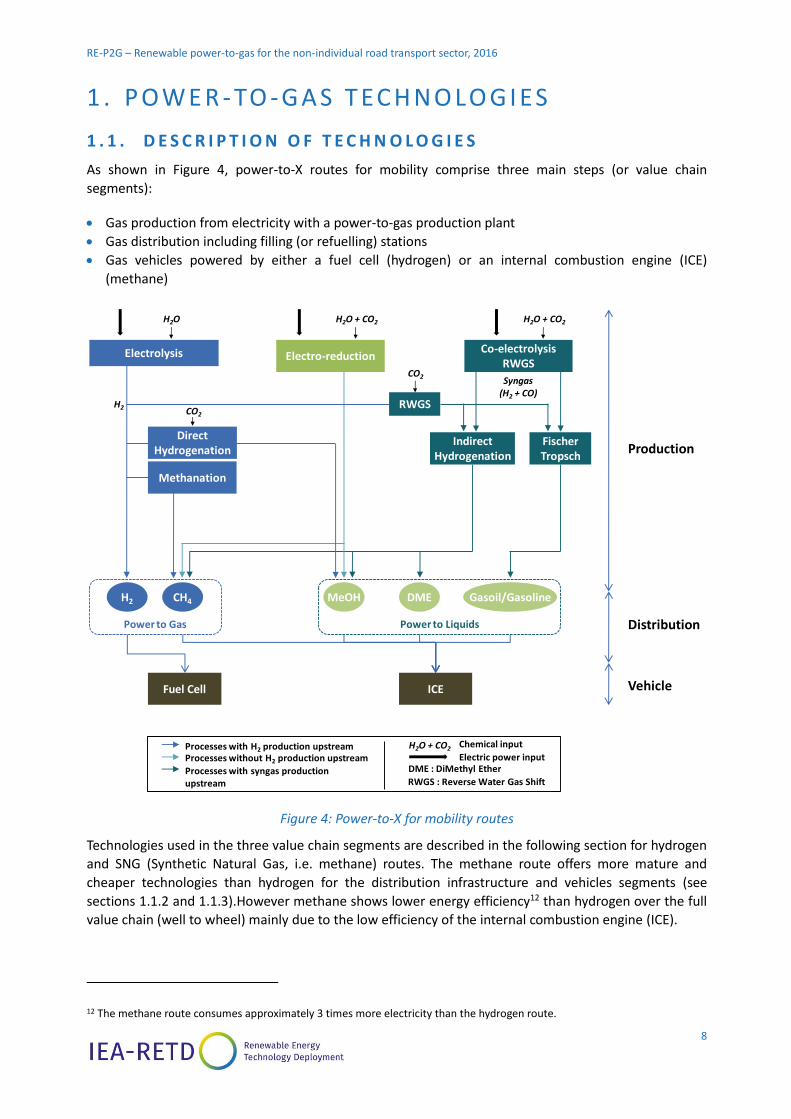
As shown in Figure 4, power-to-X routes for mobility comprise three main steps (or value chain
segments):
Gas production from electricity with a power-to-gas production plant
Gas distribution including filling (or refuelling) stations
Gas vehicles powered by either a fuel cell (hydrogen) or an internal combustion engine (ICE)
(methane)
Figure 4: Power-to-X for mobility routes
Technologies used in the three value chain segments are described in the following section for hydrogen
and SNG (Synthetic Natural Gas, i.e. methane) routes. The methane route offers more mature and
cheaper technologies than hydrogen for the distribution infrastructure and vehicles segments (see
sections 1.1.2 and 1.1.3).However methane shows lower energy efficiency12 than hydrogen over the full
value chain (well to wheel) mainly due to the low efficiency of the internal combustion engine (ICE).
12 The methane route consumes approximately 3 times more electricity than the hydrogen route.
Methanation
H2
Electrolysis
CH4
Co-electrolysisRWGS
MeOH DME Gasoil/Gasoline
Indirect Hydrogenation
Fischer Tropsch
CO2
H2O H2O + CO2 H2O + CO2
H2
Syngas (H2 + CO)
Processes with H2 production upstream
Processes with syngas production upstream
Processes without H2 production upstream
Power to Gas Power to Liquids
H2O + CO2 Chemical input
DME : DiMethyl Ether
Electro-reduction
RWGS
Direct Hydrogenation
RWGS : Reverse Water Gas Shift
CO2
Electric power input
Fuel Cell ICE
Production
Distribution
Vehicle

RE-P2G – Renewable power-to-gas for the non-individual road transport sector, 2016
9
Power-to-liquids is not the focus of the study due to its high similarity with power-to-SNG compared to
power-to-hydrogen. Indeed, as for power-to-SNG, power-to-liquids has the main advantage of being a
drop-in technology (gasoline and diesel produced from power can be used in infrastructures and
vehicles already available), but it is at a cost of higher CAPEX for fuel production and lower energy
efficiency on a well to wheel basis. Results derived from the comparative analysis between power-to-
hydrogen and power-to-SNG along the study can thus be applied to power-to-liquids.
1.1.1. Power-to-gas production plants
Power-to-gas plants produce hydrogen from electricity with the water electrolysis process and can
further convert hydrogen into methane through a reaction with CO2 called methanation. The water
electrolysis process is already mature and a new generation is arriving on the market. The methanation
process has been used for decades in the industry but its use at small scale and as an intermittent
process for power-to-gas applications still requires technology development.
Electrolysis
Water electrolysis consists in converting power to hydrogen and oxygen by dissociation of water. This
hydrogen production process is well known but it is still marginal13when considering the global
production of hydrogen which mainly based on fossil fuels conversion.
Alkaline electrolysis is the most mature technology available on the market. Depending on the capacity
of the electrolyser and the pressure of the hydrogen delivered, the energy efficiency of the devices vary
between 66% and 74% (4.8 and 5.4 kWhel/Nm3H2) and the installed14 CAPEX varies from 1,000 to
2,000 €/kWel [2]. Future reduction of CAPEX and energy consumption of alkaline electrolysers will likely
remain limited due to the high maturity of the technology.
PEM electrolysis (Proton Exchange Membrane) is a new generation technology currently under
demonstration for power-to-gas applications at large scales (up to 2 MWel per electrolyser). PEM
electrolysers have currently higher CAPEX than alkaline electrolysers. Further development of the
technology could however reduce investment costs below the alkaline technology. According to
technology developers, for a 10 MWel unit the installed cost of a PEM electrolyser could reach
1,000 €/kWel in the coming years, 700 €/kWel in 2030 and even decrease down to 400 €/kWel in 2050 [2].
Methanation
Methanation refers to the synthesis of methane by hydrogenation of carbon monoxide or carbon
dioxide15. Carbon monoxide methanation through catalytic processes has been used for decades for
ammonia synthesis, in coal-to-gas/liquids processes or for natural gas treatment in the oil & gas sector.
This reaction can happen through two different techniques: catalytic methanation or biological
methanation. The catalytic option is the focus of current R&D activity due to its historical importance in
the industry and is thus most likely to be used in power-to-gas applications.
Catalytic methanation is a thermochemical process operated on a catalyst at high temperature (between
200 and 700°C) and pressures between 1 and 100 bar. The reaction releases significant amounts of heat
13 4% of global hydrogen production comes from water electrolysis with most of it being the by-product of chlorine.
14 Installed CAPEX is the investment cost of equipment including its transport, installation and commissioning costs.
15 In the case of power-to-gas applications, methanation refers to the hydrogenation of carbon dioxide according to the following reaction: 4𝐻2 + 𝐶𝑂2 → 𝐶𝐻4 + 2𝐻2𝑂(𝑔) ΔH= -165 kJ/mol

RE-P2G – Renewable power-to-gas for the non-individual road transport sector, 2016
10
which requires cooling the reactor in order to control temperature levels and avoid catalysts
degradation. Proper control of the temperature within the reactor is a key challenge currently addressed
by R&D activity for power-to-gas applications of the methanation process (small scale and intermittent
operation).
The energy efficiency of the chemical reaction is close to 80 % which leads to an overall energy
efficiency of a power-to-methane plant of 53% to 59% depending on the efficiency of the electrolyser.
Improvements on the energy efficiency could however be achieved with the recovery of the reactor heat
and its internal reuse or external valorisation. Cost estimates of a methanation unit are still uncertain
due to the lack of units under current commercial operation and vary from 400 to 1,500 €/kWHHV-SNG, in
the literature and from information provided by technology developers [2].
1.1.2. Fuel infrastructures for distribution
Distribution infrastructures mainly comprise refuelling stations where the fuel is compressed and stored
before transfer to the vehicles (see main refuelling station arrangements description below).
The existing gas grids can be used to transport methane from power-to-gas plants to refuelling stations.
With hydrogen, the gas must be produced at the refuelling station directly or transported by truck.
Refuelling stations for methane are much more mature and developed than for hydrogen as the result of
the significant market growth of Compressed Natural Gas (CNG) applications in the mobility sector over
the last decade. Due to the low energy and mass density by volume unit, hydrogen must be compressed
at higher pressure levels than methane (i.e. typically 350 to 700 bars for hydrogen compared to 200 bars
for methane) and this compression work is more energy intensive. Moreover, hydrogen handling is more
complicated, which increases the cost of equipment. All these elements result in much higher cost of
hydrogen refuelling stations compared to methane.
As high capacity and high load factor significantly impact the reduction of the per MWh cost of hydrogen
refuelling stations, these stations require a minimum capacity to reach economic viability. A capacity of
200 kgH2/day is currently considered as the minimum required for a hydrogen refuelling station to reach
breakeven under current CAPEX of infrastructure [2]. Addressing several types of vehicle maximizes the
chances of economic viability of refuelling stations.
CNG/SNG refuelling station arrangements
CNG/SNG stations are connected to the gas grid and receive gas at a pressure lower than that used
inside the vehicle tank. A gas dryer removes the moisture from the gas. It is then compressed at the
station for vehicle fuelling. There are three main types of CNG/SNG stations, as described below:
Fast-fill stations: The compressor feeds in the storage tanks from which gas is delivered to the
vehicle. Refuelling takes a few minutes. Fast-fill stations are mainly used in retail stations.
Figure 5: Fast-fill station diagram
DryerGas
compressor
Storage
Storage
Storage
Suction gas
Sequencing and temperature compensation

RE-P2G – Renewable power-to-gas for the non-individual road transport sector, 2016
11
Time-fill stations: The compressor directly feeds into the vehicle. Refuelling takes up to several hours
and is generally done at night. Time-fill stations are mainly used by fleet operators owned stations.
Figure 6: Time-fill station diagram
Combination-fill stations: Both fast-fill and time-fill options are available at these stations. Fleet
operators primarily use the time-filling option and can use the fast-filling option when needed.
H2 refuelling station arrangements
H2 refuelling stations are similar to CNG/SNG fast-fill stations.
Hydrogen is delivered either from on-site electrolysers or via liquid storage tank fed by trucks at a
pressure lower than that used inside the vehicle, compressed, and stored in high pressure storage tanks.
Dispensers are connected to these high pressure tanks and deliver hydrogen to the vehicles.
Figure 7: H2 refuelling station diagram
DryerGas
compressorSuction gas
Temperature compensation
H2 compressor
Electrolyser
High pressure gas storage
High pressure gas storage
High pressure gas storage
Sequencing

RE-P2G – Renewable power-to-gas for the non-individual road transport sector, 2016
12
Figure 8: A hydrogen refuelling station in Frankfurt-Höchst
1.1.3. Vehicles
Internal combustion engines (ICE) running on fossil diesel are the current benchmark for non-individual
transport mobility uses. ICE running on compressed natural gas (CNG) are gaining interest and market
share due to low prices of natural gas and can be used with renewable forms of methane such as
biomethane and SNG. Two main other alternative power trains suited for renewable mobility are
currently commercialized or under development: batteries and fuel-cells, as well as hybrid version of
these technologies. The hybrid version of ICE with batteries is not considered in this study as long as it is
not an option for fully renewable mobility.
ICEs are the most common types of engines in use today. They convert heat to work through pressure on
pistons, blades or rotors. These engines are compatible with most fuels today: diesel, gasoline, ethanol,
liquefied gas or compressed natural gas. ICEs operate similarly with liquid fuels and gaseous fuels,
except for the mixing of fuel with air. Tank specifications also differ for liquid and gaseous fuels. The
same engines are used for CNG and SNG vehicles.
In battery electric vehicles (BEV), electricity is stored in lithium ion batteries and directly discharged in a
DC motor to produce movement. Batteries can be charged directly through fast chargers or through an
onboard inverter using a simple house-plug.
Fuel-cells produce electricity through the reaction of positively charged hydrogen ions (fuel) with
oxidants. The electrical current created is stored in a battery and discharged in a DC motor to produce
movement. Fuel-cell electric vehicles (FCEV) can be charged by refuelling the hydrogen tank.
Alternatively to vehicles running exclusively on hydrogen, technology developers have created hydrogen
range extenders that can be added on BEVs. Vehicles can be recharged both through plugs and at
hydrogen refuelling stations. When in use, the power produced by the small 5 kW fuel cell is fed to the

RE-P2G – Renewable power-to-gas for the non-individual road transport sector, 2016
13
battery. This solution offers the combined benefits of added range and limited fuel cost when driving on
electricity.
A comparative analysis of the main features of the three types of power train is provided in Figure 9.
Figure 9: Comparison of vehicle technologies’ main features
Fuels Vehicle size
Tank to
wheel
Energy
Efficiency
Autonomy
(relative to
pier
vehicles)
CO2 emissions
(relative to
peer vehicles)
Pollutants
emissions
(relative to
peer vehicles)
Maturity of
powertrain
Cost of vehicle
(compared to liquid
fuels ICEV)
LDV
MDV
HDV
LDV
MDV
HDV
LDV
MDV
HDV
LDV
MDV
HDV
LDV
MDV
HDV
LDV
Commercial
(individual cars
only)
+200% and more
MDVTechnology
developmentNA
HDV Demonstration +200% and more
LDV Demonstration +200% and more
MDV Demonstration +200% and more
HDVTechnology
developmentNA
LDV Commercial +50% to +100%
MDV Demonstration +100% to +200%
HDVTechnology
developmentNA
Vehicle powertrain
Biomethane
Internal
combustion
engines
vehicles
Battery electric vehicles
Fuel-cell
vehicles
Full H2
Range-
extended
Gaseous
fuels
Liquid fuels
Biofuels
Diesel /
gasoline
Electricity
Hydrogen
Hydrogen +
electricity
SNG
60% to 90%
40% to 90%
~ 20%
High
Medium
Low
Low
Depends on
production
method
Low
40% to 60%
CNG
None
Commercial
NA
+10% to +50%
Depends on
production
method
Depends on
production
method of H2
and carbon
footprint of the
grid
Depends on the
carbon footprint
of the grid
High
Medium
Medium
Medium
Medium
None
None
High
High

RE-P2G – Renewable power-to-gas for the non-individual road transport sector, 2016
14
Figure 10: The six roof-mounted hydrogen fuel tanks of a London fuel cell bus
1 . 2 . C O N S T R A I N T S O N E L E C T R I C I T Y S U P P LY F O R R E N E W A B L E P O W E R - T O - G A S
1.2.1. CO2 emissions of power-to-gas mobility
The environmental performance of power-to-gas entirely depends on the origin of the power used for
electrolysis. To be environmentally sound, power-to-gas must be based on full or close to full renewable
electricity. As shown in Figure 11, compared to diesel16, grid power-to-hydrogen provides CO2 reduction
potential if the carbon footprint of the electricity used is less than 180 kg of CO2/MWh. Of the IEA RETD
countries, only France and Norway met this threshold in 201117 (Figure 1). Despite big improvements
and a high penetration of wind energy, Denmark’s grid footprint still stood at 285 kg CO2/MWh in 2014,
which is insufficient for grid power-to-hydrogen to be less emissive than diesel. Grid power-to-SNG
requires an electricity carbon footprint three times lower than grid power-to-hydrogen to be less
emissive than diesel due to its low overall energy efficiency: three times as much power is required to
produce enough SNG for a LDV to travel 100km compared to the same distance with hydrogen. Of the
IEA RETD countries, producing grid power-to-SNG would only contribute to CO2 reduction in Norway.
16Assumptions for CO2 emissions of fossil fuels are 117 lbC02/Mbtu for CH4 and 156 lbCO2/Mbtu for diesel (EIA figures are 117 and 157.2 respectively). However, as tank-to-wheel and well-to-wheel CNG emissions are not yet well known and subject to controversy, no comparison to CNG emissions is provided here.
17 The electric grid of France mainly relies on nuclear capacities while Norway uses hydro as its main source of electricity

RE-P2G – Renewable power-to-gas for the non-individual road transport sector, 2016
15
Figure 11 – 2011 CO2 equivalent emissions of fuel cell LDVs and SNG LDVs by countries of the IEA RETD if the power-to-gas process uses grid electricity. Tank-to-wheel diesel emissions are provided for comparison18. Numbers in parenthesis indicate the carbon footprint of each country in g/kWh[3].
1.2.2. Conditions to renewable electricity access
There are two options to making power-to-gas a fully renewable option: using grid electricity with
renewable certificates covering 100% of the plant consumption, or using electricity from variable
renewable sources (i.e. wind, solar) that would be curtailed otherwise.
The deployment of 1 million of full H2 LDVs would correspond to an annual demand of 43 TWh19 of
renewable electricity, which represents about 5% of the EU-28 renewable electricity production in 2013
[4]. There is thus room for renewable power-to-hydrogen market uptake with current renewable
electricity production and the use of renewable certificates. However, large scale deployment (e.g. 10 to
100 millions of unit in Europe) would significantly increase the demand, requiring additional installation
of renewable capacities.
Running power-to-gas plants during periods of excess production of intermittent renewable electricity
enables for the valorisation of renewable electricity production that would be curtailed otherwise,
which would more likely to occur as the share of variable renewable sources increases in the electricity
mix. However, if this option is not used in combination with renewable certificates to ensure base load
operation, it would decrease power-to-gas plants utilization substantially as periods of excess renewable
energy will remain limited.
Both options could be used in combination in order to optimise the production cost of power-to-gas
fuels. However, running power-to-gas plants on excess production of renewable electricity would better
guarantee that power-to-gas for mobility does not prevent other uses of renewable electricity.
18 Diesel CO2 emission figures are tank-to-wheel. Well-to-tank figures would be around 20 kgCO2/100 km, but would not change the overall result of comparison with fuel cell and SNG vehicles, since most emissions of diesel are in the use phase.
19 This estimate is based on a yearly travelled distance of 62,571 km, a vehicle fuel consumption of 1kg per 100 km and a total electricity consumption of 1.75MWhel/MWhH2-HHV for hydrogen production and delivery.
0
20
40
60
80
100
120
Germany (461)
Ireland (458)
UK(457)
Japan (416)
Denmark (360)
Canada (186)
France (61)
Norway (13)
Ve
hic
le e
mis
sio
ns
In k
g o
f C
O2
/10
0km
Countries(2011 Carbon footprint of grid electricity in kg of CO2/MWh)
FCEV
SNG
Diesel

RE-P2G – Renewable power-to-gas for the non-individual road transport sector, 2016
16
Thus, any development of renewable power-to-gas at large scale should be concomitant with high
targets of renewable energy sources (RES) in electricity production to allow for the second options with
longest possible periods of excess renewable energy to limit asset under-utilisation.
1 . 3 . D E M A N D
The purpose of this section is to understand the drivers of demand for non-individual fuel cell vehicles,
through the review of ongoing demonstration projects and feedback from industrial actors, as well as to
segment the road mobility market for non-individual vehicles so as to select the most promising options
for market uptake in the next section.
1.3.1. Review of rationale and demand drivers from early adopters
From the literature review and the interviews conducted with industrial actors and fleet operators, it
appears that their demand for fuel cell vehicles is driven by a rationale similar to the demand and
adoption of battery electric vehicle. The environmental benefits of reducing CO2 and particulate
emissions of vehicles contribute to the final purpose of increasing business opportunities through
enhanced brand image. In addition, it offers the possibility to compete for tenders where environmental
stewardship is a decisive criterion. [5] [6] [7] [8] [9]
Demand drivers for road applications
The HyWay project in France provides a detailed overview of the drivers for power-to-gas mobility. Fuel
cell vehicles are seen as the closest alternative to battery electric vehicles in cases where the autonomy
provided by the battery is not sufficient for the required purpose [6]:
Vehicles with daily operations of more than 120 km with no intraday hub that would allow for
recharging: this is the case for rural routes of delivery companies such as the postal services.
Heavy and energy intensive vehicles. Construction and industrial companies have shown an interest
for fuel cell range extenders for their electric vans as a way of differentiating their offer in competitive
tendering processes.
Vehicles running multiple pendulum tours of 40 to 50 km every day and requiring a fast recharge
between these tours. This use case would require at least 2 BEVs (1 would be recharging when the
other is active) where one BEV with range extender would be sufficient. Medical delivery companies
have tested H2 range extenders for this purpose.
Vehicles operating in difficult environments and climates (mountainous and cold primarily) where
energy needs are greater and battery effective capacity is limited by the cold temperatures. The
French postal service has for instance been testing mail delivery vehicles equipped with range
extenders in Rhône-Alpes and Jura.
Hydrogen is also seen as a safeguard for first response vehicle for which running out of power would be
catastrophic. The fire-fighters of St-Lô in Normandy in France have acquired two hydrogen vehicles for
medical interventions.
Additionally, though this has not been mentioned in the interviews, it could become compulsory for
fleet operators active in urban environments to meet even more stringent particulate emissions and
noise regulations by switching to zero emissions vehicle. In the EU, current levels are set by the Euro 6
norm but certain cities have expressed the will to set higher standards [7]. FCEV would be the next best
option in cases where autonomy remains an issue. For example, inter-city buses operating both inside
(for drop-off) and outside of cities could be limited by such regulations and still need large autonomy for
long distances travelled. Long distance coaches are seen as a promising use case [6] but the high cost of
deploying the required hydrogen refuelling infrastructure has limited the number of pilot projects
RE-P2G – Renewable power-to-gas for the non-individual road transport sector, 2016
17
directed at this market segment. Most programs have been targeting captive fleets20 with single
charging points (see section 1.3.2).
Lastly, feedback from drivers shows an interest for the comfort of fuel cell buses. The reported
smoothness of the ride compared to ICE buses was mentioned to reduce health impacts on the drivers
[10]. Also, drivers of BEVs have been complaining about the diminished comfort of BEVs in cold
environments with the time for the vehicle to warm up far exceeding that of a regular internal
combustion engine (ICE) vehicle[6]. Fuel cells create more heat, benefiting both the driver and the
battery when used as range extenders (batteries operate better in warmer environments making the risk
of deep discharge situations less probable when the battery is constantly fed by the fuel cell).
Limits to demand drivers for roads applications
While hydrogen vehicles offer greater autonomy compared to battery electric vehicles, the trade-off for
market segments with limited need for autonomy such as city buses is often in favour of BEVs because
of the greater maturity of the technology and its cost advantage compared to hydrogen vehicles.
For instance, Volvo, one of the leading company manufacturing buses and trucks, is betting on the plug-
in hybrid and full electric paths for the city bus segment for the future [8]. City lines are typically 10
kilometres long in large cities in Europe, meaning that plug-in hybrid and full electric buses require
limited battery to go from one end of the line to the other (roughly the same battery needed for a car
with a 120 km range). Recharging can be done in a very short time (5 to 6 minutes) thanks to the fast
charging technology, without affecting the schedule of the line.
Similarly, the RATP (Parisian public transportation authority) is targeting a fleet of 80% battery electric
buses (BEB) and 20% biogas buses [11] in its 2025 Plan for buses. They are however looking to recharge
their fleet of buses at night at the bus depot and run on a single recharge every day, which would
require greater autonomy (180 km to 250 km) and battery size.
1.3.2. Review of current leading initiatives on power-to-gas mobility
A number of hydrogen mobility projects (whether from renewable electricity sources or not) have been
carried out in IEA RETD TCP member countries and others. Fuel cell vehicles are being adopted for a
variety of reasons, from improving a country’s energy security supply to developing zero emissions
public city transportation, finding use cases for the development of power-to-gas or simply gaining
technological advance and operational feedback on a competitive market with potential larger
applications (such as in-home fuel cells).
Japan
Japan has been at the forefront of FCEVs development [12]. In 2014, the Ministry of Economy, Trade and
Industry (METI) drafted a strategic roadmap for the development of Hydrogen and Fuel Cells.
FCEVs represent an important part of this roadmap and benefit from targeted efforts:
R&D support for technology developers
Public procurement of FCEVs for governmental captive fleets: as of January 2015, 60% of the 1,500
fuel cell vehicles ordered in Japan had been ordered by government agencies [13]
20A captive fleet is a collection of vehicles with predictable driving and refuellingpatterns, typically owned and managed by one party.

RE-P2G – Renewable power-to-gas for the non-individual road transport sector, 2016
18
Private public partnerships for the deployment of a hydrogen refilling infrastructure in the country: the
government provides subsidies for up to 60% of the installation cost of refuelling infrastructure and
the remaining 40% are brought by a consortium of four major auto manufacturers [13].
Europe
In Europe, efforts from the public sector have been concentrated on fuel cell buses: Clean Hydrogen in
European Cities (CHIC), 3Emotion, High V.LO-City and HyTransit are all European wide programs targeted
at this specific segment, carried out under the European Fuel Cells and Hydrogen Joint Undertaking
(FCHJU):
CHIC: Answering the need to comply with ambitious legislation, improving passengers comfort,
enhancing cooperation among Europeans in the field of hydrogen mobility and improving the overall
knowledge of the technology are the main objectives of the project. It includes the deployment of 56
fuel-cell buses and their refuelling infrastructure between 2010 and 2016, with 23 partners in eight
cities (London, Aargay, Bozen, Milan, Whistler (see below in the Canada section), Cologne, Hamburg
and Oslo) and a budget of more than €80 million [14]
3Emotion: Similar to the CHIC program, 3Emotion objectives are in line with the European’s Union
legislative emission reduction goals and it includes a variety of public and private partners. Hydrogen
buses and hydrogen infrastructure are being tested in Cherbourg, South Rotterdam, South Holland,
London, Antwerp and Rome. [15]
High V.LO-City: “The overall objective of High V.LO-City is to facilitate rapid deployment of the last
generation of [fuel-cell] buses in public transport operations, by addressing key environmental and
operational concerns that transport authorities are facing today. [...] The project envisions broad
dissemination of actual [fuel-cell] bus performance in normal bus operations to other first users and
potentially interested transport authorities in their geographical area.” Selected cities are San Remo,
Antwerp and Aberdeen [16].
HyTransit: restricted to Aberdeen, this project, unlike those previously mentioned, targets inter-city
bus routes.
It is also worth mentioning the existence of numerous national and regional projects: Karlsruhe,
Stuttgart, Frankfurt, etc., also target the bus sector. In France, a consortium of industrial players have
gathered to form the HyTrac project [17], a €26million project and aimed at developing new offers for
large and heavy vehicles (buses, regional distribution trucks and vocational trucks).
Initiatives have also arisen for different applications and under different impulses. In France, La Poste,
the national postal service, has been testing hydrogen fuel cell range extenders on its electric mail
delivery vehicles because its battery electric fleet (5500 vehicles already in use [18]) had limited
operability in hilly regions (Franche-Comté and Rhône-Alpes). They participated in the HyWay
program[19] in 2014, aiming to deploy 50 Renault Kangoo (light duty van) with range extenders. This
program stands out from the rest of the European projects because it targets a broad range of
customers (Serfim in the construction industry, La Poste, Cetup in the medical delivery market, DHL, the
Compagnie Nationale du Rhône, Linde, and the DREAL Rhône-Alpes).In 2015, La Poste deepened its
innovation efforts on hydrogen mobility by initiating a new partnership with Renault Trucks and
SymbioFCell for a larger city truck (4,5t Renault Maxity) equipped with a fuel-cell range extender.
In Germany, Audi has been developing a hydrogen range-extended version of its A7 model, the A7 h-
tron [20].

RE-P2G – Renewable power-to-gas for the non-individual road transport sector, 2016
19
Canada
Canada was one of the first countries to promote the development of fuel-cell vehicles by launching the
“Early adopter H2 program” in 2003, which included R&D support, individual cars and bus
demonstration projects as well as the deployment of refuelling stations [21]. It is also a participant of
the CHIC program with pilot projects in Whistler, BC.
Box 1: Hydrogen mobility for the mining industry
USA
In the US, and California in particular, hydrogen fuel cells are expected to play a significant role in
reducing the country’s greenhouse gas and smog emissions. The state of California, together with
private companies, has invested in the deployment of hydrogen refuelling stations and hydrogen buses
Canada and South Africa, two of the largest mining countries in the world, have shown a particular
interest for the development of hydrogen fuel-cell technologies applied to mining vehicles.
Fuel-cells offer reduced maintenance costs compared to ICE mechanics and reduced CO2 emissions
when hydrogen is produced from renewable electricity. On top of that, the mining sector offers
several specific conditions that, added together, build a strong case for the use of power-to-gas:
For mining sites located in remote areas, the cost of diesel can be much higher than for road
transportation due to additional cost of transport.
Particulate emissions pose serious health threats for miners in underground environments and
require the use of expensive ventilation: fuel-cell vehicles would reduce health hazards and
diminish the need for ventilation, which would reduce both CAPEX and OPEX.
Transportation of mineral from the mine site to the terminal where it is processed and then
shipped requires large vehicles with high energy needs that could be powered by hydrogen or
with hydrogen range extenders.
Mining sites offer good conditions for the installation of onsite renewable power generating plants
(wind turbines are already present in Canadian mines and solar is considered for South Africa
mines [5]).
Lastly, platinum mining companies see the development of fuel-cells (which use platinum coating)
as a way of increasing demand and price for platinum.
In Canada, pilot projects have been carried out starting in the early 2000’s by a consortium of public
and private actors (including Vale, Air Liquide and Hydro-Quebec – a Canadian public utility) in the
CANMET (Canadian Center for Mineral and Energy Technology) experimental mine of Val d’Or
(Québec). These pilot projects have been testing the technical feasibility, the safety requirements
and a cost-benefit analysis of underground operating vehicle (a mine production locomotive and a
mine production loader), as well as the possibility of using onsite produced electricity from excess
wind for the electrolysis of hydrogen [47]. Glencore’s Raglan mine in Canada is for instance already
equipped with an electrolyser for power-to-power use[9].
In South Africa, Anglo American Platinum Ltd – a leading mining company –, Trident South Africa
and Battery Electric – two mining solutions providers –, as well as Vehicle Projects Inc – a US
company developing prototype heavy fuel-cell vehicles –, have initiated in 2012 a partnership for a
proof-of-concept trial of fuel cell locomotives and dozers in the Bathopele Mine near Rustenburg
(Transvaal)[5].

RE-P2G – Renewable power-to-gas for the non-individual road transport sector, 2016
20
through the allocation of grants [22]. There are now 13 research hydrogen refuelling stations in
California which was the first market for commercialization of individual FCEVs outside of Japan in 2015.
1.3.3. Market segmentation and identification of the most promising segments
The relevance of the power-to-gas path differs from one market segment to another. The objective of
this section is to identify the most interesting categories of use and types of vehicles within the non-
individual transport sector for further modelling and policy analysis in the scope of the current study.
Market segmentation
Existing market segmentations in the literature tend to classify vehicles by gross vehicle weight rating
(GVWR) and class21. The adopted methodology was therefore to build on the existing classifications [23]
and combine them with a classification of vehicles by purpose and use. As much as possible, each of the
categories was built so as to match with one or more vehicle classes. The classification was built as
follows (see Table 1):
Category: this first segmentation breaks the non-individual vehicle market in four main categories
depending on their use: to carry people, as a work tool, to carry goods, or to accomplish specific tasks
(vocational vehicles).
Purpose: in each of these broad categories, the segmentation can be refined based on the operational
environment and the distances travelled. Vehicles circulating in urban environments have different
characteristics compared to those in rural or suburban environments, are subject to different norms,
and have different fuel consumption patterns. Twelve “purpose” sub categories were thus defined.
Vehicle type: lastly, even for similar use cases, a variety of vehicles can be chosen depending on other
factors such as: the size of operations, the targeted clients or the availability of vehicles. Different
vehicle types were matched with the vehicle categories they can be used for. These vehicle types are
taken from the literature [24] and can be matched with typical GVWRs and classes.
21The United States Census Bureau in particular used to publish the most detailed statistics about truck fleets, including end-use statistics. However, the survey was discontinued in 2002 [22].

RE-P2G – Renewable power-to-gas for the non-individual road transport sector, 2016
21
Category Purpose Definition Vehicle types [23] GVWR (short
tons) [23] Class[23]
Passenger Transportation
Bus Large vehicle used for carrying passengers in urban and suburban areas along fixed routes
Shuttle Bus 5 - 7 3
School Bus 9.75 - 13 6
City Transit Bus 13 - 16.5 7
Coach Large vehicle used for carrying passengers across long distances (city to city) along fixed routes
Coach 13 - 16.5 7
Commercial Vehicle
Small businesses
vehicles
Small vehicles carrying people and tools for daily operations (excluding captive fleets) Ex: plumber / electrician van
LDV < 3 1
Utility Van 3 - 4 2a
Conventional Van 5 - 8 3,4
Captive Fleets
Small vehicles carrying people and tools for daily operations around hubs, and part of a larger fleet Ex: Post office LDVs
LDV < 3 1
Goods Logistics Vehicle
City Delivery
Vans and Trucks suitable for delivering goods under urban constraints (noise, size, pollutants emissions) Ex: deli delivery, Fedex delivery
Utility Van 3 - 4 2a
Step Van 4.25 - 5 2b
City Delivery Truck 5 - 9.75 3,4,5
Rural Delivery
Small Vans suitable for sparse delivery of goods in rural environments Ex: rural post vans
Utility Van 3 - 4 2a
Regional distribution
trucks
Trucks operating between warehouses and distribution centres outside of cities
Rack truck 9.75 - 13 6
Beverage Truck 9.75 - 13 6
Medium conventional Trucks
13 - 16.5 7
Long Haul trucks
Trucks operating across long distances connecting large distribution hubs
Medium Conventional Truck
13 - 16.5 7
Heavy Conventional Truck
> 16.5 8
Vocational Trucks
Garbage Truck
Road vehicle for collecting domestic refuse
Refuse Truck 13 - 16.5 7
Tow Truck Road vehicle equipped for towing away cars
Tow Truck > 16.5 8
Cement Truck
Road vehicle equipped with a concrete mixer
Cement truck > 16.5 8
Dump Truck
Large truck with a container for carrying and unloading loose material Ex: mining dump truck
Dump truck > 16.5 8
Table 1: Non-individual vehicles market classification

RE-P2G – Renewable power-to-gas for the non-individual road transport sector, 2016
22
Preliminary case selection
The cases selected for further analysis in this study have been chosen based on 5 criteria:
Attractiveness of the market segment based on our internal analysis (applicability of air pollution and
noise regulation) and feedback from fleet operators and vehicle manufacturers.
Overall potential for CO2 reduction: the key objective of this study is to identify the relevant policy
measures that could enable the take-off of the power-to-gas mobility market. It was therefore
important that the potential impact of the initiative would be compelling enough for governments to
support it. So as to evaluate the CO2 reduction potential of each market segment, we used country
statistics on share of fuel consumption by vehicle groups [25] [26] [27] [28], summarized in Figure 12
for Germany.
Figure 12: Weight of different types of vehicles in energy consumption of the German non-individual transport sector
Power of public authorities on the given market segments: for the same reason as mentioned above,
it was important that governments could positively drive the market. Segments including a large
number of government agencies’ or public companies’ vehicles (like buses or public utilities trucks)
were better positioned on this criterion, contrary to those with a greater share of private fleets.
Competition: the attractiveness of the power-to-gas solution was compared to that of existing
alternative fuel options. Market segments where other alternative solutions (such as battery electric
vehicles) were more competitive than power-to-gas did not rank well on this criterion.
Development status of the fuel cell mobility option: market segments with existing offers or
advanced state of development (mainly buses, light duty vehicles and small trucks) were considered
above others for practical reasons. They indicate a stronger initial interest from key players and
provide economic data for the case studies.
43%
9%7%
8%
17%
15%
Vans (<=3,5 t)
Trucks (3,5-7,5 t)
Trucks (7,5-14t)
Trucks (14-20 t)
Trucks (>20 t)
Buses and coaches
RE-P2G – Renewable power-to-gas for the non-individual road transport sector, 2016
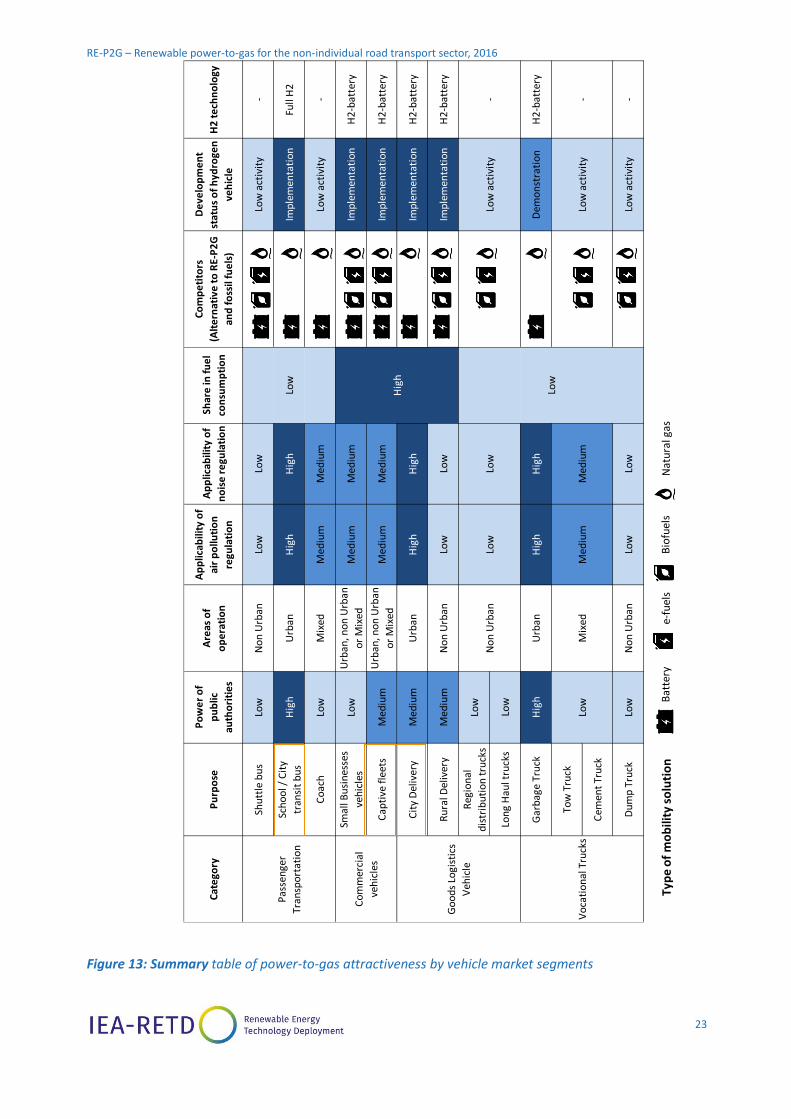
23
Figure 13: Summary table of power-to-gas attractiveness by vehicle market segments
Typ
e o
f m
ob
ility
so
luti
on
Bat
tery
Bio
fuel
sN
atu
ral g
ase-
fuel
s
Cat
ego
ryP
urp
ose
Po
we
r o
f
pu
blic
auth
ori
tie
s
Are
as o
f
op
era
tio
n
Ap
plic
abili
ty o
f
air
po
lluti
on
regu
lati
on
Ap
plic
abili
ty o
f
no
ise
re
gula
tio
n
Shar
e in
fu
el
con
sum
pti
on
Co
mp
eti
tors
(Alt
ern
ativ
e t
o R
E-P
2G
and
fo
ssil
fue
ls)
De
velo
pm
en
t
stat
us
of
hyd
roge
n
veh
icle
H2
te
chn
olo
gy
Shu
ttle
bu
sLo
wN
on
Urb
anLo
wLo
wLo
w a
ctiv
ity
-
Sch
oo
l / C
ity
tran
sit
bu
sH
igh
Urb
anH
igh
Hig
hIm
ple
men
tati
on
Full
H2
Co
ach
Low
Mix
edM
ediu
mM
ediu
mLo
w a
ctiv
ity
-
Smal
l Bu
sin
esse
s
veh
icle
sLo
wU
rban
, no
n U
rban
or
Mix
edM
ediu
mM
ediu
mIm
ple
men
tati
on
H2
-bat
tery
Cap
tive
fle
ets
Med
ium
Urb
an, n
on
Urb
an
or
Mix
edM
ediu
mM
ediu
mIm
ple
men
tati
on
H2
-bat
tery
Cit
y D
eliv
ery
Med
ium
Urb
anH
igh
Hig
hIm
ple
men
tati
on
H2
-bat
tery
Ru
ral D
eliv
ery
Med
ium
No
n U
rban
Low
Low
Imp
lem
enta
tio
nH
2-b
atte
ry
Reg
ion
al
dis
trib
uti
on
tru
cks
Low
Lon
g H
aul t
ruck
sLo
w
Gar
bag
e Tr
uck
Hig
hU
rban
Hig
hH
igh
Dem
on
stra
tio
nH
2-b
atte
ry
Tow
Tru
ck
Cem
ent
Tru
ck
Du
mp
Tru
ckLo
wN
on
Urb
anLo
wLo
wLo
w a
ctiv
ity
-
Pas
sen
ger
Tran
spo
rtat
ion
Low
Co
mm
erci
al
veh
icle
s
Hig
h
Go
od
s Lo
gist
ics
Veh
icle
No
n U
rban
Low
Low
act
ivit
y-
Low
act
ivit
y-
Vo
cati
on
al T
ruck
sLo
wM
ixed
Med
ium
Med
ium
Low
Low

RE-P2G – Renewable power-to-gas for the non-individual road transport sector, 2016
24
Based on Figure 13, three market segments were assessed as the most relevant for P2G development in
the non-individual road transport sector and are analysed in section 2:
City and Inter-Urban Buses (i.e. short and long distance city buses) segment: was chosen for the
high power of public authority on this segment and the applicability of air pollution and noise
regulation, as well as a development status of hydrogen vehicles in implementation phase with
numerous pilot projects deployed.
Captive Light Duty Vehicle fleets segment: was chosen as Light Duty vehicle fleets represent a high
share of fuel consumption and could be subject to pollution and noise regulations given their
potential use in urban environment.
City Delivery Trucks segment: was chosen as city delivery trucks have heavy energy uses and operate
in urban environments where they could be subject to air pollution and noise regulations if they are
made stricter.
Shuttle buses, regional distribution trucks, long-haul trucks and dump trucks ranked low on almost every
criterion. Tow trucks and cement trucks do not constitute a big enough segment to be considered to
initiate and grow the market. Similarly, garbage trucks, even though they rank high on most criteria,
would be a niche market for power-to-gas mobility. Finally, the power of public authorities on coaches
and small businesses vehicles is very limited which makes policy implementation more difficult.
Mining dump trucks and other mining vehicles that could benefit from Power to gas approach are
deliberately left out of the scope of our further analyses. Though fuel-cell vehicles and range extenders
offer several additional benefits in mining compared to road applications, the market segment still
requires targeted technical research. Moreover, the policy measures that could be considered to enable
market launching would be focused on innovation in the mining industry specifically, with limited
beneficial spill over effects to be expected on other industries. Lastly, mining is a sector where the
power of public authorities is much more limited than in road transportation.

RE-P2G – Renewable power-to-gas for the non-individual road transport sector, 2016
25
2 . P R E L I M IN A RY CO M PA R I S O N O F C A S E S T U D I ES
In order to select the most promising combinations of market segments and technologies for further
analysis, we compared the TCO of all power-train technologies for the three market segments selected
(buses, city delivery trucks and captive light duty vehicles fleets), on short and long distances, based on
the current situation without policy incentives.
2 . 1 . M E T H O D
2.1.1. Total Cost of Ownership
In order to assess the competitiveness of power-to-gas in comparison with other power-train
technologies, a total cost of ownership (TCO) calculation was done for several technology paths on each
market segment. The elements used for the TCO calculation are summarized in Table 2and described
below.
Full hydrogen Hydrogen Range
extender Synthetic
Natural Gas Diesel, CNG and
biomethane Battery electric
Vehicle costs
Included: Retail price of vehicles, insurance and maintenance, and battery rental for BEVs and range extended FCEVs.
Not included: subsidies, registration costs, tolls and parking costs, cost of operator, resale price
Fuel costs
Fuel NA NA NA
Diesel: Brent + refining and distribution costs + fuel taxes + carbon tax
CNG and biomethane: wholesale price + fuel taxes + carbon tax + fully amortized gas distribution costs (inc. refuelling) over a fleet of vehicles
NA
Refuelling station
Fully amortized cost of refuelling
station over a fleet of vehicles
Fully amortized cost of refuelling
station over a fleet of vehicles
Fully amortized cost of refuelling
station over a fleet of vehicles
Diesel: NA (included in fuel cost)
CNG and biomethane: fully amortized cost of refuelling station over a fleet of vehicles
NA (recharging at night)

RE-P2G – Renewable power-to-gas for the non-individual road transport sector, 2016
26
Full hydrogen Hydrogen Range
extender Synthetic
Natural Gas Diesel, CNG and
biomethane Battery electric
Gas Grid NA22 NA22 Gas grid fee
Diesel: NA
CNG and biomethane: gas grid fee
NA
Injection station (power-to-SNG pipeline to grid)
NA22 NA22
Fully amortized cost of Injection
station over a fleet of vehicles
NA NA
Pipeline (power-to-SNG
plant to injection station)
NA22 NA22
Fully amortized cost of pipeline over a fleet of
vehicles
NA NA
SNG compression
NA NA
Fully amortized cost of
compressor over a fleet of vehicles
NA NA
Methanation reactor
NA NA
Fully amortized cost of
methanation reactor over a
fleet of vehicles
NA NA
CO2 for SNG production
NA NA Cost of CO2 used for methanation
NA NA
Electrolysis
Fully amortized cost of
electrolyser over a fleet of vehicles
Fully amortized cost of
electrolyser over a fleet of vehicles
Fully amortized cost of
electrolyser over a fleet of vehicles
NA NA
Power grid connection
Fully amortized cost of required transformer and
HV lines to connect the
electrolyser to the electric grid
Fully amortized cost of required transformer and
HV lines to connect the
electrolyser to the electric grid
Fully amortized cost of required transformer and
HV lines to connect the
electrolyser to the electric grid
NA NA
Power
Cost of power for power-to-gas
production and distribution
(inc. Taxes and fees)
Cost of power for power-to-gas
production and distribution + cost of power directly fed to the battery
(inc. Taxes and fees)
Cost of power for power-to-gas
production and distribution (inc. Taxes and fees)
Diesel: NA
CNG and biomethane: cost of power used for refuelling
Cost of power directly fed to
the battery (inc. Taxes and fees)
Table 2: Total Cost of Ownership elements
22 Hydrogen is produced on site

RE-P2G – Renewable power-to-gas for the non-individual road transport sector, 2016
27
Vehicle costs (see details in section 7.2 in appendix)
Purchase cost: based on available public data. When possible, identical vehicle models were
compared across power-train technologies (for example: Kangoo Diesel, Kangoo ZE, Kangoo ZE +
hydrogen range extender). When this was not possible, similar vehicle models were compared. In last
resort, we estimated retail prices based on typical technology to technology cost ratios.
Insurance cost: battery electric vehicles benefit from lower insurance costs than regular ICE vehicles
due to their lower risk of technical failure. This was taken into account in the TCO calculation and the
same discount (30%) was applied for full hydrogen and range extended vehicles.
Maintenance cost: battery electric vehicles benefit from reduced maintenance compared to ICE
vehicles. Estimates of this added benefit varies greatly due to the lack of feedback. Our assumptions
are based on interviews with technology experts for Light Duty Vehicles and NREL research for buses
and trucks [29]. The cost of battery rental was also added to BEV and range extended vehicles.
Registration cost: this was not included in the TCO calculation as it was considered equal across
power-train technologies. However, it remains a lever for policy support and would have an effect
similar to direct subsidy.
Tolls and parking: similar to registration costs, this was not included in the TCO calculation as it was
considered equal across power-train technologies. Exemptions on tolls could be a lever for policy
support of alternative fuel technologies.
Resale price: we currently have very low visibility on the resale value of used BEVs and FCEVs due to
the absence of a second hand market today. Following calculations thus have a bias in favour of
FCEVs and BEVs.
Fuel cost (see details in section 7.2 in appendix)
Full hydrogen vehicles: Fully amortized cost of power-to-gas production and distribution
infrastructure over a fleet of vehicles including: depreciation of total CAPEX and OPEX of electrolyser
(1 MW), power grid connection, and refuelling station as well as power consumed for electrolysis and
refuelling. CAPEX include equipment costs and project costs.
Range extended vehicles: RE vehicles are deemed to run half on hydrogen and half on battery. The
same assumptions as full hydrogen vehicles were taken for the hydrogen (amortized over a fleet
twice as large as each car uses half as much hydrogen).
SNG: Fully amortized cost of power-to-gas production and distribution infrastructure over a fleet of
vehicles including: depreciation of total CAPEX and OPEX of electrolyser (10 MW23), methanation
reactor, SNG compressor, local gas pipes, injection station, power grid connection, and refuelling
station; as well as power consumed for electrolysis, compression and refuelling, and gas grid fee.
CAPEX include equipment costs and project costs.
BEV: retail price of electricity. We excluded recharging infrastructure cost from the BEV fuel costs
because our scenario is based on the assumption of recharging at night from standard plugs for
which capital cost is greatly reduced compared to that of power-to-gas refuelling stations.
Diesel: the cost of diesel is recomputed from the breakdown of Brent price, refining and distribution
costs, fuel taxes and carbon tax that can vary independently depending on the scenario.
23 Because SNG can be fed into the existing gas grid, it is less expensive to have a concentrated centralized production of SNG. Conversely, it would be more expensive to centrally produce H2 and distribute it with trucks. Therefore a 1 MW decentralised electrolyser was taken for hydrogen production while a 10 MW centralised electrolyser was taken for SNG production. For the power-to-hydrogen path, fuel is supposed to be produced directly at refuelling station with no transportation costs. For the power-to-SNG path which can benefit from the natural gas grid for fuel transport between production and refuelling locations, a gas grid fee is included.

RE-P2G – Renewable power-to-gas for the non-individual road transport sector, 2016
28
CNG: Natural gas wholesale price +taxes + fully amortized gas distribution costs over a fleet of
vehicles: gas grid, refuelling station (CAPEX depreciation and OPEX) and power consumption for
refuelling. CAPEX include equipment costs and project costs.
Biomethane: average of biomethane production costs including taxes + fully amortized gas
distribution costs over a fleet of vehicles: gas grid, refuelling station (CAPEX depreciation and OPEX)
and power consumption for refuelling. CAPEX include equipment costs and project costs.
A 20% VAT (corresponding to the average conventional VAT rate in the EU) was applied on every cost
element and the TCO calculation was done over a lifetime of 10 years, the typical time horizon
considered by fleet operators for the amortization of a fleet of vehicles.
2.1.2. Assumptions for the preliminary comparison
The following assumptions were used for our preliminary comparison:
Power: power used for power-to-gas production is deemed to be supplied by the grid and to come
from renewable sources (i.e. with renewable certificates).
Load factor: because power-to-gas production facilities are connected to the electric grid and are
deemed to benefit from renewable certificates on power supply, we assumed a near 100% load
factor of the power-to-gas plants.
Power-to-gas infrastructure: we estimated the costs of power-to-gas infrastructure (production,
transport23 and refuelling) based on interviews with industry experts in 2015 [2].
Vehicle costs: we used available public prices in 2016 for this scenario.
Country context: figures are based on the French market context. However, the output of the
scenario for power-to-gas options varies little from one market to another. The main hypotheses
affecting the competitiveness of power-to-gas options are the prices on electricity and the fuel taxes.
In Germany, where tax on natural gas is much higher than France, the CNG option is much less
competitive than in France but the gap between power-to-gas options and diesel remains
unchanged.
A detailed table of input values used in the model are shown in appendix (see section 7.2).
2 . 2 . R E S U LT S
Main results of TCO comparison
Battery electric vehicle outcompete all other alternative power-train technologies in urban and small
distances settings, as shown in Figure 14, Figure 15and Figure 16. Therefore, we only considered
vehicle uses for medium to long ranges, where battery electric vehicles range limits are reached.

RE-P2G – Renewable power-to-gas for the non-individual road transport sector, 2016
29
Figure 14: TCO comparison of city buses technologies (2015 costs)
Box 2: How to read TCO comparison charts
Figure 15: TCO comparison of short range city delivery trucks technologies (2015 costs)
431 k€ 455 k€
620 k€
1 380 k€
1 213 k€
1 045 k€
0 k€
500 k€
1 000 k€
1 500 k€
2 000 k€
Diesel Bus CNG Bus BioCH4 Bus H2 Bus SNG Bus Battery Bus
Tota
l Co
st o
f O
wn
ers
hip
Vehicle
Refueling station
Gas Grid
Injection station
Pipeline
SNG compression
Methanation reactor
CO2
Electrolysis
Power grid connection
Power
Fuel
+203%
+5%
+42%
+172%
+135%
132 k€155 k€
199 k€
448 k€
355 k€ 350 k€
0 k€
150 k€
300 k€
450 k€
600 k€
Diesel City Delivery
CNG City Delivery
BioCH4 City Delivery
H2 City Delivery SNG City Delivery
Battery City Delivery
Tota
l Co
st o
f O
wn
ersh
ip
Vehicle
Refueling station
Gas Grid
Injection station
Pipeline
SNG compression
Methanation reactor
CO2
Electrolysis
Power grid connection
Power
Fuel
+240%
+18%
+51%
+170% +166%
TCO: the TCO components are represented by layered bar charts.
- The cost components of the H2 (or SNG) fuel are broken down into each of the production
steps costs. Each of these sub costs includes discounted CAPEX depreciation and OPEX costs
over the lifetime of the vehicle.
- The vehicle cost component (yellow) includes all expenses related to the vehicle excluding
fuel: purchase, insurance and maintenance.
Percentages: each power-train technology’s TCO is compared to the TCO of the base option
(diesel option) and represented by a percentage above its bar.

RE-P2G – Renewable power-to-gas for the non-individual road transport sector, 2016
30
Figure 16: TCO comparison of short range captive LDV technologies (2015 costs)
The total cost of fuel is much higher for the SNG path than for the hydrogen path, mainly due to a
significant difference in energy efficiency24 which translates into higher power consumption. This
lower competitiveness of the SNG path compared to the FCEV path is hardly balanced on long
distance uses, even with market segments were the cost of vehicle plays in favour of SNG due to
current low FCEV offer (e.g. buses) (Figure 17, Figure 18 and Figure 19).
Figure 17: TCO comparison of Inter-Urban buses technologies (2015 costs)
24 The low energy efficiency of the SNG path mostly lies in the reduced efficiency of gas engines compared to hydrogen fuel cells. The additional step of methanation during the production process also affects the efficiency of the SNG path. Overall, the well-to-tank energy consumption of the SNG path is 2.5 times higher than that of the hydrogen path.
37 k€ 43 k€ 50 k€
85 k€ 85 k€73 k€
46 k€
0 k€
60 k€
120 k€
180 k€
240 k€
Diesel LDV CNG LDV BioCH4 LDV Range extended LDV
Full H2LDV
SNG LDV Electric LDV
Tota
l Co
st o
f O
wn
ersh
ip
Vehicle
Refueling station
Gas Grid
Injection station
Pipeline
SNG compression
Methanation reactor
CO2
Electrolysis
Power grid connection
Power
Fuel
+132%
+17%
+132%+100%
+24%+35%
591 k€ 580 k€
911 k€
1 718 k€
2 095 k€
0 k€
600 k€
1 200 k€
1 800 k€
2 400 k€
Diesel Bus CNG Bus BioCH4 Bus H2 Bus SNG Bus
Tota
l Co
st o
f O
wn
ers
hip
Vehicle
Refueling station
Gas Grid
Injection station
Pipeline
SNG compression
Methanation reactor
CO2
Electrolysis
Power grid connection
Power
Fuel
-2%
+55%
+196%
+259%
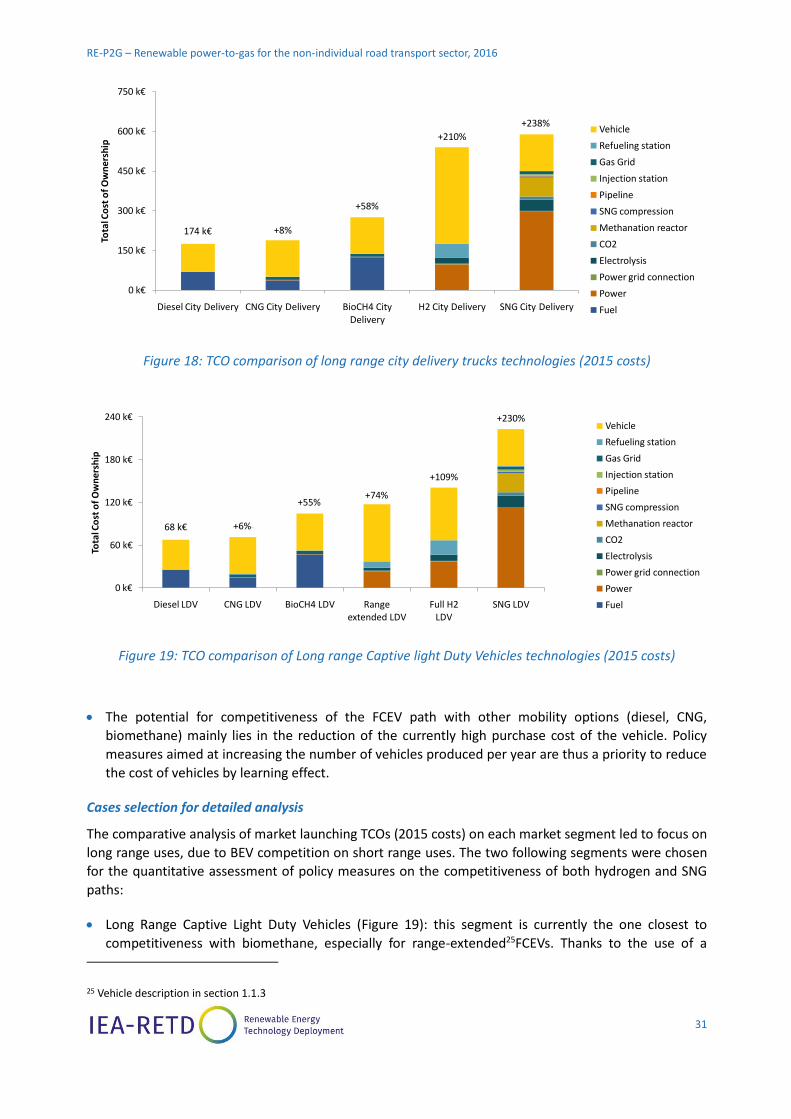
RE-P2G – Renewable power-to-gas for the non-individual road transport sector, 2016
31
Figure 18: TCO comparison of long range city delivery trucks technologies (2015 costs)
Figure 19: TCO comparison of Long range Captive light Duty Vehicles technologies (2015 costs)
The potential for competitiveness of the FCEV path with other mobility options (diesel, CNG,
biomethane) mainly lies in the reduction of the currently high purchase cost of the vehicle. Policy
measures aimed at increasing the number of vehicles produced per year are thus a priority to reduce
the cost of vehicles by learning effect.
Cases selection for detailed analysis
The comparative analysis of market launching TCOs (2015 costs) on each market segment led to focus on
long range uses, due to BEV competition on short range uses. The two following segments were chosen
for the quantitative assessment of policy measures on the competitiveness of both hydrogen and SNG
paths:
Long Range Captive Light Duty Vehicles (Figure 19): this segment is currently the one closest to
competitiveness with biomethane, especially for range-extended25FCEVs. Thanks to the use of a
25 Vehicle description in section 1.1.3
174 k€ 189 k€
276 k€
540 k€588 k€
0 k€
150 k€
300 k€
450 k€
600 k€
750 k€
Diesel City Delivery CNG City Delivery BioCH4 City Delivery
H2 City Delivery SNG City Delivery
Tota
l Co
st o
f O
wn
ersh
ip
Vehicle
Refueling station
Gas Grid
Injection station
Pipeline
SNG compression
Methanation reactor
CO2
Electrolysis
Power grid connection
Power
Fuel
+8%
+58%
+210%
+238%
68 k€ 71 k€
104 k€118 k€
141 k€
223 k€
0 k€
60 k€
120 k€
180 k€
240 k€
Diesel LDV CNG LDV BioCH4 LDV Range extended LDV
Full H2LDV
SNG LDV
Tota
l Co
st o
f O
wn
ersh
ip
Vehicle
Refueling station
Gas Grid
Injection station
Pipeline
SNG compression
Methanation reactor
CO2
Electrolysis
Power grid connection
Power
Fuel
+74%
+6%
+55%
+109%
+230%

RE-P2G – Renewable power-to-gas for the non-individual road transport sector, 2016
32
battery for 50% of the vehicle consumption, the overall cost of the “fuel” is reduced compared to full
FCEVs. The integration of a hydrogen tank and a fuel-cell on the existing structure of a BEV is also
cheaper than the development of new car bodies for a full FCEV model26. The TCOs of the range-
extended option and the full hydrogen option were estimated to be respectively 1.75 and twice
higher than the TCO of a diesel vehicle. The SNG option is strongly affected by the lower power
conversion efficiency of the methane production, resulting in the electricity accounting for more than
50% of the TCO.
Inter-city buses (Figure 17): even on long distances, H2 and SNG buses and city delivery trucks are
widely outcompeted by diesel, CNG and biomethane. However, the high cost of the H2 vehicle is
mainly due to the low number of vehicles produced to date and has a significant potential for
improvement.
Because inter-urban buses and long range city delivery trucks (Figure 18) present similar cost
structures and competitiveness gaps, it was decided that the detailed case study would focus on one
market segment only. Inter-city buses have been chosen for this purpose because of their more
advanced state of development, but the results and the consequent recommendations are likely
similar for long range city delivery trucks.
Sensitivity Analysis
The model is most sensitive to the load factor and the electricity price hypotheses. We have taken a very
optimistic assumption of 100% for the load factor and the competitiveness of both hydrogen and SNG
solutions would be lower with a reduced load factor. Elements of CAPEX would double with a 50%
decrease in load factor. The electricity price in this scenario is the electricity price in France, which is
lower than that of its European counterparts like Germany. The “Power” element of the TCO would vary
proportionally with the electricity price. In the US and Canada, electricity prices are lower than in France
but the low cost of fuel offsets their benefits.
26Developing full FCEV models requires the set up of new production lines and the fuel cell stacks are smaller for range extended vehicles than for full hydrogen vehicles.

RE-P2G – Renewable power-to-gas for the non-individual road transport sector, 2016
33
3 . D E TA I LE D CA S ES A N D I M PAC T O F P O L I C I ES
The second step of our cases analyses is to model the impact of policies on the market uptake and large
scale deployment of the most competitive market segments we have previously identified (inter-urban
buses and long range captive light duty vehicle fleets).
3.1.1. Method
This section provides a description of the method used to assess the impact of financial support to
power-to-gas routes in the selected market segments. A detailed table of input values used in the model
are shown in appendix (see section 7.2).
Two time horizons are considered to assess the impact of policies:
Market uptake: based on the current cost of power-to-gas options, we estimate the level of financial
public support that would make them competitive with ICE vehicles in 2016 as a learning curve can
only be initiated if production is met by demand.
Large scale deployment: based on assumptions on the cost decrease of power-to-gas production
infrastructure and vehicles, as well as the expected changes in fuel prices in 2030, and a 100 €/ton of
CO2 carbon price, we estimate the level of subsidies that would make power-to-gas options
competitive with ICE vehicles in 2030.
3.1.2. Specific assumptions for the market uptake scenario
The market uptake scenario is based on the same set of assumptions than that used in the preliminary
comparison (see section7.2). In addition, a tax exemption on electricity used by power-to-gas
production plants was included in the model as the cost of such measure is very limited before mass
deployment: rather than a direct expenditure, this form of subsidy is a non-revenue for the government.
The expected impact resulting from closing the cost difference between power-to-gas and diesel
mobility options is the increase of the number of FCEVs manufactured and subsequent reduction of
their cost thanks to learning effects.
Natural gas ICE vehicles running either on CNG, biomethane or SNG have a much lower potential for
manufacturing cost reduction due to already high number of units produced worldwide. Moreover, the
market uptake of the SNG path would have a limited impact in the number of units produced compared
to the current CNG market. Therefore, there is no significant learning effect to expect from such a
market uptake.
3.1.3. Method for modelling the learning curve of FCEV and infrastructure costs
Through literature review, three studies from 2010, 2014 and 2015 aiming at modelling the learning
curve of fuel cell light duty vehicles have been identified[30] [31] [32]. The methodology for the case
studies is built upon the latest two. Based on the projections of cumulative installed fuel-cell LDVs in
2020 and 2030, we fit an exponential growth curve of newly built cars to estimate the number of cars
produced each year from 2015 to 2020 and from 2020 to 2030. Depending on the market considered
(World, Europe, Germany for example), the cumulative produced fuel-cell LDVs in 2020 and 2030
(150,000 and 1,350,000 vehicles) account for a small to large share of the long range captive LDV market
but always a small share of the total LDV market.
We use the same method to estimate the cost of vehicles: based on the extra cost of FCEVs compared to
ICE vehicles in 2015 and the projected extra cost of FCEVs in 2020 and 2030, we fit a decreasing

RE-P2G – Renewable power-to-gas for the non-individual road transport sector, 2016
34
exponential growth curve to estimate the extra cost each year from 2015 to 2020 and from 2020 to
2030. The cost of diesel ICE vehicles was deemed constant from 2015 to 2030.
Figure 20: Fuel-cell LDVs learning curve: green dots are taken from the literature and blue dots are constructed by exponential fitting, with different coefficients before and after 2020
A similar approach was used for fuel cell buses, taking into account the lower production numbers.
Cost assumptions for the power-to-gas infrastructure in 2030 are based on the FCHJU targets and
industry experts’ interviews [2]. For each year between 2015 and 2030, these costs were linearised
between their 2015 and their 2030 value.
3.1.4. Specific assumptions for the large scale deployment scenario
A mid-term scenario (i.e. 2030) is established with large scale deployment of power-to-gas mobility
options resulting from a first phase of market uptake and with higher penetration of renewables in
electricity mixes. TCO comparison of the different mobility options in this scenario aims at illustrating
how financial support in the market uptake phase can improve the long term competitiveness of power-
to-gas options.
In this scenario, we used the methodology presented above in section 3.1.3 to forecast the costs of fuel-
cell vehicles and power-to-gas infrastructure. For the fuel component of traditional ICE vehicles, we
assumed fuel costs from the IEA World Energy Outlook 2030 New Policy scenario for oil and gas, a 30%
decrease in the cost of biomethane compared to 2015 and a 100 €/ton of CO2 carbon price.
Based on the discussion in section 1.2.2, our scenario assumes that power-to-gas production plants
operate on excess renewable electricity only in 2030. Thus the load factor of the plants is reduced to
2000 hours per year27 (compared to 8600 hours in 2015), and the wholesale price of electricity is
reduced accordingly, from 60€/MWh to 10€/MWh.
Lastly, and similarly to the market uptake scenario, we assumed an exoneration on electricity taxes for
power-to-gas production and fuel tax on renewable fuels.
27 With power-to-gas production plants running 2,000 hours per year only, hydrogen refuelling station would require significant storage capacities to operate continuously. This constraint is deemed more technical than economic when compared to other components of the TCO such as the impact of a reduced load factor of production plant on the cost of the fuel. Therefore, the additional cost of hydrogen storage capacities is excluded from the model. For the SNG path, the natural gas grid can be used as a storage capacity.
0
500
1,000
1,500
2015 2020 2025 2030
Cu
mu
lati
ve in
stal
led
ca
pac
ity
(in
th
ou
san
ds)
0%
100%
200%
300%
400%
1,000 10,000 100,000 1,000,000
Extr
a co
st o
f H
2 L
DV
co
mp
are
d t
o IC
E
Cumulative installed capacity

RE-P2G – Renewable power-to-gas for the non-individual road transport sector, 2016
35
3 . 2 . R E S U LT S
This section aims to quantify and discuss the level of political support and subsidies that would be
needed to make power-to-gas competitive for the selected market segments.
3.2.1. Long Range Captive Light Duty Vehicle Fleets
TCO Analysis
Figure 21 displays the TCOs of the different mobility options assessed for Long Range Captive Light Duty
Vehicle fleets for both market uptake (2015) and large scale deployment scenarios (2030).
Figure 21: TCO of captive light duty vehicle fleets across power-train technologies in 2015 and 2030 including tax exemptions on electricity and power-to-gas fuels
Diesel and CNG TCOs increase in 2030 due to the expected increase in fuel prices while biomethane
prices are expected to decrease.
Hydrogen range-extended LDVs have the potential to become more competitive than diesel, CNG and
biomethane by a significant margin by 2030, thanks to the decrease of power-to-gas infrastructure
expenditures and the reduced price of electricity. The gap of competitiveness with diesel vehicles is
reversed from €45,400 in 2015 to -€13,400 in 2030. Similarly, full H2 vehicles almost reach
competitiveness with diesel and CNG in 2030 (differences of €4,300 and €7,000 respectively).
68 k€ 71 k€
104 k€113 k€
133 k€
200 k€
0 k€
60 k€
120 k€
180 k€
240 k€
Diesel LDV CNG LDV BioCH4 LDV Range extended LDV
Full H2LDV
SNG LDV
Tota
l Co
st o
f O
wn
ersh
ip
Long range captive light duty vehicles - Market Uptake - 2015
Vehicle
Refueling station
Gas Grid
Injection station
Pipeline
SNG compression
Methanation reactor
CO2
Electrolysis
Power grid connection
Power
Fuel
+67%
+5%
+54%
+98%
+197%
78 k€ 77 k€ 83 k€65 k€
83 k€
210 k€
0 k€
60 k€
120 k€
180 k€
240 k€
Diesel LDV CNG LDV BioCH4 LDV Range extended LDV
Full H2LDV
SNG LDV
Tota
l Co
st o
f O
wn
ersh
ip
Long range captive light duty vehicles - Large scale deployment - 2030
Vehicle
Refueling station
Gas Grid
Injection station
Pipeline
SNG compression
Methanation reactor
CO2
Electrolysis
Power grid connection
Power
Fuel
-17%-2% +6% +6%
+168%

RE-P2G – Renewable power-to-gas for the non-individual road transport sector, 2016
36
On the contrary, SNG LDVs TCO increases by 2030. Indeed, production infrastructure represents a
greater share of SNG vehicles TCO than hydrogen vehicles (power grid connection, electrolysis,
methanation, compression, pipeline and injection station account for €48k in the TCO of SNG LDVs in
2015 compared to €10k for power grid connection and electrolysis in the TCO of full hydrogen LDVs as
can be seen in Figure 21). Therefore, the production load factor decreases as a consequence of power-
to-gas plants operating only on fully renewable hours of power production whereas in the 2015 scenario
plants were supposed to run all year long on renewable certificates (see section 1.2.2), leading to the
TCO of SNG vehicles increasing by between 2015 and 203028and SNG not coming close to
competitiveness with other fuels.
A sensitivity analysis is provided in appendix (section 0) and shows that more optimistic assumptions on
SNG (such as assuming gas engines are as efficient as diesel engines) might lead to different conclusions
of the TCO analysis for 2015 but would be unchanged for 2030. Even if in 2015the TCO of SNG vehicles
might in some cases be lower (despite their lower energy efficiency) than the TCO of H2 vehicles, this
can mainly be explained by the high cost of hydrogen vehicles. As H2 vehicles benefit from cost
reduction by 2030, they become more economically interesting than SNG vehicles.
The H2 path thus seems more interesting for a large scale deployment, from economic, efficiency and
environmental standpoints.
Box 3: TCO analysis of range extended LDVs compared to full hydrogen LDVs
In order for the 2030 scenario to be made possible, a continuous policy support has to be set in place
between 2015 and 2030 to subsidise the gap of competitiveness of range extended and full H2 vehicles
compared to diesel vehicles until it is closed. Ideally, these policies should target distribution
infrastructure and vehicles proportionally (i.e. so that the end user cost of hydrogen at the pump and
28costs linked to production increase to €124k per SNG LDV compared to €27k per hydrogen LDVs in 2030.
Range extended vehicles require extra equipment compared to full hydrogen vehicles: they are
equipped with a large battery, a hydrogen tank and a fuel cell. Therefore, when deployed at
commercial scale, the manufacturing cost of the vehicle should be in favour of full-hydrogen
vehicles. However, range extended vehicles are more competitive on a TCO basis, for several
reasons:
At present, full hydrogen vehicles require specific car design developments while range extenders
can be added on a BEV body in large vehicles, which is less expensive.
Because range-extended vehicles partly run on electricity, the same infrastructure for hydrogen
production and distribution can be used by a greater number of range extended vehicles than full
hydrogen vehicles, decreasing the per vehicle cost of these infrastructures in the TCO.
The hydrogen cycle being less efficient than the battery cycle (increased losses due to energy
transformation); more power is used in full hydrogen vehicles than in range extended vehicles.
Specific assumptions including vehicle costs, battery costs for range extended vehicles and
infrastructure cost and detailed analysis of TCO difference between range-extended and full H2
vehicles can be found in sections 7.2 and 7.1. This analysis shows that even with optimistic
assumptions on the manufacturing cost of full H2 vehicles, range extended vehicles are more
competitive than full H2 vehicles on the TCO basis.

RE-P2G – Renewable power-to-gas for the non-individual road transport sector, 2016
37
the end user cost of fuel cell vehicles match those of diesel vehicles after financial support, in order to
make a business case for both deploying infrastructure and developing production lines of vehicles).
The cost of the measure per vehicle is the difference of TCO between the power-to-gas vehicle and a
regular diesel vehicle that could have been bought instead: the fleet operator buys the fuel cell vehicles
at a premium and recoups some of the extra costs through lower operating expenses.
The total cost of subsidies is significantly impacted by the cost decrease rate. Figure 22 offers an
estimate of the cost of reaching competitiveness for range extended vehicles(i.e. to achieve scale
effects) based on the number of vehicle deployed, independently from the country, and for two
different assumptions of cost decreases29,30: an optimistic scenario (based on the literature) and a
pessimistic scenario (with lesser cost decreases). In the optimistic scenario, competitiveness is reached
in 5 years after the deployment of 150,000range extended LDVs31, with no need for further subsidies
after 2020. The total cost of the measure is €1,125m over the period. In the pessimistic scenario, 2
additional years are required to reach competitiveness and the total cost of the measure amounts to
€2,380m over the seven years period. In both cases, range extended FCEVs are competitive with regular
options after 2022 and their costs continue to decrease.
Figure 22: Cumulated cost of policy support for the development of REH2 LDVs in optimistic and pessimistic scenarios and per vehicle TCO difference with diesel
For full H2 FCEVs however, the cost of policy measures would be significantly higher due to the fact that
full H2 FCEVs hardly reach competitiveness in 2030. Figure 23 shows the cost of promoting full H2 FCEVs
until 2030, subsidising up to 1.3 million vehicles, in pessimistic and optimistic scenarios of learning rates.
29 In the optimistic scenario, the cost premium of the vehicles decreases by 34% each year and the production increases by 145% yearly until 2020. From 2020 to 2030, the cost premium of vehicles decreases at a yearly rate of 5% and the production increases at a 5% yearly rate. In the pessimistic scenario, the learning curve is slower between 2016 and 2020, with cost premiums decreasing by 25% each year. Production assumptions are similar in both cases.
30 This can be achieved at any scale that shares similar market conditions to those taken in the scenarios hypotheses. The total cost of the measure is the same when implemented in Germany, France, or Germany and France
31 As a comparison, in Germany the total fleet of vans (GWR < 3,5 t) represent about 2 million vehicles.
0 k€
5 k€
10 k€
15 k€
20 k€
25 k€
30 k€
35 k€
40 k€
45 k€
50 k€
0 m€
1 000 m€
2 000 m€
3 000 m€
2016 2017 2018 2019 2020 2021 2022
TCO
dif
fere
nce
Tota
l co
st o
f su
pp
ort
Cost of support (optimistic) Cost of support (pessimistic)
TCO difference (optimistic) TCO difference (pessimistic)

RE-P2G – Renewable power-to-gas for the non-individual road transport sector, 2016
38
In the optimistic scenario, full H2 FCEVs could reach competitiveness by 2050 if the subsidies were to be
maintained after 2030. This would not be possible however in the pessimistic scenario.
Figure 23: Cumulated cost of policy support for the development of full H2 fuel-cell LDVs in optimistic and pessimistic scenarios and per vehicle TCO difference with diesel
Figure 24 compares the cost and time required to support range extended or full H2 fuel-cell LDVs in the
optimistic scenario. Even though supporting the full H2 option requires 10 times the public financial
support of the range extended option to reach full competitiveness to diesel vehicles, this investment
can be valuable in the long term if the mass market of passenger cars is targeted in the end. Indeed,
current fuel-cell passenger car developments focus on the full H2 option and market uptake of full H2
LDVs will benefit to that of full H2 passenger cars. Technology developments on full H2 LDVs will be
directly transferable to full H2 passenger cars that have the same order of power range and vehicle size.
Moreover, refuelling infrastructures can be shared between full H2 vehicles (hydrogen delivered at
700 bars) whereas infrastructures developed for range extended vehicles with hydrogen delivered at 350
bars could not be reused for full H2 vehicles without significant retrofitting costs32.
32The retrofit from 350 to 700 bars would require additional compression and cooling equipment. Storage reservoirs and all piping and instrumentation would be changed to be suited to higher pressure levels. Finally, the retrofitting costs would be in the same order of magnitude to that of a green field station of 700 bar.
0 k€
10 k€
20 k€
30 k€
40 k€
50 k€
60 k€
70 k€
0 m€
5 000 m€
10 000 m€
15 000 m€
20 000 m€
20
16
20
17
20
18
20
19
20
20
20
21
20
22
20
23
20
24
20
25
20
26
20
27
20
28
20
29
20
30
TCO
dif
fere
nce
Tota
l co
st o
f su
pp
ort
Cost of support (optimistic) Cost of support (pessimistic)
TCO difference (optimistic) TCO difference (pessimistic)

RE-P2G – Renewable power-to-gas for the non-individual road transport sector, 2016
39
Figure 24: Comparison of the cumulated cost of policy support for the development of range extended and full H2 fuel-cell LDVs in the optimistic scenario and per vehicle TCO difference with diesel
Sensitivity analysis
The cost of competitive fuels (diesel, CNG and biomethane) significantly impacts the TCO difference with
power-to-gas vehicles. This element can vary from one country to another and could be raised through
taxes from now until 2030. As shown in Figure 25, with a cost of diesel at 2€/litre, full H2 LDVs are more
competitive than regular diesel LDVs. Conversely, range extended LDVs remain more competitive than
diesel LDVs even with a cost of diesel at 1€/litre.
Figure 25: Sensitivity analysis of full hydrogen and range extended LDVs TCOs on diesel price in the 2030 optimistic scenario
Apart from the cost of fossil fuels and the hypotheses on learning curves, the results of the case studies
are most affected by four factors shown in Figure 26: the distance travelled by each car, the weighted
average cost of capital (WACC), the cost of electricity and the load factor of the power-to-gas production
facilities.
0 k€
20 k€
40 k€
60 k€
80 k€
0 b€
5 b€
10 b€
15 b€
TCO
dif
fere
nce
Tota
l co
st o
f su
pp
ort
Cumulative cost of support (RE H2) Cumulative cost of support (Full H2)
TCO difference (RE H2) TCO difference (Full H2)
More competitive Less competitive
-30 000 -20 000 -10 000 0 10 000 20 000
Impact on RE-H2
Impact on full H2
TCO (H2) – TCO (Diesel) (€)
1€/litre
2€/litre

RE-P2G – Renewable power-to-gas for the non-individual road transport sector, 2016
40
Figure 26: Sensitivity analysis of range extended LDV in the 2030 optimistic scenario: Travelled distance (1,5X to 0,5X); WACC (5% to 11%); electricity price (0 to 50€); load factor (3000 to 1000 hours)
Distance travelled: for the range extended fuel-cell solution to be competitive, vehicles need to travel
long distances every day. However, the cost of fuel for full H2 vehicles remains higher than that of
diesel, so the greater the distance travelled, the less competitive the TCO of full H2 LDVs
WACC: As a consequence of a higher share of CAPEX in the TCO of hydrogen vehicles than for diesel,
a high cost of capital degrades the competitiveness of the FCEVs. Investments in power-to-gas
production and refuelling assets can be particularly exposed to high cost of capital during market
uptake if the regulatory and policy frames do not create investors’ confidence in the sector.
Electricity cost and load factor: the competitiveness of fuel-cell solutions will strongly depend on
electricity supply conditions. Favourable conditions can be the result of high penetration of
renewables in the grid or the opportunity to connect the power-to-gas production plant to a cheap
and off grid renewable source (see Figure 27). Our optimistic case is based on the assumption of a
power-to-gas production plant connected to the grid with high penetration of variable renewable
sources.
Figure 27: Sensitivity analysis of electricity supply conditions on the TCO difference between Range extended and diesel LDV in 2030. Each blue box corresponds to a specific scenario: 1: grid connected power-to-gas plant with low to medium penetration of renewable sources 2: off grid power-to-gas plant connected to a wind farm 3: grid connected power-to-gas plant with high penetration of renewable sources For example, the TCO of a range extended LDV would be 2154€ less than the TCO of a diesel LDV in 2030 with an average electricity price of €60/MWh and a load factor of 1500 hours for power-to-gas production
More competitive Less competitive
-25 000 -20 000 -15 000 -10 000 -5 000 0 5 000
Load factor
Electricity Price
WACC
Travelled distance
TCO (Range Extended H2) – TCO (Diesel) (€)
High
Low
TCO gapElectricity price (in euros per MWh inc. grid fee)
20 30 40 50 60
Load factor (in hours per year)
1000 -2 092 € 151 € 2 394 € 4 637 € 6 879 €
1500 -11 125 € -8 883 € -6 640 € -4 397 € -2 154 €
2000 -15 642 € -13 399 € -11 157 € -8 914 € -6 671 €
2500 -18 352 € -16 109 € -13 867 € -11 624 € -9 381 €
3000 -20 159 € -17 916 € -15 674 € -13 431 € -11 188 €
1
2
3

RE-P2G – Renewable power-to-gas for the non-individual road transport sector, 2016
41
Financial analysis
Taxing fossil fuels would be the most direct way of financing the measures required for the development
of fuel-cell LDVs. It would allow both to compensate for the absence of revenues from fuel taxes on
power-to-gas vehicles and to pay for the extra subsidy. More importantly, it would shorten the necessary
time for power-to-gas LDVs to become competitive with diesel and CNG by lowering the TCO difference
to be filled. The financial burden of supporting the market uptake of hydrogen vehicles should ideally be
shared between countries given that the main effect of such a development will be shared (i.e. vehicle
manufacturing cost decrease due to learning effect).
As an example, implementing the required level of subsidies to make range extended vehicles
competitive in France could be financed through a 0.50€ct/l / 0.76€ct/l (optimistic scenario / pessimistic
scenario) increase in diesel taxation33 during 5 / 7 years. To finance the policy support of full-hydrogen
vehicles, a 1.79€ct/l /2.58€ct/l increase in diesel taxation during 15 years would be needed. By 2030,
with the fleet of hydrogen vehicles increasing, compensating for the revenue loss from the tax
exemption on hydrogen fuel could be financed through an additional 4.50€ct/l tax on diesel34.
With a coordinated approach from multiple countries (France and Germany for example), implementing
the required level of subsidies to make range extended vehicles competitive could be financed through a
0.22€ct/l / 0.33€ct/l (optimistic scenario / pessimistic scenario) increase in diesel taxation during 5 / 7
years. To finance the policy support of full-hydrogen vehicles, a 0.78€ct/l / 1.12€ct/l increase in diesel
taxation during 15 years would be needed. By 2030, with the fleet of hydrogen increasing, compensating
for the revenue loss from the tax exemption on hydrogen fuel could be financed through an additional
2€ct/l tax on diesel. The more countries willing to participate in a coordinated effort, the lesser would be
the cost per country.
Conclusion on captive light duty vehicles
Based on Figure 22, promoting the development of range-extended captive light duty vehicles seems
like a feasible option: the total cost of policy support is comprised between €1bn and €2.5bn
(independently of the number of countries where the policy support is in place) in our two scenarios
and our sensitivity analyses show that range extended LDVs will likely be competitive with diesel LDVs in
most cases in 2030. The financial burden of the subsidies can be supported by a reasonable increase in
diesel taxation and the taxation on H2 can progressively be instated after range-extended LDVs reach
competitiveness to compensate for the diminished revenues on diesel tax.
Based on Figure 23, it appears that promoting the development of full H2 vehicles would come at a price
10 times higher (€10bn to €20bn between 2016 and 2030). Moreover, the carbon reduction allowed by
full hydrogen LDVs is significantly less important than from range-extended LDVs when part of the
energy produced in the power-to-gas operation is not renewable.
Based on the TCO calculations of Figure 21, SNG does not seem like a reasonable option to be pursued:
the cost of production of SNG would increase more rapidly than the cost of production of H2if it were to
33The necessary increase in fuel taxes that would compensate for subsidies on range-extended and full H2 LDVs was calculated as the ratio of the total cost of subsidies divided by the cumulated revenues generated by a one cent increase on fuel taxes. This figure can be found in the literature [50]. The fleet of diesel vehicles is deemed constant until 2030. In 2030, based on the projections we have made, hydrogen vehicles would still represent less than 3% of the total fleet.
34 The cost of non taxation of hydrogen fuel is calculated as the amount of diesel tax a hydrogen vehicle would have paid over its lifetime had it run on diesel.

RE-P2G – Renewable power-to-gas for the non-individual road transport sector, 2016
42
use intermittent renewable energy sources and the CO2 decrease potential is negative in most IEA RETD
countries when the power used for power-to-gas production is not entirely renewable (Figure
11).Although hydrogen is cleaner and more competitive on a TCO basis, SNG is currently considered
because of its ease of implementation thanks to the existing CNG/SNG infrastructures and vehicles.
Lastly, it should be kept in mind that battery electric LDVs have been kept out of our comparative case
studies because of the choices of long distance uses that were made, with the hypothesis that their
range would not be sufficient for such uses. If ranges of BEV were to increase by 2030, BEVs could
compete with fuel-cell vehicles and would benefit from better cost fundamentals (see section 2.2) in
appendix).
3.2.2. Inter-City Buses
TCO Analysis
Figure 28 displays the TCOs of the different mobility options assessed for inter-city buses for both
market uptake and large scale deployment scenarios.
Figure 28: TCO of Inter-City buses across power-train technologies in 2015 and 2030 including tax exemptions on electricity and power-to-gas fuels
591 k€ 579 k€
910 k€
1 648 k€
1 869 k€
0 k€
500 k€
1 000 k€
1 500 k€
2 000 k€
Diesel Bus CNG Bus BioCH4 Bus H2 Bus SNG Bus
Tota
l Co
st o
f O
wn
ers
hip
Long range inter-city buses - Market Uptake - 2015
Vehicle
Refueling station
Gas Grid
Injection station
Pipeline
SNG compression
Methanation reactor
CO2
Electrolysis
Power grid connection
Power
Fuel
-2%
+55%
+184%
+220%
702 k€642 k€
706 k€
894 k€
1 974 k€
0 k€
500 k€
1 000 k€
1 500 k€
2 000 k€
Diesel Bus CNG Bus BioCH4 Bus H2 Bus SNG Bus
Tota
l Co
st o
f O
wn
ers
hip
Long range inter-city buses - Large scale deployment - 2030
Vehicle
Refueling station
Gas Grid
Injection station
Pipeline
SNG compression
Methanation reactor
CO2
Electrolysis
Power grid connection
Power
Fuel
-9%+1%
+39%
+198%

RE-P2G – Renewable power-to-gas for the non-individual road transport sector, 2016
43
Fuel Cell Inter-City buses have the potential to significantly reduce their TCO, from €1,648k in 2015 to
€894k in 2030, therefore closing the gap with diesel and CNG from €1,056k (+179%) and €1,068k
(+184%) to €192k (+27%) and €251k (+39%) respectively. However, the fuel component of the TCO
remains higher for fuel-cell buses in 2030. It should be noted that these figures are based on France’s
market hypotheses: the TCO of CNG buses would be considerably higher in Germany because of taxes
on CNG, but lower in the US and Canada for example. For this reason, we will use diesel buses in our
following analyses as the benchmark technology.
On the contrary, the TCO of SNG buses increases between 2015 and 2030 because they are more
affected by the load factor decrease of power-to-gas production than H2 vehicles. The TCO of SNG buses
raises from €1,869k to €1,974k because of the lesser utilization of power-to-gas production
infrastructures.
In order for the 2030 scenario to be possible, a continuous policy support has to be set in place between
2015 and 2030 to decrease, in one form or the other, the gap of competitiveness of fuel-cell buses.
Although competitiveness is not reached by 2030, there is still room for improvement after 2030 and
more importantly, an unexpected high price of fossil fuels (either due to market conditions or increased
taxation) could make the fuel-cell bus option competitive earlier than expected. Policy measures to
support the development of inter-city buses could take similar forms to those exposed in the LDV
analysis: green public procurement, direct subsidies, tax exemptions, and VAT exemptions. The cost of
these measures per bus is the difference of TCO between the fuel-cell bus and a regular ICE bus.
Figure 29 offers an estimate of the total cost of the measure for fuel-cell buses for an optimistic scenario
(based on production learning rates and costs from the literature) and a pessimistic scenario (with lesser
cost decreases)35.
35In the low scenario, the cost of the buses decreases by 34% each year and the production increases by 145% yearly until 2020. From 2020 to 2030, the cost of buses decreases at a yearly rate of 5% and the production increases at a 5% yearly rate. In the high scenario, the learning curve is slower between 2016 and 2020, with costs decreasing by 25% each year. Production assumptions are similar in both cases.

RE-P2G – Renewable power-to-gas for the non-individual road transport sector, 2016
44
Figure 29: Per vehicle and total cost of policy support for the development of fuel-cell buses in optimistic and pessimistic scenarios
If the subsidies were to be maintained over the 15 years period until 2030, their total cost would range
between €32,5b and €43,4b based on the chosen scenario, without reaching competitiveness in 2030.
The benefits of maintaining the subsidy after 2020 are limited as the learning curve slows down.
Moreover, competitiveness seems unattainable in the long run if the cost of diesel buses is not
increased through taxes. An alternative policy strategy would be to subsidy fuel-cell buses until 2020 and
drastically increase taxes on fossil fuels afterwards to make them less competitive. With a TCO difference
of €365k in our low scenario, the total cost of diesel would almost need to double in order to close the
TCO difference.
Sensitivity analysis
The cost of competitive fuels (diesel, CNG and biomethane) significantly impacts the TCO difference with
power-to-gas buses. This element can vary from one country to another and could be raised through
taxes from now until 2030. As shown in Figure 30, with a cost of diesel at 2€/litre, the TCO difference
between fuel-cell buses and diesel buses is reduced by half. Conversely, the TCO difference would
increase by 50% in a scenario of cheap oil prices.
0 k€
200 k€
400 k€
600 k€
800 k€
1 000 k€
1 200 k€
0 m€
10 000 m€
20 000 m€
30 000 m€
40 000 m€
50 000 m€
20
16
20
17
20
18
20
19
20
20
20
21
20
22
20
23
20
24
20
25
20
26
20
27
20
28
20
29
20
30
TCO
dif
fere
nce
Tota
l co
st o
f su
pp
ort
Cost of support (optimistic) Cost of support (pessimistic)
TCO difference (optimistic) TCO difference (pessimistic)

RE-P2G – Renewable power-to-gas for the non-individual road transport sector, 2016
45
Figure 30: Sensitivity analysis of full hydrogen buses TCO difference with diesel buses on diesel price in the 2030 optimistic scenario
Apart from the cost of fossil fuels and the hypotheses on learning curves, the results of the case studies
are most affected by four factors as shown in Figure 31: the distance travelled by each car, the weighted
average cost of capital (WACC), the cost of electricity and the load factor of the power-to-gas production
facilities.
In any case, for fuel-cell buses to become fully competitive with diesel buses would need the
conjunction of a plurality of favourable elements.
Figure 31: Sensitivity analysis of fuel-cell buses in the 2030 optimistic scenario: Travelled distance (0,5X to 1,5X); WACC (5% to 11%); electricity price (0 to 50€); load factor (3000 to 1000 hours)
Distance travelled: because the cost of fuel is still higher for fuel-cell buses in 2030 compared to
diesel buses, longer routes induce an increased TCO difference.
WACC: As a consequence of a higher share of CAPEX in the TCO of the hydrogen vehicles compared
to diesel vehicles, a high cost of capital degrades the competitiveness of the first. Investments in
power-to-gas production and refuelling assets can be particularly exposed to high cost of capital
during market uptake if the regulatory and policy frames do not create investors’ confidence in the
sector.
Electricity cost and load factor: similarly to fuel-cell LDVs, the competitiveness of fuel-cell buses will
strongly depend on electricity supply conditions. Favourable conditions can be the result of high
penetration of renewable in the grid or the opportunity to connect the power-to-gas production
More competitive Less competitive
0 100 000 200 000 300 000 400 000
TCO (H2) – TCO (diesel) (€) 2€/litre
1€/litre
More competitive Less competitive
0 100 000 200 000 300 000 400 000 500 000
Load factor
Electricity Price
WACC
Travelled distance
TCO (H2) – TCO (diesel) (€)
low
high

RE-P2G – Renewable power-to-gas for the non-individual road transport sector, 2016
46
plant to a cheap and off grid renewable source (see Figure 32). Our low case is based on the
assumption of a power-to-gas production plant connected to the grid with high penetration of
variable renewable sources.
Figure 32: Sensitivity analysis of electricity supply conditions (electricity price and load factor) on the TCO difference between fuel cell and diesel buses in 2030. Each blue box corresponds to a specific scenario 1: grid connected power-to-gas plant with low to medium penetration of renewable sources 2: off grid power-to-gas plant connected to a wind farm 3: grid connected power-to-gas plant with high penetration of renewable sources
Conclusion
The TCO analysis of the development of fuel-cell buses shows that competitiveness with diesel buses is
likely unattainable by 2030 and thereafter. Only a conjunction of favourable elements (an increase in oil
prices, a fast penetration of renewable on the grid, and a faster than expected cost decrease of buses
vehicle costs) would make it possible. Even in that case, the cost of promoting hydrogen buses until 2030
would be very high (€32b to €44b).
Imposing mandates on privately owned fleets to include a minimum of fuel-cell buses would be the only
“free” option left. This could be considered together with an initial promotion of hydrogen buses until
2020 to bring the TCO difference down from more than €1m per bus to ~€375k at a more reasonable
cost of €7b to €9b.The environmental benefits of promoting hydrogen buses are limited compared to
captive light duty vehicles fleets because they account for a much less important part of CO2 emissions
from the mobility sector [33] [25].
Therefore, based on the assumptions made previously, inter-city buses are likely not a market segment
to target in priority if the governments wish to develop the hydrogen mobility segment at a reasonable
cost, and with the end goal of reducing CO2 emissions in the mobility sector. In the longer term however,
power-to-gas is the only technical solution available for the decarbonisation of long range heavy duty
vehicles, and inter-city buses and long range city delivery trucks would be better suited than other HDVs
for launching the market.
TCO gapElectricity price (in euros per MWh inc. grid fee)
20 30 40 50 60
Load factor (in hours per
year)
1000 462 787 € 495 639 € 528 491 € 561 343 € 594 195 €
1500 282 284 € 315 136 € 347 988 € 380 840 € 413 692 €
2000 192 033 € 224 885 € 257 737 € 290 589 € 323 441 €
2500 137 882 € 170 734 € 203 586 € 236 438 € 269 290 €
3000 101 782 € 134 634 € 167 486 € 200 338 € 233 190 €
1
2
3

RE-P2G – Renewable power-to-gas for the non-individual road transport sector, 2016
47
4 . P O L I C I ES
The policy section identifies and analyses policies suited to support the market launch of power-to-gas
technologies in the non-individual transport sector. A screening of policy instruments is provided in
section 4.1 and the most relevant are analysed in section 0.
4 . 1 . S C R E E N I N G O F P O L I C Y I N S T R U M E N T S
A first list of policy measures was built on the results of the RES-T-NEXT report published by IEA-RETD in 2015 [34]. This report provides recommendations on the policies to be used to increase the share of renewable energy in the individual transport sector based on a technology agnostic analysis. The analysis of policy measures to stimulate power-to-gas in the non-individual transport sector is based on the findings of the RES-T-NEXT report and complemented with additional instruments.
All instruments were grouped depending on their type of support to stimulate the use of power-to-gas in the transport sector:
Regulatory measures provide a combination of long term targets, possible obligations and their
associated schemes to increase the share of renewable fuels used in the transport sector.
Financial support reduces the cost difference between an emerging technology (i.e. power-to-gas) and
their benchmark (i.e. fossil fuelled vehicles). In the particular case of mobility, financial support can
also help in expanding alternative fuel production and distribution infrastructure or research and
development in vehicle technology.
Public support for technology demonstration projects and acceptance by end-users can also
contribute to the market launch of emerging technologies such as power-to-gas vehicles.
Each policy measure addresses a specific power-to-gas mobility value chain segment. Three segments were differentiated: energy carrier (including its production), distribution infrastructure and vehicles.
Table 3 provides a summary of the policies screened and the result of the selection process. Most of the 17 measures are technology agnostic, they apply generically to all technologies that comply with the objective of reducing emissions (either carbon or air pollutants emissions) and are therefore not specific to power-to-gas. This can be a challenge when power-to-gas is outcompeted by alternative technologies (e.g. BEVs in short-distance urban applications). In order for these measures to effectively support the market uptake of power-to-gas technologies, the power-to-gas for mobility sector has to be preferentially developed through long range uses of vehicles where power-to-gas is predicted to be economically sound and where the measures will enable a differentiation from competing technologies (see section 2.2).
The RES-T-NEXT report identifies incentives, green public procurement, policies to increase RES-hydrogen, ZEV mandates, regulation of the filling infrastructure, and pilot projects as being main instruments stimulating hydrogen mobility. All these measures (excluding incentives concerning company car taxation) appear to be suitable for supporting the market launch of power-to-gas technologies in the non-individual transport sector as well and are therefore considered in a further, more detailed analysis in section 4.2.

RE-P2G – Renewable power-to-gas for the non-individual road transport sector, 2016
48
Other instruments identified in the RES-T-NEXT report have however not been further considered due to their low applicability or low effectiveness to support power-to-gas in the non-individual transport sector in particular:
Environmental zoning and parking policies: both apply to urban contexts where the BEV option will
outcompete power-to-gas technologies.
Incentives on high occupancy vehicle lanes for ZEV and on company car taxation: both apply mainly to
passenger cars and are thus not suited to the non-individual transport sector.
Incentives on road pricing and tolls: the impact of such an incentive strongly depends on the country
context and in this case it has only a regional impact. The measure could be applied to power-to-gas
mobility but is excluded in favour of more effective policy measures.
Information provision: As for any innovative technology, the provision of information on power-to-gas
technology is important for the market launch but is not seen as a priority compared to other policy
measures required.
Nevertheless, each of these 6 measures is briefly described in appendix (see section 7.5).

RE-P2G – Renewable power-to-gas for the non-individual road transport sector, 2016
49
Table 3 summarizes the 17 screened policy measures, with their type and their value chain segment
addressed. The 11 measures selected for further consideration are highlighted in bold.
Type Policy measure Value chain segment
addressed Selection
Regulation
Regulations on renewable fuels in transport sector Energy carrier Yes
Regulations on distribution infrastructure Distribution
infrastructure Yes
Renewable electricity and e-fuel certification schemes
Energy carrier &
Distribution
infrastructure
Yes
Zero emission vehicle (ZEV) mandates for public fleet /
public transport Vehicle Yes
Environmental zoning (urban access restrictions) Vehicle No
Parking policies Vehicle No
High Occupancy Vehicle (HOV) Lanes Incentives for ZEV Vehicle No
Financial
support
Subsidies for capital cost of power-to-gas production
plants Energy carrier Yes
Energy taxation incentives (electricity & fuel tax
exemption, CO2 tax) Energy carrier Yes
Subsidies for capital cost of distribution infrastructure Distribution
infrastructure Yes
Vehicle registration tax (VRT) and value added tax (VAT)
incentives Vehicle Yes
Direct subsidies for vehicle purchase cost Vehicle Yes
Green public procurement (GPP) in public transport and
public captive fleets Vehicle Yes
Company car taxation incentives Vehicle No
Road pricing and toll incentives Vehicle No
Technology
development &
acceptance
Pilot & demonstration projects All Yes
Information provision All No
Table 3: Summary table of the screening of financial measures to support the power-to-gas mobility market uptake in the non-individual transport sector

RE-P2G – Renewable power-to-gas for the non-individual road transport sector, 2016
50
4 . 2 . S E L E C T E D S E T O F P O L I C I E S
4.2.1. Overview of relevant policy instruments
The preliminary screening of policy measures in section 4.1 results in a set of 11 instruments that can be
used simultaneously or at different phases to support the market launch of power-to-gas technology in
the non-individual transport sector. This set of policies is suited to the most promising market segments
identified in section 1.3.3, section 2.2 and section 0: captive fleets of light duty vehicles, inter-city buses
and city delivery trucks for long ranges (i.e. no fully urban uses). It could also be applied to other
segments such as rural, regional or long haul transport with either medium or heavy duty vehicles even
though these segments are less suited to early adoption through the conversion of public fleets.
Figure 33 shows the main and supporting policy instruments to boost the market uptake of power-to-
gas in the non-individual transport sector. The rationale for use of the main instruments and their
description is given in section 4.2.2, and supporting instruments are further described in section 4.2.3
and in the appendix (section 7.4).
Figure 33: Main and the supporting policy instruments to support the market uptake of power-to-gas in the non-individual transport sector.
The policy instruments in the figure build the required frame for power-to-gas technology development
in the non-individual road transport sector. Policy instruments should be used to trigger the early
adoption of hydrogen vehicles. In order to increase the effectiveness for the P2G market, policy
instruments may be chosen that are specifically designed for this market. This goes against the usual
paradigm of “technology-neutral policy design” but is justified in order to achieve a high penetration of
renewables in the transport sector using power-to gas fuels. Only a consistent set of policy measures
with a phased approach continuing over a period of 10-15 years can deliver a relevant market
penetration.
Figure 34 displays the full set of policy instruments positioned according to the value chain segment
addressed by the instrument (energy carrier, distribution infrastructure or vehicle) and according to the
phase of market launch when the policy is best suited to be used. The three types of policy measures
measure (regulation, financial support, technology development & acceptance) are differentiated by
color.

RE-P2G – Renewable power-to-gas for the non-individual road transport sector, 2016
51
Figure 34: Overview of the relevant policy instruments to be used to support market launch of power-to-gas technologies in the non-individual road transport applicable to captive fleets of light duty vehicles and buses
4.2.2. Main policy instruments to support P2G in non-individual transport
Power-to-gas as fuel in the mobility sector is currently under-represented due to its high fuel costs, the
underdeveloped filling infrastructure and in consequence a small number of adapted vehicles with high
costs. Thus, policy measures aiming to support the use of power-to-gas in the mobility sector have to
address all those issues. In this study, we identified a combination of five main policy measures spanning
the value chain and different stages of development to be most effective on the power-to-gas mobility
market development: this effectiveness is achieved by covering the entire value chain from fuels to
infrastructure and vehicles as well as bridging the gap between small scale pilot and demonstration
projects to market roll out through public procurement.
Green public procurement (GPP) in public transport and public captive fleets
Direct subsidies for vehicle purchase costs
Subsidies for capital costs of distribution infrastructure
Energy taxation incentives (electricity & fuel exemption, CO2-tax)
Regulations on renewable fuels in the transport sector
Green public procurement (GPP) in public transport and public captive fleets
Green Public Procurement (GPP) is "a process whereby public authorities seek to procure goods,
services and works with a reduced environmental impact throughout their life-cycle when compared to
goods, services and works with the same primary function that would otherwise be procured.” Source:
Communication (COM (2008) 400) “Public procurement for a better environment”

RE-P2G – Renewable power-to-gas for the non-individual road transport sector, 2016
52
The public sector in the EU operates a large fleet of vehicles including passenger cars, LDVs, buses and
waste disposal trucks. The annual purchase of vehicles by public authorities in the EU is estimated at
110.000 LDVs and 35,000 vans (around 6% of the market) and around 17000 buses (30% of the market).
These figures illustrate that GPP of green vehicles can play a major role in the market launch for
renewable powered vehicles e.g. by stimulating public authorities to operate hydrogen vehicle fleets.
The existing set of relevant legislation and policies in the EU includes the clean vehicle directive
(2009/33/EC), definition of target values for fleet emissions, the EURO standards and directive
2003/30/EC to promote the use of biofuels with a target of 5.75%. Like in other sectors, GPP in transport
can be implemented through e.g. National Action Plans or by local governments. This instrument is
established on a voluntary basis usually at regional level by municipalities and is well applicable to public
captive fleets (e.g. governmental fleets, public buses, etc.).
One recent example for GPP is the decision of the German government from January 2015 to purchase
20% of new cars for the federal agencies with emissions of less than 50 g CO2/km. This can only be
achieved with BEVs or hydrogen vehicles. The city of Hamburg has decided to only purchase zero
emission busses from 2020 onwards. With a plan to operate 4 more hydrogen filling stations in the city
by 2020, a high share of these are expected to be fuel cell buses
GPP will increase the volume of vehicles purchased at market launch and it will stimulate companies to
develop and manufacture a variety of hydrogen fuelled vehicles. Due to a more reliable market forecast
of GPP initiatives compared to a less predictable private customer purchase behaviour this can stimulate
an accelerated production capacity increase in the industry. Such economy of sales effects will
accelerate the cost reduction from moving down the learning curve. Since SNG vehicles have already
benefited from the learning effect of CNG vehicles (their cost is already close to that of diesel vehicles)
this measure should be focused towards hydrogen fuelled vehicles.
In many sectors of GPP the TCO of a green product is lower e.g. for energy consuming appliances. This is
currently not the case for hydrogen vehicles. For the additional cost of this measure (additional capital
costs and operational costs compared to a benchmark technology) financing mechanisms need to be
developed. These can include Public Private Partnerships with companies in the value chain who can
demonstrate their innovations and new products while covering part of the additional cost and risks or
less capital intensive financing schemes such as leasing of vehicles. In public transport the introduction
of zero emission vehicles can be partially financed through a moderate increase of the transport fares
with an accompanying campaign to achieve public acceptance and to promote the greening of the
transport sector, and cross-financed through taxes on polluting alternatives, which can also be used to
finance zero emissions LDVs and vans.
The total cost of the measure is set by the volume of the fleets (i.e. number of vehicles) on which the
GPP is applied. In Hamburg the replacement of the entire fleet of 700 busses currently operated from 7
stations will be realized in a step by step process and is expected to take 12 to 14 years. In each phase
the number of vehicles should match the infrastructure to ensure a cost effective combined effect. In
this way, GPPs can be used in combination with subsidies for distribution infrastructures in a target area
in order to secure sufficient demand for the filling infrastructure.
Many countries in Europe and worldwide, for instance Sweden and Japan, have successfully
implemented GPP in their public transport sector in the past.

RE-P2G – Renewable power-to-gas for the non-individual road transport sector, 2016
53
Direct subsidies for vehicle purchase costs
Fuel-cell vehicles have significantly higher investment costs than fossil fuelled vehicles due to the low
number of units produced so far. This cost is the main contributor to the total cost of ownership of
FCEVs. Subsidies for purchase costs of vehicles (LDV, trucks, buses) during their market launch are
important to reduce the final purchase price of the vehicle and increase its competitiveness with other
types of vehicles (e.g. fossil fuelled vehicles) and thus to ensure the technology is suitably attractive for
end-users. Subsidies on vehicle purchases can be designed and adjusted year by year along the learning
curve of vehicle manufacturing costs in order to close the gap between vehicles costs (either in purchase
costs or in total costs of ownership) and eventually cease when competitiveness with the benchmark
option (i.e. diesel) is reached.
Direct subsidies for vehicle purchase costs are expected to have a more efficient financial stimulation
effect compared to VRT and VAT exemptions for the vehicle purchase, since in many countries tax
exemptions amounts would be too low (or not even applicable) to cover the TCO difference.
The cost of direct subsidies is inherently correlated with the number of vehicle purchased. It will thus
increase rapidly with market take-off. As long as the number of vehicles supported by such financial
support remains at a low level due to a limited number of non-individual vehicles, the costs could be
balanced by an increase in taxes applied to mass market vehicles and a higher fuel tax on fossil fuels.
The current European figure of nearly 100 hydrogen buses which are all part of demonstration projects
compared to an annual sales volume of more than 30,000 buses in Western Europe alone illustrates the
actual small market share. Even though ambitious projects like e.g. in China with numbers of up to 300
buses to be deployed throughout 2016 and 2017 will increase the numbers of hydrogen buses
substantially in the near future, sales numbers will remain fairly small compared to the overall market.
As calculated in section 3.2.2, the cost of promoting hydrogen buses until 2030 would be very high
(€32b to €44b). However, an initial promotion of hydrogen buses until 2020 could bring the TCO
difference down from more than €1m per bus to ~€375k at a more reasonable cost of €7b to €9b.
As stated above, the numbers for fuel cell powered LDVs required to reach cost competitiveness is
around 150,000. Consequently there is very significant gap to bridge in order to bring the numbers up to
the level of cost competitiveness. However, cost will come down steadily with a steep learning curve
today as vehicle numbers increase, which could be in part achieved through the conversion of part of
the 110,000 public LDV to hydrogen.
Direct subsidies for CNG vehicle purchase would not necessarily improve the competitiveness for SNG
use. This measure is not deemed to have a strong impact on the SNG path, and the lack in
competitiveness which mostly lies in the fuel production value chain.
Subsidies for the purchase of alternative vehicles are used by many national and state authorities
around the world (e.g. Spain, France, Netherlands, UK, Sweden, Germany, USA, Japan and China). For
instance, the Clean Vehicle Rebate Project in California provides rebates on vehicle purchase prices of up
to $6,500 per alternative light duty vehicle (battery electric, plug-in hybrid electric and fuel cell vehicles)
[37].
Subsidies for capital costs of distribution infrastructure
Negative experiences from supporting gas vehicles in Germany by means of fuel tax exemption have
shown that a fuel exemption tax alone is not sufficient to initiate the market development, if there is no

RE-P2G – Renewable power-to-gas for the non-individual road transport sector, 2016
54
incentive to develop the infrastructure required. Sufficiently widespread filling stations are a
prerequisite for gas vehicles being adopted by end consumers. Subsidies for capital costs will improve
the business case of the filling infrastructure that will generally not be attractive when fuel demand is
low during the early adoption phase. Consequently those subsidies will unlock the issue of lack of
infrastructure for the first hydrogen vehicles deployed. However, filling stations used for CNG are the
same that would be used to deliver SNG to SNG powered vehicles, and the market of CNG/SNG filling
stations is much more mature than for hydrogen. Where this is the case, further public support for the
capital costs of CNG/SNG filling stations is not effective.
The need for infrastructure development in Europe is supported by the DIRECTIVE 2014/94/EU on the
deployment of alternative fuels infrastructure which regulates the EU-wide development. Is was
preceded by a report of the CARS 21 High Level Group in 2012 which stated that the lack of a Union-
wide harmonized alternative fuel infrastructure prevents the market introduction of vehicles using
alternative fuels and delays their environmental benefits. An action plan for a competitive and
sustainable automotive industry in Europe from the same year led to this directive. However, this
Directive does not regulate financial measures which are important for market launch.
The directive makes it clear that regulatory aspects to encourage the growth of filling stations should be
made part of the subsidy condition in order to optimise the localisation of filling stations, commitment
to renewable energies, or higher subsidies for the filling stations using RES. The financial support for a
hydrogen filling station should be dependent on the use of green hydrogen.
The cost of the measure can be reduced if the subsidy is limited to the first filling stations installed in
order to launch the market in a given geographic perimeter. However, the costs can rise significantly if
public funds are used to develop the refuelling infrastructure at national scale with tens to hundreds of
units. Therefore it is recommended to cap the subsidies for filling stations at a number identified to
ensure a basic supply for a given area.
Subsidies on the capital cost of distribution infrastructure can be implemented through call for projects
at state or national level or regional level (e.g. UE level). Public Private Partnerships (PPP) can also be
established in order to reduce the capital cost carried by private entities. Both options require public
authorities to be involved in projects.
In Hamburg the bus fleet is operated from 7 stations with about 100 busses per station. By successive
conversion of the fleet to hydrogen busses, the utilization of the filling station is sufficient. For large
buses fleets, it is possible to provide them with their own H2 filling stations, which are only used by
busses. Nevertheless subsidies are needed for the development of the infrastructure.
For the supply of LDV and trucks publicly available stations are required which can also be used by
individual transport to ensure better utilization. Therefore the subsidized filling stations should be open
for broad application to improve the business case. In the National Hydrogen and Fuel Cell Technology
Innovation program in Germany the filling infrastructure technology is not restricted.
National targets have been published for several countries to install significant networks of filling
stations within the next years. For instance, the Japanese government plans to implement 100 hydrogen
filling stations in the near future. In Germany, the H2 mobility initiative (consortium created by Air
Liquide, Daimler, Linde, OMV, Shell and Total) fosters the expansion of the hydrogen infrastructure to
100 filling stations by 2017 and 400 filling stations by 2023.

RE-P2G – Renewable power-to-gas for the non-individual road transport sector, 2016
55
Energy taxation incentives (electricity & fuel exemption, CO2-tax)
Depending on the country’s tax system, electricity and fuel taxes can represent a significant share of the
final purchase price of power-to-gas fuels. In a number of countries, the electricity tax depends on the
business sector and consumption. Further differences in the taxation apply between industrial, service
companies and private households. Across the EU the share of the final electricity price of tax and levies
varies from below 5% e.g. in Malta and UK to around 70% in Denmark for household consumers. The
electricity price share of taxes and levies paid by industrial consumers in 2015varies from 0 (e.g. Malta
and a number of Easter European countries) to more than 40% (Italy and Germany). A number of
countries have exempted electricity produced by renewable energy sources from electricity tax.
In the same way the taxation of the transport sector varies. The US is well known for its very low fuel
taxes while some EU countries (e.g. UK, Norway and Switzerland) charge high fuel taxes combining
excise duty and VAT. Fuel taxes on petrol and diesel vary from around 0.9 €/l for Petrol in many EU
countries to 0.55 €/l in Japan and 0.07 €/l in the US. A similar range can be found for Diesel even though
in most EU countries the tax for Diesel is lower than for gasoline with values between 0.6 and -0.7 €/l,
0.33 €/l in Japan and 0.08 in the US. In many countries alternative fuels are exempted from fuel tax
already. According to the US DOE alternative fuels data centre 135 alternative fuel tax incentives are
currently applied across the US.
For power to gas fuels tax exemption, can be a key instrument to compete with the benchmark options
(i.e. diesel, CNG or biomethane).
There are three suitable forms of energy taxation incentives which improve the competitiveness of
renewable power-to-gas fuels compared to fossil fuels:
Tax discounts, or tax differentiation for electricity from renewable sources purchased by power-to-gas
production plants,
Tax discounts, or tax differentiation for gaseous fuels produced from electricity,
Increased CO2 tax on fuels.
Tax differentiation is recommended instead of tax discount or exemption because it allows balancing revenue losses by increasing the tax level on conventional uses of electricity or on conventional fuels (i.e. fossil fuels).An increased CO2 tax will generate additional public revenues but is not expected to significantly increase the competitiveness of power-to-gas fuels unless it is set at a very high level (i.e. several hundreds of Euros per ton of CO2).
Tax incentives on electricity and fuel are deemed to be more effective than subsidies on the capital costs
of power-to-gas plants: their cost can be balanced with tax differentiation and they provide a lasting
frame and financial support creating confidence for investors and industrials.
Tax incentives on electricity from renewable sources apply to BEVs and power-to-gas and do therefore
not provide a competitive advantage for power-to-gas fuels. They are still very relevant in transport
market segments such as long range applications where BEVs cannot compete for technical reasons and
power-to-gas fuels are the only viable option for sustainable transport.
Due to the wide variation of fuel and electricity tax regimes this instrument might only have limited
impacts where taxes are low in general and should therefore be combined with the other policy
measures as described in this chapter. The CNG taxation incentives implemented in Germany did not
result in the expected market growth of CNG vehicles since the initiative lacked from such a combination
with other policy instruments [35].
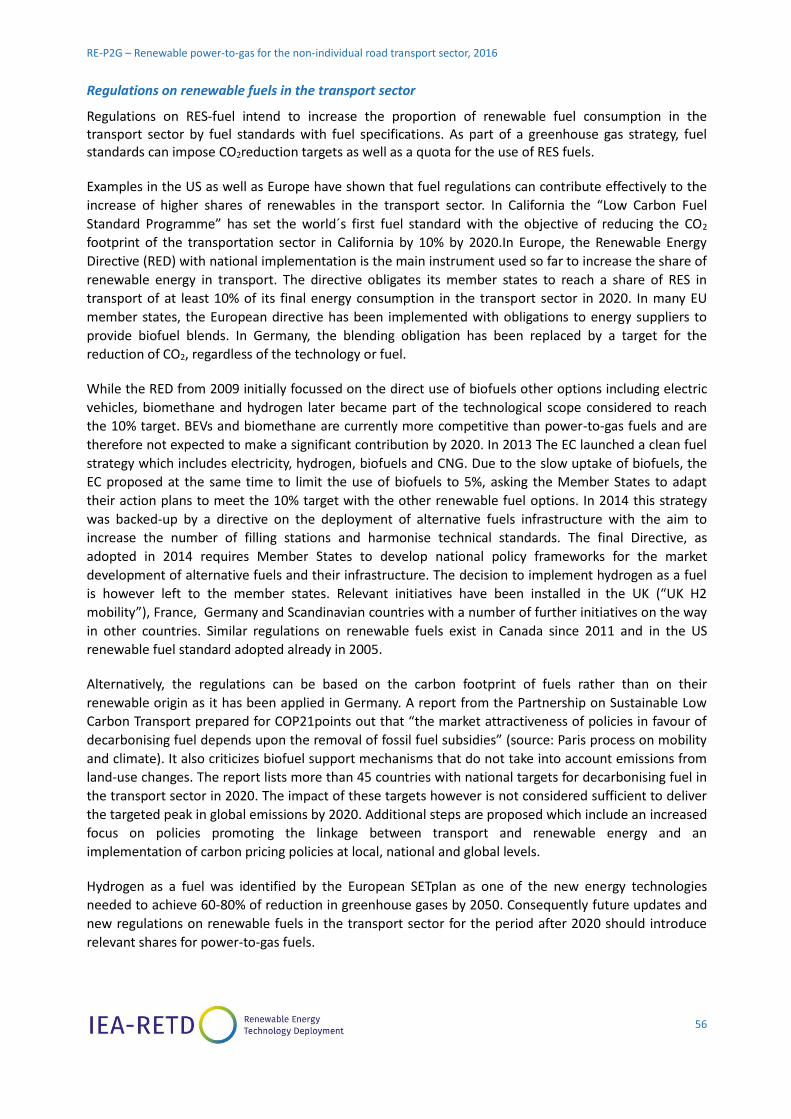
RE-P2G – Renewable power-to-gas for the non-individual road transport sector, 2016
56
Regulations on renewable fuels in the transport sector
Regulations on RES-fuel intend to increase the proportion of renewable fuel consumption in the transport sector by fuel standards with fuel specifications. As part of a greenhouse gas strategy, fuel standards can impose CO2reduction targets as well as a quota for the use of RES fuels.
Examples in the US as well as Europe have shown that fuel regulations can contribute effectively to the
increase of higher shares of renewables in the transport sector. In California the “Low Carbon Fuel
Standard Programme” has set the world´s first fuel standard with the objective of reducing the CO2
footprint of the transportation sector in California by 10% by 2020.In Europe, the Renewable Energy
Directive (RED) with national implementation is the main instrument used so far to increase the share of
renewable energy in transport. The directive obligates its member states to reach a share of RES in
transport of at least 10% of its final energy consumption in the transport sector in 2020. In many EU
member states, the European directive has been implemented with obligations to energy suppliers to
provide biofuel blends. In Germany, the blending obligation has been replaced by a target for the
reduction of CO2, regardless of the technology or fuel.
While the RED from 2009 initially focussed on the direct use of biofuels other options including electric
vehicles, biomethane and hydrogen later became part of the technological scope considered to reach
the 10% target. BEVs and biomethane are currently more competitive than power-to-gas fuels and are
therefore not expected to make a significant contribution by 2020. In 2013 The EC launched a clean fuel
strategy which includes electricity, hydrogen, biofuels and CNG. Due to the slow uptake of biofuels, the
EC proposed at the same time to limit the use of biofuels to 5%, asking the Member States to adapt
their action plans to meet the 10% target with the other renewable fuel options. In 2014 this strategy
was backed-up by a directive on the deployment of alternative fuels infrastructure with the aim to
increase the number of filling stations and harmonise technical standards. The final Directive, as
adopted in 2014 requires Member States to develop national policy frameworks for the market
development of alternative fuels and their infrastructure. The decision to implement hydrogen as a fuel
is however left to the member states. Relevant initiatives have been installed in the UK (“UK H2
mobility”), France, Germany and Scandinavian countries with a number of further initiatives on the way
in other countries. Similar regulations on renewable fuels exist in Canada since 2011 and in the US
renewable fuel standard adopted already in 2005.
Alternatively, the regulations can be based on the carbon footprint of fuels rather than on their
renewable origin as it has been applied in Germany. A report from the Partnership on Sustainable Low
Carbon Transport prepared for COP21points out that “the market attractiveness of policies in favour of
decarbonising fuel depends upon the removal of fossil fuel subsidies” (source: Paris process on mobility
and climate). It also criticizes biofuel support mechanisms that do not take into account emissions from
land-use changes. The report lists more than 45 countries with national targets for decarbonising fuel in
the transport sector in 2020. The impact of these targets however is not considered sufficient to deliver
the targeted peak in global emissions by 2020. Additional steps are proposed which include an increased
focus on policies promoting the linkage between transport and renewable energy and an
implementation of carbon pricing policies at local, national and global levels.
Hydrogen as a fuel was identified by the European SETplan as one of the new energy technologies
needed to achieve 60-80% of reduction in greenhouse gases by 2050. Consequently future updates and
new regulations on renewable fuels in the transport sector for the period after 2020 should introduce
relevant shares for power-to-gas fuels.

RE-P2G – Renewable power-to-gas for the non-individual road transport sector, 2016
57
Besides its binding role, a strong and ambitious regulatory frame in favour of renewable mobility will
provide the different actors of the value chain with the necessary market visibility and confidence to
engage in the sector.
4.2.3. Supporting policy instruments
The following supporting policy instruments are recommended as a useful addition to the main
instruments. They are required for the further development of power to gas in the mobility sector. A
more detailed description is enclosed in the appendix (see section 7.4).
Regulations on distribution infrastructure
Regulating the number of filling stations that should be implemented until a defined target year
stimulates a sound network of filling stations and consequently the attractiveness of vehicles. This
measure should be implemented in addition to subsidies for the capital costs of the distribution
infrastructure in order to ensure the long-term expansion of power-to-gas and to offer investment
security. Furthermore this regulation can be used to ensure the sound regional distribution of filling
stations (e.g. in urban areas or along main corridors).
Renewable electricity and e-fuels certification schemes
Renewable electricity certificates enable electricity consumers to guarantee the renewable origin
(Guarantee of Origin) of the electricity purchased. From the perspective of fuel production from
electricity, similar certification schemes can be used in order to guarantee the renewability of fuels
produced from renewable electricity. Renewable electricity certificates are currently implemented in
most countries which produce renewable energy. However, such a scheme has not yet been established
for fuels produced from electricity.
Zero emission vehicle (ZEV) mandates for public fleets / public transport
Setting a mandatory target guarantees the achievement of a defined market volume. This encourages
car manufacturers to develop and manufacture ZEV as well as encouraging operators of filling stations to
invest in the required infrastructure because of the predictable fuel demand.
Even though this instrument is not aimed at promoting a specific technology within ZEVs, it could be
used to incentivise the power-to-gas market directly by setting specific targets for hydrogen vehicles.
California for instance aims to achieve 1.5 million ZEV by 2020 according to its ZEV action plan. [36].
Subsidies for the capital costs of power-to-gas production infrastructure
Subsidies for the implementation of power-to-gas infrastructure address the issue of high capital
expenditures of emerging technologies during their market launch. Reducing the investment costs in this
period by means of subsidies increases the attractiveness of the technology for project developers. As a
result of the first units installed thanks to this financial support, the specific capital costs of power-to-gas
plants will decrease. The market launching of current mature renewable energy technologies has been
initiated by granting subsidies on the first units installed (e.g. wind, solar, biogas...).
Vehicle registration tax (VRT) and value added tax (VAT) incentives
A tax exemption (either registration tax, VAT or both) is crucial for users investing in renewable gas
powered vehicles in order to improve their competitiveness compared to fossil-fuelled vehicles.
The reduction of the final purchase price of hydrogen vehicles during the first years of market launching
is very important to allow the cost of the vehicles to decrease due to the learning effect. The Norwegian

RE-P2G – Renewable power-to-gas for the non-individual road transport sector, 2016
58
government for instance provides incentives on VRT and VAT for BEVs, with the effect, that in 2014, ZEVs
accounted for 12.7% of total vehicle sales [37].
Pilots & demonstration projects
Hydrogen buses and trucks as well as the infrastructure still require research and development to reduce
cost much further and final validation to prove their reliability by means of pilot and demonstration
projects before the market roll-out. Moreover, social acceptance and gaining the confidence of the
investors for such a new and disseminated technology will be improved with success stories based on
demonstration projects.
4.2.4. The role of the country context and governments’ vision
As explained above a range of policy measures are necessary in order to promote the market uptake of
power-to-gas in the non-individual transport sector. No single measure has the strength and impact to
accelerate the market uptake as required to have the desired impact in the time frame analysed.
Regulatory frames and international initiatives are already available for governments to commit to
ambitious strategies for renewable mobility and power-to-gas more specifically. In the European Union,
the RED and FQD directives enable member states to impose CO2 reduction targets as well as quotas for
the use of RES fuels.
Norway, Germany, the United Kingdom, the Netherlands and ten North American state governments are
part of the International Zero-Emission Vehicle (ZEV) Alliance aiming to accelerate the adoption of zero-
emission vehicles including hydrogen vehicles.
The Norwegian example is particularly explicit on the role played by ambitious national strategies for
climate and renewable mobility. The share of ZEVs in total vehicle sales in Norway has jumped to more
than 12% in 2014 thanks to policy support, including financial incentives on car registration taxes. One
continuation of the strict climate policy is a planned ban on diesel and petrol vehicles from the year
2025 onwards.
Another example can be seen in the Netherlands where the Dutch parliament has taken the first step in
banning new sales of petrol and diesel cars from the year 2025. The lower house supported a motion to
ensure that all new cars are sustainable from 2025 onward and the cabinet must now come up with an
action plan [38].
Industrial companies will also play an important role in the development and use of power-to-gas. For
instance, the Hypos project (Hydrogen Power Storage & Solutions East Germany e.V.) will connect the
chemical material flow network, the natural gas grid, and the electricity supply network in eastern
Germany by using green hydrogen. By using fluctuating energy this would require 1000-1200 MW
electrolysis capacity [39].

RE-P2G – Renewable power-to-gas for the non-individual road transport sector, 2016
59
5 . CO N C LU S I O N S & R ECO M M E NDAT IO N S
Renewable power-to-gas mobility options (hydrogen and SNG) are suited for decarbonisation of the
non-individual transport sector but should focus on long range uses.
Renewable gas vehicles (biomethane, renewable SNG and renewable hydrogen) offer a decarbonisation
path for long range uses. The extent to which they can contribute has to be determined depending on
local context and markets (fossil fuel prices for transportation and electricity prices in a given region will
have a strong influence on the eventual use of power-to-gas). For short range uses battery-electric
vehicles will most likely play the dominant role.
The biomethane path is cheaper than power-to-gas. However, biomethane will hardly be produced in
sufficient quantities to significantly increase the share of renewable fuels in the non-individual transport
sector. Thus, there is room for power-to-gas to play a role in the decarbonisation of transports on long
range uses, both through SNG for methane vehicles and hydrogen for range extenders and full-H2
vehicles.
SNG mobility is easier to implement than hydrogen mobility thanks to existing CNG infrastructure and
vehicles but hydrogen is more competitive on a TCO base.
SNG is an option that is technically attractive for the non-individual sector where vehicles running on
methane are already gaining market share. The infrastructure for gas transport is ready and the
infrastructure for refuelling is under deployment, driven by the growth of the CNG vehicles market while
both vehicle technology and distribution infrastructure for the hydrogen path are much less mature.
However, the additional required production equipment and the low energy efficiency of the SNG path
(low energy efficiency of production and of the ICE) results in an overall lower competitiveness
compared to hydrogen over the full lifetime of the vehicle (TCO). Effectively, the lower energy efficiency
means that more electricity is used for transport over a given distance and that CAPEX are amortized
over a smaller fleet of vehicles, increasing the per vehicle cost of power-to-SNG production and
distribution. This result is already true today and will be even more valid in the future as hydrogen
vehicles manufacturing costs will decrease faster than CNG/SNG vehicles manufacturing costs, which
have already benefitted from learning curve effects. The SNG option is economically outcompeted by
hydrogen, whatever the conditions of electricity purchase of a power-to-gas plant and independently of
the cost reduction of electrolysers and methanation reactors.
Therefore, if power-to-gas options were to be promoted for mobility uses in the non-individual transport
sector, the hydrogen path should be preferred, even though it implies the development of less mature
vehicle technologies and distribution infrastructures.
To maximise the cost-efficiency of political support for power-to-hydrogen introduction within the
non-individual transport sector, policy incentives should focus on fleets of Light Duty Vehicles.
They offer significant advantages compared to larger vehicles: the financial public support needed for
market uptake is lower and the amount of avoided CO2 emissions after large scale deployment of the
technology is higher (see Figure 13). Lastly, synergies can be envisaged between the technology
development of LDVs and passenger cars (mostly synergies on fuel cells) which could greatly increase
the impact of policy measures.

RE-P2G – Renewable power-to-gas for the non-individual road transport sector, 2016
60
In the longer term renewable power-to-hydrogen is the most promising solution currently available for
the decarbonisation of long range heavy duty vehicles; and within those, inter-city buses and long range
city delivery trucks are better suited than other HDVs for launching the market. Promoting and
subsidizing long range inter-urban buses and long range city delivery trucks is not expected to bring their
TCO down to competitiveness with diesel over the next 15 years and would cost more than €40bn, with
uncertain success and limited environmental impact. However, subsidising early series of production
would significantly improve their TCO (down to less than 50% more than diesel vehicles) and would cost
less than €10bn over the next five years. As closing the TCO difference between hydrogen and diesel
buses and trucks is not achievable in the end, any market uptake of these vehicles will require policy
makers to remove diesel buses and trucks from the market, for instance through stricter regulation.
Range extended vehicles are a good transition option to test the power-to-hydrogen technology and
market response at a reduced cost while full hydrogen vehicles are more expensive but could
potentially address more markets
Range extended vehicles come at a lower total cost of ownership compared to full hydrogen vehicles
because the cost of the vehicle is lower, power-to-hydrogen infrastructures are amortized over a larger
fleet (less hydrogen is used per vehicle) and less electricity is used. Moreover, policies targeting range
extended LDVs could also benefit BEVs because they use the same vehicle body, helping to further
decarbonise the transport sector.
Full hydrogen vehicles are more expensive and promoting them would come at a higher cost for policy
makers. But they have a higher potential in terms of decarbonisation: they would be more suited for the
mass market of individual passenger cars (due to the higher ranges and the simpler ease of use36), thus,
developing full hydrogen LDVs could achieve synergies and create an economic opportunity for hydrogen
individual passenger cars.
Developing range extended LDVs should be seen as a transition option to observe the development and
the acceptance of fuel cell vehicles at a reduced cost (it is 10 times less expensive to develop range
extended vehicles compared to full hydrogen vehicles), while improving the economics of fuel cells for
both options. Nevertheless, this strategy is not risk-free: car manufacturers might be reluctant to invest
in the development of range extended vehicles if it is only a transition solution.
Certain policy measures can be implemented to promote the development of all power-to-gas mobility
options, whatever the production and vehicle technology choices.
An appropriate regulatory framework should be set up to provide confidence to stakeholders of the
power-to-gas mobility value chain. It would at least include targets or requirements for a given level of
renewable fuels at the distribution infrastructure level and certification schemes for renewable fuels,
including fuels produced from electricity. In parallel, an exemption of taxes on electricity consumed and
on fuel produced should be granted to power-to-gas plants running on renewable electricity.
In order to enable the targeted development of power-to-hydrogen mobility, a coherent policy
strategy should include the simultaneous implementation of financial and technology demonstration
measures targeting distribution infrastructure and vehicles.
36Range extended vehicles require two types of fuels compared to just one for full hydrogen vehicles.

RE-P2G – Renewable power-to-gas for the non-individual road transport sector, 2016
61
Hydrogen distribution infrastructure deployment should be promoted through subsidies and PPPs:
though it does not represent the largest share of the TCO, distribution infrastructure is a prerequisite to
vehicle adoption. On the contrary, renewable power-to-hydrogen production is not a prerequisite for
vehicle adoption. Hydrogen production can be achieved by non-renewable processes during early
adoption, to prove the technology and trigger the development of the infrastructure independently
from the pace of development of renewables.
Simultaneously, the hydrogen vehicles’ market uptake should intensively be fostered to reduce
manufacturing costs: vehicle costs represent an overwhelming share of today’s TCO and can be
decreased if a learning curve is initiated. Green Public Procurement would be a relevant instrument for
market launch, while zero emissions vehicles mandates would be a complementary tool when the
volume of vehicles sold increases. Direct financial support through subsidies, vehicle registration tax
exemption or VAT exemption could also be considered.
Financing such policy measures could be done through increased diesel taxation or carbon pricing. For
both infrastructure and vehicles, policy makers will have to choose between promoting range-extended
and full hydrogen vehicles: the two options require different developments in terms of infrastructure
because of the different pressures (350 and 700 bars) and in terms of vehicle production (development
of a full hydrogen body or addition of range extenders on a BEV body). However, as individual transport
would develop on full H2 rather than range extenders, a 700 bars infrastructure will facilitate synergies
with this market in the long term, while being also adaptable to deliver a 350 bar pressure if needed37.
37 For instance full H2 buses are currently developed for 350 bars.

RE-P2G – Renewable power-to-gas for the non-individual road transport sector, 2016
62
6 . B I B L I O GR A P H Y
[1] IEA, "CO2 emissions from fuel combustion," 2015.
[2] ENEA Consulting. (2016) The potential of power-to-gas. [Online]. http://www.enea-consulting.com/wp-
content/uploads/2016/01/ENEA-Consulting-The-potential-of-power-to-gas.pdf
[3] IEA, "CO2 emissions from fuel combustion," 2013.
[4] Eurostat. (2015) Electricity generated from renewable energy sources, EU-28, 2003-2013. [Online].
http://ec.europa.eu/eurostat/statistics-
explained/index.php/File:Electricity_generated_from_renewable_energy_sources,_EU-
28,_2003%E2%80%9313_YB15.png
[5] Anglo American Platinum Ltd. (2014) Fuel Cell Technology in Undergound Mining.
[6] SymbioFcell, Interview with Julien Brunet, Sustainable Mobility Leader, 2016.
[7] European Commission. (2016, April) Urban Access Regulation in Europe. [Online].
http://urbanaccessregulations.eu/
[8] Volvo, Adrian Felton. Public Transport Policy of the future.
[9] Glencore. Powering a mine on wind. [Online]. http://www.glencore.com/sustainability/case-
studies/p/powering-a-mine-on-wind
[10] Clean Hydrogen in European Cities, "Influencing factors to the acceptance process of FCH technologies in
public transport," 2013.
[11] RATP. (2016, April) ratp.fr. [Online]. http://scope.ratp.fr/grand-angle/bus2025-en-route-vers-la-mobilite-
durable/
[12] METI. (2014, August) METI.org. [Online]. http://www.meti.go.jp/english/press/2014/pdf/0624_04a.pdf
[13] IEA. (2015, November) Driving renewable energy for transport.
[14] Clean Hydrogen in European Cities (CHIC), "Experiences with the implementation of infrastructures for
hydrogen refuelling and lessons for future installations," 2014.
[15] 3Emotion. (2016) 3emotion.eu. [Online]. http://www.3emotion.eu
[16] High V-Lo City. (2016, April) www.highvlocity.eu. [Online]. http://www.highvlocity.eu
[17] BPI France. (2015, Juillet) Projet HyTrac. [Online].
http://investissementsdavenir.bpifrance.fr/actualites_et_communiques_de_presse/investissements_d_aveni
r_10_8_millions_d_euros_pour_hytrac
[18] La Poste. (2016, April) laposte.fr. [Online]. http://legroupe.laposte.fr/decouverte/les-vehicules-electriques-
de-la-poste
[19] Tenerrdis. (2016, April) www.tenerrdis.fr. [Online]. http://www.tenerrdis.fr/Hydrogene/hyway-kangoo.html
[20] Audi. Audi A7 H-Tron. [Online].
http://www.audi.com/com/brand/en/vorsprung_durch_technik/content/2014/11/audi-a7-sportback-h-tron-

RE-P2G – Renewable power-to-gas for the non-individual road transport sector, 2016
63
quattro.html
[21] National Resources Canada, "Canada’s National Hydrogen and Fuel Cell Strategy & Roadmaps," 2005.
[22] California Energy Commission. (2016, April) www.energy.ca.gov. [Online].
http://www.energy.ca.gov/drive/projects/hydrogen.html
[23] CalHeat Truck Research Center, "Vehicle and Technologies Characterization and Baseline," 2011.
[24] Department of Commerce. (2000) Review of the U.S. Department of Energy's Heavy Vehicle Technologies
Program. [Online]. http://www.nap.edu/catalog/9989/review-of-the-us-department-of-energys-heavy-
vehicle-technologies-program
[25] KBA. www.kba.de. [Online].
http://www.kba.de/DE/Statistik/Kraftverkehr/VerkehrKilometer/verkehr_in_kilometern_node.html
[26] Comissariat Général du développement durable. (2012) Les véhicules utilitaires légers au premier janvier
2011. [Online]. http://www.developpement-durable.gouv.fr/IMG/pdf/CS310.pdf
[27] Comissariat Général au développement durable. (2012, October) Information CO2 des prestations de
transport. [Online]. http://www.developpement-durable.gouv.fr/IMG/pdf/Guide_Information_CO2-2.pdf
[28] Volkswagen. Wolkswagen Van fuel consumptions. [Online]. http://www.volkswagen-
utilitaires.fr/content/medialib/vwd4/vwn_fr/pdf/fiches-
techniques/2016/crafter_van_caracteristiquestechniques20160111-
pdf/_jcr_content/renditions/rendition.download_attachment.file/crafter_van_caracteristiques_techniques_
20160111.pdf
[29] NREL. (2016) Fast-Charge Battery Electric Transit Bus In-Use Fleet Evaluation. [Online].
http://www.nrel.gov/docs/fy16osti/66098.pdf
[30] McKinsey, "A portfolio of power-trains for Europe: a fact-based Analysis," 2010.
[31] Christopher Yang, Michael Nicholas and Lew Fulton Joan Ogden, "The Hydrogen Transition," UC Davies
Institute of Transportation Studies, 2014.
[32] Anna Creti et al., "Defining the Abatment Cost in Presence of Learning-by-doing: Application to the Fuel Cell
Electric Vehicle," Ecole Polytechnique, Université Paris Dauphine, INRA-UR1303 ALISS, CNRS, 2015.
[33] INSEE. (2016, April) http://www.insee.fr. [Online].
http://www.insee.fr/fr/themes/tableau.asp?reg_id=0&ref_id=NATTEF13629
[34] IEA-RETD, "Driving renewable energy for transport - Next generation policy instruments for renewable
transport (REST-T-NEXT)," November 2015.
[35] Peters von Rosenstiel Dirk, Daniel F. Heuermann, and Stefan Hüsig, "Why has the introduction of natural gas
vehicles failed in Germany? Lessons on the role of market failure in markets for alternative fuel vehicles,"
Energy Policy78, pp. 91–101, 2015.
[36] Biofuels News International.
[37] California Environmental Protection Agency. (2016) Clean Vehicle Rebate Project. [Online].
http://www.arb.ca.gov/msprog/aqip/cvrp.htm
[38] Dutch News. [Online]. http://www/DutchNews.nl

RE-P2G – Renewable power-to-gas for the non-individual road transport sector, 2016
64
[39] C Mühlhaus, "Power-to-Hydrogen als Chance für die Chemieindustrie," Cluster Chemie/Kunststoffe, Berlin,
Vortrag bei DBI-Fachforum Energiespeicher 2015.
[40] Alternative Fuels Data Center, "Clean Cities Guide to Alternative Fuel and Advanced Medium- and Heavy-Duty
Vehicles,".
[41] CalHeat, "CalHeat Forum 2013," in CalHeat Technology Roadmap, 2013.
[42] ENEA, ENEA Analysis, 2016.
[43] ADEME, "Un mix électrique 100% renouvelable? Analyses et optimisations," 2015.
[44] US Census Bureau. (2004, December) Vehicle Inventory and Use Survey. [Online].
https://www.census.gov/prod/ec02/ec02tv-us.pdf
[45] IPCC. Carbon dioxide intensities of fuels and electricity for regions and countries. [Online].
https://www.ipcc.ch/pdf/special-reports/sroc/Tables/t0305.pdf
[46] BPI France. (2015, Juillet) Projet HyTrac. [Online].
https://www.google.fr/url?sa=t&rct=j&q=&esrc=s&source=web&cd=1&cad=rja&uact=8&ved=0ahUKEwiXrcz
XnePMAhWDB8AKHWLoDFgQFggfMAA&url=http%3A%2F%2Fwww.bpifrance.fr%2Fcontent%2Fdownload%2
F15365%2F205920%2Ffile%2F20150708%2520CP%2520Bpifrance%2520-%2520HyTrac.pdf&
[47] Natural Resources Canada. (2012, October) Hydrogen Power application to Mining.
[48] Council Directive 2003/96/EC of 27 October 2003.
[49] DG Move, "State of the Art on Alternative Fuels Transport Systems," 2015.
[50] Transport & Environment, "Europe tax deals for diesel," 2015.
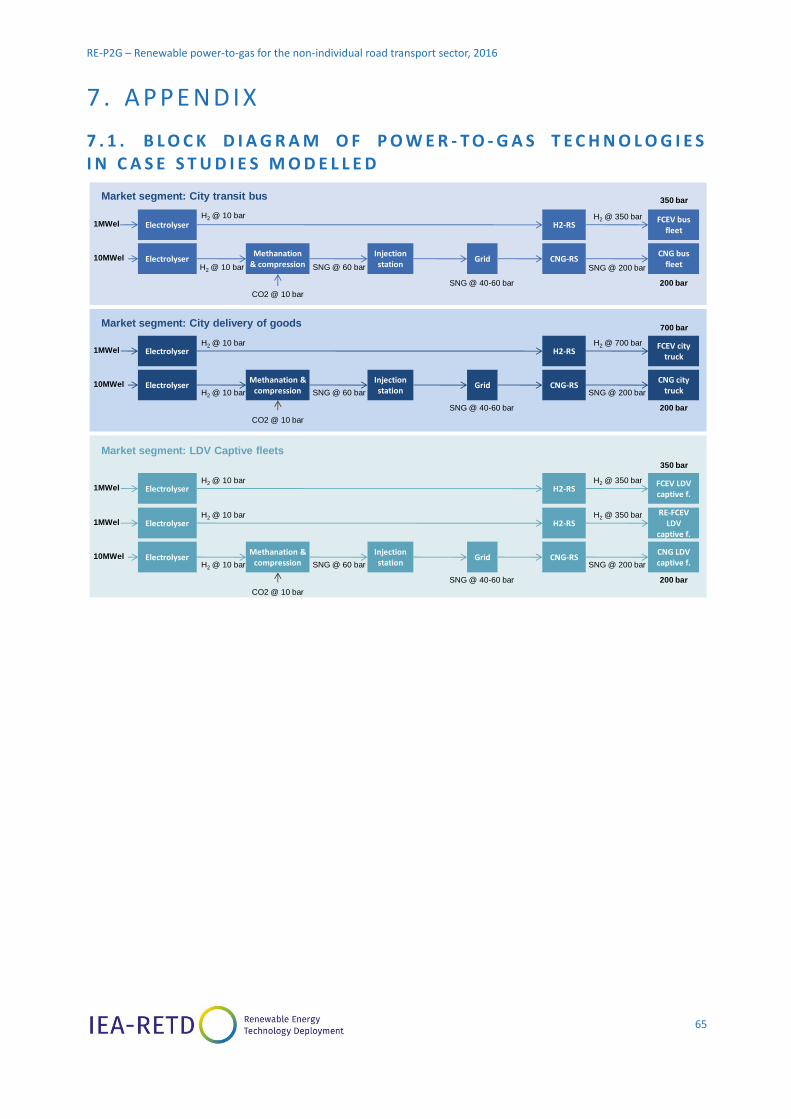
RE-P2G – Renewable power-to-gas for the non-individual road transport sector, 2016
65
7 . A P P E ND I X
7 . 1 . B L O C K D I A G R A M O F P O W E R - T O - G A S T E C H N O L O G I E S I N C A S E S T U D I E S M O D E L L E D
Market segment: City delivery of goods
Electrolyser H2-RSFCEV bus
fleet
Electrolyser CNG-RSCNG bus
fleetMethanation
& compressionInjection station
Grid10MWel
1MWel
Electrolyser H2-RSFCEV city
truck
Electrolyser CNG-RSCNG city
truckMethanation &
compressionInjection station
Grid10MWel
1MWel
CO2 @ 10 bar
350 barMarket segment: City transit bus
H2 @ 10 bar H2 @ 350 bar
200 bar
CO2 @ 10 bar
H2 @ 10 bar SNG @ 60 bar
SNG @ 40-60 bar
SNG @ 200 bar
H2 @ 10 bar H2 @ 700 bar
700 bar
H2 @ 10 bar SNG @ 60 bar
SNG @ 40-60 bar
SNG @ 200 bar
200 bar
Market segment: LDV Captive fleets
Electrolyser H2-RSRE-FCEV
LDV captive f.
Electrolyser CNG-RSCNG LDV captive f.
Methanation & compression
Injection station
Grid10MWel
1MWel
CO2 @ 10 bar
H2 @ 10 bar H2 @ 350 bar
350 bar
H2 @ 10 bar SNG @ 60 bar
SNG @ 40-60 bar
SNG @ 200 bar
200 bar
Electrolyser H2-RSFCEV LDV captive f.
1MWelH2 @ 10 bar H2 @ 350 bar
350 bar
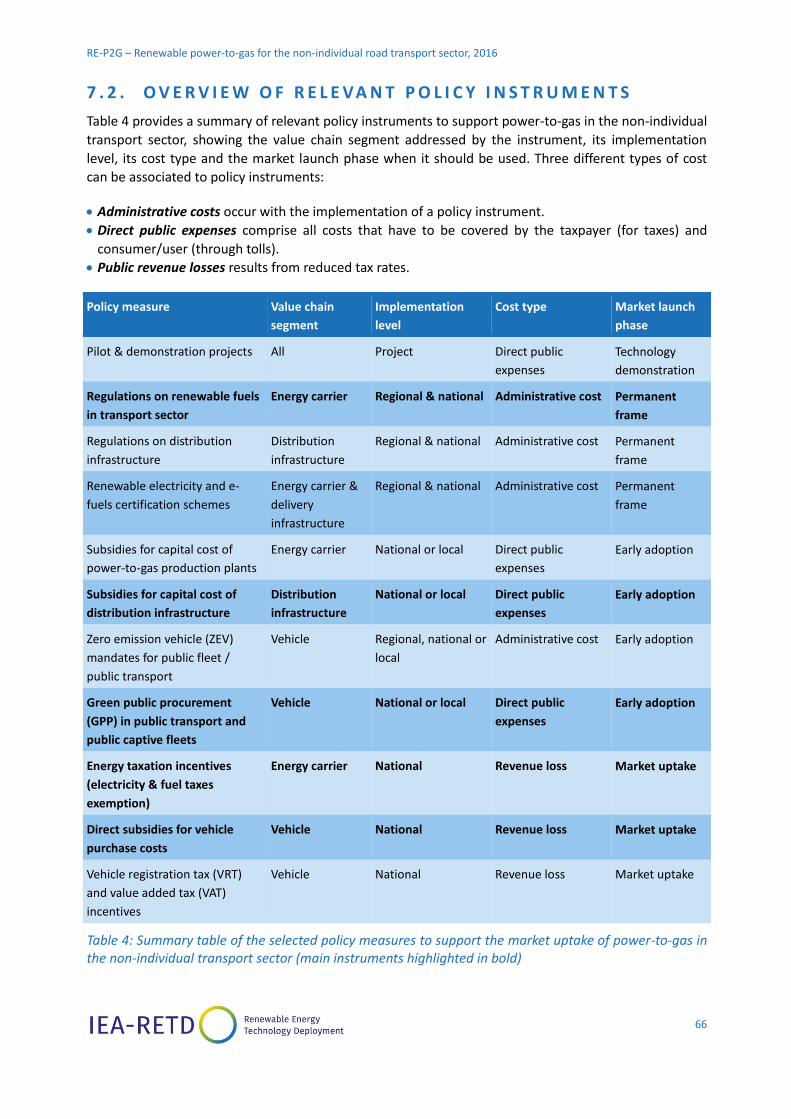
RE-P2G – Renewable power-to-gas for the non-individual road transport sector, 2016
66
7 . 2 . O V E R V I E W O F R E L E VA N T P O L I C Y I N S T R U M E N T S
Table 4 provides a summary of relevant policy instruments to support power-to-gas in the non-individual
transport sector, showing the value chain segment addressed by the instrument, its implementation
level, its cost type and the market launch phase when it should be used. Three different types of cost
can be associated to policy instruments:
Administrative costs occur with the implementation of a policy instrument.
Direct public expenses comprise all costs that have to be covered by the taxpayer (for taxes) and
consumer/user (through tolls).
Public revenue losses results from reduced tax rates.
Policy measure Value chain
segment
Implementation
level
Cost type Market launch
phase
Pilot & demonstration projects All Project Direct public
expenses
Technology
demonstration
Regulations on renewable fuels
in transport sector
Energy carrier Regional & national Administrative cost Permanent
frame
Regulations on distribution
infrastructure
Distribution
infrastructure
Regional & national Administrative cost Permanent
frame
Renewable electricity and e-
fuels certification schemes
Energy carrier &
delivery
infrastructure
Regional & national Administrative cost Permanent
frame
Subsidies for capital cost of
power-to-gas production plants
Energy carrier National or local Direct public
expenses
Early adoption
Subsidies for capital cost of
distribution infrastructure
Distribution
infrastructure
National or local Direct public
expenses
Early adoption
Zero emission vehicle (ZEV)
mandates for public fleet /
public transport
Vehicle Regional, national or
local
Administrative cost Early adoption
Green public procurement
(GPP) in public transport and
public captive fleets
Vehicle National or local Direct public
expenses
Early adoption
Energy taxation incentives
(electricity & fuel taxes
exemption)
Energy carrier National Revenue loss Market uptake
Direct subsidies for vehicle
purchase costs
Vehicle National Revenue loss Market uptake
Vehicle registration tax (VRT)
and value added tax (VAT)
incentives
Vehicle National Revenue loss Market uptake
Table 4: Summary table of the selected policy measures to support the market uptake of power-to-gas in the non-individual transport sector (main instruments highlighted in bold)

RE-P2G – Renewable power-to-gas for the non-individual road transport sector, 2016
67
7 . 1 . I N P U T D ATA F O R T H E C A S E S T U D I E S
Item Unit Long Range Short RangeMarket
uptake
Large scale
deployment
General assumptions
Carbon Price €/kg CO2 0,02 0,02 0,02 0,10
Project costs % of Total CAPEX 30% 30% 30% 30%
WACC - 8% 8% 8% 8%
CO2 diesel emissions kg/l 2,7 2,7 2,7 2,7
CO2 CNG emissions kg/MWH 163,0 163,0 163,0 163,0
Carbon footprint of electric grid kg CO2 / MWh 0 0 0 0
P2G OPHR h/year 8 600 8 600 8 600 2 000
Refueling station OPHR h/year 8 600 8 600 8 600 8 600
VAT € 20% 20% 20% 20%
Electricity
Electricity cost €/MWhe 100,00 100,00 80,00 30,00
Wholesale electricity price 60,00 60,00 60,00 10,00
Grid fee €/MWhe 20,00 20,00 20,00 20,00
Tax on electricity €/MWhe 20,00 20,00 0,00 0,00
Fuel prices
Diesel price €/l 1,21 1,21 1,21 1,51
CNG price €/MWhHHV-CNG 20,43 20,43 20,43 29,70
BioCH4 price €/MWHLHV-BioMethane 82,74 82,74 82,74 57,92
CO2 cost @ 10 bar €/ton 50 50 50 50
Fuel Taxes
P2G fuel tax % 0,00 0,00 0,00 0,00
CNG tax €/MWhHHV-CNG 4,34 4,34 4,34 4,34
BioCH4 tax €/MWHLHV-BioMethane 0,00 0,00 0,00 0,00
Physical constants
CO2 density ton/Nm3-CO2 0,0018 0,0018 0,0018 0,0018
HHV volumic H2 MWh/Nm3-H2 0,004 0,004 0,004 0,004
HHV volumic SNG MWh/Nm3-SNG 0,011 0,011 0,011 0,011
Power grid connection
Lifetime power grid connection years 40 40 40 40
Transformer capacity out - 1MW MWe 1,0 1,0 1,0 1,0
Transformer capacity out - 10MW MWe 10,0 10,0 10,0 10,0
Transformer losses % 3% 3% 3% 3%
Length HV line km 1,0 1,0 1,0 1,0
Equipment CAPEX HV circuit breaker € 125 000 125 000 125 000 125 000
Specific equipment CAPEX HV line €/km 100 000 100 000 100 000 100 000
Equipment CAPEX transformer € 30 000 30 000 30 000 30 000
Fixed OPEX power grid connection %CAPEX/year 0,0 0,0 0,0 0,0
Electrolyzis 10 bar
Lifetime electrolyzer years 25 25 25 25
Electrolyzer capacity in - 1MW MWe 1 1 1 1
Electrolyzer capacity in - 10MW MWe 10 10 10 10
Electrolyzer efficiency kWhHHV-H2/kWhe 66% 66% 66% 71%
Electrolyzer capacity out - 1MW MWHHV-H2 0,66 0,66 0,66 0,71
Electrolyzer capacity out - 10MW MWHHV-H2 6,60 6,60 6,60 7,10
Specific equipment CAPEX electrolyzer - 1MW €/MWe in 1 500 000 1 500 000 1 500 000 1 000 000
Specific equipment CAPEX electrolyzer - 10MW €/MWe in 1 000 000 1 000 000 1 000 000 800 000
Fixed O&M electrolyzer - 1MW % CAPEX/year 5% 5% 5% 5%
Fixed O&M electrolyzer - 10MW % CAPEX/year 2% 2% 2% 2%
Preliminary Analysis Case Studies
€/MWhLHV-BioMethane
€/MWhLHV-BioMethane
kg/MWh

RE-P2G – Renewable power-to-gas for the non-individual road transport sector, 2016
68
Item Unit Long Range Short RangeMarket
uptake
Large scale
deployment
Methanation
Lifetime methanation reactor years 25 25 25 25
Methanation capacity out - 10MW MWHHV-SNG 5,24 5,24 5,24 5,64
Methanation efficiency MWhHHV-SNG out/MWhHHV-H2 in 79,4% 79,4% 79,4% 79,4%
Factory gate specific cost methanation reactor - 10MW €/MWHHV-SNG out 1 500 000 1 500 000 1 500 000 700 000
Additional costs methanation reactor % cost methanation reactor 50% 50% 50% 50%
Fixed O&M methanation - 10MW % cost methanation reactor/year 7,5% 7,5% 7,5% 7,5%
Methanation H2 consumption Nm3H2/Nm3SNG 4,0 4,0 4,0 4,0
Methanation CO2 consumption Nm3CO2/NmSNG 1,0 1,0 1,0 1,0
Compression SNG
Lifetime compressor SNG years 15 15 15 15
Compressor SNG capacity out - 10MW MWHHV-SNG 5,24 5,24 5,24 5,64
Factory gate total cost compressor SNG - 10MW € 630 957 630 957 630 957 567 862
Additional costs compressor SNG % cost compressor 15% 15% 15% 15%
Fixed O&M compressor SNG 10-60bar % CAPEX/year 6% 6% 6% 6%
Power consumption compressor SNG 10-60bar MWhe/MWhHHV-SNG 0,02 0,02 0,02 0,02
Pipeline SNG
Lifetime pipeline years 35 35 35 35
Pipeline capacity out - 1MW MWHHV-H2 0,66 0,66 0,66 0,71
Pipeline capacity out - 10MW MWHHV-H2 5,24 5,24 5,24 5,64
Pipeline length km 1 1 1 1
Fixed equipment CAPEX pipeline @60 bar € 200 000 200 000 200 000 200 000
Variable equipment CAPEX pipeline @60 bar €/km 300 000 300 000 300 000 300 000
Fixed O&M pipeline % CAPEX/year 2% 2% 2% 2%
Injection station SNG
Lifetime injection station SNG years 15 15 15 15
Injection station SNG capacity out MWHHV-SNG 5,239 5,239 5,239 5,635
Total equipment CAPEX transport injection station SNG € 900 000 900 000 900 000 720 000
Fixed O&M injection station SNG %CAPEX/year 8,0% 8,0% 8,0% 8,0%
Refueling station
Lifetime refueling station years 30 30 30 30H2 refueling station @ 350 bar capacity out - 1MW MWHHV-H2 0,660 0,660 0,660 0,165H2 refueling station @ 700 bar capacity out - 1MW MWHHV-H2 0,660 0,660 0,660 0,165
SNG refueling station @ 200 bar capacity out - 10MW MWHHV-SNG 5,24 5,24 5,24 1,31
Specific equipment CAPEX H2 refueling station @ 350 bar €/MWHHV-H2 out 4 090 909 4 090 909 4 090 909 2 454 545
Specific equipment CAPEX H2 refueling station @ 700 bar €/MWHHV-H2 out 4 545 455 4 545 455 4 545 455 2 727 273
Specific equipment CAPEX SNG refueling station @ 200 bar €/MWHHV-SNG out 47 722 47 722 47 722 47 722
Fixed O&M H2 refueling station @ 350 bar - 1MW %CAPEX/year 7,5% 7,5% 7,5% 7,5%
Fixed O&M H2 refueling station @ 700 bar - 1MW %CAPEX/year 7,5% 7,5% 7,5% 7,5%
Fixed O&M SNG refueling station @ 200 bar - 10MW %CAPEX/year 7,5% 7,5% 7,5% 7,5%
Power consumption H2 refueling station @ 350 bar MWhe/MWhHHV-H2 out 0,09 0,09 0,09 0,09
Power consumption H2 refueling station @ 700 bar MWhe/MWhHHV-H2 out 0,18 0,18 0,18 0,18
Power consumption SNG refueling station @ 200 bar MWhe/MWhHHV-SNG 0,012 0,012 0,012 0,012
Grid
Grid capacity out - 10MW MWHHV-SNG 5,24 5,24 5,24 5,64
Grid transmission fee €/MWhHHV-SNG 7,5 7,5 7,5 7,5
Lifetime grid years 1 1 1 1
Preliminary Analysis Case Studies
Installation costs compressor SNG
(incl. on site compression)
Nm3CO2/Nm3SNG
BoP methanation reactor

RE-P2G – Renewable power-to-gas for the non-individual road transport sector, 2016
69
Item Unit Long Range Short RangeMarket
uptake
Large scale
deployment
Vehicles
Lifetime vehicle years 10,00 10,00 10,00 10,00
Fuel consumption H2 CD MWhHHV-H2/(100km*vehicle) 0,20 0,20
Fuel consumption H2RE LDV MWhHHV-H2/(100km*vehicle) 0,04 0,04 0,04 0,04
Fuel consumption H2 Bus MWhHHV-H2/(100km*vehicle) 0,32 0,32 0,32 0,32
Fuel consumption SNG Bus MWhHHV-SNG/(100km*vehicle) 0,84 0,84 0,84 0,84
Fuel consumption SNG CD MWhHHV-SNG/(100km*vehicle) 0,54 0,54
Fuel consumption SNG LDV MWhHHV-SNG/(100km*vehicle) 0,10 0,10 0,10 0,10
Fuel consumption BE LDV MWhe/100km 0,02 0,02 0,02
Fuel consumption BE Bus MWhe/100km 0,13 0,13 0,13
Fuel consumption BE CD MWhe/100km 0,09 0,09
Fuel consumption Diesel LDV l/100km 4,70 4,70 4,70 4,70
Fuel consumption diesel bus l/100km 38,70 38,70 38,70 38,70
Fuel consumption diesel CD l/100km 25,00 25,00
Fuel consumption FH2 LDV MWhHHV-H2/(100km*vehicle) 0,04 0,04 0,04 0,04
Travelled distance Bus 100km/year 781,40 390,70 781,40 781,40
Travelled distance CD 100km/year 319,26 159,63
Travelled distance LDV 100km/year 625,71 125,14 625,71 625,71
Range extender use on LDV 100 km/day 1,00 0,20 1,00 1,00
Battery use on LDV 100 km/day 1,00 0,20 1,00 1,00
Days of operation of LDV days/years 313 313 313 313
Total fleet H2 Bus vehicle 23 46 23 6
Total fleet SNG Bus vehicle 69 138 69 17
Total fleet H2 CD vehicle 87 175
Total fleet SNG CD vehicle 261 521
Total fleet H2RE LDV vehicle 460 2 302 460 115
Total fleet SNG LDV vehicle 687 3 436 687 172
Total fleet FH2 LDV vehicle 230 1 151 230 58
Vehicle list price H2 Bus € 850 000,00 850 000,00 850 000,00 288 655,04
Vehicle list price SNG Bus € 250 000,00 250 000,00 250 000,00 200 000,00
Vehicle list price diesel bus € 200 000,00 200 000,00 200 000,00 200 000,00
Vehicle list price BE Bus € 795 046,71 795 046,71 795 046,71
Vehicle list price H2 CD € 280 918,45 280 918,45
Vehicle list price SNG CD € 82 623,07 82 623,07
Vehicle list price diesel CD € 55 000,00 55 000,00
Vehicle list price BE CD € 262 756,81 262 756,81
Vehicle list price H2RE LDV € 48 500,00 48 500,00 48 500,00 14 250,99
Vehicle list price SNG LDV € 17 275,73 17 275,73 17 275,73 11 500,00
Vehicle list price diesel LDV € 11 500,00 11 500,00 11 500,00 11 500,00
Vehicle list price BE LDV € 21 500,00 21 500,00 21 500,00
Vehicle list price FH2 LDV € 48 500,00 48 500,00 48 500,00 14 250,99
Maintenance H2 Bus €/100km 8,74 8,74 8,74 8,74
Maintenance SNG Bus €/100km 9,83 9,83 9,83 9,83
Maintenance BE Bus €/100km 8,74 8,74 8,74
Maintenance diesel Bus €/100km 9,83 9,83 9,83 9,83
Maintenance H2 CD €/100km 4,96 5,92
Maintenance SNG CD €/100km 6,67 6,67
Maintenance BE CD €/100km 4,96 5,92
Maintenance diesel CD €/100km 6,67 6,67
Maintenance H2RE LDV €/100km 1,18 3,10 1,18 1,18
Maintenance FH2 LDV €/100km 1,18 3,10 1,18 1,18
Maintenance SNG LDV €/100km 3,50 3,50 3,50 3,50
Maintenance Diesel LDV €/100km 2,80 2,80 2,80 2,80
Maintenance BE LDV €/100km 0,70 0,70 0,70
Battery rental BE LDV €/year 840,00 840,00 840,00 840,00
Insurance H2 Bus €/year 2 940,00 2 940,00 2 940,00 2 940,00
Insurance SNG Bus €/year 4 200,00 4 200,00 4 200,00 4 200,00
Insurance Diesel Bus €/year 4 200,00 4 200,00 4 200,00 4 200,00
Insurance BE Bus €/year 2 940,00 2 940,00 2 940,00
Insurance H2 CD €/year 2 205,00 2 205,00
Insurance SNG CD €/year 3 150,00 3 150,00
Insurance Diesel CD €/year 3 150,00 3 150,00
Insurance BE CD €/year 2 205,00 2 205,00
Insurance H2RE LDV €/year 1 470,00 1 470,00 1 470,00 1 470,00
Insurance FH2 LDV €/year 1 470,00 1 470,00 1 470,00 1 470,00
Insurance SNG LDV €/year 2 100,00 2 100,00 2 100,00 2 100,00
Insurance Diesel LDV €/year 2 100,00 2 100,00 2 100,00 2 100,00
Insurance BE LDV €/year 1 470,00 1 470,00 1 470,00
Preliminary Analysis Case Studies

RE-P2G – Renewable power-to-gas for the non-individual road transport sector, 2016
70
7 . 2 . I N P U T D ATA A N D C O S T C O M PA R I S O N B E T W E E N R A N G E E X T E N D E D A N D F U L L H 2 L D V S
Assumptions on hydrogen LDVs are based on the Kangoo vehicle (LDV manufactured by Renault and
currently available in diesel and battery version). Costs for the range extended are based on information
shared by SymbioFCell, a company supplying range extended Kangoo [6].
Range extended LDV
A range extended LDV costs the price of a battery electric LDV plus a range extender kit. With current
costs for a Kangoo:
LDV BEV: €21,500 inc. €10,000 subsidy, resulting in €31,500 without subsidy
Range extender kit: €17,000
TOTAL range extended LDV =€48,500
On top of that, owners of battery electric Kangoo have to rent their battery. So we added the cost of the
rental of the battery: €840 per year.
Full H2 LDV
This type of vehicle does not exist yet. We took the optimistic assumption that the cost was the same as
the range extended version (€48,500) knowing that the cost of Toyota Mirai, a smaller vehicle, is
currently €66,000.
Insurance and Maintenance
We took the same assumptions for Insurance and Maintenance of full H2 and RE-H2. Based on these
assumptions, the vehicle component of the TCO is €80k for the RE-H2 vehicle and €74k for the full H2
vehicle in 2015.
Learning curve assumptions
We take the same learning curve assumptions for full H2 and RE-H2 vehicles. This assumption is
optimistic for range extended vehicles since the battery component of the vehicle will likely not
decrease as fast as the fuel-cell component.
Based on these assumptions, the vehicle component of the TCO is €39k for the RE-H2 vehicle and €33k
for the full H2 vehicle in 2030. The TCO is €69k for RE-H2 vehicle and €89k for full H2 vehicle.
If we had only applied the learning curve to the range extender kit for the RE-Kangoo, the vehicle
component of the TCO would be €68k in 2030 and the TCO of the RE vehicle would be €98k. But this
would not take into account the future improvements of battery technologies as well as the learning
curve on assembly and integration of range extenders in BEVs.

RE-P2G – Renewable power-to-gas for the non-individual road transport sector, 2016
71
Non vehicle costs
As shown in Table 5, apart from vehicle costs, range extended LDVs benefit from significant cost
advantages compared to full H2 LDVs:
Costs of power grid connection, electrolysis and refuelling station for RE-H2 are half that of full H2.
Each vehicle uses half hydrogen / half electricity, so the same production and distribution
infrastructure of H2 can be used for twice as many vehicles compared to full H2
Cost of electricity is significantly reduced: the electricity needed to produce H2 for RE-H2 vehicles is
half as much as for full H2 vehicles. On top of that, RE-H2 vehicles also use electricity directly, which
is why the power component of the TCO for RE-H2 is not half that of full H2.
2015 2030
RE-H2 Full H2 RE-H2 Full H2
Power €23,601 €37,135 €11,214 €17,394
Power grid
connection
€486 €973 €1,944 €3,887
Electrolysis €4,356 €8,711 €11,607 €23,214
Refuelling station €8,935 €19,855 €5,361 €11,913
Vehicle €80,289 €74,201 €39,190 €33,102
Total €117,666 €140,875 €69,315 €89,510
Table 5: TCO breakdown of range extended and full H2 LDVs

RE-P2G – Renewable power-to-gas for the non-individual road transport sector, 2016
72
7 . 3 . S E N S I T I V I T Y A N A LY S I S O N 2 0 1 5 A N D 2 0 3 0 L D V T C O S F O R H Y D R O G E N A N D S N G V E H I C L E S
A sensitivity analysis was performed to evaluate the robustness of conclusions, both for the 2015 (Figure
35) and 2030 scenario (Figure 36), when varying the most sensitive factors explaining the TCO difference
between H2 and SNG LDVs: methanation specific CAPEX and engine energy consumption. The tables
provide the TCOs for combinations of these hypotheses, all other hypotheses being unchanged.
Figure 35 shows that obtaining a SNG LDV TCO equal or lower than H2 LDV TCO with 2015 data would
require the engine efficiency of SNG vehicles to be equivalent to that of diesel engines, while SNG
engines currently consume about 1.8 times more thermal energy than diesel engines, and about 2.5
more than H2.Moreover, the sole reduction of methanation CAPEX by a factor 7.5 compared to the base
case is not sufficient to obtain TCOs equivalent to the H2 case. When looking at H2 TCO sensitivity to
refuelling stations and H2 vehicle costs, doubling one of these factors (for instance to take into account
storage costs in refuelling station) is also not enough to reach the SNG TCO of the base case.
Figure 35: Sensitivity analysis of SNG and H2 LDVs in 2015
Figure 36: Sensitivity analysis of SNG and H2 LDVs in 2030
Base case
Engine efficiency
(MWhHHV/100km)0,10 0,04
Specific CAPEX Methanation
(€/MWHHV-SNG)
1 500 000 200 k€
1 000 000 191 k€
500 000 182 k€
200 000 177 k€
H2 TCO Sensitivity H2 vehicle cost x 1 H2 vehicle cost x 2
H2 Refuelling station x 1 133 k€ 192 k€ SNG
H2 Refuelling station x 2 153 k€ 212 k€ 107 k€
H2
126 k€
H2
2015 LDV TCORetail price of electricity = 80€/MWh
Load factor = 8600 h/year
Methanation @ €200k + Efficiency @ 0,06 Electricity @ €60
Middle caseBest case
(diesel engine equivalent)
133 k€
0,08
166 k€
159 k€
152 k€
148 k€
0,06
132 k€
127 k€
122 k€
119 k€
SNG
Base case
Engine efficiency
(MWhHHV/100km)0,10 0,04
Specific CAPEX Methanation
(€/MWHHV-SNG)
700 000 169 k€
200 000 143 k€
100 000 138 k€
H2 TCO Sensitivity H2 vehicle cost x 1 H2 vehicle cost x 2 Methanation @ €100k + Efficiency @ 0,06 Load factor @ 8600h
H2 Refuelling station x 1 74 k€ 91 k€ SNG
H2 Refuelling station x 2 85 k€ 103 k€ 77 k€
H2
62 k€
0,06
140 k€ 112 k€
74 k€120 k€ 98 k€
116 k€ 95 k€
0,08
Load factor = 3000 h/year SNG
H2Middle case
Best case
(diesel engine equivalent)
Retail price of electricity = 40€/MWh 2030 LDV TCO
Engine consumption
Engine consumption

RE-P2G – Renewable power-to-gas for the non-individual road transport sector, 2016
73
7 . 4 . D E TA I L E D D E S C R I P T I O N O F T H E S U P P O R T I N G P O L I C Y M E A S U R E S
7.4.1. Regulation
Regulations on distribution infrastructure
Value chain segment:
Distribution
infrastructure
Level of implementation:
Regional & National
Cost type:
Administrative costs
Market launch phase:
Permanent frame
Brief description:
Regulation of the number of refuelling stations implemented by the target year. A sound network of
refuelling stations stimulates the attractiveness of vehicles powered by fuels which requires a new
infrastructure such as gaseous fuels and electricity.
Relevance to support the market uptake of power-to-gas in the non-individual transport sector:
The regulation of the framework conditions for refuelling stations deployment (number, location) can
be designed with a mandatory target for gaseous refuelling stations. A sound filling infrastructure is
the basis to raise the confidence on gas powered vehicles as well as to convince consumers to invest
in gas powered vehicles.
Implementation of the measure:
To stimulate a state or national wide deployment of alternative refuelling stations, regulation should
be implemented at state or national level. In the European Union, such a regulation is generally
initiated at EU level with a directive setting minimum number of alternative refuelling stations to be
installed.
Cost of the measure:
As a regulation, the measure does not induce direct costs for public authorities but may require
complementary financial instrument to reach its final objective. In the case of obligations,
implementation costs are paid by private actors whereas in the case of public financial support
(subsidies, PPPs), part of the cost is covered with public funds.
Impact on power-to-gas for the non-individual transport sector:
Regulation of refuelling infrastructure sets a regulatory frame and targets to provide the different
actors of the value chain with sufficient visibility and confidence to engage in the sector. It is thus a
necessary measure even though it also requires complementary measures to support financially the
additional costs during the market launching phase.
Examples of current or forecasted application of the measure:
The EU Directive 2014/94/EU requires member states to set target on the deployment of alternative
fuels infrastructure between 2020 and 2030 and to implement sufficient means to reach this target.
Alternative fuels included in the directive are electricity, hydrogen, biofuels, synthetic fuels natural gas
and biomethane in the gaseous or liquid form and Liquefied Petroleum Gas (LPG).

RE-P2G – Renewable power-to-gas for the non-individual road transport sector, 2016
74
Renewable electricity and e-fuels certification schemes
Value chain segment:
Energy carrier &
distribution infrastructure
Level of implementation:
Regional & National
Cost type:
Administrative
costs
Market launch phase:
Permanent frame
Brief description:
Renewable certificates for electricity enable electricity consumers to guarantee the renewable origin
of the electricity purchased. In the perspective of fuel production from electricity, similar certification
scheme can be used in order to guarantee the renewability of fuels, when produced from renewable
electricity.
Relevance to support the market uptake of power-to-gas in the non-individual transport sector:
The design and implementation of certification schemes to differentiate renewable and non
renewable e-fuels is a key tool for the development of a renewable power-to-gas market in the
transport sector. Such a scheme will enable policy makers to monitor the renewability of e-fuels and
to determine financial support of the various actors of the value chain (e-fuels producers, distributors
and consumers).
Implementation of the measure:
The certification of renewable electricity and e-fuel must be implemented at national level through a
dedicated scheme to be applied to all the value chain (i.e. from electricity producers to e-fuel
consumers). A dedicated public agency could be responsible for the design, implementation and
monitoring of the schemes.
Cost of the measure:
A recurrent budget should be allocated to the public agency in charge of the operation of the
certification schemes.
Impact on power-to-gas for the non-individual transport sector:
The implementation of certification schemes for renewable electricity and e-fuels is mandatory to
monitor the share of renewable energy in e-fuels consumed and to determine financial support to the
different actors of the value chain.
Examples of current or forecasted application of the measure:
Renewable electricity certificates are currently implemented in most of countries producing
renewable energy. However, such a scheme has not been established yet for fuels production from
electricity.

RE-P2G – Renewable power-to-gas for the non-individual road transport sector, 2016
75
ZEV mandates for public fleet/public transport
Value chain segment:
Vehicle
Level of implementation:
Regional, National or Local
Cost type:
Administrative costs
Market launch phase:
Early adoption
Brief description:
This instrument sets a mandatory target market volume of zero emission vehicles (ZEV)for public
fleets.
Relevance to support the market uptake of power-to-gas in the non-individual transport sector:
A mandatory target guarantees the achievement of a defined market volume. This encourages car
manufacturers to develop and manufacture ZEV as well as operators of refuelling station to invest into
the required infrastructure due to a predictable fuel demand.
Even though this instrument is not aimed at promoting a specific technology within ZEVs, it could be
used to incentivise the power-to-gas market directly by setting specific targets for hydrogen and/or
SNG vehicles.
Implementation of the measure:
Mandates can be set at local, state, national or regional (i.e. EU) level. They are achieved by the target
public fleet operators.
Cost of the measure:
Setting ZEV mandates does not directly induce costs but the achievement of the mandate by public
fleet operators necessarily increases public expenses if the new technology used (e.g. fuel cell
vehicles) is more expensive than the benchmark (e.g. diesel vehicles).
Impact on power-to-gas for the non-individual transport sector:
If properly designed (i.e. targeting the relevant types of vehicle and uses), ZEV mandates can drive the
deployment of the first fleets of power-to-gas and thus foster market launching. For instance, ZEV
mandates on long range captive fleets and long range buses will necessarily support the development
whereas ZEV mandate for city fleets will foster the development of BEVs.
Examples of current or forecasted application of the measure:
California aims to achieve 1.5 million ZEV by 2020 according to their ZEV action plan. In October 2014
Italy has announced a target for advanced biofuels of 0.6% blending by 2018 and 1% by 2022.
Denmark has announced plans for a 0.9% blending by 2020 [36].

RE-P2G – Renewable power-to-gas for the non-individual road transport sector, 2016
76
7.4.2. Financial support
Subsidies for capital cost of power-to-gas plants
Value chain segment
Energy carrier
Level of implementation:
National
Cost type:
Direct public
expenses
Market launch phase:
Early adoption
Brief description:
Subsidies for the investment in power-to-gas production plants are granted to the project developer.
This reduces the installation costs and consequently the total production cost of fuel.
Relevance to support the market uptake of power-to-gas in the non-individual transport sector:
Subsidies for the implementation of power-to-gas plants address the issue of high capital
expenditures of emerging technologies during their market launch. Reducing the investment costs in
this period with subsidies increases the attractiveness of the technology for project developers. As a
result of the first units installed thanks to this financial support, the specific capital costs of power-to-
gas plants will decrease.
Implementation of the measure:
Subsidies on the capital cost of power-to-gas production plants can be implemented through call for
projects at state or national level or regional level (e.g. UE level). Public Private Partnerships (PPP) can
also be established in order to reduce the capital cost carried by private entities. Both options require
public authorities to be involved in projects and are thus more complicated to implement than the
implementation of a legal frame such as for tax exemption.
Cost of the measure:
The cost of subsidising investments for power-to-gas plants can be reasonable if the scheme is limited
to the first units installed in order to launch the market.
Impact on power-to-gas for the non-individual transport sector:
Subsidising the first units of power-to-gas plants can enable the technology to build on first
references. Thanks to the feedback and standardisation derived from experience of the first units
installed, the cost of projects will be reduced and confidence of investors and operators in the
technology will be improved.
Examples of current or forecasted application of the measure:
Market launching of current mature renewable energy technologies has been kicked-off with
subsidies on the first units installed (e.g. wind, solar, biogas...).

RE-P2G – Renewable power-to-gas for the non-individual road transport sector, 2016
77
Vehicle registration tax (VRT) and value added tax (VAT) incentives
Value chain segment
Vehicle
Level of implementation:
National
Cost type:
Revenue loss
Market launch phase:
Market uptake
Brief description:
Exemption of taxes (either registration tax, VAT or both) for customers investing in renewable gas
power train vehicles in order to improve their competitiveness compared to fossil-fuelled vehicles.
Relevance to support the market uptake of power-to-gas in the non-individual transport sector:
Tax exemptions for the purchase of renewable gas power train vehicles would reduce their final
purchase price for the consumer and thus increase their attractiveness. The measure should apply to
all renewable power-train vehicles (inc. battery electric vehicles) and not to power-to-gas vehicles
only. It will thus not provide a particular advantage for power-to-gas vehicles in comparison to BEVs.
Implementation of the measure:
Incentives on the vehicle registration tax (VRT) and Value Added Tax (VAT) can be implemented at
state or national level with relatively simple legal procedures (e.g. decree).
Cost of the measure:
The cost of vehicle registration taxes (VRT) and VAT is inherently correlated with the number of
vehicle sold. It will thus necessarily increase quickly with market take-off. As long as the number of
vehicles supported with such tax exemptions remains reduced, these revenue losses can be balanced
with an increase in similar taxes applied to mass market vehicles such as registration tax on fossil
fuelled vehicles for instance.
Impact on power-to-gas for the non-individual transport sector:
Artificial reduction of the final purchase cost of hydrogen vehicles during the first years of market
launching is mandatory to enable the cost of vehicle to decrease thanks to learning effect. Depending
on the national or state tax system, cumulated VRT and VAT can represent more than 30% of the
purchasing cost for mass market vehicles. Exempting hydrogen vehicles from these taxes would thus
contribute to the reduction of their final price. However this would unlikely be sufficient to balance
the difference with fossil fuelled vehicles at market launching step when the cost of hydrogen vehicles
is still far exceeding that of conventional vehicles.
VRT and VAT exemption for CNG vehicles would necessarily improve their competitiveness for SNG
use. However this measure is not deemed the most impactful for the SNG path whose lack in
competitiveness mostly lies in the fuel production process.
Examples of current or forecasted application of the measure:
The Norwegian government provides incentives on VRT and VAT for BEVs. In 2014, they accounted for
12.7% of total vehicle sales [37]

RE-P2G – Renewable power-to-gas for the non-individual road transport sector, 2016
78
7.4.3. Technology development and acceptance
Pilot and demonstration projects
Value chain segment
All
Level of implementation:
Regional, National or Local
Cost type:
Direct public
expenses
Market launch phase:
Technology
demonstration
Brief description:
Pilot and demonstration projects test and demonstrate the operation of innovative technologies in
real conditions. Pilot and demonstration projects are usually co-funded by technology developers or
operators and public authorities.
Relevance to support the market uptake of power-to-gas in the non-individual transport sector:
Some power-to-gas technologies such as the methanation process or fuel cell buses or trucks still
require research and development and final validation with pilot and demonstration project.
Moreover, social acceptance and investors’ confidence for such a new and disseminated technology is
improved with success stories based on demonstration projects.
Implementation of the measure:
Pilot and demonstration projects can be supported at local, national and regional (i.e. EU) level. They
require dedicated resources in order to select, monitor and evaluate the projects and to capitalise and
share their outcomes.
Cost of the measure:
Funding for pilot projects is usually provided by public institutions. Nevertheless costs can be reduced
for the operation of pilot and demonstration projects by involving industrial partners into the project
and sharing funding of research and development.
Impact on power-to-gas for the non-individual transport sector:
Pilot and demonstration projects are still necessary for market segments which call for technologies
still at development stage such as hydrogen heavy vehicles (buses and trucks). If hydrogen mobility is
to be developed on these segments, then the funding of pilot and demonstration projects will
represent the first step of public support for market uptake.
Examples of current or forecasted application of the measure:
Large scale pilot and demonstration projects are a required step to launch any innovative technology
on a given market. Initiatives are currently implemented in this objective on hydrogen mobility and in
various countries (see section 1.3.2).

RE-P2G – Renewable power-to-gas for the non-individual road transport sector, 2016
79
7 . 5 . S H O R T D E S C R I P T I O N O F U N S E L E C T E D P O L I C Y M E A S U R E S
7.5.1. Regulation
Environmental zoning (urban access restrictions)
Type of policy measure:
Regulation
Value chain segment addressed:
Vehicle
Selection:
No
Brief description:
In urban areas, the access of polluting vehicles is restricted or charged in certain environmental zones
also called low emission zones or zero emission zones. A specific level of emission is set in order to
define categories of vehicles allowed in the environmental zone.
Relevance to support the market uptake of power-to-gas in the non-individual transport sector:
Zero emission zones can improve the attractiveness of FCEV and BEV (zero emission zones) in cities.
Low emission zones apply to all renewable fuels as well as hybrid vehicles. Whatever the level of
restriction, the measure will favour BEV which is the hardest competitor to any renewable mobility
option in urban context (i.e. short distances travelled per day). It is thus not seen as a relevant
measure to promote power-to-gas options in particular.
Parking policies
Type of policy measure:
Regulation
Value chain segment addressed:
Vehicle
Selection:
No
Brief description:
Parking policies aims at incentivising the use of alternative vehicles thanks to special park sites and/or
discount or full exemption of parking fees.
Relevance to support the market uptake of power-to-gas in the non-individual transport sector:
This measure is mostly effective in urban areas where BEV outcompete other alternative mobility
options and power-to-gas options in particular. Moreover, parking fee exemption or discount is
deemed to have a limited financial impact on the total cost of ownership of a vehicle.

RE-P2G – Renewable power-to-gas for the non-individual road transport sector, 2016
80
High occupancy vehicle (HOV) lanes incentives for ZEV
Type of policy measure:
Regulation
Value chain segment addressed:
Vehicle
Selection:
No
Brief description:
High Occupancy Vehicle (HOV) Lanes were created in the U.S. in the 1970s to encourage people to
carpool. Depending on the freeway, some carpool lanes require two or three people to a car. HOV
lanes opened for zero emission vehicles (ZEV) would incentivise their use, especially in large urban
areas with traffic congestion at peak hours.
Relevance to support the market uptake of power-to-gas in the non-individual transport sector:
HOV lanes incentives for ZEV are mostly relevant to improve the attractiveness of alternative vehicles
for individual uses but not for non-individual uses. Moreover, this instrument supports ZEV in general
and do not promote power-to-gas vehicles in particular.
7.5.2. Financial support
Company car taxation incentives
Type of policy measure:
Financial support
Value chain segment addressed:
Vehicle
Selection:
No
Brief description:
In some countries, the benefit to the employee of the use of a company car is taxable, based on a
percentage of the vehicle list price. Company cars driven with SNG or hydrogen are incentivized by
exemptions of the tax or reductions in the tax rate.
Relevance to support the market uptake of power-to-gas in the non-individual transport sector:
Incentives in company car taxation appear as a relevant mechanism to support the development of a
mass market of alternative power train vehicles for individuals. However it is not relevant to develop
power-to-gas in the non-individual transport sector in which vehicles differ from that of individuals.

RE-P2G – Renewable power-to-gas for the non-individual road transport sector, 2016
81
Road pricing and tolls incentives
Type of policy measure:
Financial support
Value chain segment addressed:
Vehicle
Selection:
No
Brief description:
Owners of SNG or hydrogen vehicles are exempted from road pricing and tolls, with a possible
emphasis in urban environments, in order to improve their attractiveness compared to fossil fuelled
vehicles.
Relevance to support the market uptake of power-to-gas in the non-individual transport sector:
Incentives on road pricing and tolls apply to renewable fuels in general and are thus not expected to
play in favour of power-to-gas in particular compared to battery electric vehicles or biomethane for
instance.
7.5.3. Technology development and acceptance
Information provision
Type of policy measure:
Technology development &
acceptance
Value chain segment addressed:
All
Selection:
No
Brief description:
Communication campaigns can be used at market launch of a new technology in order to inform
users on the given technology and the supporting schemes available (vehicle performance, cost
incentives, environmental impacts...).
Relevance to support the market uptake of power-to-gas in the non-individual transport sector:
Information provision on power-to-gas technologies for the mobility sector is mandatory to launch
the market but is not seen as a priority compared to other policy measures required.

This page is left intentionally blank.

M E M B E R CO U N T R IES O F T HE IEA R E T D T EC H NO LO GY CO L L A B O R AT I O N PRO G R A M M E

The International Energy Agency’s Renewable Energy Technology Deployment Technology
Collaboration Programme (IEA RETD TCP) provides a platform for enhancing international cooperation
on policies, measures and market instruments to accelerate the global deployment of renewable energy
technologies.
IEA RETD TCP aims to empower policy makers and energy market actors to make informed decisions by:
(1) providing innovative policy options; (2) disseminating best practices related to policy measures and
market instruments to increase deployment of renewable energy, and (3) increasing awareness of the
short-, medium- and long-term impacts of renewable energy action and inaction.
Current member countries of the IEA RETD Technology Collaboration Programme (TCP) are Canada,
Denmark, France, Germany, Ireland, Japan, Norway, and United Kingdom.
More information on the IEA RETD TCP can be found at
www.iea-retd.org