Nomura Holdings, Inc. Investor Day Presentation, Kentaro ...
20
Connecting Markets East & West © Nomura May 12, 2021 Investor Day Kentaro Okuda Group CEO Nomura Holdings, Inc.
Transcript of Nomura Holdings, Inc. Investor Day Presentation, Kentaro ...

Connecting Markets East & West
© NomuraMay 12, 2021
Investor Day
Kentaro Okuda
Group CEO
Nomura Holdings, Inc.

Enhancing risk management and business approach
following incident in US
Exited over 99% of positions (progressed from over 97% as of April 23 and now nearly fully exited)
Implementing following initiatives and strengthening organization to support international strategy
1
Phase 1
Initial responses
Phase 2
Review prime brokerage risk
management framework
Review of transactions with existing prime brokerage clients (review of large clients completed)
Reviewed concentrated positions in non risk origination businesses (completed)
Phase 3
Comprehensive review of
Wholesale risk
management framework
Phase 4
Enhance global risk
governance
Comprehensive review of risk management framework (internal review complete, upcoming external review)
Enhance Risk Management org.
Strengthen functions of committees− Expand scope of portfolio testing
beyond financing to other Wholesale businesses
Promote understanding or subjective risk management among front office teams
Prime brokerage is an important client service that supports our
overall Equities business including execution, block trades,
derivatives and ECM
Continue to offer prime brokerage services to support other
businesses while enhancing risk management
Enhance monitoring of concentrated positions
Revise margin rate table Enhance management of margin
rates for individual transactions (approvals, etc.)
Strengthening
leadership
Detail of actions (all completed or in progress)
Future prime brokerage business
Taking swift action
Fact-finding
investigation
Related departments conducted wide-ranging investigation of facts; Already implemented a number of preventative measures
Audit Committee hired external law firm to conduct comprehensive, impartial review and a number of remedial measures have already been put in place
We conducted a full review of existing prime brokerage transactions and reviewed positions in other financing-related businesses, confirming no other similar transactions
Review of risk management framework centered on Prime Brokerage business
Looking ahead
Robust financial position for provision of high-
quality services (Mar 2021)
Common Equity Tier 1 ratio of 15.7%
(minimum regulatory requirement is 7.51%)
Liquidity portfolio of Y5.7trn (13% of total assets)
Management
strategy
Continue with management strategy, in particular Wholesale strategy to build out businesses leveraging our global franchise, while enhancing risk management
Further enhance our governance structure in line with global business strategy (increase the number of non-Japanese outside directors)
Check and
strengthen
risk
management
framework
Conduct comprehensive review by third-party experts on risk management framework for Wholesale and Risk management
Strengthen global risk controls (enhance Risk Management organization, deepen and expand scope of Wholesale risk monitoring conducted by committee comprising CRO/CFO/Head of Wholesale)
Leadership
Appoint new CEO at US subsidiary who has extensive
experience in financial services in the US
Enhance front office and risk management teams
Responses
completed/
being
implemented
Responses
moving
forward
Strengthened US executive structure

Leverage our strengths in the public markets to enhance our presence in private markets
Expanding our scope of business from public to private
(1/2)
2
Announced management vision of “Achieving sustainable growth by helping resolve social issues” towards FY2024/25
To achieve this, we are taking strategic steps to expand our scope of business from public to private
Listed products
and public
offerings
Mainly individuals,
institutional investors,
listed companies
Clients
Pro
du
cts
and
se
rvic
es
Mainly face-to-face
high touch services
Current
business
(centered on
public markets)
Alternatives
• Private equity
• Private debt
• Project assets
(infrastructure)
Private placements
Non-financial services
Digital bonds, security
token offerings
1
New investor base
New needs of existing clients
Startups (unlisted companies)
Digital
Bespoke
3
2
Provide customized services
and solutions privately to each
client

3
Continue to strengthen existing businesses with competitive advantage
Actively allocate resources to new businesses including private with a view to the future
Expanding our scope of business from public to private
(2/2)
Retail WS IM New areas not under any specific divisionPrivate
New compared to existing business
Advisory
Domestic wealth management
HNWIs and Corporates/owners
OTC Derivatives
Mass affluent
Credit
Equities
Rates
CIO services
Nomura Greentech
International
wealth management
Nomura Navigation Boostry
Private equity/debt
Infrastructure and
power finance
Alliance with
Wolfe Research
Sustainable finance
Search funds
Remote financial
consulting services
Nomura SPARX
Level fee
Security token
offering
KomainuLINE Securities
China business
Financial intermediaries
(Alliance with
regional banks)
Financial intermediaries
(Platform)
Areas to enter/enhance
for future
Areas of
competitive strength
Nomura Agri
Planning & Advisory
Private placement Alliance with Jarden
Contact center
Corporate transformation
ESG investment
Wealth Square
Aircraft lease
Structured Finance
FX/Emerging
ECM/DCM
ETF
Public investment
trust
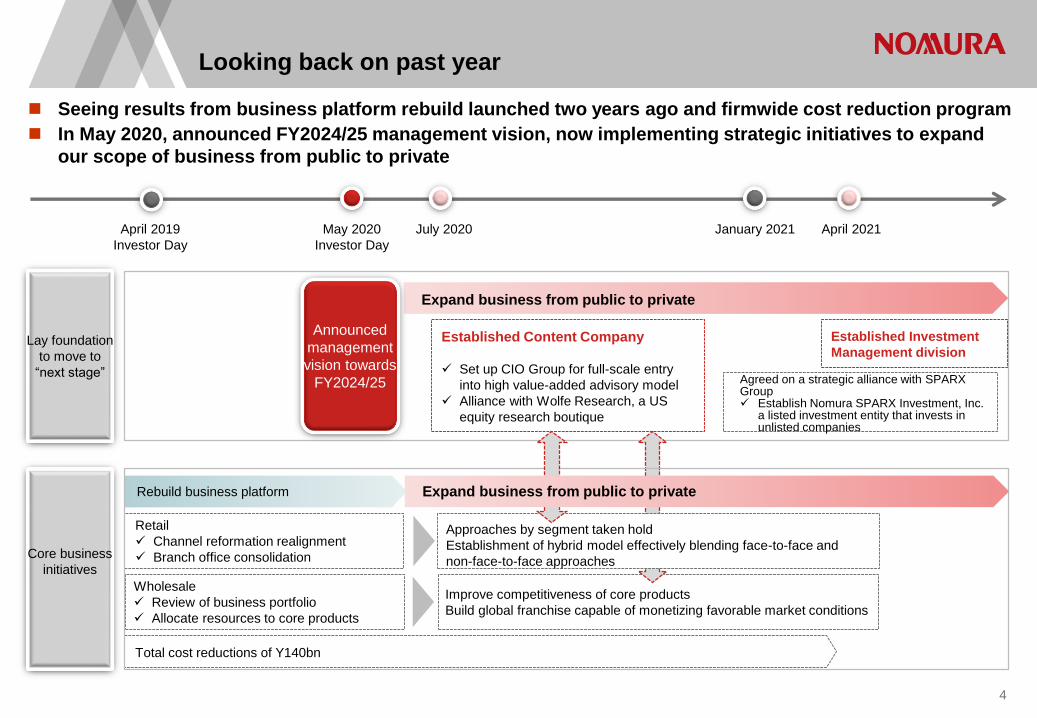
Looking back on past year
Seeing results from business platform rebuild launched two years ago and firmwide cost reduction program
In May 2020, announced FY2024/25 management vision, now implementing strategic initiatives to expand
our scope of business from public to private
4
May 2020
Investor Day
July 2020 January 2021 April 2021
Lay foundation
to move to
“next stage”
Core business
initiatives
April 2019
Investor Day
Established Content Company
Set up CIO Group for full-scale entry
into high value-added advisory model
Alliance with Wolfe Research, a US
equity research boutique
Announced
management
vision towards
FY2024/25
Expand business from public to private
Established Investment
Management division
Agreed on a strategic alliance with SPARX Group Establish Nomura SPARX Investment, Inc.
a listed investment entity that invests in unlisted companies
Rebuild business platform
Retail
Channel reformation realignment
Branch office consolidation
Wholesale
Review of business portfolio
Allocate resources to core products
Total cost reductions of Y140bn
Approaches by segment taken hold
Establishment of hybrid model effectively blending face-to-face and
non-face-to-face approaches
Improve competitiveness of core products
Build global franchise capable of monetizing favorable market conditions
Expand business from public to private

24.7 24.627.9
30.8
39.3 40.144.4
50.0 51.4 49.3
64.7
2011 2012 2013 2014 2015 2016 2017 2018 2019 2020 2021
70.6 72.083.8
91.7
109.5100.6
107.7117.7 114.7
104.0
126.6
2011 2012 2013 2014 2015 2016 2017 2018 2019 2020 2021
Risk money flows via public markets
Retail client assets up 1.8x in past 10 years Assets under management up 2.6x in past 10 years
Market share growth in core products Providing fundraising, M&A advisory and other services
EGB trading volume share1
(End of March) (End of March)
(trillions of yen) (trillions of yen)
US RMBS new issuance securitization
share3
US EQ listed option revenue share4AEJ Credit revenue share2
Japan related M&A
Y62.7trn(of which, cross-border M&A Y27.4trn)
Japan related ECM
(IPO)
Y8.2trn
Japan related ECM
(PO)
Y11.8trn
5
Financing
related5
M&A5
(Total deal value of transactions Nomura involved in from April 2011 – March 2021)
1. Source: Bloomberg, duration weighted trading volume share 2. Source: Coalition Competitor Analytics and Nomura. Ranks are based upon the following peers (BofA, BARC, BNPP, Citi, CS, DB, GS,
JPM, MS, HSBC, UBS). Market share results are based on industry revenue pools and Nomura‘s internal revenues, and are based upon Nomura’s product taxonomy
3. Source: Bloomberg, deal count share 4. Source: Third party research 5. Source: Refinitiv, from April 2011 to March 2021
1.8x 2.6x
3% 9.1%
(2016) (2020)# 2
5.4% 7.7%
(2016) (2020 1H)# 4
1.9% 13.5%
(2016) (2020)# 2
9.0% 13.0%
(2016) (2020)# 2
(Total deal value of transactions Nomura involved in from April 2011 to March 2021)
Connecting investors and issuers through capital markets and providing liquidity; Support the sound flow
of risk money
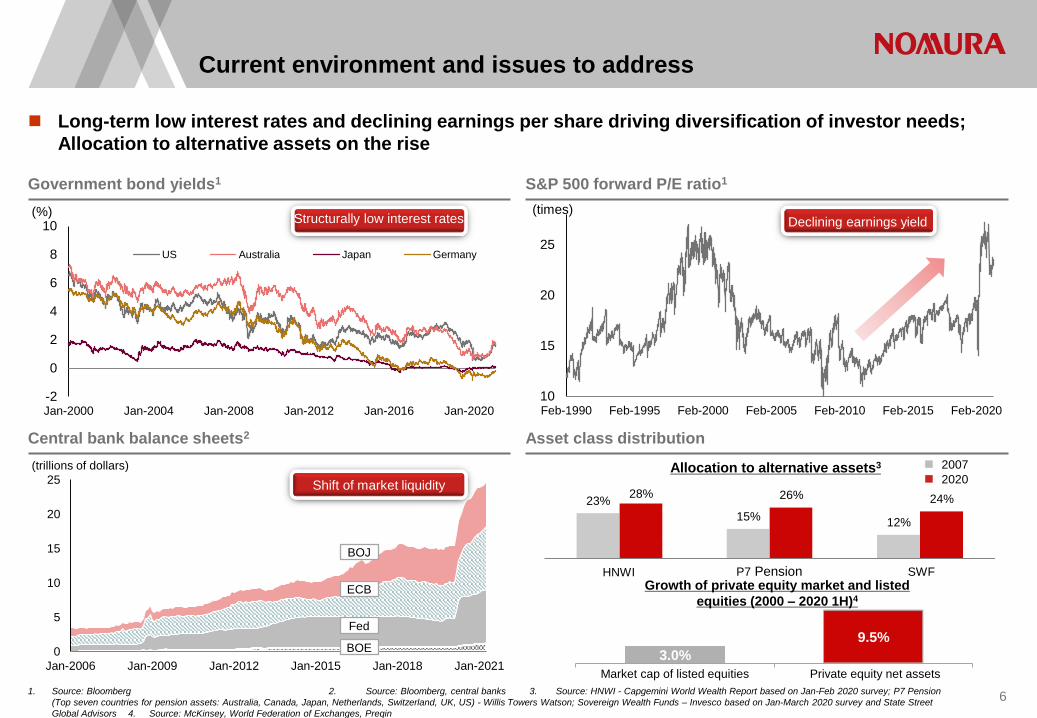
23%
15%12%
28% 26% 24%
3.0%
9.5%
10
15
20
25
Feb-1990 Feb-1995 Feb-2000 Feb-2005 Feb-2010 Feb-2015 Feb-2020
Current environment and issues to address
1. Source: Bloomberg 2. Source: Bloomberg, central banks 3. Source: HNWI - Capgemini World Wealth Report based on Jan-Feb 2020 survey; P7 Pension
(Top seven countries for pension assets: Australia, Canada, Japan, Netherlands, Switzerland, UK, US) - Willis Towers Watson; Sovereign Wealth Funds – Invesco based on Jan-March 2020 survey and State Street
Global Advisors 4. Source: McKinsey, World Federation of Exchanges, Preqin
Long-term low interest rates and declining earnings per share driving diversification of investor needs;
Allocation to alternative assets on the rise
Government bond yields1 S&P 500 forward P/E ratio1
Central bank balance sheets2 Asset class distribution
Structurally low interest rates
Growth of private equity market and listed
equities (2000 – 2020 1H)4
Shift of market liquidity
Allocation to alternative assets3
Market cap of listed equities Private equity net assets
HNWI P7 Pension SWF
2007
2020
6
(trillions of dollars)
(%) (times)
-2
0
2
4
6
8
10
Jan-2000 Jan-2004 Jan-2008 Jan-2012 Jan-2016 Jan-2020
US Australia Japan Germany
0
5
10
15
20
25
Jan-2006 Jan-2009 Jan-2012 Jan-2015 Jan-2018 Jan-2021
BOE
Fed
ECB
BOJ
Declining earnings yield

Establishment of Investment Management division
1. Main Group companies under Investment Management.
Announced establishment of Investment Management division in March 2021
Bring together Nomura Group companies to provide investment management opportunities and solutions
in both public and private markets
Provide balance sheet Provide investment productsOwn capital,
Capital intensive businesses
Stable revenue expansion,
Businesses with light capital burden
Strengthen efforts in public and private markets
Respond to increasingly diverse investment management needs of clients amid prolonged low interest rate environment
Bring together Group wide expertise from traditional assets to private equity and other alternatives to boost added value
Aim of
division
Main
companies1
Access to Group’s high-
quality, broad client base
Groupwide collaboration to
provide investment opportunities
and solutions to clients (retail
clients and institutional investors
in Japan and abroad)
Operational efficiencies
Standardize internal processes
Drive efficiencies through digital
efforts
Sophisticated
divisional strategies
Centralize division strategy under dedicated department
Ensure independence of each entity. Expand product offering with competitive performance backed by expertise and innovation of each entity under the division
Full
capabilities
of Nomura
Group
7
Nomura Capital Partners Co., Ltd.
Nomura Mezzanine Partners Co., Ltd.

Overview of digital transformation
Digital transformation
8
New business model
Deliver completely new value
Develop new client base
Uncover new revenue sources
Transforming existing client user
interface and experience
Improve services
More efficient, sophisticated
internal processes
Digital improvements Digital transformation
New
Data strategyCloud strategyCollaboration
platforms
Dig
ital tra
nsfo
rma
tion
in a
ctio
nE
nviro
nm
en
t
to im
ple
me
nt
Promoting digital transformation
Initiatives led by businesses and companies for digital improvement and transformation- Wholesale Digital Office- Global Markets Digital Strategy Dept.- Innovation Lab (research on innovative
technologies in Asset Management)- Future Innovation Company, etc.
Appointed CIO in each division to consolidate infrastructure aligned to requirements of each business, clarified cross-divisional functions
Organizational initiatives
Development of digital talent
Recruiting digital talent
Provide learning opportunities for new technologies such as AI mainly in Wholesale, create cross-divisional organization of new technology experts to drive internal initiatives
Introduce systematic development program for Retail IT talent
Step up recruitment of IT talent with knowledge of new technologies
Recruit digital transformation talent into Future Innovation Company to collaborate with businesses
Tra
nsfo
rmin
g h
ow
we
deliv
er v
alu
e

Initiatives and successes of existing businesses,
delivering higher added value to clients

FY2020/2021 full year
or Mar 2021
FY2022/23 Target
(as of May 2020)
FY2022/23 Target
(as of May 2021)
KPI
Retail
Recurring revenue assets Y18.2trn ✔ Y21trn Y21trn
Consulting-related revenue Y13.4bn Y27.8bn Y27.8bn
Number of active clients 1.019m 1.47m 1.47m
Net inflows of cash and securities Y887.7bn Y2.4trn/year Y2.4trn/year
Investment Management Assets under management Y65.8trn ✔ Y70trn
Wholesale
Revenue/modified RWA1 6.4% ✔ Approx. 6% 6% or more
Fee and commission
revenueUS$1.26bn ✔ US$1.15bn or more US$1.3bn or more
Expenses/revenue 91% 82% or less 80% or less
KGI
Retail
Income before income taxes
Y92.3bn ✔ Y110bn Y110bn
Investment Management Y91.0bn (of which business
income2 Y40.8bn)✔
(former AM division:
Y50bn)Y60bn (of which business
income2 Y45bn)
WholesaleY64.3bn
(of which US loss -Y245.7bn)Y120bn Y150bn
Three segmentY247.6bn ✔ Y280bn Y320bn
Results to FY2020/21 vs. FY2022/23 targets
Business growth: FY2022/23 KPI and KGI targets
1. Wholesale net revenue divided by modified risk-weighted assets (daily average for the accounting period) used by Wholesale. Modified risk-weighted assets (daily average for the accounting period) is a non-
GAAP financial measure and is the total of (i) risk-weighted assets (as calculated and presented under Basel III) and (ii) an adjustment equal to the regulatory adjustment to common equity tier I capital calculated
and presented under Basel III divided by our internal minimum capital ratio target
2. Investment Management business income does not include investment income (ACI-related gain/loss (includes gain/loss on market valuation of ACI shares, interest payments on funds used to acquire ACI shares
and dividends received from ACI) and gain/loss on funds of investment companies under Investment Management such as Nomura Capital Partners and investment securities under Investment Management).
Revised some FY2022/23 KPIs and KGI based on progress to end FY2020/21 and establishment of
Investment Management division
10
(former AM division:
Y65trn)

FY2022/23 Target(As of May 2020)
FY2022/23 Target(As of May 2021)
FY2024/25 Target
Achieving ROE target
FY2024/25 management targets
Expand business into private areas in addition to public markets to increase income from existing
businesses and new areas
11
8% or
more
8 - 10%
below 8%
Three
segment
income before
income taxes
(KGI)
Y280bn Y320bn
1
2
2
>40% growth over
next 2-3 yearsReinforcing Private Markets
Income growth to FY2024/25
50%+ growth over next 3 years
Targeting 5x AuM
Income before income
taxes: +Y20bn
Consolidate investment management functions for existing business growth and pursue inorganic strategies
1 Raising FY2022/23 income before income tax target (KGI)
Income before income
taxes: +Y30bn
Consolidate management of assets from
traditional to alternatives
Income before income
taxes: +Y10bn
Improve underlying Wholesale profitability
Grow digital businesses (existing and new)
Collaborate with other companies (regional financial institutions,
LINE, etc.) to grow client base and generate different types of fees
Enhance private and low risk businesses for institutional investors
and corporates
Scaling-up Advisory business
Growth in International Wealth
Management

339.5 336.4 368.8
97.8 92.6134.8
555.4648.6
691.4
992.7
1,077.6
1,194.9
FY2018/19 FY2019/20 FY2020/21
Stronger revenues in each core business segment, and marked improvement in income
before income taxes driven by continued focus on cost reductions
FY2020/21: Three segment profitability improved as a
result of structural transformation
12
(billions of yen)
Started business portfolio realignment in
April 2019
Retail
Asset
Management
Fixed
income
Equity
Investment
banking
Wholesale555.4
648.6
691.4
Three segment net revenue
Three segment income
(loss) before income taxes
Three segment
Expenses/revenue
-27.7
103%
170.4
84%
230.9
81%
CET 1 ratio
15.7%
(Medium-term target: 11% or more)
Three segment income before
income taxes
Y230.9bn
(FY2022/23 KGI Y280.0bn)
Wholesale
Revenue/modified RWA
6.4%
(FY2022/23 KPI Approx. 6%
Asset Management
Assets under management
Y64.7trn Record high
(FY2022/23 KPI Y65trn)
Retail
Recurring revenue assets
Y18.2trn
(FY2022/23 KPI Y21trn)
Main KPI/KGI progress
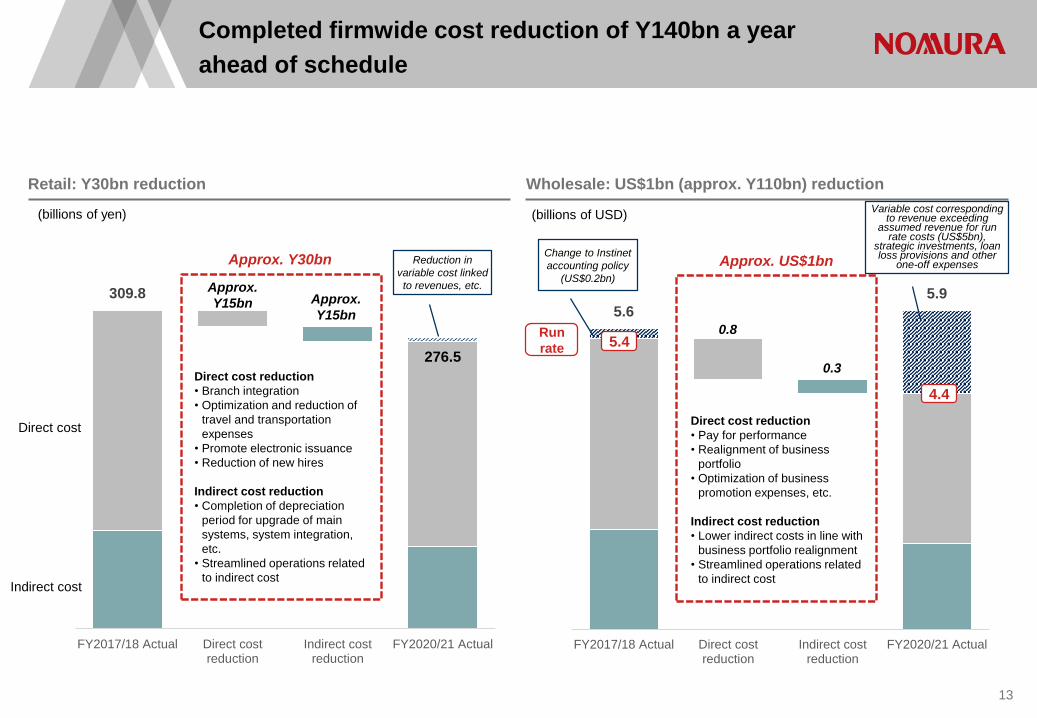
5.6
5.9
FY2017/18 Actual Direct costreduction
Indirect costreduction
FY2020/21 Actual
309.8
276.5
FY2017/18 Actual Direct costreduction
Indirect costreduction
FY2020/21 Actual
Completed firmwide cost reduction of Y140bn a year
ahead of schedule
Retail: Y30bn reduction Wholesale: US$1bn (approx. Y110bn) reduction
Indirect cost
Direct cost
Run
rate
(billions of yen) (billions of USD)
Approx. Y30bn
Approx.
Y15bn
Approx. US$1bn
0.8
0.3
13
4.4
5.4
Approx.
Y15bn
Direct cost reduction
• Branch integration
• Optimization and reduction of
travel and transportation
expenses
• Promote electronic issuance
• Reduction of new hires
Indirect cost reduction
• Completion of depreciation
period for upgrade of main
systems, system integration,
etc.
• Streamlined operations related
to indirect cost
Direct cost reduction
• Pay for performance
• Realignment of business
portfolio
• Optimization of business
promotion expenses, etc.
Indirect cost reduction
• Lower indirect costs in line with
business portfolio realignment
• Streamlined operations related
to indirect cost
Reduction in
variable cost linked
to revenues, etc.
Variable cost corresponding to revenue exceeding
assumed revenue for run rate costs (US$5bn),
strategic investments, loan loss provisions and other
one-off expenses Change to Instinet
accounting policy
(US$0.2bn)

103%
84%
81%
Approx. 75%
60%
70%
80%
90%
100%
110%
FY2018/19Actual
FY2019/20Actual
FY2020/21Actual
FY2022/23Target
Continued focus on cost control
1. Actual total for Retail, Asset Management and Wholesale from FY2018/18 to FY2020/21. FY2022/23 is cost income ratio on assumption of a certain level of total revenues for Retail, Wholesale and Investment
Banking.
Three segment cost income ratio (expenses / revenue)1 Measures to lower the cost income ratio
14
Revenue
expansion
Cost
control
Continue necessary investments to build out business
towards achieving the management vision
Promote use of digital technologies in Corporate
Transform operating model while building important
foundation of agility and efficiency
Support operating efficiency and revenue growth
- Lessen client onboarding time and reduce
maintenance costs
- Eliminate manual processes to promote
efficiency, cut costs, etc.
Implement real estate and offshore center strategies
Consolidate branch administrative operations, enhance
retail sales support and transaction management and
promote higher productivity
Develop business leveraging high market share of core
products and global collaboration; improve underlying
profitability
Create a new business model through combined digital
and people approach and collaborate with third parties
to grow our client base
Expand business in private areas in addition to public
markets

Capital policy and shareholder returns
Maintain appropriate capital ratios and aim for long-term ROE growth through optimal capital allocation
15
Consolidate payout ratio of 30% as key indicator based
on half year consolidated performance
Aim for total shareholder return ratio including share
buybacks of at least 50%
Shareholder
return policy
CET1 ratio: Targeting at least 11% Risk assets expected to increase when Basel 3
fully implemented in 2023; Plan to minimize impact by realigning portfolio and revising models
Invest for growth
Respond to regulatory requirements and
ensure financial soundness
Shareholder returns
Reward shareholders in line with shareholder return policy while maintaining appropriate capital levels and ensure balance between regulatory developments and investing for growth
Invest for growth to realize management strategy of expanding scope of our business from public into private markets
Carefully select areas where returns outstrip cost of capital
Regu
lato
ry
requ
irem
ent
Op
tima
l ca
pita
l allo
ca
tion
1. Including allocations for stock options.
(billions of yen)
30
63 69 47
71 69
20
64
107 32
65 59
16
107 98
150
62
128 127
63
178 167
20
214
107
58% 60% 57% 48%74% 76%
98%70%
(5)
(4)
(3)
(2)
(1)
0
1
2
0
50
100
150
200
250
300
FY2012/13 FY2013/14 FY2014/15 FY2015/16 FY2016/17 FY2017/18 FY2018/19 FY2019/20 FY2020/21
Dividend amount Share buyback amount
Shareholder return level of 50% Total shareholder return ratio¹

2 nominees with deep knowledge of US financial
industry, macro economics and regulatory
environment
1 nominee from Asia with expertise in UK and
Hong Kong legal systems
1 Japanese corporate executive with experience
in running global businesses and sustainability
Initiatives to enhance governance
Following shareholders’ meeting in June 2021, aim for more advanced governance in line with global operating
environment
New governance system
16
Outside Directors
Female directors
Non-Japanese directors
History of enhancing
governance system
Explored how to further enhance governance in line with
global operating environment on back of increasing in
international business proportion in business portfolio
Researched and validated best approach for Board of
Directors for a global financial company, and to further
enhance governance conducted search and selected Director
nominees with the required background needed for
management oversight
Outside:
8 (67%)
Female:
3 (25%)
Non-
Japanese:
4 (33%)
2001
Shifted to holding company structure
and listed on NYSE
Established Advisory Board where
outside experts regularly discuss group
management
2003
Adopted Company with Committees,
etc. structure
(now known as a Company with Three
Board Committees)
2010
Two Outside Directors (one female)
joined from overseas and Board of
Director comprised of a majority of
Outside Directors
2015
Established "Outside Directors
Meetings" to discuss matters related to
business and corporate governance
regularly
2019
All three committees (Nomination,
Audit, Compensation) have Outside
Director as Chairman
4 new Outside Director
nominees
Composition of Board of Directors after 2021
shareholders’ meeting (plan)

Towards the realization of a sustainable society
Deliver solutions to a broad range of stakeholders leveraging diverse group functions
Integrate sustainability into management strategy, and realize growth of clients, wider society
and Nomura Group
17
Social
issues
Climate
change
Increasing
social
inequality
Food
problem
(Agriculture
and food)
Aging
society
Help enrich society through our expertise in the capital markets
Stakeholders
CompaniesIndividuals/
employees
Institutional investors/
pension funds
Public sector
organizations Society
Consultations for medical corporations and nursing
care facilities Food & Agri consulting and advisory
Healthcare
issues
Financial literacy program
Financial transactions addressing
climate change
Promote ESG through investment
chain
Initiatives to address aging
society
Sustainability promotion
initiatives (2021)
Underwriting of sustainable
finance
Nomura Greentech advisory
services
Support infrastructure and power
financing, etc.
Disseminate information leveraging Nomura Center of Sustainability Center and ESG research
Development, management and provision of sustainability related investment products
Implement responsible investing
Approach to clients using financial gerontology
Support business succession (sponsorship of Startup Pitch contest in Japan)
Establishment of search fund
Wide ranging support towards
sustainable regional healthcare
framework
To increase efficiency, discover
startups that can provide new
services and new technologies
related to AI, IoT, robotics and
genomics
Research and consulting for government institutions, municipalities, and private sector organizations and implementation support
Provide information/advice to companies contemplating investment or collaboration with agricultural corporations
Develop expertise and know-how at company farm and demonstration tests
Financial literacy lessons and materials to elementary, junior and senior high; university courses for 20 years at approx. 2,100 universities, reaching approx. 270,000 students
Systematic learning opportunities through Nomura Financial Academy
✔Strengthen D&I to enable
flexible decision making
and implementation amid
uncertainty of the future - Approx. 26,000
employees, 15,000 in Japan and 11,000 overseas; 90 nationalities
- Diverse executive officers newly appointed (10 out of 26 started careers outside Nomura; 2 women appointed at Nomura Securities)
- Nomura Holdings became a member of the 30% Club Japan
✔Appoint executive in
charge of sustainability
Disclaimer
This document is produced by Nomura Holdings, Inc. (“Nomura”).
Nothing in this document shall be considered as an offer to sell or solicitation of an offer to buy any security, commodity or other
instrument, including securities issued by Nomura or any affiliate thereof. Offers to sell, sales, solicitations to buy, or purchases of any
securities issued by Nomura or any affiliate thereof may only be made or entered into pursuant to appropriate offering materials or a
prospectus prepared and distributed according to the laws, regulations, rules and market practices of the jurisdictions in which such
offers or sales may be made.
The information and opinions contained in this document have been obtained from sources believed to be reliable, but no
representations or warranty, express or implied, are made that such information is accurate or complete and no responsibility or liability
can be accepted by Nomura for errors or omissions or for any losses arising from the use of this information.
All rights regarding this document are reserved by Nomura unless otherwise indicated. No part of this document shall be reproduced,
stored in a retrieval system or transmitted in any form or by any means, electronic, mechanical, photocopying, recording or otherwise,
without the prior written permission of Nomura.
This document contains statements that may constitute, and from time to time our management may make “forward-looking statements”
within the meaning of the safe harbor provisions of The Private Securities Litigation Reform Act of 1995. Any such statements must be
read in the context of the offering materials pursuant to which any securities may be offered or sold in the United States. These forward-
looking statements are not historical facts but instead represent only our belief regarding future events, many of which, by their nature,
are inherently uncertain and outside our control. Actual results and financial condition may differ, possibly materially, from what is
indicated in those forward-looking statements. You should not place undue reliance on any forward-looking statement and should
consider all of the following uncertainties and risk factors, as well as those more fully discussed under Nomura’s most recent Annual
Report on Form 20-F and other reports filed with the U.S. Securities and Exchange Commission (“SEC”) that are available on Nomura’s
website (https://www.nomura.com) and on the SEC‘s website (https://www.sec.gov); Important risk factors that could cause actual
results to differ from those in specific forward-looking statements include, without limitation, economic and market conditions, political
events and investor sentiments, liquidity of secondary markets, level and volatility of interest rates, currency exchange rates, security
valuations, competitive conditions and size, and the number and timing of transactions.
Forward-looking statements speak only as of the date they are made, and Nomura undertakes no obligation to update any forward-
looking statement to reflect the impact of circumstances or events that arise after the date the forward-looking statement was made.
The consolidated financial information in this document is unaudited.

Nomura Holdings, Inc.www.nomura.com