Investor Presentation 2009 - Nomura Holdings
42
Investor Presentation 2009 April 30, 2009 Kenichi Watanabe President and CEO Nomura Holdings, Inc.
Transcript of Investor Presentation 2009 - Nomura Holdings

Investor Presentation 2009April 30, 2009
Kenichi WatanabePresident and CEONomura Holdings, Inc.

1
1. This document is produced by Nomura Holdings, Inc. ("Nomura"). Copyright 2009 Nomura Holdings, Inc. All rights reserved.2. Nothing in this document shall be considered as an offer to sell or solicitation of an offer to buy any security, commodity or
other instrument, including securities issued by Nomura or any affiliate thereof. Offers to sell, sales, solicitations to buy, or purchases of any securities issued by Nomura or any affiliate thereof may only be made or entered into pursuant to appropriate offering materials or a prospectus prepared and distributed according to the laws, regulations, rules and market practices of the jurisdictions in which such offers or sales may be made.
3. No part of this document shall be reproduced, stored in a retrieval system or transmitted in any form or by any means, electronic, mechanical, photocopying, recording or otherwise, without the prior written permission of Nomura.
4. The information and opinions contained in this document have been obtained from sources believed to be reliable, but no representations or warranty, express or implied, are made that such information is accurate or complete and no responsibility or liability can be accepted by Nomura for errors or omissions or for any losses arising from the use of this information.
5. This document contains statements that may constitute, and from time to time our management may make "forward-looking statements" within the meaning of the safe harbor provisions of The Private Securities Litigation Reform Act of 1995. Any such statements must be read in the context of the offering materials pursuant to which any securities may be offered or sold in the United States. These forward-looking statements are not historical facts but instead represent only our belief regarding future events, many of which, by their nature, are inherently uncertain and outside our control. Important factors that could cause actual results to differ from those in specific forward-looking statements include, without limitation, economic and market conditions, political events and investor sentiments, liquidity of secondary markets, level and volatility of interest rates, currency exchange rates, security valuations, competitive conditions and size, and the number and timing of transactions.
6. The consolidated financial information in this document is unaudited.
2
1.
Current Environment2.
4. In Closing
Focus for Current Fiscal Year3.
Review of Last Fiscal Year

3
0
500
1,000
1,500
2,000
2,500
3,000
05/04 05/07 05/10 06/01 06/04 06/07 06/10 07/01 07/04 07/07 07/10 08/01 08/04 08/07 08/10 09/01 09/04
Share price
Share price hit Y400s during March, lowest level since 1982.
Nomura Holdings historical share priceNomura Holdings historical share price
(yen)Historical share price (Apr. 2005 – Apr. 2009)

4
Balance sheet
Writing down problem assets
Depletion of capital
Dealing with legacy assets

5
Expanding wholesale platform
Balance sheet
Raising capital
Paving the way for future growth

6
Breakdown of revenue and pre-tax lossBreakdown of revenue and pre-tax loss
(779)(779)
(532.9)(532.9)
(862.3)(862.3)
(144)(144)
762.4762.4
Income (loss) before income taxes
(US GAAP)
One-off losses/expenses
GM Trading losses
Non-interestexpenses
Net revenue(excl. GM
trading losses)
Main causes of lossesMain causes of losses
Expenses aimed at future growth (approx. figures)
Wholesale platform expansion Y120bnOne-off expenses related to Lehmanacquisitions
(billions of yen)
Note: GM (Global Markets) trading losses include net interest revenue, exclude one-off losses.
Dealing with legacy positions (approx. figures)
Carry trades with less client order flow Y150bn
Monoline related lossesIceland related losses
Real estate loans, other illiquid assets Y140bnPrivate equity write-downsReal estate related losses
Long-term asset losses/expenses Y125bnFortress impairmentJAFCO impairment
Breakdown of losses for year ended March 2009

7
Top management taking a hands-on approach
Shift from reactive to proactive risk management
Risk management structure shaped by balance sheet
Proactive risk management
8
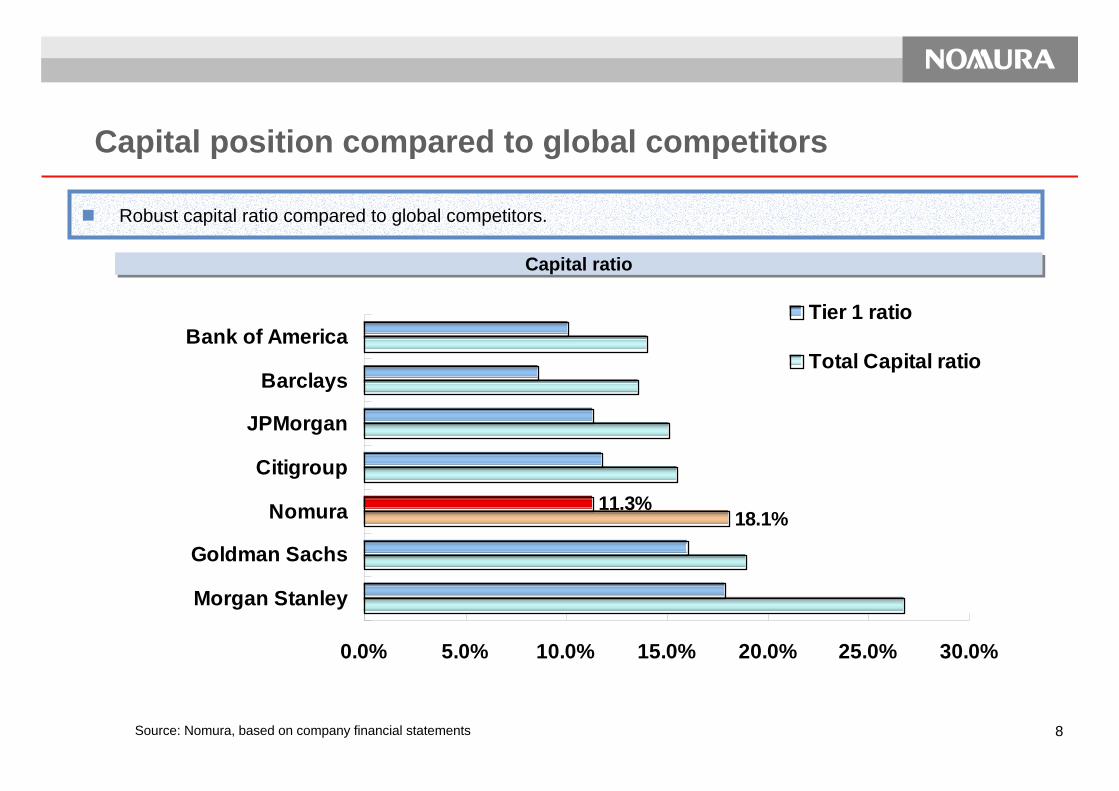
Capital ratioCapital ratio
Robust capital ratio compared to global competitors.
Capital position compared to global competitors
Source: Nomura, based on company financial statements
18.1%11.3%
0.0% 5.0% 10.0% 15.0% 20.0% 25.0% 30.0%
Morgan Stanley
Goldman Sachs
Nomura
Citigroup
JPMorgan
Barclays
Bank of AmericaTier 1 ratio
Total Capital ratio

9
1.
Current Environment2.
4. In Conclusion
Focus for Current Fiscal Year 3.
Review of Last Fiscal Year

10
Note: 1. Data up to December 2003 survey and data thereafter are not linked due to a revisionin the structure of the survey.
2. April – June 2009 data is forecast DI as reported in March 2009 survey.3. Shaded areas indicate recessionary phases.
Source: Bank of Japan
Source: Bank of Japan
BoJ’s March Tankan survey of business sentiment saw confidence among Japanese firms drop to an all time low due mainly to a plunge in exports. Confidence was hit hardest at exporters, with iron and steel manufacturers down 77 percentage points and auto makers down 51 percentage points from December’s survey.
Business condition diffusion index for large enterprisesBusiness condition diffusion index for large enterprises Large manufacturer diffusion index by industryLarge manufacturer diffusion index by industry
-60
-40
-20
0
20
40
60
84 85 86 87 88 89 90 91 92 93 94 95 96 97 98 99 00 01 02 03 04 05 06 07 08 09
(DI, ppt)
(CY)
Large Enterprises/Nonmanufacturing
Large enterprises/Manufacturing
"Fav
orab
le"
"Unf
avor
able
"
Japan: Business sentiment at record low
("Favorable" - "Unfavorable" %)
Dec 2008 survey Mar 2009 surveyRecent Previous
change change
Manufacturing -24 -36 -58 (-34) -51 (7)Textiles -38 -43 -69 (-31) -67 (2)Lumber & Wood Products -45 -41 -82 (-37) -73 (9)Pulp & Paper -3 -7 -32 (-29) -35 (-3)Chemicals -14 -22 -50 (-36) -34 (16)Petroleum & Coal Products -45 -50 -60 (-15) -40 (20)Ceramics, Stone & Clay -32 -48 -64 (-32) -60 (4)Iron & Steel 12 -44 -65 (-77) -69 (-4)Non-ferrous metals -43 -54 -81 (-38) -65 (16)Food & Beverages -7 -5 -6 (1) -6 (0)Processed metals -30 -45 -51 (-21) -43 (8)Industry machinery -22 -38 -64 (-42) -68 (-4)Electrical machinery -37 -39 -69 (-32) -58 (11)Shipbuilding & Heavy Machinery, etc 3 -13 -23 (-26) -34 (-11)Motor vehicles -41 -68 -92 (-51) -83 (9)Precision machinery -14 -39 -50 (-36) -47 (3)Basic materials -20 -35 -60 (-40) -51 (9)Processing -26 -37 -57 (-31) -52 (5)
Major Companies
PreviousRecent

11
Coordinated fiscal stimulus by G20 countries
G20 total: USD5 trillion(as of G20 summit on April 2, 2009)
Japan: USD154.0bn(Additional stimulus announced
Apr. 10, ’09)
US: USD787.2bn(American Recovery and Reinvestment
Act signed into law Feb. 17, 2009)
China: USD600.0bn(Comprehensive fiscal stimulus package
announced Nov. 5, 2009)
Aiming for global GDP growth of 2% in 2010
Note: Latest fiscal stimulus figures announced by each country.Calculated using USD1 = JPY100, USD1 = RMB6.83
Coordinated moves to overcome crisis: Fiscal stimulus
12
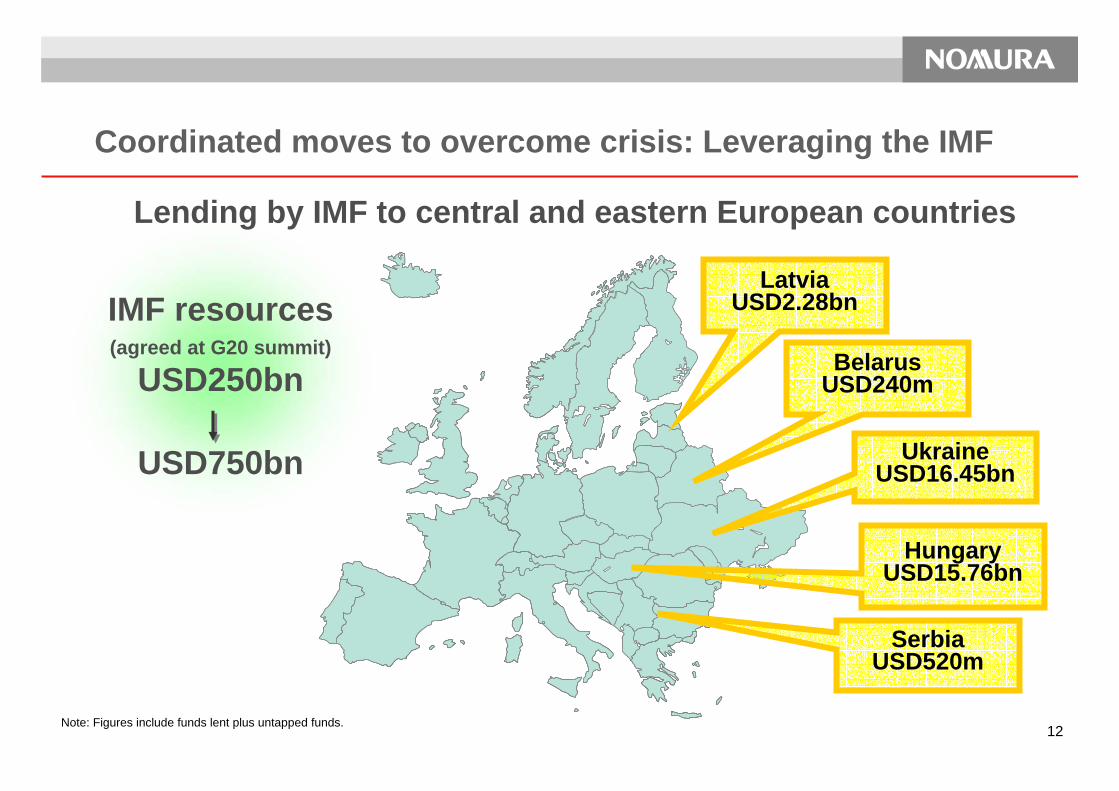
Lending by IMF to central and eastern European countries
LatviaUSD2.28bn
BelarusUSD240m
UkraineUSD16.45bn
HungaryUSD15.76bn
SerbiaUSD520m
Note: Figures include funds lent plus untapped funds.
Coordinated moves to overcome crisis: Leveraging the IMF
IMF resources(agreed at G20 summit)
USD250bn
USD750bn

13
Sharp rise in refinancing in the US due to drop in interest rates.Possibility of early economic recovery as consumers benefit from lower rates, underpinning the US economy.
US mortgage rates and refinancing levelsUS mortgage rates and refinancing levels
Source: Nomura, based on Mortgage Bankers Association data.
(%)
US: Economic recovery on increased mortgage refinancing
-
1,000
2,000
3,000
4,000
5,000
6,000
7,000
8,000
2005 2006 2007 2008 20094.0
4.5
5.0
5.5
6.0
6.5
7.0
7.5
MBA リファイナンス・インデックス. モーゲージ30年固定金利MBA Refinance Index(Sesonally adjusted index)
30-year fixed rate mortgage interest

14
Note: Estimate of impact on YoY rise in GDP and on each category. Based on Japanese economic model announced by Japan’s Cabinet Office.Source: Nomura
Impact of 2008/2009 economic measures on GDP growthImpact of 2008/2009 economic measures on GDP growth
Economic measures taken by the government expected to boost real GDP growth by 1.47%.In mid 2009 when most of Japan, US, China stimulus implemented, Japan’s economy is expected to rise.
Japan taking proactive approach to fiscal stimulus
(ppt)
Impact ofstimulusmeasures
decided in 2008
Impact ofstimulusmeasures
decided in 2009
Total
Impact ofstimulusmeasures
decided in 2008
Impact ofstimulusmeasures
decided in 2009
Total
Real GDP growth 0.62 0.85 1.47 0.22 0.33 0.54Consumer spending 0.31 0.31 0.61 0.56 0.59 1.16Capex 0.77 0.45 1.23 1.06 1.00 2.06Housing investment 0.20 0.23 0.43 0.41 0.35 0.76Public investment 5.54 12.98 18.52 -3.84 -7.39 -11.23Imports 0.69 1.12 1.82 0.76 0.76 1.52
Impact on growth in FY09 Impact on growth in FY10

15Source: Nomura, based on CEIC data.
Foreign currency reserves/short-term debt (2008)Foreign currency reserves/short-term debt (2008) Household debt/disposable income (2007)Household debt/disposable income (2007)
Chinese economy relatively strong compared to other emerging markets thanks to low leverage.
Source: Nomura, based on CEIC data.
7.3
4.44.0
3.2 3.0
1.8
1.1
4.3
0
2
4
6
8
China
India
Philippines
Thailand
Taiwan
Malaysia
Indonesia
Korea
Ratio
29
53
126136
149158 159 162
65
0
30
60
90
120
150
180
China
HK
France
Japan
US
Korea
UK
AU
NZ
%
Asia: Low leverage puts China in strong position
(Ratio) (%)
16
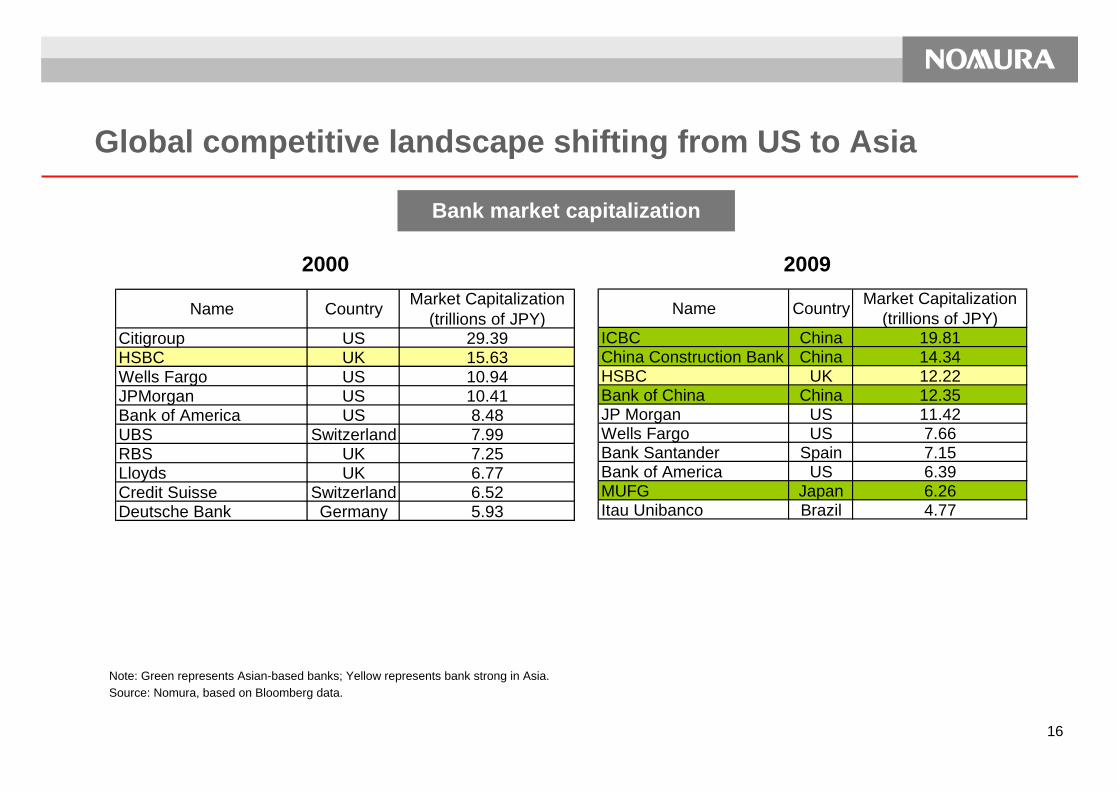
2000
Bank market capitalization
2009
Note: Green represents Asian-based banks; Yellow represents bank strong in Asia.Source: Nomura, based on Bloomberg data.
Global competitive landscape shifting from US to Asia
Name Country Market Capitalization(trillions of JPY)
Citigroup US 29.39HSBC UK 15.63Wells Fargo US 10.94JPMorgan US 10.41Bank of America US 8.48UBS Switzerland 7.99RBS UK 7.25Lloyds UK 6.77Credit Suisse Switzerland 6.52Deutsche Bank Germany 5.93
Name Country Market Capitalization(trillions of JPY)
ICBC China 19.81China Construction Bank China 14.34HSBC UK 12.22Bank of China China 12.35JP Morgan US 11.42Wells Fargo US 7.66Bank Santander Spain 7.15Bank of America US 6.39MUFG Japan 6.26Itau Unibanco Brazil 4.77
17
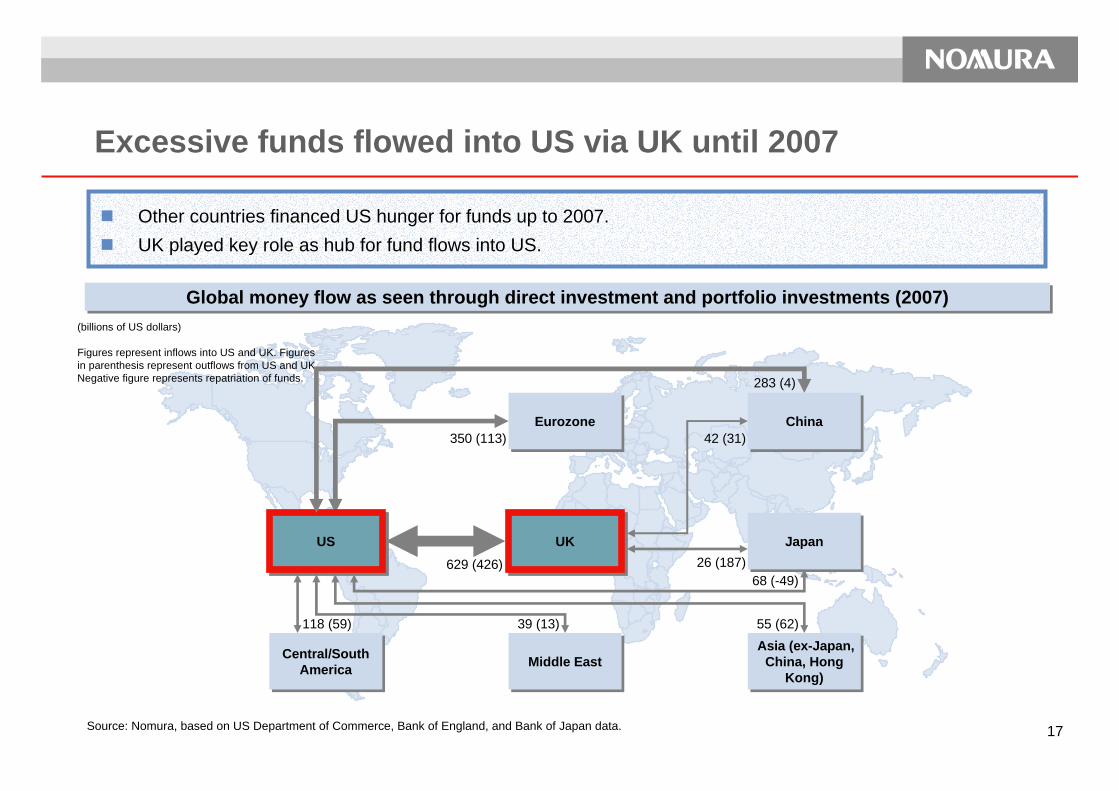
Other countries financed US hunger for funds up to 2007.UK played key role as hub for fund flows into US.
Global money flow as seen through direct investment and portfolio investments (2007)Global money flow as seen through direct investment and portfolio investments (2007)
Source: Nomura, based on US Department of Commerce, Bank of England, and Bank of Japan data.
(billions of US dollars)
Figures represent inflows into US and UK. Figuresin parenthesis represent outflows from US and UK.Negative figure represents repatriation of funds.
42 (31)EurozoneEurozone ChinaChina
JapanJapanUKUK
Central/South America
Central/South America
Asia (ex-Japan, China, Hong
Kong)
Asia (ex-Japan, China, Hong
Kong)Middle EastMiddle East
USUS629 (426)
350 (113)
39 (13) 55 (62)
68 (-49)
118 (59)
26 (187)
283 (4)
Excessive funds flowed into US via UK until 2007
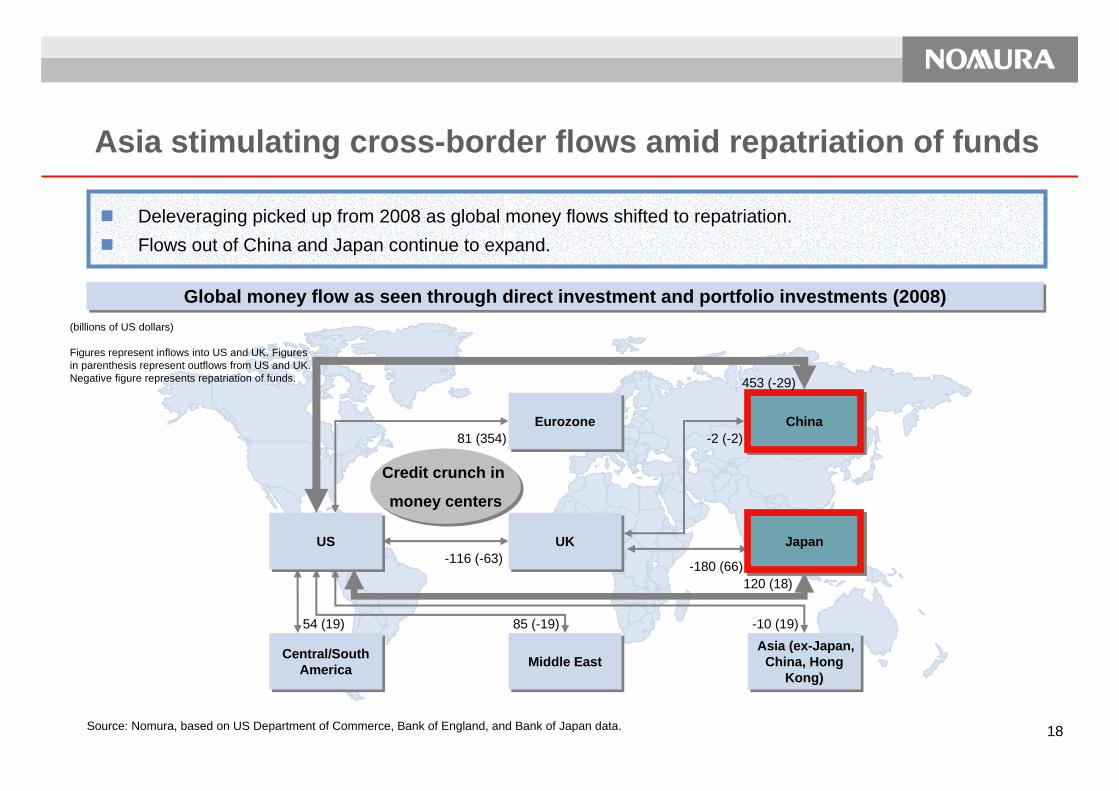
18
Deleveraging picked up from 2008 as global money flows shifted to repatriation.Flows out of China and Japan continue to expand.
Global money flow as seen through direct investment and portfolio investments (2008)Global money flow as seen through direct investment and portfolio investments (2008)
-2 (-2)EurozoneEurozone ChinaChina
JapanJapanUKUK
Central/South America
Central/South America
Asia (ex-Japan, China, Hong
Kong)
Asia (ex-Japan, China, Hong
Kong)Middle EastMiddle East
USUS-116 (-63)
81 (354)
85 (-19) -10 (19)
120 (18)
54 (19)
-180 (66)
453 (-29)
Credit crunch in
money centers
Credit crunch in
money centers
Source: Nomura, based on US Department of Commerce, Bank of England, and Bank of Japan data.
Asia stimulating cross-border flows amid repatriation of funds
(billions of US dollars)
Figures represent inflows into US and UK. Figuresin parenthesis represent outflows from US and UK.Negative figure represents repatriation of funds.
19
1.
Current Environment2.
4. In Closing
Focus for Current Fiscal Year3.
Review of Last Fiscal Year
20
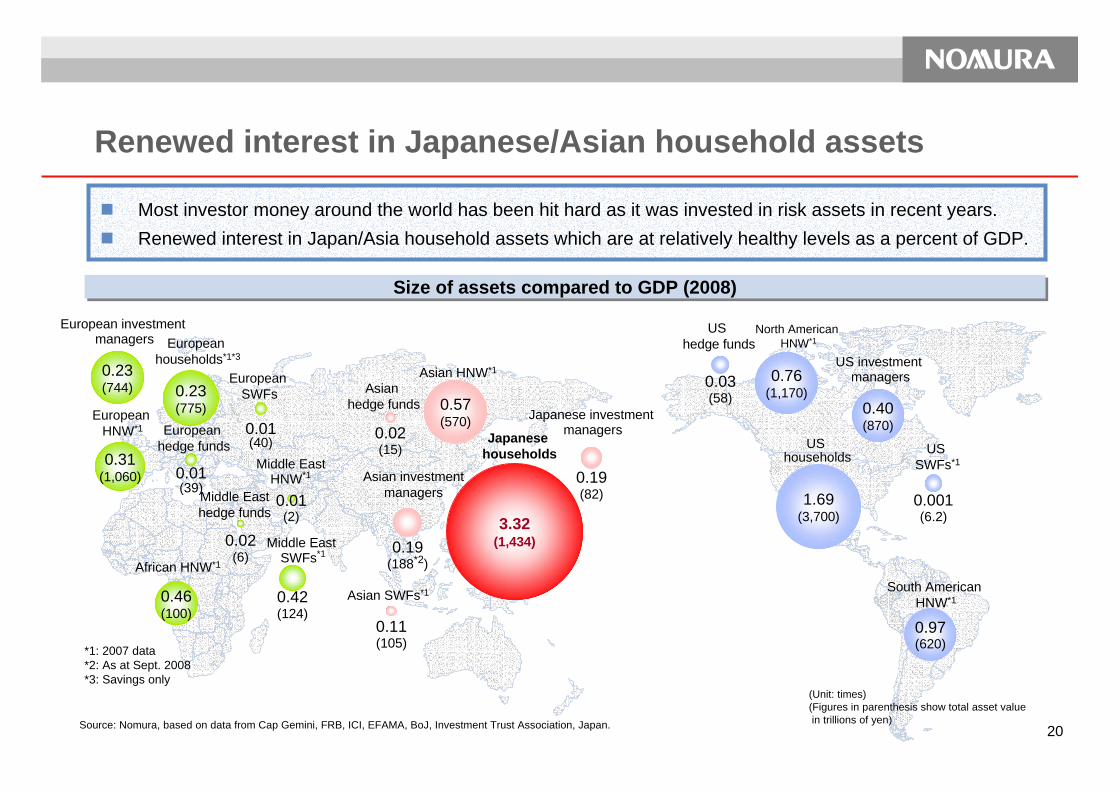
Most investor money around the world has been hit hard as it was invested in risk assets in recent years.Renewed interest in Japan/Asia household assets which are at relatively healthy levels as a percent of GDP.
(Unit: times)(Figures in parenthesis show total asset value in trillions of yen)
*1: 2007 data*2: As at Sept. 2008*3: Savings only
Size of assets compared to GDP (2008)Size of assets compared to GDP (2008)
European HNW*1
0.31(1,060)
European hedge funds
Middle Easthedge funds
African HNW*1
0.46(100)
0.01(39)
0.02(6)
0.23(744)
European investment managers
Middle EastHNW*1
0.01(2)
European households*1*3
0.23(775)
0.42(124)
European SWFs
0.01(40)
Middle East SWFs*1
Asian hedge funds 0.57
(570)0.02(15)
Asian HNW*1
0.19(188*2)
Asian investmentmanagers
0.19(82)
Japanese investment managers
Asian SWFs*1
0.11(105)
North American HNW*1
0.76(1,170)
US hedge funds
US households
South American HNW*1
0.97(620)
0.03(58)
1.69(3,700)
0.40(870)
US investment managers
US SWFs*1
0.001(6.2)
Source: Nomura, based on data from Cap Gemini, FRB, ICI, EFAMA, BoJ, Investment Trust Association, Japan.
Japanese households
3.32(1,434)
Renewed interest in Japanese/Asian household assets

21
Daiwa14.8%
Kokusai11.2%Nikko
10.2%
All others22.7%
Shinko2.0%
Mizuho2.7%
Sumitomo Mitsui2.3%
Mitsubishi UFJ6.5%
Pictet2.8%
DIAM2.8%
Nomura22.0%
Leading share in retail business in Japan
Retail client assets stood at 58 trillion yen at the end of December 2008, representing over 30% share of risk assets held by retail investors in Japan
Retail client assets and risk assets held by individualsRetail client assets and risk assets held by individuals Share of public investment trust marketShare of public investment trust market
・それ、野村にきいてみよう。
Assets under management in public investment trusts (total for all managers of 51.4 trillion yen as at end Mar. 2009)
Note: Retail client assets include some corporate client assets. Individual risk assets is total of equities, bonds, and investment trusts included in personal financial assets in Japan. Calculated by Nomura based on Bank of Japan data. Domestic retail client assets as of end December 2008 totaled 58.3 trillion yen.
Source: Nomura, based on Investment Trust Association, Japan data.
- Retail client assets/individual risk assets(trillions of yen)
175.1
58.3
0
100
200
300
400
2007.3 2007.6 2007.9 2007.12 2008.3 2008.6 2008.9 2008.12
33.3%
31.7%30.5%30.6%
29.3%28.3%
27.8%28.1%
Individual risk assetsNomura Retail client assets
22
Daiwa SecuritiesDaiwa Securities
Daiwa Securities SMBCDaiwa Securities SMBC
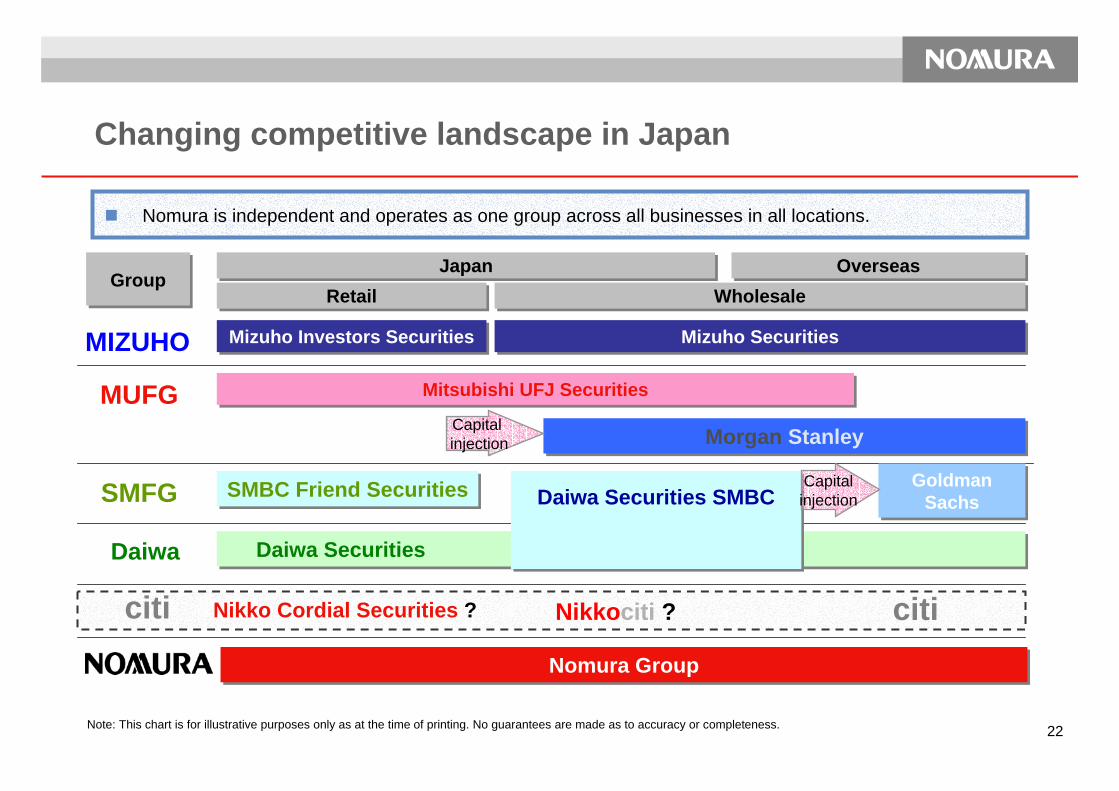
Changing competitive landscape in Japan
JapanJapan OverseasOverseas
RetailRetail WholesaleWholesaleGroupGroup
Nomura is independent and operates as one group across all businesses in all locations.
MUFG
SMFG
MIZUHO
Mitsubishi UFJ SecuritiesMitsubishi UFJ Securities
Morgan StanleyMorgan Stanley
SMBC Friend SecuritiesSMBC Friend Securities
Nikko Cordial Securities ? Nikkociti ?citi
Mizuho Investors SecuritiesMizuho Investors Securities
Daiwa
citi
Goldman Sachs
Goldman Sachs
Capitalinjection
Mizuho SecuritiesMizuho Securities
Capital injection
Note: This chart is for illustrative purposes only as at the time of printing. No guarantees are made as to accuracy or completeness.
Nomura GroupNomura Group

23
Face-to-face servicesNon face-to-face services
Col
labo
ratio
nIn
-hou
se s
ervi
ces
In addition to Merrill Lynch approach with strengths in affluent category, expand to multi-channel approaches such as Schwab and Fidelity.
Nomura model• Expand customer access points, enhance face-to-face business through
training and development.
• Offer sophisticated products and services through open architecture.
• Reorganize online and call center services with possible integration of Joinvest.
• Collaborate with regional banks through affiliation with Daiko Clearing Services Corporation.
• Expand business aimed at salaried workers through Employees Services Dept.
Merrill Lynch approach• Comprehensive face-to-face financial consulting in teams.
• Focus on affluent investors with over $1m.
• Integrated asset management services including savings, loans, and credit cards.
Charles Schwab approach• Moving from online to multi-pronged approach incorporating face-to-face,
online, and call center services.
• Using independent advisors to expand services beyond online client base.
• Wide product offering based on open architecture.
Fidelity approach• Strong IT platform including planning tools, etc.
• Leveraging online and call center infrastructure to expand into bank and ESOP channels.
• Provides sales support to banks and small and medium sized brokers.
HNW
(Y80tn market)
Affluent (Y250tn market)
Asset builders (Y1,170tn market)
Merrill Lynch model
Charles Schwab and Fidelity models
Note: Market size/segmentation figures from Nomura Research Institute, Ltd. Values shown are total financial assets held by each category.
Retail growth strategy
24
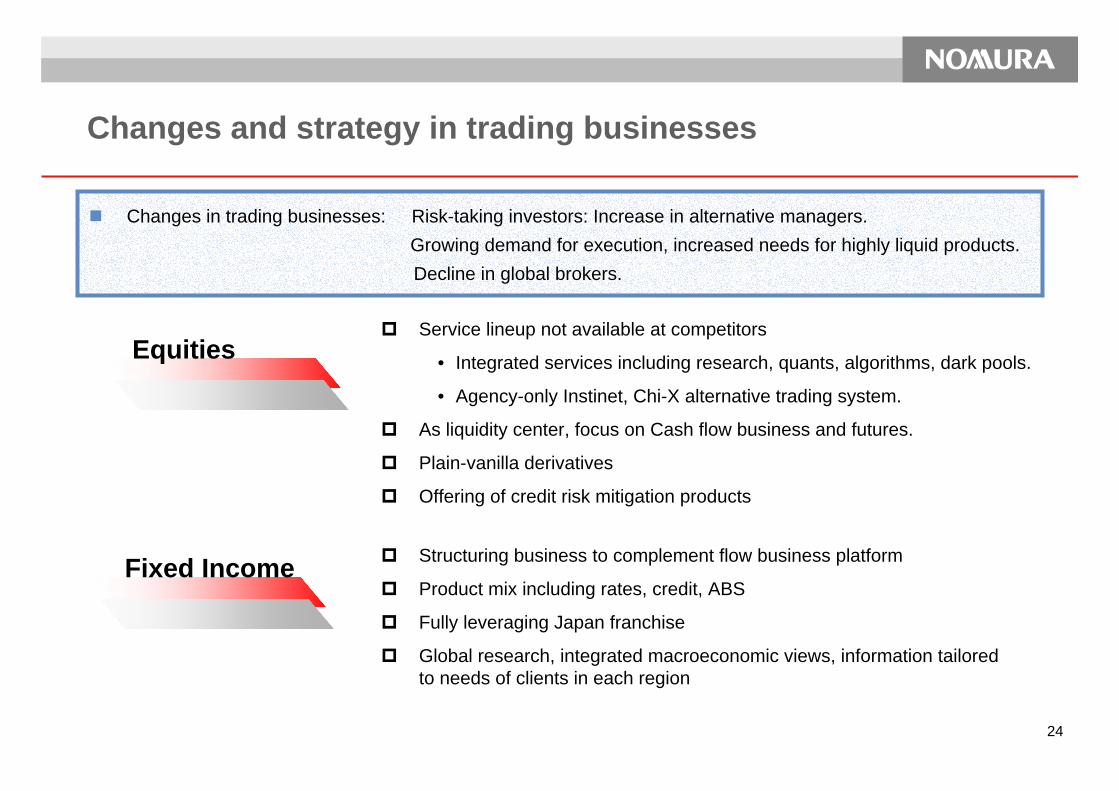
Changes and strategy in trading businesses
Service lineup not available at competitors
• Integrated services including research, quants, algorithms, dark pools.
• Agency-only Instinet, Chi-X alternative trading system.
As liquidity center, focus on Cash flow business and futures.
Plain-vanilla derivatives
Offering of credit risk mitigation products
Fixed Income Structuring business to complement flow business platform
Product mix including rates, credit, ABS
Fully leveraging Japan franchise
Global research, integrated macroeconomic views, information tailored to needs of clients in each region
Changes in trading businesses: Risk-taking investors: Increase in alternative managers.Growing demand for execution, increased needs for highly liquid products.Decline in global brokers.
Equities
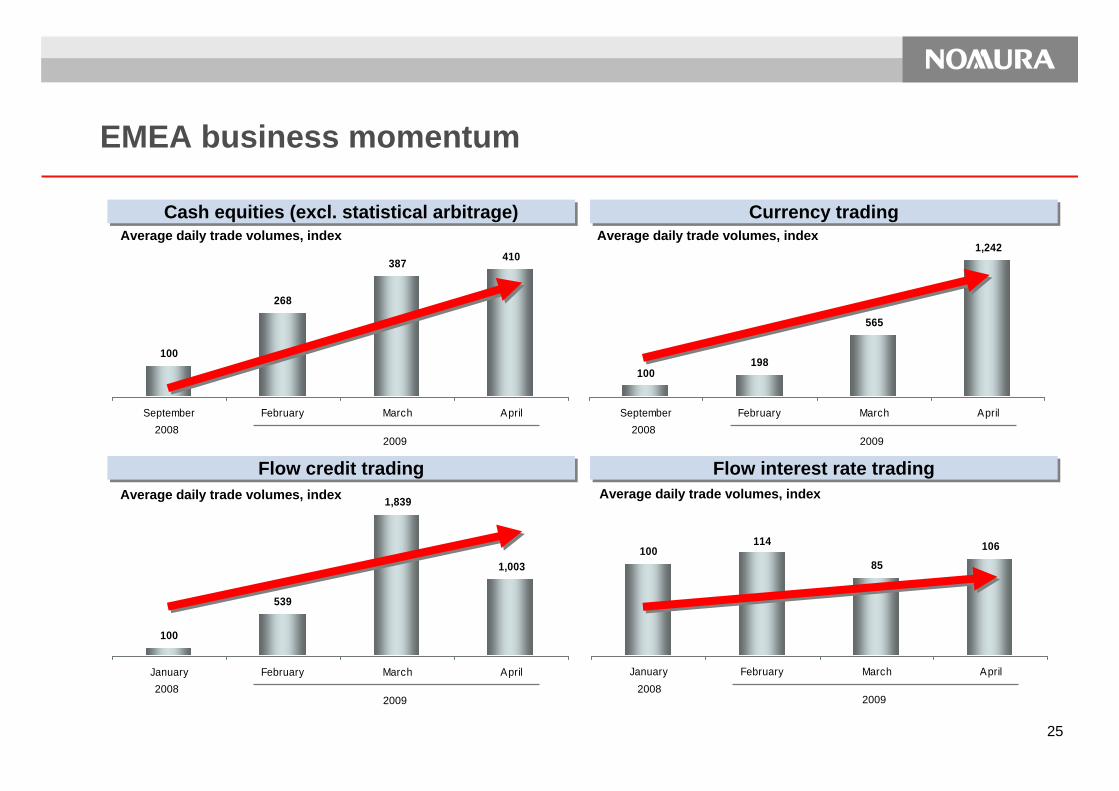
25
100
539
1,839
1,003
January February March April
100114
85106
January February March April
EMEA business momentum
100
268
387 410
September February March April
Average daily trade volumes, index
20092008
100198
565
1,242
September February March April
Average daily trade volumes, index
20092008
Average daily trade volumes, index
20092008
Average daily trade volumes, index
20092008
Cash equities (excl. statistical arbitrage)Cash equities (excl. statistical arbitrage) Currency tradingCurrency trading
Flow credit tradingFlow credit trading Flow interest rate tradingFlow interest rate trading
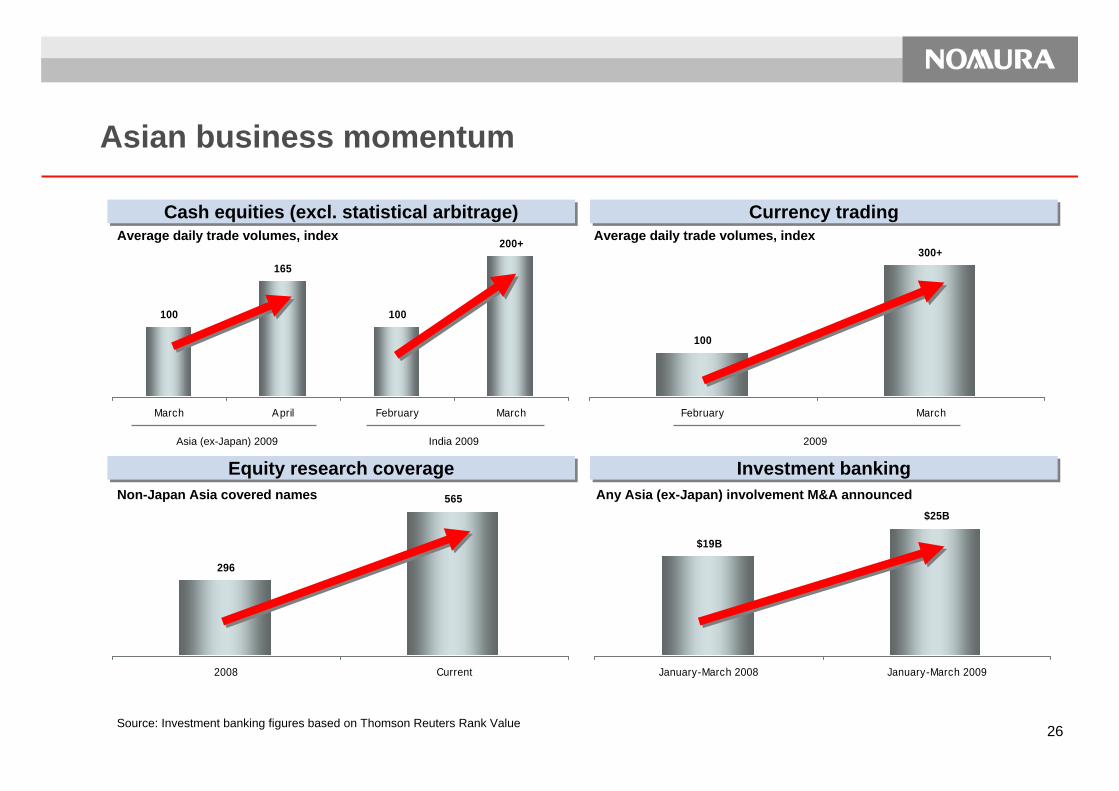
26
$25B
$19B
January-March 2008 January-March 2009
296
565
2008 Current
Asian business momentum
100
165
100
200+
March April February March
Average daily trade volumes, index
Asia (ex-Japan) 2009
100
300+
February March
Average daily trade volumes, index
2009
Non-Japan Asia covered names Any Asia (ex-Japan) involvement M&A announced
Cash equities (excl. statistical arbitrage)Cash equities (excl. statistical arbitrage) Currency tradingCurrency trading
Equity research coverageEquity research coverage Investment bankingInvestment bankingIndia 2009
Source: Investment banking figures based on Thomson Reuters Rank Value
27
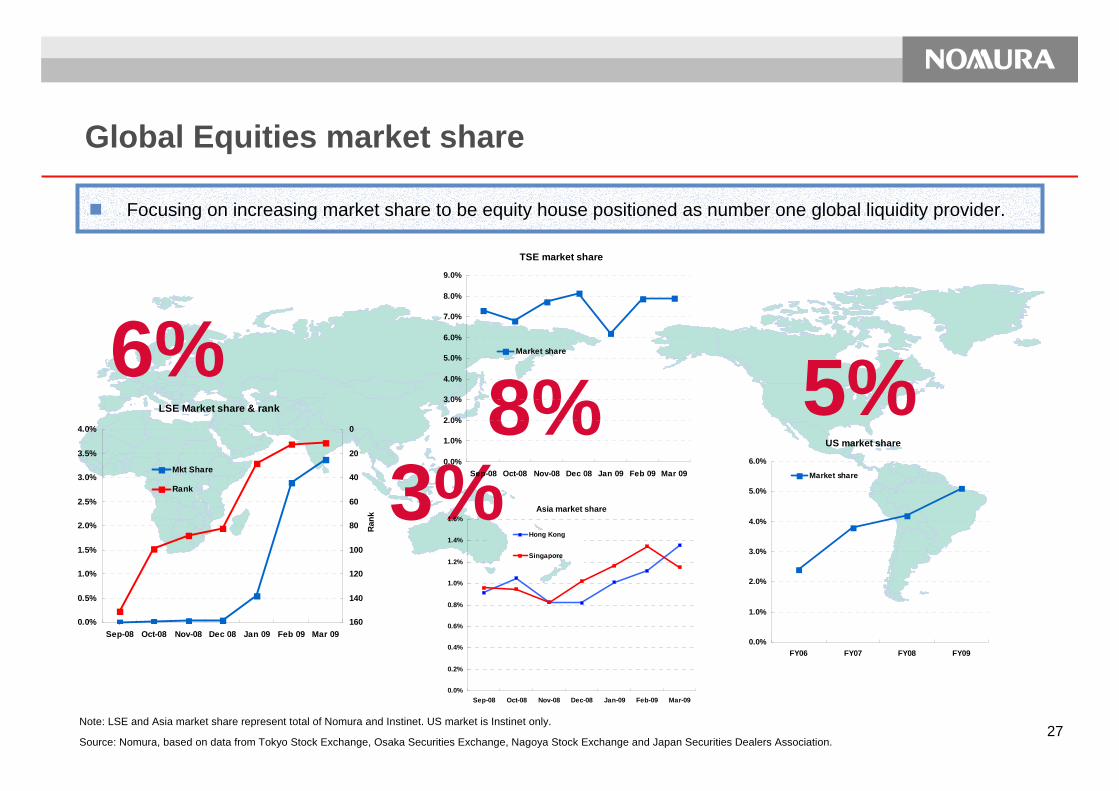
5%6%8%
Focusing on increasing market share to be equity house positioned as number one global liquidity provider.
3%
Note: LSE and Asia market share represent total of Nomura and Instinet. US market is Instinet only.
Source: Nomura, based on data from Tokyo Stock Exchange, Osaka Securities Exchange, Nagoya Stock Exchange and Japan Securities Dealers Association.
TSE market share
0.0%
1.0%
2.0%
3.0%
4.0%
5.0%
6.0%
7.0%
8.0%
9.0%
Sep-08 Oct-08 Nov-08 Dec 08 Jan 09 Feb 09 Mar 09
Market share
Asia market share
0.0%
0.2%
0.4%
0.6%
0.8%
1.0%
1.2%
1.4%
1.6%
Sep-08 Oct-08 Nov-08 Dec-08 Jan-09 Feb-09 Mar-09
Hong Kong
Singapore
US market share
0.0%
1.0%
2.0%
3.0%
4.0%
5.0%
6.0%
FY06 FY07 FY08 FY09
Market share
Global Equities market share
LSE Market share & rank
0.0%
0.5%
1.0%
1.5%
2.0%
2.5%
3.0%
3.5%
4.0%
Sep-08 Oct-08 Nov-08 Dec 08 Jan 09 Feb 09 Mar 09
0
20
40
60
80
100
120
140
160
Rank
Mkt Share
Rank

28
Possible rise in M&A with global trend towards consolidation
Financials, health care, many other sectors seeing accelerated global consolidation. Healthy Asian corporates becoming more active acquirers.Nomura traditionally strong in Asia, fast gaining ground in cross-border deals by leveraging global franchise.
Cross-border M&A deals by sector (Jan. – Apr. 14, 2009)Cross-border M&A deals by sector (Jan. – Apr. 14, 2009)
Health Care10%
General ConsumerGoods
9%
Telecom9%
Materials7%
Real estate
2%Tech 3%
Industrial 5%
Energy/Electricity12%
Durable goods/svcs
2%
Media/Ent 1%Retail
1%Govt 0%
Finance39%Deal Value
1.3 tn USD
Source: Thomson Reuters
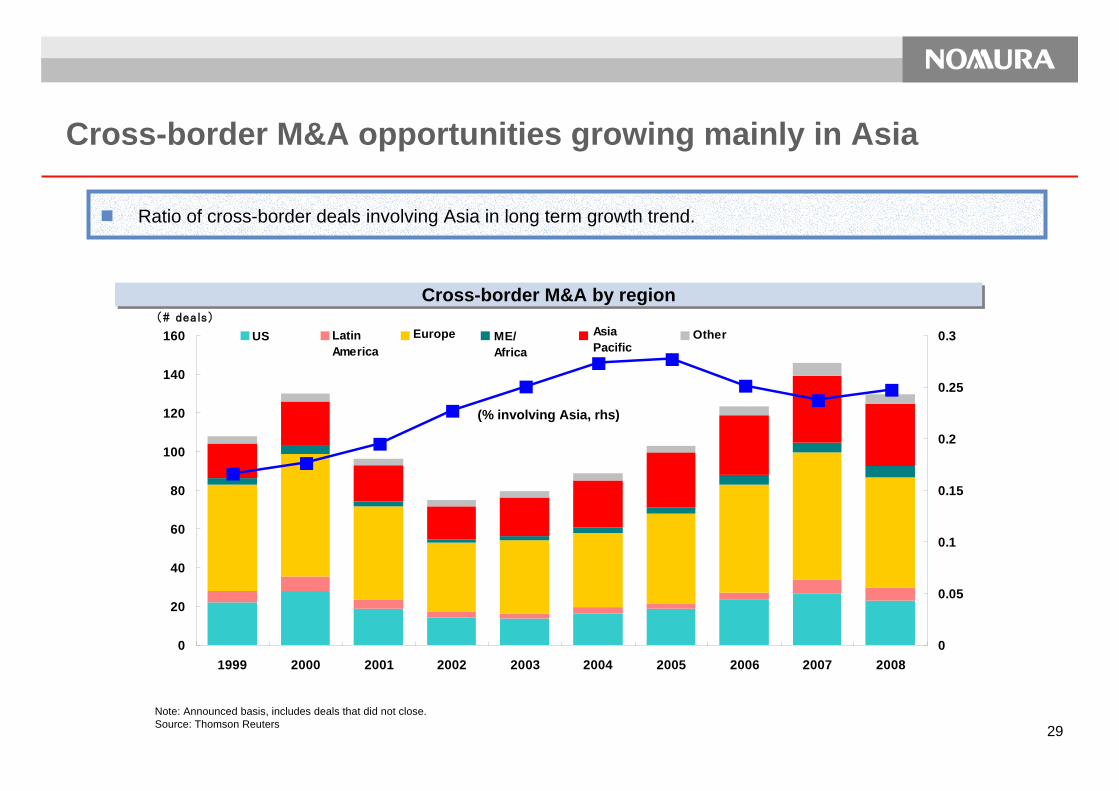
29
Cross-border M&A opportunities growing mainly in Asia
Cross-border M&A by regionCross-border M&A by region
Ratio of cross-border deals involving Asia in long term growth trend.
0
20
40
60
80
100
120
140
160
1999 2000 2001 2002 2003 2004 2005 2006 2007 2008
(# deals)
0
0.05
0.1
0.15
0.2
0.25
0.3北米 南米 欧州 アフリカ・中東
アジア・太平洋
その他US LatinAmerica
Europe ME/Africa
AsiaPacific
Other
Note: Announced basis, includes deals that did not close.Source: Thomson Reuters
(% involving Asia, rhs)
30
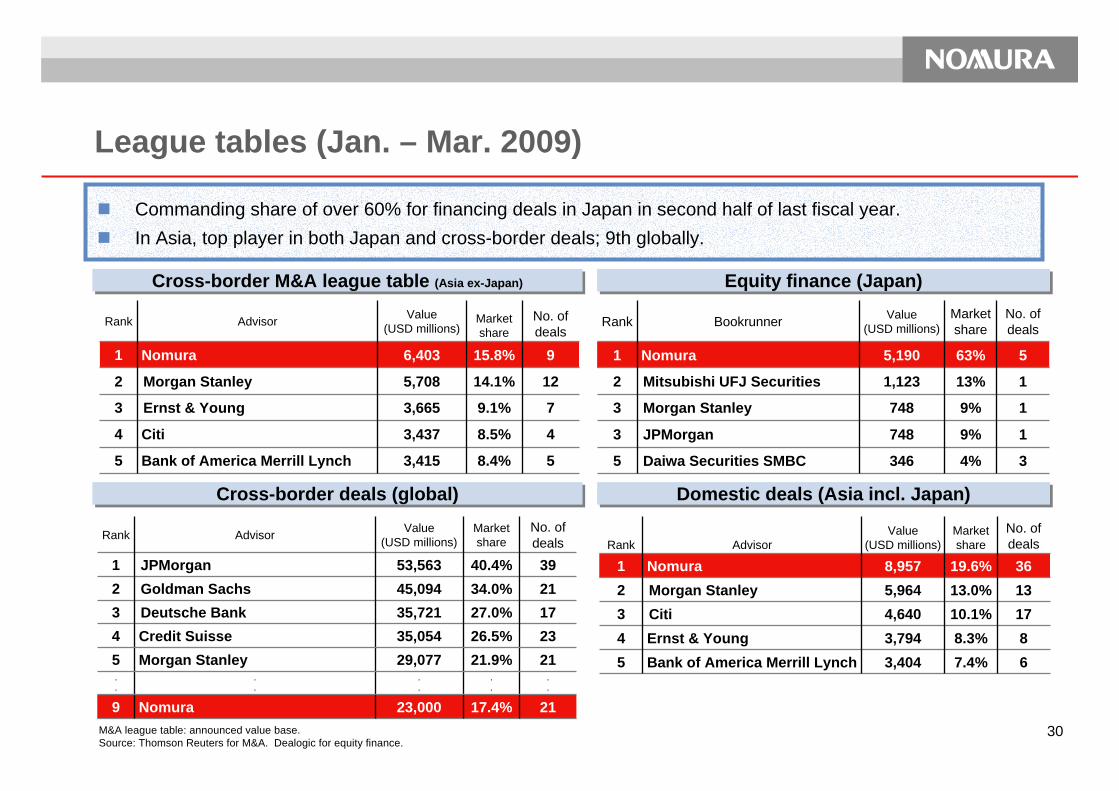
League tables (Jan. – Mar. 2009)
M&A league table: announced value base.Source: Thomson Reuters for M&A. Dealogic for equity finance.
.
...
.
...
.
.
2326.5%35,054Credit Suisse 42121.9%29,077Morgan Stanley5
17.4%
27.0%34.0%40.4%
Market share
9
321
Rank
21
172139
No. of deals
Value(USD millions)Advisor
23,000Nomura
35,721Deutsche Bank 45,094Goldman Sachs 53,563JPMorgan
4%
9%
9%
13%
63%
Market share
3
1
1
1
5
No. of deals
5
3
3
2
1
Rank Value(USD millions)Bookrunner
346Daiwa Securities SMBC
748JPMorgan
748Morgan Stanley
1,123Mitsubishi UFJ Securities
5,190Nomura
Equity finance (Japan)Equity finance (Japan)Cross-border M&A league table (Asia ex-Japan)Cross-border M&A league table (Asia ex-Japan)
Cross-border deals (global)Cross-border deals (global) Domestic deals (Asia incl. Japan)Domestic deals (Asia incl. Japan)
7.4%8.3%
10.1%13.0%19.6%
Market share
54321
Rank
68
171336
No. of deals
Value(USD millions)Advisor
3,404Bank of America Merrill Lynch3,794Ernst & Young 4,640Citi5,964Morgan Stanley 8,957Nomura
8.4%
8.5%
9.1%
14.1%
15.8%
Market share
5
4
3
2
1
Rank
5
4
7
12
9
No. of deals
Value(USD millions)Advisor
3,415Bank of America Merrill Lynch
3,437Citi
3,665Ernst & Young
5,708Morgan Stanley
6,403Nomura
Commanding share of over 60% for financing deals in Japan in second half of last fiscal year.In Asia, top player in both Japan and cross-border deals; 9th globally.

31
0
20
40
60
80
100
120
140
160
2005 2006 2007 2008 2009推計
国内または海外→中国
中国→海外
(十億ドル)
China emerging as new source of investment banking revenues
Cross-border M&A deals out of China surging in 2009, Nomura has gained top market share.
Note: Announced basis, M&A fee basis.
Value of Chinese M&A dealsValue of Chinese M&A deals
Note: 2009 is Jan. – Mar. annualized, announced basis.
League tables for M&A deals out of ChinaLeague tables for M&A deals out of China
Source: Thomson Reuters
5
4
3
2
1
Rank
3.7%
5.3%
6.3%
6.9%
15.9%
Market shareAdvisor
Morgan Stanley
CITIC
Nomura
Goldman Sachs
JPMorgan
20082008 2009 (Jan.-Mar.)2009 (Jan.-Mar.)
5
4
3
2
1
Rank
6.3%
17.8%
17.8%
17.8%
23.4%
Market shareAdvisor
Deutsche Bank
Blackstone
CIC
JPMorgan
Nomura
Overseas to ChinaChina to overseas
(est.)
(billions of US dollars)
32
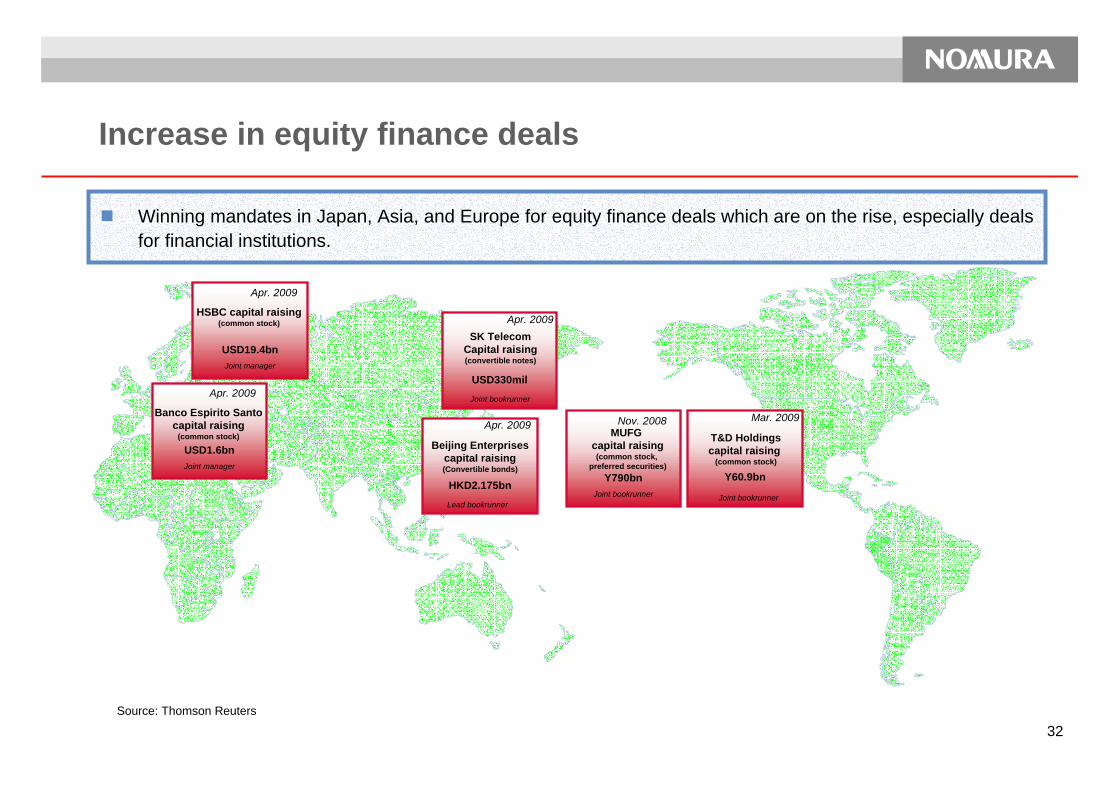
Winning mandates in Japan, Asia, and Europe for equity finance deals which are on the rise, especially deals for financial institutions.
Source: Thomson Reuters
T&D Holdingscapital raising
(common stock)
Y60.9bn
SK TelecomCapital raising(convertible notes)
USD330mil
Beijing Enterprisescapital raising(Convertible bonds)
HKD2.175bn
Increase in equity finance deals
Nov. 2008
Joint bookrunner
MUFG capital raising(common stock,
preferred securities)Y790bn
Apr. 2009
Joint manager
HSBC capital raising(common stock)
USD19.4bn
Apr. 2009
Joint manager
Banco Espirito Santocapital raising
(common stock)
USD1.6bn
Joint bookrunner
Mar. 2009
Apr. 2009
Apr. 2009
Joint bookrunner
Lead bookrunner

33
Multi-product approach
M&A Advisory
Risk mitigation solutions
Acquisition finance Take-
out finance
Complete client
solution
M&A Advisory
Financial Advisor to Carlsberg & Joint Advisor
to Consortium
£10.7 billion
Acquisition Finance
Mandated Lead Arranger, Joint Bookrunner
Acquisition of S&N assets for EV £5.8bn Acq
Debt Facilities
Risk Mitigation solutions
April 2008
Sole structuring advisor
Take-out Finance
May 2008
DKK 30.5bn (~$6.9bn)
1 for 1 Rights Issue
DKK 15.7bn (~$3.3bn) Carlsberg Foundation
Placement
$10.2 billion
April 2008
April 2008
CarlsbergCarlsberg HeinekenHeinekenS&NS&N
CarlsbergCarlsberg HeinekenHeinekenS&NS&N
CarlsbergCarlsberg
CarlsbergCarlsberg

34
5.4 5.9
3.1 3.21.8 1.7 2.3
7.6 6.8
6.64.9
5.63.7
0.5
13.0 12.6
9.6
8.07.4
5.4
2.8
0
2
4
6
8
10
12
14
GoldmanSachs
Citigroup MorganStanley
Merill Lynch JP Morgan LehmanBrothers
Nomura
欧州
アジア(含む日本)
(十億ドル)(10億ドル)
Merrill Lynch
Medium term growth strategy for wholesale business
Expand business scope from Japan market focus to EAFE mandate market.Become top tier global wholesale player.
Revenues from wholesale business (FY03 - FY07 av.)Revenues from wholesale business (FY03 - FY07 av.)Market capitalization of Japan and EAFE (5-yr av.)Market capitalization of Japan and EAFE (5-yr av.)
Source: Five year average of market capitalization at end of December using MSCI country weight.
EAFE: Europe, Australasia, Far East.
Source: Nomura, based on annual reports of competitors where comparison possible. Annual revenues from wholesale business, except Morgan Stanley which shows revenues from entire business.
Note: Years ended November for Goldman Sachs, Morgan Stanley, and Lehman Brothers. Years ended December for Citigroup and JPMorgan. Years ended March the following year for Nomura. JPMorgan revenues used for 2005 and 2006 are as announced in 2007.
EAFE10,740
Japan2,442
(billions of US dollars) 13.0 12.6
9.6
8.0
5.4
7.4
2.8
(billions of US dollars) EuropeAsia (incl. Japan)
35
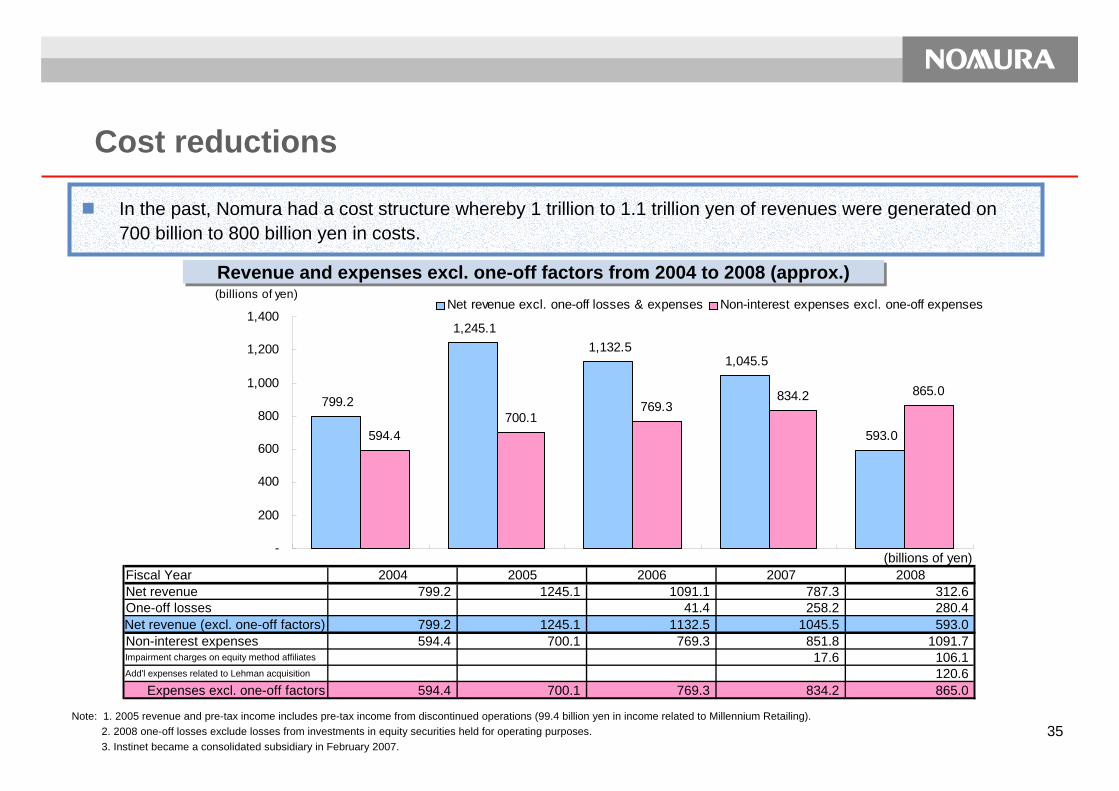
Cost reductions
In the past, Nomura had a cost structure whereby 1 trillion to 1.1 trillion yen of revenues were generated on 700 billion to 800 billion yen in costs.
Note: 1. 2005 revenue and pre-tax income includes pre-tax income from discontinued operations (99.4 billion yen in income related to Millennium Retailing).2. 2008 one-off losses exclude losses from investments in equity securities held for operating purposes. 3. Instinet became a consolidated subsidiary in February 2007.
Revenue and expenses excl. one-off factors from 2004 to 2008 (approx.)Revenue and expenses excl. one-off factors from 2004 to 2008 (approx.)
799.2
1,245.11,132.5
1,045.5
593.0594.4700.1
769.3834.2 865.0
-
200
400
600
800
1,000
1,200
1,400
(billions of yen)Net revenue excl. one-off losses & expenses Non-interest expenses excl. one-off expenses
(billions of yen)Fiscal Year 2004 2005 2006 2007 2008Net revenue 799.2 1245.1 1091.1 787.3 312.6One-off losses 41.4 258.2 280.4Net revenue (excl. one-off factors) 799.2 1245.1 1132.5 1045.5 593.0Non-interest expenses 594.4 700.1 769.3 851.8 1091.7Impairment charges on equity method affiliates 17.6 106.1Add'l expenses related to Lehman acquisition 120.6
Expenses excl. one-off factors 594.4 700.1 769.3 834.2 865.0
36
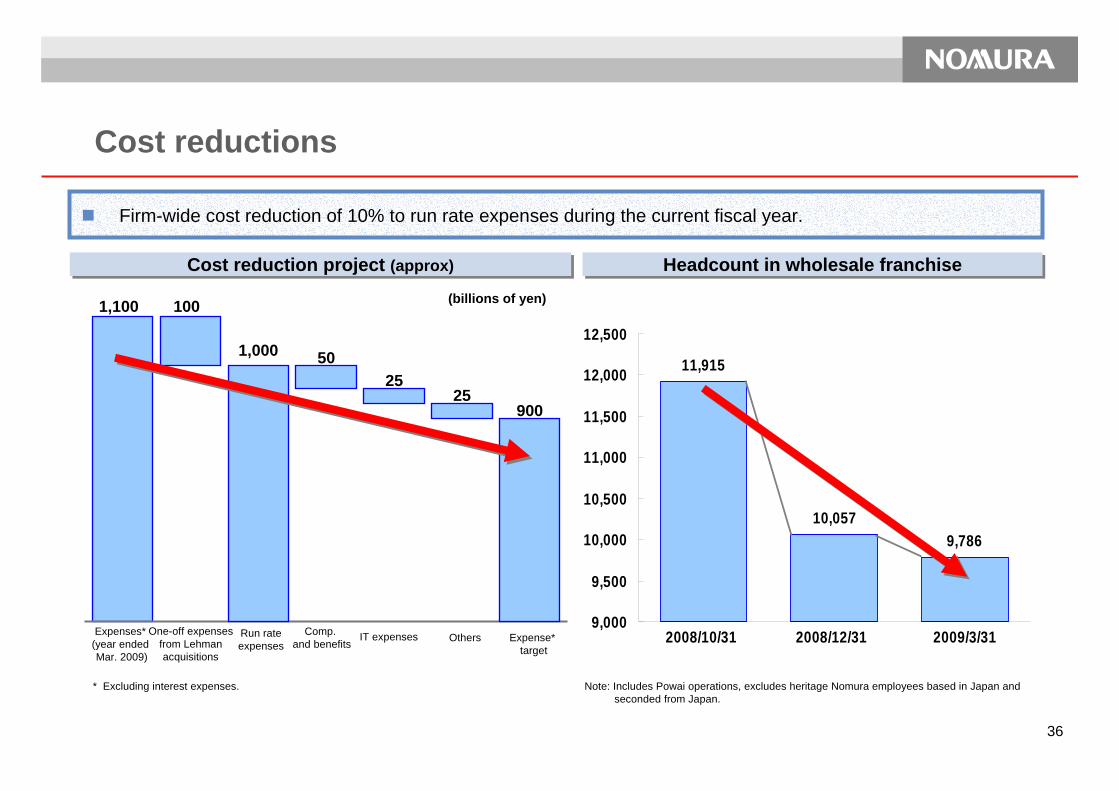
Cost reduction project (approx)Cost reduction project (approx)
Firm-wide cost reduction of 10% to run rate expenses during the current fiscal year.
Headcount in wholesale franchiseHeadcount in wholesale franchise
Note: Includes Powai operations, excludes heritage Nomura employees based in Japan and seconded from Japan.
1,100
Expenses* (year ended Mar. 2009)
(billions of yen)100
One-off expensesfrom Lehman acquisitions
Run rate expenses
1,000 50
Comp. and benefits
2525
IT expenses Others
900
Expense* target
11,915
10,0579,786
9,000
9,500
10,000
10,500
11,000
11,500
12,000
12,500
2008/10/31 2008/12/31 2009/3/31
* Excluding interest expenses.
Cost reductions

37
1.
Current Environment2.
4. In Closing
Focus for Current Fiscal Year3.
Review of Last Fiscal Year
38
A financial services group with world-class competitiveness
Create change to contribute to the development of the capital markets and generate growth opportunities
Act as a bridge between Asia and Europe/US
Create changeCreate change WorldWorld--class class SpeedSpeed
Keywords
Management vision
39
Future direction
ClientClient--focusedfocused
BusinessBusiness--drivendriven
Internal momentumInternal momentum

40
Advantage as independent investment bank
Competitors restricted from expanding operations due to public funds or being part of banking conglomerate. Nomura only firm positioned among independents to use balance sheet for underwriting and other businesses.
Banking/Securities conglomerate
Can’t use balance sheet
Can use balance sheet
Public funds
Independent
Private capital
Restrictions on intl. ops and compensation
Uniquely positioned
Limited business restrictions
Capital regulations, conflicts of interest
Note: This chart is for illustrative purposes only as at the time of printing. No guarantees are made as to accuracy or completeness.
41
Nomura Holdings, Inc.www.nomura.com