Noise within a Data Center - Ruđer Bošković Institute · 1352 MIPRO 2016/CTS Noise within a Data...
6
1352 MIPRO 2016/CTS Noise within a Data Center Dubravko Miljković Hrvatska elektroprivreda, Zagreb, Croatia [email protected] Abstract - Data centers with its numerous servers, network switches, routers and air conditioning equipment produce significant noise that influences work and communication of maintenance staff. Noise levels and spectrum within a data center are measured and analyzed. Daily and weekly variations of noise levels are also captured. From measured noise levels and spectrum speech intelligibility measures are calculated and communication distances within a data center are determined. The need for noise protection and methods for noise reduction are considered. I. INTRODUCTION Work in a data center exposes staff to some suboptimal working conditions. Noise, temperature and air circulation are three of the biggest environmental issues that data center workers face. Air-condition and equipment cooling fans necessary for the proper operation of IT equipment run continuously and create excessive noise that influence comfort, poses risk to hearing and impairs communication and concentration. With the introduction of smaller hardware, data center is even more densely populated and noise inside is becoming louder. Constant humming of air-conditioners and servers within a data center may create noise sometimes in excess of 80 dBA. Although maximum acceptable 8 hour exposure level in most countries is set at 85 dBA, as 10% of the level that does not show any effect (NOEL - No Observed Effect Level), this level is far above levels prescribed for mentally demanding work and office environment. II. SOURCES OF DATA CENTER NOISE Data centers consist of servers, routers, switches, storages, tape systems, UPS and cooling equipment (HVAC – Heat Ventilation Air Condition). Main sources of data center noise are shown in Fig. 1. HVAC with its supply ventilation ducts is a single main source of a data center noise, with noise level typically about 70 dBA. Within IT equipment main contributors to data center noise are cooling fans installed in numerous servers, routers, switches and storages, although some minor noise comes from disks, tape drives, transformers and human Figure 1. Main sources of data center noise intervention. Individual servers produce noise levels in a 40-70 dBA range, depending on the brand and size, [1]. The sound power (not SPL) of centrifugal and axial fans (such are used in HVAC ventilation ducts) is given by (1), [2]: N W W C BFI P Q K L 10 10 log 20 log 10 (1) where L W sound power level K W specific sound power level depending on a type of fan (obtained from manufacturer data) Q volume flow rate P total pressure (inches of H 2 O) BFI blade frequency increment, correction for pure tone (obtained from the graphs) C N efficiency correction (out of optimum flow conditions, obtained in tables) When there are hundreds of servers, with hundreds of cooling fans, noise levels are considerably higher than in the case of one server. Considering them as noise sources that are not coherent, level difference is given by (2): ΔL = 10 × log n (2) where ΔL is the level difference n is the number of equally loud noise sources Permissible Exposure Time for various noise levels (according to NIOSH) may be calculated using (3), [3]. t = 480 / 2 (L - 85)/3 (3) where t is maximum exposure duration (seconds) L is noise exposure level (dBA) 3 is exchange rate (dBA), i.e. for noise level increase of 3 dBA, permissible exposure time is cut in half Permissible exposure time for noise - guidelines for level and duration (time) are shown in Table I, [4]. Noise exposure level/times exceeding those shown in table require use of hearing protection. When considering working conditions for technicians and visitors in a data center, high noise levels influence not only hearing and communication but negatively influence concentration needed for performing complex cognitive tasks. Some kind of protection may be needed, especially for workers working long shifts to increase concentration, comfort and TABLE I. PERMISSIBLE TIME EXPOSURE Level, dBA 85 88 90 92 94 95 100 105 110 115 OSHA PEL 16 8 4 2 1 0,5 0,25 NIOSH REL 8 4 1 0,25 Duration (in hours) of allowable exposure based on OSHA and NIOSH criteria. PEL = Permissible Exposure Limit; REL = Recommended Exposure Limit
Transcript of Noise within a Data Center - Ruđer Bošković Institute · 1352 MIPRO 2016/CTS Noise within a Data...

1352 MIPRO 2016/CTS
Noise within a Data Center
Dubravko Miljković Hrvatska elektroprivreda, Zagreb, Croatia
Abstract - Data centers with its numerous servers, network switches, routers and air conditioning equipment produce significant noise that influences work and communication of maintenance staff. Noise levels and spectrum within a data center are measured and analyzed. Daily and weekly variations of noise levels are also captured. From measured noise levels and spectrum speech intelligibility measures are calculated and communication distances within a data center are determined. The need for noise protection and methods for noise reduction are considered.
I. INTRODUCTION
Work in a data center exposes staff to some suboptimal working conditions. Noise, temperature and air circulation are three of the biggest environmental issues that data center workers face. Air-condition and equipment cooling fans necessary for the proper operation of IT equipment run continuously and create excessive noise that influence comfort, poses risk to hearing and impairs communication and concentration. With the introduction of smaller hardware, data center is even more densely populated and noise inside is becoming louder. Constant humming of air-conditioners and servers within a data center may create noise sometimes in excess of 80 dBA. Although maximum acceptable 8 hour exposure level in most countries is set at 85 dBA, as 10% of the level that does not show any effect (NOEL - No Observed Effect Level), this level is far above levels prescribed for mentally demanding work and office environment.
II. SOURCES OF DATA CENTER NOISE
Data centers consist of servers, routers, switches, storages, tape systems, UPS and cooling equipment (HVAC – Heat Ventilation Air Condition). Main sources of data center noise are shown in Fig. 1. HVAC with its supply ventilation ducts is a single main source of a data center noise, with noise level typically about 70 dBA. Within IT equipment main contributors to data center noise are cooling fans installed in numerous servers, routers, switches and storages, although some minor noise comes from disks, tape drives, transformers and human
Figure 1. Main sources of data center noise
intervention. Individual servers produce noise levels in a 40-70 dBA range, depending on the brand and size, [1].
The sound power (not SPL) of centrifugal and axial fans (such are used in HVAC ventilation ducts) is given by (1), [2]:
NWW CBFIPQKL 1010 log20log10 (1)
where LW sound power level KW specific sound power level depending on a type
of fan (obtained from manufacturer data) Q volume flow rate P total pressure (inches of H2O) BFI blade frequency increment, correction for pure
tone (obtained from the graphs) CN efficiency correction (out of optimum flow
conditions, obtained in tables) When there are hundreds of servers, with hundreds of
cooling fans, noise levels are considerably higher than in the case of one server. Considering them as noise sources that are not coherent, level difference is given by (2):
ΔL = 10 × log n (2) where
ΔL is the level difference n is the number of equally loud noise sources
Permissible Exposure Time for various noise levels (according to NIOSH) may be calculated using (3), [3].
t = 480 / 2(L - 85)/3 (3) where
t is maximum exposure duration (seconds) L is noise exposure level (dBA) 3 is exchange rate (dBA), i.e. for noise level increase of 3 dBA, permissible exposure time is cut in half
Permissible exposure time for noise - guidelines for level and duration (time) are shown in Table I, [4]. Noise exposure level/times exceeding those shown in table require use of hearing protection. When considering working conditions for technicians and visitors in a data center, high noise levels influence not only hearing and communication but negatively influence concentration needed for performing complex cognitive tasks. Some kind of protection may be needed, especially for workers working long shifts to increase concentration, comfort and
TABLE I. PERMISSIBLE TIME EXPOSURE
Level, dBA 85 88 90 92 94 95 100 105 110 115 OSHA PEL 16 8 4 2 1 0,5 0,25 NIOSH REL 8 4 1 0,25 Duration (in hours) of allowable exposure based on OSHA and NIOSH criteria. PEL = Permissible Exposure Limit; REL = Recommended Exposure Limit

MIPRO 2016/CTS 1353
prevent undesirable extra-aural effects (influence on the autonomous system), [5]. When noise levels exceed 85 dBA, hearing conservation programs are required. This includes baseline audiometric testing, noise level monitoring or dosimetry, noise hazard signage, education and training, [6]. Once levels exceed 87 dBA (in Europe) or 90 dBA (in the US), further measures are required like use of hearing protection, rotation of employees, or engineering controls must be taken, [6].
III. SPEECH COMMUNICATION UNDER NOISY
CONDITIONS
During various installation and maintenance works communication between staff is of utter importance. Normal conversation tends to occupy 60-70 dBA range. Speech communication in data center is degraded by the masking effect of the background noise and changes in vocal effort are necessary for various background noise levels, [7], as shown in Fig. 2, [8], and Table II.
Figure 2. Long-term spectrum of speech under various vocal efforts (adopted from [8])
TABLE II. SPEECH LEVELS AT VARIOUS VOCAL EFFORTS
Voice Average level dB/dBA Casual 52.0/42.0 Normal 57.0/47.0 (private speech) Raised 64.0/57.0 Loud 73.0/62.0 Shout 85.0/72.0
Auditory masking is intrusion of unwanted sounds that interfere with the speech signal. Masking effect of data center noise in spectral domain is illustrated in Fig. 3-5. When the low-frequency noise is louder than the
Figure 3. Spectrogram of speech (‘Noise within a data center’)
Figure 4. Spectrogram of data center noise
Figure 5. Spectrogram speech plus data center noise combined
speech signal it effectively masks speech. At high sound pressure levels such noise effectively masks both vowels and consonants. High-frequency noise masks only the consonants, and its masking effectiveness decreases as the noise gets louder, [9]. Noise exposure levels in a data center afford less than desired intelligibility (< 95%).
IV. DATA CENTER NOISE MEASUREMENTS
Noise measurements were performed in mid-size corporate data center, of surface area about 170 m2. IT equipment installed within a data center is listed in Table III. Temperature inside a data center is kept in 21-22 °C range with separate cabinet cooling systems blowing out air at 18-19 °C.
TABLE III. IT EQUIPMENT WITHIN A DATA CENTER
Type Number of devices Server (physical) 120
Storage 5 Tape subsystem 3
Routers/ Switches 15 Cabinet Cooling System 10
A. Measuring Equipment
Noise levels were measured using the CEM DR-805 Sound Meter. A-level weighting was used due to high correlation with people’s subjective judgment of the loudness. Noise signals were recorded at 44.1 kHz sampling frequency and 16-bit resolution, using simple Ednet Desktop Microphone with 30 Hz-16 kHz range, HP ProBook 6570b laptop computer with internal audio card and YMEC sound measurement and analyzing software.

1354 MIPRO 2016/CTS
Figure 6. Data center schematic
B. Measured Noise Levels
Noise was measured at 19 different places, 15 in a data center and 4 in accompanying spaces (console room, archive, operators room and at the entrance hall) shown in data center schematic, Fig. 6. All noise measurements were performed at the head level while in standing position. Measurement results are shown in Table IV. Noise level depends if it is measured in a cold or hot aisle. The lowest level in a data center was around 70 dBA and the highest slightly above 80 dBA. Similar values are common in data centers, [10]. Higher levels were measured in hot aisles (where cooling air gets out of servers). The highest level was measured near routers with particularly noisy cooling fans. These levels are bellow maximum acceptable levels. However repeated exposure to noise levels between 75 and 85 dBA may pose a small risk to some people, [11]. Being so close to the limit and considering excess risk of long term exposure, [4], it may be wise to take no chances and wear some hearing protection. Noise in accompanying spaces was much lower (under 60 dBA). Although this is much less than in data center and staff got used to it, prolonged stay is still quite unpleasant for unaccustomed visitors.
C. Noise Spectrum
Spectrum of data center noise is shown in Fig. 7. Please note harmonic content at frequency range from 150 Hz up to 1.5 kHz that originates from air condition
TABLE IV. NOISE LEVELS AT VARIOUS POSITIONS
Position Description, contributing sources in aisle dBA 1 Servers, storage, cabinet cooling system 76,2 2 Servers, storage, cabinet cooling system 76,1 3 Servers, storage, cabinet cooling system 79,2 4 Servers, storage, cabinet cooling system 76,9 5 Servers, storage, cabinet cooling system 78,1 6 Servers, cabinet cooling system 79,1 7 Servers, storage, cabinet cooling system 74,2 8 Servers, cabinet cooling system 75,0 9 Servers, cabinet cooling system 74,7 10 Servers, cabinet cooling system 73,9 11 Servers, cabinet cooling system 70,9 12 Servers, cabinet cooling system 70,9 13 Routers 75,2 14 Routers 80,3 15 Fire central (alarm and dischargers) 70,7 16 Console room 57,8 17 Archive 55,6 18 Operators room 58,5 19 Entrance hall 58,3
and IT equipment cooling fans. These fans operate at discrete frequencies, and certain frequencies like blade passing frequency (BPF), have more power than others. BPF is the product of the fan rotation speed and the number of fan blades, (4), [2]:
60BR NN
BPF (4)
where BPF is the basic frequency of fan tonal components, NR is the fan rotation speed (rotations per minute, RPM) and NB is the number of fan blades. Numerous harmonics are present as multiples of BPF. There is also a considerable noise in a frequency range of 2-7 kHz due to the turbulent air flow produced by the fans. Above 7 kHz noise rapidly diminishes.
Figure 7. Spectrum of data center noise
D. Daily and Weekly Variations
Data centers have its temperature fluctuations that may indirectly (due to different cooling requirements) influence noise levels. This includes:
daily variation caused by daily swings in the IT load and outdoor temperature
day-to-day variation caused by the weather IT load reduction on weekends
Daily noise variations measured at position 3 in data center schematic from Fig. 6, are shown in Fig. 8.

MIPRO 2016/CTS 1355
Figure 8. Daily noise variations (linear amplitude scale, working day)
Noise level is quite constant with occasional spikes
due to human influence (opening data center doors, opening server cabinets, loud communication etc.). Noise levels averaged in four hour periods are shown in Table V. Summary of daily variations, but averaged over 5s period are given in Table VI. Weekly noise variations of daily averages are given in Table VII.
TABLE V. DAILY NOISE VARIATIONS
Noise level (4 hour average) dBA
0-4 4-8 8-12 12-16 16-20 20-24 79,4 79,4 79,3 79,3 79,4 79,4
TABLE VI. DAILY NOISE VARIATIONS – SUMMARY
Noise level (5s average) dBA
min max aver 78.5 88.3 79.4
TABLE VII. WEEKLY NOISE VARIATIONS – SUMMARY
Noise (daily average) dBA
Sun Mon Thu Wen Thu Fri Sat 79,3 79,3 79,4 79,5 79,4 79,4 79,4
Data center where the measurements have taken place
is working with low utilization of computing resources and main contributor to temperature changes is the weather alone. As can be seen from our particular case, noise variation during a period of one day and week are negligible. In some data centers temperature fluctuations may be up to 9 ºC depending on the time of day, season and the current weather. Much lower temperature excursions (just few degrees) are common in most data centers.
V. MEASURED NOISE LEVELS, SPEECH
INTELIGIBILLITY AND COMMUNICATION DISTANCE
Several noise metrics have evolved for assessing the influence of noise on speech, [12].
A. Speech Interference Level (SIL)
Speech Interference Level is defined as the arithmetic average of the sound pressure levels at 500, 1000, 2000 and 4000 Hz octave bands, (5), [12, 13].
4400020001000500 pppp LLLL
SIL
(5)
A-weighted sound level Lpa correlate well with SIL for most sounds in aviation, [2]. Acceptable results of SIL values maybe derived from A-weighted noise levels by using the following approximate expression, (6), [13]:
10 pALSIL (6)
For data center noise spectral content shown in Fig. 7 and put into (5), more appropriate expression would be (7):
5,12 pALSIL (7)
B. Articulation Index (AI)
Articulation Index (AI) is the value, between 0 and 1.0, which describes the masking of speech by background noise. An AI of 1 means that all speech can be understood, and 0 that no speech can be understood. An AI < 0,05 means very poor speech intelligibility, and an AI > 0.80 good speech intelligibility. AI is found by evaluating the signal to noise ratio in specific frequency bands, [12], according to (8), [14].
30
121
i
n
ii SNRI
AI (8)
where AI is the Articulation Index Ii is the frequency importance function for band i SNR is the Signal-to-Noise Ratio for band i
AI can be calculated from the 1/3 octave band levels between 200 Hz and 6300 Hz center frequencies, using the AI calculator, shown in Fig. 9, [15].
Figure 9. AI Calculator
C. Speech Intelligibility Index (SII)
The Speech Intelligibility Index (SII), [12, 16, 17], is a standardized objective measure which is correlated with the intelligibility of speech under a variety of adverse listening conditions. SII is a function of the long-term average spectrum of the speech and noise signals and is based on the Articulation Index. SII and the AI are not the same thing, but are quite similar. The SII, like the AI, is a quantification of the proportion of speech information that is both audible and usable for a listener. The SII is computed as a product of the frequency band importance function Ii, and the band audibility function Ai, (9).
n
iii AISII
1
(9)
The value of the SII varies from 0 (completely unintelligible) to 1 (perfect intelligibility). SSI can be determined using the SII Calculator, Fig. 10, [17].
Speech intelligibility in a data center is determined according to mentioned intelligibility measures. Values for SIL were determined using (5) and scaling the noise values. In a similar way values for AI and SII were determined using AI and SII calculator (for SII calculator

1356 MIPRO 2016/CTS
Figure 10. SII Calculator
user specified male speech spectrum normalized to 70 dB SPL was supplied). Speech intelligibility values for various noise levels are listed in Table VIII. At levels within a data center, staff have to talk loudly to be heard.
D. Communication Distance
The distance between the talker and listener (i.e. communication distance) is important when the conversation takes place. Speech levels are reduced typically by 6 dB for each distance doubling between the talker and listener. Communication distances for various
values of SIL are shown in Fig. 11, [18], and for various noise levels encountered in a data center in Table VIII.
Figure 11. Communication distance for various values of SIL (adopted from [18])
TABLE VIII NOISE LEVELS, SPEECH INTELLIGIBILITY MEASURES AND
COMMUNICATION DISTANCES
Noise level, dBA
Speech intelligibility1 Communication distance (m) SIL AI SII normal speech loud speech
552 42,5 0,82 0,66 2,6 9,5 602 47,5 0,66 0,53 1,2 4,5 70 57,5 0,34 0,23 0,44 1,6 72 59,5 0,28 0,17 0,35 1,2 74 61,5 0,22 0,12 0,29 1,0 76 63,5 0,17 0,08 0,23 0,76 78 65,5 0,11 0,06 0,18 0,66 80 67,5 0,06 0,04 0,14 0,53 82 69,5 0,03 0,03 0,13 0,44 84 71,5 0,01 0,02 0,10 0,34
1normal speech, 2noise levels at accompanying spaces
VI. POSSIBLE NOISE REDUCTION SOLUTIONS
A. Passive Noise Reduction
Data center with its walls, floors and ceiling surfaces provide little acoustic absorption. Conventional passive acoustic absorption materials are not used because they are highly flammable and may emit particulates that may trigger fire detection sensors, [19]. Materials used in a data center must be properly fire rated and fiber free. They can be mounted on walls and suspended from ceilings preventing reflections, reducing reverberation and preventing noise build up. It is also possible to use sound dampening server cabinets that use acoustic foam.
Passive noise protection headphones may be used for tasks where no communication is needed. Conventional hearing protection or noise protection headphones restrict the workers ability to communicate. If communication among workers is needed, headphones with integrated wireless communication (like Bluetooth) could be used.
B. Active Noise Control
Noise within a data center consists of tonal and broadband components. Tonal components originate from HVAC fans and equipment cooling fans with pronounced discrete spectrum. Broadband component originates from turbulent airflow. Active Noise Control (ANC) is quite successful at eliminating tonal components. Eliminating these low to mid frequency components would greatly reduce the amount of noise present in the data center.
ANC is generally not suitable for noise attenuation in large spaces, but is mostly restricted to generating local zones of silence. ANC over an extended region is not possible in the data center room in general, [20]. This is due to the random nature of the noise and the high modal density of the room itself. If trying to suppress noise within a large space better approach is to attenuate noise at the source itself, like at ends of ventilation ducts.
ANC can be successfully applied for silencing HVAC ventilation ducts, [21, 22], Fig. 12. Ventilation ducts contain low to mid frequency tonal and broadband noise. ANC systems for silencing ventilation ducts have been developed decades ago, but with reduced cost of signal processing hardware are becoming feasible for common use. In laboratory, ANC can achieve 15-25 dB additional noise reduction at frequency range of 50-350 Hz, [21], and values of 10-15 dB are reported in a real world, [22]. Specially designed add-on unit can be installed at the end of a pipe emitting or sucking air and generating noise.
ANC within servers, integrated with cooling fans, is something to be common in a future. Such system uses a magnetic field to generate minute vibrations in fan blades. A microphone samples the noise and then tunes the fan blade vibration to cancel it out, [23].
Figure 12. ANC in a ventilation duct
MIPRO 2016/CTS 1357
ANC headphones, [24], can provide greater deal of
protection, however most of ANC headphone designs are
optimized for aircraft use. Although ANC headphones are
successful at reducing noise, they also reduce the ability
to hear speech and remain aware of surroundings. Some
communication headphones combine speech enhancement
with noise suppression technology that elevates speech
and suppresses dangerous background noise so workers
can hear speech and stay protected in high noise
environments, [25]. Sometimes even situational awareness
with speech and noise direction recognition is preserved.
C. Lowering Cooling Requirements
HVAC is the main source of noise in a data center.
According to [6], 20% increase in cooling air speed
equates to a 4 dB increase in noise level. By reducing
HVAC activity it is possible to reduce noise.
Lower cooling requirements on HVAC can be
achieved by implementing higher degree of virtualization
and hence achieving higher CPU usage and the lower
number of necessary physical servers. Overall power
consumption, cooling requirements and noise levels go
down. However efficiency of power and cooling
infrastructure gets worse because of underloading, [26].
Another approach is raising target temperature within
a data center, [27]. The higher the target temperature in a
data center, the lower is the cooling requirement. HVAC
unit should not necessary run at full capacity at all times.
Increasing target temperature for just few degrees during
maintenance activities would lead to a quieter work
environment for employees. Recommendations for air
temperatures in data centers (Class 1 requirements) put
them in a range 18-27 °C (allowable 15-32 °C), [28]. As
an approximation it may be expected that 2°C increase in
data center temperatures would cause noise decrease of
3-5 dB, [6]. Server fans will, however, try to compensate
for diminished HVAC operation using the server built-in
temperature-based fan speed control, adding some noise.
VII. CONCLUSION
Measured noise levels within a data center were in
70-80 dBA range (as in other data centers). These levels
are below maximal acceptable eight hour exposure limit
but are close enough and it may be wise to use some kind
of hearing protection like noise protection headphones.
Prolonged exposure to such noise levels could produce
extra-aural health effects. High noise levels interfere with
performing cognitive tasks, influence autonomous system
and after the long-term exposure may cause behavior
modifications. Noise in a data center significantly
interferes with speech intelligibility (as reflected in
speech intelligibility measures), making communication
among personnel difficult (raising voice and reducing
communication distance). Lightweight ANC headphones
with build in wireless interphones would be beneficial.
Staff should perform as much as possible tasks remotely
from the office, using iLO console or RD connections.
Passive noise reduction with certified fire resistant
materials may be applied to data center surfaces. ANC is
suitable for HVAC ventilation ducts. During extensive
maintenance activities temperature throttling can be used.
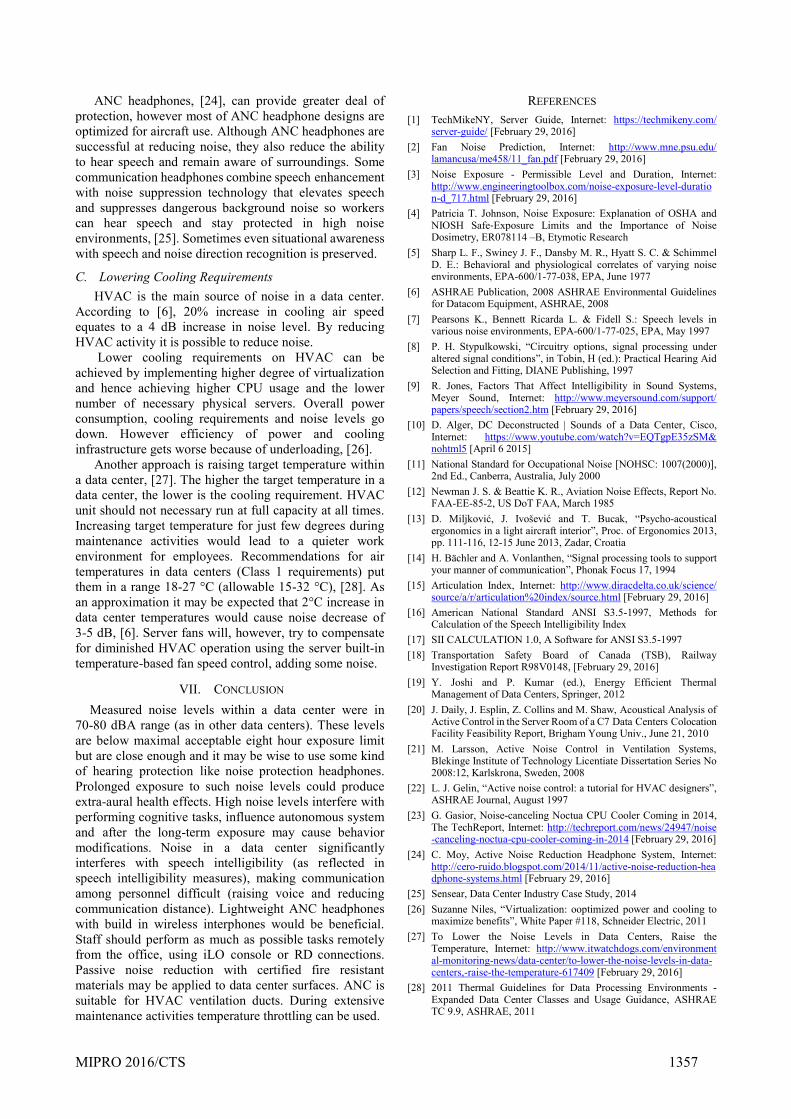
REFERENCES
[1] TechMikeNY, Server Guide, Internet: https://techmikeny.com/ server-guide/ [February 29, 2016]
[2] Fan Noise Prediction, Internet: http://www.mne.psu.edu/ lamancusa/me458/11_fan.pdf [February 29, 2016]
[3] Noise Exposure - Permissible Level and Duration, Internet: http://www.engineeringtoolbox.com/noise-exposure-level-duratio n-d_717.html [February 29, 2016]
[4] Patricia T. Johnson, Noise Exposure: Explanation of OSHA and NIOSH Safe‑Exposure Limits and the Importance of Noise Dosimetry, ER078114 –B, Etymotic Research
[5] Sharp L. F., Swiney J. F., Dansby M. R., Hyatt S. C. & Schimmel D. E.: Behavioral and physiological correlates of varying noise environments, EPA-600/1-77-038, EPA, June 1977
[6] ASHRAE Publication, 2008 ASHRAE Environmental Guidelines for Datacom Equipment, ASHRAE, 2008
[7] Pearsons K., Bennett Ricarda L. & Fidell S.: Speech levels in various noise environments, EPA-600/1-77-025, EPA, May 1997
[8] P. H. Stypulkowski, “Circuitry options, signal processing under altered signal conditions”, in Tobin, H (ed.): Practical Hearing Aid Selection and Fitting, DIANE Publishing, 1997
[9] R. Jones, Factors That Affect Intelligibility in Sound Systems, Meyer Sound, Internet: http://www.meyersound.com/support/ papers/speech/section2.htm [February 29, 2016]
[10] D. Alger, DC Deconstructed | Sounds of a Data Center, Cisco, Internet: https://www.youtube.com/watch?v=EQTgpE35zSM& nohtml5 [April 6 2015]
[11] National Standard for Occupational Noise [NOHSC: 1007(2000)], 2nd Ed., Canberra, Australia, July 2000
[12] Newman J. S. & Beattie K. R., Aviation Noise Effects, Report No. FAA-EE-85-2, US DoT FAA, March 1985
[13] D. Miljković, J. Ivošević and T. Bucak, “Psycho-acoustical ergonomics in a light aircraft interior”, Proc. of Ergonomics 2013, pp. 111-116, 12-15 June 2013, Zadar, Croatia
[14] H. Bächler and A. Vonlanthen, “Signal processing tools to support your manner of communication”, Phonak Focus 17, 1994
[15] Articulation Index, Internet: http://www.diracdelta.co.uk/science/ source/a/r/articulation%20index/source.html [February 29, 2016]
[16] American National Standard ANSI S3.5-1997, Methods for Calculation of the Speech Intelligibility Index
[17] SII CALCULATION 1.0, A Software for ANSI S3.5-1997
[18] Transportation Safety Board of Canada (TSB), Railway Investigation Report R98V0148, [February 29, 2016]
[19] Y. Joshi and P. Kumar (ed.), Energy Efficient Thermal Management of Data Centers, Springer, 2012
[20] J. Daily, J. Esplin, Z. Collins and M. Shaw, Acoustical Analysis of Active Control in the Server Room of a C7 Data Centers Colocation Facility Feasibility Report, Brigham Young Univ., June 21, 2010
[21] M. Larsson, Active Noise Control in Ventilation Systems, Blekinge Institute of Technology Licentiate Dissertation Series No 2008:12, Karlskrona, Sweden, 2008
[22] L. J. Gelin, “Active noise control: a tutorial for HVAC designers”, ASHRAE Journal, August 1997
[23] G. Gasior, Noise-canceling Noctua CPU Cooler Coming in 2014, The TechReport, Internet: http://techreport.com/news/24947/noise -canceling-noctua-cpu-cooler-coming-in-2014 [February 29, 2016]
[24] C. Moy, Active Noise Reduction Headphone System, Internet: http://cero-ruido.blogspot.com/2014/11/active-noise-reduction-hea dphone-systems.html [February 29, 2016]
[25] Sensear, Data Center Industry Case Study, 2014
[26] Suzanne Niles, “Virtualization: ooptimized power and cooling to maximize benefits”, White Paper #118, Schneider Electric, 2011
[27] To Lower the Noise Levels in Data Centers, Raise the Temperature, Internet: http://www.itwatchdogs.com/environment al-monitoring-news/data-center/to-lower-the-noise-levels-in-data-centers,-raise-the-temperature-617409 [February 29, 2016]
[28] 2011 Thermal Guidelines for Data Processing Environments - Expanded Data Center Classes and Usage Guidance, ASHRAE TC 9.9, ASHRAE, 2011