NOISE SOURCE IDENTIFICATION AND ADOPTION OF PROPER...
131
NOISE SOURCE IDENTIFICATION AND ADOPTION OF PROPER NOISE CONTROL STRATEGIES ON WHEELED TRACTORS A THESIS SUBMITTED TO THE GRADUATE SCHOOL OF NATURAL AND APPLIED SCIENCES OF MIDDLE EAST TECHNICAL UNIVERSITY BY MURAT BALABAN IN PARTIAL FULFILLMENT OF THE REQUIREMENTS FOR THE DEGREE OF MASTER OF SCIENCE IN MECHANICAL ENGINEERING MAY 2010
Transcript of NOISE SOURCE IDENTIFICATION AND ADOPTION OF PROPER...

NOISE SOURCE IDENTIFICATION AND ADOPTION OF PROPER NOISE CONTROL STRATEGIES
ON WHEELED TRACTORS
A THESIS SUBMITTED TO THE GRADUATE SCHOOL OF NATURAL AND APPLIED SCIENCES
OF MIDDLE EAST TECHNICAL UNIVERSITY
BY
MURAT BALABAN
IN PARTIAL FULFILLMENT OF THE REQUIREMENTS FOR
THE DEGREE OF MASTER OF SCIENCE IN
MECHANICAL ENGINEERING
MAY 2010

Approval of the thesis:
NOISE SOURCE IDENTIFICATION AND ADOPTION OF PROPER NOISE CONTROL STRATEGIES ON WHEELED TRACTORS
submitted by MURAT BALABAN in partial fulfillment of the requirements for the degree of Master of Science in Mechanical Engineering Department, Middle East Technical University by, Prof. Dr. Canan Özgen ___________ Dean, Graduate School of Natural and Applied Sciences Prof. Dr. Süha Oral ___________ Head of Department, Mechanical Engineering Prof. Dr. Mehmet Çalışkan ___________ Supervisor, Mechanical Engineering Dept., METU Examining Committee Members: Prof. Dr. Eres SÖYLEMEZ _________________ Mechanical Engineering Dept., METU Prof. Dr. Mehmet ÇALIŞKAN _________________ Mechanical Engineering Dept., METU Prof. Dr. Y. Samim ÜNLÜSOY _________________ Mechanical Engineering Dept., METU Assist. Prof. Dr. Gökhan O. ÖZGEN _________________ Mechanical Engineering Dept., METU Ergün GÜLTEKİN, M.Sc. _________________ R&D Manager, Türk Traktör ve Ziraat Makineleri A.Ş.
Date: 05/05/2010

iii
I hereby declare that all information in this document has been obtained and presented in accordance with academic rules and ethical conduct. I also declare that, as required by these rules and conduct, I have fully cited and referenced all material and results that are not original to this work.
Name, Last name: Murat BALABAN
Signature:

iv
ABSTRACT
NOISE SOURCE IDENTIFICATION AND ADOPTION OF PROPER NOISE CONTROL STRATEGIES ON WHEELED TRACTORS
Balaban, Murat
M.Sc., Department of Mechanical Engineering
Supervisor: Prof. Dr. Mehmet Çalışkan
May 2010, 109 pages
This thesis is aimed at identifying the noise sources of a wheeled tractor to
reduce the noise levels below the legislative limits by controlling noise
sources through proper methodologies.
The study focuses firstly on identifying the noise sources of a wheeled tractor
by using proper noise source identification techniques. These techniques can
be summarized as sound intensity measurements, sound power level
determination studies and spectral analysis of the noise data acquired in the
tests. Simple sound intensity mapping techniques are used and the intensity
contour maps are generated to identify the noise sources.
Most important and effective noise sources are identified and the critical
noise sources are focused to apply appropriate noise control strategies not
only at the prototype production stages but also at the early design stages.

v
Consequently, upon consideration of both structure-borne and flow-induced
noise, the pass-by noise level and the operator’ s ear noise levels of the
tractor are reduced by nearly 3 dB (A) through application of proper noise
control strategies.
Keywords: Sound Intensity, Noise Source Identification, Tractor, Noise
Control Strategies

vi
ÖZ
TEKERLEKLİ TRAKTÖRLERDE GÜRÜLTÜ KAYNAĞI TANIMLANMASI VE UYGUN GÜRÜLTÜ KONTROL STRATEJİLERİNİN UYGULANMASI
Balaban, Murat
Yüksek Lisans, Makine Mühendisliği Bölümü
Tez Yöneticisi: Prof. Dr. Mehmet Çalışkan
Mayıs 2010, 109 sayfa
Bu tez çalışmasında, uygun yöntemler aracılığıyla gürültü kaynaklarının idare
edilmesi ile birlikte gürültü düzeyinin yasal sınırlarının altına indirilmesi için bir
tekerlekli traktörün gürültü kaynaklarının tespit edilmesi amaçlanmaktadır.
Bu araştırma ilk olarak uygun gürültü kaynağı belirleme teknikleri kullanılarak
tekerlekli traktörün gürültü kaynaklarının tespit edilmesine odaklanmıştır. Bu
teknikler, ses yeğinliği ölçümleri, ses gücü seviyesi belirleme çalışmaları ve
testlerle elde edilen verilerin izgesel analizleri olarak özetlenebilir. Ses
yeğinliği haritalama teknikleri kullanılarak oluşturulan ses yeğinliği haritaları
yardımıyla gürültü kaynaklarının tespit edilmesi sağlanmıştır.
Araştırma sonunda belirlenen en etkili ve önemli gürültü kaynakları arasından
sadece deneme üretimi sürecinde değil; aynı zamanda tasarım sürecinin ilk
evrelerinde de uygun gürültü idaresi stratejilerini uygulamak için kritik gürültü
kaynaklarına odaklanılmıştır.

vii
Sonuç olarak, uygun gürültü idaresi stratejilerinin uygulanması sayesinde
traktör şanjmanı ve üst inşa yapısı kaynaklı ve hava akışı sevkli kaynaklı
gürültülerin göz önünde tutulması sağlanmış; böylece hem traktör geçişi
sırasında yaydığı gürültü seviyesinde hem de operatör kulak hizası gürültü
seviyesinde yaklaşık 3 dB (A) azalma elde edilmiştir.
Anahtar Kelimeler: Ses Yeğinliği, Gürültü Kaynağı Belirleme, Traktör, Gürültü
Kontrol Yöntemleri

viii
To my dear family

ix
ACKNOWLEDGMENTS
First of all, I would like to express my sincere regards, gratitude and
appreciation to my supervisor, Prof. Dr. Mehmet ÇALIŞKAN for his guidance,
insight and invaluable help throughout this study.
The examining committee members, Prof. Dr. Eres SÖYLEMEZ, Prof. Dr. Y.
Samim ÜNLÜSOY and Assist. Prof. Dr. Gökhan O. ÖZGEN are also
acknowledged for their guidance and helpful suggestions.
I would like to thank to my brother, Dr. Osman BALABAN and to his wife, Dr.
Meltem ŞENOL BALABAN for their helpful comments and endless support.
I would like to thank to my managers, Mr. Friedrich WIRLEITNER, Mr. Ergün
GÜLTEKİN and Mr. Aydın GÜLTEKİN for their encouragement and support.
I am especially grateful to my father Ali BALABAN and my mother Kadriye
BALABAN, to my sister Emine Özlem, to her husband Kaan for their
encouragement and persuasion about completing my thesis work.
I would like to express my deepest gratitude to Mr. Alper AKGÜL, who
provided guidance and support on sound measurement instruments, and
answered my questions with great patience.
I am also grateful to my cousins, special friends and colleagues for their
presence and support.
This study was supported by Türk Traktör ve Ziraat Makineleri A.Ş.

x
TABLE OF CONTENTS
ABSTRACT .................................................................................................. iv
ÖZ ................................................................................................................ vi
ACKNOWLEDGEMENTS ............................................................................ ix
TABLE OF CONTENTS ............................................................................... x
LIST OF TABLES ......................................................................................... xiii
LIST OF FIGURES ...................................................................................... xv
LIST OF ABBREVIATIONS ......................................................................... xx
CHAPTERS
1. INTRODUCTION ....................................................................................... 1
2. LITERATURE SURVEY ............................................................................. 5
2.1 Noise Sources Identification .......................................................... 9
2.2 Noise Control Strategies .............................................................. 16
2.3 Flow Induced Noise ..................................................................... 21
3. IDENTIFICATION OF NOISE SOURCES ................................................ 24
3.1 Methodology ................................................................................ 24
3.2 Sound Intensity Mapping ............................................................. 31
3.3 The Test Tractor T480 ................................................................. 34

xi
4. EXPERIMENTAL STUDIES ..................................................................... 40
4.1 Sound Power Level Determination Using Sound Pressure Level
Measurements ................................................................................... 42
4.2 Spectral Analysis of Exterior Noise on the Test Tractor .............. 47
4.3 Sound Intensity Measurements ................................................... 49
4.4 Sound Power Level Determination Using Sound Intensity
Measurements ................................................................................... 55
5. RESULTS OF EXPERIMENTS ................................................................ 57
5.1 Results of Noise Measurements .................................................. 57
5.2 Sound Power Level Calculation Using Sound Pressure Level
Measurements ................................................................................... 58
5.3 Spectral Analysis of Exterior Noise on the Test Tractor .............. 59
5.4 Ranking Noise Sources of the Test Tractor ................................. 61
5.5 Results of Sound Intensity Measurements of the Original Prototype
Tractor ............................................................................................... 63
5.6 Sound Power Level Calculation Using Sound Intensity
Measurements of the Original Prototype Tractor ............................... 76
5.7 Results of Sound Intensity Measurements after Initial Modifications
.......................................................................................................... 77
5.8 Results of Sound Intensity Measurements after Final Modifications
.......................................................................................................... 80
5.9 Dominant Noise Sources from Test Results ................................ 92

xii
5.10 Sound Power Level Calculation Using Sound Intensity
Measurements after Final Modifications ............................................ 95
5.11 Sound Power Level Calculation Using Sound Pressure
Measurements after Final Modifications ............................................ 96
6. SUMMARY AND CONCLUSIONS ................................................ 97
6.1 Noise Control Strategies on the Test Tractor .............................. 97
6.2 Potential Future Studies on Tractors ......................................... 103
REFERENCES .......................................................................................... 104

xiii
LIST OF TABLES
TABLES
Table 3.1 Legislative Noise Limits ................................................................ 24
Table 4.1 Specifications of the Steering Pump on the Engine ..................... 41
Table 4.2 Specifications of the Hydraulic Pump on the Engine .................... 41
Table 5.1 Noise Levels of the Original Prototype Tractor ............................. 57
Table 5.2 Sound Power Level Calculation of the Original Prototype Tractor.
..................................................................................................................... 58
Table 5.3 Highest Ratio Peak Center Frequencies and Sound Levels on the
Front Side .................................................................................................... 61
Table 5.4 Highest Ratio Peak Center Frequencies and Sound Levels on the
Left Side ....................................................................................................... 61
Table 5.5 Highest Ratio Peak Center Frequencies and Sound Levels on the
Right Side… ................................................................................................. 62
Table 5.6 Peak Center Frequencies and Noise Sources ............................. 62
Table 5.7 Peak Center Frequencies and Intensity Values from Sound
Intensity Measurements ............................................................................... 64
Table 5.8 Sound Power Level Calculation Results from Sound Intensities of
the Original Prototype Tractor ...................................................................... 76
Table 5.9 Peak Center Frequencies and Associated Noise Sources ........... 77

xiv
Table 5.10 Comparison of Sound Intensity Measurements Peak Center
Frequencies and Intensity Values after Initial Modifications ......................... 78
Table 5.11 Comparison of Peak Center Frequencies and Associated Intensity
Values after Final Modifications ................................................................... 81
Table 5.12 Sound Power Level Calculation Results from Sound Intensities
after Final Modifications ............................................................................... 95
Table 5.13 Sound Power Level Calculation Results after Final Modifications
..................................................................................................................... 96
Table 6.1 The Homologation Tractor Noise Levels ...................................... 99

xv
LIST OF FIGURES
FIGURES
Figure 1.1 A Wheeled Tractor ........................................................................ 2
Figure 3.1 The intensity map of a washing machine .................................... 32
Figure 3.2 The intensity map of an earth moving machine .......................... 32
Figure 3.3 The intensity map of an internal combustion engine ................... 33
Figure 3.4 The Side View of the Test Tractor .............................................. 34
Figure 3.5 The Front View of the Test Tractor ............................................. 35
Figure 3.6 The Engine Wireframe 3D Model ................................................ 36
Figure 3.7 The Front View of the Engine ..................................................... 36
Figure 3.8 Potential Noise Sources on the Tractor ...................................... 37
Figure 4.1 The Left View of the Engine Wireframe ...................................... 40
Figure 4.2 The Sketch Showing Microphone Locations of the Test Area ..... 44
Figure 4.3 Microphone Locations on the Test Site ....................................... 45
Figure 4.4 Microphone Locations on the Test Area of Spectral Analysis. .... 48
Figure 4.5 Measurement Area ..................................................................... 48
Figure 4.6 The Grid Frame used for Sound Intensity Measurements .......... 49
Figure 4.7 The Sound Intensity Probe ......................................................... 50
Figure 4.8 The Sound Calibrator .................................................................. 51
Figure 4.9 The Sound Level Meter ............................................................... 52

xvi
Figure 4.10 Digital Laser Remote Tachometer ............................................ 52
Figure 4.11 The Left Side View of the Test Tractor during Sound Intensity
Measurements ............................................................................................. 53
Figure 4.12 Grid Numberings for the Right Side of the Tractor .................... 53
Figure 4.13 Grid Numberings for the Front Side of the Tractor .................... 54
Figure 4.14 Grid Numberings for the Left Side of the Tractor ...................... 54
Figure 5.1 Sound Level and Peak Center Frequencies on the Front Side ... 59
Figure 5.2 Sound Level and Peak Center Frequencies on the Left Side ..... 60
Figure 5.3 Sound Level and Peak Center Frequencies on the Right Side ... 60
Figure 5.4 Left Side View for Sound Intensity Measurements ..................... 65
Figure 5.5 The Original Intensity Map of the Left Side of the Tractor at 315 Hz
..................................................................................................................... 65
Figure 5.6 Left Side View for Sound Intensity Measurements ..................... 66
Figure 5.7 The Original Intensity Map of the Left Side of the Tractor at 400 Hz
..................................................................................................................... 66
Figure 5.8 Left Side View for Sound Intensity Measurements ..................... 67
Figure 5.9 The Original Intensity Map of the Left Side of the Tractor at 630 Hz
..................................................................................................................... 67
Figure 5.10 Left Side View for Sound Intensity Measurements ................... 68
Figure 5.11 The Original Intensity Map of the Left Side of the Tractor at 800
Hz ................................................................................................................ 68
Figure 5.12 Front Side View for Sound Intensity Measurements ................. 69

xvii
Figure 5.13 The Original Intensity Map of the Front Side of the Tractor at 250
Hz ................................................................................................................ 69
Figure 5.14 Front Side View for Sound Intensity Measurements ................. 70
Figure 5.15 The Original Intensity Map of the Front Side of the Tractor at 630
Hz ................................................................................................................ 70
Figure 5.16 Front Side View for Sound Intensity Measurements ................. 71
Figure 5.17 The Original Intensity Map of the Front Side of the Tractor at
1000 Hz ....................................................................................................... 71
Figure 5.18 Right Side View for Sound Intensity Measurements ................. 72
Figure 5.19 The Original Intensity Map of the Right Side of the Tractor at 315
Hz ................................................................................................................ 72
Figure 5.20 Right Side View for Sound Intensity Measurements ................. 73
Figure 5.21 Figure 5.21 The Original Intensity Map of the Right Side of the
Tractor at 400 Hz ......................................................................................... 73
Figure 5.22 Right Side View for Sound Intensity Measurements ................. 74
Figure 5.23 The Original Intensity Map of the Right Side of the Tractor at 630
Hz ................................................................................................................ 74
Figure 5.24 Right Side View for Sound Intensity Measurements ................. 75
Figure 5.25 The Original Intensity Map of the Right Side of the Tractor at 800
Hz ................................................................................................................ 75
Figure 5.26 Octave Band Analysis of Noise after Initial Modifications ......... 79
Figure 5.27 Left Side View for Sound Intensity Measurements ................... 82
Figure 5.28 The Final Intensity Map of the Left Side of the Tractor at 315 Hz
..................................................................................................................... 82

xviii
Figure 5.29 Left Side View for Sound Intensity Measurements ................... 83
Figure 5.30 The Final Intensity Map of the Left Side of the Tractor at 400 Hz
..................................................................................................................... 83
Figure 5.31 Left Side View for Sound Intensity Measurements ................... 84
Figure 5.32 The Final Intensity Map of the Left Side of the Tractor at 630 Hz
..................................................................................................................... 84
Figure 5.33 Left Side View for Sound Intensity Measurements ................... 85
Figure 5.34 The Final Intensity Map of the Left Side of the Tractor at 800 Hz
..................................................................................................................... 85
Figure 5.35 Front Side View for Sound Intensity Measurements ................. 86
Figure 5.36 The Final Intensity Map of the Front Side of the Tractor at 250 Hz
..................................................................................................................... 86
Figure 5.37 Front Side View for Sound Intensity Measurements ................. 87
Figure 5.38 The Final Intensity Map of the Front Side of the Tractor at 630 Hz
..................................................................................................................... 87
Figure 5.39 Right Side View for Sound Intensity Measurements ................. 88
Figure 5.40 The Final Intensity Map of the Right Side of the Tractor at 315 Hz
..................................................................................................................... 88
Figure 5.41 Right Side View for Sound Intensity Measurements ................. 89
Figure 5.42 The Final Intensity Map of the Right Side of the Tractor at 400 Hz
..................................................................................................................... 89
Figure 5.43 Right Side View for Sound Intensity Measurements ................. 90
Figure 5.44 The Final Intensity Map of the Right Side of the Tractor at 630 Hz
..................................................................................................................... 90

xix
Figure 5.45 Right Side View of Sound Intensity Measurements .................. 91
Figure 5.46 The Final Intensity Map of the Right Side of the Tractor at 800 Hz
..................................................................................................................... 91
Figure 5.47 A Sectional View of Steering Motor Column and its Support .... 92
Figure 5.48 A Sectional View of Steering Motor Column and its Support .... 93
Figure 5.49 The Exhaust Pipe Isolation view taken from 3D Master Model of
the Tractor ................................................................................................... 94
Figure 6.1 The Engine Panel on the Left Side ............................................. 99
Figure 6.2 The Engine Panel on the Right Side ......................................... 100
Figure 6.3 The Original Intensity Map of the Right Side at 400 Hz ............ 100
Figure 6.4 The Final Intensity Map of the Right Side at 400 Hz ................. 101
Figure 6.5 The Original Intensity Map of the Left Side at 630 Hz ............... 102
Figure 6.6 The Final Intensity Map of the Left Side at 630 Hz ................... 102

xx
LIST OF ABBREVIATIONS
PL : Sound Pressure Level (dB)
WL : Sound Power Level (dB)
WAL : A-Weighted Sound Power Level (dB (A))
pAL : A-Weighted Sound Pressure Level (dB (A))
refP : Threshold of Hearing (Pa)
iP : A-Weighted Acoustic Pressure for thi Frequency
rmsP : A-Weighted Acoustic Pressure for Whole Frequency Range
pAL : A-Weighted Sound Level for Whole Frequency Range
ipAL : A-Weighted Sound Level for thi Frequency
P : Instantaneous Pressure at a Point (Pa)
Ur
: Particle Velocity Vector at a Point (m/s)
Ir
: Sound Intensity Vector (W/ m²)
W : Sound Power (W)

xxi
S : Surface Area (m²)
iS : Partial Surface Area for the thi Intensity Grid (m²)
N : Total Number of Intensity Grids of Measurement Area
nI : Sound Intensity (W/ m²)
refI : Reference Sound Intensity (W/ m²)
niI : Average Sound Intensity for the thi Partial Surface of
Measurement Area (W/ m²)
nIL : Sound Intensity Level (dB)
nIL : Average Sound Intensity Level (dB)
iW : Partial Sound Power (W)
refW : Reference Sound Power (W)
0S : Unit Surface area (m²)
'pAL : Average A-weighted sound pressure level of sound source for
the reference surface area

xxii
'pAiL : A-weighted sound pressure level as dB for thi microphone
location
N : Total Number of Microphone locations
FFT : Fast Fourier Transform

1
CHAPTER 1
INTRODUCTION
Agriculture is simply the production of food and goods through farming.
Besides, agriculture covers the development of the quality of these food and
goods. Furthermore, the outcome from agriculture can be considered as the
transportation and marketing of these products. Agriculture is one of the most
significant evolvements that directed to the rise of civilization with the
utilization of farm machines and implements.
There are several agricultural machines used on today’s farms such as
harvesters, tractors, cultivators, ploughs, etc. Although other multi-functional
machines may have taken the harvesting task away from tractors, they still
can do the majority of work on farms these days. They can be used to pull
implements for tilling the ground, seeding, transportation, etc. Tractors are
considered in this study from noise control point of view. There are two types
of tractors; crawler tractors and wheeled tractors. A crawler tractor is a
vehicle that runs on continuous tracks instead of wheels. Crawler tractors are
generally used on rocky lands with higher inclinations where pneumatic tires
may have short bursts and may not possess sufficient grip on ground. On the
other hand, a wheeled tractor, can be seen in Figure 1.1, has pneumatic tires
for the front and rear axles.
Wheeled tractors are the main concern of noise control studies for this thesis
work.

2
Figure 1.1 A Wheeled Tractor
Tractors have always been the most necessary farm machine. As tractors got
larger, producers started to install cabinets to save drivers from undesired
elements and extending the hours the machine could be used throughout the
year.
Excessive noise radiated from tractors is one of these elements. As farm and
its machinery evolve, increasing pressure has been coming from worldwide
markets to reduce or decrease the noise. It has already been investigated
and proved that excessive noise exposure was unhealthy and harmful for
humans.
Legislations have started to enforce new laws and directives to protect
human health. New legislations and directives were published for more strict
applications. Tractor manufacturers must comply with the European Noise
Directives 77 / 311 / EEC [1] and 74 / 151 / EEC [2]. Decreasing the noise
level below the legal requirements has always been a challenging task or
issue for almost all tractor manufacturers.

3
There are a few ways to deal with this issue. One of the most powerful tools
that can be used in modern acoustics today is the noise source identification.
By identifying where the noise sources may be located and their spectral
characteristics, it then becomes much easier to understand, to reduce or to
control the overall noise level of a tractor. This is the typical aim of noise
vibration harshness programs. Over the years many different techniques
have become available as technology moves forward. When tractors are
specifically considered, majority of noise comes from the engine. Other
sources can be the transmission box, hydraulic components, cooling fan and
exhaust pipes, etc.
Vibrations from all these sources can cause related components to produce
structure-borne noise. Noise source identification software will be used to
develop noise maps showing the most effective portions of tractor in this
research. Special care will also be exercised to improve the sealing or air
tightness especially in the areas where cables and harnesses enter.
Within this research, the flow induced noise will be studied because the
bigger portion of noise level comes not only from the exhaust and its pipe but
also from the cooling fan of radiator.
The objective of this study is to apply the noise source identification methods
to find out related noise sources; to complete the study by using noise control
strategies on tractors as well as to minimize the noise level radiated by
recently designed tractors.
The outline of the study is organized in six chapters. Chapter 2 summarizes
the literature survey of noise source identification techniques and noise
control applications on tractors and in automotive industry applications.

4
Chapter 3 introduces the methodologies, giving the equations necessary for
calculations to compare results and findings and presenting the project
tractor with its potential noise sources. Chapter 4 explains the experiments,
experimental studies, instruments used during tests in detail and related ISO
standards to describe how to calculate sound power levels, tests and the
instruments to be used throughout the tests. In addition, Chapter 5 reveals all
the experimental results from tests and measurements, tabulates the results
and plots intensity maps, shows the modifications on tractors and also
comments on data. Moreover, tabulates the calculation results found by
using measured data in equations.
And finally, Chapter 6 summarizes the studies, tests and explains how the
modifications were conducted on tractors and compares the data found after
modifications and recommends future works.

5
CHAPTER 2
LITERATURE SURVEY
Tractors have been used all around the world with an increasing trend as
agriculture has grown rapidly worldwide for a couple of decades. Despite
their usage, increasing pressure has been coming from worldwide markets
and also from the public to cut down or minimize the noise emitted during
their operations. It has already been proved that excessive noise exposure
was unhealthy and harmful for humans. Fallon [3] studied the relation
between farm workers’ hearing losses and the noise emitted by tractors. It
was stated that farm workers’ hearing loss is proportional to the amount and
duration of noise. Moreover, an important relation between hearing loss and
ages of people was determined among people older than 35 years of age
who are exposed to farm machinery by Solecki [4].
Agricultural and its applications in Japan have grown enormously since 1955
together with tractors and other farm machineries. These new technological
developments have shown that an increase in noise exposure that is not only
annoying, but also damaging to human health.
Miyakita et al [5] tried to decide, if Japanese tractor users and farmers are at
risk for hearing loss due to noise in comparison with people working at the
offices, and by evaluating the present conditions regarding occupational
noise levels among people involved in agriculture. The results proposed that
particularly male farmers have a high prevalence of hearing loss in the higher
frequency ranges.

6
Daily noise exposure levels ranges from 81.5 to 99.1 dB (A) for tea
harvesting and processing, and from 83.2 to 97.6 for sugar cane harvesting.
Taking into account long extended working hours and excessive noise from
farm machineries, it is concluded that farmers are at risk for noise-induced
hearing loss. These findings clearly points out that a strong need for
implementation of hearing conservation programs among agricultural workers
exposed to machinery noises. [5]
Important differences were found between male farmers and male office
workers in the percentage of subjects with hearing levels more than 40 dB at
4 kHz. For example, in their 40 s, the rate was 16.4% among farmers and
9.6% among office workers. When the time interval is 60 s, the rate became
50.3% for farmers and 29.9% for office workers. For hearing levels at 1 kHz,
no considerable differences were obtained among male subjects. [5]
In female subjects, no significant differences were found between farmers
and office workers except among the 50-year-olds at 1 kHz test frequency.
The results prove that Japanese farmers, particularly male farmers, are at
risk from noise-induced hearing loss when compared with office workers.
From the results, it was clearly realized that tractor or other agricultural
machinery manufacturers must pay necessary attention to noise control
applications. [5]
Another investigation was conducted by Dewangan et al [6] to determine the
noise generation during stationary condition and the noise level at operator’s
ear level of tractors of 18.7 and 26.1 kW power and hand tractors of 4.6 and
6.7 kW. The sound pressure level at operator’s ear level, in dB (A), was
found as around 92 dB (A). This value does not comply with legislative limits.
Two models of the 2-wheel drive tractors and two models of hand tractors
were selected for the study.

7
In order to monitor the sound propagation characteristics in terms of sound
pressure level (SPL), grid points were marked on the experimental open field,
ranging rods and measuring tape at a grid spacing of 1 m x 1 m. The test
tractors were kept at the centers of the grid lines with their engines operating
at full throttle. [6]
Finally, the maximum sound pressure level produced by tractors and hand
tractors during stationary condition at rated engine speed was found to be 92
dB (A) and 94 dB (A), respectively. The fact that the SPL of hand tractors is
higher than that of tractors by 2 dB (A) was due to the absence of an engine
shroud. The SPLs were higher for field operations corresponding to the
implements requiring higher drafts for field operations. [6]
Considering all these side effects during farm mechanization process, to
protect human health and to minimize the effects, governments started to
enforce new laws and legislations.
There are two legislations about the noise level of wheeled tractors used in
fields or places open to public. 77 / 311 / EEC [1] Maximum Permissible
Noise Level at operator’s ear position and 74 / 151 / EEC [2] Maximum
Permissible Noise Level of tractor’s Pass-By Noise.
Regarding tractors, manufacturers must comply with these legislations. The
legislation 77 / 311 / EEC [1] ensures that the tractor drives’ noise level
perception must not exceed 86 dB (A) and requires the measurement of
maximum noise level at operator’s ear position during tractor movement. The
test requirements can be summarized as;
• The test field must be in an open and sufficiently silent location. For
example, an open space of 50-metre radius and a central part with a
radius of at least 20 m. [1]

8
• The surface of the track must not cause excessive tire noise. [1]
• The weather must be fine and dry with little or no wind. [1]
• The tires must be inflated to the pressure recommended by the tractor
manufacturer, the engine, transmission and drive axles must be at
normal running temperature. [1]
• The microphone must be located 250 mm to the side of the central
plane of the seat, the side being that on which the higher noise level is
encountered. [1]
• The microphone diaphragm must face forward and the centre of the
microphone shall be 790 mm above and 150 mm forward of the seat
reference point. [1]
• Noise must be measured at the maximum engine speed using sound-
level meter in the gear-range combination giving the speed nearest to
7,5 km/h at the rated rpm. The tractor must be unladen when
measurements are being made. [1]
The second legislation is 74 / 151 / EEC [2] guarantees that the maximum
noise level of a tractor during operation affecting surroundings must not
exceed 89 dB (A) and requires the measurement of noise level while tractor
is passing by in front of a microphone. The test requirements can be
summarized as;
• The test field must be in an open and sufficiently silent location. For
example, an open space of 50 meter radius and a central part with a
radius of at least 20 m. [2]
• The surface of the track must not cause excessive tire noise. [2]
• The weather must be fine and dry with little or no wind. [2]
• The microphone shall be placed 1,2 meters above ground level at a
distance of 7,5 meters from the path of the tractor's centre line. [2]

9
• Two lines respectively 10 meters forward and 10 meters rearward of
microphone axis line shall be marked out on the test track. Tractors
shall approach one line at a steady speed. The throttle shall then be
fully opened as rapidly as practicable and held in the fully opened
position until the rear of the tractor crosses the other line. The throttle
shall then be closed again as rapidly as possible. [2]
With the inception of these two directives in Europe, it has always been a
challenging task for the tractor manufacturers to obey the limits. Noise source
identification techniques have been introduced and noise control techniques
have been implemented.
In the literature survey, there are several sources on the tire-road interaction
noise. However, this type of noise can be considered as a noise source
mainly for vehicles run at speeds higher than 70 km/h. Since maximum
speeds for tractors are presently much lower than 70 km/h, these sources
found in literature survey will not be shared and discussed in this thesis. The
maximum speeds for tractors are between 30 km/h and 45 km/h.
2.1 Noise Sources Identification
Noise source identification is the first step of noise control studies. To solve
noise problem on a machine, it is essential that noise sources should be
identified and described thoroughly. To decide which design changes are
proper to decrease the noise radiated by a machine, one needs to
characterize the noise in the sense of:
• Spectral content
• The location of the dominant sources
• The relative importance of dominant sources
• In depth description of noise generation mechanisms

10
Noise source identification occupies a number of tools to manage such a
characterization, such as spectral methods, sound intensity measurements,
coherent output energy analysis, etc.
Internal combustion engines on tractors are considered generally as the main
noise source. The power source of a tractor, the engine, should be
investigated first in terms of noise and vibration, because it has an
importance to meet the required comfort level by farmers.
JunHong and Bing [7] investigated the mechanisms of engine front noise
generation by exterior noise diagnosis analysis of an in-line-six cylinder direct
injection diesel engine diesel engine by intensity techniques. Sound level
measurements were carried out at 1m height from the engine front, rear and
right sides while the engine was running at 2200 rpm and full load. It was
found that most of the sound energy was emitted from the front side of the
engine.
The peaks in the noise spectra taken at the front side were independent of
engine rotational speed, which indicated that structural resonance
frequencies were the primary causes of the engine front noise. As a detailed
noise diagnosis of front side, sound intensity measurement was performed
according to the standards ISO 9614-1 [8], ISO 9614-2 [9] and ISO 9614-3
[10]. From the results of the intensity measurements, noise sources were
identified as oil sump, front timing gear cover and front pulley. A structural
modification was considered based on former noise generation system
analysis. A laminated damped steel oil pan was designed and produced. The
noise from the front timing gear cover was reduced by use of the double
shinned approach. Furthermore, the head cover and intake manifold were
isolated by using rubber material. Therefore, the noise level of the modified
engine was 115.2 dB (A) and about a 3.5 dB (A) noise reduction was
achieved. [7]

11
Q. Leclére et al [9] studied the low frequency amplitude modulation of the
noise generated by a diesel engine operating at idle. Modulated vibrations
were transmitted to the frame mainly by one of the engine mounts. The
combustion was the first potential source to be suspected and inspected.
However, as the article stated the origin of amplitude modulation is not
related to the combustion process.
Thus, secondary potential sources have to be inspected on the diesel engine
such as; the timing system, the diesel pump, the power-assisted steering
pump, the alternator, the air-conditioning compressor and the oil pump.
Spectral analysis tools are applied on multi-channel measurements to identify
the sources. A sensor is placed on each potential noise and vibration source.
A virtual source analysis shows that several uncorrelated sources are
contributing to the operating response, particularly on frequencies for which a
high amplitude modulation is observed. This virtual source analysis has been
implemented, showing that although the phenomenon was poorly coherent
with the combustion while it was coherent with the diesel pump. [9]
A conditioned spectral analysis has confirmed these suspicions. A practical
study has been carried out to verify that the diesel pump and the whole
injection circuit were involved in the amplitude modulation. Added masses
appropriately placed on the injection circuit at the engine mount and strongly
attenuate the amplitude modulation. [9]
Talotte et al [12] used noise source identification techniques to reduce
railway noise. Reduction of noise at a source might be more challenging than
the use of noise barriers but this requires a thorough understanding of the
source mechanisms. The paper shows a critical survey of the identification
and modeling of railway noise sources.

12
Besides, the paper summarizes the current knowledge of the physical source
phenomena as well as the potential for noise reduction. The study is
concerned with improvements to source modeling, especially for
aerodynamic noise, investigation of other sources and development of more
advanced models for predicting railway noise in the environment. Source
identification on trains has been more than simply measuring pass-by levels
with a single microphone. More advanced methods have proved useful
information which involves either microphone arrays or a combination of
different sensors. Use of microphone arrays, combination of different sensors
and coherent output power techniques were described. [12]
Microphone arrays were used to localize the aerodynamic noise sources
emitted from the sideways and upper part of the trains. Different microphone
array configurations like star and spiral arrays were used for different
frequency ranges. To differentiate the vehicle and track noise, diagnosis
techniques had been developed. Apart from microphone arrays, coherent
output power technique was used to visualize the aerodynamic sources on a
high-speed train called TGV. [12]
In another study, Murat İnalpolat [13] investigated sound radiation and power
flow characteristics of plates which constitute the bodies of common
engineering applications like cars and household appliances. Two-
microphone sound intensity measurement with a probe utilizing side by side
configuration is used to analyze the near-field radiation characteristics of a
square steel plate excited by a shaker at its midpoint. Three different vibro-
acoustical measurement techniques were used in an integrated manner and
results obtained are compared with those obtained from analytical models
developed. Structural intensity was used to identify the power flow patterns
on the plate. All measurements were repeated for externally damped
configuration of the same plate and results were analyzed.

13
A number of noise source identification techniques have been developed
over the years. Under appropriate conditions several different available
techniques can be applicable and provide useful information.
However, to solve the more complicated noise source identification problems
for instance those involving multiple noise sources; such as internal
combustion engines or complete vehicles, most existing techniques are
inadequate; so development of more sophisticated source identification
methods are necessary.
In recent years, the coherence function technique, among several others, has
gained increasing attention. The most important feature of this technique is
its use of a multiple-input linear system to model an acoustic or vibration
system with several sources. Wang and Crocker [14] published their paper to
explore further the possibility of using the coherence function technique for
noise source identification in a multiple-source acoustic environment when
other techniques may be difficult to use or not provide sufficient information. Assuming that most of the diesel engine noise was due to the combustion
pressure excitation of the engine structure, the noise generation of a six-
cylinder, naturally aspirated, direct-injection, v-type Cummins diesel engine
was studied. The noise generation system of the engine was considered as a
multiple-input, linear system. The inputs of the system were the cylinder
pressure signals measured respectively, by six pressure transducers; the
output was the engine noise measured by a microphone at about 1 m away
from the engine. [14]
Two different approaches for noise source identification based on theory for
multiple-input systems have been investigated. In the first approach the
concept of frequency response function was employed. In the second
approach the concept of coherent residual spectral densities was used. [14]

14
In order to gain physical insight into the methods, an experimental
investigation was conducted with an idealized system designed to simulate a
multiple noise source environment. [14]
Results of the experiments showed that, in cases when strong measurement
contamination existed, neither approach was able to give good estimates of
the spectra of the noise sources. Therefore, whether or not the present
techniques are applicable depends not only on the degree of source
coherence but on the extent of measurement contamination. [14]
Sung-Chon Kang and Jeong Guon Ih [15] dealt with the issues of the
identification and localization of noise sources using the sound intensity
method for a reactive field. For these purposes, a three-dimensional model
structure similar to the engine room of a passenger car was assumed. The
model contains complicated noise sources distributed within the small space,
including narrow and reflecting planes constructed with rigid boxes.
For this model, the near field acoustic intensity is calculated by scanning over
the upper plane opposite to the bottom by using the acoustic boundary
element method. It was observed that the application of sound intensity
method without proper care in this situation can yield the detection of fake
sources. Therefore, the sound intensity scanning over the engine room
upper, with its hood open, may indicate the false positions or components as
noise sources. The field reactivity has to be checked and the care should be
attended in this type of measurement using the sound intensity methods. [15]
Dumbacher et al [16] studied acoustic array techniques as an alternative
method for noise source identification. The basic theory of array procedures
for nearfield acoustical holography and an inverse frequency response
function technique are given. Experimental evaluation was provided for tire-
road interaction noise identification.

15
The sound pressure measurements from the microphone array can be done
by a number of suitable techniques to provide an estimate of the location and
magnitude of sound sources. In the automotive industry, such an estimate is
useful for identifying airborne and structure-borne sources such as wind
noise, tire noise and sheet metal parts’ vibration to noise contributions on an
engine dynamometer, and pass-by noise source localization. [16]
The array techniques evaluated in the paper include nearfield acoustical
holography, temporal array methods, and an Inverse frequency response
function method. [16]
The above mentioned studies generally dealt with the engine noise. Ki-Sug
Oh et al [17] studied on axle noise and its effects. After having reduction in
engine noise, the axle has become an important noise source in sport utility
vehicles due to the reason that these vehicles are generally used off-road.
The study introduces both experimental and analytic analyses for reducing
the whine noise generated by axles of the vehicle. The test vehicle has a 5-
cylinder diesel engine. The vehicle is driven from 40 km/h to 130 km/h to
measure the interior noise and vibration due to the fact that whine noise
occurs in this speed range. The overall sound levels of vehicle interior noise
were measured between 65 dB (A) and 70 dB (A). The suspension system of
the vehicle has nine vibration transfer paths from the axle system to the
chassis. Through these paths rubber vibration isolation mounts were installed
between the axle system and the respective link and between the link and
the chassis frame. To recognize the transfer path of the interior noise caused
by axles, a vibration path analysis, modal analysis and operational deflection
shape analysis are systematically accomplished. The vibrations at several
points of the axle are measured by using accelerometers attached to the axle
system to describe the transfer path of the vibration from the axle system to
the car body. [17]

16
Structural changes were conducted to reduce the noise generated by axles.
Finally, the stiffness of the axle system was changed by stiffening the rib on
the carrier cover and increasing the thickness of the carrier to reduce the
vibration and radiated noise of the axle system. [17]
Another noise control study including spectral analysis methods was
completed by Yalçınkaya [18] for Backhoe Loaders having an attenuation of
2 dB. The thesis aimed at controlling the noise emitted by the Backhoe
Loader with noise source identification methodology including sound power
level determination tests, coherent output power tests and sound intensity
measurements. Comparative evaluation of results of spectral analysis of
exterior noise emitted by the machine with possible noise sources reveals the
possible noise source frequencies as cooling fan blade passing frequency,
hydraulic pump operational frequency and engine firing frequencies.
Changing the design of cooling fan and applying proper vibration isolation
parts helped to decrease overall sound power level by 2 dB.
2.2 Noise Control Strategies
There are basically three ways in any noise control study;
• Noise control at the source of the sound
• Noise control along the path through which the sound travel
• Noise control at the receiver of the sound
The 3rd item was not a proper way for this thesis study because the aim of
the study is to reduce the noise levels of the machines. Therefore, the 1st
and 2nd items were used in the thesis. Noise and Vibration in dynamic
systems can be decreased by a number of means. These can be generally
classified into active, passive, and semi-active methods.

17
Active control includes the use of certain active elements like speakers,
actuators, and microprocessors to produce an ‘‘out-of phase’’ signal to
electronically mask or cancel the disturbance. Active and semi-active noise
control applications are not generally used in automotive industry due to their
complexity and high cost levels. Due to the fact that passive noise control
applications are simple to assemble and economical, they are commonly
used on tractors or other vehicles.
The most commonly used passive control ways for air-borne noise include
the use of absorbers, barriers, mufflers, silencers, etc. For reducing
structure-borne vibration and noise, several methods are also available.
Sometimes, by changing only the system’s stiffness or mass to modify the
resonance frequencies can decrease the unwanted vibration as long as the
excitation frequencies do not change.
However, the vibrations need to be isolated or dissipated by using isolator or
damping materials. For example, Rao [19] described the application of
passive damping technology using visco-elastic materials to control noise
and vibration in automotive industry. Special damped laminates and spray
paints suitable for mass production and capable of forming with conventional
techniques are now manufactured in a continuous manner using advanced
processes. These are widely used in the automotive industry in some
applications to reduce noise and vibration.
The use of damping treatment in the automotive and aerospace industries is
made possible by the advancements in production processes that are cost-
effective and suitable for high volume production. [19]
Ghosh et al [20] studied to control the noise level of a diesel engine by
developing a new exhaust muffler, since exhaust as a noise source might be
the single biggest contributor to the overall noise from the engine.

18
For the same power rating, diesel engines are noisier than gasoline engines,
since the combustion characteristics of diesel engines produce more
harmonics than the slower combustion of gasoline. An unmuffled gasoline
engine emits exhaust noise in the range from 90 to 100 dB (A), while an
unmuffled diesel engine under identical conditions emits exhaust noise in
range from 100 to 125 dB (A). This work aims at improving a new muffler for
the vehicle having a diesel engine and then comparing the results in terms of
both acoustic performance and engine performance with respect to an
unmuffled exhaust system of a vehicle. [20]
A new design, by Ricardo with the application of the engine performance
simulation program, was taken up, and this was modified in certain aspects
to be fit the engine used in the study. The muffler was produced and data
were recorded for evaluation of the acoustic performance as well as the
engine performance and for purposes of comparison with the existing muffler
as well as with the unmuffled exhaust system. The new muffler was found to
be better than the existing one in terms of both acoustic performance and
engine performance. [20]
With the new muffler, the maximum noise reduction was 19.3 dB (A) and the
maximum brake thermal efficiency was 39 per cent, while with the existing
muffler the corresponding values were 14.5 dB (A) and 37.4 per cent. This
work finally experimentally shows that the results from software can be
changed and applied to an alternative design. [20]
Besides the previous mentioned study, Ghosh et al [21] aimed at predicting
the noise level by mathematical modeling the exhaust muffler and validating
the analytical results with the experimental results of engine. Since the
pressure drop in an exhaust muffler plays an important role for the design
and development of a muffler, the prediction of pressure drop by
mathematical modeling will be very useful for the design and development of
muffler.

19
It was observed that brake thermal efficiencies without muffler and existing
muffler were little higher than that of modified muffler. The brake thermal
efficiency with modified muffler is little less than the without muffler, because
of the higher pressure drop in case of modified muffler in comparison to
without and existing mufflers. When sound level was 116.8 dB (A) by without
muffler, at that time we get sound level 96.4 dB (A) within existing muffler,
82.2 dB (A) within the new modified and fabricated muffler and finally 77.047
dB (A) from mathematical modeling. It was interesting to note down the
variations between the sound levels variation measured by modified and
fabricated muffler and theoretical muffler is 4.3%. This was simply due to the
reasonable assumptions taken in the mathematical modeling. [21]
The prediction of intake system noise of an internal combustion engine is one
of the important issues regarding the noise attenuation of an internal
combustion engine. In the study of Jeong-Guon Ih et al [22], noise source
parameters of an engine intake system during running-up conditions were
measured by using the direct method employing two external loudspeakers,
turned on simultaneously, and three microphones for the separation of
upstream and downstream wave components. Predicted insertion loss and
radiated sound pressure level using the measured source parameters were
compared with those of measured data and predicted data employing several
idealized source models which have been adopted for the calculations.
Even for the frequencies of firing harmonics, it was shown that the prediction
precision was enough for the practical application in the acoustical
development of automotive intake system. The measured source parameters
were compared with the idealized source models such as constant pressure
source, constant volume-velocity source, and anechoic source. Idealized
source models yielded poor prediction of the insertion loss and radiated
sound pressure loss in comparison with those predicted with measured
impedance. [22]

20
Considering these results in mind, it was suggested that, for the purpose of
approximate calculation of the overall trend of insertion loss and radiated
sound pressure loss of the intake system, anechoic source model and
measured source impedance with a cold engine condition could be good
alternatives. [22]
Another noise attenuation application for tractors or heavy-duty vehicles can
be accomplished by cutting down the hydraulic pump noise.
Tractors are equipped with external gear pumps in order to feed the hydraulic
systems to operate and lift the implements necessary on the field work.
These external gear pumps basically suck the oil at one side and send it to
the other side with the required properties, pressure, flow, etc. The external
gear pumps have two meshing gears generating required vacuum at one
side. These gears are mainly spur gears due to cost and easy operational
reasons.
However, it had already been shown that using helical gears instead of spur
gears decreased considerably the overall noise level of hydraulic pump.
Cesare Angeloni [23] published an article in Machine Design Magazine about
gear pumps noise reduction. Conventional, high-pressure gear pumps are
noisy because they trap and compress fluid between gear teeth as it rotates.
The result is a sharp pressure rise that generates noise especially above
about 1,500 rpm. Continuous-contact pumps feature helical gears that do not
trap fluid as they rotate, as is the case with conventional gear pumps. This
minimizes pressure ripple and gives high efficiency and quiet operation at
speeds to 5,000 rpm. The Continuous-contact pump design eliminates
compressed oil between gears, yielding smooth pressure changes, high
efficiency, and quiet operation at speeds to 5,000 rpm. Besides, noise levels
range from 52 to 68 dB (A) at 2,750 rpm, based on ISO 4412 testing.

21
An experimental thesis work was completed by Fatma Ceyhun Şahin [24] in
2007. Thesis study was focused on experimentally investigating pump noise
at design and off-design operations and its relations with pressure
fluctuations. Two small size pumps are placed in a semi-anechoic chamber
and operated at various system conditions and speeds. Pump operational
data, noise data and time dependent pressure data are recorded. Coherence
spectrum between sound pressure level and hydraulic pressures at inlet and
outlet are obtained. During study specific software Soundbook SAMURAI
was used. The experiments have indicated that system characteristics or
pump size do not have any influence on the noise of pump investigated in the
study.
On the other hand, pump characteristics are found to be distinguishable by
means of peak frequencies on the sound spectra which are proportional to
blade passing frequency. Results of cross correlations also show that, pump
outlet pressure is a more significant source of noise than pump inlet
pressure. [24]
2.3 Flow Induced Noise
Frequently in commercial work in the oil and gas sector, one can come
across situations in which the flow of gas through a given component
generates extremely high levels of noise. This noise can be an occupational
hazard, environmental or safety issue and in certain cases can lead to
equipment damage.
Tractors have hydraulic systems in which pipes and hoses are used mostly to
transfer hydraulic oil. Short-term management of the problem involves
expensive loss of productivity and long-term solutions can be extremely
costly, not least owing to the downtime necessary to install them.

22
In order for a treatment solution to be cost effective, the problem must first be
accurately diagnosed and second the effectiveness of the treatment must be
accurately and reliably evaluated. Both these aspects require prediction
methods that are accurate and reliable, but at the same time fast enough to
be employed in design iterations.
Direct flow simulation has not yet advanced sufficiently to be able to predict
noise generation and analytical techniques, while playing an extremely
important role in establishing engineering practice, are insufficient on their
own. Naturally, empirical methods have played an essential role in the
development of current methodologies, but for trouble-shooting new or
modified geometries, they are extremely time-consuming and expensive.
Flow induced noise and its effects can be seen in other industries as well as
in automotive industry. Faruk Emre Güngör [25] studied the some of the
noise source like air-flow noise, fan noise in HVAC systems and prepared
noise prediction software for HVAC systems. Aerodynamic noise from all
types of fans can be broadly divided into a rotational component and vortex
component associated with turbulent mixing process.
The rotational component is associated with the impulse given to the air each
time a blade passes a given point and is hence a series of discrete tones at
the fundamental blade passing frequency and harmonics thereof. In addition
to aerodynamic noise, there are usually several non-aerodynamic sources of
noise in equipment involving fans as well as other types of rotating
machinery. [25]
Such mechanical sources include noise resulting from unbalance and
misalignment, bearing noise, brush noise, magnetic noise, and belt noise.
The number of blades of a centrifugal fan generally is governed by optimum
airflow design. [25]

23
The noise generation decreases but slightly for more than the optimum
number of blades. A shroud around a propeller fan may serve to reduce
noise considerably if it is working properly. Such a reduction is generally
most effective at the higher harmonics. However, if the flow breaks down
over part of the shroud, the noise may become considerably worse than for
an un-shrouded case. As the operating pressure across axial fans is
increased, the maximum sound intensity is shifted from the fundamental to
higher harmonics. This effect is not observed for centrifugal fans. [25]
Although fans are a major source of sound in HVAC systems, they are not
the only sound source. Aerodynamic sound is generated at duct elbows,
dampers, branch takeoffs, air modulation units, sound attenuators, and other
duct elements. [25]
Produced by the interaction of moving air with the structure, the sound power
levels in each octave frequency band depend on the duct element geometry
and the turbulence of the air flow and the air flow velocity in the vicinity of the
duct element. During the study, noise prediction software focused mainly on
the noise sources generated by flow induced noise. [25]
The previous study was about the air-flow noise sources in HVAC systems.
This type of study was done for axial fans in railcar systems by Cleon and
Williaime [26].
The study illustrated the operation of an axial fan and then the main sources
of noise generated by this type of fan. The interactions between acoustic
emissions and mass output are then described to illustrate the advantages of
an acoustic and pneumatic predictive device. Finally, a newly designed of
axial fan on the railcar reduced the noise emission by 10 dB (A) without
decreasing the original cooling performances. Besides, this application
helped to reduce energy consumption. [26]

24
CHAPTER 3
IDENTIFICATION OF NOISE SOURCES
3.1 Methodology
This thesis is aimed at identifying the possible noise sources of a wheeled
tractor and reducing the noise levels below the necessary legislative limits by
controlling these noise sources using the proper methodologies.
These methodologies consist of sound intensity measurements and spectral
analysis of exterior noise and comparison of data acquired by these tests. In
order to understand the current situation of original prototype tractor’s noise
levels, the operator’s ear and pass-by noise levels of original prototype
tractor were measured and compared to the legislative limits shown in Table
3.1.
Table 3.1 Legislative Noise Limits
Wheeled Tractors Noise Level Limit
Legislation Description dB (A) 74/151 [2] Pass-By 89
77/311 [1] Operator's Ear 86
Then, sound intensities at three sides of the tractor were measured. Sound
levels were measured on the test tractor to generate a basis for thesis
research at the early stage.

25
During these measurements and tests, as a first impression, at the engine
idle speed and the test tractor is at stationary position, the engine noise is
noticed clearly. However, considering the measurements when the tractor
moves shows that there is noticeable transmission noise or drive-train noise.
Spectral analysis of the noise radiated by the test tractor is conducted to
describe the current situation. Estimates for frequency spectra of noise at
front, right and left sides were obtained. Possible noise sources of the
machine are examined through inspection of these estimated spectra. That
is, frequencies at which peaks are observed in the noise spectra are
compared with the calculated operational frequencies of the possible noise
sources. The classification of the sources helps to clarify the sources.
There are several dominant and minor possible noise sources on tractors. It
is important to classify them according to their contribution into overall sound
power emitted by tractor. However, it is not easy to identify and control all the
possible noise sources. Usually, it is a better engineering approach in terms
of cost management to know which source has the biggest contribution and
which source has the smallest. Therefore, sound pressure spectra are
inspected to understand the significance of each frequency. Due to this fact,
noise source ranking is used in noise source identification studies. The
necessary terms and formulae et al [27] are described for noise source
ranking. The physical acoustic pressure based on sound pressure level can
be expressed as;
⎥⎥⎦
⎤
⎢⎢⎣
⎡=
ref
rmsPPLp log20 [dB] (3.1)
where the reference pressure is taken as,

26
61020 −= xPref [Pa] (3.2)
By using this equation, with known A-weighted sound levels at each
frequency, one can calculate A-weighted acoustic pressure values for each
frequency. Also, the overall A-weighted acoustic pressure value can be
calculated. Therefore, the ratio of an acoustic pressure of a chosen
frequency over the overall pressure will be acquired.
( )620 102010 −= xxPpL
rms [Pa] (3.3)
( )620 102010 −= xxPip
i
L
[Pa] (3.4)
Finally the ratio is,
100xPP
RATIOrms
i
⎟⎟⎠
⎞⎜⎜⎝
⎛= [%] (3.5)
Where,
iP : A-weighted acoustic pressure value for thi frequency
rmsP : A-weighted acoustic pressure value for whole frequency range
pAL : A-weighted sound level value for whole frequency range
ipAL : A-weighted sound level value for thi band frequency

27
Noise source ranking should be done by using A-weighted sound levels,
because A-weighted values are more correlated with hearing loss incurred
for comparison concerning on humans due to exposure to noise. The A-
weighting is the standard weighting for outdoor community noise
measurements and is commonly used for noise measurements within
architectural spaces and within vehicles. It accounts for the sensitivity of
human ear to low intensity sounds. The A-weighting reduces the sensitivity of
the measuring instrument to both low and very high frequency sounds. In the
study, each frequency is considered as a noise source, and the
corresponding amplitude at that frequency can be considered as the
contribution by that noise source. If the ratio (Equation 3.5) of source level
(Equation 3.4) to the overall level (Equation 3.3) is calculated, then the
amplitude at that frequency, i.e. the contribution of that noise source can be
acquired.
Dominant peak center frequencies where noise energy peaks out in the
spectral analysis are obtained. These observed frequencies from spectral
analysis are compared with the operational frequencies on the tractor. The
peaks are measured, ranked and finally classified. After this comparison,
some of the noise sources can be identified.
Nevertheless, this method cannot be used for the sources with high ranking
and not related with operational frequencies. These types of unidentified
sources are accepted as either hydrodynamic or vibro-acoustic originated
sources. So, it would be better to reveal the relation between the bandwidth
of the mentioned peaks in the spectra between vibrating parts of tractor and
the measured noise. The peaks with wider bandwidth could be from
hydrodynamic origin and on the other hand the peaks with narrower
bandwidth could be from vibro-acoustic origin.

28
It is known that anything moving or spinning in a direction at any speed will
generate vibration at some level. Most systems will experience wear in time,
increasing vibration levels. It needs only a small amount of vibration energy
to generate noticeable, audible noise. In other words, a small vibration force
can create a significantly audible noise problem. The unidentified vibro-
acoustic originated sources should be investigated by means of tractor plates
called fenders covering tires, front hood covering engine and steps or
platform on which seat and operator were positioned.
On the other hand, hydro-acoustics or hydrodynamic originated noise term
developed from the need to understand the causes and origin of flow-induced
noise. The major way to the knowledge has been the study of sound
generated by particular flow processes. The source of sound, rather than the
sound itself, became the center of attention, and real problems of identifying
the source had their origin in the fact that the source is ambiguous. That is,
the source determines the sound but the sound cannot prescribe the source.
Hydrodynamic sources are always associated with unsteady flow, most noisy
flows being unsteady. Small perturbations about the steady state grow into
turbulent sources of sound. Sound generated by turbulence can be the
triggering disturbance of instabilities that grow into turbulence.
Another detailed analysis to study these vibro-acoustic and hydrodynamic
noise sources is the measurement of sound intensities. Sound intensity is the
measurement of flow of sound power through a unit area. In addition to this
description, sound intensity can be defined as sound energy flux at a certain
point or surface.
UPIrr
= (3.6)
∫=S
n dSIW (3.7)

29
In discrete sense, Equation (3.7) can be thought as,
∑=
=N
iini SIW
1 (3.8)
where,
P: Instantaneous Pressure at a Point (Pa)
Ur
: Particle Velocity Vector at a Point (m/s)
Ir
: Sound Intensity Vector (W/ m²)
W : Sound Power (W)
S : Surface Area (m²)
Sound intensity can be calculated by Equation (3.6). It is seen that sound
intensity is a vector quantity. Moreover, sound power of a source could also
be calculated using sound intensity measurements on the hypothetical
surfaces such as, hemispheres, box shapes, etc. The surface can be divided
into equal sized grids and over each grid center sound intensity is measured.
Then intensity values and the total area are used to calculate sound power
emitted by that side of the tractor. As a more general explanation, sound
intensity can be used for the determination of sound power, noise source
location and determination of the transmission loss of structures. The sound
power can be determined from intensity measurements on a hypothetical
enveloping surface enclosing the noise source. The sound power calculation
using sound intensity measurements is covered in relation to the ISO
standards numbered as 9614-1 [8], 9614-2 [9] and ISO 9614-3 [10].

30
This surface can be a hemisphere or a cube. Considering the fact that sound
intensity is a vector quantity, steady background noise does not affect the
measured data in sound intensity measurements. Consider a steady
background noise source in an environment where sound intensity test was
conducted. Sound power emitted by background noise source for the
measurement surface is calculated as zero, because the net sound energy
propagating into hypothetical surface is zero. As a result, background noise
does not affect the intensity measurement for the source of interest.
Therefore, sound power levels can be calculated both from sound pressure
measurements and sound intensity measurements. Advantages of
calculating sound power levels from sound pressure measurements might be
summarized as;
• The instrumentation is more available and is quite cheaper
• Sound pressure is quite easy to measure and do not require expertise
• Numerous international standards are available for converting sound
pressure measurements to sound power levels
On the other hand, advantages of calculating sound power levels from sound
intensity measurements can be summarized as;
• The measurements can be carried out in an open site eliminating the
requirement of special chambers or rooms
• The effect of continuous background noise need not be considered due
to the fact that sound intensity is a vector quantity
• Intensity measurements help to determine the direction from which the
noise tends to propagate.

31
3.2 Sound Intensity Mapping As it was mentioned earlier, sound intensity is the measurement of flow of
sound power through a unit area. This measurement quantity, i.e. sound
intensity is a vector quantity and hence it has both magnitude and direction.
This measurement tends to help the designers to determine the direction
from which the noise tends to propagate.
Sound intensity measurement tests form a basis for the determination of
sound power. Moreover, it provides an edge over sound pressure
measurements because of its capability to phase out steady background
noises. This also has the advantage of measuring the noise intensity in the
near field of the machines.
Sound intensity values can be negative or positive. If it is negative, then it
means that there is sound energy absorption instead of propagation.
Whereas, if it is a positive value, then this time it is called as the source
behavior because it means that there is energy flow away from the source.
Measuring sound intensity and calculating sound power is a necessary
process to be done during noise source identification applications. One of the
other advantages of sound intensity measurements includes the ability to
determine the directionality of sound, and to quickly localize noise "hot
spots". In order to show these “hot spots”, it is important to generate intensity
maps. Proper mapping software will provide the noise engineer with a
contour map of noise levels for use in noise control studies on tractors or any
other industrial products.
The pictures shown below are from different industries related to intensity
mapping applications. In Figure 3.1 an intensity map for a washing machine
is shown. The “hot spots” appeared at the bottom of the washing machine.

32
In Figure 3.2, an intensity map for an earth moving machine and in Figure
3.3, an intensity map for an internal combustion engine is shown.
Figure 3.1 The intensity map of a washing machine [33]
Figure 3.2 The intensity map of an earth moving machine [34]

33
Figure 3.3 The intensity map of an internal combustion engine [35]
As it can be seen in above figures, the so called “hot spots” can be clearly
identified as in red color having the highest intensity values. By analyzing and
studying these intensity maps carefully, design engineers can focus on the
“hot spots” and apply necessary noise control applications to these “hot
spots”. Otherwise, it will be very difficult and time-consuming using trial-and-
error type efforts.

34
3.3 The Test Tractor T480 The study of this thesis work has been done on the test tractor named as
T480 for domestic market. The pictures of T480 tractor can be seen in
Figures 3.4 and 3.5. The tractor is a 2-wheel drive less cab tractor having a
48 Hp, naturally aspirated, diesel engine and a very economical small duty
driveline for basic agricultural work especially for vineyards and orchard
applications.
The developed noise source identification methodologies and noise control
strategies have been applied to T480 tractor.
Figure 3.4 The Side View of the Test Tractor
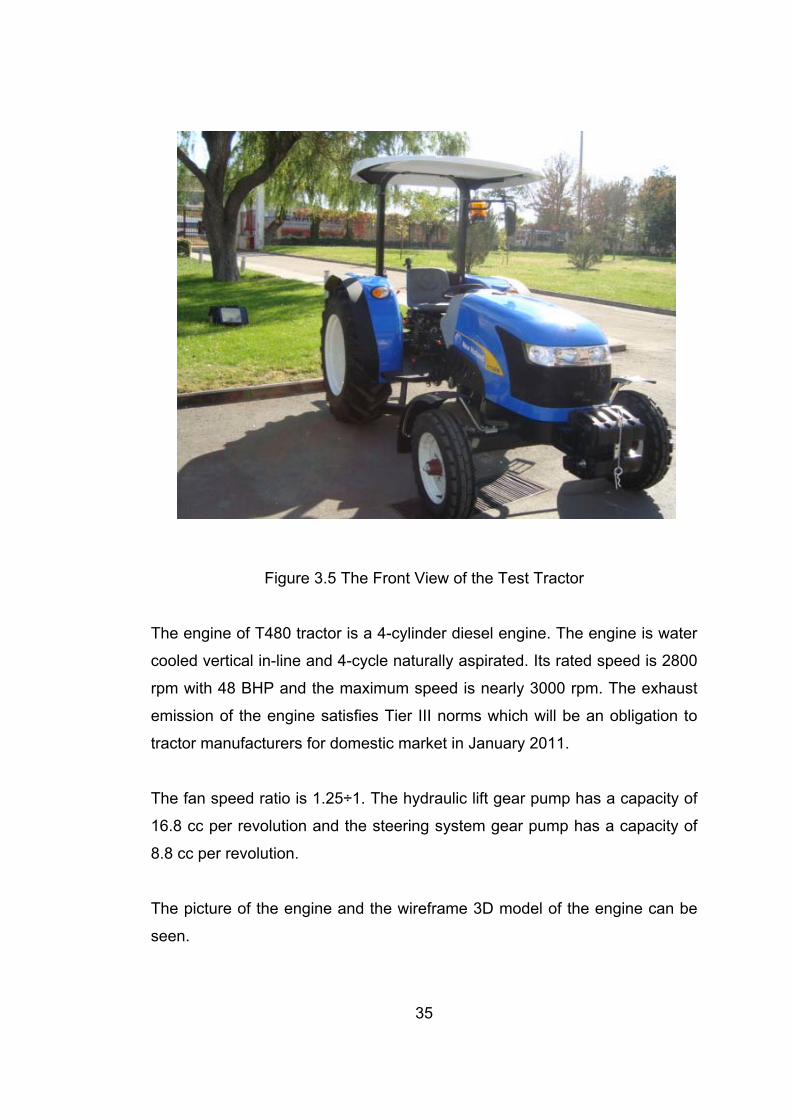
35
Figure 3.5 The Front View of the Test Tractor
The engine of T480 tractor is a 4-cylinder diesel engine. The engine is water
cooled vertical in-line and 4-cycle naturally aspirated. Its rated speed is 2800
rpm with 48 BHP and the maximum speed is nearly 3000 rpm. The exhaust
emission of the engine satisfies Tier III norms which will be an obligation to
tractor manufacturers for domestic market in January 2011.
The fan speed ratio is 1.25÷1. The hydraulic lift gear pump has a capacity of
16.8 cc per revolution and the steering system gear pump has a capacity of
8.8 cc per revolution.
The picture of the engine and the wireframe 3D model of the engine can be
seen.

36
Figure 3.6 The Engine Wireframe 3D Model
Figure 3.7 The Front View of the Engine

37
In order to be able to start the study, the original tractor’s noise levels are
measured. Obtained sound pressure level is compared with the permissible
maximum level stated in the legislations.
Operator’s ear noise level was measured according to the instructions stated
in the legislation. After the comparison, it was seen that the operator’s ear
noise level of the original prototype tractor was higher than the legislative
limit, 86 dB (A). Potential noise sources of the tractor can be seen in Figure
3.8.
Figure 3.8 Potential Noise Sources on the Tractor
Steering motor Hydraulic
Pump and Steering Pump
Exhaust Pipe
Cooling Fan & Fan Shroud
Transmission Box; Speed/Range Gears
Fuel Tank
Muffler
Steering pipes
Engine

38
According to the legislation 77/311/EEC, the noise level for T480 tractor must
not exceed 86 dB (A). The first set of measurements taken from the original
prototype T480 tractor completed in September 2009. Measurements
showed that the original prototype tractor’s noise level is between 88.5 dB (A)
and 89 dB (A). Therefore, 3 dB (A) reduction in noise levels at the operator’s
ear should be achieved to meet the requirement stated in the directives and
to complete the processes necessary for a complete tractor homologation.
Noise sources on the tractor should be determined. Spectral analyses of the
exterior noise from three sides of the machine are performed. Operational
frequencies on the machine are first calculated. Then, these frequencies are
compared with the estimated frequencies in the spectral analyses.
Generally, noise sources can be mainly classified in three groups:
• Sources related to the engine rotational speed
• Sources not related to the engine rotational speed (vibro-acoustic,
hydrodynamic or hydro-acoustic, aero-acoustic)
• Other sources.
For example, cooling fan rotational frequency, fan blade passage frequency
and engine firing frequency can be classified into the first group. However,
vibration due to fender could be covered under third group.
Noise source ranking is the next step in thesis methodology. Flow generation
devices such as cooling fan or engine and firing are the most potential
sources which can be identified with the operational speed. In addition to this,
the uncorrelated sources with operational speeds, classified into the second
group, are also found to be that they are relatively of higher importance.

39
Sound intensity measurements are carried out to examine the vibro-acoustic
noise level radiated from mainly large surfaces in vibration like front hood,
fenders or hydraulic and steering pumps. Moreover, intensity maps were
generated to describe the noise emission from these areas.
Acoustic intensities on front hood, fenders, exhaust pipe and hydraulic pump
should be measured; because the area of the front hood is larger than the
other parts of the machine. The front hood due to its size might act as a
possible vibro-acoustic noise source. The operational frequency of the
hydraulic pump is also investigated by analyzing results of intensity
measurements.
During original prototype tractor’s measurement tests in which the test tractor
is moving at the required speed, it was realized that there is significant drive-
train noise. Tests have been conducted to verify this statement. Hence, this
drive-train noise could cause structure-borne noise as well.

40
CHAPTER 4
EXPERIMENTAL STUDIES
The original prototype tractor used during the experiments is manufactured
by Türk Traktör and Ziraat Makineleri A.Ş. These experiments were
accomplished on an engine having a 4-cylinder diesel engine. The engine is
water cooled vertical in-line and 4-cycle naturally aspirated. Its rated speed is
2800 rpm with 48 BHP and the maximum speed is nearly 3000 rpm. There
are two separate hydraulic pumps on the test tractor. One of them is the
hydraulic pump a fixed displacement external gear pump. This pump serves
the necessary flow 16.8 cc/rev to the main hydraulic system including the
tractor’s hydraulic lift. The other pump is the steering pump serving flow to
the steering system, i.e. steering motor of the tractor. This pump has 8.8
cc/rev flow rate. Both pumps can be seen in Figure 4.1.
Figure 4.1 The Left View of the Engine Wireframe

41
The specifications for both hydraulic and steering pumps are given in Tables
4.1 and 4.2.
Table 4.1 Specifications of the Steering Pump on the Engine
Specifications of Steering Pump
Volume [ cc/rev ] 8,8 Maximum Pressure [ MPa ] 13,7 (140 kgf/cm2) Instantaneous Max. Pressure [ MPa ] 16,2 (165 kgf/cm2) Pump Speed [ rpm ] 600 ~ 3000
Table 4.2 Specifications of the Hydraulic Pump on the Engine
Specifications of Hydraulic Pump
Volume [ cc/rev ] 16,8 Maximum Pressure [ MPa ] 17,2 (175 kgf/cm2) Instantaneous Max. Pressure [ MPa ] 20,6 (210 kgf/cm2) Pump Speed [ rpm ] 600 ~ 3000
Noise level experiments will be classified into three groups:
1. Sound Power Level Determination
2. Spectral Analysis of Tractor Noise
3. Sound Intensity Measurements
Tests related to tractor noise source identification studies will be explained in
detail. Firstly, original sound power level of the machine is determined.
Secondly, frequency spectrum of the exterior noise is determined. This
spectrum is evaluated with the expected dominant noise frequencies in terms
of tractor operational frequencies. Third step is a rather more detailed noise
source identification technique called sound intensity technique.

42
Fourth step is the comparison of the results and finally fifth step is the final
measurements on the tractor having final modifications and explaining the
changes, applications and their comparisons.
4.1 Sound Power Level Determination Using Sound Pressure Level Measurements
Effective noise source identification studies require measurement of sound
pressures and intensities. When a noise source generates noise, the sound
pressure from that source is generally dependent on the surroundings.
Because, the sound pressure level will be different for the same source
whether the source is positioned indoors or outdoors.
On the contrary, the sound power is generally independent of surroundings.
Due to this reason, for design engineers who are interested in noise control
applications, sound power calculations and comparisons are essential. Also,
European Union requires the declaration of noise emissions in terms of
sound power levels otherwise stated.
However, the sound power cannot be measured by using equipments. It can
only be calculated and there are two ways to calculate it. One way is to
calculate sound power from sound pressure levels and the other way is to
calculate it from sound intensity levels together with necessary surface area
and time values.
In the literature, there are 7 ISO standards explaining how to calculate sound
power from sound pressures. These ISO standards can be seen below list.
• ISO3740:2001 Acoustics: Determination of sound power levels of
noise sources. Guidelines for the use of basic standards [40]

43
• ISO3741:2000 Acoustics: Determination of sound power levels of
noise sources using sound pressure. Precision methods for
reverberation rooms [41]
• ISO3743-1:1995 Acoustics: Determination of sound power levels of
noise sources. Engineering methods for small, movable sources in
reverberant fields. Comparison for hard-walled test rooms [42]
• ISO3743-2:1997 Acoustics: Determination of sound power levels of
noise sources. Engineering methods for small, movable sources in
reverberant fields. Methods for special reverberation test rooms [43]
• ISO3744:1995 Acoustics: Determination of sound power levels of
noise sources using sound pressure. Engineering method in an
essentially free field over a reflecting plane [44]
• ISO3746:1999 Acoustics: Determination of sound power levels of
noise sources using sound pressure. Survey method using an
enveloping measurement surface over a reflecting plane [29]
• ISO3747:2000 Acoustics: Determination of sound power levels of
noise sources using sound pressure. Comparison method in situ [45]
Among these standards, ISO3746:1999 [29] was taken as a reference for the
calculation method due to its application which can be done over a reflecting
surface, such as a tractor parking fleet area.
As it was explained in ISO3746:1999 [29], the sound power generated by a
source can be measured in an open field free from nearby reflective surfaces
while the engine was running at about maximum speed of 3000 rpm. Three
microphone locations were selected and necessary measurements were

44
recorded. Figure 4.2 shows an example of test area and microphone
locations. The radius of hypothetical sphere is 4m, which is nearly twice the
wheel base of tractor. According to ISO3746:1999 [29], the radius must be at
least 3m.
Figure 4.2 The Sketch Showing Microphone Locations of the Test Area [29]

45
Figure 4.3 Microphone Locations on the Test Site
According to ISO3746:1999 [29], the sound power calculation can be done
by using the formulae;
'pAL ⎥
⎦
⎤⎢⎣
⎡⎟⎠⎞
⎜⎝⎛= ∑
=
N
i
L pAi
N 1
1.0 '
101log10 [dB (A)] (4.1)
Where;
'pAL : Average A-weighted sound pressure level of sound source for the
reference surface area

46
'pAiL : A-weighted sound pressure level as dB for thi microphone location
N : Number of microphone positions
Normally, depending upon test environment and process, some correction
factors should be considered during these calculations. However, since the
difference between the background noise measured during tests and the
sound pressure levels is above 10 dB, there is no need to have a correction
factor for these calculations as it was explained in ISO standard.
Since there are no correction factors,
'pApfA LL = (4.2)
Finally, the sound power equation becomes,
⎟⎟⎠
⎞⎜⎜⎝
⎛+=
0
log10ssLL pfAWA [dB (A)] (4.3)
Where,
s : Measurement Surface Area (m²)
And the reference area is,
0s : 1 m²
The measurement surface area is then,
2rs π= , mr 4=

47
4.2 Spectral Analysis of Exterior Noise on the Test Tractor In order to identify noise sources, spectral analysis of noise emitted by tractor
which is the second step in the methodology was performed.
Measurements were carried out in free field where test site is tractor fleet
area having asphalt surface in compliance with the standards. The test
tractor is located at the center of the enveloping sphere as shown in Figure
4.4. Transmission of the tractor is in neutral position and the engine is kept
running at nearly 3000 rpm.
Both tests were conducted in an open free field. Due to size of the tractor,
there should be no sound-reflecting surface near the test area.
Meteorological conditions such as weather, wind speed, relative humidity and
temperature data are all recorded. Measurements are not performed during
precipitation. In case of exceeding wind speed from 1 m/s, windscreen over
the microphone is used. If wind speed exceeds 5 m/s, the sound level
measurement tests should not be done.
In order to obtain steady state conditions, before measurements, the engine
and the hydraulic system had run for some time to bring tractor up to normal
operating condition temperatures.
In Figure 4.4, three sides used on spectral analysis can be seen. These are
front, left and right sides. Rear side was not used during measurements. And
in Figure 4.5, the measurement area can be viewed.

48
Figure 4.4 Microphone Locations on the Test Area of Spectral Analysis
Figure 4.5 Measurement Area

49
4.3 Sound Intensity Measurements Sound intensity measurements providing the location and the frequency
information of sound energy flux from the tractor is the third step in the noise
source identification methodology. Sound intensity radiated by the test tractor
is measured over suspected vibro-acoustic noise sources such as engine
front hood and hydraulic pump. The grid application was done by using the
grid instrument designed and produced by R&D Department of Türk Traktör
and Ziraat Makineleri A.Ş. The grid frame has a flat surface divided into grids
with edge lengths of 200mm and 200mm. This frame can be seen in Figure
4.6.
Figure 4.6 The Grid Frame used for Sound Intensity Measurements
Start Grid
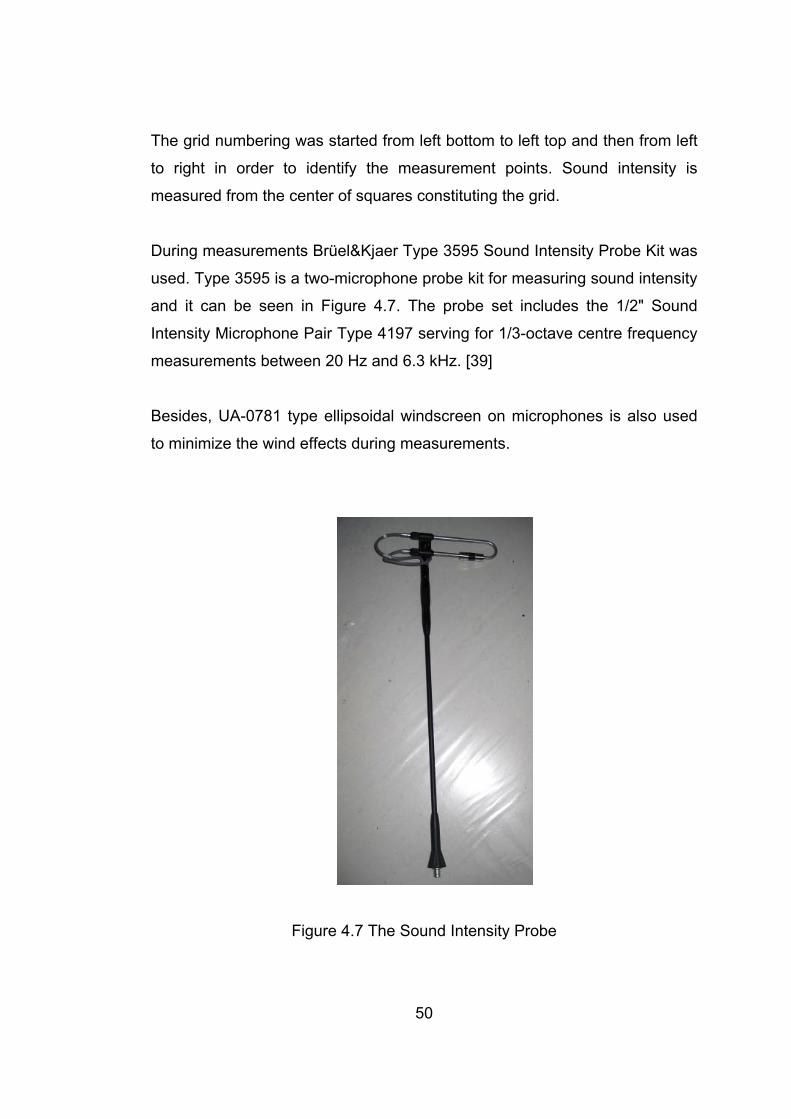
50
The grid numbering was started from left bottom to left top and then from left
to right in order to identify the measurement points. Sound intensity is
measured from the center of squares constituting the grid.
During measurements Brüel&Kjaer Type 3595 Sound Intensity Probe Kit was
used. Type 3595 is a two-microphone probe kit for measuring sound intensity
and it can be seen in Figure 4.7. The probe set includes the 1/2" Sound
Intensity Microphone Pair Type 4197 serving for 1/3-octave centre frequency
measurements between 20 Hz and 6.3 kHz. [39]
Besides, UA-0781 type ellipsoidal windscreen on microphones is also used
to minimize the wind effects during measurements.
Figure 4.7 The Sound Intensity Probe

51
In this experiment, the distance between the measurement surface and the
microphones was chosen not to be closer than 300mm. In addition to that,
12mm microphone spacing was chosen due to its frequency range from 20
Hz and 6.3 kHz.
Calibration is performed by Brüel&Kjaer Type 4231 with its adapter type DP-
0888. Calibrator can be seen in Figure 4.8 below.
Figure 4.8 The Sound Calibrator
The Sound Level Meter Type 2260 Brüel&Kjaer was used during all sound
pressure level and intensity measurements and it can be seen in Figure 4.9.
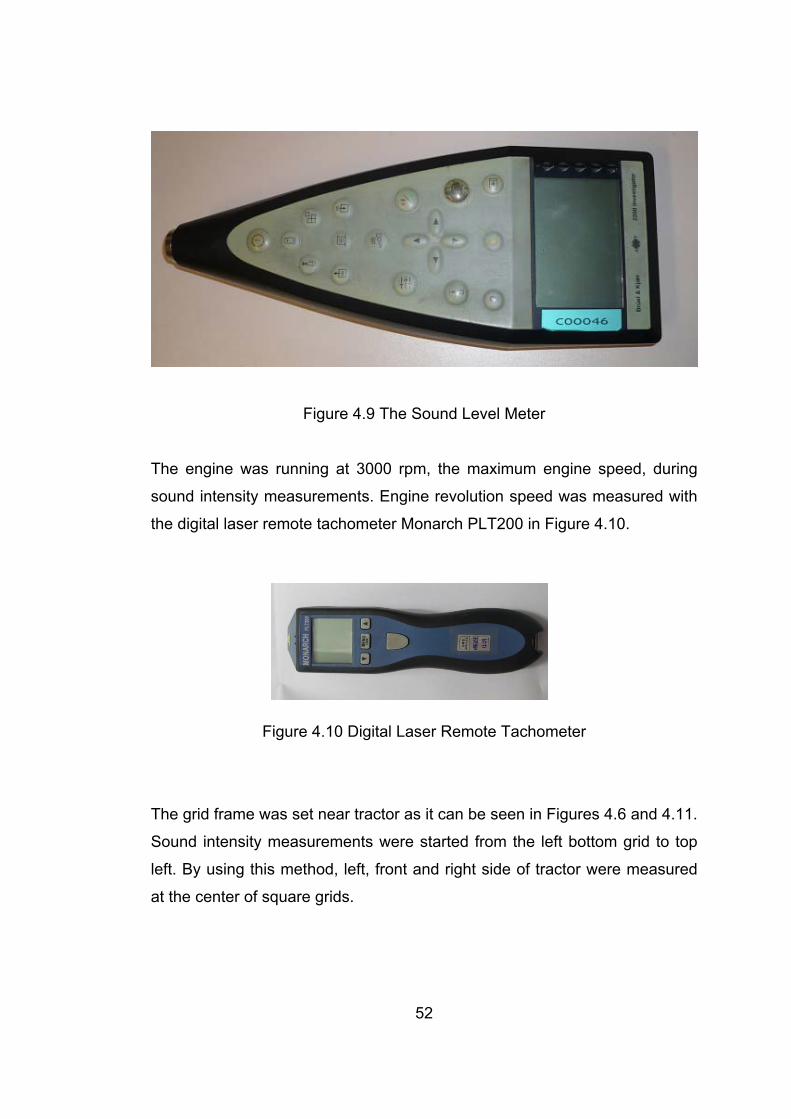
52
Figure 4.9 The Sound Level Meter
The engine was running at 3000 rpm, the maximum engine speed, during
sound intensity measurements. Engine revolution speed was measured with
the digital laser remote tachometer Monarch PLT200 in Figure 4.10.
Figure 4.10 Digital Laser Remote Tachometer
The grid frame was set near tractor as it can be seen in Figures 4.6 and 4.11.
Sound intensity measurements were started from the left bottom grid to top
left. By using this method, left, front and right side of tractor were measured
at the center of square grids.

53
Figure 4.11 The Left Side View of the Test Tractor during Sound Intensity
Measurements
The grid numberings of right, front and left sides of tractor were shown in
Figures 4.12, 4.13 and 4.14.
Figure 4.12 Grid Numberings for the Right Side of the Tractor

54
Figure 4.13 Grid Numberings for the Front Side of the Tractor
Figure 4.14 Grid Numberings for the Left Side of the Tractor
There are 78 grids on cumulative. The measurement time for each grid is 5
seconds already tuned on sound level meter. After every 5 seconds
measurement grid was changed automatically by sound level meter,
therefore all 78 points or grids were scanned and intensities were measured.

55
4.4 Sound Power Level Determination Using Sound Intensity Measurements
Another way of calculating the sound power level for a noise source is
calculating from sound intensities over measurement surface areas. In the
literature, there are three standards explaining sound power calculation from
sound intensities:
• ISO 9614-1: 1994 [8] Acoustics – Determination of sound power levels
of noise sources using sound intensity – Part 1: Measurement at
discrete points
• ISO 9614-2: 1994 [9] Acoustics – Determination of sound power levels
of noise sources using sound intensity – Part 2: Measurement by
scanning
• ISO 9614-3: 1994 [10] Acoustics – Determination of sound power
levels of noise sources using sound intensity – Part 3: Precision
method for measurement by scanning
From intensity measurements, sound intensity levels were recorded.
According to ISO 9614-2 and 9614-3 standards, the calculation can be done
as followed;
1010nIL
refni II = (4.4)
where, 1210 −=refI (W/ m²)

56
Then, partial sound power values can be found by using formula,
inii SIW .= (4.5)
Where, 04,0=iS m² for a square having sides of 20cm.
From here,
∑=
=N
iiWW
1 (4.6)
Finally, to find sound power level, equation (4.7) should be used.
⎟⎟⎠
⎞⎜⎜⎝
⎛=
refW W
WL log10 (4.7)
where, 1210 −=refW (W)

57
CHAPTER 5
RESULTS OF EXPERIMENTS
5.1 Results of Noise Measurements As it was explained in the methodology section, original prototype tractor’s
noise levels were measured at operator’s ear position. Originally measured
data is tabulated in Table 5.1. There are a number of requirements in order to
do sound measurements. During the measurements, the weather was
suitable, nearly 10°C and the wind speed was below 5 m/s. Moreover, the
measurement field had no reflective parts or surfaces closer than 50m. The
measurements were according to ISO 5131 [28].
Table 5.1 Noise Levels of the Original Prototype Tractor
Operator’ Ear Level Measurements Measurement Locations
Noise Level dB (A) Left Side Right Side
T480 Tractor Original Prototype 88,5 89

58
5.2 Sound Power Level Calculation Using Sound Pressure Level Measurements
By using the techniques described in ISO3746:1999 [29] Standard and
formulae given in Chapter 4, sound power calculation of the original
prototype tractor was completed. The overall sound power generated by
tractor was calculated as 107,2 dB (A).
Table 5.2 Sound Power Level Calculation of the Original Prototype Tractor
Microphone Position
Point
BackgroundNoise dB (A)
1'pAL
2'pAL
3'pAL
TpAL ,'
pAL'
wAL
14 56,7 89,2 88,8 88,9 88,97
90,2
107,
2
15 56,5 90,5 89,9 90,0 90,13
6 56,6 91,1 90,8 91,0 90,97
After analyzing the results shown in Table 5.2, it can be concluded that the
measurements at point 6 yield the highest values. Point 6 was in front of
tractor. This is simply due to the engine noise can propagate more easily
through the grill in front of the tractor than from sides where engine front
hood forms an obstacle to this propagation.
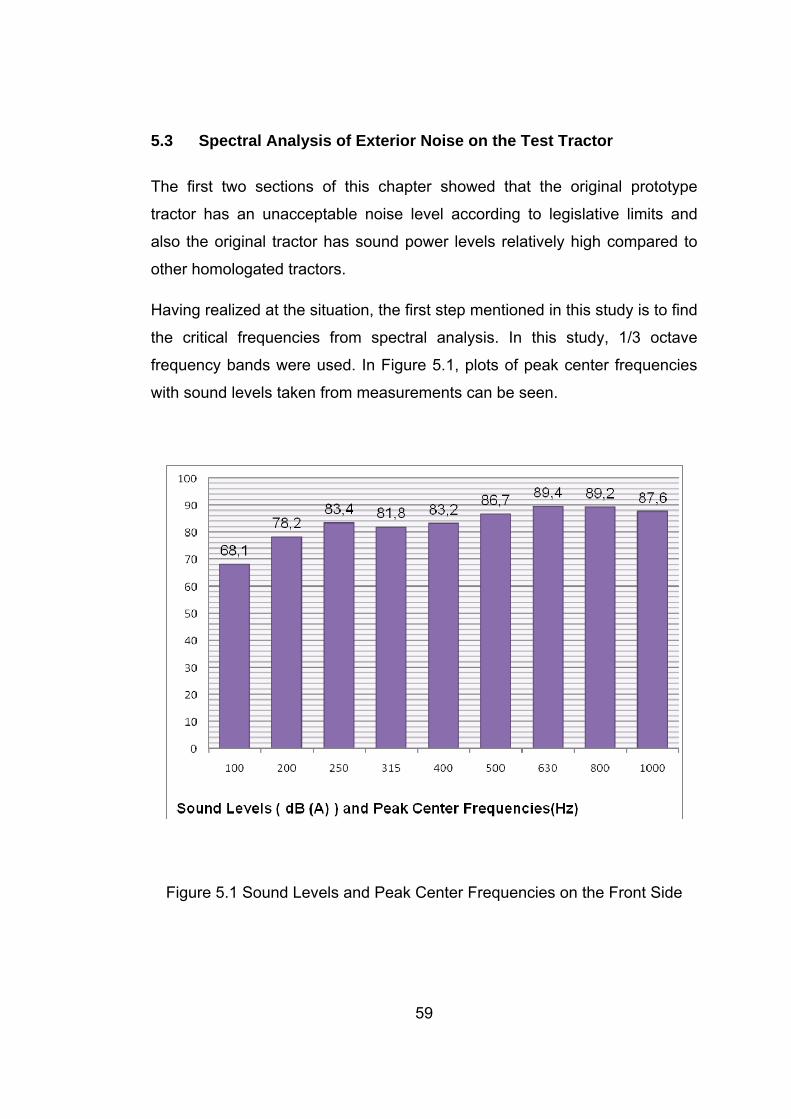
59
5.3 Spectral Analysis of Exterior Noise on the Test Tractor The first two sections of this chapter showed that the original prototype
tractor has an unacceptable noise level according to legislative limits and
also the original tractor has sound power levels relatively high compared to
other homologated tractors.
Having realized at the situation, the first step mentioned in this study is to find
the critical frequencies from spectral analysis. In this study, 1/3 octave
frequency bands were used. In Figure 5.1, plots of peak center frequencies
with sound levels taken from measurements can be seen.
Figure 5.1 Sound Levels and Peak Center Frequencies on the Front Side

60
Figure 5.2 Sound Level and Peak Center Frequencies on the Left Side
Figure 5.3 Sound Level and Peak Center Frequencies on the Right Side
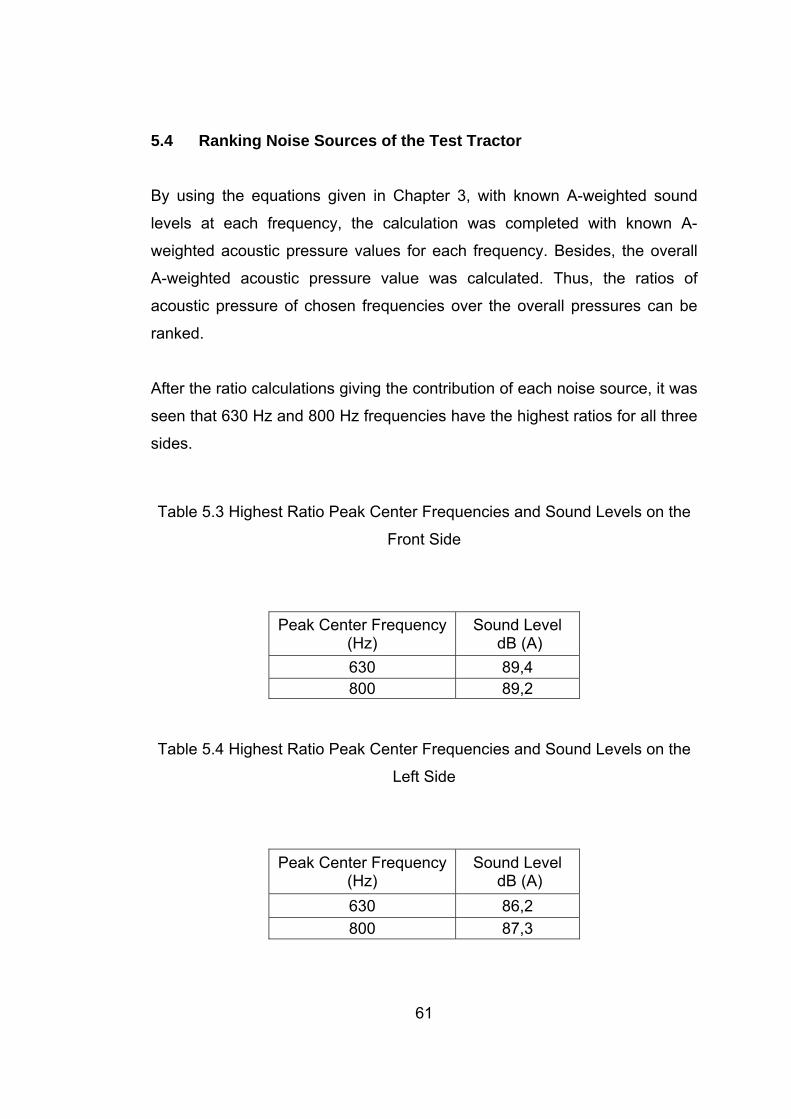
61
5.4 Ranking Noise Sources of the Test Tractor
By using the equations given in Chapter 3, with known A-weighted sound
levels at each frequency, the calculation was completed with known A-
weighted acoustic pressure values for each frequency. Besides, the overall
A-weighted acoustic pressure value was calculated. Thus, the ratios of
acoustic pressure of chosen frequencies over the overall pressures can be
ranked.
After the ratio calculations giving the contribution of each noise source, it was
seen that 630 Hz and 800 Hz frequencies have the highest ratios for all three
sides.
Table 5.3 Highest Ratio Peak Center Frequencies and Sound Levels on the
Front Side
Peak Center Frequency(Hz)
Sound Level dB (A)
630 89,4 800 89,2
Table 5.4 Highest Ratio Peak Center Frequencies and Sound Levels on the
Left Side
Peak Center Frequency(Hz)
Sound Level dB (A)
630 86,2 800 87,3

62
Table 5.5 Highest Ratio Peak Center Frequencies and Sound Levels on the
Right Side
Peak Center Frequency(Hz)
Sound Level dB (A)
630 85,2 800 86,2
After analyzing these tables and peak center frequencies, it can be
concluded that the ratios at these frequencies are the highest ratios and
therefore, the study must focus on the noise sources corresponding to these
frequencies as a first strategy.
Table 5.6 Peak Center Frequencies and Noise Sources
Peak Center Frequency (Hz)
Noise Source(s)
100 Engine Firing Frequency
200 Engine Firing Frequency
400 Engine Firing Frequency + Cooling Fan
800 Cooling Fan 2nd harmonic
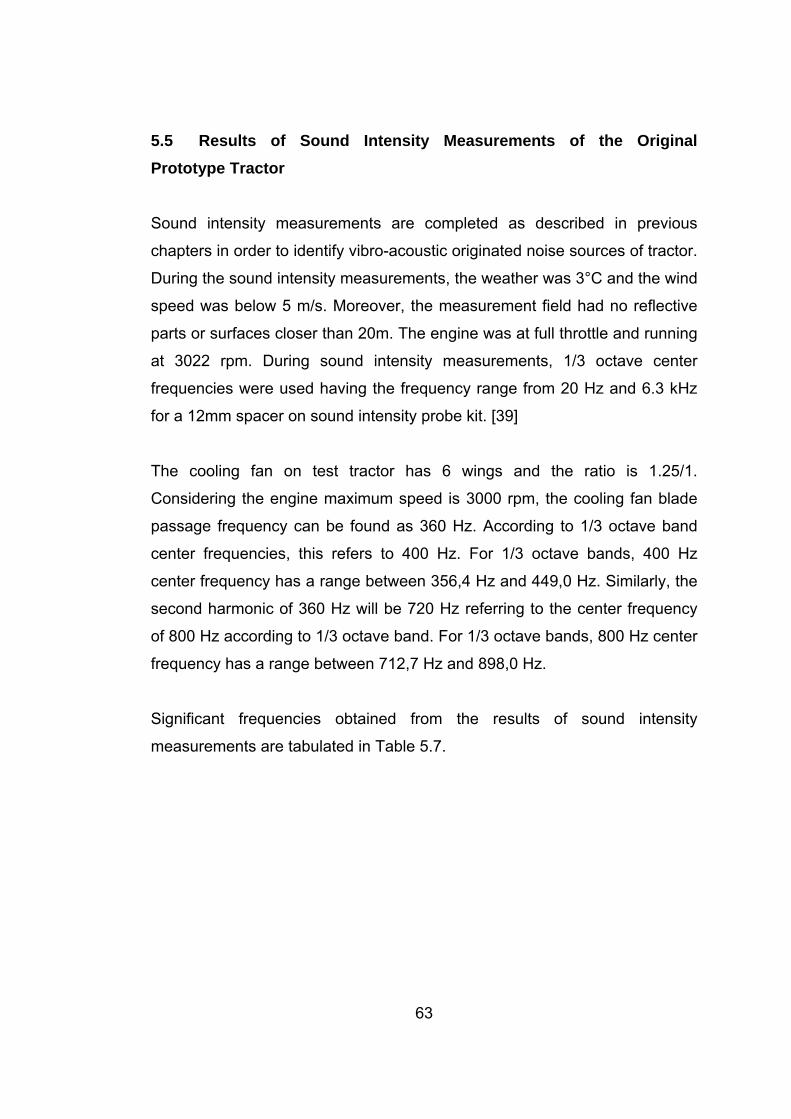
63
5.5 Results of Sound Intensity Measurements of the Original Prototype Tractor Sound intensity measurements are completed as described in previous
chapters in order to identify vibro-acoustic originated noise sources of tractor.
During the sound intensity measurements, the weather was 3°C and the wind
speed was below 5 m/s. Moreover, the measurement field had no reflective
parts or surfaces closer than 20m. The engine was at full throttle and running
at 3022 rpm. During sound intensity measurements, 1/3 octave center
frequencies were used having the frequency range from 20 Hz and 6.3 kHz
for a 12mm spacer on sound intensity probe kit. [39]
The cooling fan on test tractor has 6 wings and the ratio is 1.25/1.
Considering the engine maximum speed is 3000 rpm, the cooling fan blade
passage frequency can be found as 360 Hz. According to 1/3 octave band
center frequencies, this refers to 400 Hz. For 1/3 octave bands, 400 Hz
center frequency has a range between 356,4 Hz and 449,0 Hz. Similarly, the
second harmonic of 360 Hz will be 720 Hz referring to the center frequency
of 800 Hz according to 1/3 octave band. For 1/3 octave bands, 800 Hz center
frequency has a range between 712,7 Hz and 898,0 Hz.
Significant frequencies obtained from the results of sound intensity
measurements are tabulated in Table 5.7.
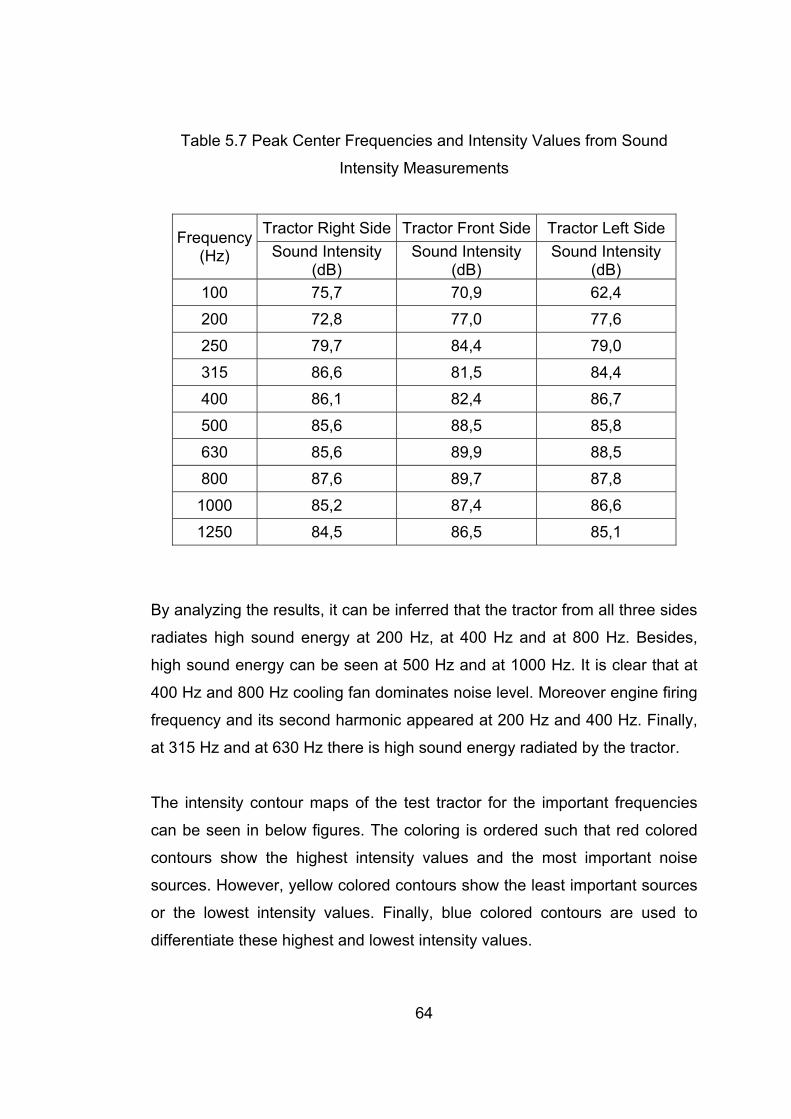
64
Table 5.7 Peak Center Frequencies and Intensity Values from Sound
Intensity Measurements
Frequency (Hz)
Tractor Right Side Tractor Front Side Tractor Left Side Sound Intensity
(dB) Sound Intensity
(dB) Sound Intensity
(dB) 100 75,7 70,9 62,4
200 72,8 77,0 77,6
250 79,7 84,4 79,0
315 86,6 81,5 84,4
400 86,1 82,4 86,7
500 85,6 88,5 85,8
630 85,6 89,9 88,5
800 87,6 89,7 87,8
1000 85,2 87,4 86,6
1250 84,5 86,5 85,1
By analyzing the results, it can be inferred that the tractor from all three sides
radiates high sound energy at 200 Hz, at 400 Hz and at 800 Hz. Besides,
high sound energy can be seen at 500 Hz and at 1000 Hz. It is clear that at
400 Hz and 800 Hz cooling fan dominates noise level. Moreover engine firing
frequency and its second harmonic appeared at 200 Hz and 400 Hz. Finally,
at 315 Hz and at 630 Hz there is high sound energy radiated by the tractor.
The intensity contour maps of the test tractor for the important frequencies
can be seen in below figures. The coloring is ordered such that red colored
contours show the highest intensity values and the most important noise
sources. However, yellow colored contours show the least important sources
or the lowest intensity values. Finally, blue colored contours are used to
differentiate these highest and lowest intensity values.

65
Figure 5.4 Left Side View for Sound Intensity Measurements
Figure 5.5 The Original Intensity Map of the Left Side of the Tractor at 315 Hz
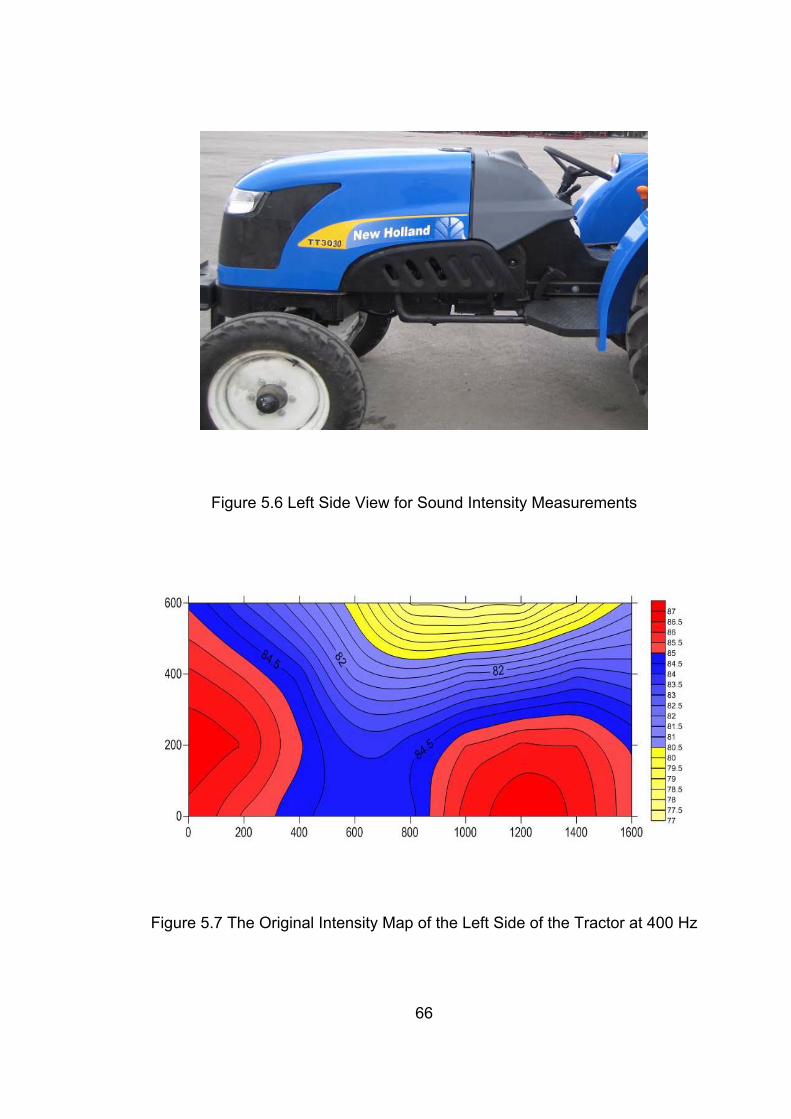
66
Figure 5.6 Left Side View for Sound Intensity Measurements
Figure 5.7 The Original Intensity Map of the Left Side of the Tractor at 400 Hz

67
Figure 5.8 Left Side View for Sound Intensity Measurements
Figure 5.9 The Original Intensity Map of the Left Side of the Tractor at 630 Hz

68
Figure 5.10 Left Side View for Sound Intensity Measurements
Figure 5.11 The Original Intensity Map of the Left Side of the Tractor at 800
Hz

69
Figure 5.12 Front Side View for Sound Intensity Measurements
Figure 5.13 The Original Intensity Map of the Front Side of the Tractor at 250
Hz

70
Figure 5.14 Front Side View for Sound Intensity Measurements
Figure 5.15 The Original Intensity Map of the Front Side of the Tractor at 630
Hz

71
Figure 5.16 Front Side View for Sound Intensity Measurements
Figure 5.17 The Original Intensity Map of the Front Side of the Tractor at
1000 Hz

72
Figure 5.18 Right Side View for Sound Intensity Measurements
Figure 5.19 The Original Intensity Map of the Right Side of the Tractor at 315
Hz

73
Figure 5.20 Right Side View for Sound Intensity Measurements
Figure 5.21 The Original Intensity Map of the Right Side of the Tractor at 400
Hz

74
Figure 5.22 Right Side View for Sound Intensity Measurements
Figure 5.23 The Original Intensity Map of the Right Side of the Tractor at 630
Hz
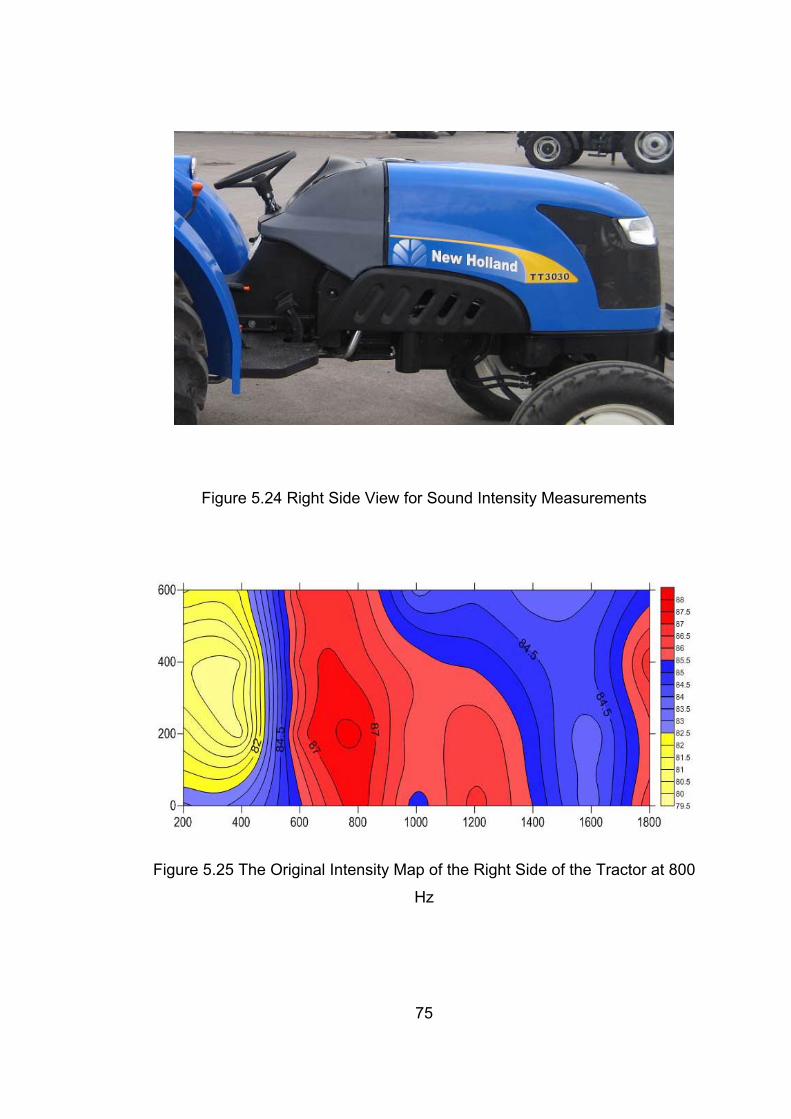
75
Figure 5.24 Right Side View for Sound Intensity Measurements
Figure 5.25 The Original Intensity Map of the Right Side of the Tractor at 800
Hz

76
5.6 Sound Power Level Calculation Using Sound Intensity Measurements of the Original Prototype Tractor
By using the techniques described in ISO 9614-2 [9] and 9614-3 [10]
standards and formulae given in previous chapter, sound power calculation
of the original prototype tractor is completed. The overall sound power level
produced by the tractor can be calculated as 99,2 dB (A).
Table 5.8 Sound Power Level Calculation Results from Sound Intensities of
the Original Prototype Tractor
Sound Power (W) Sound Power (W)
Sound Power Level
Left Right Front Sum of All Surfaces
A-Weighted dB (A)
3397,2E-6 3546,1E-6 1443,4E-6 8386,7E-6 99,2
The overall sound power level is lower than the value found from sound
pressure measurements. The difference is due to the reason that sound
intensity measurement surfaces were not covering the whole tractor. Only the
front, right and left sides of the tractor were scanned during measurements.

77
5.7 Results of Sound Intensity Measurements after Initial Modifications By analyzing spectral analysis results, it was obtained that the highest
contributions were discovered at frequencies, 630 Hz and 800 Hz. The noise
sources referring to these frequencies are muffler or exhaust pipe and
cooling fan, respectively. In addition to that, the domination of cooling fan and
exhaust pipe can be seen on intensity maps at these frequencies.
Sound intensities were measured on original prototype tractor after first
modifications consisting of changing cooling fan blade angle from 36° to 43°
and adding a vibration isolator on the exhaust pipe connection to the
platform. During the sound intensity measurements, the weather was 13°C
and the wind speed was below 5 m/s. Moreover, the measurement field had
no reflective parts or surfaces closer than 20m.
Table 5.9 Peak Center Frequencies and Associated Noise Sources
Peak Center Frequency (Hz)
Noise Source(s)
100 Engine Firing Frequency
200 Engine Firing Frequency
315 Muffler/silencer + Exhaust Pipe
400 Engine Firing Frequency + Cooling Fan
500 Engine Firing Frequency
630 Muffler/silencer + Exhaust Pipe 2nd harmonic
800 Cooling Fan 2nd harmonic

78
Initial modified tractor’s significant frequencies obtained from the results of
sound intensity measurements and comparison to the first measurements are
tabulated in Table 5.10.
Table 5.10 Comparison of Sound Intensity Measurements Peak Center
Frequencies and Intensity Values after Initial Modifications
Freq. (Hz)
Right Side
Right Side (Initial
Modified)
Front Side
Front Side (Initial
Modified)
Left Side
Left Side (Initial
Modified)Intensity
(dB) Intensity
(dB) Intensity
(dB) Intensity
(dB) Intensity
(dB) Intensity
(dB) 100 75,7 80,3 70,9 74,9 62,4 59,8
200 72,8 72,6 77,0 81,5 77,6 75,5
250 79,7 76,9 84,4 82,6 79,0 79,0
315 86,6 80,6 81,5 82,1 84,4 83,9
400 86,1 80,9 82,4 84,2 86,7 83,2
500 85,6 82,4 88,5 84,2 85,8 82,7
630 85,6 81,8 89,9 87,2 88,5 83,0
800 87,6 83,0 89,7 90,4 87,8 83,7
1000 85,2 81,6 87,4 87,7 86,6 82,5
1250 84,5 81,1 86,5 87,1 85,1 81,7
In addition to this table, plots from these values were generated and shown in
Figure 5.26 below.

79

80
5.8 Results of Sound Intensity Measurements after Final Modifications
After the initial modifications, it was seen from intensity measurements that
intensity values were decreased. However, in order to comply with the
legislation, more modifications were required for the noise sources at other
peak frequencies, like 400 Hz, 315 Hz, etc.
Sound intensity measurements were completed with the final modified tractor
with all necessary modifications. During the sound intensity measurements,
the weather was 9°C and the wind speed was below 5 m/s. Although the
weather was suitable, some measurements were refreshed due to unwanted
noises. Moreover, the measurement field had no reflective parts or surfaces
closer than 20m.
All the modifications including the initial modifications on final prototype
tractor can be listed as;
• Steering Column Vibration Isolation from Transmission Box Casting
• Exhaust Pipe Vibration Isolation from the Platform
• The Cooling Fan
• Serial Production Silencer/Muffler
• The Engine Side Sound Absorbers/Isolators
• Platform Vibration Isolators
After all noise control applications and improvements were conducted on the
final modified tractor, the comparison of all intensity values can be seen in
Table 5.11 and final sound intensity contour maps can be seen below figures.

81

82
Figure 5.27 Left Side View for Sound Intensity Measurements
Figure 5.28 The Final Intensity Map of the Left Side of the Tractor at 315 Hz

83
Figure 5.29 Left Side View for Sound Intensity Measurements
Figure 5.30 The Final Intensity Map of the Left Side of the Tractor at 400 Hz

84
Figure 5.31 Left Side View for Sound Intensity Measurements
Figure 5.32 The Final Intensity Map of the Left Side of the Tractor at 630 Hz

85
Figure 5.33 Left Side View for Sound Intensity Measurements
Figure 5.34 The Final Intensity Map of the Left Side of the Tractor at 800 Hz

86
Figure 5.35 Front Side View for Sound Intensity Measurements
Figure 5.36 The Final Intensity Map of the Front Side of the Tractor at 250 Hz

87
Figure 5.37 Front Side View for Sound Intensity Measurements
Figure 5.38 The Final Intensity Map of the Front Side of the Tractor at 630 Hz

88
Figure 5.39 Right Side View for Sound Intensity Measurements
Figure 5.40 The Final Intensity Map of the Right Side of the Tractor at 315 Hz

89
Figure 5.41 Right Side View for Sound Intensity Measurements
Figure 5.42 The Final Intensity Map of the Right Side of the Tractor at 400 Hz

90
Figure 5.43 Right Side View for Sound Intensity Measurements
Figure 5.44 The Final Intensity Map of the Right Side of the Tractor at 630 Hz

91
Figure 5.45 Right Side View for Sound Intensity Measurements
Figure 5.46 The Final Intensity Map of the Right Side of the Tractor at 800 Hz

92
5.9 Dominant Noise Sources from Test Results
Concerning both frequency analysis results and sound intensity maps, it can
be seen that all three sides of the tractor radiate high sound energy at 100
Hz, 200 Hz, 400 Hz and at 800 Hz frequency bands. In addition, high sound
energy can be noticed at 500 Hz and at 1000 Hz frequency bands. It is clear
that at 400 Hz and 800 Hz cooling fan dominates noise level. Also engine
firing frequency and its second harmonic appeared at 200 Hz and 400 Hz.
Lastly, at 315 Hz and its second harmonic 630 Hz there is a high sound
energy emitted by tractor due to exhaust pipe.
For 400 Hz and 800 Hz cooling fan dominates noise level. For the original
prototype tractor, the metal cooling fan had 6 wings and 36° blade angle.
After the analysis, new cooling fan fitted to the tractor and new results were
satisfactory. The new plastic cooling fan has 6 wings but 43° blade angle.
Figure 5.47 A Sectional View of Steering Motor Column and its Support

93
In addition to the cooling fan improvement, the steering motor and its
support's connection were studied and isolated. The modifications can be
seen in Figure 5.47.
After analyzing intensity maps, it was seen and decided that rubber vibration
isolation materials could be assembled to eliminate metal to metal contact
and structure-borne noise. This situation was eliminated from steering
support bottom connection as well. This can be seen in Figure 5.48
Figure 5.48 A Sectional View of Steering Motor Column and its Support
Moreover, exhaust pipe on this tractor is horizontal and it was connected to
the platform on the tractor. Therefore, rubber vibration isolators were devised
to this connection to get rid of metal to metal contact. A snapshot taken from
3D master model for this part can be seen in Figure 5.49.

94
Figure 5.49 The Exhaust Pipe Isolation view taken from 3D Master Model of
the Tractor

95
5.10 Sound Power Level Calculation Using Sound Intensity Measurements after Final Modifications Sound power level of the test tractor having final modifications was
calculated. The overall sound power generated by this tractor was calculated
as 96,9 dB (A) and shown Table 5.12.
Table 5.12 Sound Power Level Calculation Results from Sound Intensities
after Final Modifications
T480 Tractor
Sound Power (W) Sound Power (W)
Sound Power Level
Left Right Front Sum of All Surfaces
A-Weighted dB (A)
Original 3397,2E-6 3546,1E-6 1443,4E-6 8386,7E-6 99,2
FINAL 1773,0E-6 1785,3E-6 1388,2E-6 4946,5E-6 96,9
The Decrease in Sound Power Level [dB] 2,3
Finally, it can be concluded that a 2,3 dB decrease in sound power level of
the tractor having final modifications was achieved from 99,2 dB (A) to 96,9
dB (A) after exercising final noise control applications.

96
5.11 Sound Power Level Calculation Using Sound Pressure Measurements after Final Modifications Sound power level of the tractor after final modifications was calculated
according to ISO3746:1999 [29] Standard and formulae given in Chapter 4.
The overall sound power generated by the tractor was calculated as 105,2
dB (A) and shown below Table 5.13.
Table 5.13 Sound Power Level Calculation Results after Final Modifications
Microphone Position
BackgroundNoise dB (A)
1'pAL
2'pAL
3'pAL
TpAL ,'
pAL'
wAL
14 52,7 86,0 86,5 85,8 86,1
88,2
105,
2
15 50,0 88,4 88,3 88,6 88,4
6 49,7 89,4 89,6 89,5 89,5
From the results tabulated in Table 5.13, it can be concluded that the noise
measurements at point 6 took the highest values again. However, decrease
in level was observed in the latest. The decrease on overall sound power
level of the tractor is totaled as 2 dB, from 107,2 dB (A) to 105,2 dB (A).
Consequently, both sound power level calculations showed that the overall
sound power of the test tractor was decreased by 2 dB. Through proper
noise control measures yielded comparably similar results.

97
CHAPTER 6
SUMMARY AND CONCLUSIONS
This study mainly focused on noise source identification techniques and
applications on the new project T480 tractor and development of proper
noise control strategies and applications on this tractor. In order to achieve
these, necessary measurements were completed on the T480 tractor and
related noise mapping studies were generated using relevant software.
Several aspects of the study were summarized and explained in the following
sections. The first section is devoted to the strategies applied on the tractor
and the second section describes future works not only for this project tractor
but also for the other type of tractors.
6.1 Noise Control Strategies on the Test Tractor
Noise source identification methods were explained and applied on the
original prototype tractor. These methods were composed of sound power
level determination, spectral analysis of noise data and sound intensity
measurements on three sides of the tractor.
1/3 octave band frequency analysis is used to obtain spectral analysis
results. Sound intensity measurements were accomplished for in depth
analysis of noise sources of the tractor which could be identified by only a
narrower spectral analysis.. The intensity maps of sound intensity values
from intensity measurements were carried in 1/3 octave bands.

98
Significant frequencies obtained from the results of sound intensity
measurements showed that the cooling fan, exhaust pipe, muffler and the
engine itself due to its high speed, i.e. 3000 rpm, are potential noise sources
affecting the overall noise level more than the others.
Noise control applications for reducing the flow induced noise by the cooling
fan were exercised by replacing the existing fan with a new one. The original
metal fan had 6 wings and 36° blade angle. The new plastic cooling fan has
6 wings and 43° blade angle. Finally, the new cooling fan helped reduce the
noise level nearly by 1 dB. However, the noise contribution is not the only
design constraint for a cooling fan. As the name implies, in order to avoid any
overheating problems, the new cooling fan has also been checked on air-to-
boil test.
During the operator’s ear noise level test of the original prototype tractor, it
was realized that there is noticeable drive-train noise. This noise could only
be felt while tractor is moving. Because of the fact that both sound intensity
tests and spectral analysis tests are conducted at stationary positions, this
drive-train noise is detected only when the tractor is moving.
According to the legislation, the required speed of the test tractor should be
nearly 7.5 km/h. The related range-gear combination referring to that speed
is 1st range and 3rd speed gear. The existing gear sets are spur gear sets
owing to the fact that this project is cost effective. Therefore, it is decided that
replacement of the 3rd and 4th speed gears and related shafts with helical
ones would decrease the drive-train noise levels. New helical gear sets are
used in order to reduce the noise level for final measurements on final
modified tractor. Using helical gears for 3rd and 4th speed gears helps
decrease in overall noise level 1 dB. The noise level measurements on the
modified tractor having helical gears can be seen in Table 6.1.

99
Considering the original prototype tractor’s noise levels in mind, all noise
control actions resulted in noise reduction of 3 dB. The measured data from
the final modified tractor is tabulated in table 6.1. As it can be seen from the
table the results are under the legislative limits. Finally, T480 tractor is
homologated according to European Noise Directives 77 / 311 / EEC [1] and
74 / 151 / EEC [2] and certified.
Table 6.1 The Homologation Tractor Noise Levels
Sound Level dB (A) Left Side
Right Side
Operator’ Ear Noise Level 85.1 85.5
Pass-By Noise Level 83 77.6
Moreover, absorptive materials are assembled to isolate the engine noise
which peaks out at engine firing frequencies on the interior part of the left
side engine panel and the right side engine panel. These can be viewed in
Figures 6.1 and 6.2.
Figure 6.1 The Engine Panel on the Left Side
The Panel on the Left Side
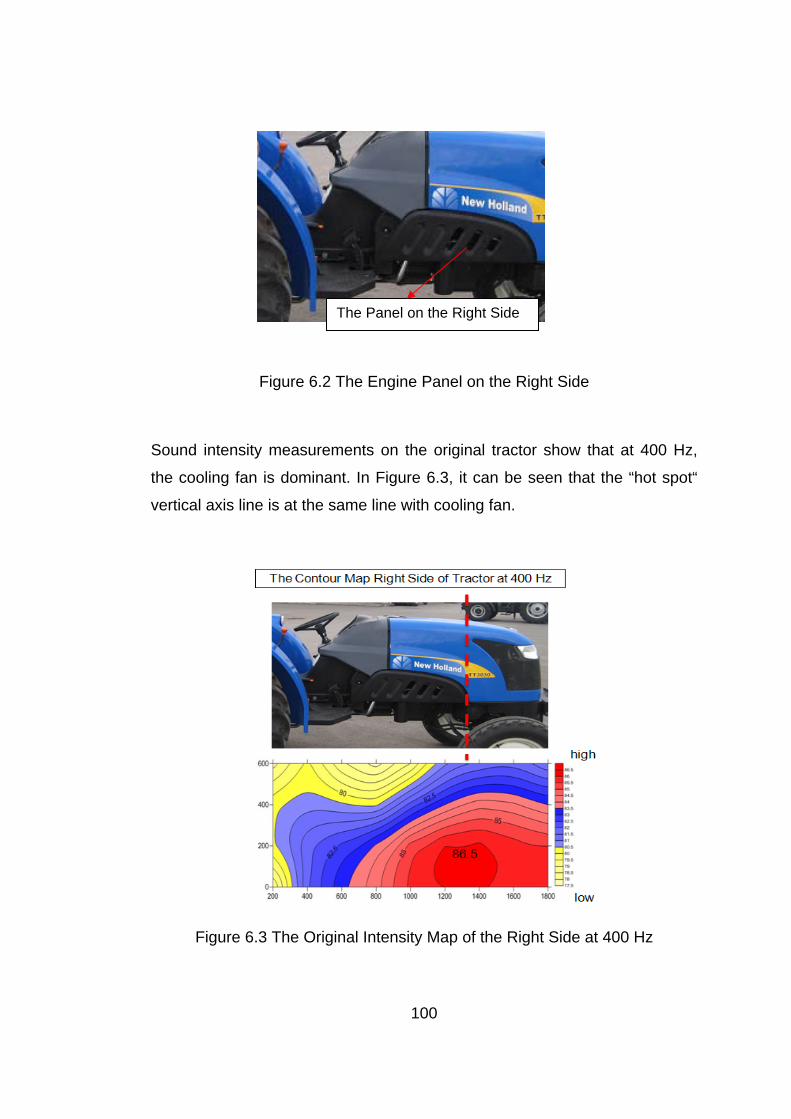
100
Figure 6.2 The Engine Panel on the Right Side
Sound intensity measurements on the original tractor show that at 400 Hz,
the cooling fan is dominant. In Figure 6.3, it can be seen that the “hot spot“
vertical axis line is at the same line with cooling fan.
Figure 6.3 The Original Intensity Map of the Right Side at 400 Hz
The Panel on the Right Side

101
After the installation of the new cooling fan, it is seen in sound intensity maps
that at 400 Hz, the “hot spot“ vertical axis line is not at the same line with
cooling fan. The line shifts rearwards of tractor and the maximum value drops
from 86,5 dB (A) to 85,5 dB (A). After final modifications, the tractor’s
intensity map at the same frequency showing the shifted line can be seen in
Figure 6.4.
Figure 6.4 The Final Intensity Map of the Right Side at 400 Hz
By analyzing the spectral analysis and the noise source ranking calculations,
it is found that the contribution of noise sources at 630 Hz is the second
highest source. Considering this in mind, the intensity map has been
generated after original tractor’s sound intensity measurements. It is seen
that at 630 Hz, exhaust pipe is the dominant noise source. In Figure 6.5, red
contour lines on intensity map mark the exhaust pipe.

102
Figure 6.5 The Original Intensity Map of the Left Side at 630 Hz
After the addition of vibration isolation element between the exhaust pipe and
the platform, it is seen that, the red contour lines in sound intensity
measurements at 630 Hz are disappeared.
Figure 6.6 The Final Intensity Map of the Left Side at 630 Hz

103
6.2 Potential Future Studies on Tractors Even though the fact that this thesis planned and realized necessary noise
control application studies not to exceed legislative limits; there remain some
other techniques and methods to be used for further improvements.
It is anticipated that future studies can include exhaust pipes and the muffler.
The engine muffler could be analyzed acoustically with the help of suitable
software. By this way, a noise attenuation of 1-2 dB could be achieved in
reference to sound intensity measurements and intensity maps.
Moreover, due to the fact that this tractor’s engine has a relatively high
maximum speed, i.e. 3000 rpm, the vibrations on this tractor are significant.
Coherence techniques can be used to obtain cause-effect relation for
vibration and noise levels for engine hood plate, side fenders and platforms.
A more detailed spectral analysis of noise and vibration of engine parts need
to be planned using FFT analysis techniques.
The study could be enlarged by using the methods covered in ISO 16902-
1:2003 [31] and ISO 15086-1:2001 [32]. Intensity measurements can be
conducted to undercover the hydraulic and steering pumps. Silently operating
gear pumps can be sought and similar analysis for resulting noise level drops
can be investigated.

104
REFERENCES
[1] European Noise Directive 77/311/EEC Driver-perceived noise level –
Operator’s Ear Noise Test
[2] European Noise Directive 74/151/EEC Certain parts and
characteristics (maximum permissible laden mass, position and mounting of
rear registration plate, liquid fuel tanks, ballast weights, audible warning
devices, permissible sound level, exhaust system) – Annex VI Pass-By Noise
Test
[3] Fallon L. Fleming, “Noise-Induced Hearing Loss from Exposure to
Tractors and Other Farm Implements“, Journal of Controversial Medical
Claims, Vol.13, No.4
[4] Solecki L., “Occupational hearing loss among selected farm tractor
operators employed on large multi-production farms in Poland”, Int. J. Occ.
Med. Environmental Health, 1998, 11(1): 69–80.
[5] Miyakita Takashi, Atsushi Ueda, Makoto Futatsuka, Tsukasa Inaoka,
Megumi Nagano, Wasaku Koyama, “Noise exposure and hearing
conservation for farmers of rural Japanese communities”, Journal of Sound
and Vibration 277 (2004) 633–641
[6] Dewangan K.N., Prasanna Kumar G.V., Tewari V.K. “Noise
characteristics of tractors and health effect on farmers”, Applied Acoustics 66
(2005) 1049–1062

105
[7] JunHong Zang, Bing Han, “Analysis of Engine Front Noise Using
Sound Intensity Techniques”, Mechanical Systems and Signal Processing 19
(2005) 213–221
[8] ISO 9614-1: 1994 Acoustics – Determination of sound power levels of
noise sources using sound intensity – Part 1: Measurement at discrete points
[9] ISO 9614-2: 1994 Acoustics – Determination of sound power levels of
noise sources using sound intensity – Part 2: Measurement by scanning
[10] ISO 9614-3: 1994 Acoustics – Determination of sound power levels of
noise sources using sound intensity – Part 3: Precision method for
measurement by scanning
[11] Leclére Q., Pézerat C., Lulagnet B., Polac L., “Application of Multi
Channel Spectral Analysis to Identify the Source of a Noise Amplitude
Modulation in a Diesel Engine Operating at Idle”, Applied Acoustics 66 (2005)
779–798
[12] Talotte C., Gautier P.E., Thompson, Hanson C., “Identification,
Modeling and Reduction Potential of Railway Noise Sources: a Critical
Survey”, Journal of Sound and Vibration 267 (2003), 447-468
[13] Inalpolat, M., “Determination of Vibro-acoustical Behavior of Plates by
Intensity Methods”, M.Sc. Thesis, Middle East Technical University,
Mechanical Engineering Department, 2004
[14] Wang M.E., Crocker M.J., “On the application of coherence
techniques for source identification in a multiple noise source environment“,
J. Acous. Soc. Am. Vol: 74, No: 3, September 1983

106
[15] Sung-Chon Kang and Jeong Guon Ih “On the use of the Sound
Intensity Method for detecting noise sources near the reflecting plates”, Fifth
International Congress on Sound and Vibration, December 15-18, 1997
[16] Dumbacher Susan, Blough Jason, Hallman Darren, Wang Percy,
“Source Identification Using Acoustic Array Techniques“, The Proceedings of
the SAE Noise and Vibration Conference, Vol 2, pp 1023-1035, Traverse
City, MI, May 1995
[17] Oh Ki-Sug, Lee Sang-Kwon, Kim Sung-Jong “Identification and
reduction of noise from axles in a passenger vehicle”, Noise Control Eng. J.
56 (5), Sept-Oct 2008
[18] Yalçınkaya, K.A., “Noise Control of Backhoe Loader”, M.Sc. Thesis,
Middle East Technical University, Mechanical Engineering Department, 2006
[19] Rao Mohan D, “Recent Application of Visco-elastic damping for Noise
Control in Automobiles and Commercial Airplanes”, Journal of Sound and
Vibration 262 (2003), 457-474
[20] Ghosh B.B., Chaudhury J., Banerjee T.K., Ghosh A.K. “Development
of a muffler for control of noise pollution in a diesel engine”, Proc Instn
Mechanical Engineers Vol: 213 Part D, 83-90
[21] Ghosh B.B., Bhattacharya, Panua, Bose “Prediction of Noise Level by
Mathematical Modeling in the Exhaust Muffler and Validation of these
Analytical Results with the Experimental Results for 4-Stroke Diesel Engine”,
Advances in Applied Mathematical Analysis ISSN 0973-5313 Volume 2
Number 1 (2007), pp. 41–49

107
[22] Jeong-Guon Ih, Hoi-Jeon Kim, Seong-Hyun Lee, K. Shinoda,
“Prediction of intake noise of an automotive engine in run-up condition”,
Applied Acoustics 70 (2009) 347–355
[23] Angeloni Cesare, “Precision gears Cut Pump Noise”, MACHINE
DESIGN, 78 • JUNE 8, 2006
[24] Şahin, Fatma Ceyhun, “An Experimental study on off-design
performance and noise in small pumps”, M.Sc. Thesis, Middle East Technical
University, Mechanical Engineering Department, 2007
[25] Güngör, Faruk Emre, “Computer aided noise prediction in heating,
ventilating and air conditioning systems”, M.Sc. Thesis, Middle East
Technical University, Mechanical Engineering Department, 2003
[26] Cleon, I.M, Willaime A., “Aero-acoustic optimization of the fans and
cooling circuit on sncf’s x 72500 railcar”, Journal of Sound and Vibration
(2000) 231(3), 925}933
[27] Vehicle Refinement- Controlling Noise and Vibration on Road Vehicles
– Harrison 2004, Published on behalf of: SAE International
[28] ISO 5131:1996 Acoustics -- Tractors and machinery for agriculture
and forestry -- Measurement of noise at the operator's position -- Survey
method
[29] ISO 3746:1999 Acoustics -- Determination of sound power levels of
noise sources using sound pressure -- Survey method using an enveloping
measurement surface over a reflecting plane

108
[30] ISO 11094:1991 Acoustics -- Test code for the measurement of
airborne noise emitted by power lawn mowers, lawn tractors, lawn and
garden tractors, professional mowers, and lawn and garden tractors with
mowing attachments
[31] ISO 16902-1:2003 Hydraulic fluid power -- Test code for the
determination of sound power levels of pumps using sound intensity
techniques: Engineering method -- Part 1: Pumps
[32] ISO 15086-1:2001 Hydraulic fluid power -- Determination of the fluid-
borne noise characteristics of components and systems -- Part 1:
Introduction
[33] http://www.bksv.com, Bruel&Kjaer Official Website, 20/12/2009 [34] http://www.e-pages.dk/bruel/72/25, Bruel&Kjaer Official Website, 20/12/2009 [35] http://www.e-pages.dk/bruel/72/25, Bruel&Kjaer Official Website, 20/12/2009
[36] Engineering noise control: theory and practice, David A. Bies, Colin H.
Hansen, London: Boston: Unwin Hyman, 1988
[37] Industrial Noise Control and Acoustics, Randall F. Barron, New York:
Marcel Dekker, 2003
[38] Noise and Vibration Control, Leo L. Beranek, New York, McGraw-Hill,
1971
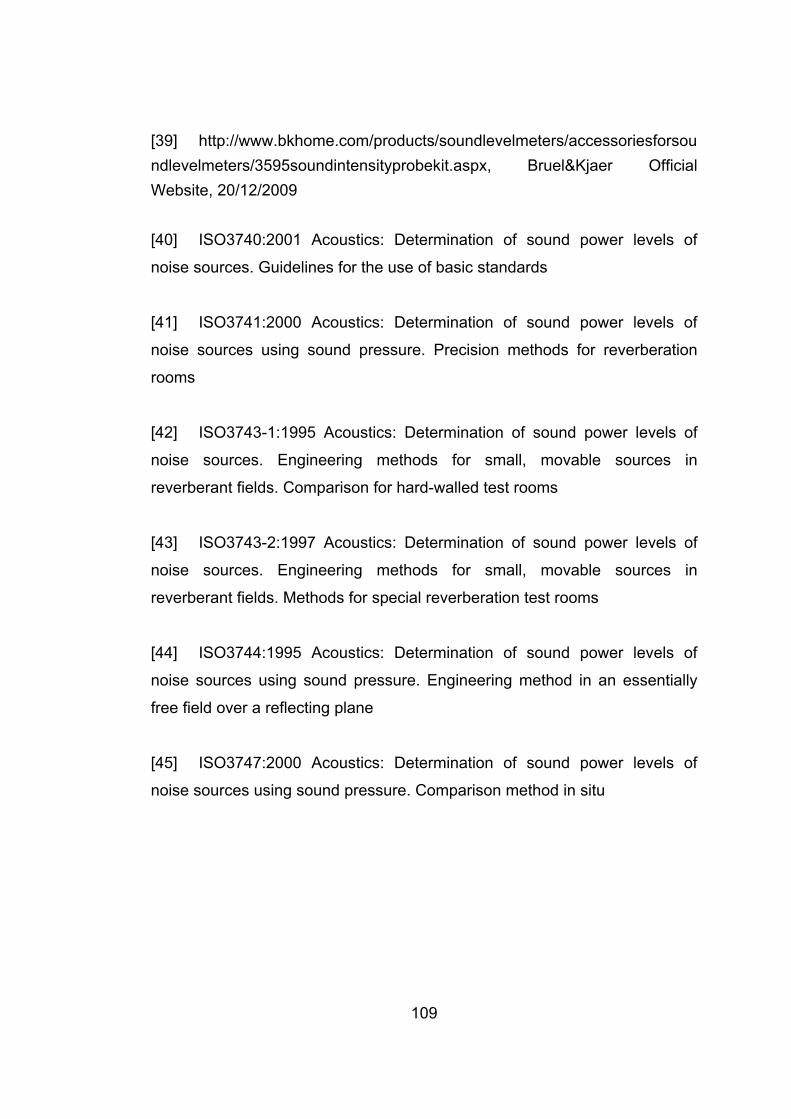
109
[39] http://www.bkhome.com/products/soundlevelmeters/accessoriesforsou ndlevelmeters/3595soundintensityprobekit.aspx, Bruel&Kjaer Official Website, 20/12/2009 [40] ISO3740:2001 Acoustics: Determination of sound power levels of
noise sources. Guidelines for the use of basic standards
[41] ISO3741:2000 Acoustics: Determination of sound power levels of
noise sources using sound pressure. Precision methods for reverberation
rooms
[42] ISO3743-1:1995 Acoustics: Determination of sound power levels of
noise sources. Engineering methods for small, movable sources in
reverberant fields. Comparison for hard-walled test rooms
[43] ISO3743-2:1997 Acoustics: Determination of sound power levels of
noise sources. Engineering methods for small, movable sources in
reverberant fields. Methods for special reverberation test rooms
[44] ISO3744:1995 Acoustics: Determination of sound power levels of
noise sources using sound pressure. Engineering method in an essentially
free field over a reflecting plane
[45] ISO3747:2000 Acoustics: Determination of sound power levels of
noise sources using sound pressure. Comparison method in situ