Noise and Vibration Technical Report - bart.gov 2 – Long-term and short-term noise and vibration...
61
BART – Hayward Maintenance Complex Noise and Vibration Technical Report November 22, 2010 Revised May 03, 2011 Prepared for: PGH Wong Engineering. By: Wilson, Ihrig & Associates, Inc. Carlos H. Reyes Senior Consultant and Deborah A. Jue Associate Principal
Transcript of Noise and Vibration Technical Report - bart.gov 2 – Long-term and short-term noise and vibration...

BART – Hayward Maintenance Complex
Noise and Vibration Technical
Report
November 22, 2010
Revised May 03, 2011
Prepared for:
PGH Wong Engineering.
By:
Wilson, Ihrig & Associates, Inc.
Carlos H. Reyes
Senior Consultant
and
Deborah A. Jue
Associate Principal
WILSON, IHRIG & ASSOCIATES, INC. i TABLE OF CONTENTS
Noise and Vibration Technical Report Revised May 03, 2011
TABLE OF CONTENTS
Executive Summary .............................................................................................................................. 1 Operational Noise and Vibration Assessment Results ...................................................................... 3
Noise ............................................................................................................................................. 3 Vibration ....................................................................................................................................... 3
Construction Noise and Vibration Assessment................................................................................. 4 Noise ............................................................................................................................................. 4 Vibration ....................................................................................................................................... 5
Conclusions and Recommendations ................................................................................................. 6 Introduction ........................................................................................................................................... 8
Noise and Vibration Measurements ...................................................................................................... 8
Long-term Ambient Noise Measurements ........................................................................................ 8 Short-term Noise and Vibration Measurements ............................................................................. 11
Noise Measurements of BART Train Passby ............................................................................. 11
Ground Vibration Measurements of BART Train Passby .......................................................... 12 Applicable Noise and Vibration Policies ............................................................................................ 16
FTA Noise Criteria ......................................................................................................................... 16
FTA Vibration Criteria ................................................................................................................... 17 Noise and Vibration Impact Assessment ............................................................................................ 19
Noise Assessment ........................................................................................................................... 22 Methodology ............................................................................................................................... 22 Projected Cumulative Noise ....................................................................................................... 24
Mitigation Measures ................................................................................................................... 28 Vibration Assessment ..................................................................................................................... 32
Methodology ............................................................................................................................... 32 Projected Ground Vibration ........................................................................................................ 33
Vibration Mitigation Measures ................................................................................................... 34 Construction Noise and Vibration Impact Assessment ...................................................................... 38
Noise and Vibration Policies .......................................................................................................... 39
Noise and Vibration Methodologies ............................................................................................... 40 Projected Construction Noise and Vibration .................................................................................. 43
Noise ........................................................................................................................................... 43 Vibration Construction Assessment ............................................................................................ 46
Construction Noise and Vibration Control Measures ..................................................................... 47
Noise ........................................................................................................................................... 47 Vibration ..................................................................................................................................... 48
Appendix A Long-term Noise Survey Plots .................................................................................... 54

WILSON, IHRIG & ASSOCIATES, INC. ii LIST OF TABLES
Noise and Vibration Technical Report Revised May 03, 2011
LIST OF TABLES
Table 1 – Summary of the existing daily ambient noise levels (Day-night level) in the proximity of
the project............................................................................................................................................ 11 Table 2 – Summary of wayside noise level from BART train passbys .............................................. 12 Table 3 - FTA Land Use Categories and Metrics for Transit Noise Impact Criteria ......................... 16
Table 4 – Category of Land Use for the FTA Vibration Analysis...................................................... 18 Table 5 - FTA Ground-borne Vibration Impact Criteria for General Assessment ............................. 18 Table 6 – Projected cumulative noise levels from BART operations on the HMC Expansion (Project)
for Phase 1........................................................................................................................................... 25 Table 7 – Projected cumulative noise levels from BART operations on the HMC Expansion (Project)
Phase 2 ................................................................................................................................................ 26
Table 8 – Projected cumulative noise levels from activities at the proposed east train storage, west
side improvements, and traction power substation ............................................................................. 27
Table 9 – Summary of minimum recommended sound wall mitigation for the HMC Project Phase 1
............................................................................................................................................................. 29 Table 10 – Summary of minimum recommended sound wall mitigation for the HMC Project Phase 2
............................................................................................................................................................. 29
Table 11 – Projected vibration levels from BART trains operations on the HMC for Phase 1 .......... 35 Table 12 – Projected vibration levels from BART trains operations on the HMC for Phase 2 .......... 35
Table 13 – Recommended location of vibration mitigation for the HMC Project ............................. 36 Table 14 – Guidelines for Assessing Construction Noise Impact by FTA ......................................... 39 Table 15 – FTA Construction Vibration Damage Criteria ................................................................. 39
Table 16 – Construction Equipment Noise Levels and Use Factor .................................................... 40 Table 17 – Construction equipment vibration levels .......................................................................... 41
Table 18 – Projected Noise Levels and Impacts from Using Heavy Equipment during Phase 1
Construction (West Side and New Shop) ........................................................................................... 50
Table 19 – Projected Noise Levels and Impacts from Using Heavy Equipment during Phase 2
Construction (East Side and Flyovers) ............................................................................................... 51
Table 20 – Summary of Vibration Induced by Heavy Equipment during Phase 1 Construction ....... 52
Table 21 – Summary of Vibration Induced by Heavy Equipment during Phase 2 Construction ....... 53

WILSON, IHRIG & ASSOCIATES, INC. iii LIST OF FIGURES
Noise and Vibration Technical Report Revised May 03, 2011
LIST OF FIGURES
Figure 1 – Long-term and short-term noise and vibration measurement locations (N of Whipple Rd)
............................................................................................................................................................. 14 Figure 2 – Long-term and short-term noise and vibration measurement locations (S of Whipple Rd)
............................................................................................................................................................. 14
Figure 3 – Equipment setup used for noise and vibration passby measurements ............................... 15 Figure 4 – Projected ground vibration levels versus distance from BART train passby on tangent and
special trackwork based on site specific measurements ..................................................................... 15 Figure 5 – Allowable Increase in Cumulative Noise Levels for FTA Category 1 and 2 .................... 17 Figure 6 – Hayward Maintenance Complex. Phase 1 (top) and Phase 2 (bottom) conceptual design
plan view ............................................................................................................................................. 21
Figure 7 – Projected unshielded day-night noise level of BART trains on at-grade ballast and tie
tracks at 70 mph with 12-minute headways (future condition). ......................................................... 23
Figure 8 – Location and minimum recommended extent of sound wall for Phase 1 ......................... 31
Figure 9 - Location and minimum recommended extent of sound wall for Phase 2 .......................... 31 Figure 10 – Schematic of the vibration mitigation extent for Tire-Derived Aggregate (TDA) on
crossover track .................................................................................................................................... 36
Figure 11 - Schematic of the vibration mitigation extent for Tire-Derived Aggregate (TDA) on
crossover P102 .................................................................................................................................... 37
Figure 12 – Expected Ground Vibration (PPV) due to Construction Activities for the BART HMC
Project ................................................................................................................................................. 42 Figure 13 – Expected Vibration Levels (VdB) versus Distance due to Construction Activities for the
BART HMC Project Vibration Impact Assessment ........................................................................... 43

WILSON, IHRIG & ASSOCIATES, INC. 1 BART Hayward Maintenance Complex
Executive Summary
Noise and Vibration Technical Report Revised May 03, 2011
Executive Summary
This report by Wilson, Ihrig and Associates, Inc. (WIA) presents results of the noise and vibration
environmental impact assessment for the Bay Area Rapid Transit (BART) Hayward Maintenance
Complex (HMC Project). The assessment of noise and vibration impacts from operations and
construction has been performed following the procedure described in the Federal Transit
Administration (FTA) guidance manual “Transit Noise and Vibration Impact Assessment”1.
The proposed Project would include adding up to six crossovers or turnouts in the area south of
Whipple Road (on the mainline tracks, test track and yard lead), adding storage tracks to the
northeast of the existing Hayward Yard to accommodate up to a maximum of 250 BART cars,
implementing a new traction power station for new tracks on the east side of the Hayward Yard, and
erecting a new Overhaul Shop (replacing an existing building). The Project includes upgrades to the
three remaining buildings (component repair shop, central warehouse, and Maintenance and
Engineering (M&E) shop storage area). Information used to prepare this draft report was obtained
from preliminary drawings of the proposed Hayward Maintenance Complex provided by BART,
received August 24, 2010, and project description revisions and updated topographic information
received by WIA in March 2011.
The primary variables and assumptions that were used in the noise and vibration models include:
Cumulative noise levels were estimated based on the future schedule proposed for the Silicon
Valley Rapid Transit Project (SVRTP).
Proposed BART future operations (SVRTP) on the main line would bring 271 trains through the
Hayward Maintenance Complex during the daytime and 44 trains at night (in both directions of
travel).
Future yard operations for the analysis were estimated at 80 train movements during daytime and
40 during nighttime hours. This number includes the current dispatch activities (60 trains) which
would originate on the west side of the HMC and the new activities on the east.
Operations on the test track for the cumulative noise analysis would be 12 trains per hour from 7
am to 11 pm. This schedule is a worst-case condition for the noise modeling, and it includes the
future expected trains from SVRT car commissioning. The train consist is assumed to be 4 cars
long with operational speeds of 30 to 40 mph south of Whipple Road.
A sound wall to reduce noise (recommended as sound walls SW-01 SW-02 and SW-03 in this
report) would be installed prior to the start of construction work. Therefore, it was assumed to be
part of the “existing” conditions for assessing construction noise impacts.
Phase 1 construction includes all work related to the west side of the Hayward Yard, including
the new Overhaul Shop and associated crossovers and trackwork, a non-rail vehicle storage area
and an enhanced vehicle inspection area (east side).
Phase 2 construction would implement work related to the east side of the Hayward Yard,
including at least one flyover, new storage tracks, associated crossovers and trackwork and third
rail power, communications, and train control systems.
1 Federal Transit Administration. Transit Noise and Vibration Impact Assessment. FTA-VA-90-1003-06, May 2006

WILSON, IHRIG & ASSOCIATES, INC. 2 BART Hayward Maintenance Complex
Executive Summary
Noise and Vibration Technical Report Revised May 03, 2011
Construction work on the test track and storage areas would be performed mostly during daytime
hours. However, there would be some activities at the staging areas during the nighttime hours
that will be performed not closer than 200 feet from any residential receptor located north of
Whipple Road. Construction work involving mainline tracks would be done during nighttime
hours and weekends, with the exception that no nighttime construction will be conducted north
of Whipple Road. New switch installation would typically be done during nights and weekends
(Phase 1 and Phase 2). However, flyover construction (pile driving) and preparation for
construction involving the mainline would be done during daytime.
Noise and vibration measurements were conducted near the Project site to obtain the environmental
ambient settings and to supplement the general information presented in the FTA guidance manual.
Ambient noise was obtained at four sites along the eastern residential area near the Project. Ground
surface vibration and wayside noise from BART train passbys were obtained at three locations along
the existing BART mainline. In addition, noise and ground vibration measurements from BART
trains passbys on crossovers, and current operations from the existing Main Shop building were
obtained at the Hayward Yard.
The criteria used to assess potential impact from BART operations are those recommended by the
FTA. The FTA noise criteria are based on the increase in total (Project + Existing) noise level over
the existing ambient noise due to operations of the project or combination of projects, and the
amount of noise increase determines whether a Severe, Moderate or No Impact occurs. Noise
Impact has been determined for those receptors with Severe Impact and Moderate Impact (as defined
by FTA). Noise control measures have been evaluated for both categories of impacts.
The operational FTA vibration criteria are level-based criteria depending on the land use at the
receptor and the frequency of the events. The level of service expected for BART for 2030 would be
classified as a system with Frequent Events. The vibration analysis was based on a field-derived set
of vibration attenuation curves specific to the site. Adjustments have been made to the curve to
account for speed, special trackwork, and the building vibration response (BVR).
The criteria for assessing noise and vibration from construction activities are also based on the FTA
criteria. The FTA noise criteria are specified in terms of 8-hour equivalent noise level (Leq) for
residential, commercial and industrial land uses. The criterion applicable to residences in the vicinity
of the project would be 80 dBA for daytime and 70 dBA for nighttime construction. This revised
report includes corrections to the evaluation criteria previously used to evaluate nighttime
construction noise.
The criteria for assessing vibration effects from construction activities have been divided into two
categories: interference with human activity (annoyance) and building damage (impact). The
applicable criteria for evaluating potential annoyance are identical to those used to assess annoyance
during train operations by land use category (e.g., Category 2 for residential homes). The FTA
criteria relating to potential cosmetic cracking due to building vibration are applicable to four
categories, considering different building structures. All residential buildings in the vicinity of the
Project could be categorized as engineered concrete and masonry (Category II) with a threshold of
0.3 in/sec.

WILSON, IHRIG & ASSOCIATES, INC. 3 BART Hayward Maintenance Complex
Executive Summary
Noise and Vibration Technical Report Revised May 03, 2011
Operational Noise and Vibration Assessment Results
Noise
Results of the analysis show a potential for wayside Noise Impact on sensitive receptors near
crossovers P100, P100B, P101 and P102 (see Figure 6 for location of these crossovers). The impact
expected would be associated with the increase in wayside noise levels from trains crossing the
turnout frogs.
The Phase 1 of the Project (which includes crossover P100 and P102) would generate Noise Impact
at three single-family homes along 11th
Street near the crossover P100. Trains crossing the gap at
crossover P102 would also generate noise impacts at 14 single-family residences at the Innovation
Homes community2. The increase associated with the Project would be up to 2.7 dBA. Sound walls
are the recommended noise mitigation control for reducing the level of impact to No Impact. The
height of sound walls required to mitigate Noise Impacts from Phase 1 would be 10 to 13 feet tall
measured from BART top-of-rail.
Phase 2 of the project would generate a Severe Impact at nine single-family residences on La Brea
Terrace. The impact is due to the increase in noise levels associated with crossover P100B. Noise
impact is also projected from crossover P101 at six single-family homes located on Carrara Terrace.
With the exception of receptors at La Brea Terrace, all noise impacts generated by the Project would
be at a level of Moderate Impact as defined by FTA. A sound wall at the BART east property line is
the recommended noise mitigation measure to reduce both Severe and Moderate impacts to No
Impact. The height of the wall would range between 9-feet and 14-feet tall measured from top-of-
rail depending on the final location selected for the sound wall. The schematic of the location and
preliminary height of sound walls is presented in the report. However, the specific location and
height of sound walls would be addressed later in detail during final design, when further details
about track and receiver elevation, track location and other pertinent information would be available.
BART operations at the train storage area and the new HMC would result in No Noise Impacts from
the additional activities. The increase due to operation on residences located east to the Yard would
be 1.2 dBA and lower. Consequently, no mitigation measures would be necessary.
No Noise Impacts are expected from the new traction power substation. No Noise Impacts are
expected for the Enhanced Vehicle Inspection Area.
Vibration
Results of the vibration evaluation show Vibration Impact from implementing the HMC Project at
10 single-family residences during Phase 1 of the Project and at 20 additional single-family
residences during Phase 2 (Twenty-four residences would be impacted if Phase 2 is considered by
itself). All residences identified with a Vibration Impact are located at the Innovation Homes. The
impact would be associated with trains crossing the frog at crossover P100B, P101 and P102 and the
proximity to the sensitive receptors (60 to 120 feet).
2 Innovation Homes are the single-family community in Union City east of the BART tracks, south of Whipple Road and
north of Dry Creek.

WILSON, IHRIG & ASSOCIATES, INC. 4 BART Hayward Maintenance Complex
Executive Summary
Noise and Vibration Technical Report Revised May 03, 2011
Vibration levels associated with BART trains on the crossovers would exceed the FTA criterion by
up to 7 VdB during Phase 1 and up to 12 VdB during Phase 2. Recommended mitigation measures
include relocating the crossover switches 130 feet or further away from homes, or installing track
mitigation measures such as tire-derived aggregate or floating slab track at the location of P100B,
P101 and P102. Recommended vibration mitigation measures would reduce the level of impact to
No Vibration Impact. Schematics of the recommended extent of the vibration mitigation are
presented in the report.
Finally, No Vibration Impact is expected from train movements at the east storage tracks.
Consequently, no mitigation measures would be needed.
Construction Noise and Vibration Assessment
Construction activities for the HMC Project evaluated include the use of heavy equipment such as
excavators and compactors, track installation equipment such as ballast tampers and ballast
regulators, and pile drivers (specifically for the flyover). The construction of the Project would
occur in two phases: Phase 1 includes the construction of the all Yard elements on the west side of
the Hayward Yard (new Overhaul Shop and related trackwork plus the enhanced vehicle inspection
area), and Phase 2 includes all Yard elements related to the east side storage tracks, including new
storage tracks, flyovers and traction power.
Noise
Construction noise resulting from activities during Phase 1 and Phase 2 of the Project were
compared against the FTA criteria (daytime and nighttime) to determine the degree of potential
impact and the noise mitigation measure to implement. The analyses include activity caused by the
use of heavy equipment and by the equipment expected during track installation (including ballast
tamping and regulating).
Airborne noise impacts would occur as follows:
Heavy Equipment: General construction activities would result in Noise Impacts at noise
sensitive receptors. Including the effect of the existing sound wall at the residential
development and new sound walls constructed as part of the Project, impacts would occur at
single-family residences at the Innovation Homes development (South of Whipple Road)
during nighttime construction hours as follows:
Phase 1 would generate No Noise Impact
Phase 2 would generate Noise Impacts at 15 homes during nighttime
construction
Track installation: Construction activities during track installation would generate a Noise
Impact for residences within 100 feet of daytime construction activities or within 300 feet of
nighttime track-laying activities, assuming an unobstructed line of sight. With the effect of
new sound walls recommended as part of the Project and constructed prior to start
construction:
o Impacted residences would include single-family residences at the Innovation Homes
development (South of Whipple Road) during nighttime construction hours.

WILSON, IHRIG & ASSOCIATES, INC. 5 BART Hayward Maintenance Complex
Executive Summary
Noise and Vibration Technical Report Revised May 03, 2011
Phase 1 would generate No Noise Impact during either daytime or nighttime
construction.
Phase 2 would generate Noise Impact at 15 homes during nighttime
construction.
Vibratory pile drivers for the flyover(s) would be used during installation of foundation
footings. Noise Impact from a vibratory pile driver is expected to generate impact at
residences that are located within 140 feet during daytime. No nighttime pile driving would
be conducted for the Project.
o The closest residences to the pile driving zone are expected to be about 400 feet and
farther. Since no nighttime pile driving work would be conducted, No Noise Impacts
are projected from pile driving activities.
Unshielded construction staging areas (CSA) would generate noise impacts if they are located closer
than 70 feet from residential land uses in the case of daytime operations and closer than 200 feet
away for nighttime operations. Two construction staging areas are proposed, one on the
southwestern portion of the expansion area and one on the existing M&E storage area at the
southeast corner of the existing yard. Noise projected from the staging areas would potentially cause
a Noise Impact for sensitive receptors (e.g., single family homes) within 70 feet from the staging
area during daytime activity and within 200 feet during nighttime activity. The closest homes to the
southwestern staging area would be located at least 250 feet from the staging area, resulting in No
Noise Impact during both daytime and nighttime operations. Similarly, there would be No Noise
Impact from operations on the southeast staging area during daytime hours. However, to ensure that
residential homes located approximately 150 feet from the southeast staging area do not experience
significant nighttime noise impacts, a buffer zone of approximately 50 feet will be maintained along
BART’s east property line where no noise-generating activity will be permitted during nighttime
construction
Vibration
This report evaluates the effect of annoyance and building damage on nearby sensitive receptors due
to construction-induced vibration activities during Phase 1 and Phase 2. The result of the analysis
shows that due to the distance between the construction site and the residential homes during both
Phases 1 and 2, the vibration from all construction equipment would be well below the threshold of
cosmetic building damage. No Vibration Impacts from construction activities would be expected
during for the Project. However, there is a potential for vibration annoyance at receptors that are
located within 100 feet of any vibratory construction sources.
Phase 1 would generate vibration annoyance at 26 residences in the Innovation Homes
Development during trackwork and switch installation activities from crossovers P100 and
P102.
Phase 2 would generate vibration annoyance at 29 residences in the Innovation Homes
Development during trackwork and switch installation activities from crossovers P100B,
P101, P103 and P104.
The use of a pile driver during construction could potentially generate annoyance to receptors
located within 190 feet of the activity. However the closest distance to nearby residences from pile

WILSON, IHRIG & ASSOCIATES, INC. 6 BART Hayward Maintenance Complex
Executive Summary
Noise and Vibration Technical Report Revised May 03, 2011
driving activities at the flyover is 400 feet resulting in vibration that would be below the threshold
for vibration annoyance.
Construction-induced vibration form staging areas would be expected to be below the threshold of
building damage and annoyance at all times. Consequently No Vibration Impacts are expected from
staging areas.
Conclusions and Recommendations
The proposed project would generate noise and/or vibration impacts for which noise or vibration
control measures should be implemented. The recommended noise or vibration control measures
would eliminate the impacts.
Operations Phase 1 – West Side Improvements
Moderate Noise Impacts at seventeen receptors near crossovers P100 and P102. Noise impacts
would be reduced to a level of No Impact by implementing a sound wall.
Vibration Impact at 10 single-family residences south of Whipple Road due to crossover P102
should be reduced to No Impact by either relocating the crossover 130 feet or further from any
residential home or implementing track mitigation measures such as the use of tire-derived
aggregate (TDA) or a floating slab track-bed (FST).
Operations Phase 2 – East Side Improvements
Moderate Noise Impacts at six receptors near crossovers P101. Noise impacts would be reduced
to a level of No Impact by implementing a sound wall.
Severe Noise Impacts at nine receptors near crossovers P100B. Noise impacts would be reduced
to a level of No Impact by implementing a sound wall.
Vibration Impact at twenty-four single-family residences south of Whipple Road due to
crossover P100B and P101. Vibration Impact should be reduced to No Impact by either
relocating the crossover 130 feet or further from any residential home or implementing track
mitigation measures such as the use of tire-derived aggregate (TDA) or a floating slab track-bed
(FST).
East Storage
No Noise Impacts and No Vibration Impacts are expected due to activities in the East Yard
Expansion.
Construction
Phase 1 – West Side Improvements
Noise Impacts at 15 residences would be generated during track installation if construction is
scheduled during nighttime hours. A temporary noise barrier or temporary relocation of residents
to a hotel should be implemented during nighttime work to reduce impacts along Messina
Terrace and La Bonita Terrace to a level that would be No Impact.
No Vibration Impacts would damage buildings during Phase 1 construction. There is a potential
for vibration annoyance at 26 residences during track installation.
Phase 2 – East Side Improvements

WILSON, IHRIG & ASSOCIATES, INC. 7 BART Hayward Maintenance Complex
Executive Summary
Noise and Vibration Technical Report Revised May 03, 2011
Noise Impact at 15 residences for nighttime construction during track installation. Noise control
measures such as temporary noise barrier, or temporary relocation of residents to a hotel should
be implemented during nighttime work to mitigate the nighttime noise impacts at receptors
located along Messina Terrace and La Bonita Terrace in the Innovation Homes complex.
No Noise Impact during eastside storage track installation north of Whipple Road because the
work would be conducted during the daytime hours.
No Noise Impacts from vibratory pile driving and therefore no noise control would be required.
No Vibration Impact would be expected during construction of the flyover aerial structure, but
there is a potential for vibration annoyance at 32 single-family homes at the Innovation Homes
during track construction.
Staging Areas
After implementing a 50 feet buffer zone along the east boundary of the BART property near the
southeastern staging area, No Noise Impacts are expected from staging areas. Therefore, no
noise mitigation would be needed.
No Vibration Impacts are expected from staging areas. Therefore, no vibration control measures
would be required.

WILSON, IHRIG & ASSOCIATES, INC. 8 BART Hayward Maintenance Complex
Introduction
Noise and Vibration Technical Report Revised May 03, 2011
Introduction
This report prepared by WIA presents results of the noise and vibration impact assessment from the
Hayward Maintenance Complex (HMC Project). The Project includes incorporating new special
trackwork (i.e., turnouts and crossovers) in the Hayward Yard, but also some new special trackwork
in the mainline and test track south of the Yard, building a storage area for up to a maximum of 250
cars and new traction power substation to the east of the Hayward Yard, two flyover structures
(north and south), upgrades to the Maintenance and Engineering (M&E) yard, shops, a new
Overhaul Shop and storage for non-revenue maintenance equipment located to the west of the
Hayward Yard.
Measurements of the ambient background noise in the residential areas near the project, and the
typical noise and vibration from train passbys were obtained by WIA in September 2009. Site-
specific wayside noise and ground vibration measurements from BART train passbys were also
obtained. This report presents the results of these measurements and also projected levels of noise
and vibration from BART operations due to the Project.
Noise and Vibration Measurements
WIA obtained measurements of the environmental ambient noise, as well as passby noise and
vibration from train operations at several locations near the project site. The purpose of the field
measurements was to evaluate the existing environmental conditions in the area of the project and
also to obtain the baseline for the noise and vibration analysis.
Long-term Ambient Noise Measurements
Ambient noise measurements were obtained at four locations between September 15 and September
20, 2009. Figure 1 and Figure 2 show an aerial view of the measurements locations. A description
of the monitoring locations and photographs of the sites are presented in the following pages.
Long-term noise measurements were obtained by means of calibrated, precision, logging sound level
meters over a 6-day period. All noise-measuring instruments used during the noise survey meet
ANSI S1.4-1993 specifications for Type I Sound Level Meters. The sound level meters monitored
the level of noise continuously providing statistics of the noise level over consecutive one-hour
intervals. The measured hourly equivalent noise levels (Leq) were used to calculate the daily Day-
Night Noise Level (DNL or Ldn) over each 24-hour period measured.
Ambient noise at location N1 is dominated by BART train passbys, local traffic, and train noise from
the nearby freight/Amtrak track (including train horn noise from the grade crossing at Whipple
Road). The Day-Night noise level (Ldn or DNL) was 64 dBA. There is a partial sound wall at the
BART property line that provides some shielding to BART train noise. The hourly equivalent noise
levels are shown in Figure A- 1 (see Appendix A).
Similarly, ambient noise at location N2 is dominated by BART train noise, local traffic, and train
noise from the nearby freight/Amtrak track. The ambient noise level ranged between 59 and 61 dBA
Ldn with an average of 60 dBA. The lower noise level obtained at N2 compared with location N1 is
a result of the more effective (i.e., higher) sound wall at location N2. The height of the sound wall

WILSON, IHRIG & ASSOCIATES, INC. 9 BART Hayward Maintenance Complex
Noise and Vibration Measurements
Noise and Vibration Technical Report Revised May 03, 2011
for residences located north of Boyle Street is about 12 feet. The hourly equivalent noise levels are
shown in Figure A- 2 (see Appendix A).
Location N3 was selected to characterize ambient noise for residences located in the Innovation
Homes residential complex. The noise monitor was hung from a light pole on Calle La Mirada
Common to provide representative ambient noise levels at these residences. Even though this
location may experience higher noise levels due to motor vehicle traffic than most homes facing the
alignment, this location provided the most suitable measurement site to obtain BART passby noise
unshielded from the two-story homes. The ambient noise at N3 ranged between 59 and 64 dBA with
an average of 62 dBA. Due to the proximity of the residential homes to the grade crossing at
Whipple Road, freight train horn noise dominates noise levels measured during night hours. Figure
A- 3 in Appendix A shows the hourly equivalent noise levels obtained at N3.
Finally, ambient noise at location N4 is dominated by train noise (Amtrak, UPRR and BART trains)
and noise from activities from the existing Hayward Yard. The Ldn ranged from 63 to 68 dBA with
an average of 67 dBA. Weekday noise levels remained very stable at about 67 to 68 dBA. Figure A-
4 in Appendix A shows the hourly equivalent noise levels obtained at N4 between September 15 and
September 21, 2009.
Table 1 summarizes the existing day-night ambient noise levels at the four locations.
Location N1
Noise logger was hung from a street light pole at
the corner of 11th Street and D Street at
approximately 130 feet from BART tracks.
WILSON, IHRIG & ASSOCIATES, INC. 10 BART Hayward Maintenance Complex
Noise and Vibration Measurements
Noise and Vibration Technical Report Revised May 03, 2011
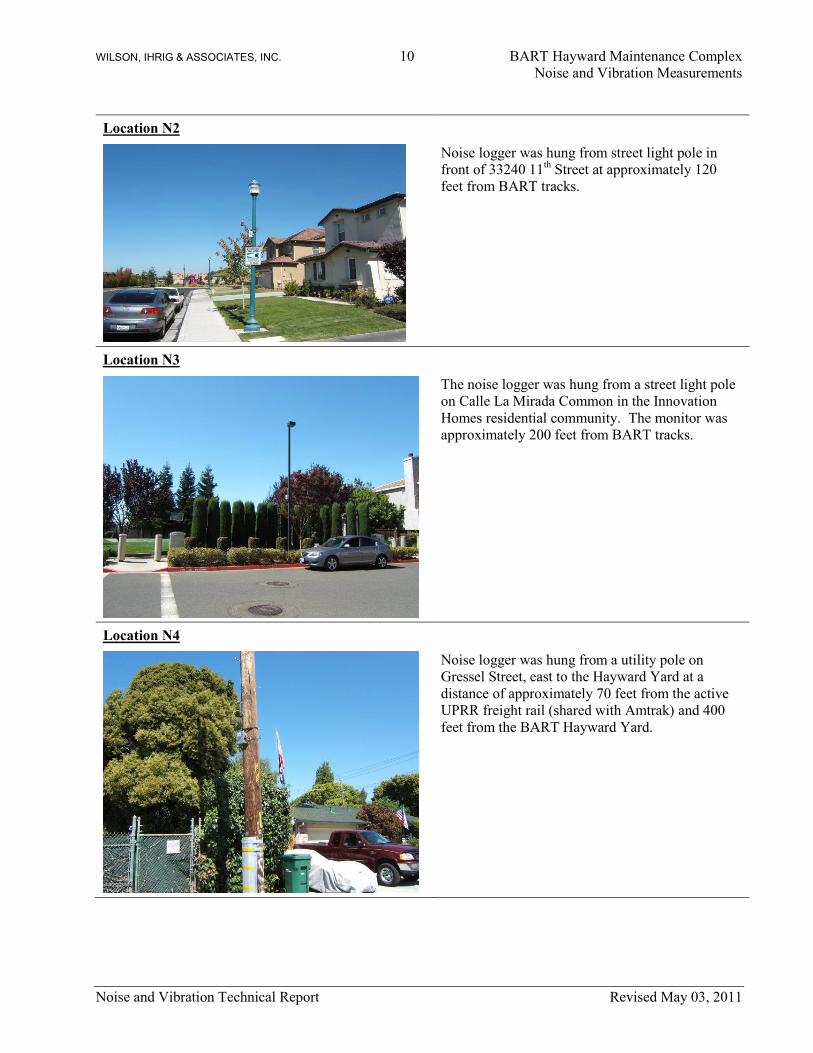
Location N2
Noise logger was hung from street light pole in
front of 33240 11th Street at approximately 120
feet from BART tracks.
Location N3
The noise logger was hung from a street light pole
on Calle La Mirada Common in the Innovation
Homes residential community. The monitor was
approximately 200 feet from BART tracks.
Location N4
Noise logger was hung from a utility pole on
Gressel Street, east to the Hayward Yard at a
distance of approximately 70 feet from the active
UPRR freight rail (shared with Amtrak) and 400
feet from the BART Hayward Yard.

WILSON, IHRIG & ASSOCIATES, INC. 11 BART Hayward Maintenance Complex
Noise and Vibration Measurements
Noise and Vibration Technical Report Revised May 03, 2011
Table 1 – Summary of the existing daily ambient noise levels (Day-night level) in the proximity of the
project
Location Tues, 15 Wed, 16 Thu, 17 Fri, 18 Sat, 19 Sun, 20 Avg.
11th Street and D Street 64 64 65 63 61 64 64
11th Street (Park) 60 60 61 60 59 60 60
Calle Innovation Homes 62 61 63 62 62 59 62
Gressel Street 68 67 67 68 66 63 67
Source: WIA, September 2009
Short-term Noise and Vibration Measurements
Noise Measurements of BART Train Passby
WIA performed measurements of airborne noise from train passbys at four locations to characterize
the typical noise levels of BART trains operating on tangent track and special trackwork (i.e.,
turnouts and crossovers). The data were also used to calibrate the noise increase due to special
trackwork in the noise model and to compare the modeled sound wall reduction with that measured
for an existing sound wall.
Figure 1 and Figure 2 shows the locations chosen for the passby test. The equipment setup used
during noise measurements is shown in Figure 3 (left photo). Several revenue train passbys were
recorded on September 15 and September 17, 2009 at each measurement location. Subsequently, the
data recorded in the field were analyzed in the WIA laboratory using a Larson Davis 2900 real time
analyzer to obtain the frequency spectra and the overall noise level from each train passby. BART
trains recorded at all locations were either 3-cars or 4-cars long, traveling at approximately 70 mph.
Measurements of wayside noise at location S1 were obtained at the corner of 11th
Street and D Street
at a distance of 125 feet from the northbound BART mainline track. The distance selected for S1
represents the setback distance from the BART main track to residences on 11th
Street. There is a
sound wall at the BART property line that runs from the Dry Creek Park to D Street. However, the
sound wall steps down to the height of the BART tracks or lower by the time it reaches D Street.
There is no sound wall south of D Street. This measurement location is representative of wayside
noise levels with no sound wall on tangent track. The measured wayside noise levels of five train
passbys ranged between 68 and 73 dBA with an average of 70 dBA.
Location S2 was located at the Dry Creek Park. The microphone was placed 135 feet from the
northbound BART main track, which is the typical setback distance to the residential single-family
homes on 11th
Street. There is a 9-foot high sound wall at the measurement location that provides
shielding to BART passby noise. The distance from the single-family homes to the sound wall is
about 70 feet. The typical overall A-weighted noise level obtained at location S2 ranged between 62
and 65 dBA with an average of 63 dBA, which is about 7 dBA lower than that obtained at location
S1.
Similarly, wayside noise was recorded at location S3 to characterize BART train passby noise for the
Innovation Homes. The microphone location was about 70 feet from the northbound BART
mainline track, which is the typical distance between the track and homes at this residential complex.
The results show wayside noise levels from seven BART train passbys ranging from 62 to 68 dBA

WILSON, IHRIG & ASSOCIATES, INC. 12 BART Hayward Maintenance Complex
Noise and Vibration Measurements
Noise and Vibration Technical Report Revised May 03, 2011
with an average of 65 dBA. There is an existing noise wall at the property line (top of the
embankment) that provides shielding of the train noise to ground level receptors. The height of the
wall is 7.5 feet from the receiver’s ground elevation.
Locations S1 through S3 provided a characterization of BART trains operating on tangent track. At
Location S4 adjacent to the Hayward Yard, WIA recorded noise from revenue trains operating
through a crossover. Measurements at the Hayward Yard were performed at interlock 77, which is
the turnout connecting the mainline tracks with the test track. The noise measurement equipment
was positioned at 70 feet and 125 feet from the northbound mainline, which corresponds to the
typical distance from BART tracks to homes located on 11th
Street and at the Innovation Homes. A
total of eight train passbys were recorded at a speed of 70 mph. The dataset included 3-car to 5-car
long trains. The noise levels ranged from 79 to 81 dBA at the 70 foot location and 77 to 79 at 125
foot location. The increase associated with the crossover was 8 dBA for the 125-foot location
Table 2 shows the comparison of the data for airborne noise from train passby obtained at the three
sites. It was observed that the existing sound wall provides a noise reduction of 7 dBA, when
compared to the scenario of no sound walls measured at location S1.
Table 2 – Summary of wayside noise level from BART train passbys
Location ID Description Type of track
Distance
from near
track CL, feet
Wayside
Noise Level,
dBA (1)
S-1 11th Street and D Street Tangent 125 70
S-2 11th Street (Park) Tangent 125 63 (2)
S-3 Innovation Homes Tangent 70 65 (2)
S-4 Hayward Yard Crossover 70 79
125 78
Note:
(1) Microphone located at 5 feet from existing ground elevation
(2) Passby noise level obtained behind the existing barrier wall
Source: WIA 2009
Ground Vibration Measurements of BART Train Passby
As for the measurement of noise from BART train passbys, recordings of ground vibration from
BART train passbys was obtained at four measurement sites. Three measurement sites were selected
to characterize ground vibration from BART trains operating on tangent track and one location for
BART trains operating on special trackwork. The data were also used to obtain the site-specific
ground vibration attenuation curve versus distance for application in the projection model.
Ground vibration was measured using Mark Products Type L282LBU 4.5 Hz geophones and a Teac
LX10 solid-state multi-channel recording system. Figure 3 shows the typical equipment setup used
during the data collection. Geophones were placed at distances between 40 feet and 270 feet from
the nearest BART mainline track. The overall ground vibration velocity level obtained from each
BART train passby was plotted against the distance and a regression analysis was applied to fit the

WILSON, IHRIG & ASSOCIATES, INC. 13 BART Hayward Maintenance Complex
Noise and Vibration Measurements
Noise and Vibration Technical Report Revised May 03, 2011
measured data. The least square regression method was used for all measured vibration presented in
this report. Figure 4 shows the results of the measurement at all five locations.
Vibration location V-1 was located at the corner of 11th
Street and D Street. Geophones were
located at distances of 75, 122, 172 and 222 feet from the northbound BART mainline track. Four
northbound BART trains were recorded traveling at 70 mph at V-1. This measurement location was
chosen to characterize ground vibration from BART trains on residences at 11th
Street between
Stone Street and E Street. The typical ground vibration level measured at the setback distance of
homes from BART tracks was 59 VdB.
Measurement location V-2 was located inside the Dry Creek Park on 11th
Street. Vibration
geophones were set at 70, 120, 220, and 270 feet from the northbound BART track. Results of the
analysis of four BART train passbys show ground vibration levels of about 62 VdB at the typical
location of the closest homes to mainline track. This measurement location was used for residences
located on 11th
Street to Stone Street.
Similar to location V-2, location V-2A was located on the north side of the Dry Creek Park as an
effort to estimate ground vibration for single-family residences on La Vita Terrace and La Brea
Terrace (both located north to the creek), and to study the effect of ground vibration from BART
trains due to the proximity of the creek. Geophones were located at 70, 120, 220, and 270 feet from
the nearest northbound BART track. As shown in Figure 4, ground vibration at location V-2A was
lower than V-2 up to 80 feet, but higher for all distances beyond. Loose local soil at the park could
be the main reason driving the results, and the creek could be the explanation for the slower decay
rate at distances further than 80 feet. Since residences north to the creek are 60 to 70 feet from the
nearest BART track and 30 to 35 feet from the test track, for the purpose of the analysis we have
used V-2 as the representative vibration location for residences on La Vita and La Brea Terrace at
the Innovation Homes.
Vibration inside the Innovation Homes complex (Location V-3) was characterized at the park on
Calle La Mirada Common. The vibration sensors were placed on the ground at a distance of 75, 95,
120, 170 and 195 feet from the northbound BART mainline track. Four train passbys were recorded
and plotted against the distance. The result shows that at the typical distance to the homes (70 to 90
feet), ground vibration ranged from 65 to 67 VdB.
Measurements of ground vibration were also performed at the Hayward Yard (Location V-4) in
September 17, 2009 near the interlock switch 77 connecting the mainline with the test track. Five
geophones were set at 40, 70, 80, 120 and 180 feet from the crossover frog. The passbys of eight
northbound trains at 70 mph were recorded and later analyzed to obtain the frequency spectra and
overall vibration level; the overall vibration was then used in a regression analysis. Figure 4 shows
the curve obtained from the analysis. Vibration levels from operations on the crossover are 12 VdB
higher than those obtained on tangent track at 50 feet (location V-2). However, the decay rate with
distance is much higher than for tangent track. This is explained by the fact that vibration from
trains operating through the crossover acts like a discrete point source while a train passby is more
like a line source. Figure 4 shows that at a distance of 180 feet, ground vibration from BART trains
operating on the turnout of the crossover is identical to that obtained for tangent track.

WILSON, IHRIG & ASSOCIATES, INC. 14 BART Hayward Maintenance Complex
Noise and Vibration Measurements
Noise and Vibration Technical Report Revised May 03, 2011
Figure 1 – Long-term and short-term noise and vibration measurement locations (N of Whipple Rd)
Figure 2 – Long-term and short-term noise and vibration measurement locations (S of Whipple Rd)

WILSON, IHRIG & ASSOCIATES, INC. 15 BART Hayward Maintenance Complex
Noise and Vibration Measurements
Noise and Vibration Technical Report Revised May 03, 2011
Figure 3 – Equipment setup used for noise and vibration passby measurements
Figure 4 – Projected ground vibration levels versus distance from BART train passby on tangent and
special trackwork based on site specific measurements
30
40
50
60
70
80
90
100
10 100 1000
Distance (feet)
Vib
rati
on
Ve
locit
y (
Vd
B)
Loc V-1
Loc V-2
Loc V-2A
Loc V-3
Loc V-4

WILSON, IHRIG & ASSOCIATES, INC. 16 BART Hayward Maintenance Complex
Applicable Noise and Vibration Policies
Noise and Vibration Technical Report Revised May 03, 2011
Applicable Noise and Vibration Policies
FTA Noise Criteria
The FTA Guidance Manual provides three levels of criteria for assessment of noise impact from rail
transit projects: No Impact, Moderate Impact and Severe Impact. These sets of criteria depend on
the existing outdoor ambient noise and the type of land use.
Noise sensitive land-use is grouped into three categories: Category 1, Category 2 and Category 3.
The criteria are shown graphically in Figure 5 for the Category 1 and Category 2 land uses.
The FTA guidelines specify a particular noise metric to be used depending on the specific land-use
(e.g., residential). The Ldn is typically used for residential uses and the worst-hour Leq is typically
used for office use. Thus, the ambient measurements described in the previous section were
conducted to characterize the existing environments accordingly.
Table 3 describes the FTA land-use categories and specifies the appropriate noise metric and the
criterion for each Category. The FTA noise impact thresholds, as indicated in Figure 5 are based on
the increase of the existing ambient noise level associated with operations of the Project or in
combination with other new planned projects (i.e., cumulative impact).
Table 3 - FTA Land Use Categories and Metrics for Transit Noise Impact Criteria
Land Use
Category
Noise Metric
(dBA)
Description of Land Use Category
1 Outdoor Leq(h) Tracts of land where quiet is an essential element in their intended purpose. This
category includes lands set aside for serenity and quiet, and such land uses as
outdoor amphitheaters and concert pavilions, as well as National Historic
Landmarks with significant outdoor use.
2 Outdoor Ldn Residences and building where people normally sleep. This category includes
homes, hospitals and hotels where a nighttime sensitivity to noise is assumed to be
of utmost importance.
3 Outdoor
Leq (h)
Institutional land uses primarily daytime and evening use. This category includes
schools, libraries, and churches where it is important to avoid interference with
such activities as speech, meditation and concentration on reading material.
Buildings with interior spaces where quiet is important, such as medical offices,
conference rooms, recording studios and concert halls fall into this category.
Places for meditation or study associated with cemeteries, monuments, museums.
Certain historical sites, parks and recreational facilities are also included.
Source: FTA, May 2006.
The FTA noise impact thresholds, as shown graphically in Figure 5 below, are based on the noise
exposure increase over the existing ambient noise level associated with the projected future noise
level (created by the project or combination of new projects). Two levels of noise impact are defined
by the FTA guidelines: Moderate Impact and Severe Impact. The range between both the upper
(Severe Impact) and lower curves (Moderate Impact) represents an area where it has been observed
that the increase in cumulative noise exposure is noticeable to most people, but generally not
sufficient to cause an adverse reaction by the surrounding communities. The FTA Guidelines

WILSON, IHRIG & ASSOCIATES, INC. 17 BART Hayward Maintenance Complex
Applicable Noise and Vibration Policies
Noise and Vibration Technical Report Revised May 03, 2011
established the threshold on the upper area as the limit above which a substantial percentage of
receptors in the vicinity of the Project may be highly annoyed.
For the BART HMC Project, Noise Impact would be indicated when noise exposure levels exceed
the threshold for Severe Impact and Moderate Impact as defined by the FTA Guidelines. Mitigation
measures would be evaluated on sensitive receptors identified with either category of impact. Noise
in the Severe Impact range has the greatest adverse effect on the community, requiring mitigation
unless extenuating circumstances prevent it, if mitigation is found not to be feasible or prudent.
Moderate Impacts also require consideration and adoption of mitigation measures when it is
considered reasonable to do so.
Source: FTA, May 2006.
Figure 5 – Allowable Increase in Cumulative Noise Levels for FTA Category 1 and 2
FTA Vibration Criteria
The ground-borne vibration criteria for the FTA General Assessment analysis accounts for the
frequency of events, where Frequent Events are defined as more than 70 events (trains) per day,
Occasional Events are for between 30 and 70 events per day, and Infrequent Events for less than 30
events per day. Additionally, FTA provides separate criteria (not included in any Category
presented above) for buildings that are especially sensitive to vibration (e.g., research laboratories).
There are currently no special buildings in the area of the Project.
In year 2030, BART is expected to run a total of 315 trains daily once the Silicon Valley Rapid
Project (SVRTP) is in place. However, even with the current train schedule, BART can be
categorized as a system with Frequent Events. Similarly, future operation of the test track falls into
the Frequent Event Category (more than 70 events per day). The current test track activities are
considered by the FTA guidelines as Occasional Events.
The FTA guidelines group vibration sensitive land uses into three categories: High Sensitivity,
Residential and Institutional. Table 4 shows the description of each land use category applied to the
Allowable Increase in Cumulative Noise Levels
- categories 1 and 2
NO IMPACT
MODERATE
IMPACT
SEVERE
IMPACT
0
5
10
15
20
40 45 50 55 60 65 70 75 80
Existing Noise Exposure
No
ise E
xp
osu
re I
ncre
ase,
Ld
n (
dB
A)

WILSON, IHRIG & ASSOCIATES, INC. 18 BART Hayward Maintenance Complex
Applicable Noise and Vibration Policies
Noise and Vibration Technical Report Revised May 03, 2011
analysis. Vibration sensitive land uses in the proximity of the HMC Project are Category 2
exclusively. No Category 1 or 3 land uses were identified in the area of the Project.
Table 4 – Category of Land Use for the FTA Vibration Analysis
Vibration Category Description of Land Use Category
Category 1 - High
Sensitivity
“Included in Category 1 are buildings where vibration would interfere with operations
within the building, including levels that may be well below those associated with
human annoyance.” “Typical land uses covered by Category 1 are: vibration-sensitive
research and manufacturing, hospital with vibration-sensitive equipment, and university
research operations.”
Category 2 - Residential “This category covers all residential land uses and any buildings where people sleep,
such hotels and hospitals. No differentiation is made between different types of
residential areas.”
Category 3 - Institutional “Vibration Category 3 includes schools, churches, other institutions, and quiet offices
that do not have vibration-sensitive equipment, but still have the potential for activity
interference. Although it is generally appropriate to include office buildings in this
category, it is not appropriate to include all buildings that have any office space.”
Source: FTA, May 2006.
Table 5 - FTA Ground-borne Vibration Impact Criteria for General Assessment
Land Use
Category
GBV Impact Levels
(VdB re 1 micro-inch/sec)
Frequent Events Occasional Events Infrequent Events
Category 1 65 VdB 65 VdB 65 VdB
Category 2 72 VdB 75 VdB 80 VdB
Category 3 75 VdB 78 VdB 83 VdB
Source: FTA, May 2006.

WILSON, IHRIG & ASSOCIATES, INC. 19 BART Hayward Maintenance Complex
Noise and Vibration Impact Assessment
Noise and Vibration Technical Report Revised May 03, 2011
Noise and Vibration Impact Assessment
The noise and vibration assessment in this report evaluates the construction and operational noise
and vibration impacts of the Project, including BART train movements on the east storage tracks, the
new Overhaul Shop, the Maintenance and Engineering (M&E) yard, shops, and storage for non-
revenue maintenance equipment, and the new traction power substation.
The alignment evaluated in this report includes both the south and north dispatch flyovers shown in
Figure 6. The Phase 1 Project proposes implementing two new crossovers between the southbound
and northbound tracks in the area of 11th
Street (crossovers P100 and P102)3. This special trackwork
would be located approximately 150 feet from the nearest single-family homes on 11th
Street. Also
during Phase 1, the Project would provide access to the Hayward Maintenance Complex (HMC).
Crossovers proposed for accessing the HMC include a single turnout off the southbound main track
(crossover P102) which is located approximately 95 feet from the nearest homes. Figure 6 shows
the location of these new crossovers.
During Phase 2, a new No. 15 crossover (crossover P101 in Figure 6) would be placed between the
northbound track and the test track just south of the Whipple Road overpass. The distance between
P101 and the closest sensitive receptors would be about 60 feet.
Two crossovers (P103 and P104) on the dispatch and reception lead track would be located just
south of the Whipple Road overpass at a distance of approximately 130 feet from the closest
sensitive receptors. Both crossovers P103 and P104 would be implemented during Phase 2 of the
Project.
The Project also includes site improvements to 20 acres of undeveloped land to the northeast of the
Yard that would provide storage tracks to accommodate up to a maximum of 250 cars, and a traction
power substation to the south end of the east storage area. The location of these improvements is
shown in Figure 6.
Finally, the proposed project would acquire three properties to the west of the existing Hayward
Yard to accommodate the new maintenance complex that would include a new overhaul shop,
component repair shop, central warehouse, and the maintenance and engineering shop and storage.
The primary variables and assumptions that were used in the noise and vibration models include:
Alignment on ballast and tie tracks except on the aerial structure for which a direct fixation
system was assumed.
Cumulative noise levels were estimated based on the future schedule proposed for the Silicon
Valley Rapid Transit Project (SVRTP).
Proposed BART future operations (SVRTP) on the main line would bring 271 trains through the
Hayward Maintenance Complex during the daytime and 44 trains at night (in both directions of
travel).
BART future trains operations would be 10-cars long (700 feet) during peak-hour operation and
5-cars long (350 feet) during off-peak operations. BART vehicles on the test track would be 4-
cars long (280 feet).
3 Labels given to crossovers in this report are intended for identification purpose only.

WILSON, IHRIG & ASSOCIATES, INC. 20 BART Hayward Maintenance Complex
Noise and Vibration Impact Assessment
Noise and Vibration Technical Report Revised May 03, 2011
Maximum BART train speed on the main line and test track would be 70 mph. BART maximum
speed on the storage and yard lead tracks would be 30 mph.
Ground vibration projections use a locally derived ground vibration curve obtained by field
measurements.
To establish interior vibration levels, an adjustment of +3 VdB was applied to account for the
general response of wood-framed residential structures.
Future yard operations for the analysis were estimated at 80 train movements during daytime and
40 during nighttime hours. This number includes the current dispatch activities (60 trains) which
would originate on the west side of the HMC and the new activities on the east.
A 34.5 KVA track power substation was assumed for the east storage area. The reference sound
exposure level used in calculations was 99 dBA at 50 feet.
Operations on the test track for the cumulative noise analysis would be 12 trains per hour from 7
am to 11 pm. This schedule is a worst-case condition for the noise modeling. This schedule
assumes the future train activities expected from future car commissioning. The train activity is
associated with the testing of the new vehicles on the test track before BART accepts them for
service. The train consist is assumed to be 4 cars long with operational speeds of 30 to 40 mph
south of Whipple Road.

WILSON, IHRIG & ASSOCIATES, INC. 21 Noise and Vibration Impact Assessment
Noise and Vibration Technical Report Revised May 03, 2011
Figure 6 – Hayward Maintenance Complex. Phase 1 (top) and Phase 2 (bottom) conceptual design plan view

WILSON, IHRIG & ASSOCIATES, INC. 22 BART Hayward Yard
Noise and Vibration Impact Assessment
Noise and Vibration Technical Report Revised May 03, 2011
Noise Assessment
Methodology
BART Operational Noise Analysis
The assessment of wayside noise impacts from operations of BART trains in the vicinity of the
Hayward Yard Project was done in accordance with the FTA Guidance Manual. The FTA
guidelines provide two levels of analysis during an environmental analysis: Screening and General
Assessment. The assessment of potential noise impacts due to BART operations as part of the
Project were based on the level described by FTA as General Assessment. The FTA Criteria are
based on the relative change in the cumulative noise exposure that would occur, using the “day-
night” noise level descriptor (Ldn) for residential or other buildings with nighttime occupancy and
peak hour Leq for buildings with daytime occupancy only. WIA obtained the existing ambient noise
levels along the corridor in September of 2009.
Cumulative noise levels due to the Project depend on train length, speed and distance from both
tracks to the buildings. The projected wayside noise levels also account for the noise shielding
effects of the existing sound walls.
For the purpose of this analysis, the current schedule of BART trains on the Fremont to Richmond
and Fremont to Daly City lines indicates 204 daytime trains and 52 nighttime trains through the
Hayward Yard (in both directions of travel). Traffic on the mainline is projected to receive
additional trains from two proposed BART extension projects: Warm Springs Project (WSX) and the
Silicon Valley Rapid Transit Project (SVRTP). The WSX project is expected to operate with a
similar number of trains as the current schedule. However for the SVRTP, BART proposes to
operate 271 trains through the Hayward Yard during the daytime and 44 trains at night (in both
directions of travel), which is approximately 59 trains per day greater than the current schedule.
BART trains operating on the SVRT Project will be 10-cars long (700 feet) during peak-hour
operation and 5-cars long (350 feet) during off-peak operation4.
Cumulative noise levels were estimated based on the future schedule proposed for the SVRT Project,
which represents a conservative approach for the Hayward Yard Expansion considering the proposed
opening date for the SVRT Project is unknown. Figure 7 shows the projected unshielded day-night
noise level versus distance expected from future BART operations on tangent track (year 2030).
Additional adjustments to the unshielded noise exposure in Figure 7 include those that account for
increases due to the crossovers, speed changes at the storage and yard lead tracks, and the reduction
of noise level provided by existing sound walls.
4 Silicon Valley Rapid Transit Project. Line Segment Wayside Noise Report, December 2006. Prepared by Wilson, Ihrig
and Associates, Inc.

WILSON, IHRIG & ASSOCIATES, INC. 23 BART Hayward Yard
Noise and Vibration Impact Assessment
Noise and Vibration Technical Report Revised May 03, 2011
Figure 7 – Projected unshielded day-night noise level of BART trains on at-grade ballast and tie tracks
at 70 mph with 12-minute headways (future condition).
Hayward Yard Operations
Noise from BART operations as part of the HMC Project include BART train movements on
proposed tracks and crossovers, and noise from the traction power substation constructed at the
south end of the storage track area to provide power to the storage tracks.
The methodology to assess wayside noise was taken from the FTA guidance manual. The reference
sound exposure level (SEL) specified in the guidance manual is 118 dBA for 20 train movements
during peak hour activities. The HMC East storage expansion proposes adding 40 train movements
during daytime hours and 20 train movements during nighttime hours to the existing train
movements (originated on the west side of the Yard). This represents a doubling of yard traffic, with
half (60 trains) operating from the west side of the Hayward Yard and half (60 trains) operating from
the east side of the yard. This assumption represents a worst case condition for noise modeling.
The unshielded noise levels from the 34.5 KVA substation were projected to nearby residences and
the level compared to the FTA criteria shown in Figure 5. The reference sound exposure used in the
calculation was 99 dBA at 50 feet. We understand that BART requires its substations meet the
National Electrical Manufacturers Association (NEMA) rating. The maximum NEMA ratings,
which are specified in terms of the average sound level, are 60 dBA for a self-cooled ventilated
system, 59 for a self-cooled sealed and 67 dBA for a ventilated forced air cooled. These sound
levels are much quieter than that specified in the FTA guidance. Therefore, following the FTA
procedure will be a conservative approach for this project.
Noise from future operations on the new overhaul shop, component repair shop, maintenance and
engineering shop and storage, and central warehouse was based on field measurements performed on
the existing main shop at the Hayward Yard. Noise measurements and field observations performed
by WIA during July 2010 helped to determine an outdoor sound exposure level of 96 dBA (at 50
feet) from typical activities from the Main Shop. Such activities included impact wrenches during
dissemble and ensemble of train’s truck, PA announcements, overhead cranes operation, and steam
cleaning.
40
45
50
55
60
65
70
75
80
10 100 1000
Distance (feet)
Un
sh
ield
ed
Day-N
igh
t Level
(d
BA
)
`

WILSON, IHRIG & ASSOCIATES, INC. 24 BART Hayward Yard
Noise and Vibration Impact Assessment
Noise and Vibration Technical Report Revised May 03, 2011
Projected Cumulative Noise
Operational
The impact assessment for noise is based on the comparison of the increased levels (Ldn) associated
with BART operations with the impact threshold presented in Figure 5.
Table 6 and Table 7 show the results of the projected cumulative noise levels from BART train
operations on the proposed HMC Project for Phase 1 and Phase 2 respectively. Projected noise
levels in the tables include the effect of BART train operations on the mainline (future schedule),
and BART operations on the new crossovers (including future test track operations). The summary
of the results are as follows:
Phase 1 - West Side Improvements
There would be potential for Moderate Noise Impact at three single-family residences located on
11th
Street due to the increase associated with the proposed crossover P100.
Noise impacts are also projected at about 14 single-family homes that would be located directly
opposite to crossover P102 which connects the southbound main line with the southbound dispatch
and reception lead. The increase in noise level expected on residences at Alicante Terrace and
Carrara Terrace would be 2.0 to 2.7 dBA resulting in Moderate Impact.
Phase 2 – East Side Improvements
Operations of BART trains on crossover P100B would result in a Severe Noise Impact at nine single-
family residences located on La Brea Terrace due to the noise increase associated with the BART
trains from crossover P100B and the distance from the crossover to the residences.
Also six single-family homes located on Carrara Avenue would receive a Moderate Impact due to
crossover P101 that would be connecting the northbound mainline with the test track. There are
other homes near this crossover; however noise levels from operations of BART trains on the test
track at the crossover P101 would be reduced by the shielding provided from the existing retaining
wall. Thus, for the single-family homes at Messina and La Bonita Terrace there would be No Noise
Impact. Consequently noise mitigation measures would only be considered for the homes on Carrara
Avenue.
North of Whipple Road, the project would slightly increase the cumulative noise levels at nearby
single-family homes due to trains on the aerial flyover. However, the increase would be below the
threshold for Moderate Noise Impact. As a result, No Noise Impact is expected from BART
operations on the aerial guideway and therefore, no additional mitigation measures would be needed
on the aerial guideway.

WILSON, IHRIG & ASSOCIATES, INC. 25 BART Hayward Yard
Noise and Vibration Impact Assessment
Noise and Vibration Technical Report Revised May 03, 2011
Table 6 – Projected cumulative noise levels from BART operations on the HMC Expansion (Project) for Phase 1
Location
Land
Use
Dist. to
nearest
track
CL (ft)
Amb.
Level
Ldn (except
as
noted
FTA
Criteria
Cumulative Noise Levels
No Noise Control
Cumulative Noise Levels
With Noise Control
Mo
der
ate
Imp
act
Sev
ere
Imp
act
Projected
Total1 Ldn
or Leq
(dBA)
Incr
ea
se
(dB
A)
Imp.
Type
# of
Bldgs
with
Imp.
Projected
Total1 Ldn
or Leq
(dBA) Incr
ea
se
(dB
A)
Imp.
Type
# of
Bldgs
with
Imp.
11th St btwn Stone St & Boyle St. SFR 135 xo 60 2.0 5.0 62 2.0 NI 0 ---
11th St and Boyle St. SFR 140 xo 60 2.0 5.0 63 2.7 MI 3 62 1.7 NI 0
Dry Creek Park Park 120xo 602 4.6 9.0 63
2 2.8 NI 0 ---
La Brea Terrace SFR 75 62 1.7 4.4 64 1.6 NI 0 ---
Alicante Terrace SFR 75 xo 62 1.7 4.4 65 2.7 MI 7 64 1.7 NI 0
Carrara Terrace SFR 80 xo 62 1.7 4.4 64 2.0 MI 7 63 1.3 NI 0
Messina Terrace SFR 85 62 1.7 4.4 63 0.5 NI 0 ---
La Bonita Terrace SFR 90 63 1.6 4.1 63 0.0 NI 0 ---
Notes:
(1) Include noise levels from future BART train operations on mainline and crossover and
the projected existing adjusted ambient noise levels.
(2) Leq is the metric for FTA Category 3 sensitive receptors
xo : crossover switch
SFR: Single-family residence building
NI : No Impact as defined by FTA
MI : Moderate Impact as defined by FTA
SI: Severe Impact as defined by FTA
Source: WIA 2010

WILSON, IHRIG & ASSOCIATES, INC. 26 BART Hayward Yard
Noise and Vibration Impact Assessment
Noise and Vibration Technical Report Revised May 03, 2011
Table 7 – Projected cumulative noise levels from BART operations on the HMC Expansion (Project) Phase 2
Location Land
Use
Dist. to
nearest
track
CL (ft)
Amb.
Level
Ldn (except
as noted
FTA
Criteria
Cumulative Noise Levels
No Noise Control
Cumulative Noise Levels
With Noise Control
Mo
der
ate
Imp
act
Sev
ere
Imp
act
Projected
Total1 Ldn
or Leq
(dBA)
Incr
ea
se
(dB
A)
Imp.
Type
# of
Bldgs
with
Imp.
Projected
Total1 Ldn
or Leq
(dBA) Incr
ea
se
(dB
A)
Imp.
Type
# of
Bldgs
with
Imp.
11th St btwn Stone St & Boyle St. SFR 135 xo 60 2.0 5.0 61 1.4 NI 0 ---
11th St and Boyle St. SFR 140 xo 60 2.0 5.0 62 1.7 NI 0 ---
Dry Creek Park Park 120xo 602 4.6 9.0 62
2 1.8 NI 0 ---
La Brea Terrace SFR 75 xo 62 1.7 4.4 67 4.7 SI 9 64 1.4 NI 0
Alicante Terrace SFR 75 xo 62 1.7 4.4 64 1.5 NI 0 ---
Carrara Terrace SFR 80 xo 62 1.7 4.4 65 2.5 MI 6 63 1.3 NI 0
Messina Terrace SFR 85 xo 62 1.7 4.4 63 1.4 NI 0 ---
La Bonita Terrace SFR 90 xo 63 1.6 4.1 63 0.4 NI 0 ---
Notes:
(1) Include noise levels from future BART train operations on mainline and crossover and
the projected existing adjusted ambient noise levels.
(2) Leq is the metric for FTA Category 3 sensitive receptors
xo : crossover switch
SFR: Single-family residence building
NI : No Impact as defined by FTA
MI : Moderate Impact as defined by FTA
SI: Severe Impact as defined by FTA
Source: WIA 2010

WILSON, IHRIG & ASSOCIATES, INC. 27 BART Hayward Yard
Noise and Vibration Impact Assessment
Noise and Vibration Technical Report Revised May 03, 2011
Table 8 – Projected cumulative noise levels from activities at the proposed east train storage, west side improvements, and traction
power substation
Location
Land
Use
Range of
Typical
Dist. (ft)
Amb.
Level
Ldn
FTA Criteria
Projected
Total Ldn
(dBA)
Increase
(dBA)
Imp.
Type
# Bldgs
w/Imp
Mo
der
ate
Imp
act
Sev
ere
Imp
act
Ithaca Ave between Whipple Road and
Troy Place SFR 630 – 2,900 70 1.0 2.8 70 0.1 NI 0
Carroll Ave between Troy Place and
Gressel St SFR 320 – 1,400 69 1.1 2.9 69 0.3 NI 0
Carroll Ave between Gressel St. and
Becker Place SFR 170 – 1,100 67 1.2 3.1 68 1.1 NI 0
Carroll Ave between Becker Pl. and
Fairway Street SFR 200 – 1,400 67 1.2 3.1 68 1.0 NI 0
Carroll Ave north of Fairways Street SFR 370 – 2,500 67 1.2 3.1 67 0.2 NI 0
SFR: Single-family residence building
NI : No Impact as defined by FTA
Source: WIA 2010
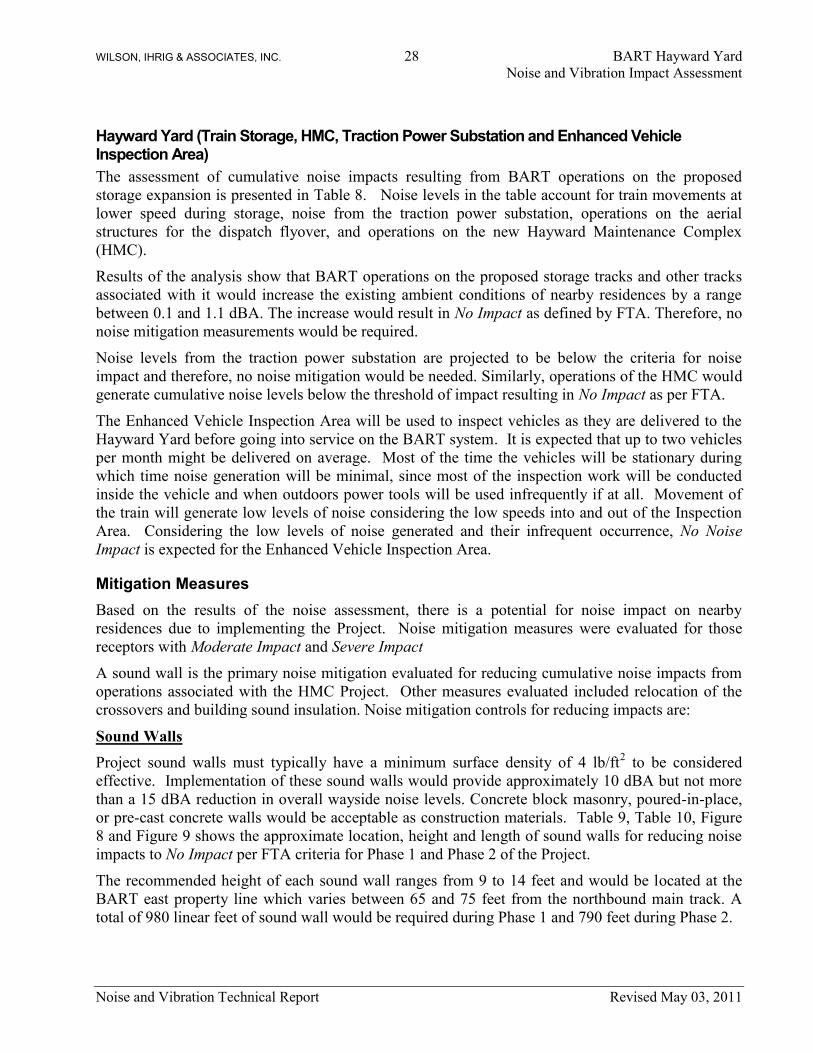
WILSON, IHRIG & ASSOCIATES, INC. 28 BART Hayward Yard
Noise and Vibration Impact Assessment
Noise and Vibration Technical Report Revised May 03, 2011
Hayward Yard (Train Storage, HMC, Traction Power Substation and Enhanced Vehicle Inspection Area)
The assessment of cumulative noise impacts resulting from BART operations on the proposed
storage expansion is presented in Table 8. Noise levels in the table account for train movements at
lower speed during storage, noise from the traction power substation, operations on the aerial
structures for the dispatch flyover, and operations on the new Hayward Maintenance Complex
(HMC).
Results of the analysis show that BART operations on the proposed storage tracks and other tracks
associated with it would increase the existing ambient conditions of nearby residences by a range
between 0.1 and 1.1 dBA. The increase would result in No Impact as defined by FTA. Therefore, no
noise mitigation measurements would be required.
Noise levels from the traction power substation are projected to be below the criteria for noise
impact and therefore, no noise mitigation would be needed. Similarly, operations of the HMC would
generate cumulative noise levels below the threshold of impact resulting in No Impact as per FTA.
The Enhanced Vehicle Inspection Area will be used to inspect vehicles as they are delivered to the
Hayward Yard before going into service on the BART system. It is expected that up to two vehicles
per month might be delivered on average. Most of the time the vehicles will be stationary during
which time noise generation will be minimal, since most of the inspection work will be conducted
inside the vehicle and when outdoors power tools will be used infrequently if at all. Movement of
the train will generate low levels of noise considering the low speeds into and out of the Inspection
Area. Considering the low levels of noise generated and their infrequent occurrence, No Noise
Impact is expected for the Enhanced Vehicle Inspection Area.
Mitigation Measures
Based on the results of the noise assessment, there is a potential for noise impact on nearby
residences due to implementing the Project. Noise mitigation measures were evaluated for those
receptors with Moderate Impact and Severe Impact
A sound wall is the primary noise mitigation evaluated for reducing cumulative noise impacts from
operations associated with the HMC Project. Other measures evaluated included relocation of the
crossovers and building sound insulation. Noise mitigation controls for reducing impacts are:
Sound Walls
Project sound walls must typically have a minimum surface density of 4 lb/ft2 to be considered
effective. Implementation of these sound walls would provide approximately 10 dBA but not more
than a 15 dBA reduction in overall wayside noise levels. Concrete block masonry, poured-in-place,
or pre-cast concrete walls would be acceptable as construction materials. Table 9, Table 10, Figure
8 and Figure 9 shows the approximate location, height and length of sound walls for reducing noise
impacts to No Impact per FTA criteria for Phase 1 and Phase 2 of the Project.
The recommended height of each sound wall ranges from 9 to 14 feet and would be located at the
BART east property line which varies between 65 and 75 feet from the northbound main track. A
total of 980 linear feet of sound wall would be required during Phase 1 and 790 feet during Phase 2.

WILSON, IHRIG & ASSOCIATES, INC. 29 BART Hayward Yard
Noise and Vibration Impact Assessment
Noise and Vibration Technical Report Revised May 03, 2011
The specific location and height of sound walls would be addressed later in detail during final design
when further details about track and receiver elevation, track location and other pertinent
information would be available.
Table 9 – Summary of minimum recommended sound wall mitigation for the HMC Project Phase 1
Sound
Wall ID Location SW (1)
Height (feet) SW length (feet)
11th St between Stone St & Boyle St. --- ---
SW-01 11th St and Boyle St. 10 320
La Brea Terrace --- ---
SW-02 Alicante Terrace 10 320
SW-02 Carrara Terrace 13 340
Messina Terrace --- ---
La Bonita Terrace --- ---
Note:
(1) Approximate height from BART top-of-rail
Source: WIA 2010
Table 10 – Summary of minimum recommended sound wall mitigation for the HMC Project Phase 2
Sound
Wall ID Location SW (1)
Height (feet) SW length (feet)
11th St between Stone St & Boyle St. --- ---
11th St and Boyle St. --- ---
SW-03 La Brea Terrace 9 380
Alicante Terrace --- ---
SW-04 Carrara Terrace 14 410
Messina Terrace --- ---
La Bonita Terrace --- ---
Note:
(1) Approximate height from BART top-of-rail
Source: WIA 2010

WILSON, IHRIG & ASSOCIATES, INC. 30 BART Hayward Yard
Noise and Vibration Impact Assessment
Noise and Vibration Technical Report Revised May 03, 2011
Building Sound Insulation
For noise sensitive receptors at ground level the outdoor noise from HMC train operations can be
mitigated with a feasible height sound wall to achieve the FTA Criteria, but the sound wall is not tall
enough to mitigate noise levels at upper stories, and possible physical improvement to building
exterior-to-interior sound insulation may be necessary and should be evaluated after construction of
the project is completed. The interior noise levels for stories above ground level at the Innovation
Homes facing the BART ROW could potentially be exposed to noise that is in excess of the FTA
criterion even with the recommended sound walls. These residences should be evaluated to
determine if improved building noise insulation may be needed as additional mitigation beyond the
recommended sound walls.
This additional type of mitigation (improving sound insulation) has been used around freeways and
airport projects, but not yet implemented on a BART project, although this approach to noise impact
mitigation has been included in the Warm Springs Extension project as well as in the Silicon Valley
Rapid Transit project (now referred to as the Berryessa Extension project). The VTA Capitol
Corridor LRT project implemented a formal process that evaluated the need for improving building
insulation on a case-by-case basis as noise mitigation where sound walls were not the preferred
option.
Improving individual building insulation can be evaluated on a case-by-case basis using the
generally accepted criterion (i.e., California State and local building codes) of a maximum interior
noise for residences of 45 dBA Ldn. Generally speaking windows are the building element that
determines whether or not a building exterior provides the amount of exterior-to-interior noise
reduction to achieve an interior noise level of 45 dBA Ldn or lower. In general, windows must
provide a Sound Transmission Class (STC) rating of greater than 27 for this to be achieved. The
greater the exterior noise level is, the higher the window STC rating required. Based on visual
observations in the field, the current construction elements of the buildings at the Innovation Homes
should provide a STC rating higher than 27. Therefore, future train operations from the HMC Project
should achieve an Ldn of 45 dBA interior or less. Consequently improving building insulation by
replacing the existing windows on a case-by-case basis may not be necessary. However, it is not
possible to verify this condition at the present time, and therefore it is recommended to that this
should be evaluated on a case-by-case basis once the HMC Project has been completed and trains are
operating.

WILSON, IHRIG & ASSOCIATES, INC. 31 Noise and Vibration Impact Assessment
Noise and Vibration Technical Report Revised May 03, 2011
Figure 8 – Location and minimum recommended extent of sound wall for Phase 1
Figure 9 - Location and minimum recommended extent of sound wall for Phase 2

WILSON, IHRIG & ASSOCIATES, INC. 32 BART Hayward Yard
Noise and Vibration Impact Assessment
Noise and Vibration Technical Report Revised May 03, 2011
Vibration Assessment
Methodology
BART Operational Vibration Analysis
To assess the potential for ground-borne vibration impact, results of the curves derived from the
measured ground vibration at the four sites were compared against the FTA criteria presented in
Table 5. The methodology to assess the potential for vibration impacts for the Hayward
Maintenance Complex Project is identical to the General Assessment presented in the FTA Guidance
Manual. The General Assessment method uses only an overall level and applies adjustments to
account for different vibration factors. The analysis presented herein uses a locally derived ground
vibration curve obtained by field measurements instead of a generalized one. Adjustments to the
curves were made to account for train speed at the east storage tracks, the elevated guideway, and
increases due to building vibration response (BVR), which generally amplifies ground-borne
vibration for residential buildings.
For practical reasons, vibration measurements in the area of the project were performed on the
ground surface outside residential homes. To establish interior vibration levels, an adjustment of +3
VdB was applied to account for the general response of wood-framed residential structures such as
those observed at all receptors in the area of the project. This adjustment is sometimes referred to as
the building vibration response (BVR).
The BVR represents the response of a particular building, type or class of building structures relative
to the vibration observed at the ground’s surface at the building façade closest to the tracks. The
response of the building includes the foundation coupling loss, floor-to-floor attenuation and
resonant amplification of vibrating room surfaces (floors/ceilings and walls) that may apply to a
specific receiving area. Generic building response data are contained in a report by Nelson and
Saurenman5, and in State-of-the-Art Review: Prediction and Control of Ground-borne Noise and
Vibration from Rail Transit Trains6. WIA also maintains a database of measured building vibration
responses for similar building construction on several rail transit projects in the Bay Area and
southern California.
Speed adjustments to the curves obtained from field measurements were applied to BART trains on
the storage and lead tracks. The speed adjustment isrefSpeed
Speedlog20 , with 70 mph as the
reference speed. For the analysis herein, the maximum speed at the east storage and lead tracks were
assumed to be 30 mph.
Separate analyses were conducted for each alternative evaluated and compared against the applicable
criteria. Operations of BART trains on the mainline can be categorized as Frequent Events per the
5 Nelson, J. T. and H. J. Saurenman, A Prediction Procedure for Rail Transportation Groundborne Noise and Vibration,
Transportation Research Record 1143, Presented at the January 1987, A1F04 Committee Meeting of the Transportation
Research Board. 6 U.S. Dept. of Transportation, State-of-the-Art Review: Prediction and Control of Groundborne Noise and Vibration
from Rail Transit Trains, UMTA-MA-06-0049-83-4, December 1983.

WILSON, IHRIG & ASSOCIATES, INC. 33 BART Hayward Yard
Noise and Vibration Impact Assessment
Noise and Vibration Technical Report Revised May 03, 2011
FTA guidelines. Based on the information provided by BART 7 current dispatch activities at the
Hayward Yard (60 trains) would continue to originate out of the west side of the facility. Yard
operations for the analysis were estimated at 80 train movements during daytime and 40 during
nighttime hours. For the purpose of modeling, we have assumed that half of the train movements
would be originated from the west side and half from the east side of the facility.
Projected Ground Vibration
Operational
The impact assessment for vibration is based on the overall vibration levels associated with BART
operations projected to the location of vibration sensitive receptors. When vibration levels exceed
the criteria shown in Table 5, then a Vibration Impact is identified. Vibration mitigation measures
have been evaluated to reduce the vibration to the level of No Impact.
Phase 1 – West Side Improvements
Table 11 shows the results of the assessment during Phase 1. As presented in the table, there would
be no Vibration Impacts from train operations on the proposed single crossover P100 along 11th
Street. Vibration sensitive receptors would be located far enough away such that the vibration levels
would be below the 72 VdB criterion. Therefore, no vibration mitigation measures would be
needed.
BART trains crossing the switch P102 would generate a Vibration Impact at approximately six
residential homes located on Alicante Terrace and four homes located on Carrara Terrace. The
vibration levels are projected 6 to 7 VdB over the FTA criteria and primarily due to the proximity
between the receptors and the crossover P102 (85 to 90 feet). Mitigation measures would be needed
at the location of crossover P102 to reduce the level of impact to No Impact.
Phase 2 – East Side Improvements
In the vicinity of crossover P101 vibration levels associated with trains crossing the crossover frog
would be 8 to 12 VdB in excess of the FTA criterion resulting in Vibration Impact at 15 residences
on La Bonita and Carrara Terrace (eight single-family homes at La Bonita Terrace and seven at
Carrara Terrace). Four of the seven single-family residences on Carrara identified with a Vibration
Impact would be impacted as discussed above for Phase 1. Mitigation measures are recommended to
reduce the level to No Impact.
In addition, vibration impact is expected at those receptors located within 130 feet from the turnout
P100B. The overall vibration criteria would be exceeded with this option by up to 4 VdB on
residences located on La Brea Terrace (9 single-family homes) resulting in Vibration Impact.
Vibration mitigation measures for the crossover P100B would be required to reduce the level of
impact to No Impact.
Vibration levels from BART train operation on crossovers P103 and 104 would be below the FTA
criterion. Consequently, no vibration mitigation measures would be necessary. Lower vibration
levels are due to the distance to/from residences and the slower train operational speed on the
dispatch track.
7 Data Request for the Hayward Yard Project. Provided by BART – Data_Request2.doc

WILSON, IHRIG & ASSOCIATES, INC. 34 BART Hayward Yard
Noise and Vibration Impact Assessment
Noise and Vibration Technical Report Revised May 03, 2011
Hayward Yard
Activities from BART trains at the proposed East Storage area would be below the FTA criterion.
Train movements are expected to occur at a lower speed and although the vibration would be higher
than those on tangent track, based on the measured data for the crossover at the Hayward Yard, the
adjusted vibration (adjusted for speed) would be below the FTA criterion resulting in No Vibration
Impact. Consequently, no mitigation measures would be required.
Vibration Mitigation Measures
As discussed above, results of the vibration assessment for the HMC Project shows that vibration
levels expected from BART operations on crossover switches would exceed the FTA criteria
resulting in potential for Vibration Impact. Vibration mitigation measures are recommended to
reduce the Project impact to No Impact.
The location of the mitigation measures under the track such as tire-derived aggregate (TDA) or
floating slab track (FST) is presented in Table 13. The mitigation control should extend a minimum
of 75 feet on both sides of the crossover frog to account for the length of one BART car. However,
the actual extent of the mitigation control would be determined during final design. In addition to
tire-derived aggregate and floating slab track, new measures to mitigate vibration may arise from
new technology and may be found to be appropriate mitigation.
Tire-Derived Aggregate (TDA)
The use of shredded scrap tires as a vibration-isolating medium for rail is a relatively recent
technology. TDA as a vibration reduction medium consists of construction with a compacted layer
of shredded tires approximately 12 inches thick located below the sub-ballast and ballast layers of
track. This system has been installed at selected locations on two transit systems, on the San Jose
VTA Vasona Line and at Denver's TREX light rail line. Recent investigation indicates that the
performance is more effective than a ballast mat, but less effective, particularly at lower frequencies
when compared to the performance of a floating slab track-bed system.
The schematic of the typical extent recommended for TDA mitigation on the crossovers is shown in
Figure 10. As indicated in the figure, vibration mitigation would be required on both frogs, and the
minimum recommended is 100 feet before the point of switch. On the turnout P102, the minimum
extent is 100 feet from the point of switch to the south and 100 feet to the north on both the main
southbound track and the turnout track. The schematic of the vibration mitigation is indicated in
Figure 11.
Floating Slab Tracks
This approach basically consists of a massive concrete slab supported on elastomeric elements,
normally natural rubber. Several designs have been successfully used for heavy rail transit systems
such as in Washington DC, Atlanta, Boston, Toronto and on the BART system. This specific design
consists of precast concrete slabs that are normally 6-feet long and supported vertically on four
natural rubber pads per slab. Each slab is held in place in the lateral direction by natural rubber "side
pads" that bear against a curb constructed in a concrete bathtub (shallow retained cut). In the
longitudinal direction, natural rubber pads separate adjacent slabs. All of the horizontal (lateral and
longitudinal) restraint pads are pre-compressed during installation. One of the most significant
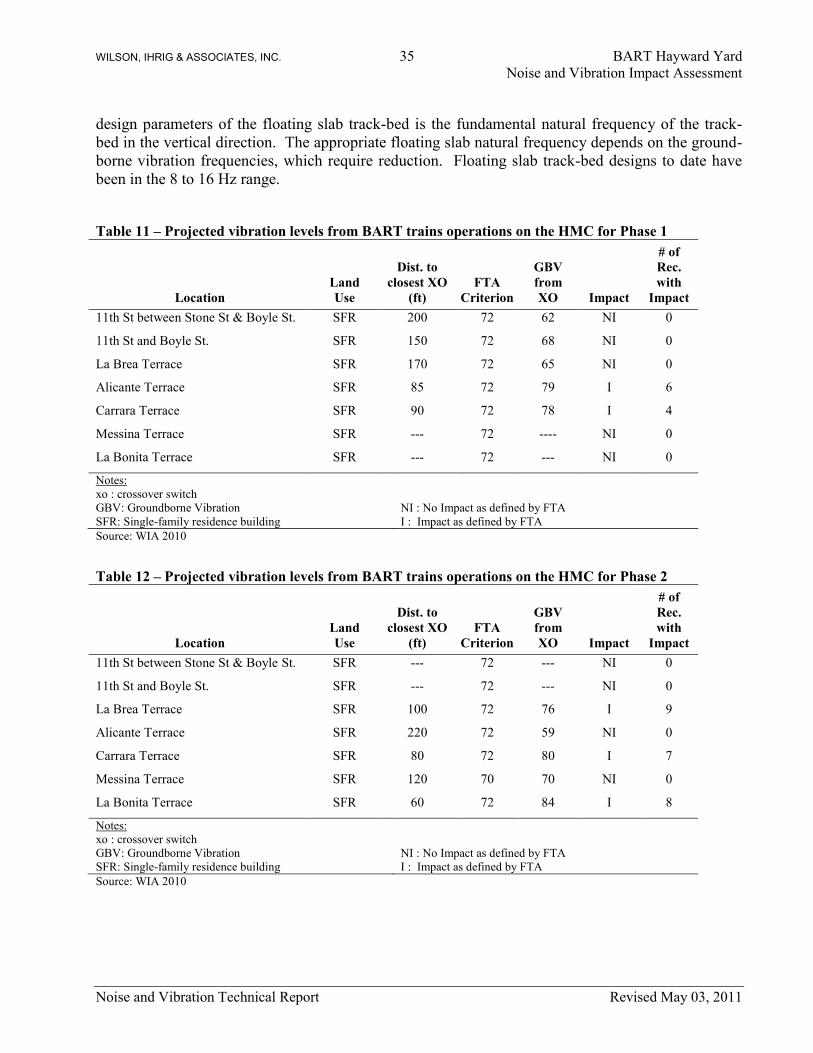
WILSON, IHRIG & ASSOCIATES, INC. 35 BART Hayward Yard
Noise and Vibration Impact Assessment
Noise and Vibration Technical Report Revised May 03, 2011
design parameters of the floating slab track-bed is the fundamental natural frequency of the track-
bed in the vertical direction. The appropriate floating slab natural frequency depends on the ground-
borne vibration frequencies, which require reduction. Floating slab track-bed designs to date have
been in the 8 to 16 Hz range.
Table 11 – Projected vibration levels from BART trains operations on the HMC for Phase 1
Location
Land
Use
Dist. to
closest XO
(ft)
FTA
Criterion
GBV
from
XO Impact
# of
Rec.
with
Impact
11th St between Stone St & Boyle St. SFR 200 72 62 NI 0
11th St and Boyle St. SFR 150 72 68 NI 0
La Brea Terrace SFR 170 72 65 NI 0
Alicante Terrace SFR 85 72 79 I 6
Carrara Terrace SFR 90 72 78 I 4
Messina Terrace SFR --- 72 ---- NI 0
La Bonita Terrace SFR --- 72 --- NI 0
Notes:
xo : crossover switch
GBV: Groundborne Vibration
SFR: Single-family residence building
NI : No Impact as defined by FTA
I : Impact as defined by FTA Source: WIA 2010
Table 12 – Projected vibration levels from BART trains operations on the HMC for Phase 2
Location
Land
Use
Dist. to
closest XO
(ft)
FTA
Criterion
GBV
from
XO Impact
# of
Rec.
with
Impact
11th St between Stone St & Boyle St. SFR --- 72 --- NI 0
11th St and Boyle St. SFR --- 72 --- NI 0
La Brea Terrace SFR 100 72 76 I 9
Alicante Terrace SFR 220 72 59 NI 0
Carrara Terrace SFR 80 72 80 I 7
Messina Terrace SFR 120 70 70 NI 0
La Bonita Terrace SFR 60 72 84 I 8
Notes:
xo : crossover switch
GBV: Groundborne Vibration
SFR: Single-family residence building
NI : No Impact as defined by FTA
I : Impact as defined by FTA
Source: WIA 2010

WILSON, IHRIG & ASSOCIATES, INC. 36 BART Hayward Yard
Noise and Vibration Impact Assessment
Noise and Vibration Technical Report Revised May 03, 2011
Table 13 – Recommended location of vibration mitigation for the HMC Project
Crossover # Phase 1 Phase 2
P100B
P100
No
No
Yes1
No
P101 No Yes 1
P102 Yes1 No
P103 No No
P104 No No
Notes:
(1) Mitigation extent will be determined during final design.
Source: WIA 2010
Figure 10 – Schematic of the vibration mitigation extent for Tire-Derived Aggregate (TDA) on
crossover track

WILSON, IHRIG & ASSOCIATES, INC. 37 BART Hayward Yard
Noise and Vibration Impact Assessment
Noise and Vibration Technical Report Revised May 03, 2011
Figure 11 - Schematic of the vibration mitigation extent for Tire-Derived Aggregate (TDA) on
crossover P102

WILSON, IHRIG & ASSOCIATES, INC. 38 BART Hayward Yard
Construction Noise and Vibration Impact Assessment
Noise and Vibration Technical Report Revised May 03, 2011
Construction Noise and Vibration Impact Assessment
Construction of the BART HMC Project is proposed in two phases. Phase 1 construction includes
all improvements related to the west side of the Hayward Yard. This would include demolition of
one warehouse, replaced by a new Overhaul Shop, and construction of new tracks to connect the
west side improvements to the BART mainline. Phase 1 would include some basic civil construction,
such as grading, installing utilities, track work, and rail turnouts required for the storage tracks at
both the west side of the Yard and south of Whipple Road. Of the switches south of Whipple Road,
switches P100 and P102 would be installed in Phase 1. Phase 2 construction would include all
improvements related to the east side of the Yard and the new east side storage tracks. This would
include construction of the storage tracks, connecting tracks between the new storage tracks and the
BART mainline tracks, third rail power, train control and one or both flyovers. Switches P100B,
P101, P103 and P104 would be installed during Phase 2. Further, construction activities which
involve the mainline tracks would be conducted during nighttime hours (10 pm to 7 am) to minimize
interference with revenue train operations, while other construction activities, including preparation
for construction involving mainline tracks, would generally be conducted within the daytime hours
(7 am to 10 pm).
The primary variables and assumptions that were used for the noise and vibration construction
models include:
Phase 1 construction includes all work related to the west side of the Hayward Yard, including
the new Overhaul Shop and associated crossovers and trackwork, a non-rail vehicle storage area,
and vehicle inspection facilities on the east side.
Phase 2 construction would implement work related to the east side of the Hayward Yard,
including at least one flyover, new storage tracks, associated crossovers and trackwork and third
rail power, communications, and train control systems.
Construction work on the test track and storage areas would be performed during daytime hours.
Construction work involving mainline tracks would be done during nighttime hours and
weekends, with the exception that no nighttime construction will be conducted north of Whipple
Road. New switch installation on the mainline would typically be done during nights and
weekends (Phase 1 and Phase 2). However, flyover construction (pile driving) and preparation
for construction involving the mainline would be done during daytime.
A sound wall to reduce operational noise from some of the new crossovers (P100, P102, P100B
and P101) would be installed prior to start any construction work. Therefore it was assumed as
part of the “existing” condition for the construction noise analysis.
There would be two staging areas, one located at the northeast end of the Hayward Yard and another
at the southeast end of the Yard (currently used as a secured storage area).
Construction areas north of Whipple Road would be accessed through the current Hayward Yard
entrance on Whipple Road and through the driveway from Whipple Road to the four warehouse
on the west side. Additionally, there would be three construction access points considered for
construction activities south of Whipple Road: through the industrial property west of the BART
mainline (south of Whipple Road), by the service road along the north side of Dry Creek, and
from F Street.
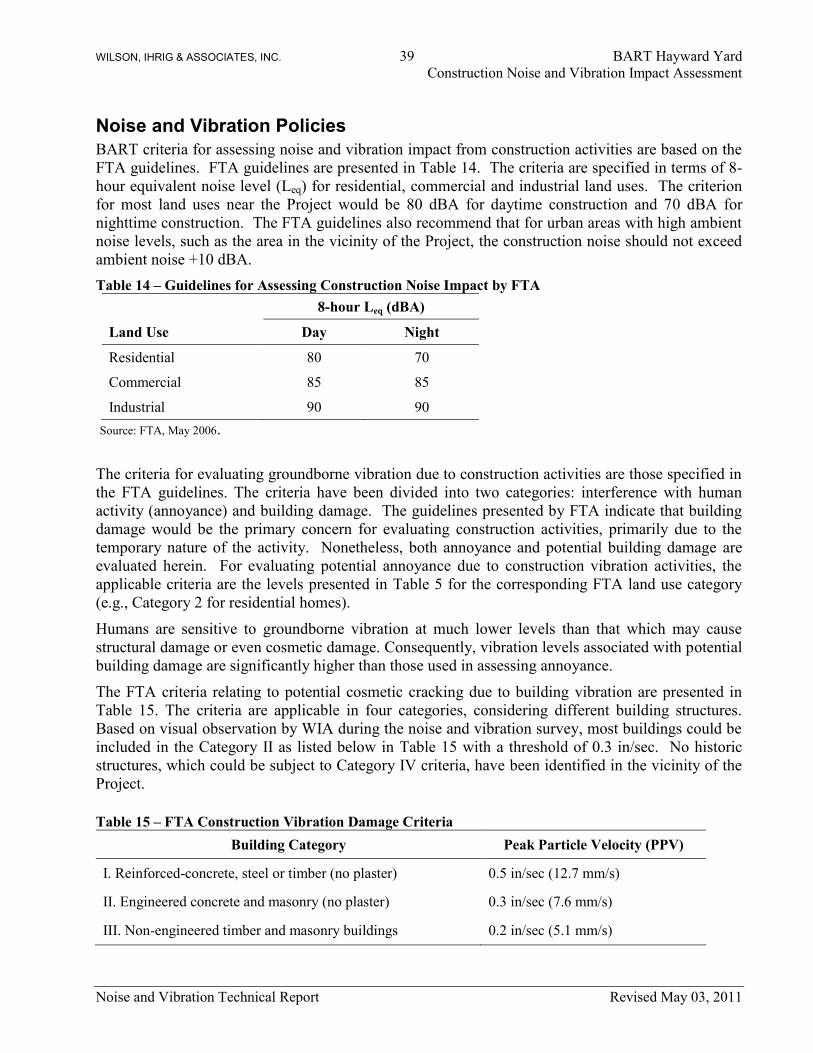
WILSON, IHRIG & ASSOCIATES, INC. 39 BART Hayward Yard
Construction Noise and Vibration Impact Assessment
Noise and Vibration Technical Report Revised May 03, 2011
Noise and Vibration Policies
BART criteria for assessing noise and vibration impact from construction activities are based on the
FTA guidelines. FTA guidelines are presented in Table 14. The criteria are specified in terms of 8-
hour equivalent noise level (Leq) for residential, commercial and industrial land uses. The criterion
for most land uses near the Project would be 80 dBA for daytime construction and 70 dBA for
nighttime construction. The FTA guidelines also recommend that for urban areas with high ambient
noise levels, such as the area in the vicinity of the Project, the construction noise should not exceed
ambient noise +10 dBA.
Table 14 – Guidelines for Assessing Construction Noise Impact by FTA
8-hour Leq (dBA)
Land Use Day Night
Residential 80 70
Commercial 85 85
Industrial 90 90
Source: FTA, May 2006.
The criteria for evaluating groundborne vibration due to construction activities are those specified in
the FTA guidelines. The criteria have been divided into two categories: interference with human
activity (annoyance) and building damage. The guidelines presented by FTA indicate that building
damage would be the primary concern for evaluating construction activities, primarily due to the
temporary nature of the activity. Nonetheless, both annoyance and potential building damage are
evaluated herein. For evaluating potential annoyance due to construction vibration activities, the
applicable criteria are the levels presented in Table 5 for the corresponding FTA land use category
(e.g., Category 2 for residential homes).
Humans are sensitive to groundborne vibration at much lower levels than that which may cause
structural damage or even cosmetic damage. Consequently, vibration levels associated with potential
building damage are significantly higher than those used in assessing annoyance.
The FTA criteria relating to potential cosmetic cracking due to building vibration are presented in
Table 15. The criteria are applicable in four categories, considering different building structures.
Based on visual observation by WIA during the noise and vibration survey, most buildings could be
included in the Category II as listed below in Table 15 with a threshold of 0.3 in/sec. No historic
structures, which could be subject to Category IV criteria, have been identified in the vicinity of the
Project.
Table 15 – FTA Construction Vibration Damage Criteria
Building Category Peak Particle Velocity (PPV)
I. Reinforced-concrete, steel or timber (no plaster) 0.5 in/sec (12.7 mm/s)
II. Engineered concrete and masonry (no plaster) 0.3 in/sec (7.6 mm/s)
III. Non-engineered timber and masonry buildings 0.2 in/sec (5.1 mm/s)

WILSON, IHRIG & ASSOCIATES, INC. 40 BART Hayward Yard
Construction Noise and Vibration Impact Assessment
Noise and Vibration Technical Report Revised May 03, 2011
IV. Buildings extremely susceptible to vibration damage 0.12 in/sec (3 mm/s)
Source FTA, 2006
Noise and Vibration Methodologies
Construction noise varies depending on the construction process, type of equipment involved,
location of the construction site with respect to sensitive receptors, the schedule proposed to carry
out each task (e.g., hours and days of the week) and the duration of the construction work. The
assessment of potential significant noise effects due to construction of the BART HMC Project is
based on the standards and procedures described in the FTA Guidance Manual and the Federal
Highway Administration (FHWA) RCNM model8. This analysis of construction noise assumes that
noise will decrease at a rate of 6 dB per doubling of the distance from the construction site.
There would be a number of noise sources associated with the proposed Project. Some of the
equipment involved during construction of Phase 1 and Phase 2 of the project would include the use
backhoes, pile drivers, mounted jack hammer (hoe ram), excavators, dozers, compactors, and
vibratory rollers. Construction activities associated with track installation would include the use of
cranes, rail saws, compressors, pumps, generators, a ballast regulator, and ballast tamper. Phase 2
would require the use of a pile driver for construction of the flyover(s).
Maximum noise levels and use factors presented in Table 16 were applied to estimate the potential
negative effects due to construction activities. The table also shows the project phase where the
equipment was assumed to be used.
Table 16 – Construction Equipment Noise Levels and Use Factor
Equipment
Acoustical Use
Factor for
Noise
(percentage)
Typical Maximum
Noise Level (Lmax)
at 50 feet from
Source, dBA Phase involved
Backhoe 40 78 1 & 2
Pile driver (sonic) 20 96 2
Compactor 20 83 1 & 2
Excavator 40 81 1 & 2
Dozer 40 82 1 & 2
Mounted Jack Hammer (hoe ram) 20 88 1
Pneumatic Tool 50 85 1 & 2
Concrete Pump Truck 20 81 1 & 2
Ballast Equalizer, Tamper 20 82 – 83 1 & 2
Rail saw 20 90 1 & 2
8 Federal Highway Administration – FHWA Roadway Construction Noise Model. Final Report January 2006.

WILSON, IHRIG & ASSOCIATES, INC. 41 BART Hayward Yard
Construction Noise and Vibration Impact Assessment
Noise and Vibration Technical Report Revised May 03, 2011
Vibratory Concrete Mixer 20 80 1 & 2
Crane 16 81 1 & 2
Sources: FHWA RCNM, January 2006 and FTA, May 2006, WIA 2010.
The analysis herein includes the noise effects from staging areas. Noise from construction staging
areas is likely to be generated by trucks, cranes and other mobile and stationary equipment. There
would be two staging areas, one located at the southeast end of the Hayward Yard, another at the
southwest of the Yard located at the undeveloped outdoor area near the new M&E shop.
The projected levels of noise generated by construction activities and construction staging areas
were compared against the criteria presented in Table 14. Noise control measures were investigated
and proposed for those areas where noise from construction activities is expected to exceed the
recommended criteria.
The assessment of potentially significant impact due to construction-induced vibration for the
Project is based on the standard procedures described in the FTA Guidance Manual. Construction
vibration varies according to the construction procedure, type of equipment involved and location of
the construction site with respect to sensitive receptors. Buildings in the vicinity of the construction
activities respond to vibration differently depending primarily on their structural characteristics.
As for the noise analysis, the assessment for vibration impacts separately evaluates the use of heavy
equipment during construction and the specialized equipment expected during track installation.
Table 17 shows the equipment assumed for this analysis. Vibration reference levels are presented in
terms of the peak-particle velocity (PPV) and their approximate vibration level (i.e., in VdB), at a
reference distance of 25 feet. The table only shows the equipment expected to have the greatest
impact.
Vibration levels associated with each piece of equipment presented in Figure 12 were projected as a
function of distance following the equation n
refequip DPPVPPV )/25( in inch/sec, where D is the
distance from the equipment (in feet) and n is a value related to the vibration attenuation rate through
the ground. A value of n equal to 1.5 was used in the analysis.
Table 17 – Construction equipment vibration levels
Equipment
PPV at 25 feet
(in/sec)
Approximate
Vibration
Velocity Level at
25 feet, VdB
Pile Driver (sonic) 0.730 105
Vibratory Roller 0.200 94
Hoe Ram 0.089 87
Large Bulldozer 0.090 87
Caisson Drilling 0.089 87
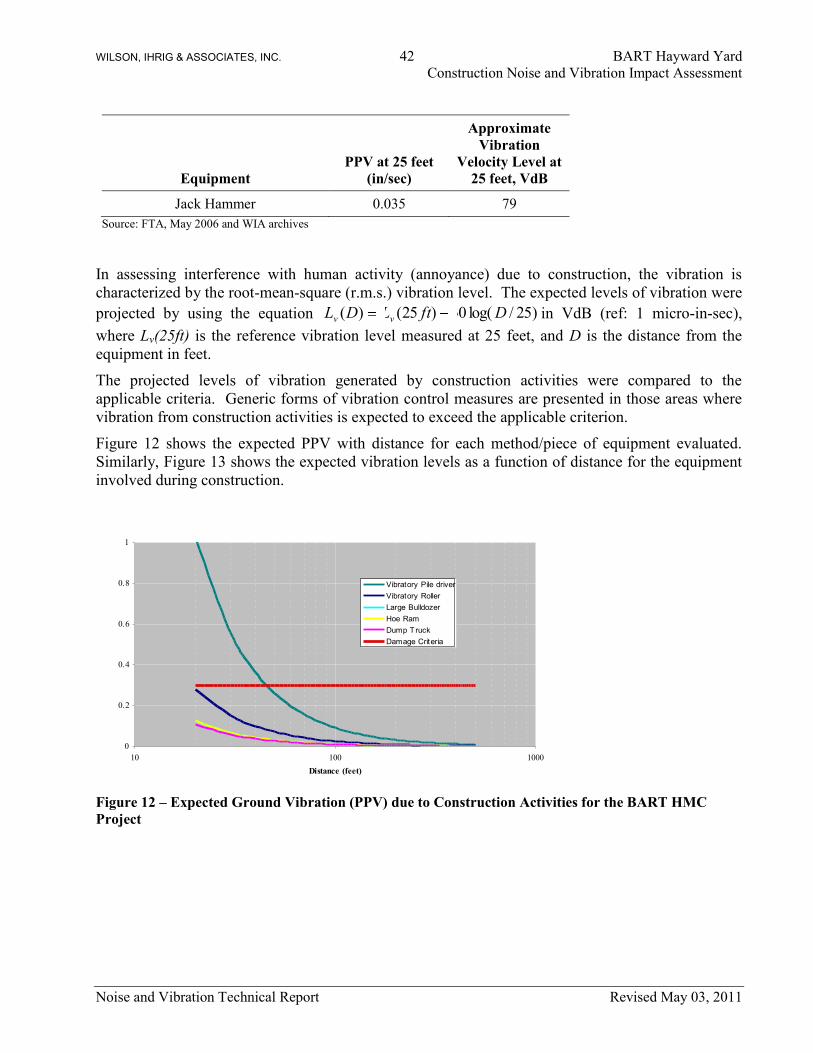
WILSON, IHRIG & ASSOCIATES, INC. 42 BART Hayward Yard
Construction Noise and Vibration Impact Assessment
Noise and Vibration Technical Report Revised May 03, 2011
Equipment
PPV at 25 feet
(in/sec)
Approximate
Vibration
Velocity Level at
25 feet, VdB
Jack Hammer 0.035 79
Source: FTA, May 2006 and WIA archives
In assessing interference with human activity (annoyance) due to construction, the vibration is
characterized by the root-mean-square (r.m.s.) vibration level. The expected levels of vibration were
projected by using the equation )25/log(30)25()( DftLDL vv in VdB (ref: 1 micro-in-sec),
where Lv(25ft) is the reference vibration level measured at 25 feet, and D is the distance from the
equipment in feet.
The projected levels of vibration generated by construction activities were compared to the
applicable criteria. Generic forms of vibration control measures are presented in those areas where
vibration from construction activities is expected to exceed the applicable criterion.
Figure 12 shows the expected PPV with distance for each method/piece of equipment evaluated.
Similarly, Figure 13 shows the expected vibration levels as a function of distance for the equipment
involved during construction.
Figure 12 – Expected Ground Vibration (PPV) due to Construction Activities for the BART HMC
Project
0
0.2
0.4
0.6
0.8
1
10 100 1000
Distance (feet)
PP
V (
in/s
ec)
Vibratory Pile driver
Vibratory Roller
Large Bulldozer
Hoe Ram
Dump Truck
Damage Criteria

WILSON, IHRIG & ASSOCIATES, INC. 43 BART Hayward Yard
Construction Noise and Vibration Impact Assessment
Noise and Vibration Technical Report Revised May 03, 2011
Figure 13 – Expected Vibration Levels (VdB) versus Distance due to Construction Activities for the
BART HMC Project Vibration Impact Assessment
Projected Construction Noise and Vibration
Noise
Based on this preliminary analysis, noise levels during Project construction with the use of heavy
equipment would typically range between 61 to 85 dBA, depending on the distance of the
construction activity to the noise sensitive receptor.
Table 18 and Table 19 show the projected range of noise levels expected from the use of heavy
equipment during construction and track installation for Phase 1 and Phase 2, respectively. The
tables present the range of noise levels expected for each group of receptors. The expected effect of
existing sound barriers at the Innovation Homes complex has been included for the noise
calculations.
Heavy Equipment
Results of the analysis show that residential receptors located within 75 feet of heavy equipment
would be exposed to a Noise Impact during daytime construction, assuming an unobstructed line of
sight. This distance would be extended to 190 feet (unobstructed) if construction activities are
executed during nighttime.
During Phase 1 construction, the typical noise levels from heavy equipment would range from 53 to
69 dBA at nearby sensitive receptors. As presented in Table 18, with the existing sound walls and
the Project sound walls at Innovation Homes, No Noise Impact is expected. Similarly, residences
located along 11th
Street would receive No Noise Impact during construction of Phase 1.
During Phase 2, Noise Impacts are expected at 15 homes located at the Innovation Homes
development during nighttime construction. Therefore, noise mitigation measures are recommended
20
40
60
80
100
120
140
10 100 1000
Distance (feet)
Vib
rati
on
Lev
el (
Vd
B,
re 1
mic
ro-i
n/s
ec) Vibratory Pile driver
Vibratory Roller
Large Bulldozer
Hoe Ram
Dump Truck
Cat. 2 Criterion

WILSON, IHRIG & ASSOCIATES, INC. 44 BART Hayward Yard
Construction Noise and Vibration Impact Assessment
Noise and Vibration Technical Report Revised May 03, 2011
to reduce the level of impact to No Impact. Mitigation measures are presented later in this report. No
daytime construction noise impacts are expected at the Innovation homes. Residences located along
Ithaca Street and Carroll Avenue would have No Noise Impact from heavy equipment.
Track Installation
The use of ballast tamping and ballast regulators would generate a Noise Impact for residences
within 100 feet of daytime construction activities or within 300 feet of nighttime track-laying
activities, including crossover switch installation.
During Phase 1, there would be No Noise Impacts from construction activities related to track
installation. Therefore no noise mitigation is necessary.
For Phase 2, track installation activities would cause a nighttime Noise Impact at 15 homes located
at the Innovation Homes development even with the existing and the Project sound walls. Noise
control measures would be required to reduce the level to No Impact. Mitigation measures including
compliance with the nighttime construction noise criterion, temporary noise barriers, and/or
temporary relocation of residences to hotels should be implemented for these receptors located on
Messina Terrace and La Bonita Terrace. A detailed discussion on these mitigation measures is
presented later in this report.
During Phase 2 no nighttime construction will be conducted north of Whipple Road. Consequently
no noise impacts are expected for homes located on Ithaca Street or Carroll Avenue.
Flyover Construction
One or both flyovers would be constructed during Phase 2 of the project, and the estimated noise
from pile driving for the aerial structure is also shown in Table 19. We have assumed for the
analysis herein, that the construction would use sonic or vibratory pile drivers, which in general
produce lower noise levels than an impact pile driver. However, while vibratory pile drivers do not
produce peak noise levels as high as impact pile drivers, they can generate high levels of noise if not
shielded properly.
Pile driving is expected to exceed the FTA noise criteria for residential receptors only within 140
feet of operation. If pile driving is schedule at night, after 10 pm or earlier than 7 am, the area of
Noise Impact could be extended up to 420 feet from the alignment right-of-way. Since no nighttime
work would be conducted north of Whipple Road for Phase 2, pile driving would occur only during
the daytime resulting in No Noise Impact.
Staging Areas
Two construction staging areas are proposed, one on the southwestern portion of the expansion area
and one on the existing M&E storage area at the southeast corner of the existing yard. Noise
projected from the staging areas would potentially cause a Noise Impact for sensitive receptors (e.g.,
single family homes) within 70 feet from the staging area during daytime activity and within 200
feet during nighttime activity. The closest homes to the southwestern staging area would be located
at least 250 feet from the staging area, resulting in No Noise Impact during both daytime and
nighttime operations. Similarly, there would be No Noise Impact from operations on the southeast
staging area during daytime hours. However, some of the residential homes along Ithaca Street
(specifically on Margo Court, Edna Court, Wendy Court, Fay Court and Kathy Court) are located
approximately 150 feet from the southeast staging area. To ensure that those homes do not

WILSON, IHRIG & ASSOCIATES, INC. 45 BART Hayward Yard
Construction Noise and Vibration Impact Assessment
Noise and Vibration Technical Report Revised May 03, 2011
experience significant nighttime noise impacts, a buffer zone of approximately 50 feet will be
maintained where no noise-generating activity will be permitted during nighttime construction. The
buffer zone will extend along the property line within the BART property and will be sufficiently
wide to ensure that a minimum of 200 feet is maintained between the staging area and the nearby
homes. With implementation of the buffer zone, there would be No Noise Impact on these homes.
Other Considerations
Trucks would be required to transport equipment, and supplies. The California Vehicle Code limits
vehicle noise emission levels of new highway trucks built after 1987 to 80 dBA at a distance of 50
feet from the centerline of travel under any condition of operation, including acceleration and
deceleration, in any gear. Older, noisier trucks may still be in use, but a reasonable approach to
construction equipment noise control would be to specify that the contractor’s trucks meet current
regulations for new trucks.
For construction activities occurring north of Whipple Road, trucks would be accessing the Project
area at the current access to the Hayward Yard on Whipple Road, which is approximately 150 feet
from residences along Ithaca Street. Noise levels at residences could potentially reach up to 63 dBA
resulting in No Noise Impact. For the purpose of calculations we have assumed about 20 trucks per
hour (1 minute each).
Three construction access points are under consideration for activities occurring south of Whipple
Road or for equipment that would be too large to go under the Whipple Road Bridge. The truck
traffic considered from any of the three access points would be very low, on the order of 5 to 6
trucks per day. Noise levels at residences located north of the Dry Creek would experience the
highest noise levels from truck traffic for the three access points in consideration. However, hourly
noise levels would be on the order of 57 dBA or lower resulting in No Noise Impact. If the access
option from F Street is selected, a temporary access road may need to be constructed along the west
side of the BART mainline. The distance to the nearest sensitive receptors would be 50 feet or
farther from truck operation, resulting in a noise level below 50 dBA and therefore No Noise Impact.
As a practical matter, new diesel trucks produce markedly lower noise levels during normal
operation than those allowed by the Vehicle Code. Trucks would also idle as they are loaded and
unloaded. We have assumed that trucks would idle for no more than 5 minutes (a more restrictive
time limit may be imposed for air quality); trucks that sit in place for longer than 5 minutes should
turn off their engines.
Audible backup alarms on moving equipment may generate neighborhood complaints because the
sound of the alarm is tonal, since it is meant to be heard and to attract attention. Backup alarms for
haul trucks must be audible above the surrounding ambient noise level at a distance of up to 200
feet9. In areas of high ambient noise or congested traffic, a motion-detected braking system or
administrative controls such as flaggers/observers may be used in lieu of an audible alarm10
. The
characteristics of the alarm tone means that backup alarms are often designed to be higher than the
ambient, typically by at least 5 dBA. Many alarms are preconfigured to be higher than a worst-case
construction/industrial operating environment by 10 to 15 dBA. Thus, since the construction noise
environment at 50 feet behind any piece of moving machinery may be as high as 70 to 90 dBA,
9 California Occupational Safety and Health Administration, Title 8, Section 1592(a)
10 Cal-OSHA, Title 8, Section 1592(b)

WILSON, IHRIG & ASSOCIATES, INC. 46 BART Hayward Yard
Construction Noise and Vibration Impact Assessment
Noise and Vibration Technical Report Revised May 03, 2011
backup alarms are typically designed to emit a sound as loud as 85 to 115 dBA. Some alarm devices
measure the ambient noise level and adjust their output accordingly. One example is a “smart alarm”
which adjusts the alarm level so that it is 5 dBA above the ambient, with a range of 77 to 97 dBA.
An alarm level of 97 dBA would correspond to a noise level of 63 dBA at a distance of 200 ft11
. If
truck operations are proposed during the nighttime hours, alternative measures such as strobe lights
or administrative controls (i.e. Flag person) can be used to replace audible backup alarms. The
contractor should be precluded from using audible backup alarms at night, if at all feasible.
Vibration Construction Assessment
Two types of potential construction-induced vibration effects were evaluated for the BART HMC
Project: Annoyance and Building Damage. The criterion used in assessing annoyance is contained in
the FTA guidance manual and presented in the operational analysis section. The criteria relating to
potential cosmetic damage (i.e., cracking) due to building vibration is 0.3 in/sec PPV based on the
FTA guidelines.
Annoyance from construction activities would likely occur at 55 sensitive receptors in the vicinity of
the Project (34 of which occur for both Phase 1 and Phase 2 of the Project), that are located within
100 feet of any heavy equipment. Specifically, vibration annoyance would be expected during
installation of crossover P100 and P102 at residences located on La Brea Terrace, Alicante Terrace,
and Carrara Terrace (26 homes, Phase 1), and installation of crossover P100B, P101, P103 and P104
at residences located on La Brea, Carrara Terrace, Messina Terrace, and La Bonita Terrace (29
homes, Phase 2).
The use of heavy equipment during construction of the Project would generate peak velocity levels
that would be well below the threshold of cosmetic damage. Consequently, construction of the
Project would result in No Vibration Impact from equipment or activities that would potentially
cause building damage. Refer to Table 20 and Table 21.
Flyover Construction
Vibration velocity levels during pile driving (vibratory pile driver) would be 0.02 in/sec PPV or
lower at all residences in the vicinity of the project. The use of a pile driver during construction of
the north and south elevated structures (flyovers) could potentially generate annoyance to receptors
located within 220 feet of the activity. A similar vibration magnitude is also expected from heavy,
dropped objects or handling of heavy plates in the work areas, although these would be very
infrequent. Potential for building damage would be expected from pile driving activities located 50
feet or closer to any building. It is expected that the closest distance between pile driving and homes
would be 300 feet. Table 21 shows the expected vibration levels from construction activities using
heavy equipment for Phase 2. The highest PPV is expected during vibratory compaction at a level
that would be 0.04 in/sec PPV which is well below the 0.3 in/sec criterion. Consequently, there
would be no potential for building damage from construction of the flyover option, resulting in No
Vibration Impact.
11
SAE J994-2003 Standard specifies that alarm noise levels are measured at a distance of 1.2 m (4 ft).

WILSON, IHRIG & ASSOCIATES, INC. 47 BART Hayward Yard
Construction Noise and Vibration Impact Assessment
Noise and Vibration Technical Report Revised May 03, 2011
Construction Noise and Vibration Control Measures
This section discusses recommended noise and vibration control measures to reduce impacts due to
the Project. Control measure recommendations are presented separately for each source and/or
phase of the project.
As presented in the previous section, due to the duration of construction activities for the Project, a
Vibration Impact would be expected only where construction activities exceed the threshold for
building damage. However, some vibration control policies are recommended to be implemented by
the contractor to minimize the potential annoyance on nearby residential properties.
Noise
To eliminate construction noise impacts, construction activities should be performed in accordance
with the criteria presented in Table 14 of this report. However, as discussed in this analysis, it may
not be possible to comply with the criteria with the use of typical construction equipment. A new
noise barrier to control noise from train operations, as discussed above, would help to reduce the
construction noise and avoid impacts for homes on 11th
Street and some homes in the Innovation
Homes complex, but additional control measures would be required for the Phase 2 nighttime track
installation impacts at the Innovation Homes complex; for these homes, the nighttime noise could
exceed the criterion, but the measures listed below would mitigate the effects of the noise. The
following noise control measures are recommended for incorporation into the construction phase of
Project:
Where feasible, require the Contractor to comply with a Performance Standard of 80 dBA 8-
hour Leq during the daytime and 70 dBA 8-hour Leq during the nighttime at the property line
of the sensitive receptor.
Prior to construction, require the Contactor to prepare a Noise Control and Monitoring
Report, in which the contractor indicates what noise levels they expect to generate, noise
control measures they intend to implement, and how they intend to monitor and document
construction noise and complaints.
Locate noisy equipment as far as possible from noise sensitive receptors. In addition, the use
of temporary barriers should be employed around the equipment.
Use temporary noise barriers along the working area and or project right-of-way.
Barriers/curtains must achieve a Sound Transmission Class (STC) of 30 or greater in
accordance with ASTM Test Method E90 and be constructed from material having a surface
density of at least 4 lb/sq. ft. to ensure adequate transmission loss.
When nighttime or 24-hour construction will be required, BART and the contractor shall
coordinate with residents to ensure that the affected residents are fully informed about the
upcoming construction. Residents will be given the option of sleeping in hotel rooms at
BART expense for the duration of the nighttime construction in areas where construction is
expected to exceed the FTA criterion. Residents that work nights and sleep days in locations
where construction noise is expected to exceed the FTA criterion will be given the same
option.

WILSON, IHRIG & ASSOCIATES, INC. 48 BART Hayward Yard
Construction Noise and Vibration Impact Assessment
Noise and Vibration Technical Report Revised May 03, 2011
Require ambient sensitive (“smart”) backup alarms, SAE Class D, or limit to SAE Class C
(97 dB) for vehicles over 2.5 cubic yard haulage capacity, or Cal-OSHA/DOSHA-approved
methods that avoid backup noise for vehicles under 2.5 cubic yard haulage capacity.
Fit silencers to combustion engines. Ensure that equipment has effective, quality mufflers
installed, in good working condition.
Switch off engines or reduce to idle when not in use.
Lubricate and maintain equipment regularly. Well-maintained equipment is normally quieter
than a non-maintained one.
Construction-related truck traffic should be re-routed along roadways that would produce the
least disturbance to sensitive receptors.
Vibration
No permanent vibration impacts have been indicated, but the construction could cause temporary
annoyance during construction activities when heavy equipment is used. To avoid vibration-induced
annoyance due to construction activities, the vibration associated with these activities should be kept
below the annoyance criteria. The contractor should be encouraged to select equipment and methods
that would reduce potential for building damage and also annoyance to nearby residents. Some
recommended vibration controls include:
Require the Contractor to comply with a Performance Standard of 0.3 in/sec PPV any
building at any time.
Encourage the Contractor to minimize vibration annoyance by maintaining vibration levels at
80 VdB or less at any building at any time.
Prior to construction, require the Contactor to prepare a Vibration Control and Monitoring
Report, in which the contractor indicates what vibration levels they expect to generate,
vibration control measures they intend to implement, and how they intend to monitor and
document construction vibration and complaints.
Avoid the use of impact pile drivers. Instead favor the use of sonic or vibratory impact driver.
It is also encouraged to use “quiet” or “silent” piling technologies, if it is possible to
implement.
When nighttime or 24-hour construction will be required BART and the contractor shall
coordinate with residents to ensure that the affected residents are fully informed about the
upcoming construction. Residents will be given the option of sleeping in hotel rooms at
BART expense for the duration of the nighttime construction in areas where construction is
expected to exceed the FTA criterion. Residents that work nights and sleep days in locations
where construction vibration is expected to exceed the FTA criterion will be given the same
option.
Monitor vibration during construction to ensure compliance with the criterion for building
damage for buildings within 40 feet from construction activities. Conduct a pre-construction
crack survey at these structures.
Plan routes for hauling material out of the Project site that would cause the least annoyance.

WILSON, IHRIG & ASSOCIATES, INC. 49 BART Hayward Yard
Construction Noise and Vibration Impact Assessment
Noise and Vibration Technical Report Revised May 03, 2011
High amplitude vibration methods such as vibratory pile driving and soil compaction using
large truck-mounted compactors should be restricted to areas beyond 50 feet and 20 feet
respectively of residential structures or wood-framed buildings. Otherwise, temporary
accommodations away from construction should be coordinated between BART and the
residents.

WILSON, IHRIG & ASSOCIATES, INC. 50 BART Hayward Yard
Construction Noise and Vibration Impact Assessment
Noise and Vibration Technical Report Revised May 03, 2011
Table 18 – Projected Noise Levels and Impacts from Using Heavy Equipment during Phase 1 Construction (West Side and New Shop)
Location
Dist. to
Const. (ft) Criteria
Expected Noise Levels from Heavy Equipment Construction and
Track Installation With Noise Control, Leq (dBA)1
Heavy Equipment Track Installation
Nea
rest
Fa
rth
est
Da
y
Nig
ht
Nea
rest
Fa
rth
est
Impact
Type
# I
mp
act
s
Nea
rest
Fa
rth
est
Impact
Type
# I
mp
act
s
Da
y
Nig
ht
Da
y
Nig
ht
11th between D & Stone St 500 500 80 70 62 62 NI NI 0 66 66 NI NI 0
11th between Stone St & Boyle St 400 400 80 70 64 64 NI NI 0 68 68 NI NI 0
11th between and Boyle St 150 300 80 70 64 58 NI NI 0 62 56 NI NI 0
La Brea Terrace 170 550 80 70 63 53 NI NI 0 61 50 NI NI 0
Alicante Terrace 85 550 80 70 69 53 NI NI 0 67 50 NI NI 0
Carrara Terrace 85 500 80 70 69 54 NI NI 0 67 51 NI NI 0
Messina Terrace 120 250 80 70 67 61 NI NI 0 65 59 NI NI 0
La Bonita Terrace 150 350 80 70 65 58 NI NI 0 63 56 NI NI 0
Ithaca Street between Whipple Rd and Carroll Ave 540 650 80 70 61 59 NI NI 0 66 64 NI NI 0
Carroll Ave between Troy Place and Gressel St. 540 650 80 70 61 59 NI NI 0 66 64 NI NI 0
Carroll Ave between Gressel St. and Becker Place 540 650 80 70 61 59 NI NI 0 66 64 NI NI 0
Carroll Ave between Becker Place and Fairway Street 660 660 80 70 59 59 NI NI 0 64 64 NI NI 0
Carroll Avenue north of Fairway Street 660 660 80 70 59 59 NI NI 0 64 64 NI NI 0
Notes
Day: from 7 am to 10 pm
Night: from 10 pm to 7 am.
I : Impact
NI: No Impact.
1: Includes the effect of existing sound walls and new project sound walls SW-01, SW-02 and SW-03 implemented at the start of construction. See Figure 9 for
location of sound walls. Source: WIA 2010
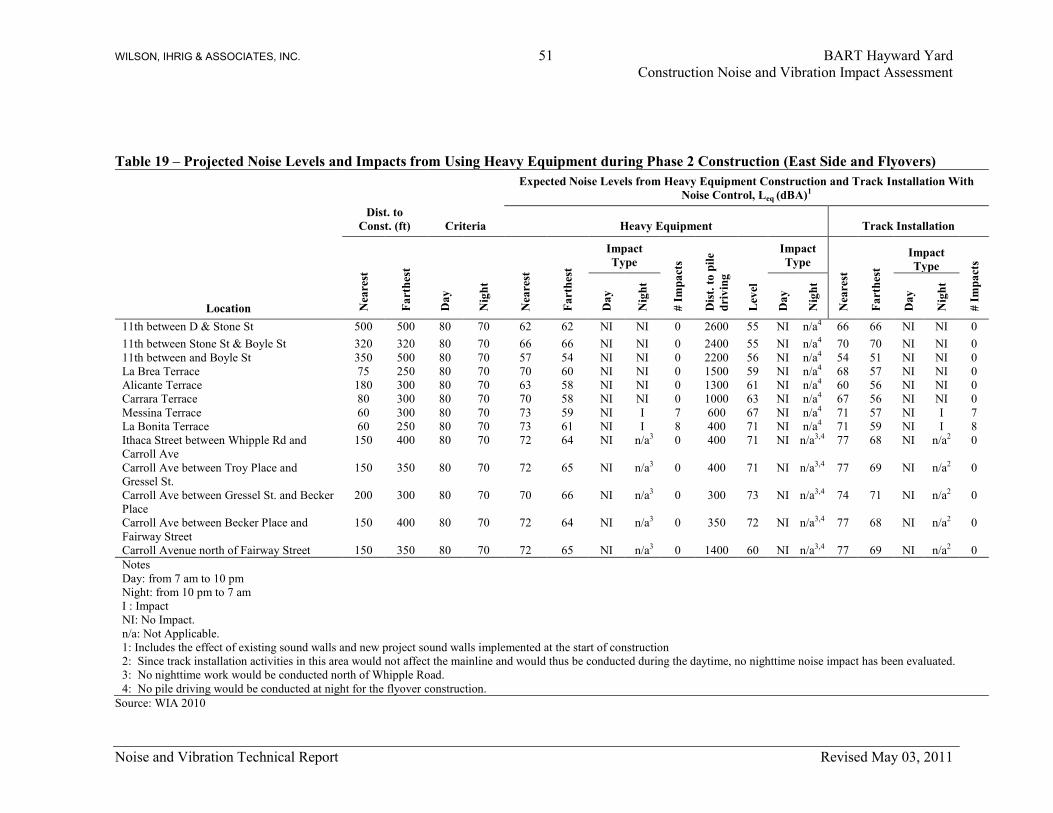
WILSON, IHRIG & ASSOCIATES, INC. 51 BART Hayward Yard
Construction Noise and Vibration Impact Assessment
Noise and Vibration Technical Report Revised May 03, 2011
Table 19 – Projected Noise Levels and Impacts from Using Heavy Equipment during Phase 2 Construction (East Side and Flyovers)
Location
Dist. to
Const. (ft) Criteria
Expected Noise Levels from Heavy Equipment Construction and Track Installation With
Noise Control, Leq (dBA)1
Heavy Equipment Track Installation
Nea
rest
Fa
rth
est
Da
y
Nig
ht
Nea
rest
Fa
rth
est
Impact
Type
# I
mp
act
s
Dis
t. t
o p
ile
dri
vin
g
Lev
el
Impact
Type
Nea
rest
Fa
rth
est
Impact
Type
# I
mp
act
s
Da
y
Nig
ht
Da
y
Nig
ht
Da
y
Nig
ht
11th between D & Stone St 500 500 80 70 62 62 NI NI 0 2600 55 NI n/a4 66 66 NI NI 0
11th between Stone St & Boyle St 320 320 80 70 66 66 NI NI 0 2400 55 NI n/a4 70 70 NI NI 0
11th between and Boyle St 350 500 80 70 57 54 NI NI 0 2200 56 NI n/a4 54 51 NI NI 0
La Brea Terrace 75 250 80 70 70 60 NI NI 0 1500 59 NI n/a4 68 57 NI NI 0
Alicante Terrace 180 300 80 70 63 58 NI NI 0 1300 61 NI n/a4 60 56 NI NI 0
Carrara Terrace 80 300 80 70 70 58 NI NI 0 1000 63 NI n/a4 67 56 NI NI 0
Messina Terrace 60 300 80 70 73 59 NI I 7 600 67 NI n/a4 71 57 NI I 7
La Bonita Terrace 60 250 80 70 73 61 NI I 8 400 71 NI n/a4 71 59 NI I 8
Ithaca Street between Whipple Rd and
Carroll Ave
150 400 80 70 72 64 NI n/a3 0 400 71 NI n/a3,4 77 68 NI n/a2 0
Carroll Ave between Troy Place and
Gressel St.
150 350 80 70 72 65 NI n/a3 0 400 71 NI n/a3,4 77 69 NI n/a2 0
Carroll Ave between Gressel St. and Becker
Place
200 300 80 70 70 66 NI n/a3 0 300 73 NI n/a3,4 74 71 NI n/a2 0
Carroll Ave between Becker Place and
Fairway Street
150 400 80 70 72 64 NI n/a3 0 350 72 NI n/a3,4 77 68 NI n/a2 0
Carroll Avenue north of Fairway Street 150 350 80 70 72 65 NI n/a3 0 1400 60 NI n/a3,4 77 69 NI n/a2 0
Notes
Day: from 7 am to 10 pm
Night: from 10 pm to 7 am
I : Impact
NI: No Impact.
n/a: Not Applicable.
1: Includes the effect of existing sound walls and new project sound walls implemented at the start of construction
2: Since track installation activities in this area would not affect the mainline and would thus be conducted during the daytime, no nighttime noise impact has been evaluated.
3: No nighttime work would be conducted north of Whipple Road.
4: No pile driving would be conducted at night for the flyover construction.
Source: WIA 2010
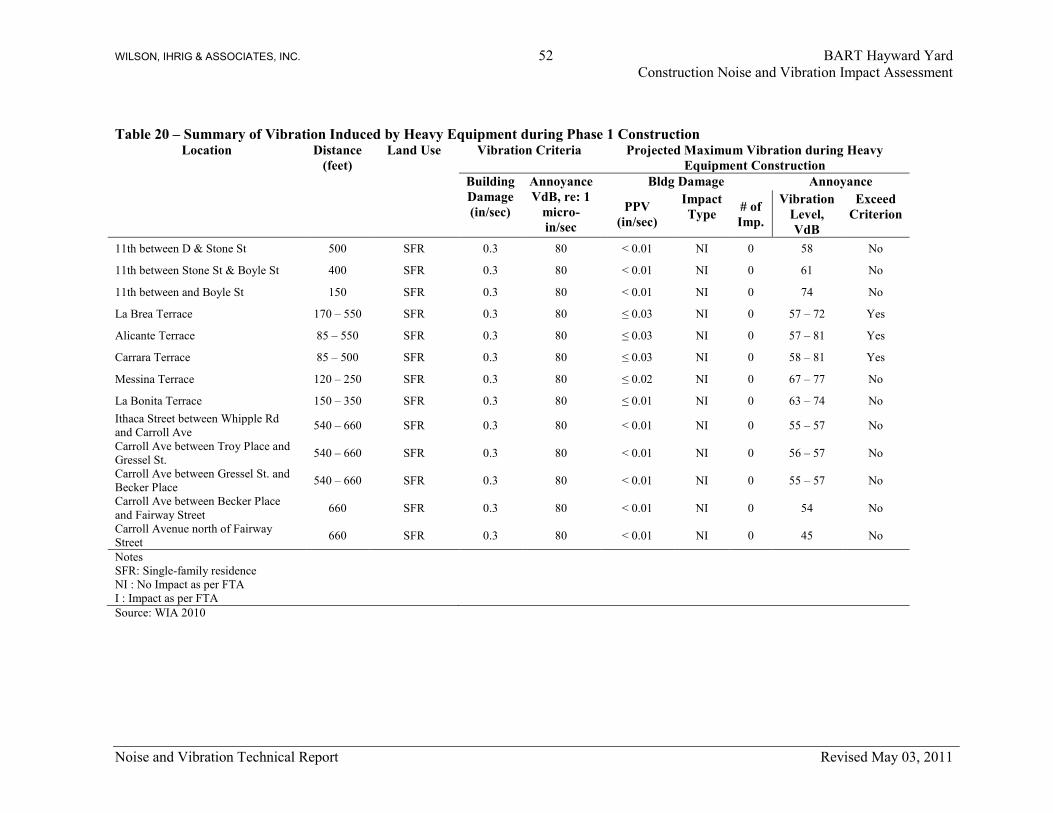
WILSON, IHRIG & ASSOCIATES, INC. 52 BART Hayward Yard
Construction Noise and Vibration Impact Assessment
Noise and Vibration Technical Report Revised May 03, 2011
Table 20 – Summary of Vibration Induced by Heavy Equipment during Phase 1 Construction Location Distance
(feet)
Land Use Vibration Criteria Projected Maximum Vibration during Heavy
Equipment Construction
Building
Damage
(in/sec)
Annoyance
VdB, re: 1
micro-
in/sec
Bldg Damage Annoyance
PPV
(in/sec)
Impact
Type # of
Imp.
Vibration
Level,
VdB
Exceed
Criterion
11th between D & Stone St 500 SFR 0.3 80 < 0.01 NI 0 58 No
11th between Stone St & Boyle St 400 SFR 0.3 80 < 0.01 NI 0 61 No
11th between and Boyle St 150 SFR 0.3 80 < 0.01 NI 0 74 No
La Brea Terrace 170 – 550 SFR 0.3 80 ≤ 0.03 NI 0 57 – 72 Yes
Alicante Terrace 85 – 550 SFR 0.3 80 ≤ 0.03 NI 0 57 – 81 Yes
Carrara Terrace 85 – 500 SFR 0.3 80 ≤ 0.03 NI 0 58 – 81 Yes
Messina Terrace 120 – 250 SFR 0.3 80 ≤ 0.02 NI 0 67 – 77 No
La Bonita Terrace 150 – 350 SFR 0.3 80 ≤ 0.01 NI 0 63 – 74 No
Ithaca Street between Whipple Rd
and Carroll Ave 540 – 660 SFR 0.3 80 < 0.01 NI 0 55 – 57 No
Carroll Ave between Troy Place and
Gressel St. 540 – 660 SFR 0.3 80 < 0.01 NI 0 56 – 57 No
Carroll Ave between Gressel St. and
Becker Place 540 – 660 SFR 0.3 80 < 0.01 NI 0 55 – 57 No
Carroll Ave between Becker Place
and Fairway Street 660 SFR 0.3 80 < 0.01 NI 0 54 No
Carroll Avenue north of Fairway
Street 660 SFR 0.3 80 < 0.01 NI 0 45 No
Notes
SFR: Single-family residence
NI : No Impact as per FTA
I : Impact as per FTA
Source: WIA 2010

WILSON, IHRIG & ASSOCIATES, INC. 53 BART Hayward Yard
Construction Noise and Vibration Impact Assessment
Noise and Vibration Technical Report Revised May 03, 2011
Table 21 – Summary of Vibration Induced by Heavy Equipment during Phase 2 Construction
Location Distance
(feet) Land Use
Vibration Criteria Projected Maximum Vibration during Heavy
Equipment Construction
Building
Damage
(in/sec)
Annoyance
VdB, re: 1
micro-
in/sec
Bldg Damage Annoyance
PPV
(in/sec)
Impact
Type # of
Imp.
Vibration
Level,
VdB
Temporary
Exceedance
11th between D & Stone St 500 SFR 0.3 80 ≤ 0.02 NI 0 58 No
11th between Stone St & Boyle St 320 SFR 0.3 80 ≤ 0.02 NI 0 64 No
11th between and Boyle St 350 – 500 SFR 0.3 80 ≤ 0.02 NI 0 58 – 63 No
La Brea Terrace 75 – 250 SFR 0.3 80 ≤ 0.04 NI 0 65 – 83 Yes
Alicante Terrace 180 – 300 SFR 0.3 80 ≤ 0.01 NI 0 65 – 71 No
Carrara Terrace 80 – 300 SFR 0.3 80 ≤ 0.03 NI 0 65 – 82 Yes
Messina Terrace 60 – 300 SFR 0.3 80 0.01 – 0.05 NI 0 67 – 86 Yes
La Bonita Terrace 60 – 250 SFR 0.3 80 0.01 – 0.05 NI 0 67 – 86 Yes
Ithaca Street between Whipple Rd
and Carroll Ave 150 – 400 SFR 0.3 80 ≤ 0.01 NI 0 61 – 74 No
Carroll Ave between Troy Place and
Gressel St. 150 – 350 SFR 0.3 80 ≤ 0.01 NI 0 63 – 74 No
Carroll Ave between Gressel St. and
Becker Place 200 – 300 SFR 0.3 80 ≤ 0.01 NI 0 65 – 70 No
Carroll Ave between Becker Place
and Fairway Street 150 – 400 SFR 0.3 80 ≤ 0.01 NI 0 61 – 74 No
Carroll Avenue north of Fairway
Street 150 – 350 SFR 0.3 80 ≤ 0.01 NI 0 63 – 74 No
Notes
SFR: Single-family residence
NI : No Impact as per FTA
I : Impact as per FTA
Source: WIA 2010

WILSON, IHRIG & ASSOCIATES, INC. 54 BART Hayward Yard
Long-term Noise Survey Plots
Noise and Vibration Technical Report Revised May 03, 2011
Appendix A Long-term Noise Survey Plots
Figure A- 1 – Summary of the hourly equivalent noise level obtained at location N1 for six consecutive
days.

WILSON, IHRIG & ASSOCIATES, INC. 55 BART Hayward Yard
Long-term Noise Survey Plots
Noise and Vibration Technical Report Revised May 03, 2011
Figure A- 2 – Summary of the hourly equivalent noise level obtained at location N2 for six consecutive
days.

WILSON, IHRIG & ASSOCIATES, INC. 56 BART Hayward Yard
Long-term Noise Survey Plots
Noise and Vibration Technical Report Revised May 03, 2011
Figure A- 3 – Summary of the hourly equivalent noise level obtained at location N3 for six consecutive
days.

WILSON, IHRIG & ASSOCIATES, INC. 57 BART Hayward Yard
Long-term Noise Survey Plots
Noise and Vibration Technical Report Revised May 03, 2011
Figure A- 4 – Summary of the hourly equivalent noise level obtained at location N4 for six consecutive
days.