NOAA Polar Data Processing Timelines - ECMWF | … · NOAA Polar Data Processing Timelines. Gene...
28
1 NOAA Polar Data Processing NOAA Polar Data Processing Timelines Timelines Gene Legg November 12, 2003
Transcript of NOAA Polar Data Processing Timelines - ECMWF | … · NOAA Polar Data Processing Timelines. Gene...

1
NOAA Polar Data Processing NOAA Polar Data Processing TimelinesTimelines
Gene LeggNovember 12, 2003

2
POLAR AFTERNOONPOLAR MORNING
GEOSTATIONARYGOES E
GEOSTATIONARYGOES W
DMSP
Notional depictionNotional depiction
DMSP
NOAA Satellite Data Acquisition
Ingesting Data from 21 Satellites

3
CEMSCS Daily Satellite Data Received
232.2 GB232.2 GB
NOAA PolarNOAA-15, 16 & 17 6.3GB
GOESGOES East/West 35.0GB
DMSP F13, 14 & 15 1.7GB
Non-NOAA SatellitesMETEOSAT 5 (INDOEX) .4GBTRMM 1.3GBMODIS 175.0GBAIRS .6GBERS 2 .2GBQuikSCAT .4GBGMS .1GBMETEOSAT 7 .8GBRadarSat 5.0GBSeawifs (not included in total, must be ordered)

POES (AM/PM) DOMSAT West DOMSAT East
GAC, LAC & HRPT
HR
PT
GAC, LAC & HRPT
FTP
SOCCSuitland,
MD
Amdahl GS 745
DISTRIBUTION
CEMSCSNOAA POLAR-ORBITING OPERATIONAL ENVIRONMENTAL SATELLITE SYSTEM
DATA FLOW
Ingest System
CEMSCS
Wallops, VAMonterey,CA
FB4Suitland, MD
Data &Products
Fairbanks,AK

SOCCSuitland, MD
IBM RS6000SP
DISTRIBUTION
Ingest System
IJPS NOCSuitland, MD
Blind GAC
GAC
Data & Products
GAC Frame Sync
LAC
GDS & MHRPT
Level 1 Metop
Blind GAC
POES TM/TC
Metop TM/TC
HRPT
Auxiliary Data
CEMSCSINITIAL JOINT POLAR-ORBITING OPERATIONAL SATELLITE SYSTEM DATA FLOW
03/04/03IJPS Era Data Flow v1
NOAAGFT
Server

NASAFB4
Suitland, MD
MO
DIS
MO
DIS
AIR
S SeaW
inds
L2 P
rodu
cts
CEMSCSNON-NOAA DATA FLOW
TERRA
AQUA
QuikSCAT
USERS
L0 A
IRS
DISTRIBUTION
Data & Products
WWW
SPP
MODIS
SeaW
inds
ERS
TRMM
MET
EOSAT
3/20/03NON-NOAA Data Flow v1
RADARSAT ERS 2
L2 TRMMRaw SeaWinds
L2 AIRSMODIS Global IB
NOAA ScienceCenter
Camp Springs, MDGM
S Dig
ital
GM
S &
MET
EO
SAT
Dig
ital
SAR ProcessingFacility
Fairbanks, AK
L2 RADAR
SAT
ESA Processing Ctr.Frascatti, Italy
L2 ERS
TRM
M
TRMMSeaWiFS
OrbimageDulles, VA
L1 SeaWiFS
CEMSCS
METEOSAT
ME
TEO
SAT D
igita
l
GM
S WEF
AX/L
RIT
GMS

CEMSCS Architecture2003
Shared ProcessingData
Non-NOAA Data
SOCC
SP Gateway
Ingest SystemIBM ATL 20TB
600 GB DASD
STK ATL Silo1.2TB
U
S
E
R
S
SAA/CLASS NCDC
UNIX/LINUX/UNICOS Distributed Processorsand Servers
CEMSCS Data Flows and Systems ArchitectureOFF SITE Processors
CRAYSUN SGI
IBM/SP Intel
GMSW EFAX/
LRITW W B
NW SGateway
W EFAX/LRITCharts
GOESW EFAX
GOES (2)
POES (2)
Amdahl GS 745
W W B
SOCC
3/20/03CEMSCS Data Flow v1
FXTS - W EFAX/LRIT
W W B
METEOSAT 7 & GMSDigital
SUN SGI SUN SGI

8
OSO/OSDPD POES Data Delivery – Primary S/C
0:55 0:55 0:55 0:55 0:55 0:55 0:55 0:55 0:55 0:55 0:55 0:55 0:55
0:24 0:25 0:19 0:19
1:00
0:20 0:19 0:21 0:20 0:17 0:21 0:23 0:20
0:06 0:060:06 0:06
0:06
0:05 0:06 0:06 0:05 0:06 0:06 0:07 0:061:211:251:221:201:23 1:181:201:21
2:01
1:201:201:261:25
0:00
0:20
0:40
1:00
1:20
1:40
2:00
2:20
JUL 1
- JUL 7
JUL 8
- JUL 1
4
JUL 1
5 - JU
L 21
JUL 2
2 - JU
L 28
JUL 2
9 - A
UG 4
AUG 5 - A
UG 11
AUG 12 - A
UG 18
AUG 19 - A
UG 25
AUG 26 - S
EP 1SEP 2
- SEP 8
SEP 9 - S
EP 15
SEP 16 - S
EP 22
SEP 23 - S
EP 30
Wee
kly
AVG
(HH:
MM
) Time fromCEMSCSIngest-to-Release
Time from datarecorded atCDA to timeplayed back toCEMSCS
Approximate Time fromObservation toPlayback toCDA

9
NCEP 00Z Cycle StatsInstrument
Eta - 00Z (T+1:10) GFS - 00Z (T+2:45) FNL - 00Z (T+6:05)
HIRS-2 (NOAA-14) 703 (14, 0) 47,826 (1, 1) 172,099 ( 0, 1)
MSU (NOAA-14) 38 ( 0, 0) 2,550 (1, 1) 9,182 ( 0, 1)
AMSU-A (N-15,16,17) 13,243 ( 1, 5) 155,673 (1, 0) 214,039 ( 0, 0)
AMSU-B (N-15,16,17) 118,373 ( 1, 5) 1,399,827 (1, 0) 1,910,940 ( 0, 0)
HIRS-3 (N-15,16,17) 28,885 ( 1, 6) 341,611 (1, 0) 468,037 ( 0, 0)

10
Future Challenges
Time Data Remains on Satellite101 minutes From First to Last Observation
Time of Data Processing at NOAA CDA and SOCC25 Minutes From Playback of Data From Satellite to Data Delivery to CEMSCS
Data Processing on CEMSCS8 Minutes from Data Arrival to Data is Available to Use
Friday, October 31, 200
Timeline for Current Processing of NOAA Polar Data
Time from Observation to Data Delivery134 Minutes from Data Observation on Satellite to Data is Made Available to Users
NCEP New Timeliness Requirement of 165 Minutes from Observation
O minutes 165 Minutes
Timeline From First Observation to Data is Made Available to Users
134 Minutes
11
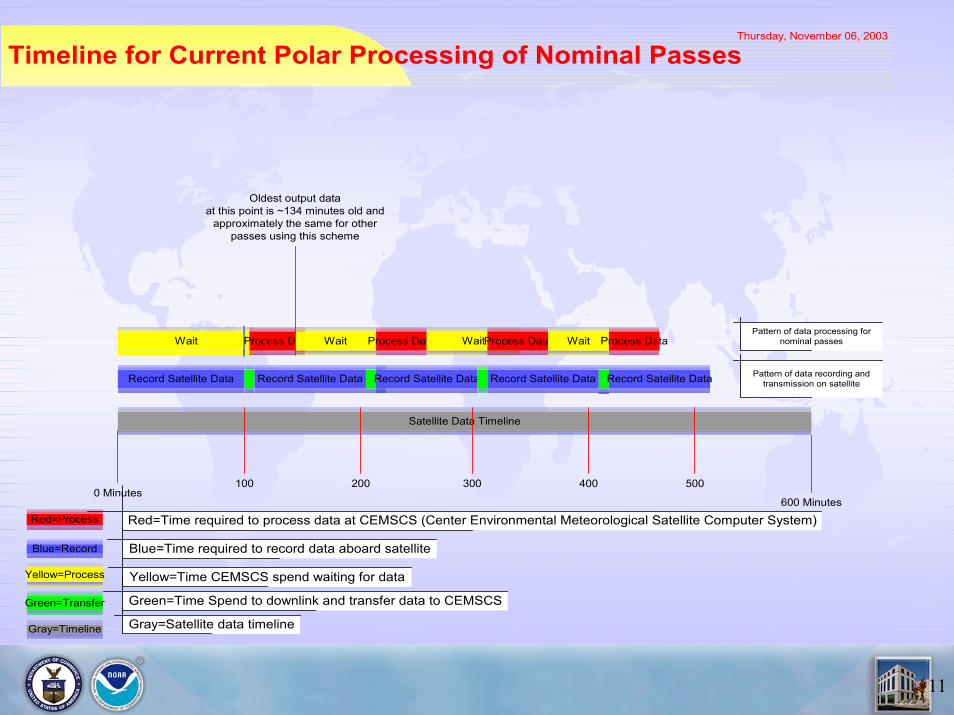
Satellite Data Timeline
0 Minutes100 200 300 400 500
600 Minutes
Record Satellite Data Record Satellite Data Record Satellite Data Record Satellite Data Record Satellite Data
Wait Process Data Wait Process Data WaitProcess Data Wait Process Data
Oldest output dataat this point is ~134 minutes old and
approximately the same for otherpasses using this scheme
Pattern of data recording andtransmission on satellite
Pattern of data processing fornominal passes
Thursday, November 06, 2003
Timeline for Current Polar Processing of Nominal Passes
Red=Process Red=Time required to process data at CEMSCS (Center Environmental Meteorological Satellite Computer System)
Blue=Record
Yellow=Process
Green=Transfer
Blue=Time required to record data aboard satellite
Green=Time Spend to downlink and transfer data to CEMSCS
Yellow=Time CEMSCS spend waiting for data
Gray=Timeline Gray=Satellite data timeline

12
Satellite Data Timeline
0 Minutes
100 200 300 400 500600 Minutes
Record Satellite Data Record Satellite Data Record Satellite Data Record Satellite Data Record Satellite Data
Wait Process Data
Start recording of second pass
End processing of third pass(most recent data)and start processing of second pass.
Data is ~ 134 minutes old at this point.
End processing offirst orbit. Data is ~ 369minutes old at this point
Pattern of recording andtransmission of satellite
data containing blindorbits
Pattern of data processing forpasses that contain a blind orbits
Process DataProcess Data
Friday, November 07, 200
Timeline for Current Polar Processing of Blind Orbits
Start recording third pass
End processing ofsecond orbit and begin
processingof first pass. Data is ~ 260
minutes old at this point
Blue=Record
Yellow=Wait
Green=Transfer
Blue=Time required to record data aboard satellite
Yellow=Time spend waiting for data to process
Green=Time spend to downlink and transfer data to CEMSCS
Red=Timeline Red= Satellite data timeline
Gray=Process Gray=Time required to process data at CEMSCS (Center Environmental Meteorological Satellite Computer System)

13
Future Challenges
Timeline
0 Minutes191 Minutes
Time to Record Data Onboard Satellite
Svalbard CDA Ingest and Darmstadt Processing
CEMSCS Ingest & Preprocessing
101 Minutes20
Minutes
70 minutes
Friday, November 07, 2003
Timeline for Pipeline Processing of METOP & NOAA BLIND ORBITS
191 Minutes from First Observation Until Orbital File is Available
First Granule Available 123 Minutes After Observation
To Be NotedThe first granule will be available 123 minutes after observation. The data age of all granules will be approximately 123 minutes. However, orbital file won't be available until ~ 191 minutes after the first observation which will be ~57 minutes later than they are today.
NCEP New Timeliness Requirement of 165 Minutes
165 Minutes

14
Future Challenges
Time Data Remains on Satellite101 minutes From First to Last Observation
Time from Playback of Data to Arrival at IDPS2 Minutes From Playback of Data From Satellite at CDA to Data
Arrives at IDPS
IDPS Data Processing5 Minutes for Processing of Data Until Data is Available to Use
Friday, October 31, 200
Timeline for NPP Orbital Process in NPP Era
Time from Observation to Data Delivery108 Minutes from Data Observation on Satellite to Data is Made Available to Users
NCEP New Timeliness Requirement of 165 Minutes from Observation
O minutes 165 Minutes
Timeline From First Observation to Data is Made Available to Users
108 Minutes

15
Record Data on Satellite
IDPS PROCESSING
Transfer Data
IDPS Processing
Record Data
IDPS Processing
Record Data Record Data
IDPS Processing
Blue=Record
Yellow=Process
Green=Transfer
Red=W ait
Tim e Data Resident on Satellite15 M inutes
Tim e from Observation to Data is Available to User16 M inutes
18 Seconds for Transfer of Data
Tim e to ProcessData at IDPS45 Seconds
W ait for M ore DataTim e to Process
Data at IDPS45 Seconds
Tim e from Observation to Data is Available to User16 M inutes
Thursday, Novem ber 06,2003Tim eline for NPOESS Processing in NPOESS Era
Tim e from Observation to Data is Available to User16 M inutes
NCEP Requirem ent of 165 M inutes
165 M inutes
Green=Tim e Spend to downlink and transfer data to IDPS
Red=Tim e IDPS system spends waiting for data
Blue=Tim e required to record data aboard satellite
Yellow=Tim e required to process data at IDPS (Interface Data Processor Segm ent)

16
Questions

17
Backup Slides

18
NCEP 06Z Cycle Stats
InstrumentEta - 06Z (T+0:50) GFS - 06Z (T+2:45) FNL - 06Z (T+5:50)
HIRS-2 (NOAA-14) 944 (22, 0) 31,503 ( 1, 7) 52,643 ( 1, 7)
MSU (NOAA-14) 52 (22, 0) 1,680 ( 1, 7) 2,808 ( 1, 7)
AMSU-A (N-15,16,17) 4,417 ( 1,10) 146,763 ( 0, 1) 191,615 ( 0, 0)
AMSU-B (N-15,16,17) 39,826 ( 1, 9) 1,312,402 ( 0, 1) 1,711,586 ( 0,.0)
HIRS-3 (N-15,16,17) 10,599 ( 0,14) 319,707 ( 0, 1) 417,200 ( 0, 0)

19
NCEP 12Z Cycle Stats
InstrumentEta - 12Z (T+1:10) GFS - 12Z (T+2:45) FNL - 12Z (T+8:05)
HIRS-2 (NOAA-14) 4,155 ( 4, 0) 78,569 ( 1, 0) 167,793 ( 0, 1)
MSU (NOAA-14) 223 ( 4, 0) 4,185 ( 1, 0) 8,946 ( 0, 1)
AMSU-A (N-15,16,17) 5,759 (0,11) 123,864 ( 0, 1) 241,759 ( 0, 0)
AMSU-B (N-15,16,17) 50,737 (0,11) 1,114,988 ( 0, 1) 2,162,062 ( 0, 0)
HIRS-3 (N-15,16,17) 12,449 (0,11) 271,980 ( 0, 1) 530,220 ( 0. 0)

20
NCEP 18Z Cycle StatsInstrument
Eta - 18Z (T+0:50) GFS - 18Z (T+2:45) FNL - 18Z (T+5:50)
HIRS-2 (NOAA-14) 2,898 ( 9, ?) 60,596 ( 2, 2) 145,332 ( 0, 5)
MSU (NOAA-14) 156 ( 9, ?) 3,232 ( 2, 2) 7,857 ( 0, 5)
AMSU-A (N-15,16,17) 5,753 ( 0, 9) 145,962 ( 0, 0) 220,484 ( 0, 0)
AMSU-B (N-15,16,17) 46,896 ( 0, 5) 1,306,063 ( 0, 0) 1,968,047 ( 0, 0)
HIRS-3 (N-15,16,17) 13,020 ( 0, 9) 320,175 ( 0, 0) 482,515 ( 0, 0)

Data Logical Product Generation
NOAA-KLM
AVHRR
AIPMIRP
TIP
AMSU-A AMSU-B HIRS SBUV
SEMDCSSAR
LAC1B*
TIP1B
AMSUB1B*
HIRS1B*
AEROSOL#
1.0 2.0 3.0 4.0 5.0 6.0 7.0 9.08.0 10.0 11.0
1B*AMSUA
(IMAGES)
# Not used forearly 0730 AM
orbit
1B* 1BTranslator
1BDatasets
Metadata
RT
RS
DTRs
COASTALSST
(SST)
SIG.EVENT
IMAGERY
GLOBALVEG.
INDEX #
GLOBALSEA
SURFACETEMP
RAD.BUDGET
OZONE # SNOW/ICE
(ATOVS)
GLOBALIMAGERY
ATMOS.TEMP
ATMOS.MOISTURE
MWSURFACE/
HYDRO
12.0
NOAA-KLM POLARPRODUCT SYSTEMS
AVHRR1A
INGEST
AIP1A
AIPPRE-PRO
DCS
SEM
AVHRRPRE-PROE
xter
nal
Arc
hive
Use
rs
SPA
CE
CR
AF
T
CDA
SOCC
GAC1B*
Fairbanks, AK Wallops, VA
Suitland, MD
Earth Location/Calibration
(OSEI) (AEROSOL) (MSPPS) (AMSUB)(IMS)(OOPS)(RBPGS)(OCNMAP)(GVI)
SAR

22
Level 1B to Products
SignificantEvent
Imagery
AtmosphericTemperature
AtmosphericMoisture
Snow/IceCoverage
SSTAerosols Ozone
VegetationIndex
CloudImagery
Precipitation
RadiationBudget
Sea IceMonitoring
AVHRRHRPT
AVHRRGAC
AVHRRLAC
HIRSLevel 1b
AMSU-ALevel 1b
AMSU-BLevel 1b
SBUVLevel 1b
SEMLevel 1b
Level 1b Data
DCSLevel 1b
SARLevel 1b
SolarEnvironmentMonitoring
Derived Product Processing
CoastWatch WindsData
CollectionSystem
Search &Rescue

NOAA Satellite Operations Facility(NSOF)
Final Occupancy May – September 2005

24
Future Data Impacts
20042005
20072008
2009BEYOND
GOES-N
NOAA-N (PM)
GOES-O
METOP-1
NSOF
CIP
NPOESS C-1
GOES-Q
METOP-2NPP NOAA-N’
(PRIME)
2010
GOES-R
METOP-3
NPOESS C-2
NPOESS C-3
2006
GOES-P

25
CEMSCS Data Volumes
Year 2003 2004 2005 2006 2007 2008 2009 2010 2011 2012 201NPP (TB) 0.00 0.00 0.00 862.86 862.86 862.86 862.86 862.86 0.00 0.00 0.0NPOESS (TB) 0.00 0.00 0.00 0.00 0.00 0.00 978.20 978.20 1956.40 1956.40 2941.9METOP (TB)* 0.00 0.00 17.00 17.00 17.00 17.00 17.00 17.00 17.00 17.00 17.0POES (TB) 2.26 2.26 2.26 2.26 2.26 2.26 1.00 1.00 1.00 1.00 1.0GOES (TB) 12.41 12.41 12.41 12.41 12.41 12.41 12.41 12.41 75.00 330.00 330.0DMSP (TB) 0.61 0.61 0.61 0.61 0.61 0.61 0.61 0.61 0.61 0.61 0.6Non-NOAA (TB) 66.00 67.00 67.00 67.00 67.00 67.00 67.00 67.00 67.00 67.00 67.0Ingested Annually (TB) 81.28 82.28 99.28 962.14 962.14 962.14 1939.08 1939.08 2117.01 2372.01 3357.5
Terabytes per day - (Divide annual volume by: 0.222674 0.225414 0.271989 2.635989 2.635989 2.635989 5.312537 5.312537 5.800016 6.498647 9.19864
By 2013, IPD will be ingesting 9 times the number of TB per day.

26
CEMSCS Architecture2005 Phase I
Processing and DistributionData Ingest/Receipt
S a t e l l i t e D a t a I n g e s t( P O E S , G O E S , M E T O P )
S h a r e d P r o c e s s i n g G a t e w a y
N o n - N O A A D a t a
A n c i l l a r y D a t a
I B M Z s e r i e s 3 0 0 M I P S
I B M 3 4 9 4 A T L
D i s k S t o r a g e A r r a y
I B M S / P s
D i s k S t o r a g e A r r a y
U N I X / L I N U X U N I X / L I N U X
U N I X / L I N U XU N I X / L I N U X
D A S DD A S D
D A S DD A S D
N S O F I n t e r n a lC u s t o m e r s
N S O F E x t e r n a lC u s t o m e r s

27
CEMSCS Architecture2005 - 2006 Phase II
Processing and DistributionData Ingest/Receipt
S a te l l i te D a ta In g e s t(P O E S , G O E S , M E T O P )
S h a r e d P r o c e s s in g G a te w a y
N o n -N O A A D a ta
A n c i l la r y D a ta
IB M Z s e r ie s 3 0 0 M IP S
IB M 3 4 9 4 A T LIB M S /P s
U N IX /L IN U X U N IX /L IN U X
U N IX /L IN U XU N IX /L IN U X
N S O F In te r n a lC u s to m e r s
N S O F E x te r n a lC u s to m e r s
S
A
N
N P P /N P O E S S ID P S

28
CEMSCS Architecture2005 - 2006 Phase III
NSOF CIP Site
Satellite Data Ingest(POES, GOES, METOP)
Shared Processing Gateway
Ancillary Data
IBM Z series 300 MIPS
IBM 3494 ATL
IBM S/P
UNIX/LINUX
UNIX/LINUX
CIP ExternalCustomers
S
A
N
Non-NOAA (TBD)
Satellite Data Ingest(POES, GOES, METOP)
Shared Processing Gateway
Non-NOAA Data
Ancillary Data
IBM Z series 300 MIPS
IBM 3494 ATLIBM S/Ps
UNIX/LINUX UNIX/LINUX
UNIX/LINUXUNIX/LINUX
NSOF InternalCustomers
NSOF ExternalCustomers
S
A
N
NPP/NPOESS IDPS