No Activity Sporadic Local Regional...
12
No Activity Sporadic Local Regional Widespread New Jersey Activity Level: HIGH Current week last year: HIGH Regional 4 Data Northwest: HIGH Northeast: HIGH Central West: HIGH Central East: HIGH South: HIGH Current Week Past 3 Weeks Cumulative Total Influenza A H1N1 (2009) 30 122 217 Influenza A H3N2 74 42 1129 Influenza B 486 1404 2439 Rapid Influenza Tests 2555 7119 11999 Influenza Activity Level 3 ILI 5 Activity Report also available at http://nj.gov/health/cd/statistics/flu-stats/ Week 40 Week 45 Week 50 Week 3 Week 8 Week 13 Week 18 Week 23 Week 28 Laboratory Testing 8 Respiratory Virus Surveillance Report 1 New Jersey Department of Health Communicable Disease Service Week ending February 17, 2018 (MMWR week 7 2 ) Percent ILI/Absenteeism 5 Baselines Current Week (range by county) Last week Current year Current week Last year Non-season 6 (Seasonal Average– low, high) 7 Long Term Care Facilities 0.78 (0.00, 3.26) 0.72 0.67 0.48 (0.45, 0.76) Schools (absenteeism) 6.05 (4.26, 10.35) 6.25 4.29 3.36 (4.49, 4.86) Emergency Departments 11.83 (0.26, 16.96) 10.71 5.41 2.21 (3.17, 3.92)
Transcript of No Activity Sporadic Local Regional...
No Activity Sporadic Local Regional Widespread
New Jersey Activity Level: HIGH
Current week last year: HIGH
Regional4 Data
Northwest: HIGH
Northeast: HIGH
Central West: HIGH
Central East: HIGH
South: HIGH
Current Week Past 3 Weeks Cumulative Total
Influenza A H1N1 (2009) 30 122 217
Influenza A H3N2 74 42 1129
Influenza B 486 1404 2439
Rapid Influenza Tests 2555 7119 11999
Influ
enza
Activ
ity L
evel 3
ILI
5 Activ
ity
Report also available at http://nj.gov/health/cd/statistics/flu-stats/
Week 40 Week 45 Week 50 Week 3 Week 8 Week 13 Week 18 Week 23 Week 28
Lab
ora
tory
Testin
g8
Respiratory Virus Surveillance Report1
New Jersey Department of Health
Communicable Disease Service
Week ending February 17, 2018 (MMWR week 72)
Percent ILI/Absenteeism5 Baselines
Current Week
(range by county)
Last week
Current year
Current week
Last year
Non-season6
(Seasonal Average–
low, high)7
Long Term Care
Facilities
0.78
(0.00, 3.26) 0.72 0.67
0.48
(0.45, 0.76)
Schools
(absenteeism)
6.05
(4.26, 10.35) 6.25 4.29
3.36
(4.49, 4.86)
Emergency
Departments
11.83
(0.26, 16.96) 10.71 5.41
2.21
(3.17, 3.92)

Influ
enza
Po
sitive
Sp
ecimen
s (PC
R)
Influ
enza
Positiv
e S
pecim
ens
(PC
R) b
y R
egio
n4/T
yp
e
Virologic Surveillance8
Influ
enza
Rap
id A
ntig
en
Resu
lt by W
eek
0
200
400
600
800
1000
1200
1400
1600
Central East Central West Nor theast Nor thwest South
Num
ber
Po
siti
ve
Number Positive
Three Week PCR positives
by Region/Type
Total by Region 2009 H1N1 AH3 A typing not performed B
0
50
100
150
200250
300
350
400
450
500
550600
650
700
750
800
850
900950
1000
1050
1100
1150
1200
1250
13001350
1400
1450
1500
9/2/
2017
9/16
/201
7
9/30
/201
7
10/1
4/20
17
10/2
8/20
17
11/1
1/20
17
11/2
5/20
17
12/9
/201
7
12/2
3/20
17
1/6/
2018
1/20
/201
8
2/3/
2018
2/17
/201
8
3/3/
2018
3/17
/201
8
3/31
/201
8
4/14
/201
8
4/28
/201
8
5/12
/201
8
5/26
/201
8
6/9/
2018
6/23
/201
8
7/7/
2018
7/21
/201
8
8/4/
2018
8/18
/201
8
9/1/
2018
9/15
/201
8
9/29
/201
8
Num
ber
Posi
tive
Week Ending
Influenza Positive (PCR)
By Week
2009 H1N1 Type AH3 A typing not performed Type B
0.00
5.00
10.00
15.00
20.00
25.00
30.00
35.00
40.00
0
1000
2000
3000
4000
5000
6000
7000
8000
9000
10000
9/2
/2017
9/1
6/2
017
9/3
0/2
017
10/1
4/2
01
7
10/2
8/2
01
7
11
/11
/20
17
11
/25
/20
17
12/9
/2017
12
/23
/20
17
1/6
/2018
1/2
0/2
018
2/3
/2018
2/1
7/2
018
3/3
/2018
3/1
7/2
018
3/3
1/2
018
4/1
4/2
018
4/2
8/2
018
5/1
2/2
018
5/2
6/2
018
6/9
/2018
6/2
3/2
018
7/7
/2018
7/2
1/2
018
8/4
/2018
8/1
8/2
018
Perc
en
t P
osit
ive
To
tal T
ests
Perf
orm
ed
Week Ending
Rapid Influenza
Total Tested and Percent Positive
Rapid Flu No. Tested 2017-2018 Rapid Flu Percent Pos 2017-2018 Average 3 highest flu seasons Average 3 lowest flu seasons

Em
ergen
cy D
epa
rtmen
t9 V
isits
Percen
t du
e to
ILI
Em
ergen
cy D
epa
rtmen
t9
Percen
t of A
dm
ission
s du
e to IL
I
Influenza-Like Illness (ILI) Surveillance
Em
ergen
cy D
epa
rtmen
t9 V
isits
Percen
t of IL
I By
Ag
e Gro
up
Emergency Department Visits - By Age Group
% of Visits Attributed to ILI
Age Group 0-4 yrs Age Group 5-24 yrs Age Group 25-49 yrs Age Group 50-64 yrs Age Group 65+ yrs
0.00
2.00
4.00
6.00
8.00
10.00
12.00
14.00
9/2/
2017
9/16
/201
7
9/30
/201
7
10/1
4/20
17
10/2
8/20
17
11/1
1/20
17
11/2
5/20
17
12/9
/201
7
12/2
3/20
17
1/6/
2018
1/20
/201
8
2/3/
2018
2/17
/201
8
3/3/
2018
3/17
/201
8
3/31
/201
8
4/14
/201
8
4/28
/201
8
5/12
/201
8
5/26
/201
8
6/9/
2018
6/23
/201
8
7/7/
2018
7/21
/201
8
8/4/
2018
8/18
/201
8
Per
cen
t IL
I
Week Ending
Percent of Emergency Department
Visits due to ILI
Percent ILI Visits 2017-2018 Average 3 Highest Flu Seasons Average 3 Lowest Flu Seasons
0.00
1.00
2.00
3.00
4.00
5.00
6.00
7.00
9/2
/2017
9/1
6/2
01
7
9/3
0/2
01
7
10
/14
/20
17
10
/28
/20
17
11/1
1/2
017
11/2
5/2
017
12
/9/2
01
7
12
/23
/20
17
1/6
/2018
1/2
0/2
01
8
2/3
/2018
2/1
7/2
01
8
3/3
/20
18
3/1
7/2
01
8
3/3
1/2
01
8
4/1
4/2
01
8
4/2
8/2
01
8
5/1
2/2
01
8
5/2
6/2
01
8
6/9
/2018
6/2
3/2
01
8
7/7
/20
18
7/2
1/2
01
8
8/4
/2018
8/1
8/2
01
8
Per
cen
t IL
I
Week Ending
Percent of Emergency Department
Admissions due to ILI
Percent ILI Admissions 2017-2018 Average 3 Highest Flu Seasons Average 3 Lowest Flu Seasons

Sch
oo
l Ab
senteeism
5
Lo
ng
Ter
m C
are F
acilities
5
0.00
1.00
2.00
3.00
4.00
5.00
6.00
7.00
8.00
9.00
10.00
11.00
12.00
9/2/
17
9/16
/17
9/30
/17
10/1
4/17
10/2
8/17
11/1
1/17
11/2
5/17
12/9
/17
12/2
3/17
1/6/
18
1/20
/18
2/3/
18
2/17
/18
3/3/
18
3/17
/18
3/31
/18
4/14
/18
4/28
/18
5/12
/18
5/26
/18
6/9/
18
6/23
/18
7/7/
18
7/21
/18
8/4/
18
8/18
/18
9/1/
18
9/15
/18
9/29
/18
Perc
ent I
LI
Week Ending
ILINet Provider
Percent ILI
2016-2017 5 year % ILI (avg) 2017-2018
Influenza-Like Illness (ILI) Surveillance
ILI N
et Pro
vid
ers5
0.00
2.00
4.00
6.00
8.00
10.00
12.00
9/2/
17
9/16
/17
9/30
/17
10/1
4/17
10/2
8/17
11/1
1/17
11/2
5/17
12/9
/17
12/2
3/17
1/6/
18
1/20
/18
2/3/
18
2/17
/18
3/3/
18
3/17
/18
3/31
/18
4/14
/18
4/28
/18
5/12
/18
5/26
/18
6/9/
18
6/23
/18
7/7/
18
7/21
/18
8/4/
18
8/18
/18
Perc
ent A
bsen
teei
sm
Week Ending
School
Percent Absenteeism
Average 3 Highest Flu Seasons Average 3 Lowest Flu Seasons Percent Absent 2017-2018
Winter Break
0.00
0.50
1.00
1.50
2.00
2.50
9/2/
17
9/16
/17
9/30
/17
10/1
4/17
10/2
8/17
11/1
1/17
11/2
5/17
12/9
/17
12/2
3/17
1/6/
18
1/20
/18
2/3/
18
2/17
/18
3/3/
18
3/17
/18
3/31
/18
4/14
/18
4/28
/18
5/12
/18
5/26
/18
6/9/
18
6/23
/18
7/7/
18
7/21
/18
8/4/
18
8/18
/18
Perc
ent I
LI
Week Ending
Long Term Care Facility
Percent ILI
Average 3 Highest Flu Seasons Average 3 Lowest Flu Seasons Percent ILI 2017-2018
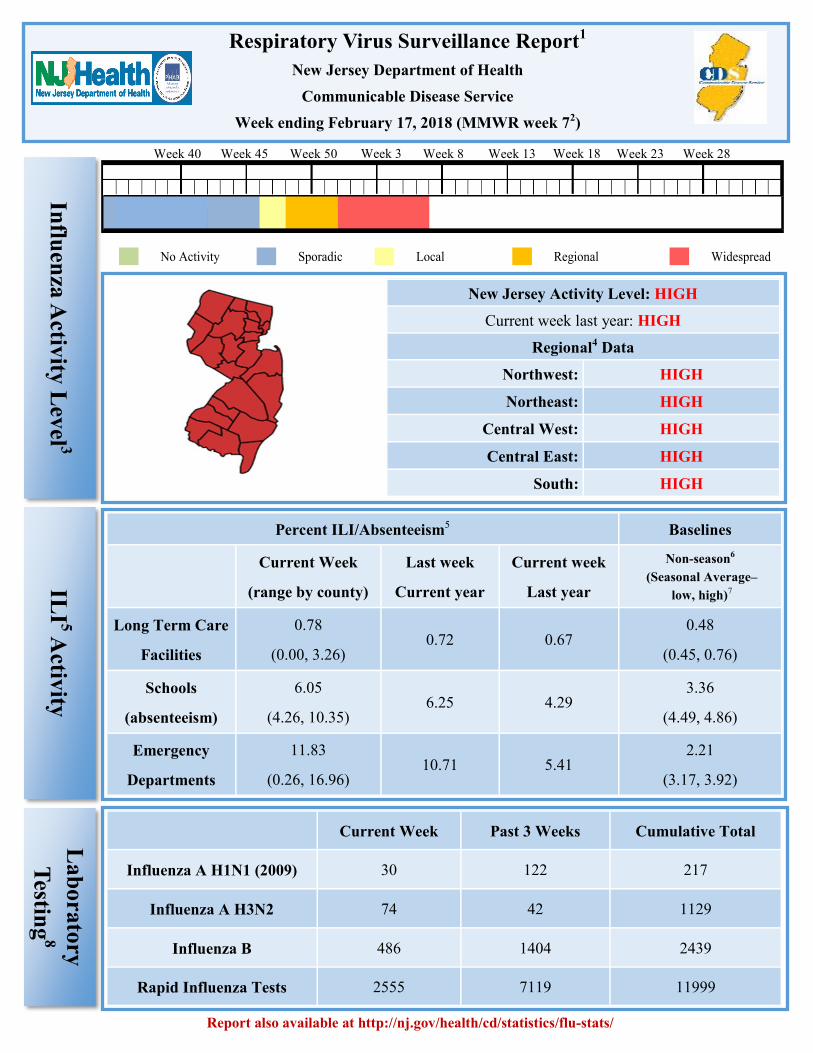
Influenza Season US (fatal) NJ (severe) NJ (fatal)
2012-2013 171 89 7
2013-2014 108 54 6
2014-2015 146 33 1
2015-2016 85 47 1
2016-2017 109 39 0
2017-2018 84 39 2
Respiratory Outbreaks in Long Term Care Facilities10
Cumulative Outbreaks 2017-2018 Season 142
No. outbreaks last 3 weeks 47
Regions with recent outbreaks NW, NE, CW, CE, S
Lo
ng
Ter
m C
are
Ou
tbrea
ks
Ped
iatric
Influ
enza
Mo
rtality
11
Influenza-Like Illness (ILI) Surveillance
Viral Respiratory Surveillance
Non-Influenza
0.00
5.00
10.00
15.00
20.00
25.00
30.00
0
500
1000
1500
2000
2500
Per
cent
Pos
itiv
e
Tot
al T
ests
Per
form
ed
Week Ending
RSV Data
Total Tested and Percent
Tests Performed 17-18 % positive 2017-2018 % positive (5 year average)
Resp
irato
ry S
yn
cy
tial V
irus
Percen
t Po
sitive

Total Tests Positive for a Respiratory Virus Other than Influenza
Respiratory
Syncytial
Virus
Parainfluenza Adenovirus Human
Metapneumovirus
Corona
Viruses Rhinovirus
Past
Three
Weeks
109 5 25 37 33 62
17-18
Season 792 70 116 105 229 456
Count of Positive Results by Type in the
Past Three Weeks Count of Positive Result by Type in the
17-18 Season
Positiv
e No
n-In
fluen
za T
ests1
2
Respiratory Syncytial Virus Parainfluenza Adenovirus Human Metapneumovirus Corona Viruses Rhinovirus
Viral Respiratory Surveillance
Non-Influenza
For additional information regarding influenza surveillance
please visit the following websites.
http://nj.gov/health/flu/surveillance/shtml
http://www.cdc.gov/flu/

Footnotes:
1. This report contains surveillance information about influenza and other viral respiratory illnesses collected by the New Jersey
Department of Health, Communicable Disease Service.
2. The Morbidity and Mortality Weekly Report (MMWR) week is the week of the epidemiologic year used by the Centers for Disease
Control and Prevention (CDC) for disease reporting. is assigned by the reporting local or state health department for the purposes of
MMWR disease incidence reporting and publishing. MMWR weeks begin on a Saturday and end on a Sunday and are assigned a
numeric value ranging from 1 to 53, although most years consist of 52 weeks. Week ending dates and associated MMWR weeks
can be found at: http://www.nj.gov/health/cd/documents/flu/mmwr_weeks.pdf
3. Activity levels for the state and region are defined in Tables 1 and 2 at the end of this document.
4. The following is a breakdown of counties contained within each public health region: Northwest: Morris, Passaic, Sussex, Warren;
Northeast: Bergen, Essex, Hudson; Central West: Hunterdon, Mercer, Somerset; Central East: Middlesex, Monmouth, Ocean,
Union; South: Atlantic, Burlington, Camden, Cape May, Salem, Cumberland, Gloucester.
5. Influenza-like illness (ILI) is defined as fever (> 100°F [37.8°C], oral or equivalent) and cough and/or sore throat (in the absence of
a known cause other than influenza). For long term care facilities, fever is defined as 2°F above baseline temperature. ILI Activity
from long term care (LTC) facilities and absenteeism data from schools is collected in the ILI Module of the Communicable
Disease Reporting and Surveillance System (CDRSS). LTCs and schools report their total census and number ill with ILI or
number absent, respectively. Emergency department (ED) data is aggregate weekly totals of syndromic ILI visits and total ED
registrations as recorded in EpiCenter (e.g., NJDOH syndromic surveillance system). Data presented represents information for the
week prior to the current report week. Current week data presented on ED Chart on page 3.
6. Non-season baseline is calculated by taking the average of statewide percentages of ILI for a 10 year (2008, 2009, 2010, 2011,
2012, 2013, 2014, 2015, 2016 and 2017) period during months when influenza is less likely to be circulating (May-August).
7. Three year seasonal averages are determined by calculating the average percent ILI/absenteeism for each influenza season (October
to May) beginning with the 2010-2011 season. These averages are ranked and the three highest and lowest overall season averages
were selected. The three highest and lowest numbers were then averaged to obtain a single high and single low value. The season
which contribute to the high and low value vary by entity type and are as follows: LTCF (High: 10-11, 12-13, 14-15; Low: 11-12,
15-16, 16-17), ED (High: 12-13, 14-15, 16-17; Low: 10-11, 11-12, 15-16) and schools (High: 10-11, 12-13, 16-17; Low: 11-12,
13-14, 14-15). A week by week average was also calculated using the average of the seasons listed above for each entity type.
8. Laboratory testing: Real-time polymerase chain reaction (PCR) results for influenza (AH1N1, AH3N2, and B) are obtained from
electronic laboratory transmission submitted by acute care, commercial and public health laboratories to CDRSS. Rapid influenza
test data and respiratory syncytial virus data are acquired from facilities reporting via the National Respiratory and Enteric Virus
Surveillance System (NREVSS) or CDRSS ILI module. Counts for cumulative totals begin with week ending October 7, 2017.
Three week count data includes current week and two prior weeks. Data presented for rapid influenza testing represents information
for the week prior to the current report week. Three year seasonal averages for rapid influenza tests are determined by calculating
the average percent positive for each influenza season (October to May) beginning with the 2010-2011 season. These averages are
ranked and the three highest and lowest overall season averages were selected. The three highest and lowest numbers were then
averaged to obtain a single high and single low value for each week. The season which contribute to the high and low value for
rapid influenza chart are as follows: High: 10-11, 11-12, 12-13; Low: 13-14, 15-16, 16-17.
9. Daily visits and admissions associated with ILI from emergency department data is collected via EpiCenter (i.e., NJDOH
syndromic surveillance). Prior to 2017-2018 season, data on ILI visits were only recorded on one day per week usually on
Tuesday. Beginning in the 2017-2018 season, weekly aggregate data is being recorded for ILI visits and admissions. Data presented
represents the week prior to the current report week.
10. Only LTCF outbreaks reported to NJDOH that receive an outbreak number are recorded in this report.
11. Data presented for New Jersey are for cases confirmed as of the current reporting week. Data presented for the United States
represent data reported for the prior MMWR week. This data can be viewed at https://www.cdc.gov/flu/weekly/
12. Select laboratories in New Jersey report the total number of tests performed and the total positive for a number of non-influenza
respiratory viruses through the National Respiratory and Enteric Virus Surveillance System (NREVSS) . Information about the
CDC NREVSS system can be found at: https://www.cdc.gov/surveillance/nrevss/labs/index.html NREVSS data is combined with
non-influenza test data from the NJDOH State Public Health and Environmental Laboratory (PHEL) and aggregate total for the
season as well as those found positive in the last three weeks are displayed.

Table 1
Influenza Activity Level—Definitions for State Activity
CSTE Level Definition NJ Level
ILI Activity/Outbreaks Lab Activity
Low
No Activity ILI activity at or below baseline
AND no detected outbreaks AND
No lab confirmed cases
Sporadic
Low ILI activity detected OR one
lab confirmed outbreak anywhere in
the state
AND
Sporadic isolation of
laboratory confirmed
influenza
Moderate
Local
Increase in ILI activity OR ≥ 2 lab
confirmed outbreaks in one public
health region (Other regions not
experiencing increased ILI activity)
AND
Recent (within 3 weeks)
laboratory activity in the
region with increased ILI
Regional
Increase in ILI activity OR ≥ 2 lab
confirmed outbreaks in at least 2
public health regions (Other regions
not experiencing ILI activity)
AND
Recent (within 3 weeks)
laboratory activity in the
region with increased ILI
High Widespread
Increase in ILI activity OR two or
more lab confirmed outbreaks in > 2
public health regions
AND
Recent (within 3 weeks)
laboratory activity in the
region with increased ILI
Table 2
Influenza Activity Level—Definitions for Public Health Regions
Definition NJ Level
ILI Activity/Outbreaks Lab Activity
Low
Low ILI activity detected OR one lab confirmed
outbreak anywhere in the region AND
Sporadic isolation of laboratory
confirmed influenza anywhere in the
region
Moderate
Increased ILI activity in less than half of the
counties in the region OR two lab confirmed
outbreaks in the public health region AND
Recent (within 3 weeks) laboratory
activity in the same counties of the
region with increased ILI
High
Increased ILI activity in more than half of the
counties in the region OR ≥ 3 lab confirmed
outbreaks in the region AND
Recent (within 3 weeks) laboratory
activity in more than half of the
counties in the region with increased
ILI
Notes:
ILI activity: Systems used to detect increases in ILI activity include: ILINet (i.e., sentinel provid-
ers), school absenteeism data, ED ILI visits and admissions collected via EpiCenter, LTCF ILI data,
respiratory outbreak data and information on influenza mortality (National Center for Health Statis-
tics).
Lab Activity: NJPHEL and commercial laboratories positive influenza tests identified by PCR and
culture will be used as the primary data source for the above levels. However, rapid influenza test
data will also be considered when determining the appropriate activity levels.

INFLUENZA LABORATORY REPORTS BY COUNTY
Counts represent total positive specimensfrom week ending October 7, 2017 to current MMWR week
Source: CDRSS
INFLUENZA LABORATORY REPORTS BY COUNTY
Counts represent total positive specimensfrom week ending October 7, 2017 to current MMWR week
Source: CDRSS
Frequency
COUNTY(COUNTY)
RESULT
InfluenzaA - Typing
notperformed
InfluenzaA 2009
H1N1Influenza
AH3Influenza
B Total
ATLANTIC 658 0 11 292 961
BERGEN 1301 38 183 862 2384
BURLINGTON 512 0 6 296 814
CAMDEN 921 0 24 569 1514
CAPE MAY 251 0 0 70 321
CUMBERLAND 24 0 1 29 54
ESSEX 688 29 105 422 1244
GLOUCESTER 232 1 20 112 365
HUDSON 1167 20 54 466 1707
HUNTERDON 113 1 38 91 243
MERCER 250 4 22 386 662
MIDDLESEX 527 11 40 318 896
MONMOUTH 1123 0 14 735 1872
MORRIS 352 23 189 236 800
OCEAN 857 13 17 533 1420
PASSAIC 706 24 72 393 1195
SALEM 8 2 1 6 17
SOMERSET 119 5 43 102 269
SUSSEX 46 4 55 64 169
UNION 341 39 232 342 954
WARREN 67 3 11 20 101
Total 10263 217 1138 6344 17962

South: Atlantic, Burlington, Camden, Cape May, Salem, Cumberland, GloucesterCentral East: Middlesex, Monmouth, Ocean, Union
Central west: Hunterdon, Mercer, SomersetNorthwest: Morris, Passaic, Sussex, Warren; Northeast: Bergen, Essex, Hudson
The following is a breakdown of counties contained within each public health region:
INFLUENZA LABORATORY REPORTS BY REGION
Counts represent total positive specimensfrom week ending October 7, 2017 to current MMWR week
Source: CDRSS
Frequency Table of REGION by RESULT
REGION
RESULT
InfluenzaA - Typing
notperformed
InfluenzaA 2009
H1N1Influenza
AH3Influenza
B Total
Central East 2848 63 303 1928 5142
Central West 482 10 103 579 1174
Northeast 3156 87 342 1750 5335
Northwest 1171 54 327 713 2265
South 2606 3 63 1374 4046
Total 10263 217 1138 6344 17962

COUNTY
# E
nro
lled
# R
epo
rts
Rec
'd
% IL
I
# E
nro
lled
# R
epo
rts
Rec
'd
% A
bse
nt
# R
epo
rts
Rec
'd
% IL
I
# E
nro
lled
Long Term Care Schools Hospital Emergency Dept
Communicable Disease Reportingand Surveillance System
02/20/2018 9:18 AMNJ ACTIVE INFLUENZA-LIKE ILLNESS SURVEILLANCE STATISTICSSURVEILLANCE DATE: 02/13/2018
February 13, 2018 MMWR WEEK 7
ATLANTIC 2 18360 0.00 6.31 4 8.644BERGEN 11 19334 0.66 5.03 6 9.165BURLINGTON 7 741013 3.26 6.39 4 10.424CAMDEN 1 780 0.00 6.45 8 13.477CAPE MAY 3 8120 0.00 7.11 1 10.861CUMBERLAND 5 10122 1.21 7.96 3 13.983ESSEX 9 143 0.37 6.52 8 13.137GLOUCESTER 3 140 0.00 8.00 2 10.062HUDSON 4 7151 1.51 4.97 6 12.586HUNTERDON 4 10114 0.93 5.45 1 9.161MERCER 1 24300 0.00 5.76 5 15.894MIDDLESEX 13 17215 0.16 4.76 6 10.746MONMOUTH 6 53670 0.00 6.63 5 12.965MORRIS 3 6101 0.00 4.83 4 5.804OCEAN 10 563 0.26 6.65 4 11.024PASSAIC 10 18303 0.00 5.07 3 14.023SALEM 0 440 0.00 10.35 1 15.841SOMERSET 5 18231 1.67 4.94 1 12.041SUSSEX 3 342 0.79 4.96 2 0.262UNION 2 34560 0.00 6.24 5 12.775WARREN 6 13191 0.00 5.55 2 16.962
22 7 0.13 1163 40NW Region
NE Region
CW Region
CE Region
South Region
State Total
10.345.14
24 8 0.78 5.09 11.8852 27 20
11
18
10 5 7 664 521.09 5.38 14.54
31 8 20 20150 1090.20 6.14 11.77
21 5 23 22177 1221.94 6.68 11.80
108 33 81 77506 3500.78 6.05 11.83
User Name: HALDEMAN, ANNMARIE Page 1 of 1

Communicable Disease Reportingand Surveillance System
02/20/2018 9:19 AMNJ ACTIVE INFLUENZA-LIKE ILLNESS SURVEILLANCE STATISTICSSURVEILLANCE DATE: 02/13/2018
County
RSV Tests Rapid Flu Tests
# P
osi
tive
# P
osi
tive
To
tal
Tes
tsP
erfo
rmed
To
tal
Tes
tsP
erfo
rmed
February 13, 2018 MMWR WEEK 7ATLANTIC 331 510136BERGEN 20219 1188398BURLINGTON 00 13020CAMDEN 130 645141CAPE MAY 111 24778CUMBERLAND 100 482123ESSEX 29713 1247193GLOUCESTER 10 38184HUDSON 16117 573151HUNTERDON 20515 20558MERCER 513 856316MIDDLESEX 11610 528164MONMOUTH 35256 902232MORRIS 522 24062OCEAN 00 409135PASSAIC 459 744256SALEM 00 00SOMERSET 00 00SUSSEX 00 00UNION 36014 404WARREN 221 224
12
49
18
80
2
161
119
660
256
828
68
1931
322
742
374
535
582
2555
1006
3008
1061
1879
2395
9349
NW Region
NE Region
CW Region
CE Region
South Region
State Total
User Name: HALDEMAN, ANNMARIE Page 1 of 1