NIWA Client report
70
Patterns and rates of recent sedimentation and intertidal vegetation changes in the Kaipara Harbour 35 4 Results 4.1 Sediment core profiles In this section we describe the physical characteristics (i.e., sediment fabric, particle size, bulk density) of each core, SAR and mixing depths estimated from the radioisotope profiles. The principles and application of radioisotope methods to the dating of sediment deposits is described in Appendix 8.2. 4.1.1 Site KAI-1 (southern Kaipara) Site KAI-1 is located ~2 km north-west of the Kaipara River mouth on the lower-intertidal flat flanking the main navigation channel in the southern Kaipara Harbour (Fig. 3.1). Three sediment cores 95 cm to 152-cm long were collected at this site. The x-radiographs for core KAI-1B show a range of sediment fabrics, from bioturbated fine- sandy muds and shell layers to sequences of finely laminated silts and sands below 60-cm depth (Fig. 4.1). Note that in these inverted x-ray images, relatively high density objects such as carbonate shells and quartz sands appear white whereas lower-density organic material (e.g., plant fragments) and/or fluid/fine-grained muds are identified as darker grey– black areas.
Transcript of NIWA Client report

Patterns and rates of recent sedimentation and intertidal vegetation changes in the Kaipara Harbour 35
4 Results
4.1 Sediment core profiles In this section we describe the physical characteristics (i.e., sediment fabric, particle size, bulk density) of each core, SAR and mixing depths estimated from the radioisotope profiles. The principles and application of radioisotope methods to the dating of sediment deposits is described in Appendix 8.2.
4.1.1 Site KAI-1 (southern Kaipara) Site KAI-1 is located ~2 km north-west of the Kaipara River mouth on the lower-intertidal flat flanking the main navigation channel in the southern Kaipara Harbour (Fig. 3.1). Three sediment cores 95 cm to 152-cm long were collected at this site.
The x-radiographs for core KAI-1B show a range of sediment fabrics, from bioturbated fine-sandy muds and shell layers to sequences of finely laminated silts and sands below 60-cm depth (Fig. 4.1). Note that in these inverted x-ray images, relatively high density objects such as carbonate shells and quartz sands appear white whereas lower-density organic material (e.g., plant fragments) and/or fluid/fine-grained muds are identified as darker grey–black areas.

36 Patterns and rates of recent sedimentation and intertidal vegetation changes in the Kaipara Harbour
Figure 4-1: Kaipara Harbour: definition of compartments used to map changes in intertidal vegetated habitats.
Patterns and rates of recent sedimentation and intertidal vegetation changes in the Kaipara Harbour 37
The top 30-cm or so of the core is composed of partly-mixed fine sands and silts. Discrete areas of intact laminated beds occur (e.g., 10-cm depth), which indicate that sediment mixing by animals and/or physical process has not been sufficient to homogenise these sediments.
A layer of cockle-shell valves (Austrovenus stutchburyi) occurs at 18-20-cm depth. A muddy-sand unit at 68–76-cm depth preserves evidence of cm- diameter animal burrows that have infilled with lower-density muds. These partly-mixed sands and muds are replaced by finely-laminated alternating layers of mud and sand below 60-cm depth, which persist to the bottom of the core at 152-cm depth. Individual mud (grey-black) and sand (white) parallel layers vary in thickness from < 1 mm to ~1 cm. This type of fine-scale, interlayered bedding, otherwise known as rhythmites, can be produced by regular changes in sediment transport rate and/or sediment supply. These changes can occur over short time scales (e.g., tides) or relate to longer-term climatic fluctuations, such as seasonal changes in river sediment loads (Reineck and Singh 1980).
The x-radiographs show that the rhythmites are gradually replaced by partially mixed mud and sand above 70-cm depth. This trend may also reflect a change in local hydrodynamic conditions over time as the intertidal flat has evolved. In particular a local increase in sea-bed elevation due to sedimentation substantially changes tidal inundation and current regimes (i.e., ebb- and flood-tide dominance, reduced peak current speeds) and wave fetch. In this scenario the dominant sediment transport process on the emerging intertidal flat shifts from tidal currents to short-period estuarine waves that become increasingly effective at resuspending/mixing bed sediments (e.g., Green et al. 1997).
These rhythmites may have been formed gradually over hundreds of years or so or they may have been deposited rapidly over the space of several years. Unfortunately, the geochronology of these deposits cannot be ascertained because they are older than the 210Pb and 137Cs-dated sediments. These deposits are too regular and numerous to be the result of episodic flood events (c.f. site KAI-14) and therefore were most likely formed by tidal currents.
The sediment profiles for KAI-1A show how the physical characteristics of the sediments change with depth below the sediment–water interface (Fig 4.2). Mean particle diameter (Dmean) gradually increases towards the surface, from ~40 m (coarse silt) at 120-cm depth to ~80 m (very-fine sand) in the top 5-cm of the sediment column. Mud content shows a corresponding decrease from 80–90% to 30% (Fig 4.2a and b). The dry bulk sediment density (DBD) profile for the top-50 cm of the core does not display any clear trend with depth, with values varying between 0.64 and 0.89 g cm-3 (Fig 4.2c). This is typical for mixed-size estuarine sediments as de-watering and compaction is minimal in the top metre or so of the sediment column. Excess 210Pb (210Pbex) and 137Cs occur to 30-cm depth in core KAI-1A. The surface-mixed layer (SML) is identified by the presence of 7Be in sediments and is detected to 5-cm depth (Fig. 4.2d and e).

38 Patterns and rates of recent sedimentation and intertidal vegetation changes in the Kaipara Harbour
Figure 4-2: Core KAI-1A (Intertidal flat, south Kaipara Harbour) sediment profiles: (a) particle size statistics – mean (red), median (blue) and standard deviation; (b) percentage mud by sample volume; (c) dry-bulk sediment density; (d) excess 210Pb concentration profile with 95% confidence intervals, time-averaged sediment accumulation rate (SAR) and coefficient of determination (r2) derived from fit to data (red line), maximum 7Be depth and maximum 137Cs depth; (e) 137Cs concentration profile with 95% confidence intervals and time-averaged SAR shown. Note: The surface-mixed layer (SML) is defined by the maximum 7Be depth. The 137Cs SAR is estimated after subtraction of the 7Be mixing depth.
The 210Pb SAR estimated for the accumulation zone below the SML is 4.5 mm yr-1 (r2 = 0.96, Fig. 4.2d) and is very similar to the 137Cs SAR of 4.9 mm yr-1 (Fig. 4.2e). The close agreement between the two SAR estimates supports the sediment dating for this site.
The residence time of sediment in the SML before it is removed by burial can be estimated from the maximum 7Be depth and 210Pb SAR as 50 mm/4.5 mm yr-1 = 11 years. In adopting this approach we assume that the sediment mixing depth has been constant over time.
4.1.2 Site KAI-2 (southern Kaipara) Site KAI-2 is located ~4 km north-west of the Kaipara River mouth on the lower-intertidal flat seaward of Opahekeheke Island in the southern Kaipara Harbour (Fig. 3.1). Three sediment cores 68 cm to 91-cm long were collected at this site.
The x-radiographs for core KAI-2A display a range of sediment fabrics. The top-most 5- cm of the core is composed of mud-rich sediments (Fig 4.3). The sand content of sediment below this surface layer is higher as indicated by the lighter-coloured appearance. There is also a general trend of increasing sand content with depth. Sediments in the upper 50-cm of the core have a mottled appearance, indicative of partial mixing by infauna, although pockets of intact bedding remain. Mud-filled worm burrows up to several mm in diameter and orientated vertically are common in the sand unit below 50 cm depth.
0 100 2000
20
40
60
80
100
120
140
160
D (m)
Dep
th (c
m)
0 50 100Mud (%)
0.1 1 10 100
210Pbex
(Bq kg-1)
210Pb SAR:
4.5 mm yr-1
r2 = 0.96
137Cs max.
7Be max.
0 1DBD (g cm-3)
0.1 1
137Cs (Bq kg-1)
137Cs SAR:
4.9 mm yr-1
(a) (b) (c) (d) (e)
SML

Patterns and rates of recent sedimentation and intertidal vegetation changes in the Kaipara Harbour 39
Figure 4-3: X-radiograph of core KAI-2A, southern Kaipara Harbour.
40 Patterns and rates of recent sedimentation and intertidal vegetation changes in the Kaipara Harbour
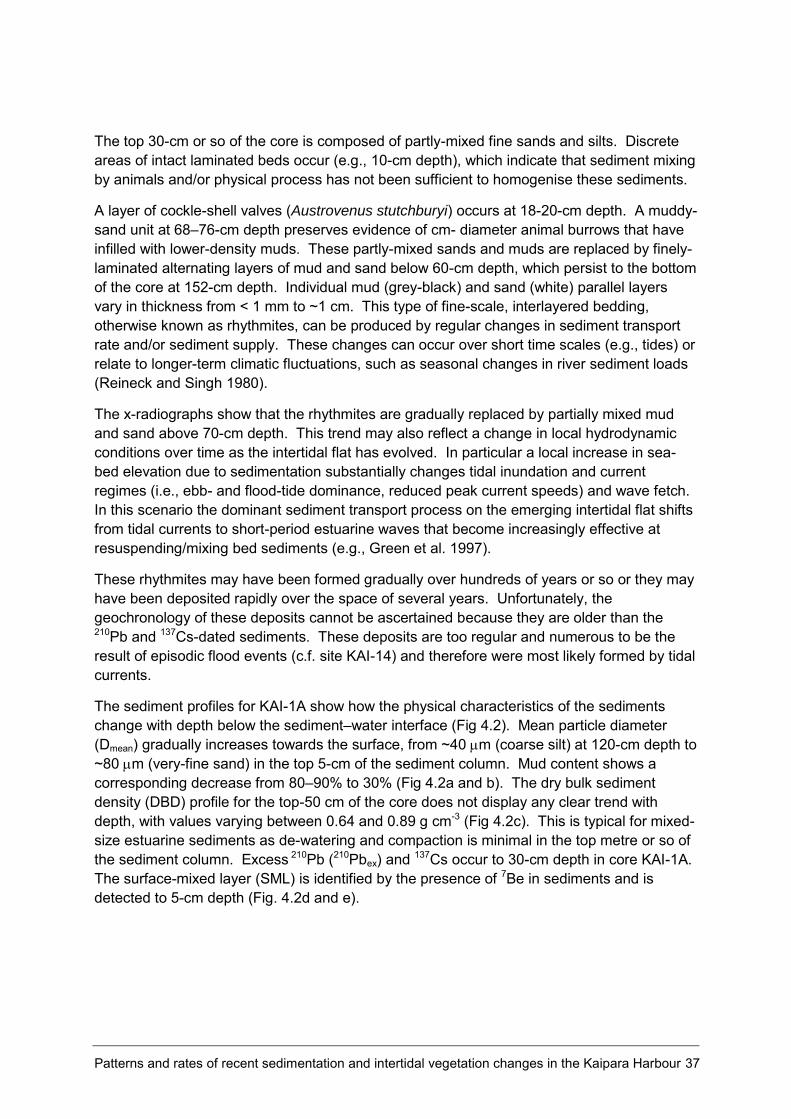
The sediment profiles for KAI-2 indicate a substantial change in type and rate of sedimentation at this site (Fig. 4.4). Mean particle diameter of ~130 m (fine sand) in the lower section of the core rapidly reduces to ~60 m (coarse silt) above 60-cm depth (Fig. 4.4a). Correspondingly, the mud content of sediments increases from less than 10% in the sand layer below 60-cm depth to 60% in the overlying bioturbated sandy mud unit (Fig. 4.4b). The DBD values for sediments to 60-cm depth vary from 0.72 to 1.04 g cm-3 (Fig 4.4c).
The 210Pbex profile at site KAI-2 is more complex in form than at site KAI-1, with an apparent ten-fold increase in SAR from 3.6mm yr-1 to ~30 mm yr-1 occurring during the last decade. This increase in accumulation rate is indicated by an abrupt change in slope of the 210Pbex profile at 20-cm depth (Fig. 4.4d).
Figure 4-4: Core KAI-2B (Intertidal flat, south Kaipara Harbour) sediment profiles: (a) particle size statistics – mean (red), median (blue) and standard deviation; (b) percentage mud by sample volume; (c) dry-bulk sediment density; (d) excess 210Pb concentration profile with 95% confidence intervals, time-averaged sediment accumulation rate (SAR) and coefficient of determination (r2) derived from fit to data (red line), maximum 7Be depth and maximum 137Cs depth; (e) 137Cs concentration profile with 95% confidence intervals and time-averaged SAR shown. Note: The surface-mixed layer (SML) is defined by the maximum 7Be depth. The 137Cs SAR is estimated after subtraction of the 7Be mixing depth.
The 137Cs profile extends to at least 35-cm depth and spans this apparent increase in 210Pbex SAR. The estimated 137Cs SAR of 6.5 mm yr-1 is consistent with a shift to a higher SAR indicated by the 210Pbex profile (Fig. 4.4e). This type of 210Pbex profile can also occur by other means other than increased sediment delivery to an estuary. In particular, downward mixing or younger sediments (with higher 210Pbex concentrations) by bioturbation over years-decades can increase the slope of the 210Pbex profile, indicating an apparent rather than an actual increase in sedimentation rate. The 7Be profile at KAI-2 is relatively shallow, extending to 1-cm depth, which indicates mixing of surficial sediment re-suspension by tides
0 100 2000
20
40
60
80
100
120
140
160
D (m)
Dep
th (c
m)
0 50 100Mud (%)
0.1 1 10 100
210Pbex
(Bq kg-1)
210Pb SAR:
3.6 mm yr-1
r2 = 0.97
137Cs max.
7Be max.210Pb SAR:
29.7 mm yr-1
r2 = 0.51
0 1DBD (g cm-3)
0.1 1
137Cs (Bq kg-1)
137Cs SAR:
6.5 mm yr-1
(a) (b) (c) (d) (e)
SML

Patterns and rates of recent sedimentation and intertidal vegetation changes in the Kaipara Harbour 41
and/or waves rather than bioturbation. The x-radiograph shows also some intact bedding at depth, so that bioturbation alone is unlikely to explain the 210Pbex profile. Alternatively, an increase in SAR can occur due to changes in local conditions such as a change in sediment transport versus deposition rates and the effects of geomorphological adjustments. For example, lateral shifts in tidal- channel position can locally increase sedimentation rates. This type of 210Pbex profile has also been observed in the Mahurangi Harbour, near Hamilton’s Landing, where a long term pattern of tidal-channel meandering has been reconstructed from hydrographic charts and sediment-core data (Swales et al. 1997, 2002). On balance, the data for site KAI-2 suggests that the observed increase in 210Pbex SAR more likely reflects a local change in net accumulation rate rather than sediment mixing.
The residence time of sediment in the 7Be SML is relatively short due to the high SAR and is estimated at 10 mm/30 mm yr-1 (SML/SAR)= 0.33 years.
4.1.3 Site KAI-3 (southern Kaipara) Site KAI-3 is located on a large intertidal bank east of the Kaipara River channel in the in the southern Kaipara Harbour (Fig. 3.1). Three sediment cores 132 cm to 137-cm long were collected at this site.
The x-radiographs for core KAI-3B have a mottled appearance, indicative of partial mixing of denser/coarser sands (light-grey–white) with lower density muds (dark grey–black) (Fig. 4.5). Traces of animal burrows can be seen through-out the core, particularly in sandy sediments where burrows up to 1-cm diameter have filled with lower-density mud (e.g., 70-90 cm depth).
The sediment profiles for KAI-3A show a gradual shift from sand to mud deposition at this site, with Dmean reducing from of ~150 m (fine sand) in the bottom of the core to ~110 m (very-fine sand) in near-surface sediments (Fig. 4.6a) and mud content increasing from less than 2% to ~20% (Fig. 4.6b). The DBD values for sediments vary from 0.67 to 1.2 g cm-3, depending on sediment composition (Fig. 4.6c).
Excess 210Pb occurs to 60-cm depth in core KAI-3A, with an estimated SAR of 7.2 mm yr-1. The data area relatively “noisy” as indicated by the fit of the log-linear regression (r2 = 0.67, Fig. 4.6d). 137Cs occur to 40-cm depth and labels sediments deposited since the early 1950s. The 137Cs SAR of 6.1 mm yr-1 is similar to the 210Pb estimate (Fig. 4.6e). The close agreement between the two SAR estimates supports the sediment dating for this site.

42 Patterns and rates of recent sedimentation and intertidal vegetation changes in the Kaipara Harbour
Figure 4-5: X-radiograph of core KAI-3B, southern Kaipara Harbour. Note the uneven exposure of x-ray images between sections due to changes in sediment composition.
The residence time of sediment in the SML before it is removed by burial is estimated from the maximum 7Be depth (i.e., 30 mm) and 210Pb SAR as 30 mm/7.2 mm yr-1 = 4.2 years.

Patterns and rates of recent sedimentation and intertidal vegetation changes in the Kaipara Harbour 43
Figure 4-6: Core KAI-3A (Intertidal bank, south Kaipara Harbour) sediment profiles: (a) particle size statistics – mean (red), median (blue) and standard deviation; (b) percentage mud by sample volume; (c) dry-bulk sediment density; (d) excess 210Pb concentration profile with 95% confidence intervals, time-averaged sediment accumulation rate (SAR) and coefficient of determination (r2) derived from fit to data (red line), maximum 7Be depth and maximum 137Cs depth; (e) 137Cs concentration profile with 95% confidence intervals and time-averaged SAR shown. Note: The surface-mixed layer (SML) is defined by the maximum 7Be depth. The 137Cs SAR is estimated after subtraction of the 7Be mixing depth.
4.1.4 KAI-4 (southern Kaipara) Site KAI-4 is located ~5 km north of the Kaipara River mouth on the lower intertidal flat flanking the eastern shore of the southern Kaipara Harbour (Fig. 3.1). Two sediment cores 83 cm and 142-cm long were collected at this site.
The x-radiographs for core KAI-4B show discrete changes in sediment composition with depth (Fig 4.7). Mud-rich sediments (0–20 cm depth) overlay more sandy sediments. The base of this sand unit contains densely packed cockle valves (36–46 cm). Mixing at the interface of the mud and sand units (15–24-cm depth), most likely by infauna, is evident. Below the shell layer, the sediments are composed of muds, which extend to the base of the core at 80-cm depth.
0 100 2000
20
40
60
80
100
120
140
160
D (m)
Dep
th (c
m)
0 50 100Mud (%)
0.1 1 10 100
210Pbex
(Bq kg-1)
210Pb SAR:
7.2 mm yr-1
r2 = 0.67
137Cs max.
7Be max.
0 1DBD (g cm-3)
0.1 1
137Cs (Bq kg-1)
137Cs SAR:
6.1 mm yr-1
(a) (b) (c) (d) (e)
SML

44 Patterns and rates of recent sedimentation and intertidal vegetation changes in the Kaipara Harbour
Figure 4-7: X-radiograph of core KAI-4B, southern Kaipara Harbour.

Patterns and rates of recent sedimentation and intertidal vegetation changes in the Kaipara Harbour 45
The sediment profiles for KAI-4A further reveal the abrupt changes in sediment composition indicated by the x-radiographs. In fact, core KAI-4A reveals a sequence of mud and sand units: mud (0-20 cm); sand (20–45 cm); mud (45–95 cm); sand (95–135 cm) and mud (135 cm –) (Fig. 4.8a). The mud content of these sediments varies from less than 4% to as much as 100% (Fig. 4.8b). The DBD values for sediments in the top 50-cm of the core vary from 0.56 to 0.81 g cm-3 (Fig 4.8c).
Figure 4-8: Core KAI-4A (Intertidal bank, south Kaipara Harbour) sediment profiles: (a) particle size statistics – mean (red), median (blue) and standard deviation; (b) percentage mud by sample volume; (c) dry-bulk sediment density; (d) excess 210Pb concentration profile with 95% confidence intervals, time-averaged sediment accumulation rate (SAR) and coefficient of determination (r2) derived from fit to data (red line), maximum 7Be depth and maximum 137Cs depth; (e) 137Cs concentration profile with 95% confidence intervals and time-averaged SAR shown. Note: The surface-mixed layer (SML) is defined by the maximum 7Be depth. The 137Cs SAR is estimated after subtraction of the 7Be mixing depth.
Excess 210Pb and 137Cs occur to 25-cm depth in the top-most mud unit (Fig 4.8d). The 210Pb SAR of 4.3 mm yr-1 (r2 = 0.96, Fig. 4.8d) is very similar to the 137Cs SAR value of 4.4 mm yr-1
(Fig. 4.8e). The close agreement between the two SAR estimates supports the sediment dating for this site. The residence time of sediment in the SML before it is removed by burial is estimated from the maximum 7Be depth (i.e., 30 mm) and 210Pb SAR as 30 mm/4.3 mm yr-1 = 7 years.
4.1.5 Site KAI-5 (southern Kaipara) Site KAI-5 is located on mid-intertidal flats near the confluence of the Puhareke Creek and Kaipara River channel, southern Kaipara Harbour (Figs. 2.2 and 3.1). Two sediment cores up to 152-cm long were collected at this site.
0 100 2000
20
40
60
80
100
120
140
160
D (m)
Dep
th (c
m)
0 50 100Mud (%)
0.1 1 10 100
210Pbex
(Bq kg-1)
210Pb SAR:
4.3 mm yr-1
r2 = 0.96
137Cs max.
7Be max.
0 1DBD (g cm-3)
0.1 1
137Cs (Bq kg-1)
137Cs SAR:
4.4 mm yr-1
(a) (b) (c) (d) (e)
SML

46 Patterns and rates of recent sedimentation and intertidal vegetation changes in the Kaipara Harbour
The x-radiographs for core KAI-5B display a range of sediment fabrics, from small-ripple cross-bedding in surficial sediments (< 5 cm depth), interlayered, finely-laminated muds and sands (12–22 cm depth), low-density muds (88–94 cm depth) and bioturbated sands with worm-burrow traces (125–150 cm depth) (Fig. 4.9).
The sediment profiles for KAI-5A preserve evidence of an abrupt shift from predominantly sand to mud deposition between 70 and 60-cm depth. This is most clearly shown by the particle size and per cent mud profiles (Figs. 4.10a–b). Mean particle diameter in the sand unit below 70-cm depth is in the range 164–195 m (fine sand) with a mud content less than 4%. By comparison, Dmean values in the overlying mud layer is in the range 22–65 m (med–coarse silt) with a mud content of 46–100%. Within the mud layer, there is also a gradual reduction in particle size towards the surface (Figs. 4.10a). Figure 4.10a also shows that median particle diameter exceeds the mean value in some sediment samples where the particle-size distribution is skewed towards the fine tail (i.e., large proportion of small particles). The mud content of the sediments also increases abruptly above 70-cm depth from less than 5% to 70–100% (Fig. 4.10b). The DBD values in the upper 70 cm of the core of 0.48 to 0.68 g cm-3 are typical of low-density clay-rich muds (Fig 4.10c).
Excess 210Pb occurs to 70-cm depth in core KAI-5A (Fig 4.10d). A notable feature of the 210Pbex profile is zone of uniform concentration (~18 Bq kg-1) at 12–22 cm depth. This unconformity in the 210Pbex profile can occur due to rapid mixing or deposition of sediment at the sea bed. On an intertidal flat, bed erosion/re-working and re-deposition by waves during an extreme wind-storm event is the most likely mechanism for rapid mixing of bed sediments. For example, 210Pbex data from the southern Firth of Thames indicated that storms during the winter of 1978 eroded the intertidal flat to a depth of 40 cm (Swales et al. 2007). Rapid deposition of terrigenous sediments, delivered during high river discharge (storm) events can also produce this type of unconformity. Both sets of physical drivers (i.e., strong winds and flood runoff) occur simultaneously during storms and in both cases sediments are typically deposited over relatively short time scales (e.g., hours–days). Closer examination of the x-radiograph shows that the unconformity at 12–22 cm depth coincides with finely laminated mud (< 1-cm thick) and sand (< 2 mm thick) layers.

Patterns and rates of recent sedimentation and intertidal vegetation changes in the Kaipara Harbour 47
Figure 4-9: X-radiograph of core KAI-5B, Puharekereke Creek mouth, southern Kaipara Harbour.

48 Patterns and rates of recent sedimentation and intertidal vegetation changes in the Kaipara Harbour
Figure 4-10: Core KAI-5A (Intertidal bank, mouth of Puharakeke Creek, south Kaipara Harbour) sediment profiles: (a) particle size statistics – mean (red), median (blue) and standard deviation; (b) percentage mud by sample volume; (c) dry-bulk sediment density; (d) excess 210Pb concentration profile with 95% confidence intervals, time-averaged sediment accumulation rate (SAR) and coefficient of determination (r2) derived from fit to data (red line), maximum 7Be depth and maximum 137Cs depth; (e) 137Cs concentration profile with 95% confidence intervals and time-averaged SAR shown. Note: The surface-mixed layer (SML) is defined by the maximum 7Be depth. The 137Cs SAR is estimated after subtraction of the 7Be mixing depth.
Sediment accumulation rates estimated above (4.8 mm yr-1) and below (4.3 mm yr-1) the unconformity in the 210Pbex profile are very similar (Fig. 4.10d). Extrapolation of the 210Pb SAR suggests that the event layer at 12–22 cm depth was deposited in the late 1970s/early 1980s. 137Cs occurs to 41-cm depth, with an estimated SAR of 6.7 mm yr-1 being substantially higher than the 210Pb estimate (Fig. 4.10e).
The residence time of sediment in the SML before it is removed by burial is estimated from the maximum 7Be depth (i.e., 30 mm) and 210Pb SAR as 50 mm/4.8 mm yr-1 = 10.4 years.
4.1.6 Sites KAI-6 and 6A (southern Kaipara) Site KAI-6 and 6A are located on the lower-intertidal flats flanking the eastern shore of the southern Kaipara Harbour near Oyster Point and approximately 3 km south east of Shelly Beach (Fig. 3.1). Poor weather on 16 March 2010 necessitated re-sampling the following day at Site KAI-6A, which is located approximately 50 m north east of KAI-6. In total, four sediment cores 84 cm to 170-cm long were collected at these two sites.
The x-radiographs for core KAI-6(B) show that the intertidal sediments at this site are composed of laminated alternating layers of mud and sand (Fig 4.11). Individual mud (grey-black) and sand (white) layers vary in thickness from < 1 mm to as much as 4 cm. This type of interlayered bedding, otherwise known as Rhythmites, can be produced by regular
0 100 2000
20
40
60
80
100
120
140
160
D (m)
Dep
th (c
m)
0 50 100Mud (%)
0.1 1 10 100
210Pbex
(Bq kg-1)
210Pb SAR:
4.3 mm yr -1
r2 = 0.89
137Cs max.
7Be max.210Pb SAR:
4.8 mm yr -1
r2 = 0.96
0 1DBD (g cm-3)
0.1 1
137Cs (Bq kg-1)
137Cs SAR:
6.7 mm yr -1
(a) (b) (c) (d) (e)
SML

Patterns and rates of recent sedimentation and intertidal vegetation changes in the Kaipara Harbour 49
changes in sediment transport rate and/or sediment supply. These changes can occur over short time scales (e.g., tides) or relate to longer-term climatic fluctuations, such as seasonal changes in wave climate and river sediment loads and deposition (Reineck and Singh 1980). The high-degree of stratigraphic preservation in this core, over a long period of time (i.e., hundreds of years) indicates that bioturbation of these sediments has been negligible. Similar, although finer bedding is observed at site KAI-1.
The sediment profiles for KAI-6A, due to the relatively large sampling intervals, do not adequately represent the fine-scale structure revealed by the x-radiographs. Mean particle diameter in the sand layers vary from 110 to 170 m (very-fine to fine sand), while the mud layers are largely composed of fine-medium silts. The mud content of the sand layers is typically less than 10% (Figs. 4.12a and b). Dry bulk sediment density varies from 0.77 g cm-
3 (mud layers) to 1.7 g cm-3 (sand layers, Fig 4.12c).
Excess 210Pb and 137Cs labelled sediments are limited to the upper 21-cm of core KAI-6A. The 210Pb SAR of 2 mm yr-1 (r2 = 0.98, Fig. 4.12d) is substantially lower than the 4.6 mm yr-1 estimated from the 137Cs profile (Fig. 4.12e) so that the geochronology for this site cannot be considered reliable.
The short-lived 7Be was not detected in surficial sediments, which is consistent with their low mud content. This, in addition to the relatively low 210Pb SAR and the thick sequence of well-preserved laminated mud and sand beds at this site is consistent with an intertidal flat environment exposed to frequent cycles of sediment resuspension and redeposition by waves.

50 Patterns and rates of recent sedimentation and intertidal vegetation changes in the Kaipara Harbour
Figure 4-11: X-radiograph of core KAI-6A(B), lower intertidal flat at Oyster Point, southern Kaipara Harbour. Note, the vertical offset in beds below 80-cm depth down the right-hand side of the core is an artefact of core collection and/or storage.

Patterns and rates of recent sedimentation and intertidal vegetation changes in the Kaipara Harbour 51
Figure 4-12: Core KAI-6A (Intertidal flat, Oyster Point, south Kaipara Harbour) sediment profiles: (a) particle size statistics – mean (red), median (blue) and standard deviation; (b) percentage mud by sample volume; (c) dry-bulk sediment density; (d) excess 210Pb concentration profile with 95% confidence intervals, time-averaged sediment accumulation rate (SAR) and coefficient of determination (r2) derived from fit to data (red line), maximum 7Be depth and maximum 137Cs depth; (e) 137Cs concentration profile with 95% confidence intervals and time-averaged SAR shown. Note: The surface-mixed layer (SML) is defined by the maximum 7Be depth. The 137Cs SAR is estimated after subtraction of the 7Be mixing depth.
4.1.7 Site KAI-7 (southern Kaipara) Site KAI-7 is located on an intertidal bank approximately 2 km east of Shelly Beach an immediately north of a low-lying salt-marsh/mangrove island (Fig. 3.1). Two sediment cores 47 cm and 67-cm long were collected at this site.
The x-radiographs for core KAI-7B show that the intertidal sediments at this site are composed of muddy fine sands. An abrupt change in sediment density occurs at 10-cm depth. A mixture of sand and water (grey–black on x-ray image) occupies the surface layer whereas more compact sands occur below 10-cm depth (Fig. 4.13). A shell layer composed of cockle valves also occurs at 38–42 cm depth.
The sediment profiles for KAI-7A reflect the sediment fabric revealed by the x-radiographs. Particle size and mud content are relatively uniform with depth, with sediments composed of homogenous fine sands. The mud content in the surface layer (5–10%) is higher than in the compact sand (< 2%) below 10-cm depth (Figs. 4.14a–b).
0 100 2000
20
40
60
80
100
120
140
160
D (m)
Dep
th (c
m)
0 50 100Mud (%)
0.1 1 10 100
210Pbex
(Bq kg-1)
137Cs max.210Pb SAR:
2.0 mm yr -1
r2 = 0.98
0 1DBD (g cm-3)
0.1 1
137Cs (Bq kg-1)
137Cs SAR:
4.6 mm yr -1
(a) (b) (c) (d) (e)
SML

52 Patterns and rates of recent sedimentation and intertidal vegetation changes in the Kaipara Harbour
Figure 4-13: X-radiograph of core KAI-7A, intertidal bank east of Shelly Beach, southern Kaipara Harbour.
Patterns and rates of recent sedimentation and intertidal vegetation changes in the Kaipara Harbour 53
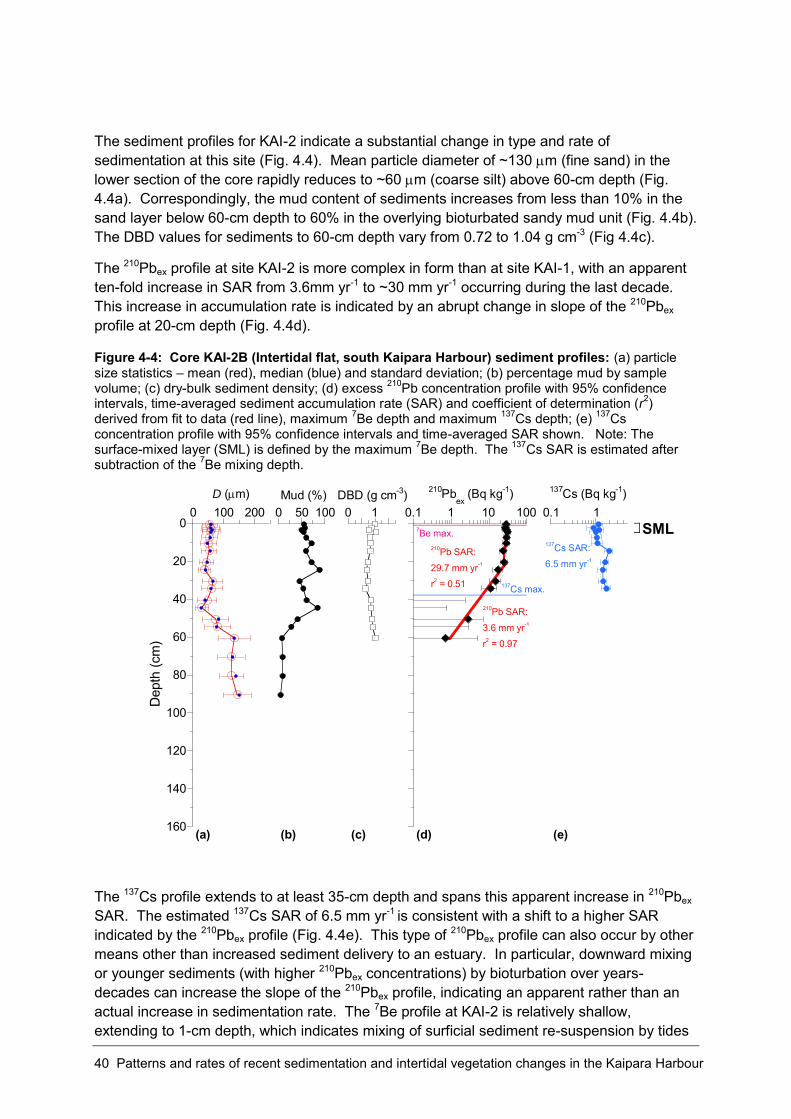
Figure 4-14: Core KAI-7A (Intertidal bank, east of Shelly Beach, south Kaipara Harbour) sediment profiles: (a) particle size statistics – mean (red), median (blue) and standard deviation; (b) percentage mud by sample volume; (c) dry-bulk sediment density; (d) excess 210Pb concentration profile with 95% confidence intervals, time-averaged sediment accumulation rate (SAR) and coefficient of determination (r2) derived from fit to data (red line), maximum 7Be depth and maximum 137Cs depth; (e) 137Cs concentration profile with 95% confidence intervals and time-averaged SAR shown. Note: The surface-mixed layer (SML) is defined by the maximum 7Be depth. The 137Cs SAR is estimated after subtraction of the 7Be mixing depth.
Dry bulk sediment density in the fluid sand surface layer at 0.77–1.0 g cm-3 is substantially lower than in the compact sand (1.3–1.59 g cm-3) below 10-cm depth (Fig 4.14c). These sediment data indicate a surface mixed layer (SML) of intensely and frequently reworked sands extending to 10-cm depth.
The effect of the relatively higher mud content in the SML can be seen in the 210Pbex and 137Cs profiles, with concentration peaks occurring at 4–5 cm depth (Figs. 4.14d–e). Below the SML, sediments are rapidly accumulating. The 210Pb SAR of 8.3 mm yr-1 (r2 = 0.96, Fig. 4.14d) is similar to 137Cs SAR (6.7 mm yr-1, Fig. 4.14e). The 210Pbex profile is also deeper (to 50-cm) than the 137Cs profile (to 37 cm). The close agreement between the two SAR estimates supports the sediment dating for this site. 7Be is absent from the fluid/sand SML, however if we assume an SML of 10 cm based on the sediment data then the residence time of sediment in the SML before it is removed by burial is estimated from the 210Pb SAR as 100 mm/8.3 mm yr-1 = 12 years.
0 100 2000
20
40
60
80
100
120
140
160
D (m)
Dep
th (c
m)
0 50 100Mud (%)
0.1 1 10 100
210Pbex
(Bq kg-1)
137Cs max.
210Pb SAR:
8.3 mm yr -1
r2 = 0.96
0 1DBD (g cm-3)
0.1 1
137Cs (Bq kg-1)
137Cs SAR:
6.7 mm yr -1
(a) (b) (c) (d) (e)
SML

54 Patterns and rates of recent sedimentation and intertidal vegetation changes in the Kaipara Harbour
4.1.8 Site KAI-9 (Omokoiti Flats) Site KAI-9 is located on the mid-intertidal of the Omokoiti Flats, approximately 1.5 km north east of the Taumata Creek mouth (Fig. 3.1). Three sediment cores 83, 90 and 155-cm long were collected at this site.
The x-radiographs for core KAI-9B show that the intertidal sediments at this site are composed of a diverse range of sediment fabrics (Fig. 4.15). These include a compact fine sand SML (0–12 cm), lenticular bedding with discontinuous pockets of finely laminated muds and sands (i.e., ripples, 12–35 cm depth), shell layer composed of disarticulated shell valves and fragments (35–55 cm depth) and partly mixed muddy sands (55–82 cm).
The sediment profiles (to 50-cm depth) for KAI-9A also reflect the sediment fabric revealed by the x-radiographs. The SML is composed of fine sands (range mean diameter 143–156 m) with mud content less than 2% (Figs. 4.16a–b). Below the SML, the particle-size data do not adequately describe the fine-scale variations in the laminated mud and sand, however the mud content increases with depth (i.e., < 25 %). Dry bulk sediment density in the SML, composed of compacted sands, is 1.3–1.6 g cm-3 , which is higher than in the underlying laminated muddy sands (0.9–1.1 g cm-3) below 12-cm depth (Fig 4.16c).
Excess 210Pb occurs to 11-cm depth in the SML (Fig. 4.16d), although with no systematic decline in concentration with depth so that we were unable to estimate SAR at this site. This is most likely the result of intense and frequent sediment mixing in the surface layer. 7Be was detected to 1-cm depth and reflects recent atmospheric deposition (i.e., days–weeks) of this radioisotope. 137Cs was not detected in the core due to: (1) the low mud content in the SML; and (2) the fact that (unlike the naturally occurring 210Pb and 7Be), atmospheric deposition of 137Cs derived from nuclear weapons tests has not occurred in New Zealand since the mid 1980s (Matthews 1989). Thus, the presence of 137Cs in surface sediments will only occur where 137Cs-labelled muds are deposited at a site. The potential sources of these labelled muds are re-suspension of estuarine deposits and/or eroded catchment topsoil.
The sediment profiles at site KAI-9 are consistent with an intertidal-flat exposed to frequent cycles of sediment resuspension and redeposition by waves.

Patterns and rates of recent sedimentation and intertidal vegetation changes in the Kaipara Harbour 55
Figure 4-15: X-radiograph of core KAI-9B, mid-intertidal zone, Omokoiti Flats, Kaipara Harbour.

56 Patterns and rates of recent sedimentation and intertidal vegetation changes in the Kaipara Harbour
Figure 4-16: Core KAI-9A (Mid-intertidal flat, Omokoiti Flats, Kaipara Harbour) sediment profiles: (a) particle size statistics – mean (red), median (blue) and standard deviation; (b) percentage mud by sample volume; (c) dry-bulk sediment density; (d) excess 210Pb concentration profile with 95% confidence intervals, No fit to data.
4.1.9 Site KAI-10 (Omokoiti Flats) Site KAI-10 is located on the lower-intertidal zone of the Omokoiti Flats, approximately 3.5 km north east of the Taumata Creek mouth (Fig. 3.1). Two sediment cores 50 and 56-cm long were collected at this site.
The x-radiographs and sediment profiles for core KAI-10B are characteristic of a wave-exposed intertidal flat. Sediments are predominantly fine sands (Dmean = 150–170 m), with discrete layers of disarticulated shell valves and shell fragments (10–20, 25–40 cm depth). Occasional traces of large infauna burrows are also present (20-cm depth) (Figs. 4.17, 4.18a). Mud content is also low, being less than 3% in the top 50 cm of the core (Fig 4.18b). Dry bulk sediment density is in the range 1.1–1.6 g cm-3 (Fig 4.18c).
Excess 210Pb occurs to 13-cm depth, with relatively uniform concentrations to 7-cm identifying the depth of the SML (Fig 4.18d). The sediment accumulation rate at this site, estimated from the 210Pbex profile is 1 mm yr-1 (r2 = 0.61), which is substantially lower than the 2.6 mm yr-1 estimated from the 137Cs profile (Fig 4.18e). The relatively poor fit of the210Pbex regression model and the poor agreement between the two dating methods makes the geochronology at this site uncertain.
0 100 2000
20
40
60
80
100
120
140
160
D (m)
Dep
th (c
m)
0 50 100Mud (%)
0.1 1 10 100
210Pbex
(Bq kg-1)
210Pb SAR: No fit to data.
7Be max.
0 1DBD (g cm-3)
(a) (b) (c) (d)

Patterns and rates of recent sedimentation and intertidal vegetation changes in the Kaipara Harbour 57
Figure 4-17: X-radiograph of core KAI-10B, lower-intertidal zone, Omokoiti Flats, Kaipara Harbour.

58 Patterns and rates of recent sedimentation and intertidal vegetation changes in the Kaipara Harbour
Figure 4-18: Core KAI-10A (Lower intertidal zone, Omokoiti Flats, Kaipara Harbour) sediment profiles: (a) particle size statistics – mean (red), median (blue) and standard deviation; (b) percentage mud by sample volume; (c) dry-bulk sediment density; (d) excess 210Pb concentration profile with 95% confidence intervals, time-averaged sediment accumulation rate (SAR) and coefficient of determination (r2) derived from fit to data (red line), maximum 7Be depth and maximum 137Cs depth; (e) 137Cs concentration profile with 95% confidence intervals and time-averaged SAR shown. Note: The surface-mixed layer (SML) is defined by the maximum 7Be depth. The 137Cs SAR is estimated after subtraction of the 7Be mixing depth.
4.1.10 Site KAI-14 (Kakarai Flats, Hoteo) Site KAI-14 is located on the lower-intertidal zone of the Kakarai Flats, approximately 2 km west of the Hoteo River mouth (Fig. 3.1). Two sediment cores 146 cm and 147-cm long were collected at this site.
The x-radiographs for KAI-14B display a range of estuarine sediment textures as previously described. The bulk of the core is composed of fine sands, although discrete mud layers up to ~6-cm thick occur at frequent intervals down the core: 30–32 cm; 41–43 cm; 50–51 cm; 54–58 cm; 72–88 cm; 91–93 cm; 105–106 cm and 126–128 cm (Fig. 4.19). Some of these mud units consist of two layers separated by a thin sand layer.
0 100 2000
20
40
60
80
100
120
140
160
D (m)
Dep
th (c
m)
0 50 100Mud (%)
0.1 1 10 100
210Pbex
(Bq kg-1)
137Cs max.
210Pb SAR:
1 mm yr -1
r2 = 0.61
0 1DBD (g cm-3)
0.1 1
137Cs (Bq kg-1)
137Cs SAR:
2.6 mm yr -1
(a) (b) (c) (d) (e)

Patterns and rates of recent sedimentation and intertidal vegetation changes in the Kaipara Harbour 59
Figure 4-19: X-radiograph of core KAI-14B, lower-intertidal zone, Kakarai Flats, Kaipara Harbour.
The mud unit at 72–88 cm depth actually consists of many very-fine laminated sand and mud layers a millimetre or less thick. Some of these mud units contain the traces of animals

60 Patterns and rates of recent sedimentation and intertidal vegetation changes in the Kaipara Harbour
burrows filled with denser sands (i.e., lighter coloured) from the under and overlying sediments (e.g., 54–58 cm). Traces of mm-scale worm burrows can also be seen in the sand layers. This sediment fabric is the same as that observed in the x-radiographs at site KAI-1 near the Kaipara River mouth. The high degree of preservation of the mud layers also indicates that sediment mixing by infauna has had a minor effect.
Sediment profiles show that the sand units are composed of slightly-muddy fine sands (Dmean = 125–150 m), with mud content less than 10% (Figs. 4.20a–b). The mud content increases to 50% at 80 cm depth, within in the finely laminated bed at 72–88-cm depth. However, the sampling increment is too coarse to resolve the fine detail shown in the x-radiograph. Dry bulk sediment density in the top 50-cm of the cores is in the range 0.9–1.4 g cm-3 (Fig. 4.20c).
Figure 4-20: Core KAI-14B (lower-intertidal zone, Kakarai Flats, Kaipara Harbour) sediment profiles: (a) particle size statistics – mean (red), median (blue) and standard deviation; (b) percentage mud by sample volume; (c) dry-bulk sediment density; (d) excess 210Pb concentration profile with 95% confidence intervals, time-averaged sediment accumulation rate (SAR) and coefficient of determination (r2) derived from fit to data (red line), maximum 7Be depth and maximum 137Cs depth; (e) 137Cs concentration profile with 95% confidence intervals and time-averaged SAR shown. Note: The surface-mixed layer (SML) is defined by the maximum 7Be depth. The 137Cs SAR is estimated after subtraction of the 7Be mixing depth.
The 210Pbex profile extends to 41-cm depth in KAI-14A and is slightly deeper than for the 137Cs profile (to 35 cm). (Figs. 4.20d–e). 7Be was not detected in this core. Below The SML extends to about 2-cm depth, as indicated by the presence of a high-density sand layer in the x-radiograph. Sediments are rapidly accumulating at this site. The 210Pb SAR of 6.8 mm yr-1 (r2 = 0.89, Fig. 4.20d) is also very similar to 137Cs SAR value (6.5 mm yr-1, Fig. 4.20e).
The close agreement between these two SAR estimates as well as the largely intact core stratigraphy provides a high degree of confidence in the dating of this core. The numerous
0 100 2000
20
40
60
80
100
120
140
160
D (m)
Dep
th (c
m)
0 50 100Mud (%)
0.1 1 10 100
210Pbex
(Bq kg-1)
137Cs max.
210Pb SAR:
6.8 mm yr -1
r2 = 0.89
0 1DBD (g cm-3)
0.1 1
137Cs (Bq kg-1)
137Cs SAR:
6.5 mm yr -1
(a) (b) (c) (d) (e)

Patterns and rates of recent sedimentation and intertidal vegetation changes in the Kaipara Harbour 61
mud layers present at various depths in KAI-14 most likely represent storm layers deposited during flood discharges from the nearby Hoteo River.
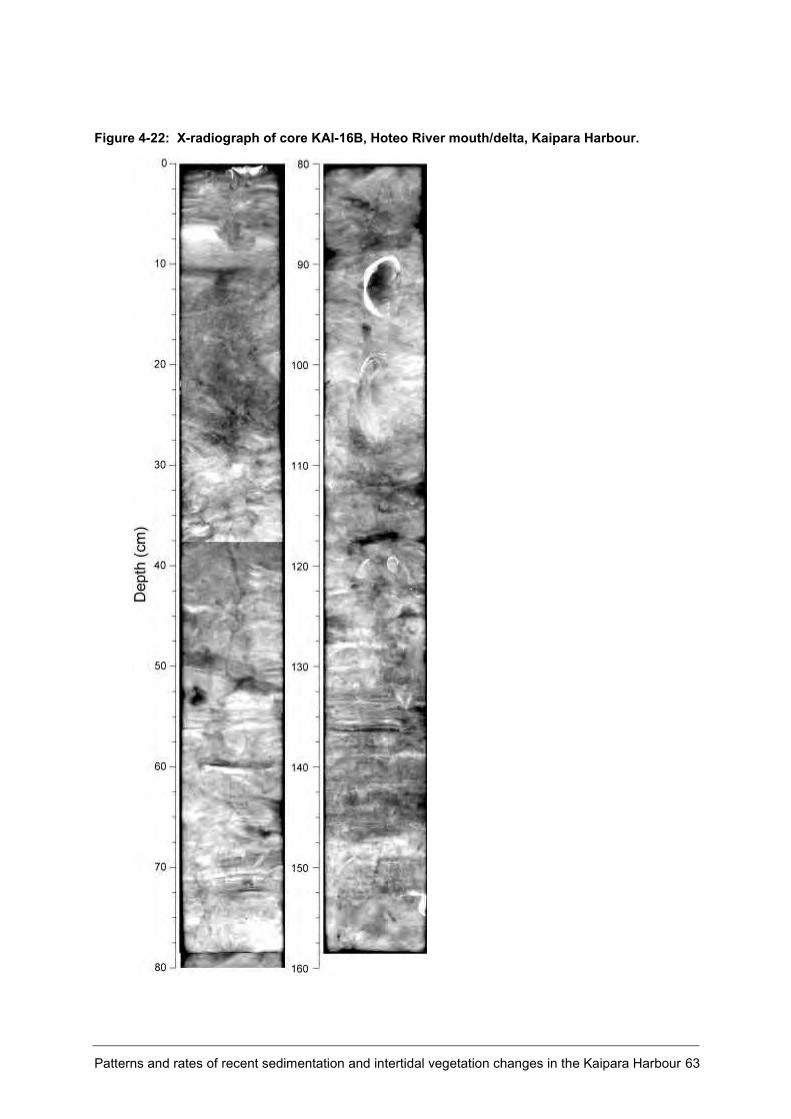
4.1.11 Site KAI-16 (Hoteo River mouth) Site KAI-16 is located on the Hoteo River delta, about 300 m south east of Breach Point (Figs. 3.1 and 4.21). Three sediment cores 152 cm, 154 cm and 175-cm long were collected at this site.
Figure 4-21: Hoteo River delta, March 2009. Core site KAI-16 is located near the bottom right corner of the photo on the north (left) side of the channel (Photo: A. Swales, NIWA).
The x-radiographs for KAI-16B provide a detailed record of mud and fine sand deposition in a deltaic sedimentary environment (Fig. 4.22). Finely-laminated mud and sand layers are common although less distinct than at sites KAI-1 and KAI-14. Crossing bedding and continuous beds inclined from the horizontal, and occasionally in opposite directions (e.g., 60–70 cm), are also evident as occur in channel-bank deposits subject to lateral migration (Reineck and Singh 1980). Traces of mm-scale worm burrows can be seen in the core but these are rare, which suggests that the sediment fabric is the result of physical rather than biological processes. Mud layers can be seen at various depths (10–11, 48–50, 68–70, 83–84, 106–108, 112–114, 131–132 and 138–140 cm) although they are more diffuse than at site KAI-14 on the intertidal-sand flat seaward of the river mouth. The mud units in KAI-16B are less distinct because of the much higher mud content of this delta deposit in comparison to the sand flat (KAI-14). Shell valves and fragments are rare, although a single large pipi (Paphies australis) valve occurs at 85–90 cm depth.

62 Patterns and rates of recent sedimentation and intertidal vegetation changes in the Kaipara Harbour
The sediments profiles for KAI-16A confirm that these deltaic deposits are composed of muddy very-fine sands. The Dmean and mud content of these sediments vary from 43 to 89 m and 21–69% respectively (Figs. 4.23a–b). The DBD values in the top 110-cm of the core vary from 0.54 to 0.98 g cm-3, with no discernible effects of compaction with depth being apparent (Fig 4.23c).
Excess 210Pb occurs to at least 110-cm depth in core KAI-16A (Fig 4.23d). It is possible that the 210Pbex profile extends tens of cm below this depth, however the estimated SAR of 21 mm yr-1 is supported by a comprehensive data set (r2 = 0.75, n = 22, Fig. 4.23d). 137Cs also occurs to 110-cm depth, so that the estimated SAR of 19 mm yr-1 is a minimum value (Fig. 4.23e). As noted for KAI-14, the close agreement between these two independent SAR estimates as well as the largely intact core stratigraphy provides a high degree of confidence in the dating of this core. 7Be occurs to 5-cm depth, which coincides with a set of well-preserved finely-laminated muds and sands. These data indicate that these surficial sediments have been deeply reworked by tidal currents and/or waves.
The residence time of sediment in the SML before it is removed by burial is estimated from the maximum 7Be depth and 210Pb SAR as 50 mm/21 mm yr-1 = 2.4 years.
Patterns and rates of recent sedimentation and intertidal vegetation changes in the Kaipara Harbour 63
Figure 4-22: X-radiograph of core KAI-16B, Hoteo River mouth/delta, Kaipara Harbour.

64 Patterns and rates of recent sedimentation and intertidal vegetation changes in the Kaipara Harbour
Figure 4-23: Core KAI-16A (delta deposits, Hoteo River mouth, Kaipara Harbour) sediment profiles: (a) particle size statistics – mean (red), median (blue) and standard deviation; (b) percentage mud by sample volume; (c) dry-bulk sediment density; (d) excess 210Pb concentration profile with 95% confidence intervals, time-averaged sediment accumulation rate (SAR) and coefficient of determination (r2) derived from fit to data (red line), maximum 7Be depth and maximum 137Cs depth; (e) 137Cs concentration profile with 95% confidence intervals and time-averaged SAR shown. Note: The surface-mixed layer (SML) is defined by the maximum 7Be depth. The 137Cs SAR is estimated after subtraction of the 7Be mixing depth.
4.1.12 Site KAI-17 (Tauhoa River mouth) Site KAI-17 is located at Te Raupa Creek, which is on the west bank of the Tauhoa River mouth (Figs. 3.1). Two sediment cores 139 cm and 145-cm long were collected from the lower-intertidal zone at this site.
The x-radiographs for KAI-17B provide a detailed record of deposition at this site (Fig. 4.24). Finely-laminated (i.e., mm scale) mud and sand layers characterise most of the core and is particularly well defined in the top 85-cm. Between 85 and 127 cm, the sediments have a mottled appearance indicative of bioturbated sediments and abundant traces of cm-scale burrows can be seen cross-cutting the bedding at 105–115-cm depth.
0 100 2000
20
40
60
80
100
120
140
160
D (m)
Dep
th (c
m)
0 50 100Mud (%)
0.1 1 10 100
210Pbex
(Bq kg-1)
137Cs max.
7Be max.
210Pb SAR:
21.4 mm yr -1
r2 = 0.75
0 1DBD (g cm-3)
0.1 1
137Cs (Bq kg-1)
137Cs SAR:
> 19 mm yr -1
(a) (b) (c) (d) (e)
SML

Patterns and rates of recent sedimentation and intertidal vegetation changes in the Kaipara Harbour 65
Figure 4-24: X-radiograph of core KAI-17B, Tauhoa River mouth, Kaipara Harbour.
66 Patterns and rates of recent sedimentation and intertidal vegetation changes in the Kaipara Harbour
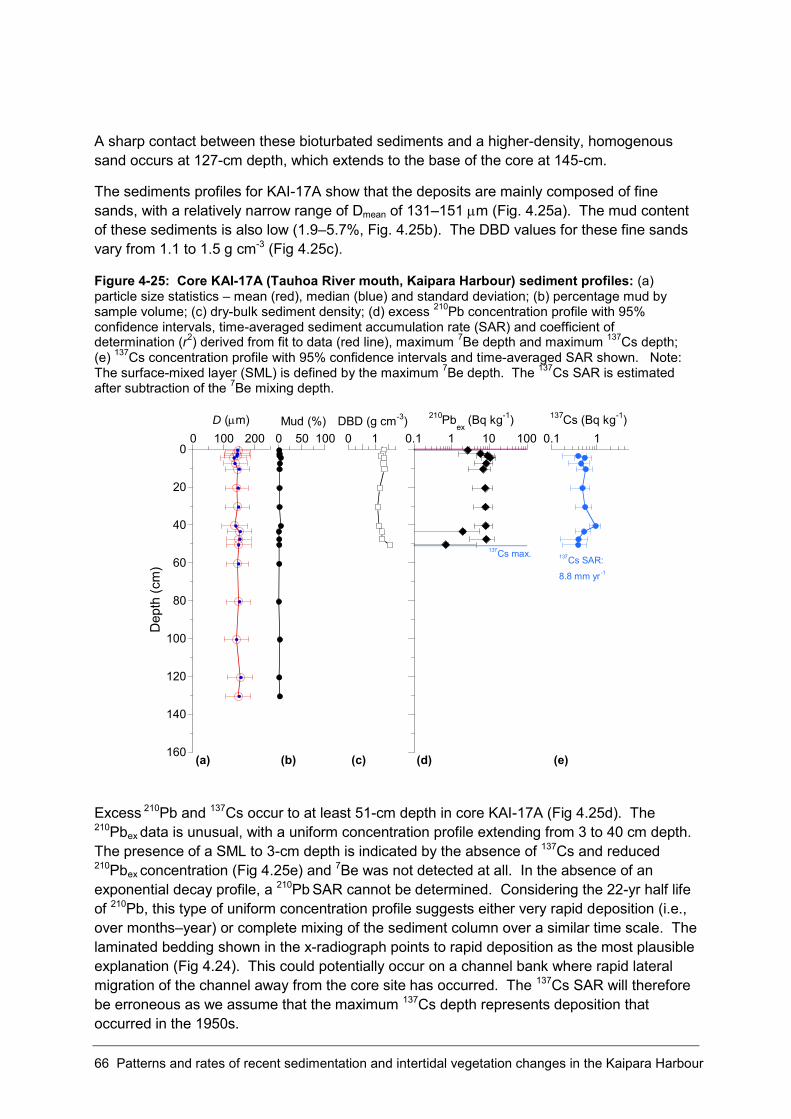
A sharp contact between these bioturbated sediments and a higher-density, homogenous sand occurs at 127-cm depth, which extends to the base of the core at 145-cm.
The sediments profiles for KAI-17A show that the deposits are mainly composed of fine sands, with a relatively narrow range of Dmean of 131–151 m (Fig. 4.25a). The mud content of these sediments is also low (1.9–5.7%, Fig. 4.25b). The DBD values for these fine sands vary from 1.1 to 1.5 g cm-3 (Fig 4.25c).
Figure 4-25: Core KAI-17A (Tauhoa River mouth, Kaipara Harbour) sediment profiles: (a) particle size statistics – mean (red), median (blue) and standard deviation; (b) percentage mud by sample volume; (c) dry-bulk sediment density; (d) excess 210Pb concentration profile with 95% confidence intervals, time-averaged sediment accumulation rate (SAR) and coefficient of determination (r2) derived from fit to data (red line), maximum 7Be depth and maximum 137Cs depth; (e) 137Cs concentration profile with 95% confidence intervals and time-averaged SAR shown. Note: The surface-mixed layer (SML) is defined by the maximum 7Be depth. The 137Cs SAR is estimated after subtraction of the 7Be mixing depth.
Excess 210Pb and 137Cs occur to at least 51-cm depth in core KAI-17A (Fig 4.25d). The 210Pbex data is unusual, with a uniform concentration profile extending from 3 to 40 cm depth. The presence of a SML to 3-cm depth is indicated by the absence of 137Cs and reduced 210Pbex concentration (Fig 4.25e) and 7Be was not detected at all. In the absence of an exponential decay profile, a 210Pb SAR cannot be determined. Considering the 22-yr half life of 210Pb, this type of uniform concentration profile suggests either very rapid deposition (i.e., over months–year) or complete mixing of the sediment column over a similar time scale. The laminated bedding shown in the x-radiograph points to rapid deposition as the most plausible explanation (Fig 4.24). This could potentially occur on a channel bank where rapid lateral migration of the channel away from the core site has occurred. The 137Cs SAR will therefore be erroneous as we assume that the maximum 137Cs depth represents deposition that occurred in the 1950s.
0 100 2000
20
40
60
80
100
120
140
160
D (m)
Dep
th (c
m)
0 50 100Mud (%)
0.1 1 10 100
210Pbex
(Bq kg-1)
137Cs max.
0 1DBD (g cm-3)
0.1 1
137Cs (Bq kg-1)
137Cs SAR:
8.8 mm yr -1
(a) (b) (c) (d) (e)

Patterns and rates of recent sedimentation and intertidal vegetation changes in the Kaipara Harbour 67
4.1.13 Site KAI-20 (Arapaoa River) The Arapaoa River is one of several large tidal-creeks that occur in the Northern Kaipara Harbour (Figs. 3.1). The main channel is ~13 km long and aligned south-east – north-west. The channel is flanked by numerous infilled embayments with extensive intertidal flats. Sediment cores were collected from five sites in these embayments. Site KAI-20 is located near the mouth of the Arapaoa River system in the Hororako Creek and ~200 m east of Whakapirau Point. Three sediment cores 125 cm, 126 cm and 155-cm long were collected from the lower-intertidal zone at this site.
The x-radiographs for KAI-20B display a range of sediment fabrics: shell-rich sands (0–30 cm depth) with a possible SML (0–12 cm depth) consisting of dense sands, low-density muds (30–60 cm depth) and bioturbated muddy sands with numerous worm burrows filed with mud (Fig. 4.26). Shell material includes cockle valves and fragments and occasional gastropods, such as the turret-shaped screw-shell Maoriculpus roseus.
The sediments profiles for KAI-20A mirror the bulk characteristics observed in the x-radiograph. The particle size profiles show that a well-sorted fine-sand occupies the top 12-cm of the core (Dmean = 134–150 m) with a mud content less than 3% (Figs. 4.27a–b). This sand unit grades into a sandy mud at 30–80 cm depth (Dmean = 45–90 m, mud content =27–75%), with the bioturbated muddy sand (Dmean = 84–110 m, mud content =20–28%) below this mud layer to the base of the core at 160 cm. Sediment DBD values decline linearly from the surface (1.4 g cm-3) to 40-cm depth (0.7 g cm-3, Fig 4.27c), mirroring the decline in particle size in this depth range.
Excess 210Pb and 137Cs occurs to 11-cm depth in core KAI-20A (Fig 4.27d). The regression-model fit to the 210Pbex data is poor (r2= 0.37).The 210Pb SAR value of 12.2 mm yr-1 is also several times higher than the 137Cs SAR estimate (1.8 mm yr-1), such that we have a low degree of confidence in the sediment dating at this site. 7Be occurs to 1-cm depth in the core (Figs. 4.27d–e). The 210Pbex coincides with the well-sorted fine-sand unit with low mud content that occupies the top 12-cm of the core. It is possible that these sediments represent a partially mixed surface layer, so that the 210Pbex profile exhibits a steep decay profile due to mixing rather than sedimentation.

68 Patterns and rates of recent sedimentation and intertidal vegetation changes in the Kaipara Harbour
Figure 4-26: X-radiograph of core KAI-20B, Tauhoa River mouth, Kaipara Harbour.

Patterns and rates of recent sedimentation and intertidal vegetation changes in the Kaipara Harbour 69
Figure 4-27: Core KAI-20A (Hororako Creek, Arapaoa River, north Kaipara Harbour) sediment profiles: (a) particle size statistics – mean (red), median (blue) and standard deviation; (b) percentage mud by sample volume; (c) dry-bulk sediment density; (d) excess 210Pb concentration profile with 95% confidence intervals, time-averaged sediment accumulation rate (SAR) and coefficient of determination (r2) derived from fit to data (red line), maximum 7Be depth and maximum 137Cs depth; (e) 137Cs concentration profile with 95% confidence intervals and time-averaged SAR shown. Note: The surface-mixed layer (SML) is defined by the maximum 7Be depth. The 137Cs SAR is estimated after subtraction of the 7Be mixing depth.
4.1.14 Site KAI-21 (Arapaoa River) Site KAI-21 is located in an embayment on the west side of the Arapaoa River channel between Puriri and Te Kopua Points (Figs. 3.1). Three sediment cores 91 cm, 157 cm and 165-cm long were collected from the lower-intertidal zone at this site.
The x-radiographs for KAI-21B display a range of sediment fabrics: a shell-lagged (i.e., cockles) surface layer of fine sands (0–6 cm depth) which caps a sandy mud (6–30 cm depth) (Fig. 4.28). Below this depth, the core has a mottled appearance with bedding not well developed, although present as isolated patches. A distinct sand layer (5-mm thick) can be seen at 120-cm depth. However, traces of infauna burrows are rare. Occasional shell valves and fragments are present throughout the core.
0 100 2000
20
40
60
80
100
120
140
160
D (m)
Dep
th (c
m)
0 50 100Mud (%)
0.1 1 10 100
210Pbex
(Bq kg-1)
137Cs max.7Be max.
210Pb SAR:
12.2 mm yr -1
r2 = 0.37
0 1DBD (g cm-3)
0.1 1
137Cs (Bq kg-1)
137Cs SAR:
1.8 mm yr -1
(a) (b) (c) (d) (e)
SML

70 Patterns and rates of recent sedimentation and intertidal vegetation changes in the Kaipara Harbour
Figure 4-28: X-radiograph of core KAI-21B, Arapaoa River, Kaipara Harbour.

Patterns and rates of recent sedimentation and intertidal vegetation changes in the Kaipara Harbour 71
The sediments profiles for KAI-21A show a rapid decline in particle size from the surface to 20-cm depth. The mean particle diameter decreases from 125 m to 42 m, while mud content increasing from 10 to 70% (Figs. 4.29a–b). The sediment composition is relatively homogenous below this depth, with Dmean varying from 19–52 m (medium–coarse silt) and mud content of 60–100%. Sediment DBD values gradually decline from the surface (0.85 g cm-3) to 50-cm depth (0.61 g cm-3, Fig. 4.29c).
The 210Pbex profile extends to 21-cm depth in KAI-21A, which is twice the depth of the 137Cs profile (to 9 cm). (Figs. 4.29d–e). 7Be was not detected in the core. The 210Pb SAR of 2 mm yr-1 (r2 = 0.75) is similar to the 137Cs value of 1.6 mm yr-1 and this provides some confidence in the sediment dating at this site.
Figure 4-29: Core KAI-21A (Arapaoa River, north Kaipara Harbour) sediment profiles: (a) particle size statistics – mean (red), median (blue) and standard deviation; (b) percentage mud by sample volume; (c) dry-bulk sediment density; (d) excess 210Pb concentration profile with 95% confidence intervals, time-averaged sediment accumulation rate (SAR) and coefficient of determination (r2) derived from fit to data (red line), maximum 7Be depth and maximum 137Cs depth; (e) 137Cs concentration profile with 95% confidence intervals and time-averaged SAR shown. Note: The surface-mixed layer (SML) is defined by the maximum 7Be depth. The 137Cs SAR is estimated after subtraction of the 7Be mixing depth.
4.1.15 Site KAI-22 (Arapaoa River) Site KAI-22 is located in the Raepere Creek on the west side of the Arapaoa River channel (Figs. 3.1). Two sediment cores 132 cm and 161-cm long were collected from the mid-intertidal zone at this site.
0 100 2000
20
40
60
80
100
120
140
160
D (m)
Dep
th (c
m)
0 50 100Mud (%)
0.1 1 10 100
210Pbex
(Bq kg-1)
137Cs max.
210Pb SAR:
2.0 mm yr -1
r2 = 0.75
0 1DBD (g cm-3)
0.1 1
137Cs (Bq kg-1)
137Cs SAR:
1.6 mm yr -1
(a) (b) (c) (d) (e)
SML

72 Patterns and rates of recent sedimentation and intertidal vegetation changes in the Kaipara Harbour
Core KAI-22B preserves a detailed record of sedimentation at this site. The x-radiographs suggest that the processes of sediment deposition at the site have varied substantially over time (Fig. 4.30). A surface layer of laminated sediments (0–6-cm depth overly cockle-shell valves and fragments (6–23 cm depth). A sharp contact and transition to very-finely laminated muds (23–30 cm depth) occurs at the base of the shell layer. Differences in grey-scale values are small, which suggests subtle differences in particle size within this laminated mud. Another cockle-shell layer (30–34 cm depth) occurs below the laminated mud and is underlain by a featureless mud (34–42-cm depth). This is replaced by well-preserved laminated sediments (42–60 cm depth). Individual mud layers 1–2 cm thick are separated by mm-thick sand layers, which appear light grey/white in the image. A sharp contact with a cockle shell layer (60–70-cm depth) occurs at the base of these laminated beds. The remainder of the core (70–163-cm depth) is composed of mud with rare cockle-shell valves and fragments. This unit has a mottled appearance that suggests a degree of sediment mixing. With the exception of a thin sand layer at the base of the core, there is little evidence of bedding in this mud and traces of mm-scale worm burrows can be seen.

Patterns and rates of recent sedimentation and intertidal vegetation changes in the Kaipara Harbour 73
Figure 4-30: X-radiograph of core KAI-22B, Raepere Creek, Arapaoa River, Kaipara Harbour.

74 Patterns and rates of recent sedimentation and intertidal vegetation changes in the Kaipara Harbour
The sediments profiles for KAI-22A show a rapid transition from muddy very-fine sands in near-surface sediments (Dmean = 74–127 m, mud content 12–26%) to mud (Dmean = 11–41 m, mud content 75–100%) below 15-cm depth (Figs. 4.31a–b). Sediment DBD values vary from 0.49 g cm-3 to 0.98 g cm-3 in the top 50-cm of the core (Fig. 4.31c).
Figure 4-31: Core KAI-22A (Raepere Creek, Arapaoa River, north Kaipara Harbour) sediment profiles: (a) particle size statistics – mean (red), median (blue) and standard deviation; (b) percentage mud by sample volume; (c) dry-bulk sediment density; (d) excess 210Pb concentration profile with 95% confidence intervals, time-averaged sediment accumulation rate (SAR) and coefficient of determination (r2) derived from fit to data (red line), maximum 7Be depth and maximum 137Cs depth; (e) 137Cs concentration profile with 95% confidence intervals and time-averaged SAR shown. Note: The surface-mixed layer (SML) is defined by the maximum 7Be depth. The 137Cs SAR is estimated after subtraction of the 7Be mixing depth.
The excess 210Pb profile extends to 31-cm depth in core KAI-22A. The data indicate an apparent change in SAR at 15-cm depth (Fig 4.31d), which coincides with the transition from mud to fine-sand deposition (Figs. 4.31a–b). The log-linear regression models fitted to these data yield 210Pb SAR of 1.9 mm yr-1 (r2 = 0.98) and 3.4 mm yr-1 (r2 = 1) below and below 15-cm depth. 137Cs occurs to 21-cm depth (Fig. 4.31e) which spans the transition to a higher sedimentation regime indicated by the 210Pbex data. The 137Cs SAR of 3.3 mm yr-1 is similar to the 210Pb SAR value above 15-cm depth. 7Be occurs to 4-cm depth and coincides with the finely-laminated muds and sands. These data are consistent with a SML produced by wave re-suspension.
The residence time of sediment in the SML before it is removed by burial is estimated from the maximum 7Be depth and 210Pb SAR as 40 mm/3.4 mm yr-1 = 12 years.
0 100 2000
20
40
60
80
100
120
140
160
D (m)
Dep
th (c
m)
0 50 100Mud (%)
0.1 1 10 100
210Pbex
(Bq kg-1)
137Cs max.
210Pb SAR:
1.9 mm yr -1
r2 = 0.98
7Be max. 210Pb SAR:
3.4 mm yr -1
r2 = 1
0 1DBD (g cm-3)
0.1 1
137Cs (Bq kg-1)
137Cs SAR:
3.3 mm yr -1
(a) (b) (c) (d) (e)
SML

Patterns and rates of recent sedimentation and intertidal vegetation changes in the Kaipara Harbour 75
4.1.16 Site KAI-23 (Arapaoa River) Site KAI-23 is located in the Kirikiri Inlet on the west side of the Arapaoa River channel (Figs. 3.1). Two sediment cores 134 cm and 170-cm long were collected from the mid-intertidal zone at this site.
The sediments deposited at site KAI-23 are similar to those described for site KAI-22, with alternating shell and mud layers in the upper ~80-cm of the sediment column. The x-radiographs for KAI-23B show: a surface layer composed of tightly-packed cockle-shell valves and fragments (0–28 cm depth, Fig. 4.32); mud with occasional cockle-shell valves (28–55 cm); a cockle-shell layer (55–62 cm depth); mud with occasional cockle-shell valves (62–74 cm); a cockle-shell layer (74–85 cm depth); homogenous mud with occasional shell valves of cockle and the large wedge shell (Macomona lilliana, 116-cm and 156-cm depth).
Particle-size data show that the surface shell layer is mixed with layers of very-fine sand and mud (Dmean = 22–144 m, mud content 17–100%, Fig. 4.33a–b). Below 20-cm depth, sediments are composed entirely of mud (Dmean = 10–21 m, mud content 100%). Sediment DBD values vary from 0.49 g cm-3 to 0.98 g cm-3 in the top 50-cm of the core (Fig. 4.33c).
Excess 210Pb occurs to 15-cm depth, within the surface shell layer (Fig 4.33d). The SAR estimated from the 210Pbex profile is 1.6 mm yr-1 (r2 = 0.94). 137Cs occurs to 17-cm depth (Fig. 4.33e), with an estimated SAR of 2.6 mm yr-1. This is substantially higher than the 210Pb SAR estimate so that the dating at this site is uncertain. The data do however indicate that the surface shell layer has accumulated over several decades. 7Be occurs to 4-cm depth, which suggests that the shell layer is actively reworked to this depth. Alternatively, 7Be-labelled sediments may be circulated through the upper few cm of the permeable surface shell layer by wave-driven flows.

76 Patterns and rates of recent sedimentation and intertidal vegetation changes in the Kaipara Harbour
Figure 4-32: X-radiograph of core KAI-23B, Kirikiri Inlet, Arapaoa River, Kaipara Harbour.

Patterns and rates of recent sedimentation and intertidal vegetation changes in the Kaipara Harbour 77
Figure 4-33: Core KAI-23A (Kirikiri Inlet, Arapaoa River, north Kaipara Harbour) sediment profiles: (a) particle size statistics – mean (red), median (blue) and standard deviation; (b) percentage mud by sample volume; (c) dry-bulk sediment density; (d) excess 210Pb concentration profile with 95% confidence intervals, time-averaged sediment accumulation rate (SAR) and coefficient of determination (r2) derived from fit to data (red line), maximum 7Be depth and maximum 137Cs depth; (e) 137Cs concentration profile with 95% confidence intervals and time-averaged SAR shown. Note: The surface-mixed layer (SML) is defined by the maximum 7Be depth. The 137Cs SAR is estimated after subtraction of the 7Be mixing depth.
4.1.17 Site KAI-24 (Arapaoa River) Site KAI-24 is located in the basin at the head of the Arapaoa River, west of Pahi township (Figs. 3.1). The basin receives runoff from Paparoa Stream and the Matakohe River. Three sediment cores 106 cm, 145 cm and 170-cm long were collected from the mid-intertidal zone at this site.
The x-radiographs for KAI-24C indicate a general trend of increasing mud content with depth (i.e., time), and a change from light coloured to darker-coloured sediment (Fig. 4.34). The sequence of sediment units are: a surface layer composed of sand with coarse sand particles and cockle-shell valves and fragments (0–10 cm depth); inter-layered cm-thick mud and sand beds (10–30 cm depth); shell layer composed of cockle shell and gastropods (i.e., whelks) at the base (30–50 cm depth). A large inclined burrow ~2-cm diameter occurs at 40-cm depth; mixed muddy-sand (50–60 cm depth); cockle-shell layer (60–64-cm depth); homogenous mud (64–94-cm depth); cockle-shell layer with rare screwshells (M. roseus, 94–112-cm depth); and mud with traces of worm burrows (112–166-cm depth) with abundant cockle-shell valves and fragments at 150–160 cm depth.
Particle-size data show that the underlying mud is capped by a 60-cm thick surface layer of fine sands (Fig. 4.35a). The mud content in this sand layer is less than 6% compared to 26–
0 100 2000
20
40
60
80
100
120
140
160
D (m)
Dep
th (c
m)
0 50 100Mud (%)
0.1 1 10 100
210Pbex
(Bq kg-1)
137Cs max.210Pb SAR:
1.6 mm yr -1
r2 = 0.94
7Be max.
0 1DBD (g cm-3)
0.1 1
137Cs (Bq kg-1)
137Cs SAR:
2.6 mm yr -1
(a) (b) (c) (d) (e)
SML

78 Patterns and rates of recent sedimentation and intertidal vegetation changes in the Kaipara Harbour
100% below 60-cm depth (Fig. 4.35b). Sediment DBD values vary from 1.1 g cm-3 to 1.5 g cm-3 in the top 20-cm of the core (Fig. 4.35c).
Excess 210Pb and 137Cs occur to 11-cm depth. The 210Pbex concentrations are uniform to 5-cm depth, which indicates that these sediments are well mixed (Fig 4.35d). There is insufficient data below this depth to estimate a 210Pb SAR. The maximum depth of 137Cs in the sediment is used to estimate a SAR of 2.6 mm yr-1 (Fig 4.35e) although this cannot be validated by the 210Pb data. 7Be occurs to 1-cm depth. The difference in the mixing depths indicated by the 7Be (half life = 53 days) and 210Pb (half life = 22 years) profiles may reflect different time scales for mixing (i.e., days–weeks versus years).

Patterns and rates of recent sedimentation and intertidal vegetation changes in the Kaipara Harbour 79
Figure 4-34: X-radiograph of core KAI-24C, Pahi, Arapaoa River, Kaipara Harbour.

80 Patterns and rates of recent sedimentation and intertidal vegetation changes in the Kaipara Harbour
Figure 4-35: Core KAI-24A (Pahi, Arapaoa River, north Kaipara Harbour) sediment profiles: (a) particle size statistics – mean (red), median (blue) and standard deviation; (b) percentage mud by sample volume; (c) dry-bulk sediment density; (d) excess 210Pb concentration profile with 95% confidence intervals, time-averaged sediment accumulation rate (SAR) and coefficient of determination (r2) derived from fit to data (red line), maximum 7Be depth and maximum 137Cs depth; (e) 137Cs concentration profile with 95% confidence intervals and time-averaged SAR shown. Note: The surface-mixed layer (SML) is defined by the maximum 7Be depth. The 137Cs SAR is estimated after subtraction of the 7Be mixing depth.
4.1.18 Site KAI-25 (Intertidal flats, Wairoa River mouth) Site KAI-25 is located on the intertidal flats east of the Wairoa River mouth and south of the Whakatu mangrove forest and oyster reefs previously described in section 2.3 (Figs. 3.1). The site was difficult to sample because the bed was composed of compact sands and the shallow water depth that limited the effectiveness of the gravity corer. Only one sediment core, 34-cm long, was successfully retrieved at this site.
The single core collected at this site was not x-ray imaged, however particle-size analysis was undertaken. Figures 4.36a–b show that the top 30-cm of the sea bed is composed of well-sorted fine sand (Dmean =155–162 m) with mud content less than 2%. Sediments at the base of the core are finer (Dmean =131 m, mud content 12%), which may indicate that these near-surface sand cap muddier sediments at depth. Dry bulk sediment densities vary between 0.9 and 1.7 g cm-3 (Fig. 4.36c).
0 100 2000
20
40
60
80
100
120
140
160
D (m)
Dep
th (c
m)
0 50 100Mud (%)
0.1 1 10 100
210Pbex
(Bq kg-1)
137Cs max.
7Be max.
210Pb SAR: No Fit.
0 1DBD (g cm-3)
0.1 1
137Cs (Bq kg-1)
137Cs SAR:
2.6 mm yr -1
(a) (b) (c) (d) (e)
SML

Patterns and rates of recent sedimentation and intertidal vegetation changes in the Kaipara Harbour 81
Figure 4-36: Core KAI-25A (Intertidal flats south of Whakatu mangrove forest, north Kaipara Harbour) sediment profiles: (a) particle size statistics – mean (red), median (blue) and standard deviation; (b) percentage mud by sample volume; (c) dry-bulk sediment density; (d) excess 210Pb concentration profile with 95% confidence intervals, no fit to data, maximum 7Be depth and maximum 137Cs depth; (e) 137Cs concentration profile with 95% confidence intervals and time-averaged SAR shown. Note: The surface-mixed layer (SML) is defined by the maximum 7Be depth. The 137Cs SAR is estimated after subtraction of the 7Be mixing depth.
Excess 210Pb and 137Cs occur to 11 cm and 13-cm depth respectively (Fig. 4.36d–e). The concentrations of both radioisotopes are low and variable, so that we could not reliably estimate the sediment accumulation rate at this site. 7Be was also not detected in the surficial sediments. The low & variable 210Pbex and 137Cs concentrations and low mud content indicate that bed sediments at site KAI-25 are frequently reworked by waves. Although silts and clays may temporarily be deposited at this site after storms, long-term accumulation does not occur.
4.2 Recent changes in vegetated intertidal habitats
4.2.1 Summary In this section we report on changes in the spatial extent of vegetated intertidal habitats since 1966/1977. These data are derived from GIS analysis of historical aerial photographs for each compartment of the Kaipara Harbour (section 3.6). Table 4.1 summarises the overall changes in the total areas of mangrove forest, salt marsh, mixed mangrove/salt marsh and sea grass (Zostera spp.) habitats in the harbour.
0 100 2000
20
40
60
80
100
120
140
160
D (m)
Dep
th (c
m)
0 50 100Mud (%)
0.1 1 10 100
210Pbex
(Bq kg-1)
137Cs max.
210Pb SAR: No Fit.
0 1DBD (g cm-3)
0.1 1
137Cs (Bq kg-1)
(a) (b) (c) (d) (e)

82 Patterns and rates of recent sedimentation and intertidal vegetation changes in the Kaipara Harbour
Table 4-1: Changes in the area (hectares) of major intertidal vegetation habitats in the Kaipara Harbour: 1977–2002 (Northland Region); 1966/1977–2007 (Auckland Region). Notes: (1) 1966 data for the South Head, Omokoiti Flats and South Kaipara compartments only. Data for the Oruawharo includes AC and NRC regions; (2) Mixed refers to habitat composed of mangrove and saltmarsh; (3) The sea grass % change estimate does not include 90.4 ha (2007) in the South Head compartment as no data were available for 1977.
Habitat Type
Auckland Northland Harbour - total
1966/1977 2007 % change 1977 2002 % change
2002/2007
Mangroves 4744.0 4661.0 -1.7 2101.1 2953.8 40.6 7614.8 Salt marsh 445.8 306.9 -31.1 238.5 352.6 47.8 659.5 Mixed 417.0 211.6 -49.3 – – – Sea grass – 358.5 – – –
This analysis indicates that the total area of mangrove habitat increased by 11% from an estimated 6845 ha in 1966/1977 to 7615 ha in 2002/2007. This estimated net increase includes the effects of large-scale reclamation works that substantially reduced the area of mangrove habitat in the South Kaipara and Omokoiti compartments. Differences in the years of aerial-photographic coverage between the Auckland and Northland regions makes direct comparisons problematic, however at the regional scale the data are unequivocal. The total area of mangrove in the Auckland region (Kaipara) has not substantially changed since 1966/1977. The apparent 1.7% reduction in mangrove area is likely within the errors of the analysis. This is particularly the case for identification of vegetation types from the small-scale black and white 1966/1977 aerial photography. A substantial increase in mangrove habitat has occurred in the Northland region of the Kaipara Harbour (41%), increasing from an estimated 2101 ha in 1977 to 2954ha in 2002. This estimate includes data from the Auckland Region for the Oruawharo compartment which straddles the regional boundary.
The total area of salt-marsh habitat in the Kaipara Harbour has reduced (-3.6%) from an estimated 684.3 ha (1966/1977) to 659.5 ha in 2002/2007, with all of this apparent reduction occurring in the Auckland region (-31%). By comparison the area of salt marsh in the Northland region has increased by 48% since the mid-1970s. Loss of salt marsh has historically occurred due to reclamation and by the landward expansion of mangrove forests. Displacement of salt-marsh habitat by mangrove (A. marina var. australasica) is a common mode of mangrove-forest expansion in south-east Australian estuaries. In New Zealand, mangrove forests more typically colonise bare intertidal flats, although landward expansion into salt marsh has been documented (Morrissey et al. 2010).
The area of mixed (mangrove and salt-marsh) habitat has also substantially reduced (-49%) in the Auckland region, from 417 ha (1966/1977) to 212 ha in 2007. The largest reductions in mixed habitat has occurred in the South Kaipara (-86%) and Omokoiti Flats (-78%) compartments and are primarily due to reclamation works. Thus, the reduction in salt-marsh habitat in the Auckland region of the harbour is primarily a result of reclamation rather than mangrove encroachment.
Data on present-day (2007) sea-grass habitat was available for the Auckland region of the harbour. No sea-grass meadows were identified in the northern Kaipara. Almost all of the

Patterns and rates of recent sedimentation and intertidal vegetation changes in the Kaipara Harbour 83
sea-grass beds occur in the Central Kaipara (41 ha), Omokoiti Flats (227 ha) and South Head (91 ha) compartments.
In the next section, changes in the area of intertidal vegetated habitats are described for each compartment.
4.2.2 North Kaipara Table 4.2 and Figure 4.37 summarise the changes in mangrove and salt-marsh habitats that have occurred in North Kaipara compartment during the 25-year period 1977–2002. Mangrove and salt-marsh habitat represents 5.1% and 22% (2002) respectively of the total area of these vegetated habitats in the harbour. The rate of change in the area of mangrove and salt-marsh habitat could not be estimated because aerial photographic coverage for the 1977 survey is incomplete.
Table 4-2: North Kaipara: changes in the area (hectares) of mangrove and salt-marsh habitats (1977–2002).
Habitat 1977 (ha) 2002 (ha) % change %/yr Mangrove 161.9 386.7 – – Salt marsh 84 145.2 – –

84 Patterns and rates of recent sedimentation and intertidal vegetation changes in the Kaipara Harbour
Figure 4-37: North Kaipara: changes in the spatial distribution of intertidal vegetated habitats between 1977 and 2002.
4.2.3 Whakatu mangrove forest Table 4.3 summarises the changes in mangrove and salt-marsh habitats that have occurred in Whakatu mangrove forest compartment. Mangrove and salt-marsh habitat represent 4.4% and 10.8% (2002) respectively of the total area of these habitats in the harbour. The area of mangrove forest increased by 53% during the period 1977–2002. As described above, most of this increase in mangrove-forest area has occurred due to colonisation of the intertidal mudflats (Fig. 4.38).
Table 4-3: Whakatu mangrove forest: changes in the area (hectares) of mangrove and salt-marsh habitats (1977–2002).
Habitat 1977 (ha) 2002 (ha) % change %/yr Mangrove 218.6 334.6 53.1 2.1 Salt marsh 68.8 71.5 3.9 0.15
The Whakatu mangrove forest has a number of similarities with the southern Firth of Thames mangrove forest: close proximity to a large river (i.e., fine-sediment supply); rapidly accreting mud flats; wave-driven onshore mud transport; and a stop bank, which constrains the landward expansion of the forest (Swales and Bentley 2008). Small increases in salt-marsh area (3.9%) have occurred between the stop-bank and landward boundary of the mangrove

Patterns and rates of recent sedimentation and intertidal vegetation changes in the Kaipara Harbour 85
forest. The annual-average rate of increase in mangrove habitat (2.1% yr-1) is ten times higher than for salt marsh.
Figure 4-38: Whakatu mangrove forest: changes in the spatial distribution of intertidal vegetated habitats between 1977 and 2002.
4.2.4 North Head North Head compartment includes the shoreline between Ru Point and Pouto Point. The largest inlet with mangrove and salt-marsh habitat is the Okaro Creek (Fig 4.39). Mangrove (64.2 ha) and salt-marsh (24.7 ha) represent 0.8% and 3.7% (2002) respectively of the total area of these habitats in the Kaipara Harbour. No data were available for the 1977 aerial survey so that changes in habitat area cannot be estimated.

86 Patterns and rates of recent sedimentation and intertidal vegetation changes in the Kaipara Harbour
Figure 4-39: North Head: spatial distribution of mangrove and salt-marsh habitat (2002).
4.2.5 Arapaoa River Table 4.4 summarises the changes in mangrove and salt-marsh habitats that have occurred in Arapaoa River compartment. Mangrove and salt-marsh habitat represent 11% and 6.4% (2002) respectively of the total area of these habitats in the harbour. The area of mangrove forest increased by 37% during the period 1977–2002. Figure 4.40 shows that mangrove stands occupy the upper-intertidal flats in the numerous creeks and bays that fringe the Arapaoa River. Mangrove-habitat expansion has occurred at most sites by colonisation of bare mud-flat areas immediately seaward of the stands.
Table 4-4: Arapaoa River: changes in the area (hectares) of mangrove and salt-marsh habitats (1977–2002).
Habitat 1977 (ha) 2002 (ha) % change %/yr Mangrove 609.7 836.7 37.2 1.5 Salt marsh 42.3 42.2 -0.3 –

Patterns and rates of recent sedimentation and intertidal vegetation changes in the Kaipara Harbour 87
Figure 4-40: Arapaoa River: changes in the spatial distribution of intertidal vegetated habitats between 1977 and 2002.
The annual-average increase in mangrove habitat between 1977 and 2002 was 1.5% yr-1. The area of salt-marsh habitat in the Arapaoa River compartment did not change during the study period.
4.2.6 Otamatea River Table 4.5 summarises the changes in mangrove and salt-marsh habitats that have occurred in Otamatea River compartment. Mangrove and salt-marsh habitat represent 4.1% and 4.3% respectively (2002) of the harbour-total areas of these habitats. The area of mangrove forest increased by 34% during the period 1977–2002. Like the Arapaoa, mangrove stands occur on the upper-intertidal flats in the numerous creeks and bays that fringe the Otamatea River, with mangroves colonising the bare mud-flat areas immediately seaward of the pre-existing mangrove stands (Fig. 4.41).

88 Patterns and rates of recent sedimentation and intertidal vegetation changes in the Kaipara Harbour
Table 4-5: Otamatea River: changes in the area (hectares) of mangrove and salt-marsh habitats (1977–2002).
Habitat 1977 (ha) 2002 (ha) % change %/yr Mangrove 234.9 314.8 34.0 1.4 Salt marsh 13.3 28.0 111.2 4.5
The area of salt marsh doubled during the study period, although the total area in 2002 (28 ha) was only 9% of the area occupied by mangrove. The annual-average rates of increase in mangrove and salt-marsh habitat was 1.4% yr-1 and 4.5% yr-1 respectively (1977–2002).
Figure 4-41: Otamatea River: changes in the spatial distribution of intertidal vegetated habitats between 1977 and 2002.
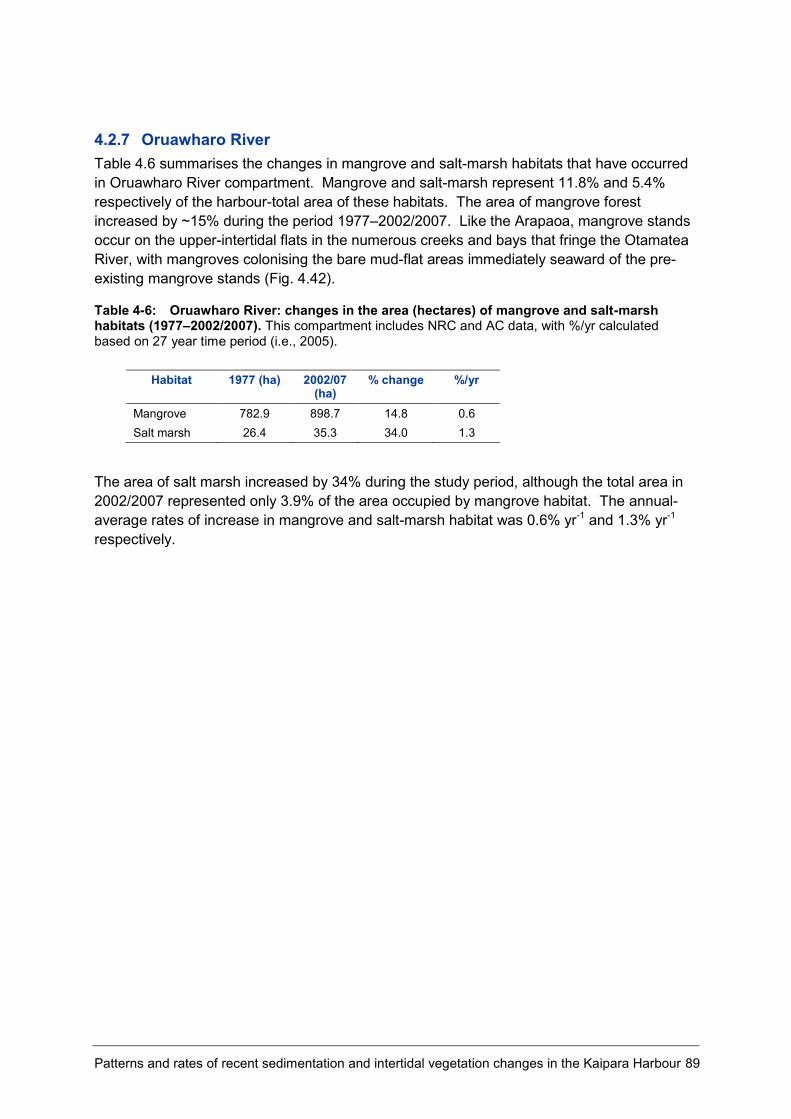
Patterns and rates of recent sedimentation and intertidal vegetation changes in the Kaipara Harbour 89
4.2.7 Oruawharo River Table 4.6 summarises the changes in mangrove and salt-marsh habitats that have occurred in Oruawharo River compartment. Mangrove and salt-marsh represent 11.8% and 5.4% respectively of the harbour-total area of these habitats. The area of mangrove forest increased by ~15% during the period 1977–2002/2007. Like the Arapaoa, mangrove stands occur on the upper-intertidal flats in the numerous creeks and bays that fringe the Otamatea River, with mangroves colonising the bare mud-flat areas immediately seaward of the pre-existing mangrove stands (Fig. 4.42).
Table 4-6: Oruawharo River: changes in the area (hectares) of mangrove and salt-marsh habitats (1977–2002/2007). This compartment includes NRC and AC data, with %/yr calculated based on 27 year time period (i.e., 2005).
Habitat 1977 (ha) 2002/07 (ha)
% change %/yr
Mangrove 782.9 898.7 14.8 0.6 Salt marsh 26.4 35.3 34.0 1.3
The area of salt marsh increased by 34% during the study period, although the total area in 2002/2007 represented only 3.9% of the area occupied by mangrove habitat. The annual-average rates of increase in mangrove and salt-marsh habitat was 0.6% yr-1 and 1.3% yr-1 respectively.

90 Patterns and rates of recent sedimentation and intertidal vegetation changes in the Kaipara Harbour
Figure 4-42: Oruawharo River: changes in the spatial distribution of intertidal vegetated habitats between 1977 and 2002.

Patterns and rates of recent sedimentation and intertidal vegetation changes in the Kaipara Harbour 91
4.2.8 Whakaki River Table 4.7 summarises the changes in mangrove and salt-marsh habitats that have occurred in the Whakaki River compartment. Mangrove and salt-marsh habitat represent 1.6% and 0.9% (2002) respectively of the harbour-total area of these habitats. The area of mangrove forest increased by 27% during the period 1977–2002 (93.1 to 118.1 ha) primarily by mangroves colonising bare mud-flat areas immediately seaward of the pre-existing stands growing in the creeks and bays that indent the shoreline (Fig. 4.43). The area of salt-marsh habitat is a small fraction of the mangrove area, although the area of salt marsh almost doubled from 3.1 to 5.7 ha. The annual-average rates of increase in mangrove and salt-marsh habitat in the Whakaki River was 1.1% yr-1 and 3.4% yr-1 respectively (1977–2002).
Table 4-7: Whakaki River: changes in the area (hectares) of mangrove and salt-marsh habitats (1977–2002).
Habitat 1977 (ha) 2002 (ha) % change %/yr Mangrove 93.1 118.3 27 1.1 Salt marsh 3.1 5.7 84.4 3.4

92 Patterns and rates of recent sedimentation and intertidal vegetation changes in the Kaipara Harbour
Figure 4-43: Whakaki River: changes in the spatial distribution of intertidal vegetated habitats between 1977 and 2002.
4.2.9 Central Kaipara Table 4.8 summarises the changes in each of the intertidal vegetated habitats that have occurred in the Central Kaipara compartment. Mangrove habitat accounts for 7.7% (2007) of the total area of mangrove in the harbour. The data for mangrove habitats includes information on changes in area in each of the four percentage cover classes.
The total increase in mangrove-forest habitat during the period 1977–2002 was 20.8% primarily due to colonisation of bare intertidal flats east and west of Te Ngaio Point on the southern shore of Okahukura Peninsula and, to a lesser extent, expansion of pre-existing mangroves stands in Waikiri and Gum Store Creeks and (Fig. 4.44). The % cover data also show this, with 58% of the increase in mangrove habitat occurring in the 0–25% cover class. This also suggests that a large proportion of the increase in mangrove habitat has occurred in recent years because the low % cover is usually indicative of young mangrove stands (Table 4.8).
No data was available for salt-marsh habitat in 2007, although the area of mixed mangrove and salt-marsh habitat increase almost four fold to 90 ha (2007). Large areas of sea grass

Patterns and rates of recent sedimentation and intertidal vegetation changes in the Kaipara Harbour 93
(40.7 ha, 2007) were also mapped on the intertidal flats fringing Gum Store Creek. These sea grass beds were not mapped in the 1977 aerial photos, which may be due to poorer quality of these earlier images (i.e., small-scale and black and white) rather than a complete absence of sea-grass habitat. The annual-average rate of increase in mangrove habitat in the Central Kaipara was relatively modest at 0.7% yr-1 (1977–2007).
Table 4-8: Central Kaipara: changes in the area (hectares) of mangrove and salt-marsh habitats (1977–2007). The % changes (total and per year) in mangrove area by % cover class are also shown as well as the % contribution of each cover class to the total change in mangrove habitat.
Habitat 1977 2007 % of change in total area
% change %/yr
Mangrove –total 486.7 588.1 20.8 0.7 0–25% 122.4 181.4 58 48.1 1.6 25–50% 78.05 88.9 10.6 13.9 0.5 50–75% 133.0 153.7 20.4 15.3 0.5 75–100% 153.2 164.4 11.0 7.3 0.2 Mixed 18.6 90.0 – 383.0 12.8 Salt marsh 126.6 – – – –
Sea grass – 40.7 – – –
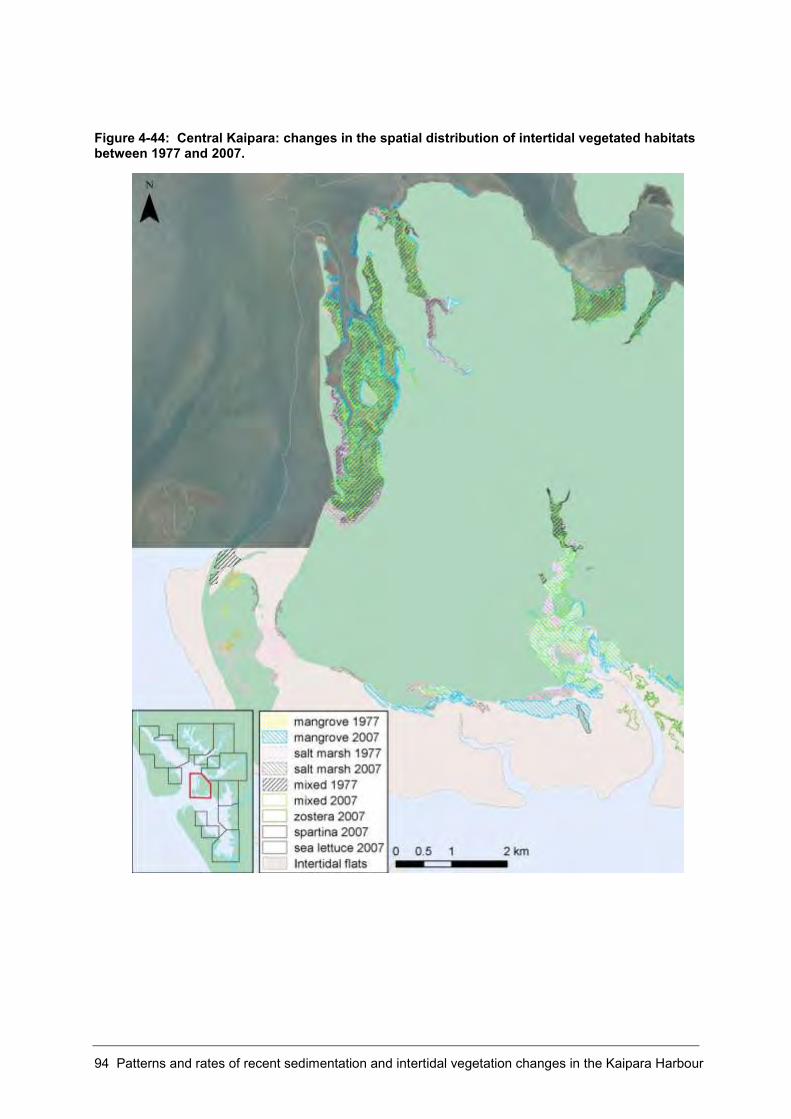
94 Patterns and rates of recent sedimentation and intertidal vegetation changes in the Kaipara Harbour
Figure 4-44: Central Kaipara: changes in the spatial distribution of intertidal vegetated habitats between 1977 and 2007.

Patterns and rates of recent sedimentation and intertidal vegetation changes in the Kaipara Harbour 95
4.2.10 Tauhoa – Hoteo Table 4.9 summarises the changes in each of the intertidal vegetated habitats that have occurred in the Tauhoa–Hoteo compartment. Mangrove and salt-marsh habitat represent 17% and 10% (2007) respectively of the total area of these habitats in the harbour. The data for mangrove habitats includes information on changes in area in each of the four percentage cover classes.
Table 4-9: Tauhoa–Hoteo: changes in the area (hectares) of mangrove and salt-marsh habitats (1977–2007). The % changes (total and per year) in mangrove area by % cover class are also shown as well as the % contribution of each cover class to the total change in mangrove habitat.
Habitat 1977 2007 % of change in total area
% change %/yr
Mangrove –total 1230.4 1313.7 6.8 0.2 0–25% 231.0 250.4 23 8.4 0.28 25–50% 270.4 272.6 2.6 0.8 0.03 50–75% 157.2 159.0 2.2 1.1 0.04 75–100% 571.8 631.7 72 10.5 0.4 Mixed 45.6 43.7 – -4.1 -0.1 Salt marsh 65.9 66.2 – 0.6 0.02
The total increase in mangrove-forest habitat during the period 1977–2007 was 6.8%. In the Tauhoa River, mangroves colonised bare intertidal flats fringing existing stands and new stands were established on intertidal flats at the river mouth (Fig. 4.45). In some areas (e.g., area west of Tauhoa settlement), landward expansion of mangrove stands also occurred. On the northern bank of the Hoteo River mouth, mangroves colonised a substantial area of intertidal flat. The sediment core data show that this is an area of rapid sediment accumulation (~20 mm yr-1, section 4.1.11).
The % cover data indicate that most of this increase occurred early in the 1977–2007 period, with the 75–100% cover class (i.e., mature mangrove) accounting for 72% of the total increase in mangrove habitat. Recent colonisation of intertidal flats (i.e., 0–25% canopy class) accounted for 23% of the mangrove-habitat increase (Table 4.9). The assumption that high % cover represents mature mangrove generally holds for fringe mangrove forests (e.g., Hoteo River mouth) but is not always the case. For example, canopy cover in old mangrove forests growing landward of the present fringing forests and at the upper limit of the tide can be quite patchy.
Changes in the area of mixed and salt-marsh habitats were negligible (Table 4.9). The mixed vegetation class included an area of salt-tolerant terrestrial plants on a low island/shell bank at the mouth of the Tauhoa River. The total area of mixed and salt-marsh habitat is small relative to mangrove habitat (8.4% in 2007).
The annual-average rate of increase in mangrove habitat in the Tauhoa–Hoteo compartment was low at 0.2% yr-1 (1977–2007).

96 Patterns and rates of recent sedimentation and intertidal vegetation changes in the Kaipara Harbour
Figure 4-45: Tauhoa–Hoteo: changes in the spatial distribution of intertidal vegetated habitats between 1977 and 2007.

Patterns and rates of recent sedimentation and intertidal vegetation changes in the Kaipara Harbour 97
4.2.11 Kaipara Flats Table 4.10 summarises the changes in each of the intertidal vegetated habitats that have occurred in the Kaipara Flats compartment. Mangrove and salt-marsh habitat represent 5.1% and 5.3% (2007) respectively of the total area of these habitats in the harbour. The data for mangrove habitats includes information on changes in area in each of the four percentage cover classes.
The total increase in mangrove-forest habitat (14.9%) during the period 1977–2007 was mainly due to colonisation of bare intertidal flats fringing mangrove stands south of the Hoteo River and Araparera River mouths (Fig. 4.46). The % cover data indicate that two-thirds of this increase occurred in the 75–100% cover class (i.e., mature mangrove), which suggests that this occurred early in the survey period 1977–2007 (Table 4.10).
Table 4-10: Kaipara Flats: changes in the area (hectares) of mangrove and salt-marsh habitats (1977–2007). The % changes (total and per year) in mangrove area by % cover class are also shown as well as the % contribution of each cover class to the total change in mangrove habitat.
Habitat 1977 2007 % of change in total area
% change %/yr
Mangrove –total 340.3 390.9 14.9 0.5 0–25% 40.8 47.9 14.0 17.4 0.04 25–50% 20.9 22.0 2.2 5.3 0.2 50–75% 78.4 87.4 17.8 11.5 0.3 75–100% 200.2 233.6 66.0 16.7 0.3 Mixed 26.2 26.7 – 1.9 0 Salt marsh 34.7 34.7 – 0 0
The annual-average increase in mangrove habitat on the Kaipara Flats was very modest at 0.5% yr-1 (1977–2007). This low rate of mangrove-habitat expansion since the mid-1970s is consistent with the exposure of these forests to the prevailing south-west winds. These winds drive sediment re-suspension by waves on the intertidal flats. For example, major phases of mangrove-habitat expansion in the southern Firth of Thames occur infrequently, on average once per decade. These events appear to coincide with rare extended periods of calm summer weather when waves do not excavate mangrove propagules and seedlings from the tidal flats (Swales et al. 2007b).

98 Patterns and rates of recent sedimentation and intertidal vegetation changes in the Kaipara Harbour
Figure 4-46: Kaipara Flats: changes in the spatial distribution of intertidal vegetated habitats between 1977 and 2007.

Patterns and rates of recent sedimentation and intertidal vegetation changes in the Kaipara Harbour 99
4.2.12 South Kaipara Table 4.11 summarises the changes in each of the intertidal vegetated habitats that have occurred in the South Kaipara compartment. Mangrove and salt-marsh habitat represent 25.9% and 24.3% (2007) respectively of the total area of these habitats in the harbour. The single largest mangrove forest in this compartment is found in the Puharakeke Creek. The data for mangrove habitats includes information on changes in area in each of the four percentage cover classes.
The total area of mangrove habitat decreased (-8.3%) during the period 1966–2007. Much of this mangrove-habitat loss appears to be associated with harbour reclamation along the eastern shore at Kakanui and in the Mairetahi and Parekaea Creeks near Shelly Beach (Fig. 4.47).
Table 4-11: South Kaipara: changes in the area (hectares) of mangrove and salt-marsh habitats (1966–2007). The % changes (total and per year) in mangrove area by % cover class are also shown as well as the % contribution of each cover class to the total change in mangrove habitat.
Habitat 1966 2007 % of change in total area
% change %/yr
Mangrove –total 2153.8 1974.9 -8.3 -1.2 0–25% 667.2 332.4 -50.2 -1.2 25–50% 233.4 241.2 3.3 0.08 50–75% 366.6 305.5 -16.7 -0.4 75–100% 886.7 1095.8 23.6 0.6 Mixed 283.3 39.3 – -86.1 -2.1 Salt marsh 178.9 159.9 – -10.6 -0.3 Spartina spp. 2.36 2.77 – 17.1 0.4 Sea grass 0.24
Despite these habitat losses, mangrove forests have colonised extensive areas of bare intertidal flat at several locations: Kakanui Point, Makarau River, Ngapuke Creek and south to the Kaipara River mouth. Increases in mangrove habitat have occurred along tidal channels in the Puharakeke Creek albeit on a smaller scale (Fig. 4.47). Historical surveys suggests that this large mangrove forest had reach an advanced stage of maturity by the 1930s (Ferrar 1934) and it has not substantially changed since that time.
The % cover data show substantial reductions in the 0–25% (-50%) and 50–75% (-16.7%) classes. The only large increase occurred in the 75–100% cover class (209 ha, 23.6%) with mangrove habitat increasing from 887 to 1096 ha (1966–2007). Thus in the South Kaipara the large-scale loss of mangrove habitat due to reclamation has been largely offset by seaward expansion of forests onto bare intertidal flats.

100 Patterns and rates of recent sedimentation and intertidal vegetation changes in the Kaipara Harbour
Figure 4-47: South Kaipara: changes in the spatial distribution of intertidal vegetated habitats between 1977 and 2007.
Figure 4.47 and Table 4.11 show that large-scale loss of mixed mangrove and salt-marsh habitats (-86%) has also occurred in the South Kaipara. These data show that human activities have had a major impact on intertidal vegetated habitats in the South Kaipara.

Patterns and rates of recent sedimentation and intertidal vegetation changes in the Kaipara Harbour 101
4.2.13 Omokoiti Flats Table 4.12 summarises the changes in each of the intertidal vegetated habitats that have occurred in the Omokoiti Flats compartment. Mangrove and salt-marsh habitat represent 5% and 6.2% (2007) respectively of the harbour-total area of these habitats. The data for mangrove habitats includes information on changes in area in each of the four percentage cover classes.
Substantial reclamation of intertidal flats has also occurred in the Omokoiti compartment, which has resulted in substantial loss of mangrove and mixed mangrove and salt-marsh habitat (Fig. 4.48). The largest area of habitat loss due to large-scale reclamation works has occurred between Taumata and Awataha Creeks. Primarily as a result of these reclamations, the total area of mangrove habitat decreased by -26.9%, from 520 ha in 1966 to 380 ha in 2007 (Table. 4.12). The % cover data show substantial reductions in the 0–25% (-53%) and 25–50% (-47%) classes, with a total of 150 ha of mangrove habitat loss and similar to the net change in total mangrove habitat of 140 ha.
Substantial loss of mixed mangrove and salt-marsh habitats (-78%) has also occurred in the Omokoiti compartment whereas the net change in salt marsh (+2.8%) since the mid 1960s has been negligible (Table 4.12). As observed in the South Kaipara, reclamation works since the mid 1960s have had a major impact on intertidal vegetated habitats at Omokoiti Flats.
Table 4-12: Omokoiti Flats: changes in the area (hectares) of mangrove and salt-marsh habitats (1966–2007). The % changes (total and per year) in mangrove area by % cover class are also shown as well as the % contribution of each cover class to the total change in mangrove habitat.
Habitat 1966 2007 % of change in total area
% change %/yr
Mangrove –total 520.2 380.1 -26.9 -0.66 0–25% 178.2 84.5 -52.6 -1.28 25–50% 122.1 65.0 -46.8 -1.14 50–75% 72.4 73.9 2.2 0.05 75–100% 147.5 156.7 6.2 0.15 Mixed 43.3 9.4 – -78.3 -1.91 Salt marsh 39.7 40.8 – 2.8 0.07 Sea grass – 226.5

102 Patterns and rates of recent sedimentation and intertidal vegetation changes in the Kaipara Harbour
Figure 4-48: Omokoiti Flats: changes in the spatial distribution of intertidal vegetated habitats between 1966 and 2007.
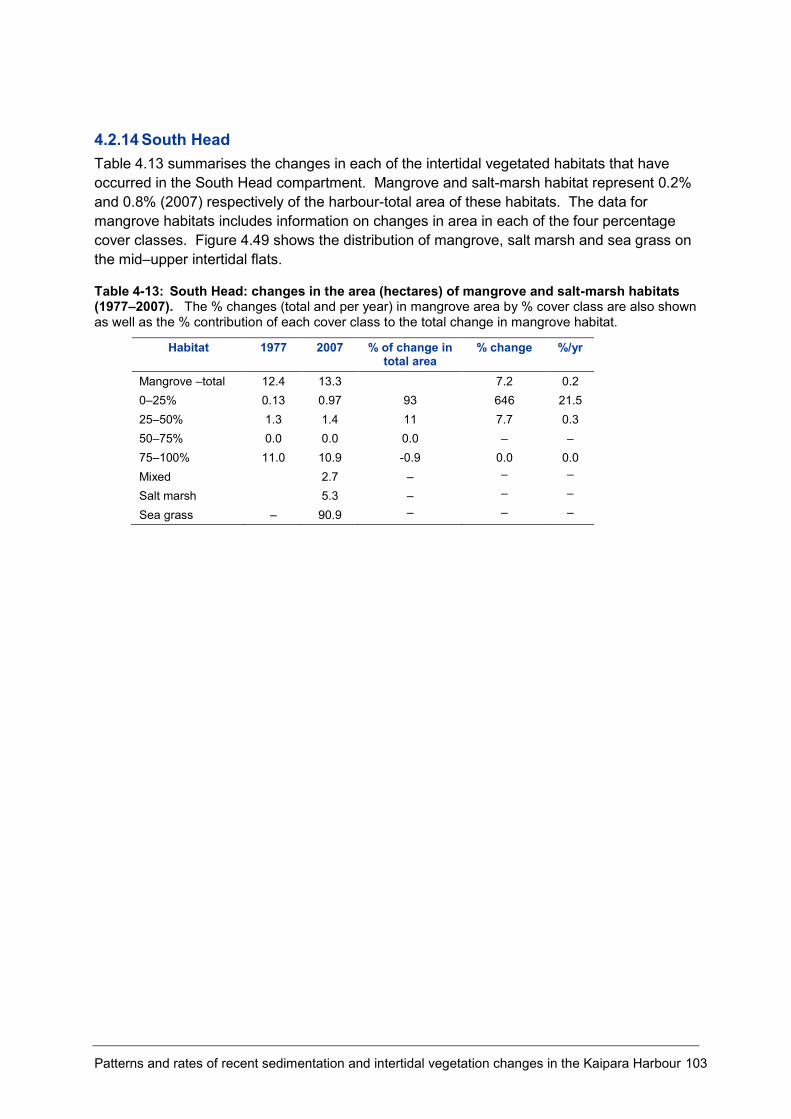
Patterns and rates of recent sedimentation and intertidal vegetation changes in the Kaipara Harbour 103
4.2.14 South Head Table 4.13 summarises the changes in each of the intertidal vegetated habitats that have occurred in the South Head compartment. Mangrove and salt-marsh habitat represent 0.2% and 0.8% (2007) respectively of the harbour-total area of these habitats. The data for mangrove habitats includes information on changes in area in each of the four percentage cover classes. Figure 4.49 shows the distribution of mangrove, salt marsh and sea grass on the mid–upper intertidal flats.
Table 4-13: South Head: changes in the area (hectares) of mangrove and salt-marsh habitats (1977–2007). The % changes (total and per year) in mangrove area by % cover class are also shown as well as the % contribution of each cover class to the total change in mangrove habitat.
Habitat 1977 2007 % of change in total area
% change %/yr
Mangrove –total 12.4 13.3 7.2 0.2 0–25% 0.13 0.97 93 646 21.5 25–50% 1.3 1.4 11 7.7 0.3 50–75% 0.0 0.0 0.0 – – 75–100% 11.0 10.9 -0.9 0.0 0.0 Mixed 2.7 – – –
Salt marsh 5.3 – – –
Sea grass – 90.9 – – –

104 Patterns and rates of recent sedimentation and intertidal vegetation changes in the Kaipara Harbour
Figure 4-49: South Head: changes in the spatial distribution of intertidal vegetated habitats between 1977 and 2007.