Nitrogen Removal Technology: Past, Present and Future- Blue … · Filtrate Treatment Facility...
49
Filtrate Treatment Facility Update Nitrogen Removal Technology: Past, Present and Future- Blue Plains Advanced Wastewater Treatment Plant’s Current Nutrient Regulation and Nitrogen Removal Processes May 20 th , 2011 Sudhir N. Murthy, PhD, PE
-
Upload
nguyenthien -
Category
Documents
-
view
220 -
download
0
Transcript of Nitrogen Removal Technology: Past, Present and Future- Blue … · Filtrate Treatment Facility...
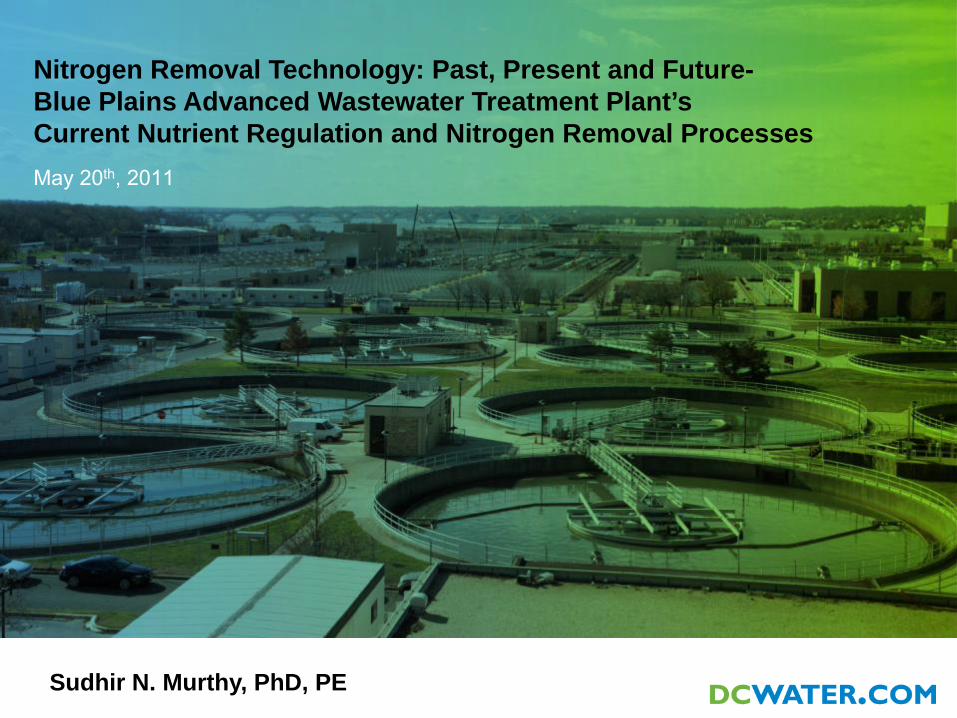
Filtrate Treatment Facility Update
Nitrogen Removal Technology: Past, Present and Future-Blue Plains Advanced Wastewater Treatment Plant’s Current Nutrient Regulation and Nitrogen Removal Processes May 20th, 2011
Sudhir N. Murthy, PhD, PE
2
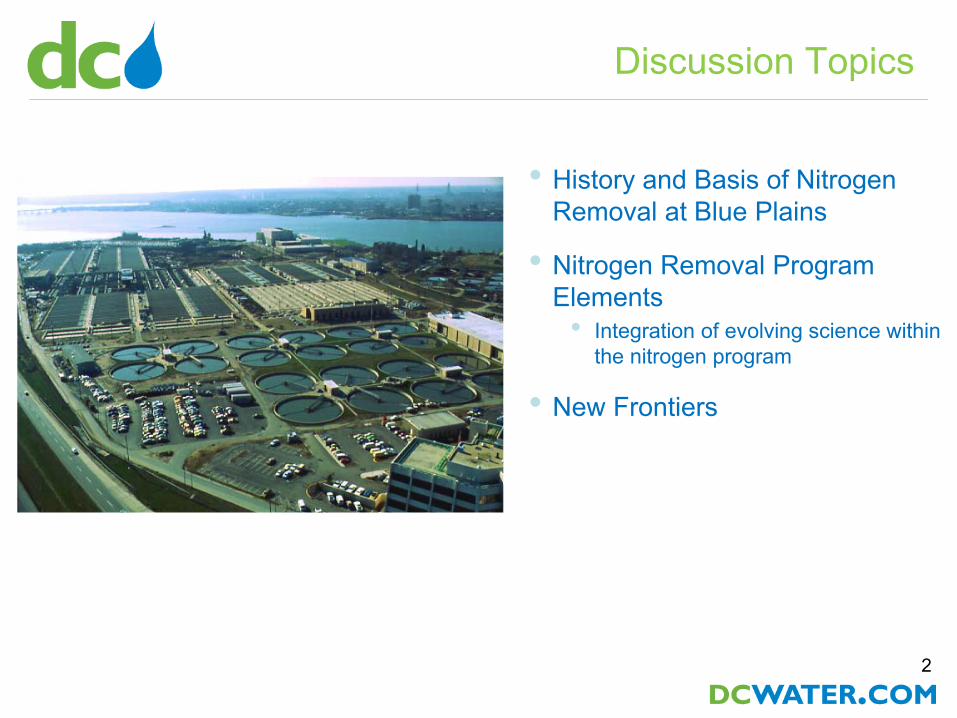
• History and Basis of Nitrogen Removal at Blue Plains
• Nitrogen Removal Program Elements• Integration of evolving science within
the nitrogen program
• New Frontiers
Discussion Topics

Relative Responsibility for Pollution Loads to the Bay (2007)
4
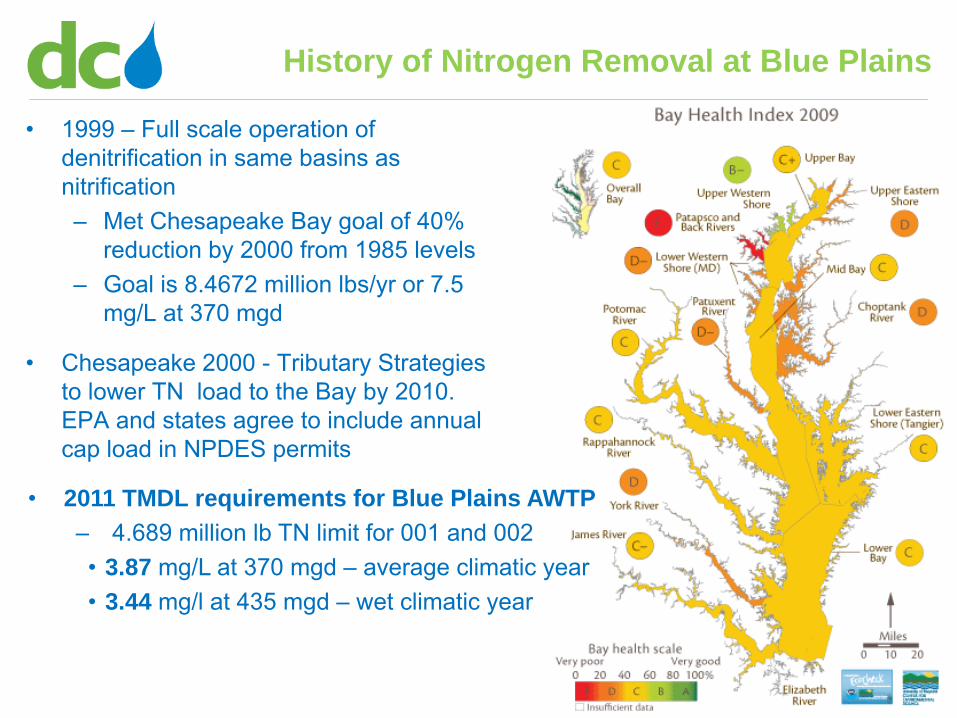
History of Nitrogen Removal at Blue Plains
• 1999 – Full scale operation of denitrification in same basins as nitrification– Met Chesapeake Bay goal of 40%
reduction by 2000 from 1985 levels– Goal is 8.4672 million lbs/yr or 7.5
mg/L at 370 mgd
• Chesapeake 2000 - Tributary Strategies to lower TN load to the Bay by 2010. EPA and states agree to include annual cap load in NPDES permits
• 2011 TMDL requirements for Blue Plains AWTP– 4.689 million lb TN limit for 001 and 002• 3.87 mg/L at 370 mgd – average climatic year• 3.44 mg/l at 435 mgd – wet climatic year
5
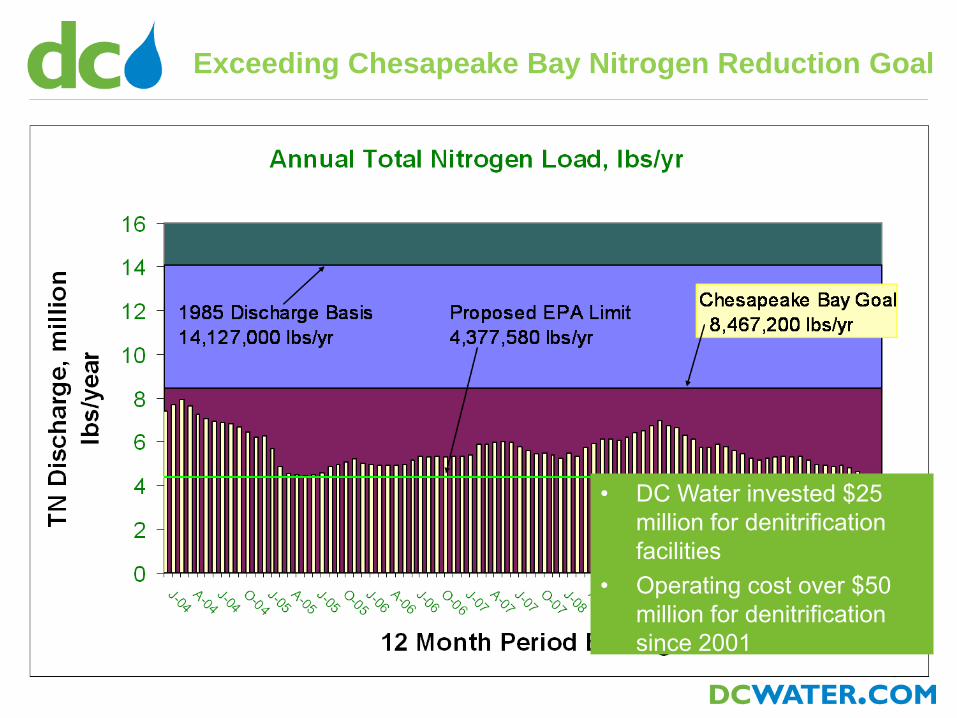
Exceeding Chesapeake Bay Nitrogen Reduction Goal
• DC Water invested $25 million for denitrification facilities
• Operating cost over $50 million for denitrification since 2001
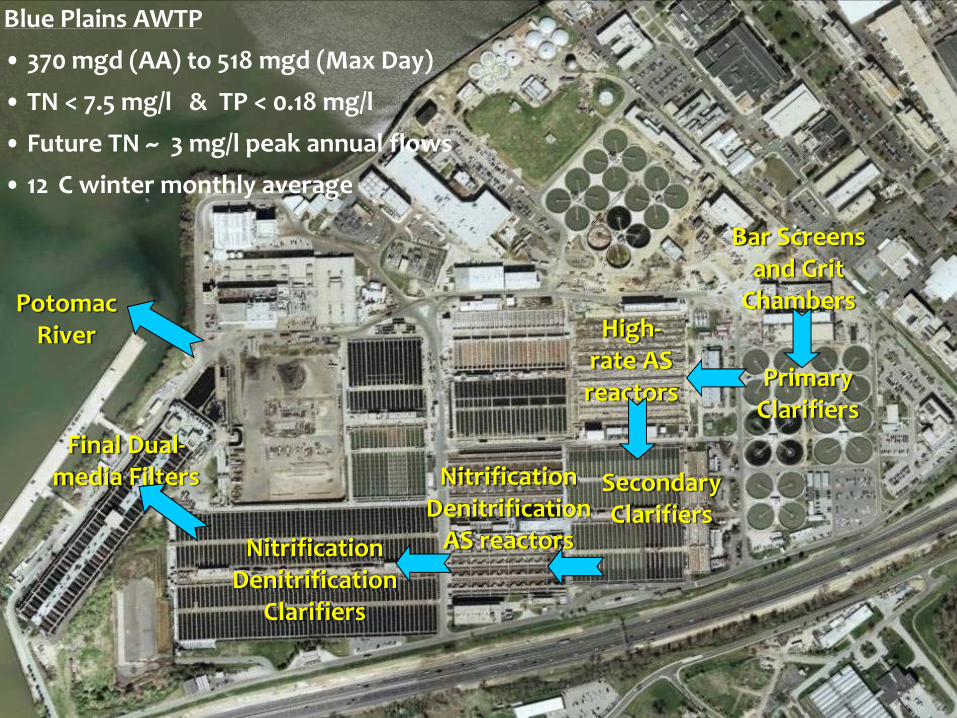
Primary Clarifiers
High‐rate AS reactors
Secondary Clarifiers
Nitrification Denitrification AS reactorsNitrification
Denitrification Clarifiers
Final Dual‐media Filters
Potomac River
Bar Screens and Grit Chambers
Blue Plains AWTP
• 370 mgd (AA) to 518 mgd (Max Day)
• TN < 7.5 mg/l & TP < 0.18 mg/l
• Future TN ~ 3 mg/l peak annual flows
• 12 C winter monthly average
7
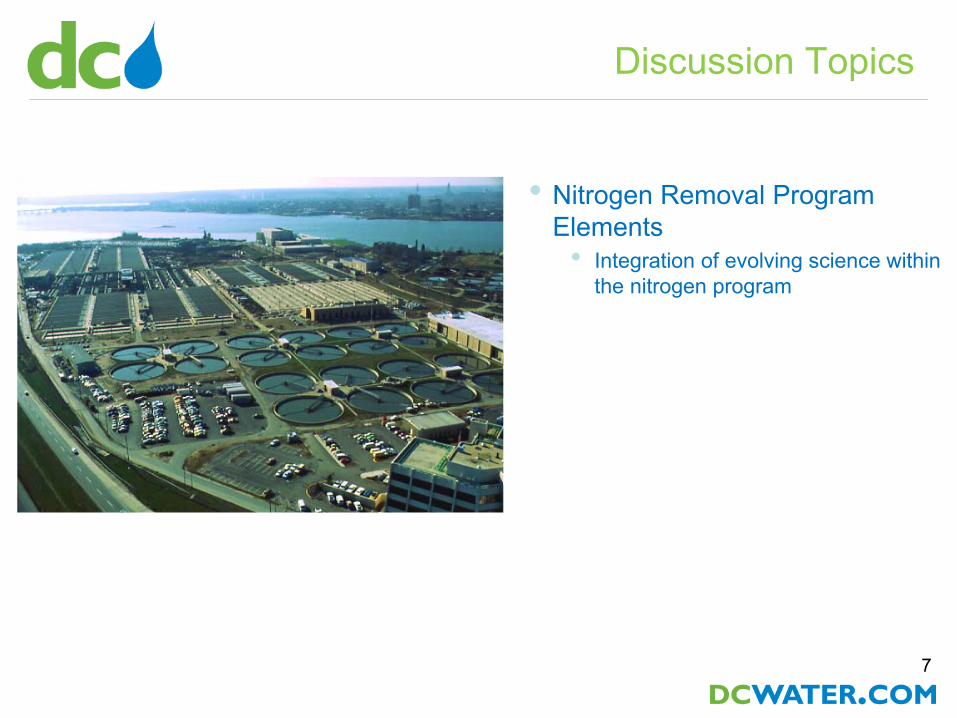
• Nitrogen Removal Program Elements• Integration of evolving science within
the nitrogen program
Discussion Topics
8
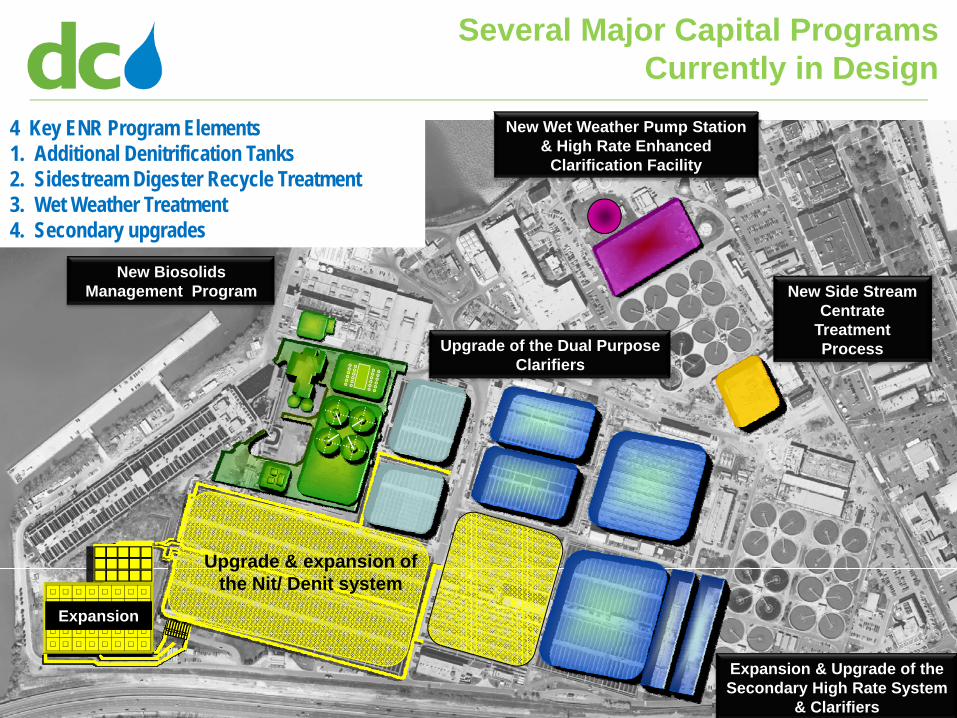
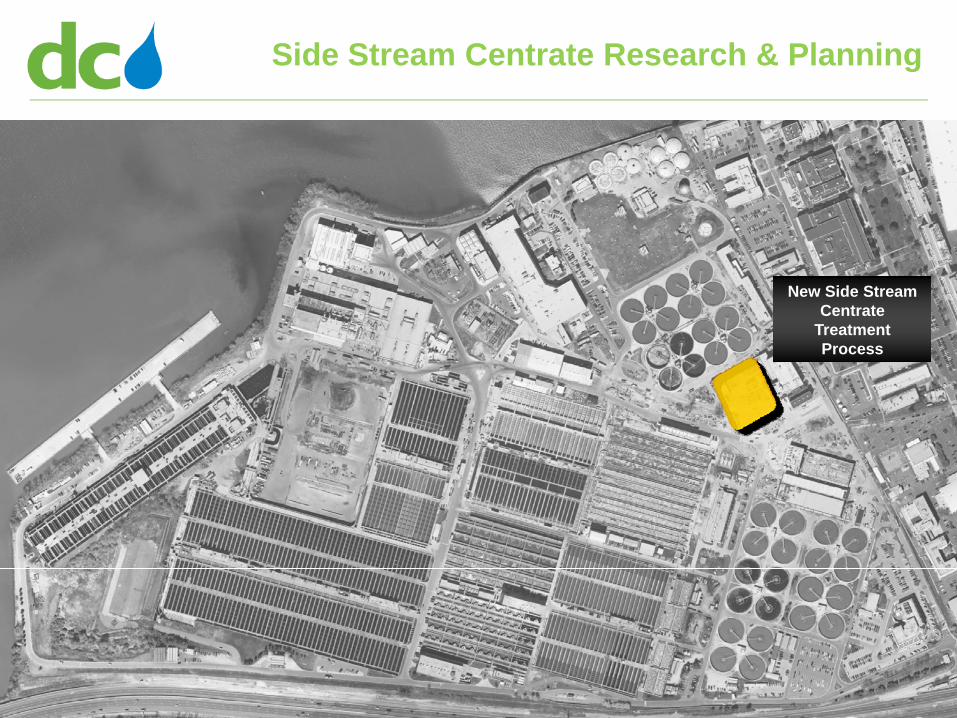
New Side Stream Centrate
Treatment Process
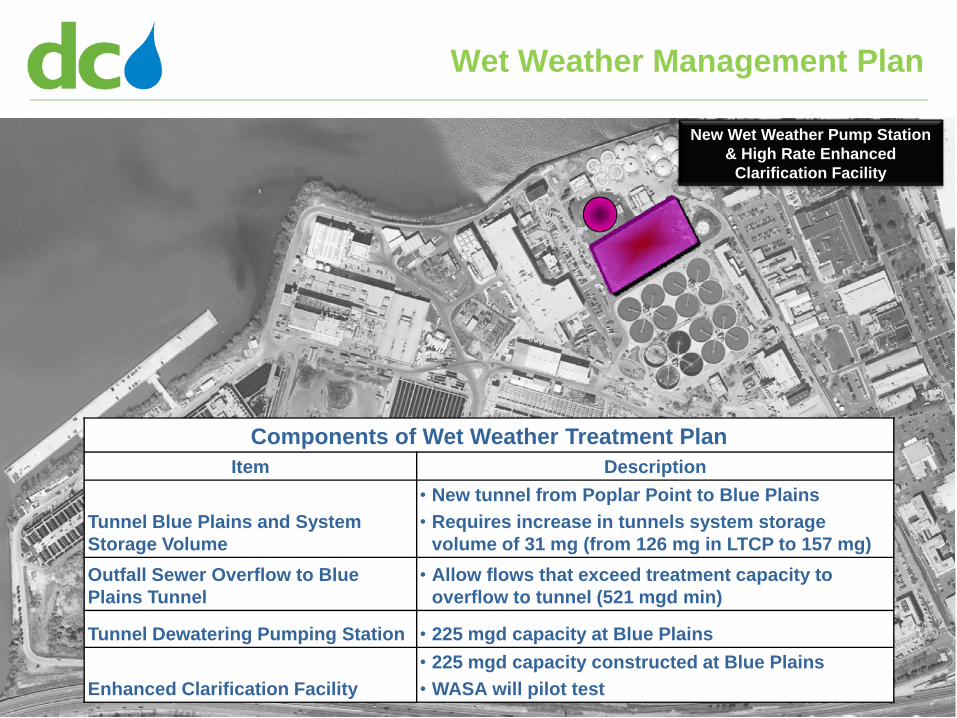
New Wet Weather Pump Station & High Rate Enhanced
Clarification Facility
Upgrade & expansion of the Nit/ Denit system
Expansion
Expansion & Upgrade of the Secondary High Rate System
& Clarifiers
New Biosolids Management Program
Upgrade of the Dual Purpose Clarifiers
Several Major Capital Programs Currently in Design
4 Key ENR Program Elements1. Additional Denitrification Tanks2. Sidestream Digester Recycle Treatment3. Wet Weather Treatment4. Secondary upgrades

9
New Wet Weather Pump Station & High Rate Enhanced
Clarification Facility
Wet Weather Management Plan

10
Challenges to Blue Plains in Meeting TN Requirements
• Storm flows impact entire plant operation– Primary tanks are overloaded– Secondary and BNR sedimentation basins overloaded – Operators intervene to protect bio-processes
• Reduced biological treatment capacity• Return to normal mode takes up to 5 days
– 1% of annual BNR flow volume (flows > 555 mgd) causes ENR problems
• Site constraints– Land area is limited– Most of land is built-out– Limited space for new process trains
• Must continue permit compliance while construction is underway
1% of flow >555 mgd
11
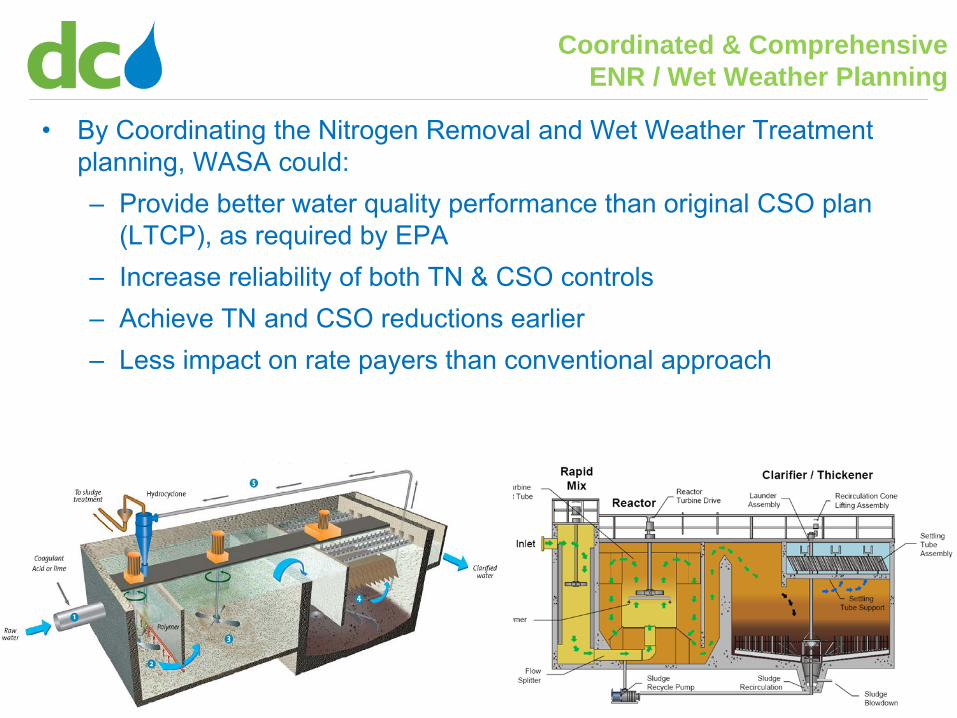
Coordinated & Comprehensive ENR / Wet Weather Planning
• By Coordinating the Nitrogen Removal and Wet Weather Treatment planning, WASA could:– Provide better water quality performance than original CSO plan
(LTCP), as required by EPA– Increase reliability of both TN & CSO controls– Achieve TN and CSO reductions earlier – Less impact on rate payers than conventional approach
12
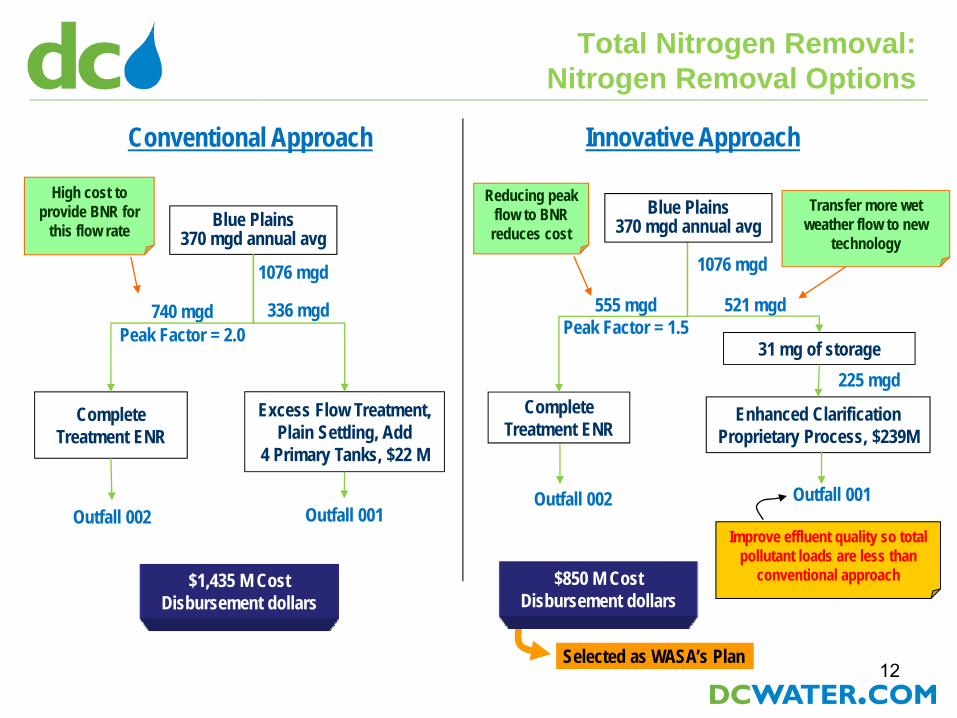
Total Nitrogen Removal:Nitrogen Removal Options
Blue Plains370 mgd annual avg
Complete Treatment ENR
Excess Flow Treatment, Plain Settling, Add
4 Primary Tanks, $22 M
Outfall 001Outfall 002
336 mgd740 mgdPeak Factor = 2.0
1076 mgd
Conventional Approach
Complete Treatment ENR
Enhanced ClarificationProprietary Process, $239M
Outfall 001Outfall 002
521 mgd
1076 mgd
Reducing peak flow to BNR reduces cost
High cost to provide BNR for
this flow rate
Improve effluent quality so total pollutant loads are less than
conventional approach
Transfer more wet weather flow to new
technology
$1,435 M CostDisbursement dollars
Selected as WASA’s Plan
Innovative Approach
31 mg of storage225 mgd
555 mgdPeak Factor = 1.5
Blue Plains370 mgd annual avg
$850 M CostDisbursement dollars
13
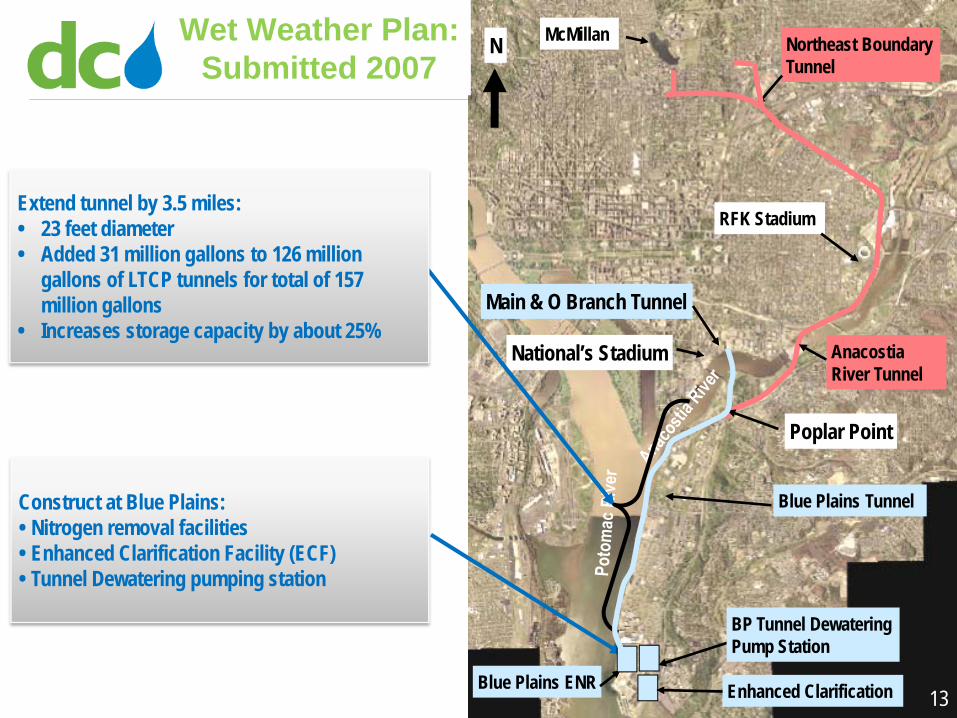
N McMillan
Main & O Branch Tunnel
RFK Stadium
Blue Plains Tunnel
Anacostia River Tunnel
Northeast Boundary Tunnel
13
National’s Stadium
Extend tunnel by 3.5 miles:• 23 feet diameter• Added 31 million gallons to 126 million
gallons of LTCP tunnels for total of 157 million gallons
• Increases storage capacity by about 25%
Construct at Blue Plains:• Nitrogen removal facilities• Enhanced Clarification Facility (ECF)• Tunnel Dewatering pumping station
Wet Weather Plan:Submitted 2007
BP Tunnel Dewatering Pump Station
Blue Plains ENR Enhanced Clarification
Poplar Point
14
New Wet Weather Pump Station & High Rate Enhanced
Clarification Facility
Wet Weather Management Plan
Components of Wet Weather Treatment PlanItem Description
Tunnel Blue Plains and System Storage Volume
• New tunnel from Poplar Point to Blue Plains• Requires increase in tunnels system storage
volume of 31 mg (from 126 mg in LTCP to 157 mg)Outfall Sewer Overflow to Blue Plains Tunnel
• Allow flows that exceed treatment capacity to overflow to tunnel (521 mgd min)
Tunnel Dewatering Pumping Station • 225 mgd capacity at Blue Plains
Enhanced Clarification Facility• 225 mgd capacity constructed at Blue Plains• WASA will pilot test
15
No Item
Average Climatic
Year
Wet Climatic Year
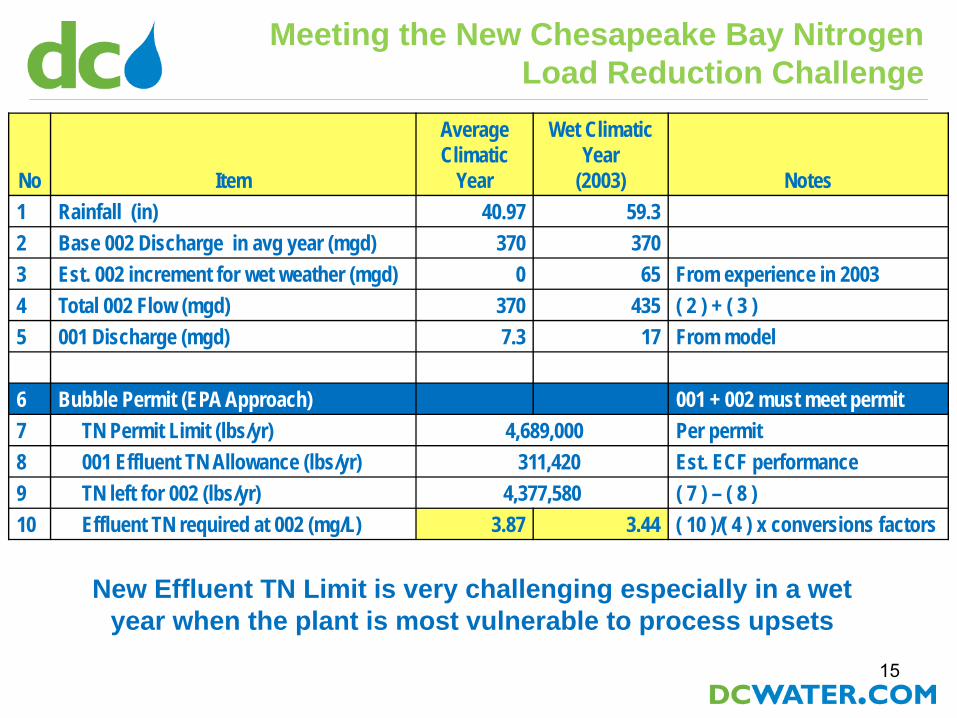
(2003) Notes1 Rainfall (in) 40.97 59.32 Base 002 Discharge in avg year (mgd) 370 3703 Est. 002 increment for wet weather (mgd) 0 65 From experience in 20034 Total 002 Flow (mgd) 370 435 ( 2 ) + ( 3 )5 001 Discharge (mgd) 7.3 17 From model
6 Bubble Permit (EPA Approach) 001 + 002 must meet permit7 TN Permit Limit (lbs/yr) 4,689,000 Per permit8 001 Effluent TN Allowance (lbs/yr) 311,420 Est. ECF performance9 TN left for 002 (lbs/yr) 4,377,580 ( 7 ) – ( 8 )10 Effluent TN required at 002 (mg/L) 3.87 3.44 ( 10 )/( 4 ) x conversions factors
New Effluent TN Limit is very challenging especially in a wet year when the plant is most vulnerable to process upsets
Meeting the New Chesapeake Bay Nitrogen Load Reduction Challenge

16
• Nitrogen Removal Program Elements• Integration of evolving science within
the nitrogen program
Discussion Topics
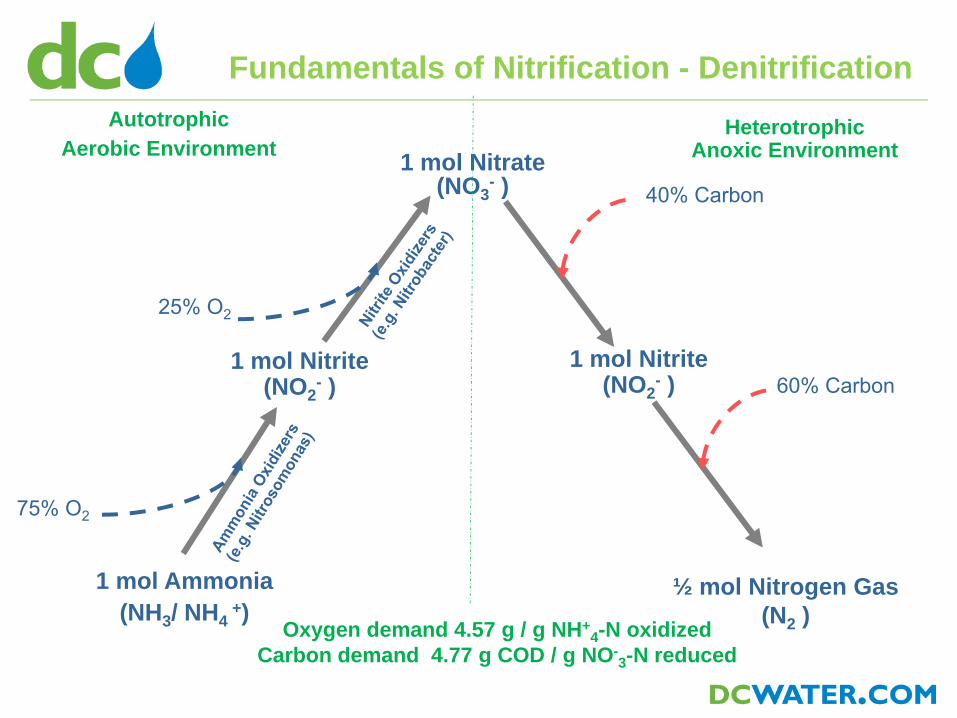
Fundamentals of Nitrification - Denitrification
Oxygen demand 4.57 g / g NH+4-N oxidized
Carbon demand 4.77 g COD / g NO-3-N reduced
1 mol Ammonia(NH3/ NH4
+)
1 mol Nitrite(NO2
- )
1 mol Nitrate(NO3
- )
75% O2
AutotrophicAerobic Environment
1 mol Nitrite(NO2
- )
½ mol Nitrogen Gas(N2 )
25% O2
40% Carbon
60% Carbon
HeterotrophicAnoxic Environment
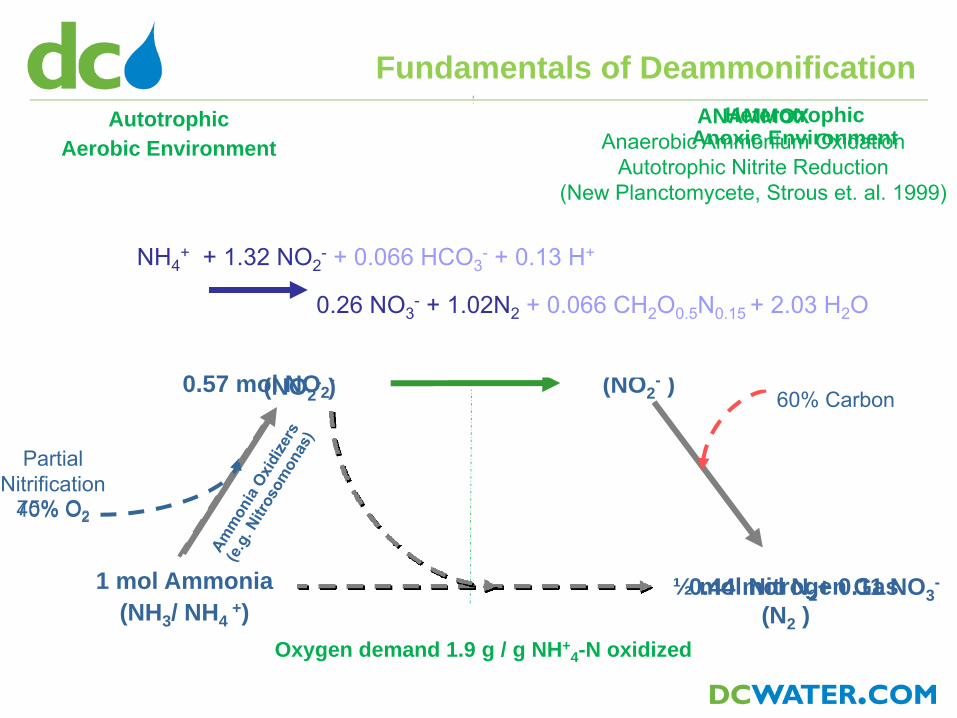
Fundamentals of Deammonification
Oxygen demand 1.9 g / g NH+4-N oxidized
1 mol Ammonia(NH3/ NH4
+)
1 mol Nitrate(NO3
- )
75% O2
½ mol Nitrogen Gas(N2 )
25% O2
40% Carbon
60% Carbon
HeterotrophicAnoxic Environment
1 mol Nitrite(NO2
- )1 mol Nitrite
(NO2- )
NH4+ + 1.32 NO2
- + 0.066 HCO3- + 0.13 H+
0.26 NO3- + 1.02N2 + 0.066 CH2O0.5N0.15 + 2.03 H2O
0.44 mol N2+ 0.11 NO3-
0.57 mol NO2-
Partial Nitrification
40% O2
AutotrophicAerobic Environment
ANAMMOX Anaerobic Ammonium Oxidation
Autotrophic Nitrite Reduction(New Planctomycete, Strous et. al. 1999)
19
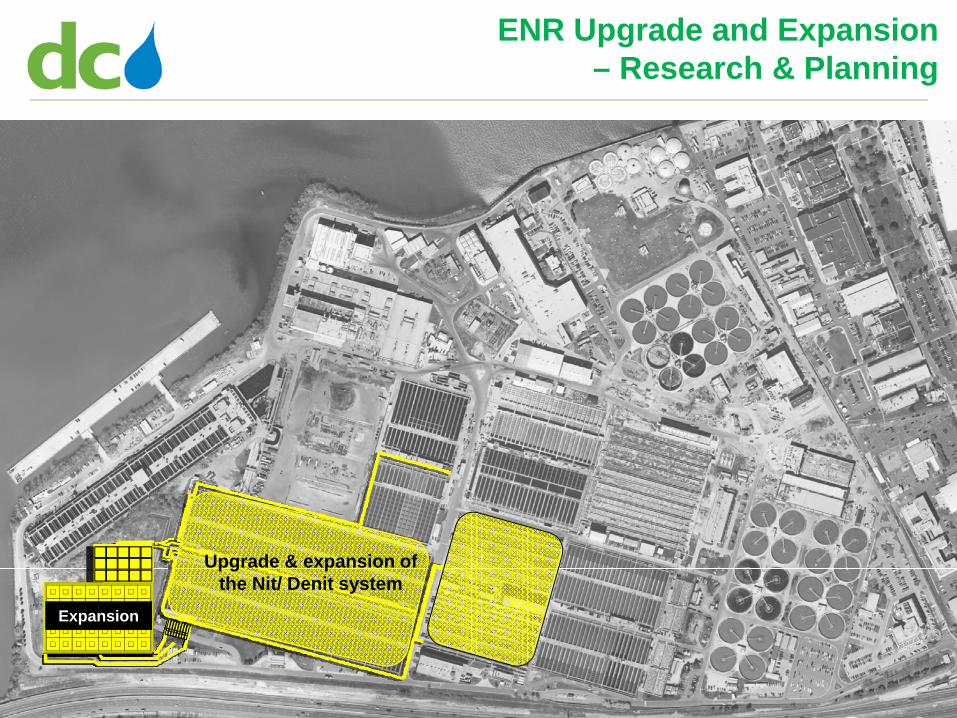
Upgrade & expansion of the Nit/ Denit system
Expansion
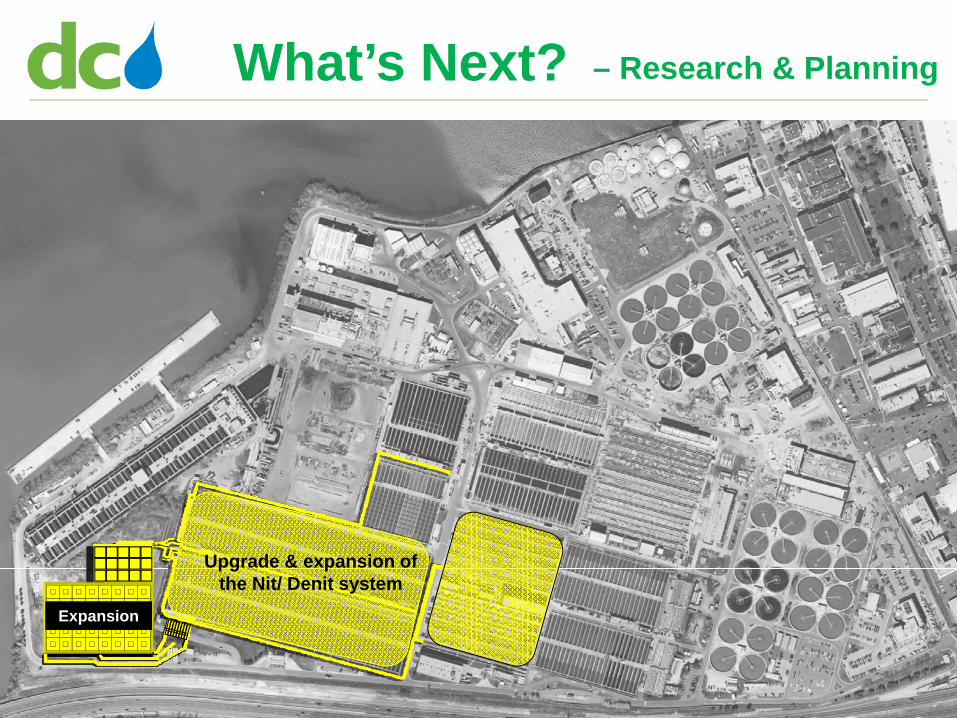
ENR Upgrade and Expansion – Research & Planning
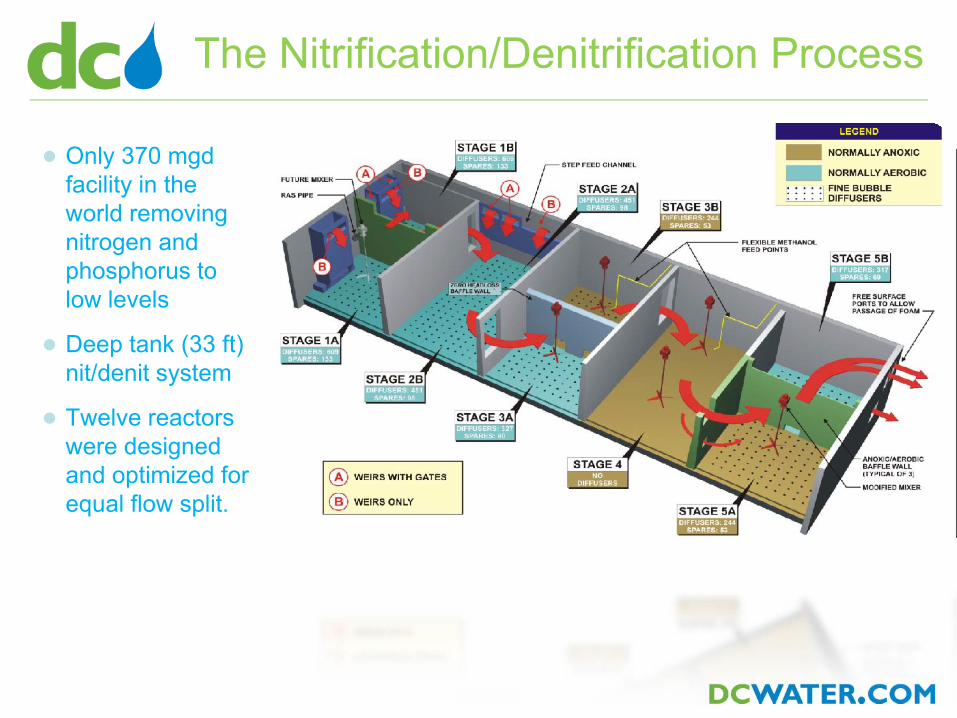
● Only 370 mgd facility in the world removing nitrogen and phosphorus to low levels
● Deep tank (33 ft) nit/denit system
● Twelve reactors were designed and optimized for equal flow split.
The Nitrification/Denitrification Process
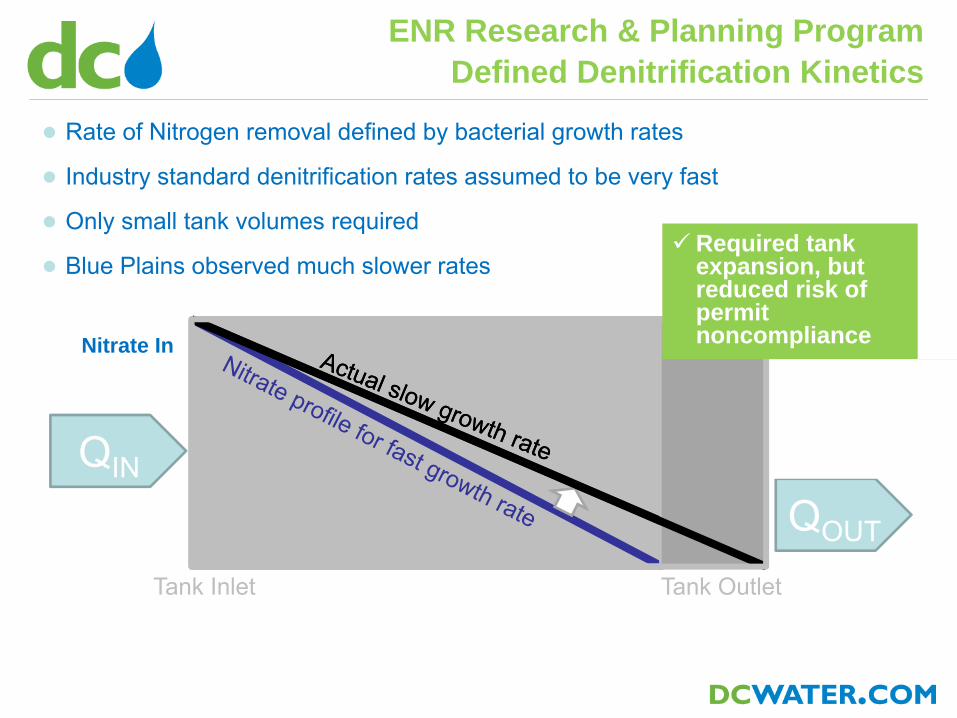
● Rate of Nitrogen removal defined by bacterial growth rates
● Industry standard denitrification rates assumed to be very fast
● Only small tank volumes required
● Blue Plains observed much slower rates
ENR Research & Planning ProgramDefined Denitrification Kinetics
Tank Inlet Tank Outlet
QIN
QOUT
Nitrate OUT < 0.5 mg/l
Nitrate InNitrate OUT > 1.5 mg/lRisk of ENR Noncompliance
Required tank expansion, but reduced risk of permit noncompliance
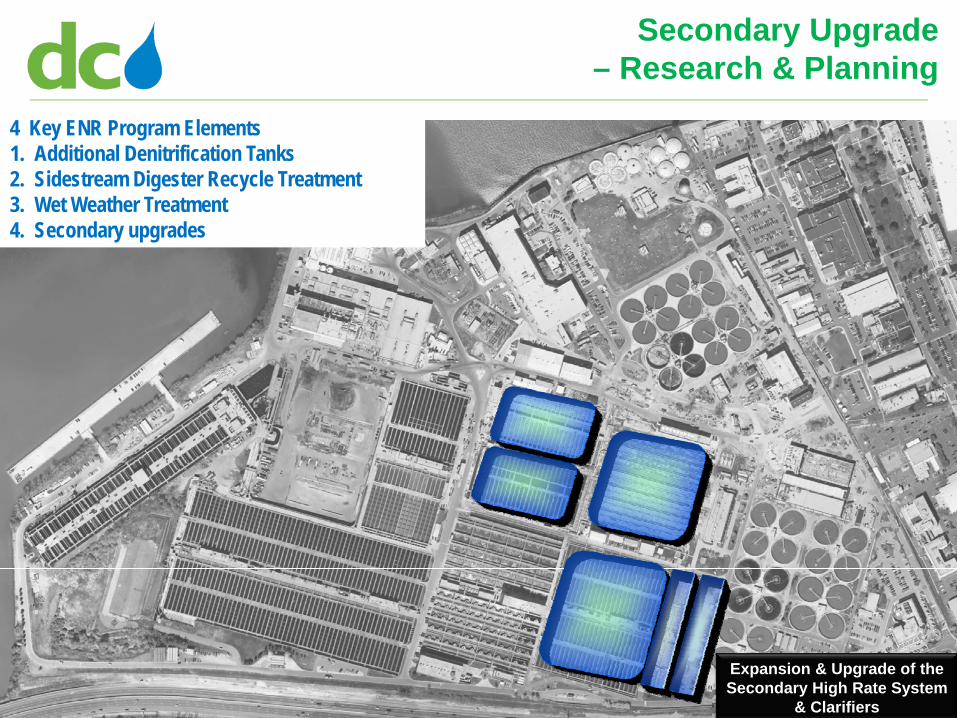
22Expansion & Upgrade of the Secondary High Rate System
& Clarifiers
Secondary Upgrade – Research & Planning
4 Key ENR Program Elements1. Additional Denitrification Tanks2. Sidestream Digester Recycle Treatment3. Wet Weather Treatment4. Secondary upgrades
23
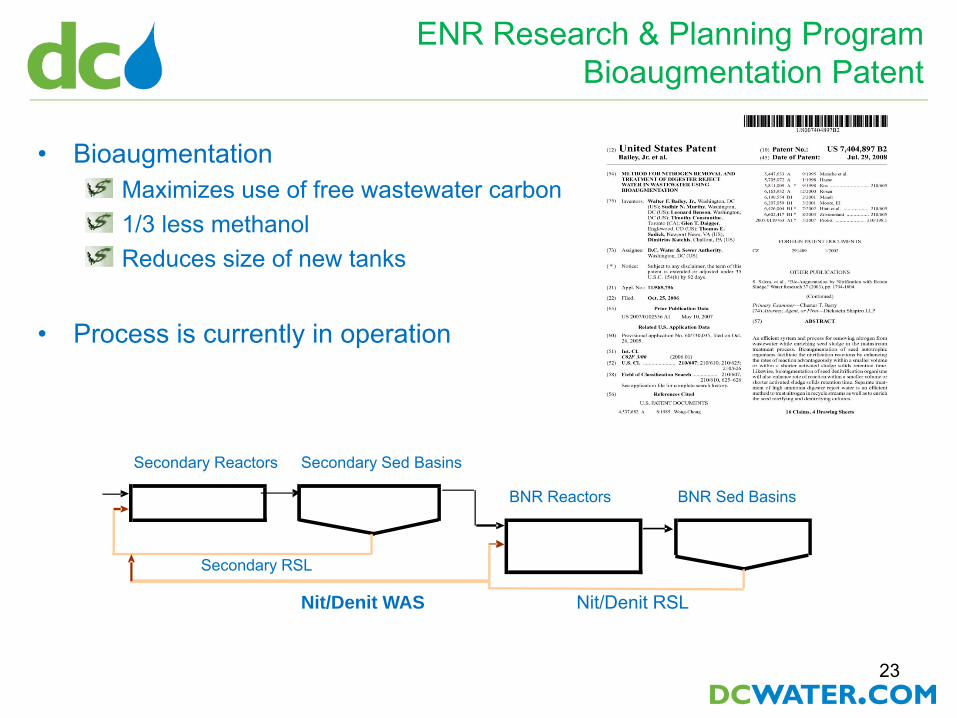
• BioaugmentationMaximizes use of free wastewater carbon1/3 less methanol Reduces size of new tanks
• Process is currently in operation phase
ENR Research & Planning ProgramBioaugmentation Patent
Secondary Reactors Secondary Sed Basins
BNR Reactors BNR Sed Basins
Secondary RSL
Nit/Denit WAS Nit/Denit RSL
24
New Side Stream Centrate
Treatment Process
Side Stream Centrate Research & Planning
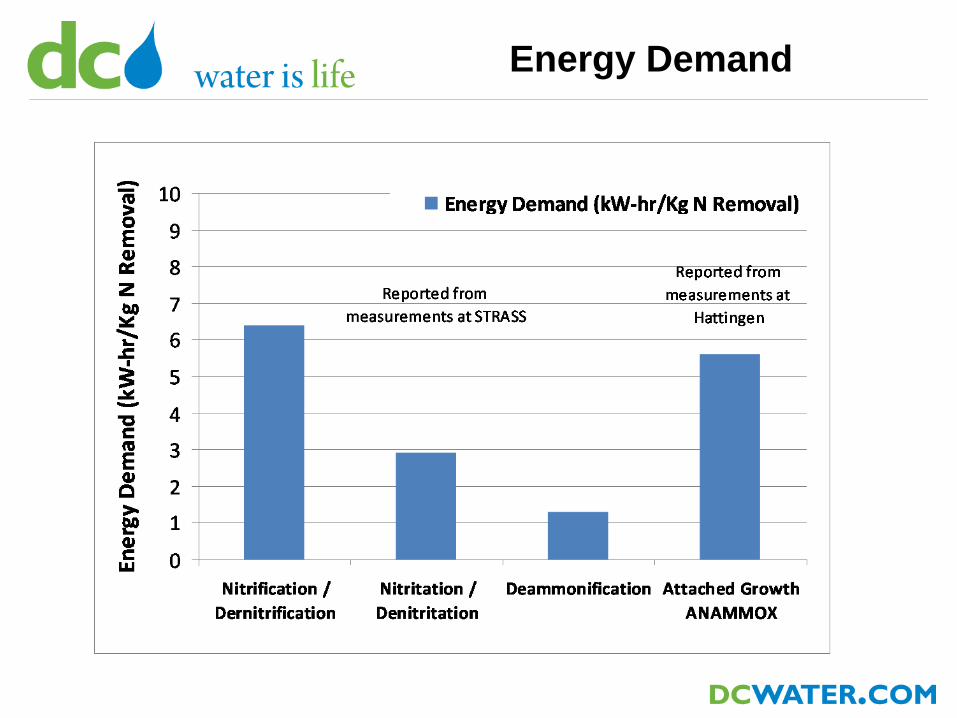
Energy Demand
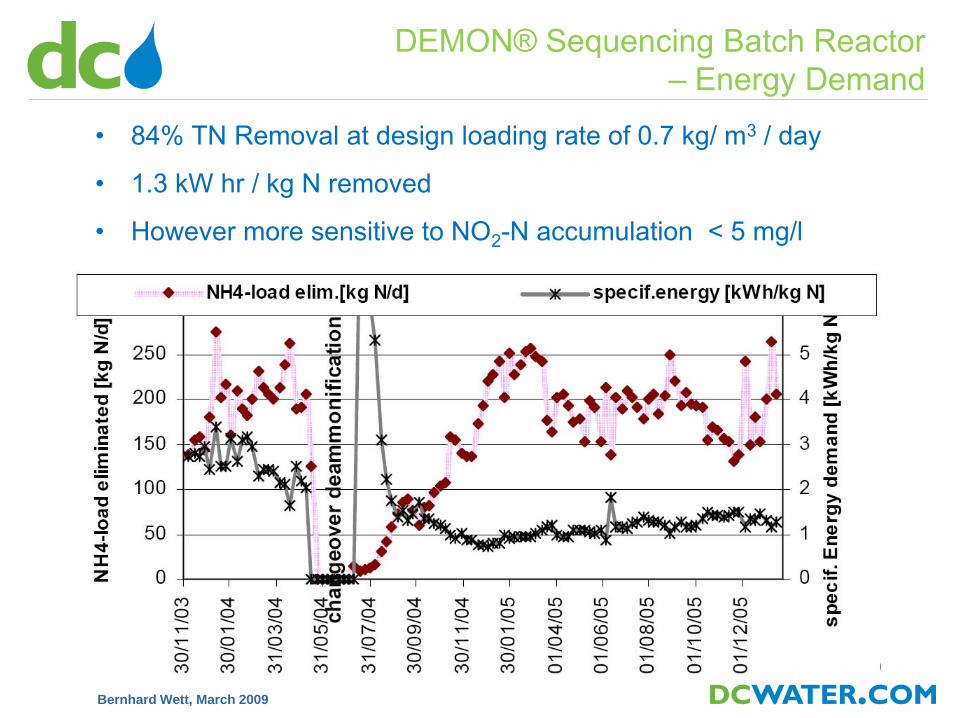
DEMON® Sequencing Batch Reactor – Energy Demand
Bernhard Wett, March 2009
• 84% TN Removal at design loading rate of 0.7 kg/ m3 / day
• 1.3 kW hr / kg N removed
• However more sensitive to NO2-N accumulation < 5 mg/l
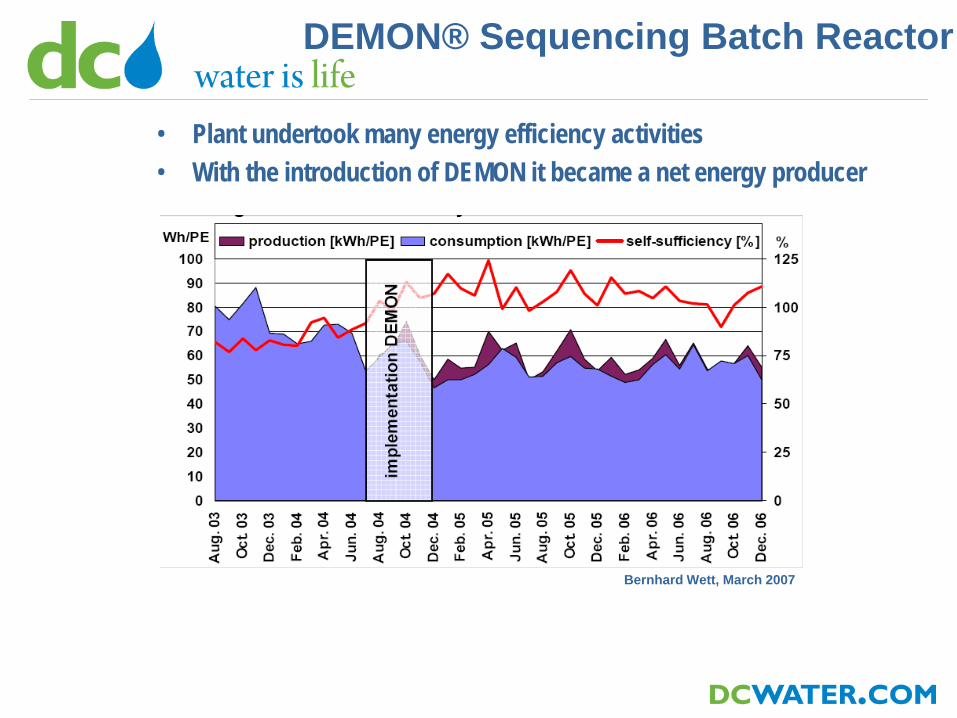
• Plant undertook many energy efficiency activities • With the introduction of DEMON it became a net energy producer
DEMON® Sequencing Batch Reactor
Bernhard Wett, March 2007
Einleitung
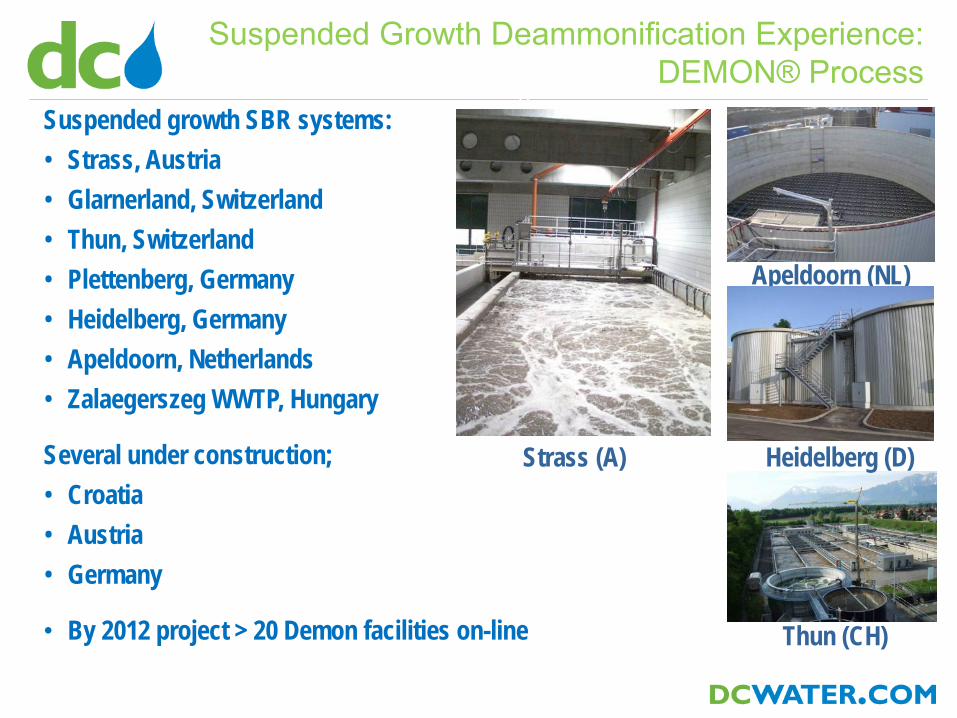
Apeldoorn (NL)
Thun (CH)
Heidelberg (D)
Suspended Growth Deammonification Experience: DEMON® Process
Suspended growth SBR systems:• Strass, Austria• Glarnerland, Switzerland• Thun, Switzerland• Plettenberg, Germany• Heidelberg, Germany • Apeldoorn, Netherlands• Zalaegerszeg WWTP, Hungary
Several under construction; • Croatia • Austria • Germany
• By 2012 project > 20 Demon facilities on-line
Strass (A)
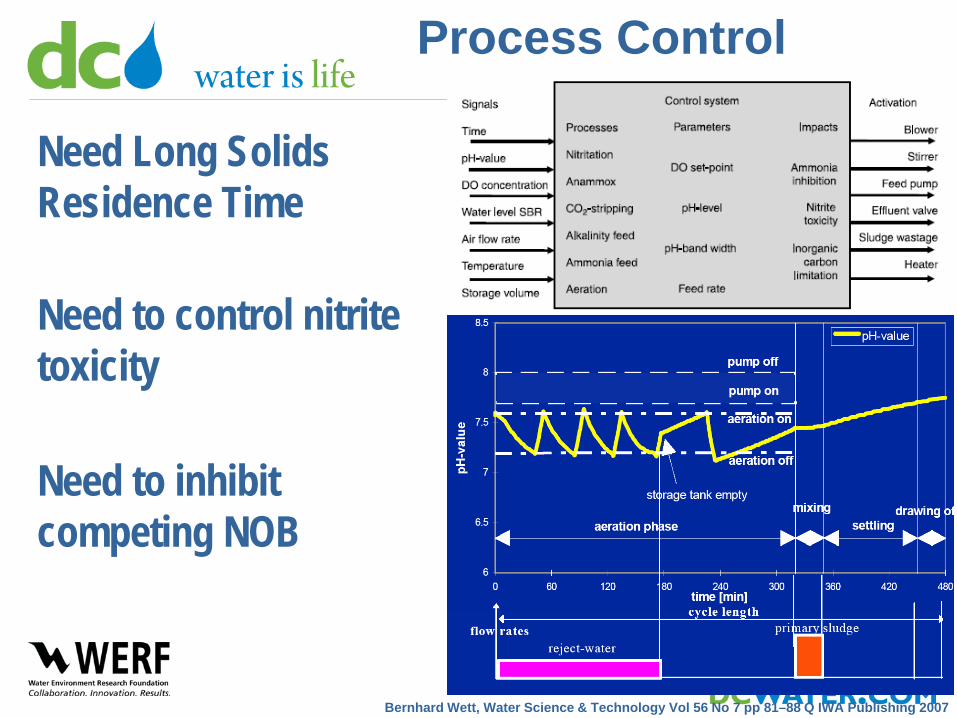
Process Control
Need Long Solids Residence Time
Need to control nitrite toxicity
Need to inhibit competing NOB
Bernhard Wett, Water Science & Technology Vol 56 No 7 pp 81–88 Q IWA Publishing 2007
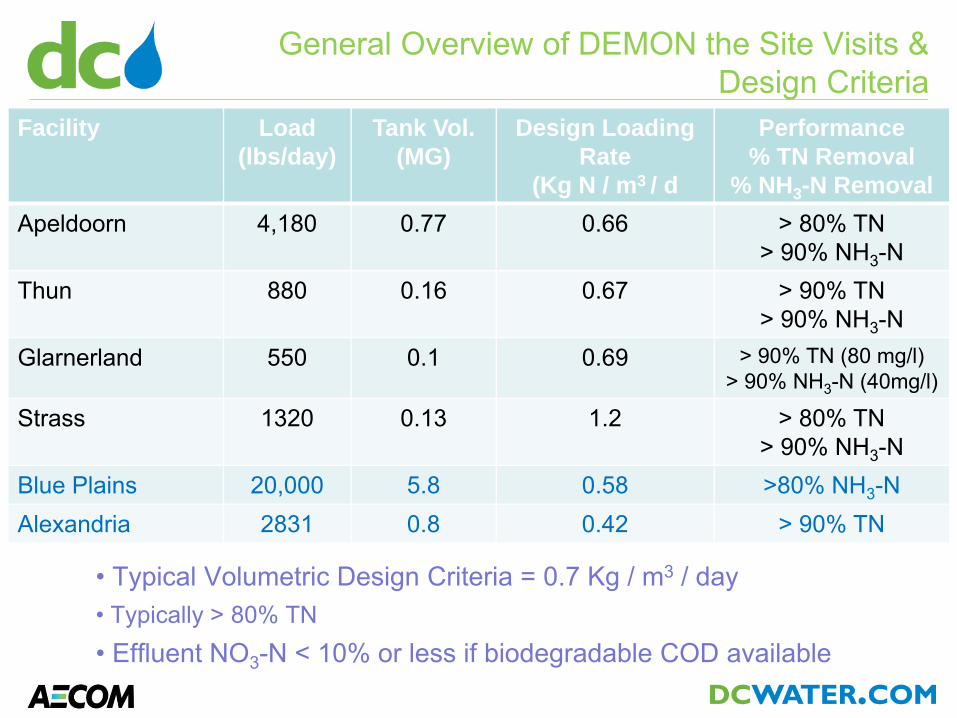
General Overview of DEMON the Site Visits & Design Criteria
Facility Load (lbs/day)
Tank Vol. (MG)
Design Loading Rate
(Kg N / m3 / d
Performance% TN Removal
% NH3-N Removal Apeldoorn 4,180 0.77 0.66 > 80% TN
> 90% NH3-NThun 880 0.16 0.67 > 90% TN
> 90% NH3-NGlarnerland 550 0.1 0.69 > 90% TN (80 mg/l)
> 90% NH3-N (40mg/l)
Strass 1320 0.13 1.2 > 80% TN> 90% NH3-N
Blue Plains 20,000 5.8 0.58 >80% NH3-NAlexandria 2831 0.8 0.42 > 90% TN
• Typical Volumetric Design Criteria = 0.7 Kg / m3 / day• Typically > 80% TN • Effluent NO3-N < 10% or less if biodegradable COD available
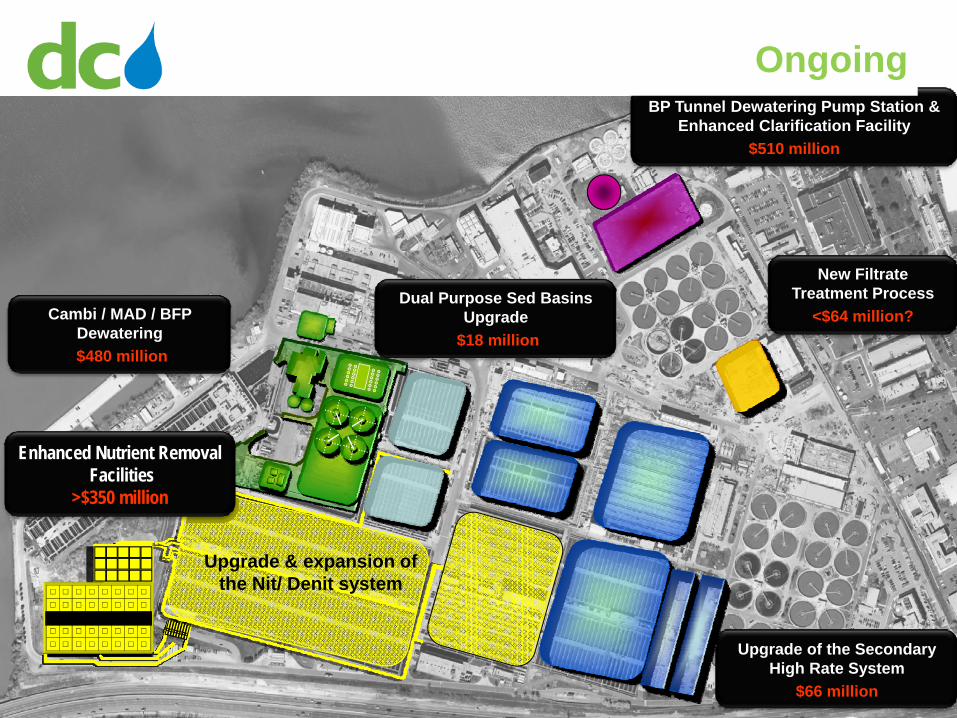
New Filtrate Treatment Process
<$64 million?
BP Tunnel Dewatering Pump Station & Enhanced Clarification Facility
$510 million
Upgrade & expansion of the Nit/ Denit system
Upgrade of the Secondary High Rate System
$66 million
Dual Purpose Sed Basins Upgrade
$18 million
Enhanced Nutrient RemovalFacilities
>$350 million
Ongoing
Cambi / MAD / BFP Dewatering$480 million
New Frontiers for Nutrient Removal
34
Upgrade & expansion of the Nit/ Denit system
Expansion
– Research & PlanningWhat’s Next?

Fundamentals of Deammonification
Oxygen demand 1.9 g / g NH+4-N oxidized
1 mol Ammonia(NH3/ NH4
+)
1 mol Nitrate(NO3
- )
75% O2
½ mol Nitrogen Gas(N2 )
25% O2
40% Carbon
60% Carbon
HeterotrophicAnoxic Environment
1 mol Nitrite(NO2
- )1 mol Nitrite
(NO2- )
NH4+ + 1.32 NO2
- + 0.066 HCO3- + 0.13 H+
0.26 NO3- + 1.02N2 + 0.066 CH2O0.5N0.15 + 2.03 H2O
0.44 mol N2+ 0.11 NO3-
0.57 mol NO2-
Partial Nitrification
40% O2
AutotrophicAerobic Environment
ANAMMOX Anaerobic Ammonium Oxidation
Autotrophic Nitrite Reduction(New Planctomycete, Strous et. al. 1999)
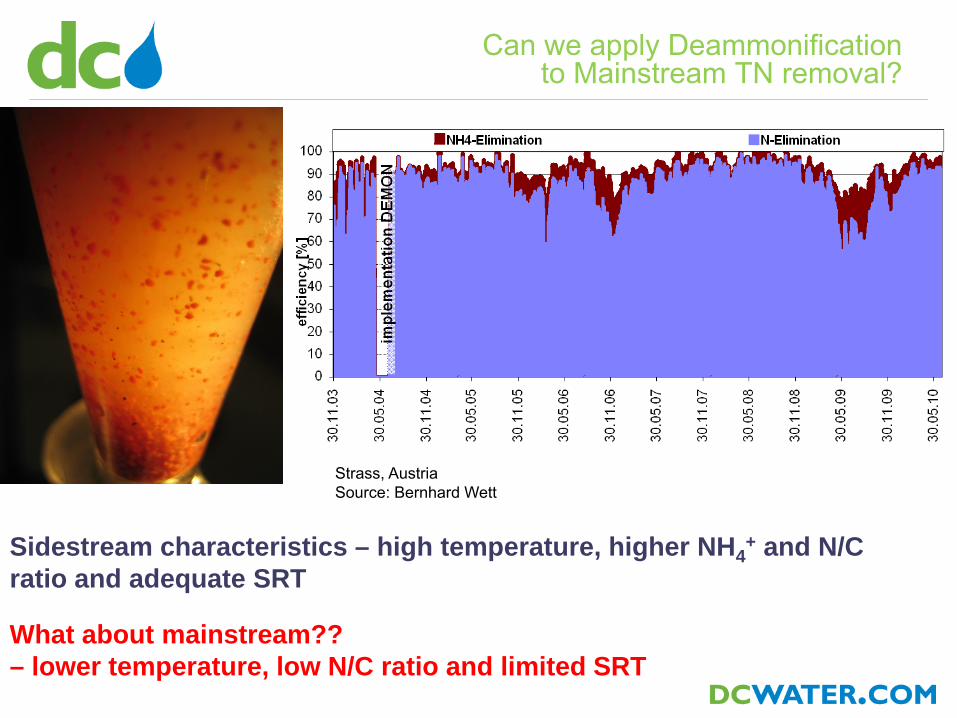
Stable performance in sidestream application
Sidestream characteristics – high temperature, higher NH4+ and N/C
ratio and adequate SRT
What about mainstream??– lower temperature, low N/C ratio and limited SRT
Strass, AustriaSource: Bernhard Wett
Can we apply Deammonification to Mainstream TN removal?
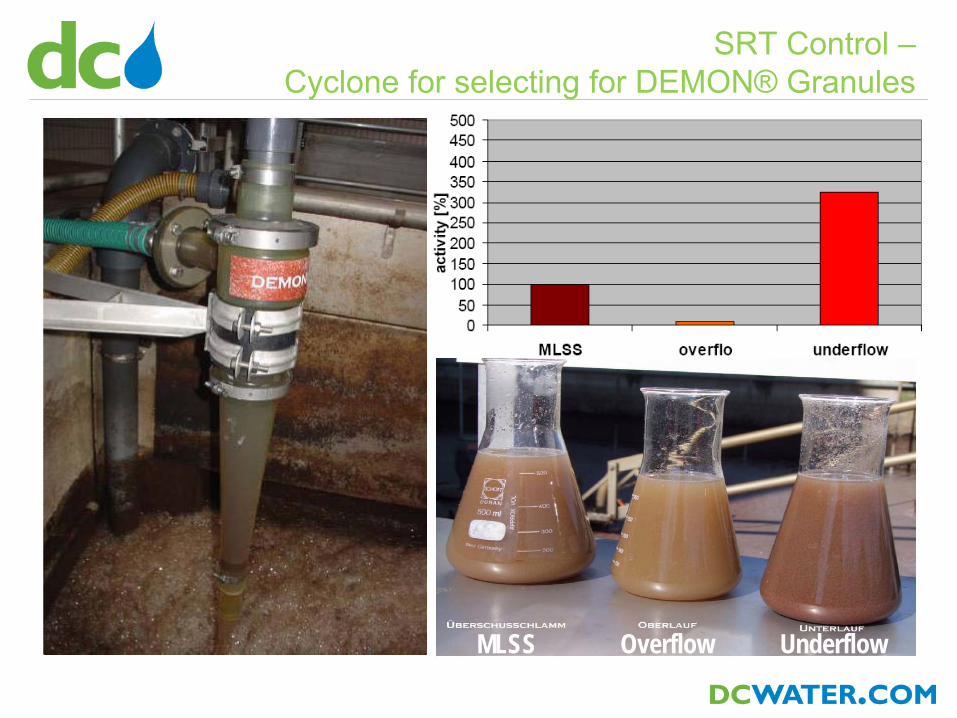
SRT Control –Cyclone for selecting for DEMON® Granules
MLSS Overflow Underflow
DEMON® strategy for mainstream treatment
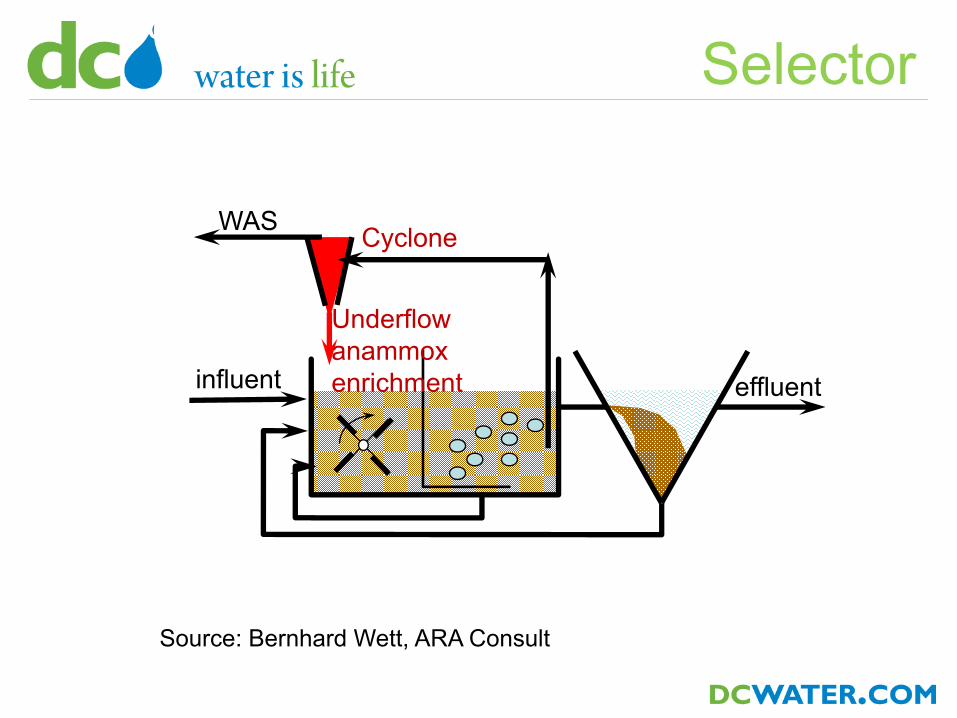
WAS
influent effluent
Cyclone
Underflow anammox enrichment
Selector
Source: Bernhard Wett, ARA Consult
• WERF Project: INFR6R11• Full-Plant Deammonification For Energy-
Positive Nitrogen Removal – Principal Investigators: Maureen O’Shaughnessy
and Bernhard Wett– Several utilities jointly investigating in Europe &
USA– Full-scale, pilot-scale, bench-scale– Kartik Chandran, Columbia University
Can we apply Deammonificationto Mainstream TN removal?
Can we apply Deammonificationto Mainstream TN removal?
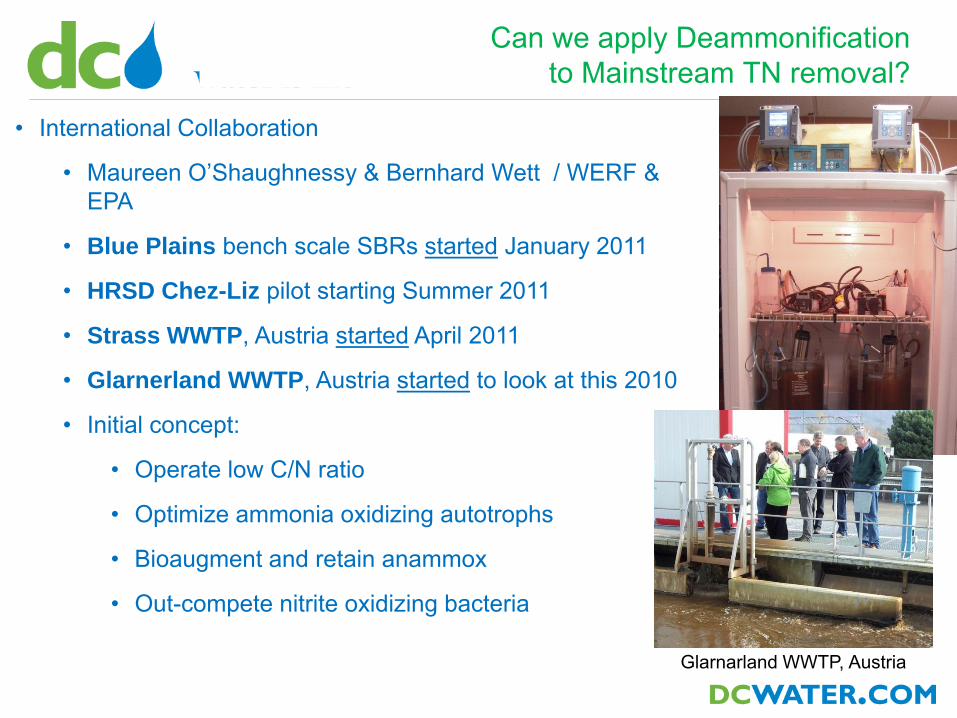
• International Collaboration
• Maureen O’Shaughnessy & Bernhard Wett / WERF & EPA
• Blue Plains bench scale SBRs started January 2011
• HRSD Chez-Liz pilot starting Summer 2011
• Strass WWTP, Austria started April 2011
• Glarnerland WWTP, Austria started to look at this 2010
• Initial concept:
• Operate low C/N ratio
• Optimize ammonia oxidizing autotrophs
• Bioaugment and retain anammox
• Out-compete nitrite oxidizing bacteria
Glarnarland WWTP, Austria
Blue Plains AWTP
-41-
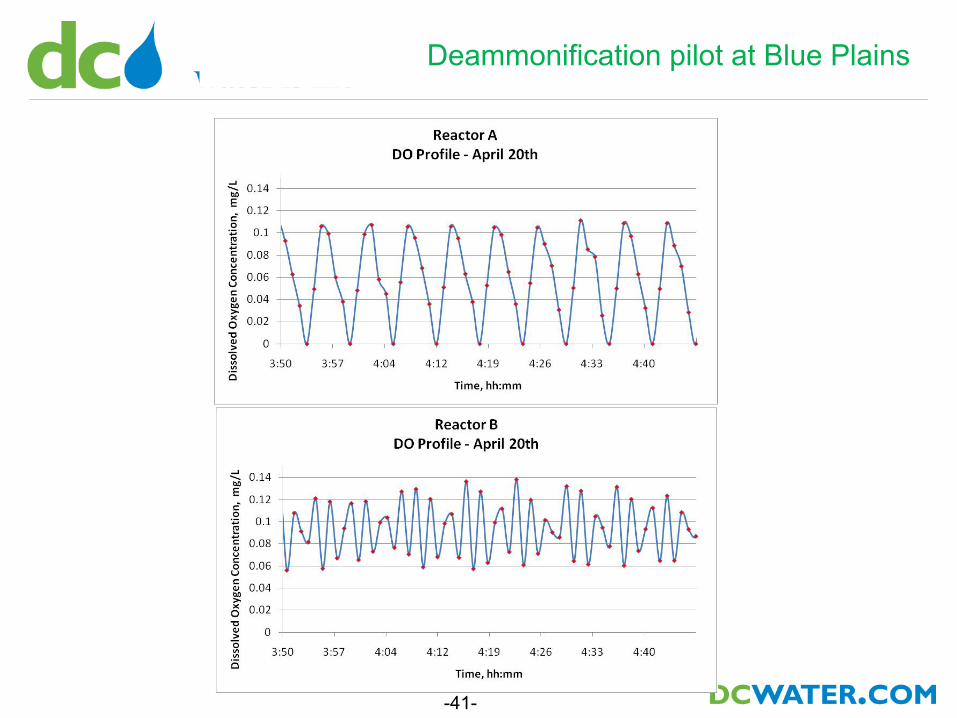
Deammonification pilot at Blue Plains

Reactor B – Profiling Specific Nitrogen Processing Rate
-42-

Preliminary results
Anammox-granules visible in mainstream activated sludge
• Preliminary and promising data• Three months of seeding• Could take a year for steady state• Nitrate concentration is significantly lower in deammonification lane
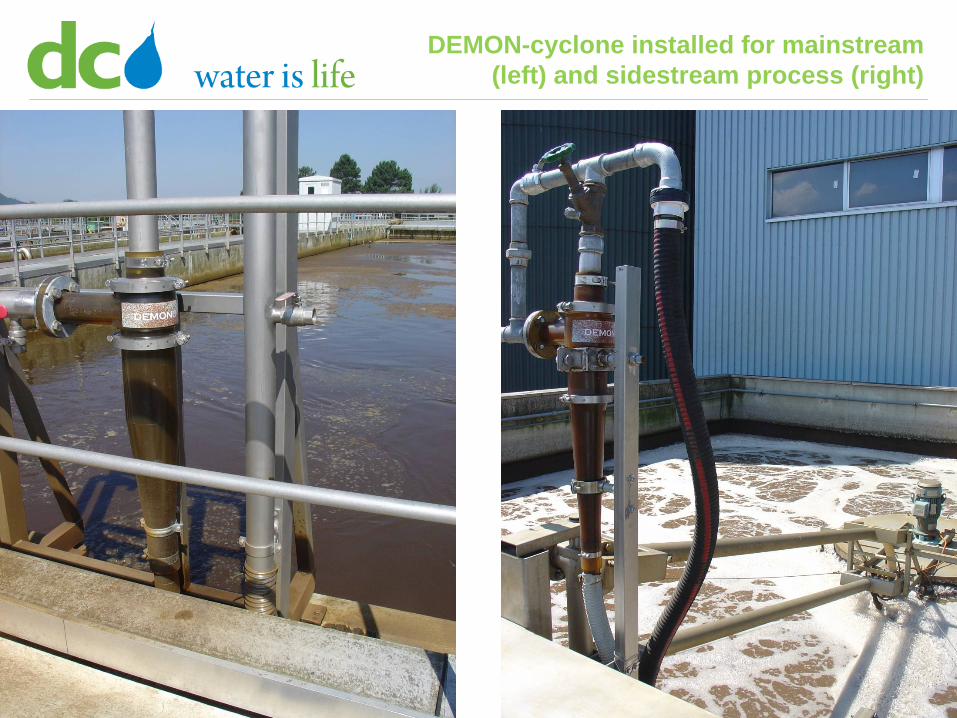
Full-scale experiments at WWTP GlarnerlandDEMON-cyclone installed for mainstream (left) and sidestream process (right)
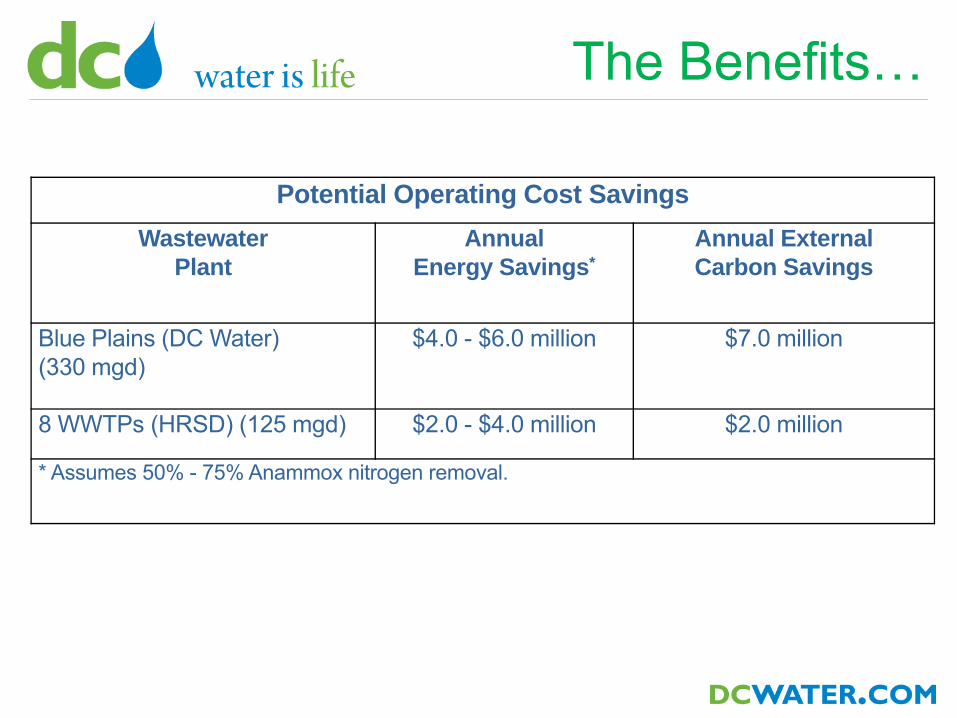
The Benefits…
Potential Operating Cost SavingsWastewater
PlantAnnual
Energy Savings*Annual External Carbon Savings
Blue Plains (DC Water) (330 mgd)
$4.0 - $6.0 million $7.0 million
8 WWTPs (HRSD) (125 mgd) $2.0 - $4.0 million $2.0 million
* Assumes 50% - 75% Anammox nitrogen removal.
Summary
• New technologies for nitrogen removal are in development
– Could considerably help reduce energy and carbon requirements for nitrogen removal
– Could go a long way towards energy positive wastewater treatment
– Compatible with existing infrastructure
48
How does the Program work?
• Collaboration (Teams)– Within DC Water (DWT, Program Management)– Other Utilities (ASA, WSSC, Fairfax County, HRSD)– Universities– Modeling Experts– External Research Agencies (primarily WERF)
Approximately 200 publications and presentations in the past 8 years
49
How does this Program work?
• Example Universities– Howard University– George Washington University– University of Maryland
– Virginia Tech– Virginia Military Institute– Bucknell University
– University of Innsbruck– University of Waterloo– Laurier University
Approximately 30 MS and PhDs in 8 years
55
Contact: Sudhir N. Murthy, PhD, PEDC Water
56