Autotrophic Nitrogen Removal from Low Concentrated Effluents

Prepared for
Maryland Department of the Environment
Refinement of Nitrogen Removal fromMunicipal Wastewater Treatment Plants
Presented by:Gannett Fleming, Inc.Stephen B. Gerlach, PE & Carrie DeSimoneIn partnership with George Miles Buhr, LLC

What is ENR?What is ENR?
Enhanced Nutrient RemovalEnhanced Nutrient Removal
Reduce nutrient discharges from Reduce nutrient discharges from WWTPs WWTPs
Use of stateUse of state--ofof--thethe--art microbial technology to break art microbial technology to break down nitrogen before dischargedown nitrogen before discharge
Next step from BNRNext step from BNR

Biological Nutrient Removal ProgramBiological Nutrient Removal Program(BNR Program)(BNR Program)
Implemented in 1983 by the Maryland Department of Implemented in 1983 by the Maryland Department of the Environment (MDE)the Environment (MDE)
Included 66 plants of capacity ≥ 0.5 MGDIncluded 66 plants of capacity ≥ 0.5 MGD
Plants retrofitted to achieve total nitrogen limits of 8 mg/lPlants retrofitted to achieve total nitrogen limits of 8 mg/l
Goal was 40% reduction of nutrients to Chesapeake Bay Goal was 40% reduction of nutrients to Chesapeake Bay (Bay)(Bay)
Have exceeded this goalHave exceeded this goal
Actual reductions from 1985 levels=16.9 million poundsActual reductions from 1985 levels=16.9 million pounds

Purpose of Enhanced Nutrient Removal StudyPurpose of Enhanced Nutrient Removal Study(ENR Study (ENR Study –– 2002 2002 –– 2004)2004)
Clear evidence plants could exceed 8 mg/lClear evidence plants could exceed 8 mg/l
EPA/MDE/Local Governments looking to achieve further nitrogen EPA/MDE/Local Governments looking to achieve further nitrogen reductions cost effectivelyreductions cost effectively
Enhancement of BNR Program in compliance with amended 2000 Enhancement of BNR Program in compliance with amended 2000 Chesapeake Bay Agreement by further reducing nutrients to the BaChesapeake Bay Agreement by further reducing nutrients to the Bayy
GF/GMB asked to evaluate 20 of the largest GF/GMB asked to evaluate 20 of the largest WWTPsWWTPs in MDin MD
Evaluate alternatives for reducing nitrogen in WWTP effluentEvaluate alternatives for reducing nitrogen in WWTP effluent
Develop cost estimate for alternativesDevelop cost estimate for alternatives
Extrapolate cost estimate to 66 plants in BNR Program which Extrapolate cost estimate to 66 plants in BNR Program which helped establish newly enacted flush taxhelped establish newly enacted flush tax

Cumberland WWTPConococheague WWTP
Hagerstown WPCP
Westminster WWTP
City of Frederick WWTP
Ballenger CreekWWTP
SenecaWWTP
Freedom District WWTP
Back River WWTPCox Creek WRF
Sod Run WWTP
Annapolis WRF
Hurlock WWTPCity of Cambridge WWTP
SalisburyWWTP
ParkwayWWTP
BowieWWTP
Little Patuxent WRF
Piscataway WWTP
Marley Taylor WRF
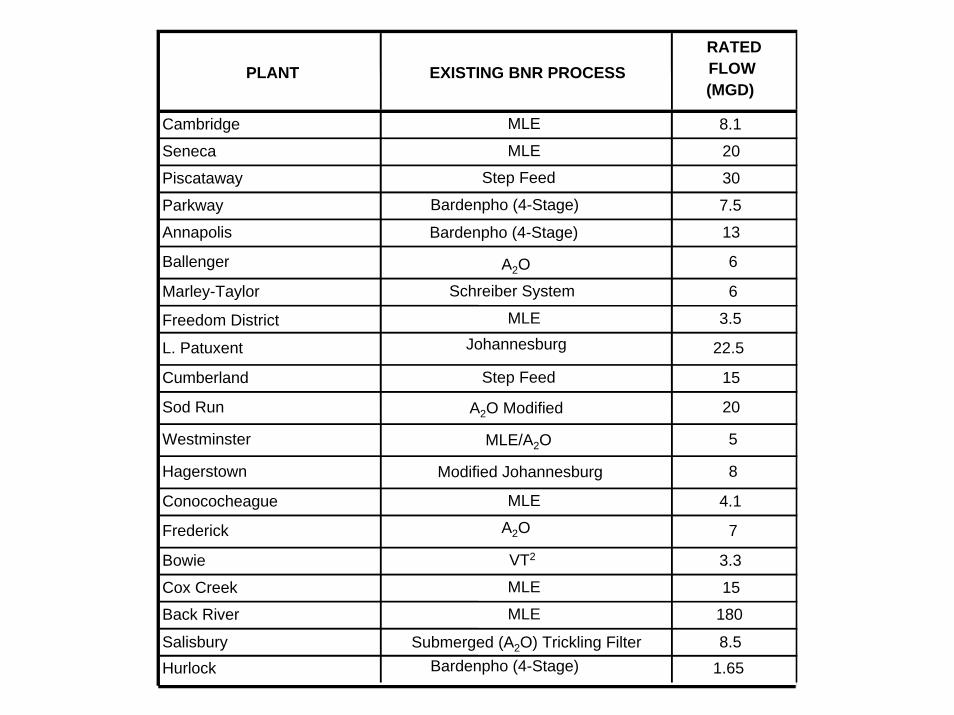
Current ProcessCurrent Process
Cambridge MLE 8.1
Seneca MLE 20
Piscataway Step Feed 30
Parkway Bardenpho (4-Stage) 7.5
Annapolis Bardenpho (4-Stage) 13
Ballenger A2O 6
Marley-Taylor Schreiber System 6
Freedom District MLE 3.5
L. Patuxent Johannesburg 22.5
Cumberland Step Feed 15
Sod Run A2O Modified 20
Westminster MLE/A2O 5
Hagerstown Modified Johannesburg 8
Conococheague MLE 4.1
Frederick A2O 7
Bowie VT2 3.3
Cox Creek MLE 15
Back River MLE 180
Salisbury Submerged (A2O) Trickling Filter 8.5Hurlock Bardenpho (4-Stage) 1.65
RATED FLOW (MGD)
PLANT EXISTING BNR PROCESS

Phase IPhase IApproachApproach
Phase I (2002Phase I (2002--2003): 2003): Evaluate ways to cost effectively reduce N in Evaluate ways to cost effectively reduce N in plant discharges plant discharges
Primary considerations in developing alternativesPrimary considerations in developing alternatives
developed biological models at each facility to estimate nitrogedeveloped biological models at each facility to estimate nitrogen n removal capacityremoval capacity
determined tank (reactor) volume requirements for each plant utidetermined tank (reactor) volume requirements for each plant utilizing lizing industry standards and individual plant dataindustry standards and individual plant data
site constraintssite constraints
existing plant configurationexisting plant configuration
cost effectiveness of alternativescost effectiveness of alternatives
Needed one or two processes that were proven and reliableNeeded one or two processes that were proven and reliable

Breakdown of BNR Processes in MarylandPhase I Challenge
25%
6%
15%
6%1%
6%
1%
3%
1%
7%
3%
6%
6%
1%
3%
1%
1%
1%
3%
MLE
A2O
Activated Sludge
Methanol AdditionOxidation Ditch
Overland
Lagoon
Schreiber
Bardenpho
RBC
Trickling Filter
Step Feed

Biological Nitrogen RemovalBiological Nitrogen RemovalNitrogen CycleNitrogen Cycle
ENR process takes additional time and requires additional tank volume beyond BNR.

Modified Modified LudzackLudzack--EttingerEttinger(MLE Process)(MLE Process)
Anoxic
Oxic
Clarifier
Internal
Recycle
RAS
Cox Creek WRF, Anne Arundel Co.15 mgd
WAS

AA22O ProcessO Process
Anoxic
Anaerobic
Oxic
Internal
Recycle
Clarifier
RAS
Sod Run WWTP, Harford Co.20 mgd
WAS

BardenphoBardenpho ProcessProcess
Demonstrated ability to Demonstrated ability to achieve 3 mg/lachieve 3 mg/l
Least costly option Least costly option
Requires existing tank Requires existing tank modification or additional modification or additional tankage
Anoxic
Oxic
Anoxic
Oxic
Clarifier
Internal
RecycleRAS
tankage
WAS

Additional tankage required for Bardenpho

SeparateSeparate--Stage Stage DenitrificationDenitrificationDenitrificationDenitrification FiltersFilters
Recommended when existing Recommended when existing process nearly achieves process nearly achieves complete nitrificationcomplete nitrification
No cost effective space No cost effective space available for additional available for additional reactor volumereactor volume

Denitrification Filters

Phase I Phase I Cost EstimatingCost Estimating
Process EquipmentProcess EquipmentDenitrificationDenitrification filters; Blowers; Pumps; Diffusersfilters; Blowers; Pumps; DiffusersObtained manufacturer cost for several plantsObtained manufacturer cost for several plantsExtrapolated equipment costs to other plantsExtrapolated equipment costs to other plants
Other CostsOther CostsRSMeansRSMeans estimating toolsestimating tools
Operation and Maintenance CostsOperation and Maintenance CostsFactors applied for disciplinesFactors applied for disciplines
ArchitecturalArchitecturalCivilCivilMechanicalMechanicalElectricalElectrical

STUDY METHODOLOGY STUDY METHODOLOGY TWO PHASESTWO PHASES
Phase II (2003Phase II (2003--2004)2004)Present findings from Phase I to municipalitiesPresent findings from Phase I to municipalities
Request current operational dataRequest current operational data
Discuss planned expansion activitiesDiscuss planned expansion activities
Solicit feed back on report findingsSolicit feed back on report findings
Update Phase I data, costs and conclusionsUpdate Phase I data, costs and conclusions

PHASE II FEED BACKPHASE II FEED BACK
General acceptance of study recommendationsGeneral acceptance of study recommendations
“One process is not suitable for every plant”“One process is not suitable for every plant”
“Detailed designs need to be performed for every plant”“Detailed designs need to be performed for every plant”
“Costs need to be indexed to Engineering News Record “Costs need to be indexed to Engineering News Record (ENR)”(ENR)”
“Costs for some facilities are too low”“Costs for some facilities are too low”I&CI&C
FoundationFoundation
EngineeringEngineering

Cost Estimates RevisionsCost Estimates Revisions
Moved costs for 2002 Moved costs for 2002 Sept. 2004Sept. 2004
Applied 10% to siteApplied 10% to site--limited plants such as Cox Creek and Sod Runlimited plants such as Cox Creek and Sod Run
Added $50/ftAdded $50/ft22 for geotechnical at select plantsfor geotechnical at select plants
Added methanol systems for each plantAdded methanol systems for each plant
Added methanol control at plants with Added methanol control at plants with denitedenite filtersfilters
Nitrate analyzers and loop controllersNitrate analyzers and loop controllers
Added lift pumping stations at plants with Added lift pumping stations at plants with denitedenite filtersfilters

RAW INFLUENT
SCREENING
GRIT REMOVAL
PRIMARY CLARIFIERS
ANAEROBIC
ANAEROBIC
ANAEROBIC
ANAEROBIC
OXIC
ANOXIC
ANOXIC
ANOXIC
ANOXIC
OXIC
OXIC
OXIC
SECONDARY CLARIFIER
FILTRATION
UV DISINFECTION
OUTFALL TO MONOCACY RIVER
Existing Ballenger Wastewater Treatment Plant6.0 mgd
MIXEDLIQUOR
RECYCLE
RAS
•A2O Process•BOD:TKN = 7:1•Influent Avg. TKN – 38•Current TN Discharge: 146,100 lbs•Projected TN Discharge: 54,800 lbs•Reduction of 91,300 lb/yr
Case StudyCase Study

RAW INFLUENT
SCREENING
GRIT REMOVAL
PRIMARY CLARIFIERS
ANOXIC
ANOXIC
ANOXIC
ANOXIC
OXIC
ANOXIC
ANOXIC
OXIC
OXIC
OXIC
OXIC
OXIC
SECONDARY CLARIFIER
FILTRATION
UV DISINFECTION
OUTFALL TO MONOCACY RIVER
Proposed Alternate for Ballenger Wastewater Treatment Plant
ANOXIC
MIXEDLIQUOR
RECYCLE
RAS
Sufficient volume for 4-Stage BardenphoAdd partition walls
Increase MLSS 2500 3500Adequate clarifier capacity Adequate pump capacity
Increase IR 200% 500%Add additional IR pumps
Add chemical phosphorus removalAdequate FeCl3 System
Estimated Cost for ENR: $3,800,000
Case StudyCase Study

Case StudyCase Study
Cox Creek Water Reclamation FacilityAnne Arundel County15 mgd
• Existing MLE Process• Insufficient Reactor Volume Available• No Space for Additional Tankage• Solution – Denitrification Filter (requires
demo of digesters)• Current TN Discharge: 365,300 lb/yr• Projected TN Discharge: 136,990 lb/yr• Reduction of 228,310 lb/yr

Case StudyCase Study
Cox Creek Water Reclamation FacilityAnne Arundel County15 mgd ESTIMATED COST FOR
REFINEMENT OF NITROGEN REMOVAL ATCOX CREEK WATER RECLAMATION FACILITY
Item CostProcess Mechanical $9,782,000Electrical $2,935,000Mechanical $978,000Architectural $978,000Site work $1,956,000
Subtotal $16,629,000
Study, Design, and Construction Phase Engineering (15%) $2,494,000Escalation per ENR Cost Index $1,164,000Mobilization $1,663,000Construction Contingency (25%) $4,157,000
Total Estimated Cost $26,107,000

CambridgeReconfiguration to
Bardenpho123,257 $1,750,000 $0.96 $0.22
Seneca
Increase in internal recycle and
Reconfiguration to Bardenpho
304,410 $4,140,000 $0.92 $0.21
PiscatawayReconfiguration to
Bardenpho456,600 $8,273,000 $1.22 $0.28
ParkwayMethanol Trim and Final
Clarifiers91,415 $2,800,000 $2.04 $0.37
AnnapolisAdditional Reactor
Volume124,828 $5,062,000 $2.73 $0.39
Ballenger
Increase in internal recycle and
Reconfiguration to Bardenpho
91,323 $4,831,000 $3.56 $0.81
Marley-TaylorAddition of anoxic and
oxic volume25,200 $11,356,000 $30.29 $1.89
FreedomProcess optimization
and Reconfiguration to Bardenpho
53,235 $3,472,000 $4.38 $0.99
L. Patuxent Denitrification filters 194,523 $28,000,000 $9.68 $1.78
Cumberland
IR, RAS Pumps, additional reactor
volume, reconfiguration to Bardenpho
228,308 $16,500,000 $4.85 $1.10
Sod Run Denitrification filters 304,410 $22,568,000 $4.98 $1.13
Westminster Denitrification filters 76,114 $8,600,000 $7.64 $1.72
Hagerstown Denitrification filters 133,940 $8,900,000 $4.46 $1.11
Conococheague None NA NA NA NA
Frederick Denitrification filters 104,528 $9,900,000 $6.37 $1.41
Bowie Denitrification filters 50,228 $1,000,000 $0.55 $1.75
Cox Creek Denitrification filters 228,308 $26,107,000 $7.69 $1.74
Back River Denitrification filters 2,739,690 $250,850,000 $6.15 $1.39
Salisbury NA 333,800 $30,175,000 $5.30 $4.18
HurlockAdditional reactor
volume50,228 $6,200,000 $8.30 $3.76
TOTAL 5,714,000 AVE. $5.90 $1.38NOTES: MAX. $30.29 $4.18
MIN. $0.55 $0.21
COST PER GALLON TREATED (3)
ESTIMATED ENR COST(SEPT. 2004 ENG. NEWS RECORD COST INDEX)
COST PER POUND REMOVED (2)
POUNDS TN REMOVED
WITH ENR MODIFICATIONS (1)
PLANTEXISTING (OR CURRENTLY DESIGNED) BNR
PROCESS
Johannesburg
ENR MODIFICATIONS
Modified Ludzack-Ettinger (MLE)
Modified Ludzack-Ettinger
Step Feed
4-Stage Bardenpho
4-Stage Bardenpho
Schreiber System
A2O
Modified Ludzack-Ettinger
Step Feed
A2 O Modified
MLE/A2O
Modified Johannesburg
Modified Ludzack-Ettinger
A2O
VT2 Oxidation Ditch
Modified Ludzack-Ettinger
Modified Ludzack-Ettinger
A2O Trickling Filter
4-Stage Bardenpho
Total Pounds Nitrogen Removed with ENR: 5,714,000
Cost per lb. removed Cost per gal. treated
Avg $ 5.90 $ 1.38
Max $30.29 $ 4.18
Min $ 0.55 $ 0.21

ResultsResultsCost per Gallon of ENR Cost per Gallon of ENR
ImprovementsImprovements
$0.00
$0.50
$1.00
$1.50
$2.00
$2.50
$3.00
$3.50
$4.00
Annap
olis
Hurloc
kSali
sbury
Cumbe
rland
Parkway
Senec
aBall
enge
rCam
bridg
ePisc
ataway
Freedo
mMarl
ey Tay
lorL.
Patuxe
ntSod
Run
Hagers
town
Wes
tmins
terFred
erick
Bowie
Back R
iver
Cox C
reek
ADDITIONAL REACTOR VOLUME REQUIRED
CONVERSION TO BARDENPHO WITHIN EXISTING REACTOR VOLUME
DENITRIFICATION FILTERS

CONCLUSIONSCONCLUSIONS
Single phase implementation of ENR is most cost effectiveSingle phase implementation of ENR is most cost effective
Alternative carbon sources add flexibilityAlternative carbon sources add flexibility
Independent study required to establish best treatment Independent study required to establish best treatment alternativealternative
Average costsAverage costs
$5.90 per pound nitrogen removed
$1.38 per gallon treated
Closely matches previous BNR costsClosely matches previous BNR costs

Prepared for
Maryland Department of the Environment
Refinement of Nitrogen Removal fromMunicipal Wastewater Treatment Plants
QUESTIONS?