NITROGEN – POLLUTION AND ITS IMPACTS
69
1 NITROGEN POLLUTION AND ITS IMPACTS OUTLINE: 1. Background – forms and cycling 2. Pools and Sources 3. Cycling, transport dynamics and loadings from watersheds 4. Landuse and N exports 5. Management Options to reduce N 6. Effects and impacts of excess N on ecosystems Notes based on – • Environmental Protection Agency. 2002. Nitrogen: Multiple and Regional Impacts. EPA-430-R-01-006. • Follett, R. 2008. Chapter 2: Transformation and ransport processes of nitrogen in Agricultural Systems. In Nitrogen in the Environment: Sources, Problems, and Management. • Passeport et al. 2013; Environmental Management
Transcript of NITROGEN – POLLUTION AND ITS IMPACTS
1
NITROGEN POLLUTION AND ITS IMPACTS
OUTLINE:
1. Background – forms and cycling 2. Pools and Sources 3. Cycling, transport dynamics and loadings from watersheds
4. Landuse and N exports
5. Management Options to reduce N 6. Effects and impacts of excess N on ecosystems Notes based on –
• Environmental Protection Agency. 2002. Nitrogen: Multiple and Regional Impacts. EPA-430-R-01-006.
• Follett, R. 2008. Chapter 2: Transformation and ransport processes of nitrogen in Agricultural Systems. In Nitrogen in the Environment: Sources, Problems, and Management.
• Passeport et al. 2013; Environmental Management
2
Forms of N: Inorganic: Reduced
1. NH4+ (ammonium – g, aq, s)
2. N2 (nitrogen – g) 3. N2O (nitrous oxide – g) 4. NO (nitric oxide – g) 5. NH3 (g, aq)
Oxidized
1. NO2- (nitrite – aq)
2. NO2 (nitrogen dioxide - g) 3. NO3
- (nitrate – aq) Organic N – urea, amines, proteins and nucleic acids Tied to carbon molecules
3
Reactive vs. Non-reactive species Non-reactive – Nitrogen gas N2 – atmosphere - largest N store on the planet (78%) Reactive (Nr) – • Ammonia • Ammonium • Nitrogen oxides • Nitric acid • Nitrous oxide • Organic compounds
N2 ↔Nr Concern – Anthropogenic activities increasing Nr accumulation in environmental reservoirs – and increasing impacts on these reservoirs.
4
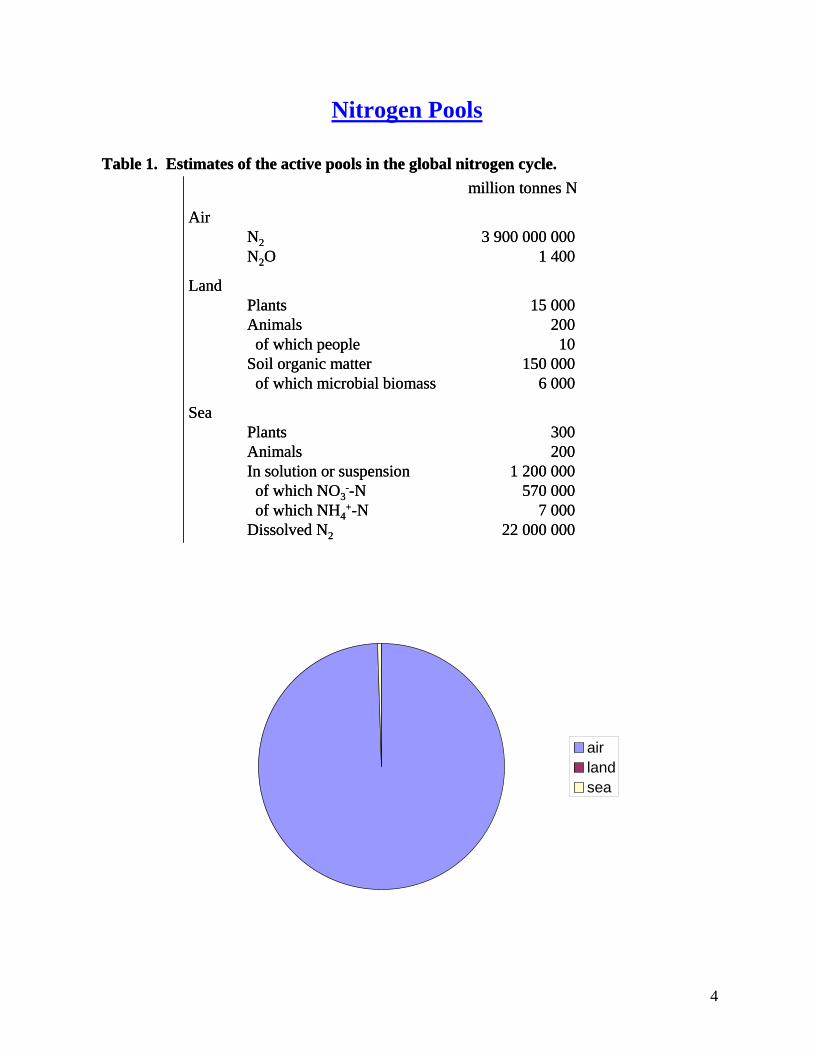
Nitrogen Pools
airlandsea
Table 1. Estimates of the active pools in the global nitrogen cycle.million tonnes N
AirN2 3 900 000 000N2O 1 400
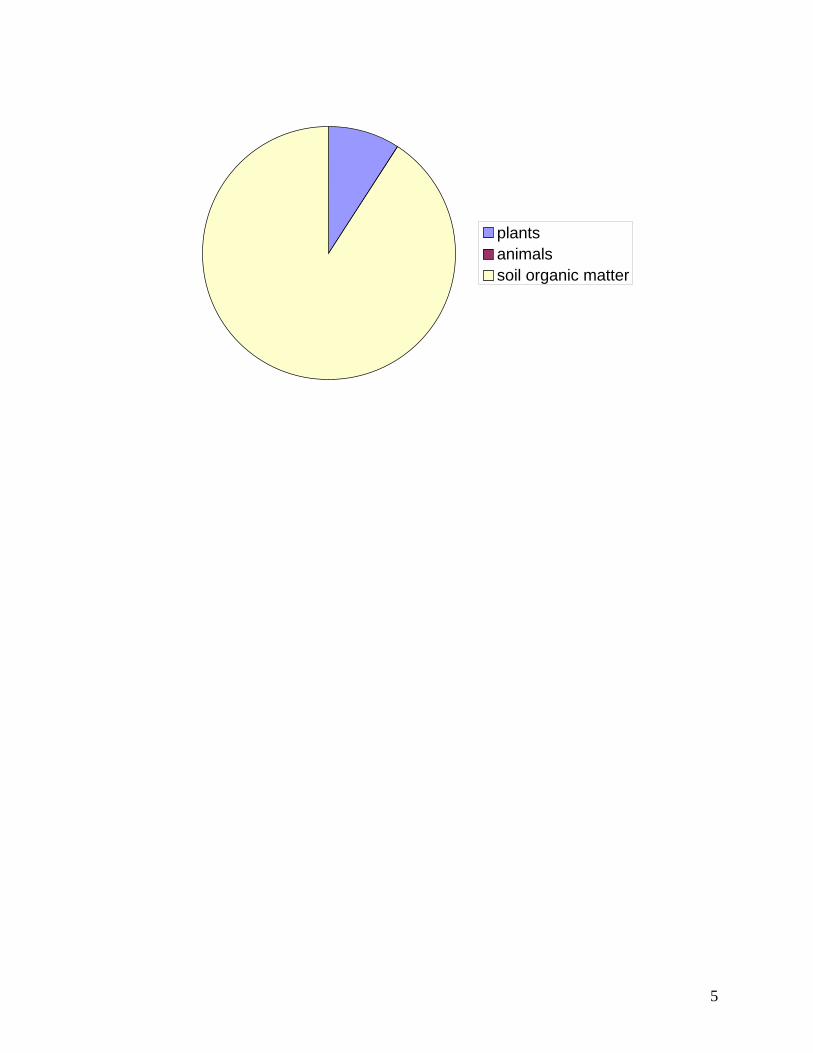
LandPlants 15 000Animals 200
of which people 10Soil organic matter 150 000
of which microbial biomass 6 000
SeaPlants 300Animals 200In solution or suspension 1 200 000
of which NO3--N 570 000
of which NH4+-N 7 000
Dissolved N2 22 000 000
Table 1. Estimates of the active pools in the global nitrogen cycle.million tonnes N
AirN2 3 900 000 000N2O 1 400
LandPlants 15 000Animals 200
of which people 10Soil organic matter 150 000
of which microbial biomass 6 000
SeaPlants 300Animals 200In solution or suspension 1 200 000
of which NO3--N 570 000
of which NH4+-N 7 000
Dissolved N2 22 000 000
5
plantsanimalssoil organic matter
6
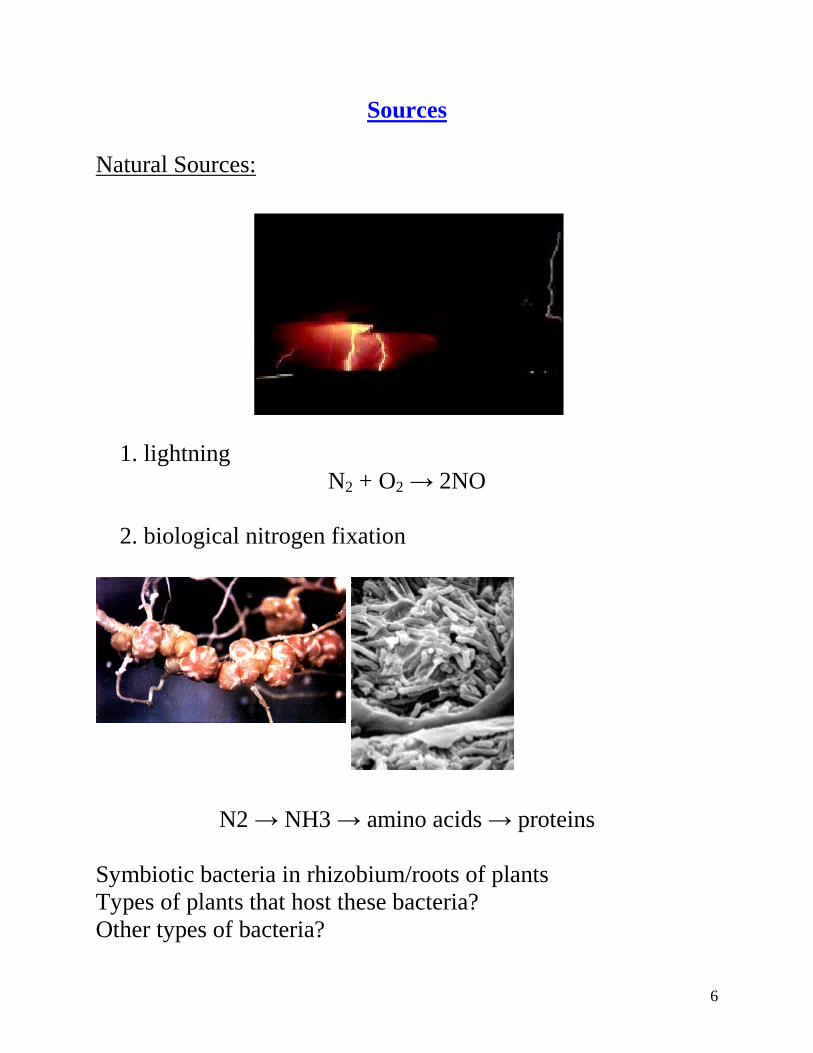
Sources Natural Sources:
1. lightning N2 + O2 → 2NO
2. biological nitrogen fixation
N2 → NH3 → amino acids → proteins Symbiotic bacteria in rhizobium/roots of plants Types of plants that host these bacteria? Other types of bacteria?
7
Plants – alfalfa, clovers, peas, beans, etc. Prior to anthropogenic influences - there was a balance between BNF and denitrification which kept Nr low Anthropogenic sources
1. Burning of fossil fuels
2. Widespread cultivation of N fixing crops
3. Use of fertilizers in agriculture – synthetic and animal manures
4. Urban, suburban, rural sources – wastewater, lawn fertilizers, septic tanks, CSOs.
Human activity has had a profound effect on the N cycle. 1. Energy production - under high temperature combustion processes, unreactive nitrogen is converted to reactive nitrogen by two processes. a. Thermal NOx 1000oK N2 + O2 → 2NO
8
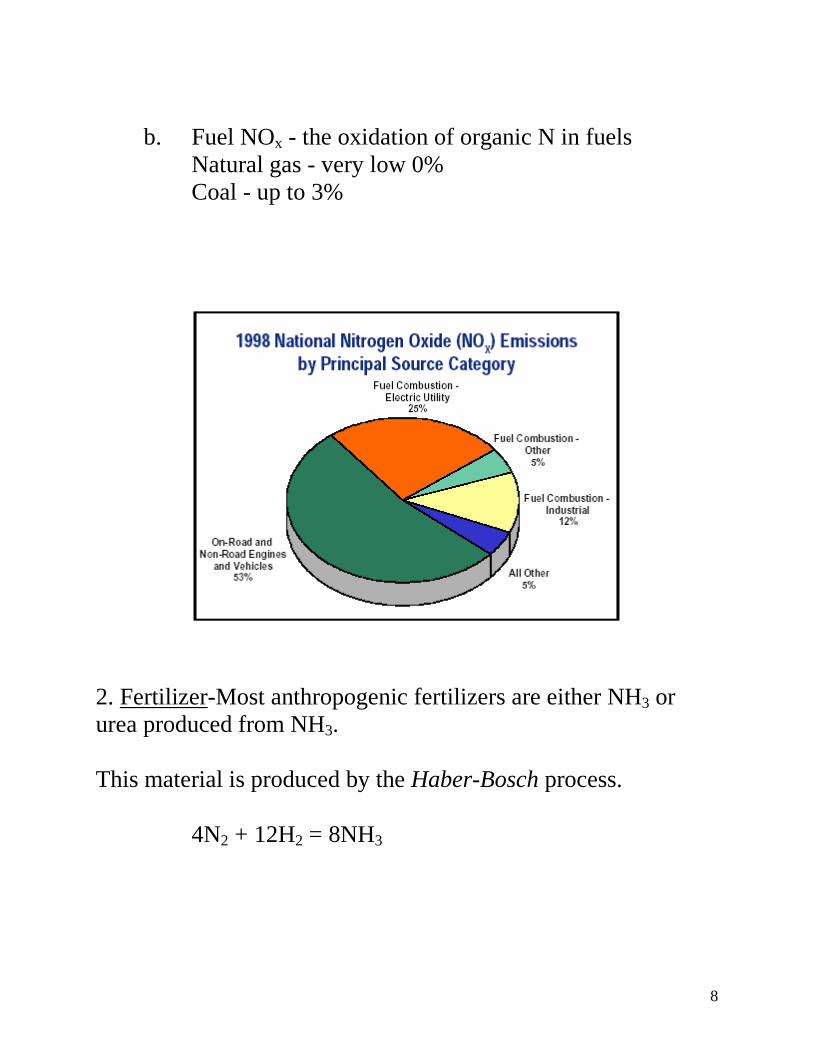
b. Fuel NOx - the oxidation of organic N in fuels Natural gas - very low 0% Coal - up to 3%
2. Fertilizer-Most anthropogenic fertilizers are either NH3 or urea produced from NH3. This material is produced by the Haber-Bosch process. 4N2 + 12H2 = 8NH3
9
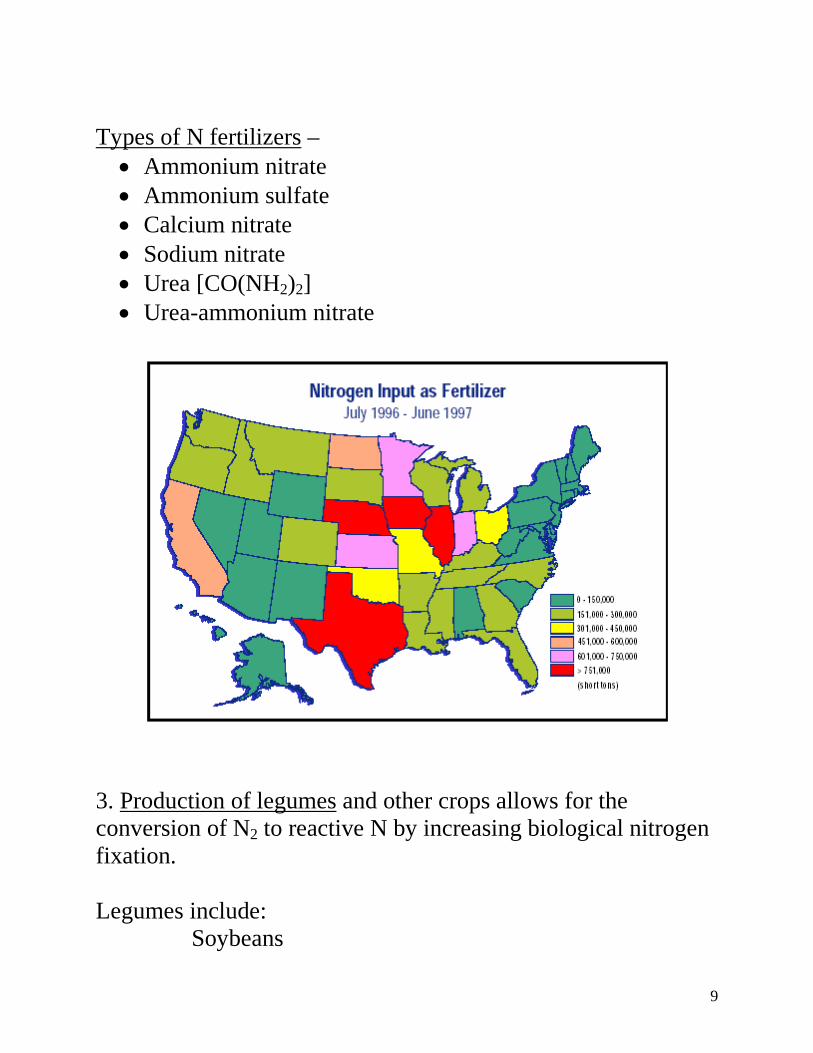
Types of N fertilizers – • Ammonium nitrate • Ammonium sulfate • Calcium nitrate • Sodium nitrate • Urea [CO(NH2)2] • Urea-ammonium nitrate
3. Production of legumes and other crops allows for the conversion of N2 to reactive N by increasing biological nitrogen fixation. Legumes include: Soybeans

10
Ground nuts (peanuts) Pulses (lentils) Forage (alfalfa, clover)
11
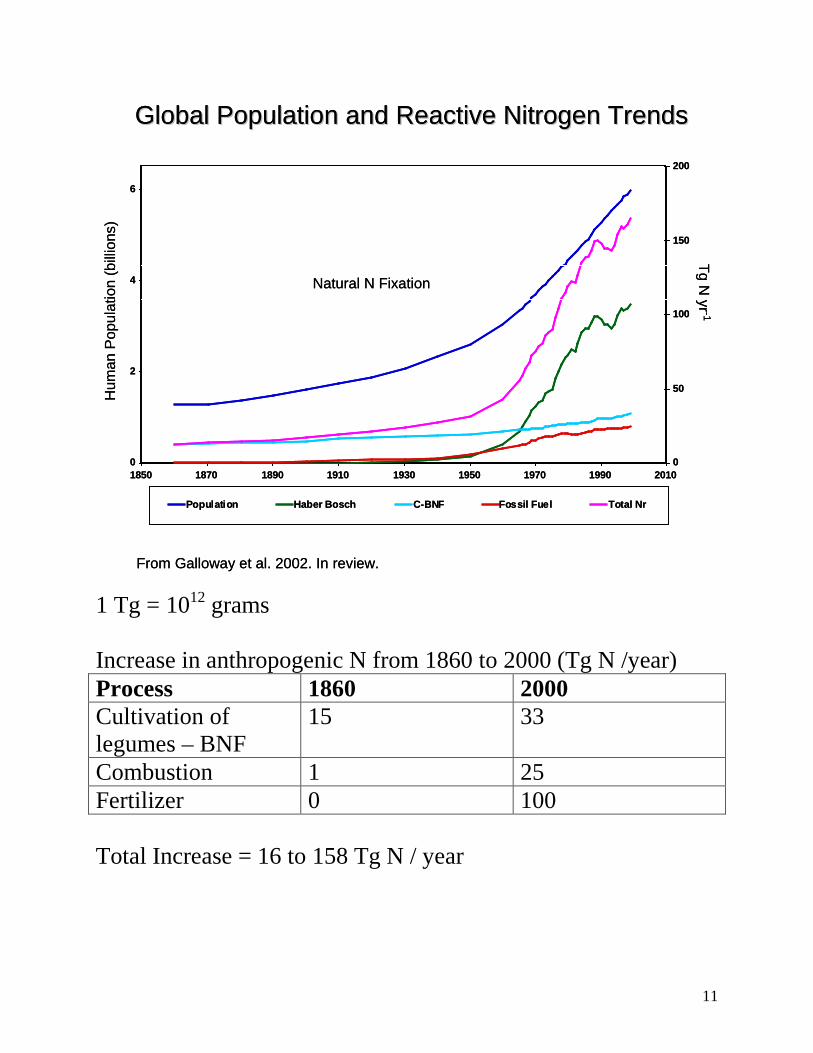
1 Tg = 1012 grams Increase in anthropogenic N from 1860 to 2000 (Tg N /year) Process 1860 2000 Cultivation of legumes – BNF
15 33
Combustion 1 25 Fertilizer 0 100 Total Increase = 16 to 158 Tg N / year
0
2
4
6
1850 1870 1890 1910 1930 1950 1970 1990 20100
50
100
150
200
Population Haber Bosch C-BNF Fossil Fuel Total Nr
Global Population and Reactive Nitrogen TrendsGlobal Population and Reactive Nitrogen Trends
From Galloway et al. 2002. In review.
Hum
an P
opul
atio
n (b
illio
ns)
TgN
yr -1
Natural N Fixation
12
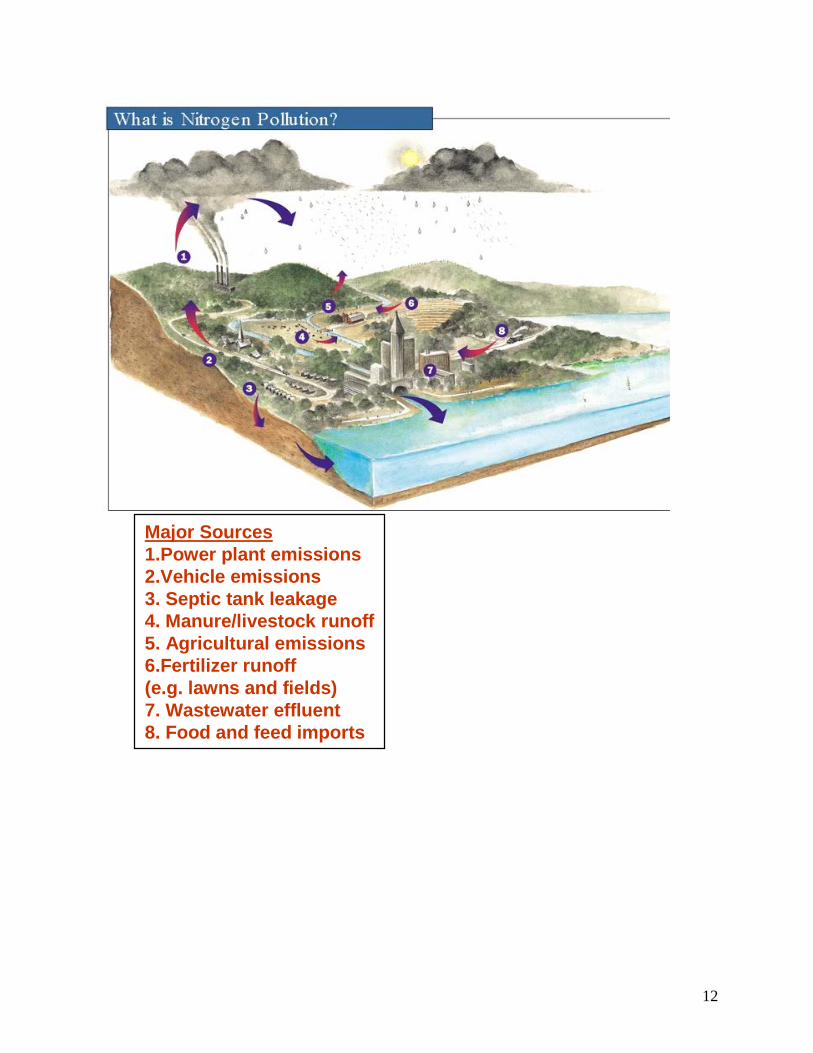
Major Sources1.Power plant emissions2.Vehicle emissions3. Septic tank leakage4. Manure/livestock runoff5. Agricultural emissions6.Fertilizer runoff(e.g. lawns and fields)7. Wastewater effluent8. Food and feed imports
13
What happens to inputs of Nr? • Denitrification (loss as N2 gas) • Biomass storage (crops, forests, animals) • Soil storage • Groundwater storage • Exported to streams/estuaries • Exported in food and feed
14
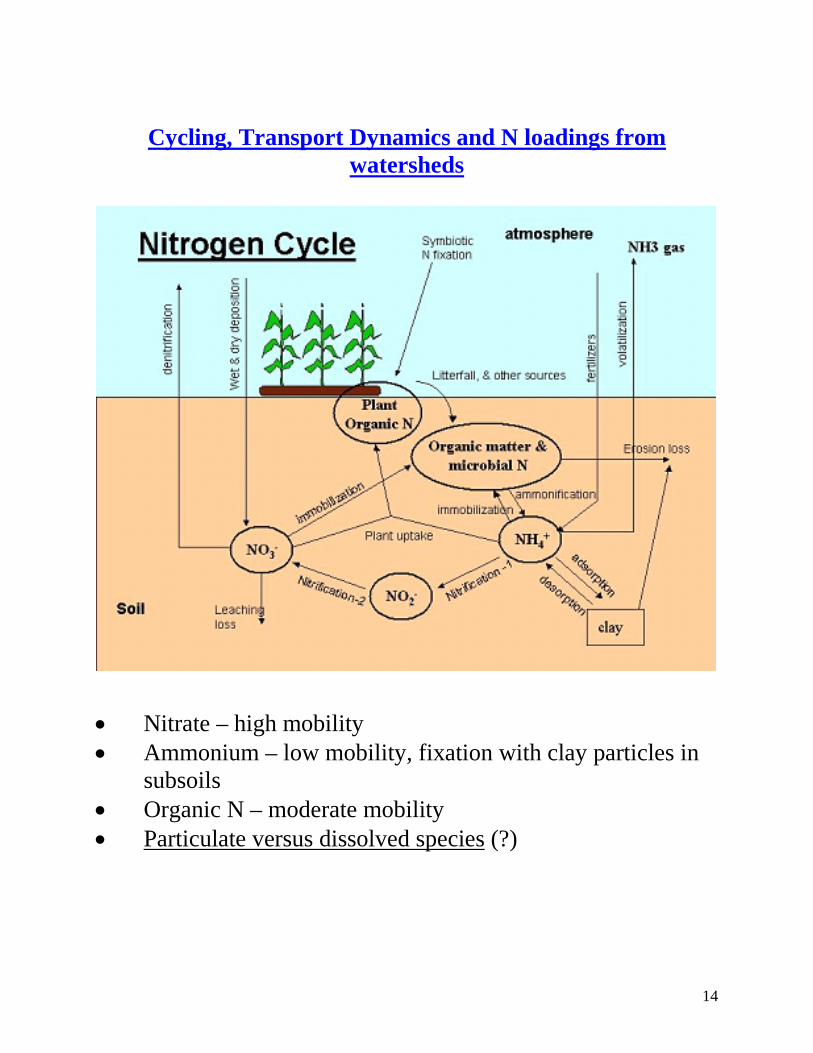
Cycling, Transport Dynamics and N loadings from
watersheds
• Nitrate – high mobility • Ammonium – low mobility, fixation with clay particles in
subsoils • Organic N – moderate mobility • Particulate versus dissolved species (?)
15
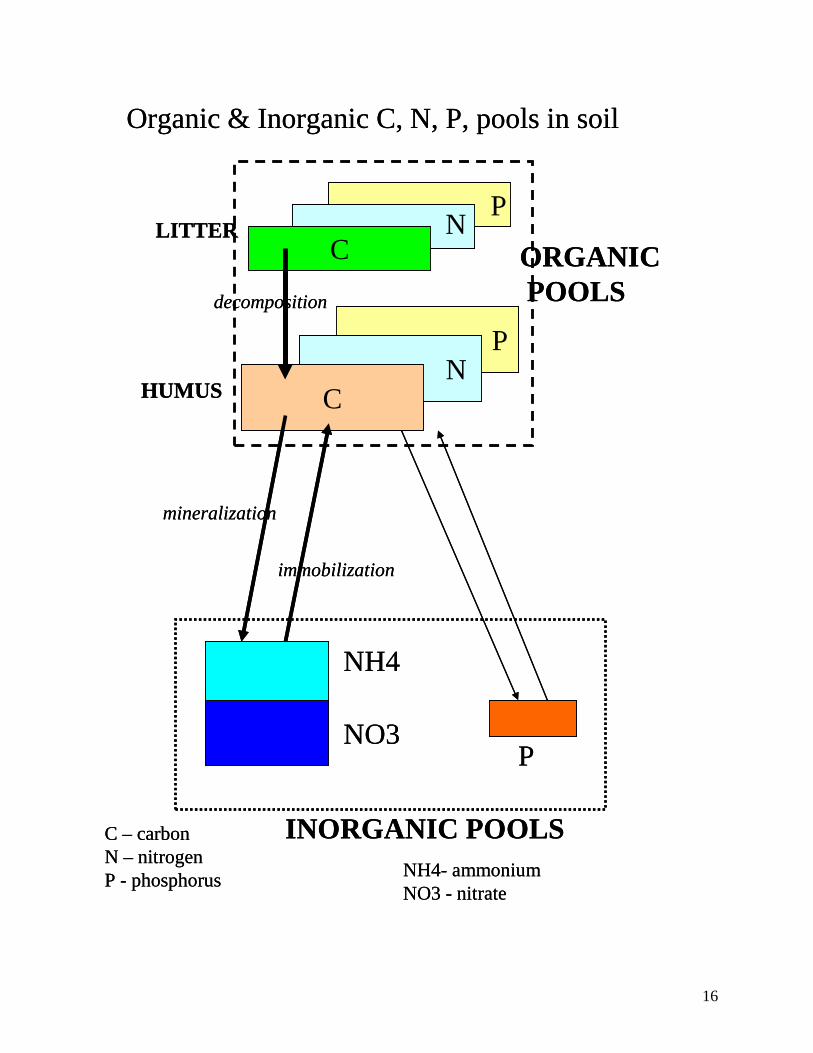
Key N Cycle Processes: Mineralization & Immobilization: • Mineralization: Conversion of organic N into inorganic N
forms (NH4+, NO3
-) – via processes like decomposition -- organic N forms decompose and form ammonium first.
• 1.5 to 3.5 % of the organic N may mineralize annually
• Immobilization: Conversion of inorganic N forms to
organic N forms (via processes like plant & biological uptake) o NH4+ preferably immobilized compared to NO3-
The carbon and nitrogen pool ratios in soils and implications for mineralization and immobilization
16
P
C
NC
ORGANICPOOLS
NH4
NO3P
INORGANIC POOLS
LITTER
HUMUS
mineralization
immobilization
N P
C – carbonN – nitrogenP - phosphorus NH4- ammonium
NO3 - nitrate
Organic & Inorganic C, N, P, pools in soil
decomposition
P
C
NC
ORGANICPOOLS
NH4
NO3P
INORGANIC POOLS
LITTER
HUMUS
mineralization
immobilization
N P
C – carbonN – nitrogenP - phosphorus NH4- ammonium
NO3 - nitrate
Organic & Inorganic C, N, P, pools in soil
decomposition
17
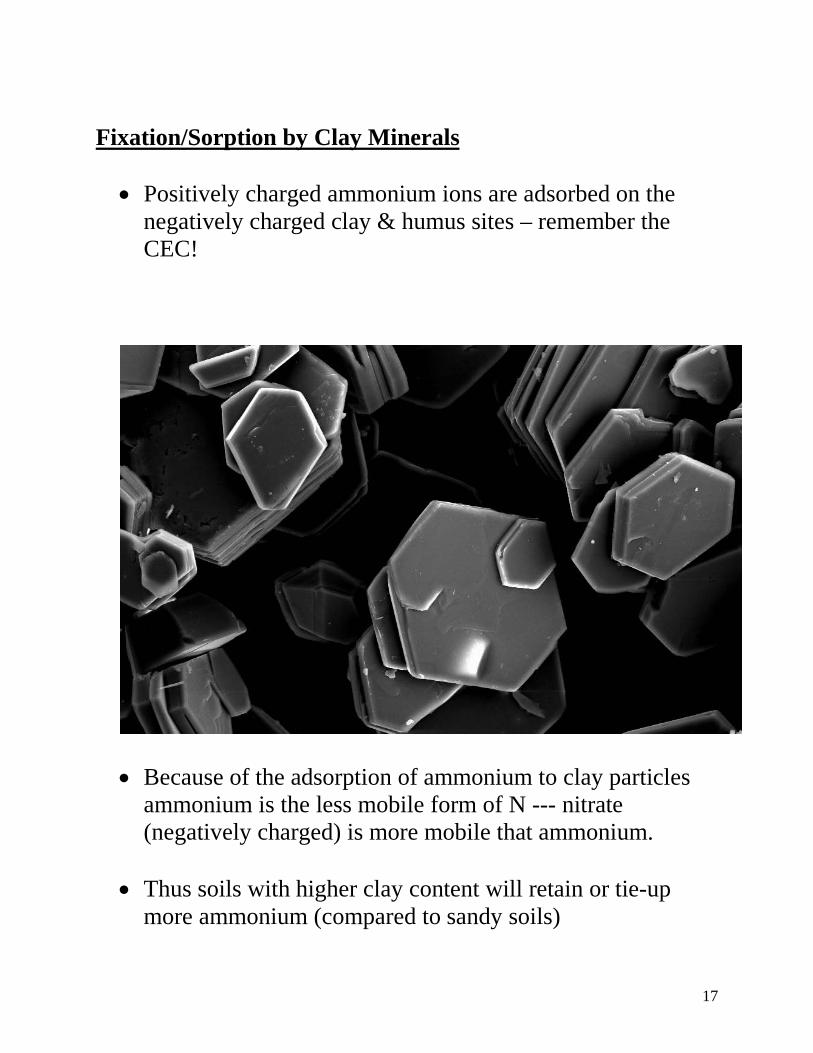
Fixation/Sorption by Clay Minerals • Positively charged ammonium ions are adsorbed on the
negatively charged clay & humus sites – remember the CEC!
• Because of the adsorption of ammonium to clay particles
ammonium is the less mobile form of N --- nitrate (negatively charged) is more mobile that ammonium.
• Thus soils with higher clay content will retain or tie-up
more ammonium (compared to sandy soils)
18
• Clay type (e.g., vermiculite) will also influence this fixation
Ammonia Volatilization
• Conversion of ammonium from the soil to ammonia gas – NH3
• Typical sites for occurrence – locations where animal
manures are spread on land.
• Moist and high pH conditions increase the rate of volatilization.
******Nitrification • Conversion of Ammonium Nitrate • Performed by bacteria classed as autotrophs – because they
obtain their energy from the oxidation of ammonium ions. • Two types of bacteria involved – Nitrosomonas and
Nitrobacter – two stage process of conversion • Ammonium Nitrite Nitrate
• Nitrification reaction results in the release of hydrogen ions
– which means nitrification increases soil acidity!
19
• Factors that regulate Nitrification:
o Availability of ammonium o Aeration – nitrifying bacteria are aerobic and need O2 o Moisture – nitrification is retarded at high soil
moisture conditions (poor aeration) o Carbon – don’t need carbon as an energy source o Temperature – optimum 20C to 30C. o Exchangeable base forming cations: Nitrification
proceeds at a higher rate in soils that have an abundance of exchangeable base forming cations like Ca2+ and Mg2+
o Clay types: (e.g., smectite & allophane) Clays that stabilize organic matter and hold ammonium ions tightly can result in reduced rates of nitrification
o Pesticides & nitrification inhibitors Denitrification
• Process of conversion of nitrate NO3- to nitrogen gas N2 • Typically occurs in saturated soils – like wetlands, riparian
soils, flooded rice fields,……. • Bacteria involved – are heterotrophs – extract their energy
from carbon (as opposed to autotrophs) • Conditions for Denitrification:
o Nitrate availability o Energy source – Carbon
20
o Anaerobic conditions – soil air less than 10% O2 or less that 0.2 mg/L
o Temperature between 2 and 50C – optimum is between 25 and 35C.
o Acidity – very low acidity (pH < 5.0) can inhibit denitrification
• Denitrification can occur in large saturated expanses of soil
or even in small pockets of saturation called micro-sites • Denitrification rates could vary from 5 to 15 kgN/ha/yr for
agricultural fields to as high as 30 to 60 kgN/ha/yr for wetlands, saturated soils receiving high N loads or riparian soils.
• During a year - denitrification losses will be high when
there is sufficient moisture in the soil and the soil is warm.
21
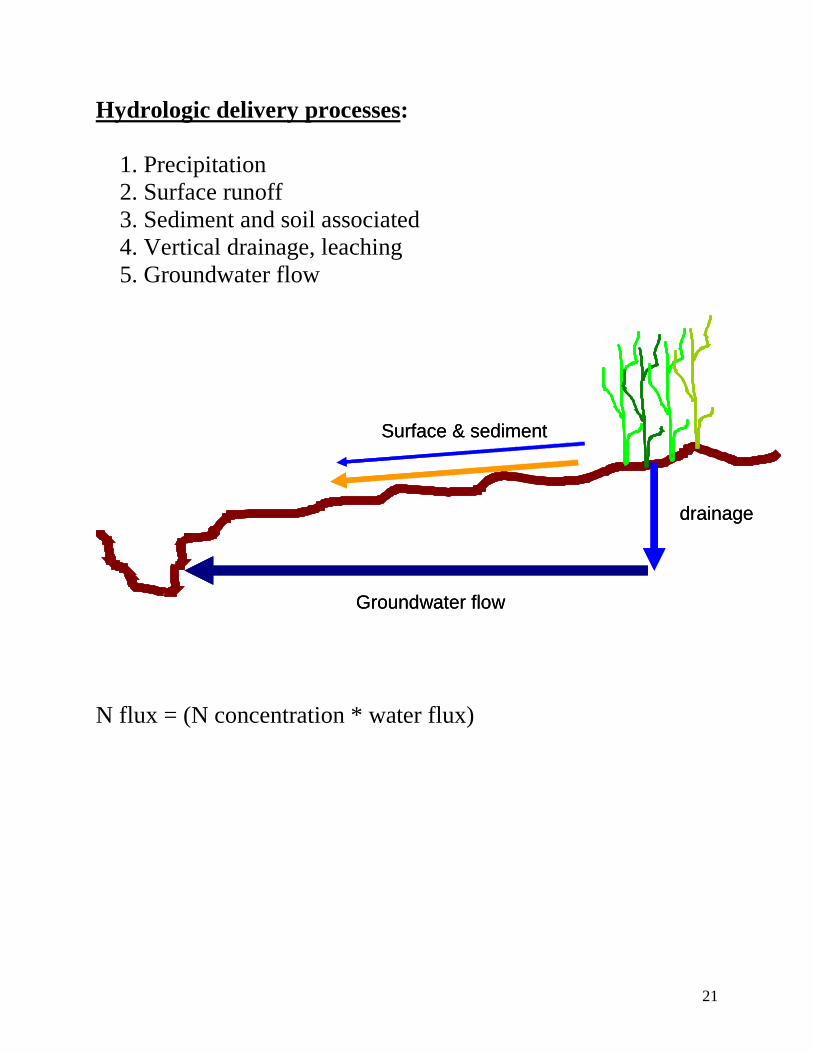
Hydrologic delivery processes:
1. Precipitation 2. Surface runoff 3. Sediment and soil associated 4. Vertical drainage, leaching 5. Groundwater flow
N flux = (N concentration * water flux)
Surface & sediment
drainage
Groundwater flow
Surface & sediment
drainage
Groundwater flow
22
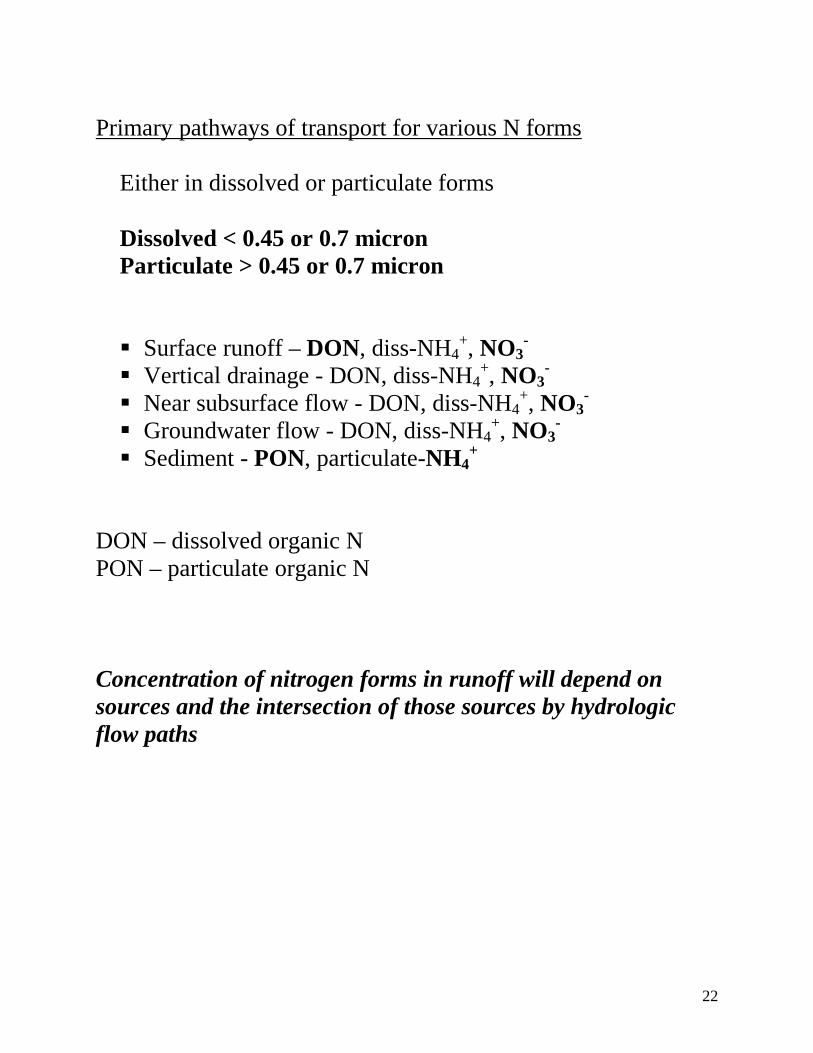
Primary pathways of transport for various N forms
Either in dissolved or particulate forms Dissolved < 0.45 or 0.7 micron Particulate > 0.45 or 0.7 micron Surface runoff – DON, diss-NH4
+, NO3-
Vertical drainage - DON, diss-NH4+, NO3
- Near subsurface flow - DON, diss-NH4
+, NO3-
Groundwater flow - DON, diss-NH4+, NO3
- Sediment - PON, particulate-NH4
+ DON – dissolved organic N PON – particulate organic N Concentration of nitrogen forms in runoff will depend on sources and the intersection of those sources by hydrologic flow paths
23
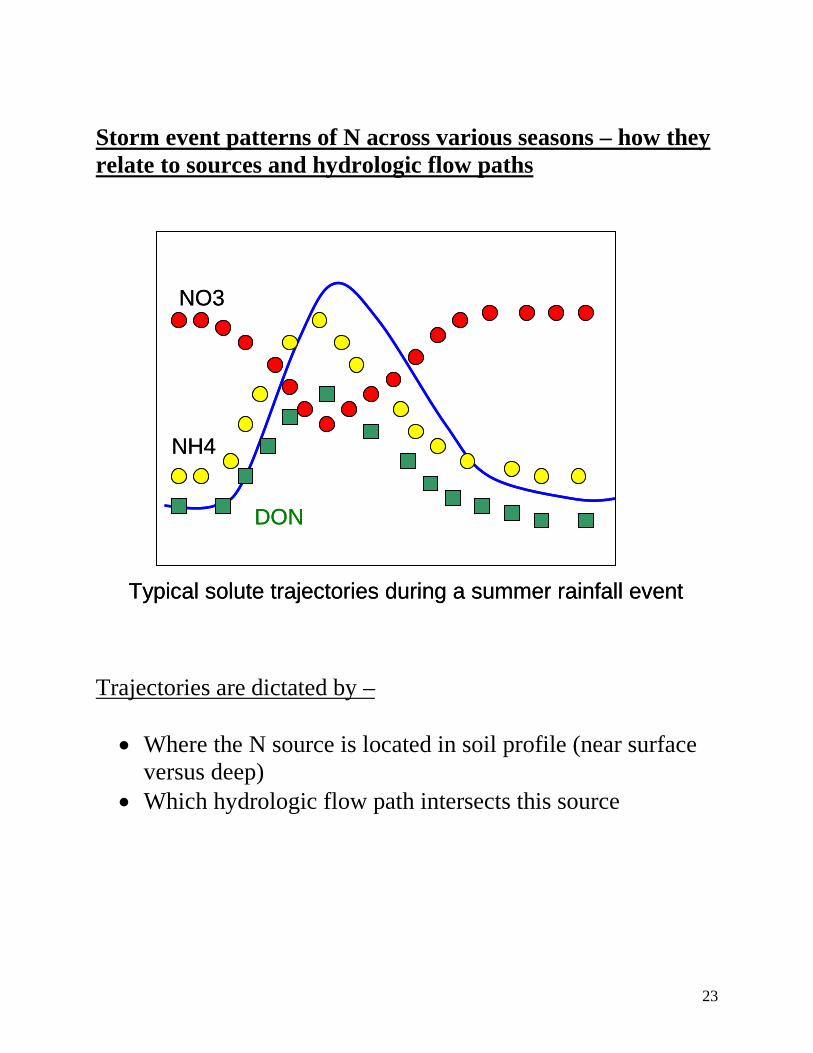
Storm event patterns of N across various seasons – how they relate to sources and hydrologic flow paths Trajectories are dictated by – • Where the N source is located in soil profile (near surface
versus deep) • Which hydrologic flow path intersects this source
NO3
NH4
DON
Typical solute trajectories during a summer rainfall event
NO3
NH4
DON
Typical solute trajectories during a summer rainfall event
24
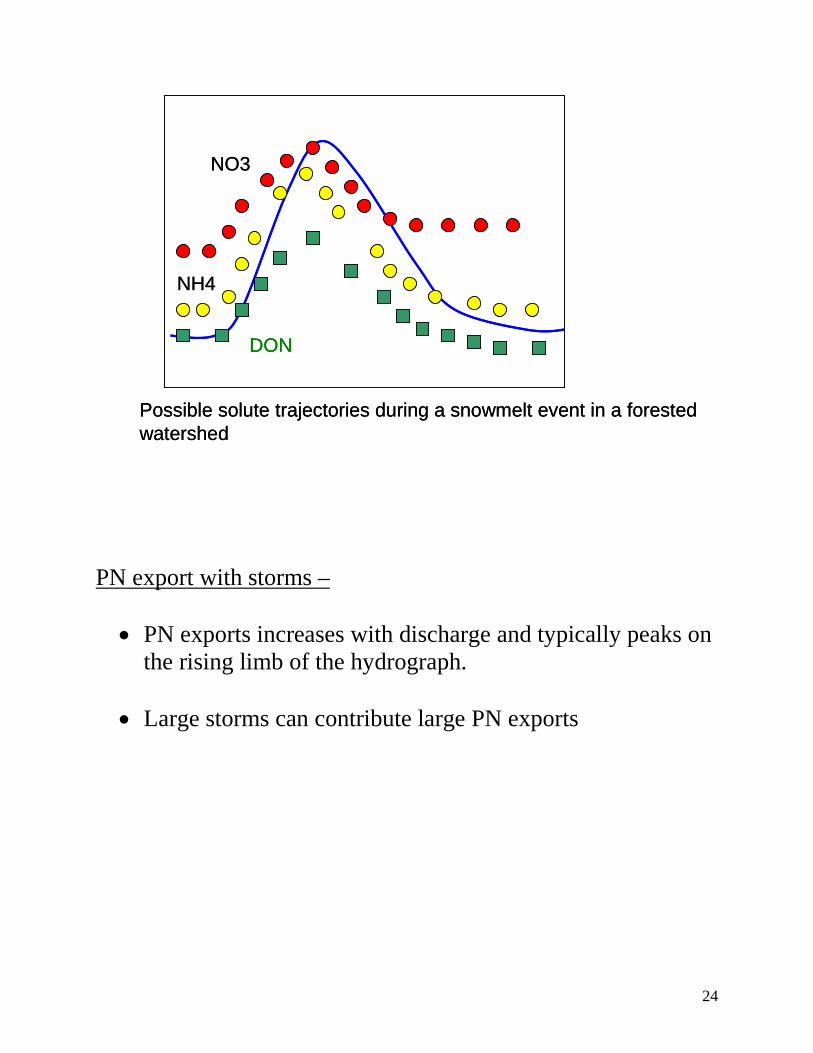
PN export with storms – • PN exports increases with discharge and typically peaks on
the rising limb of the hydrograph. • Large storms can contribute large PN exports
NO3
NH4
DON
Possible solute trajectories during a snowmelt event in a forestedwatershed
NO3
NH4
DON
Possible solute trajectories during a snowmelt event in a forestedwatershed
25
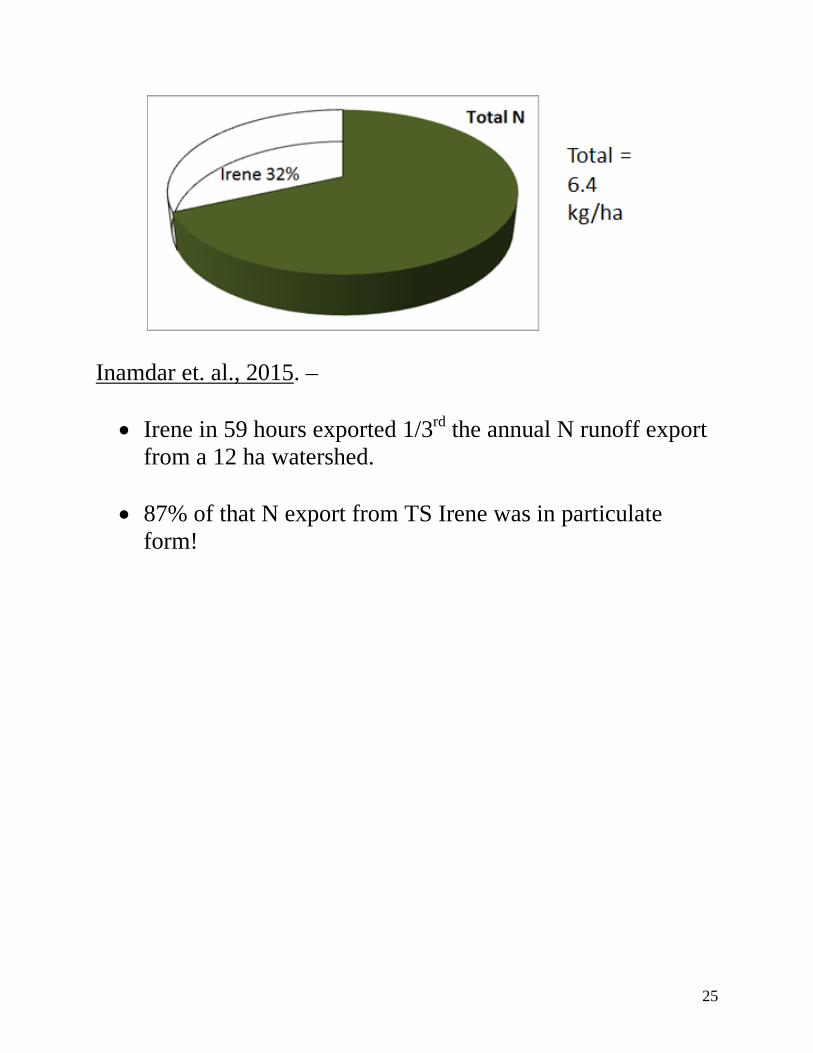
Inamdar et. al., 2015. – • Irene in 59 hours exported 1/3rd the annual N runoff export
from a 12 ha watershed. • 87% of that N export from TS Irene was in particulate
form!
26
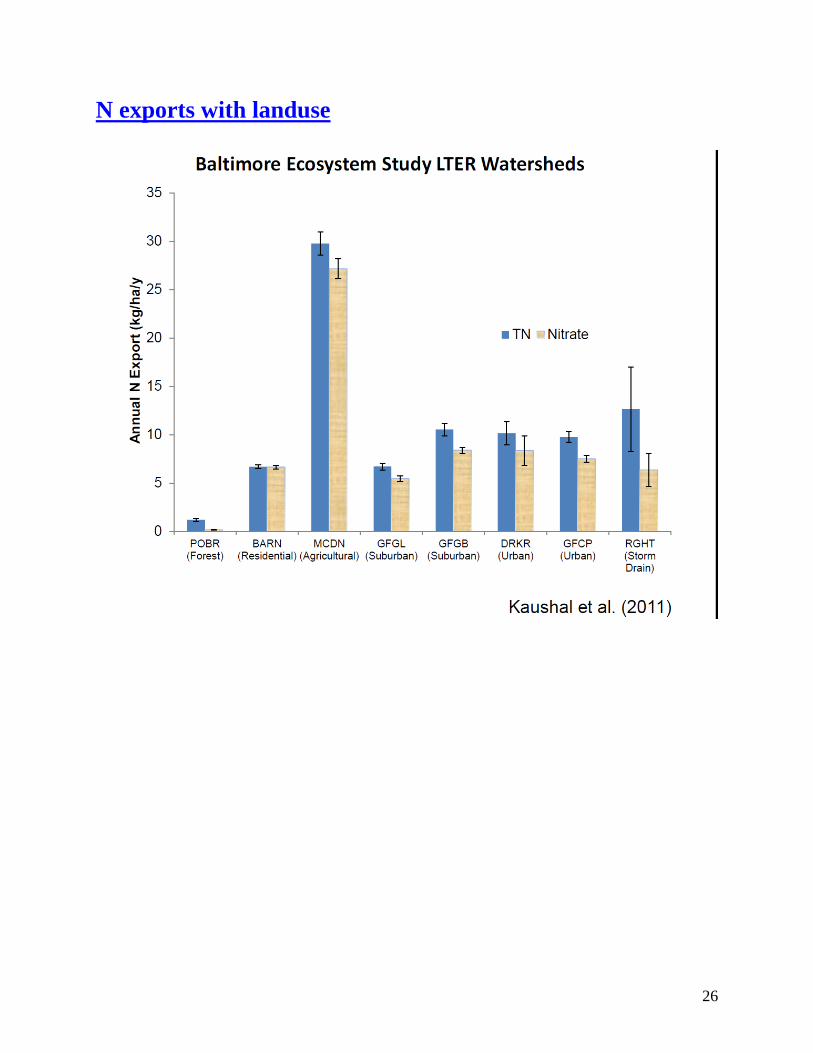
N exports with landuse
27
28
Forested watersheds: • Primary inputs – atmospheric deposition (nitrate,
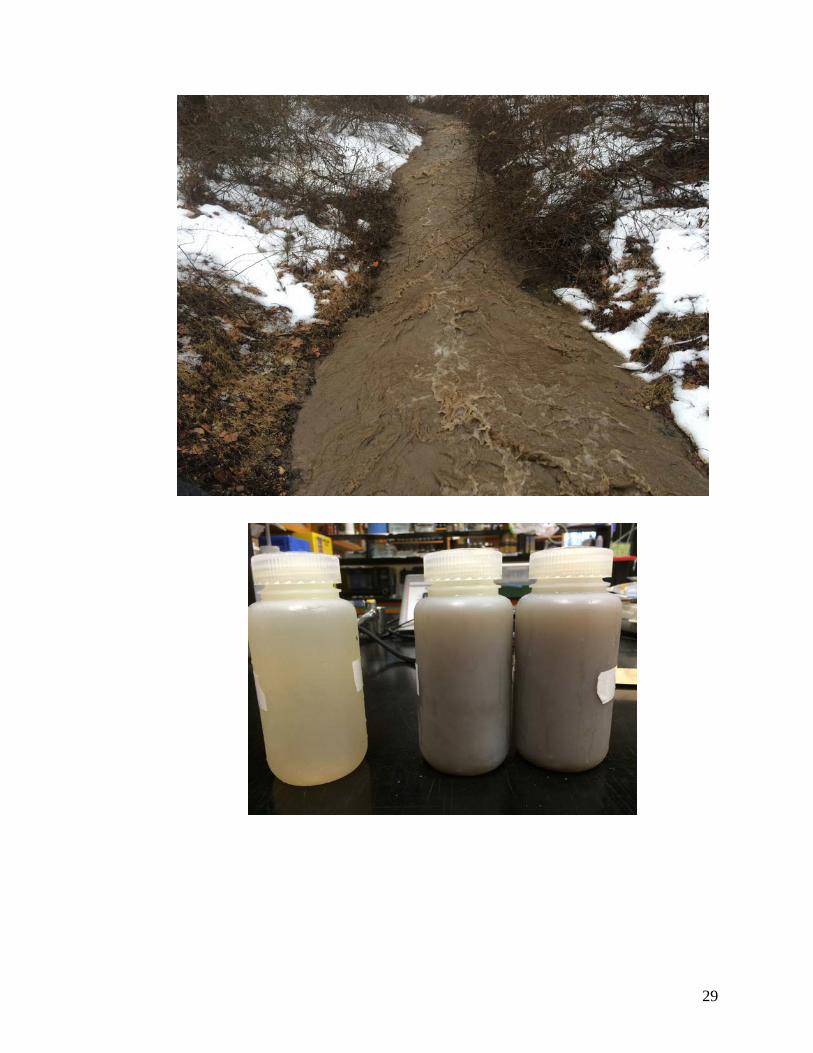
ammonium) • Atmospheric deposition for Newark region ~ 3-4 kgN/ha/yr • Primary N species exported – nitrate and DON; PN could
be high during large storms or watersheds with significant erosion and sediment export
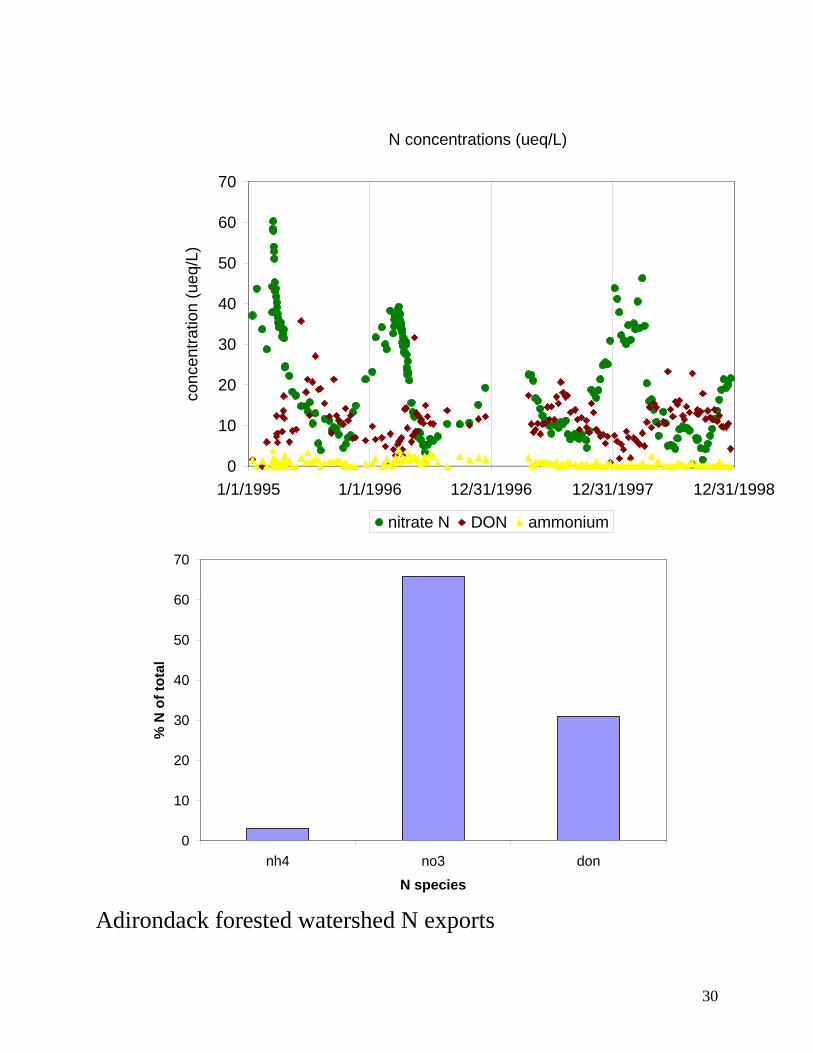
• Inorganic N species constitute 50 to 80% • In some undisturbed tropical forested watersheds – DON is
the predominant form of N (could be as high as 60-80%) • Nitrate-N concentrations less than 1.0 mg/L • Exports occur with surface as well as with groundwater
flow o DON – surface waters o Nitrate – groundwaters
29
30
N concentrations (ueq/L)
0
10
20
30
40
50
60
70
1/1/1995 1/1/1996 12/31/1996 12/31/1997 12/31/1998
conc
entra
tion
(ueq
/L)
nitrate N DON ammonium
0
10
20
30
40
50
60
70
nh4 no3 don
N species
% N
of t
otal
Adirondack forested watershed N exports
31
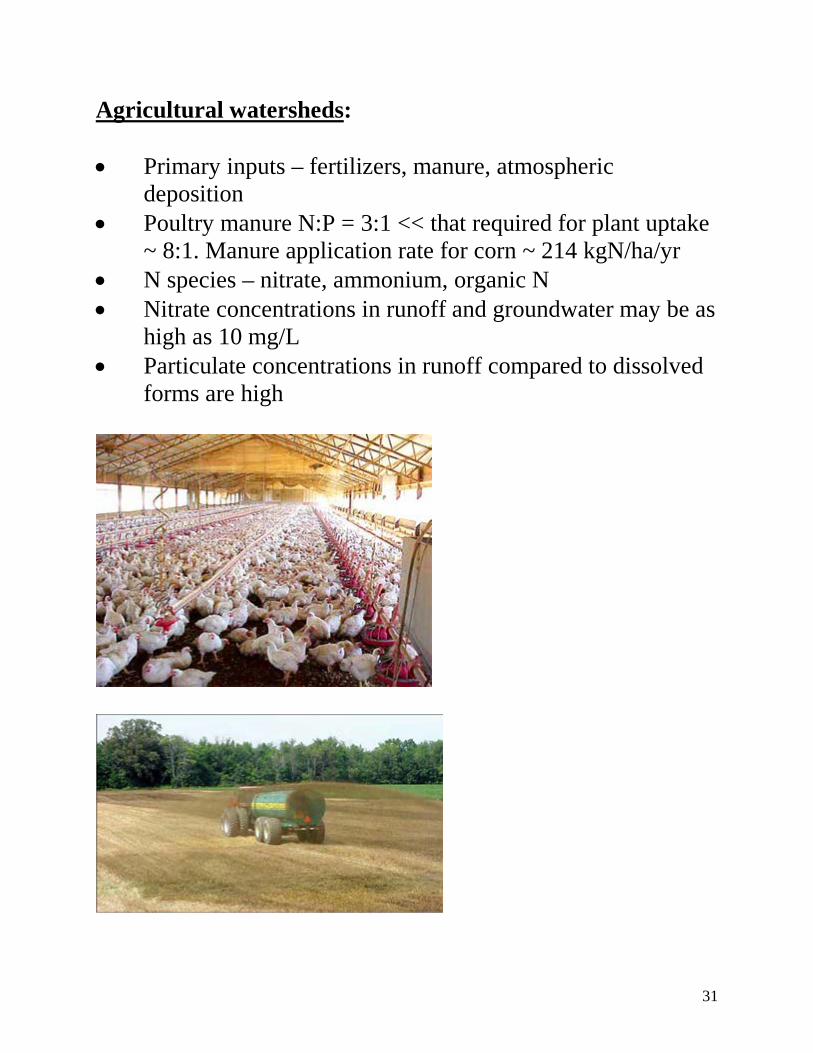
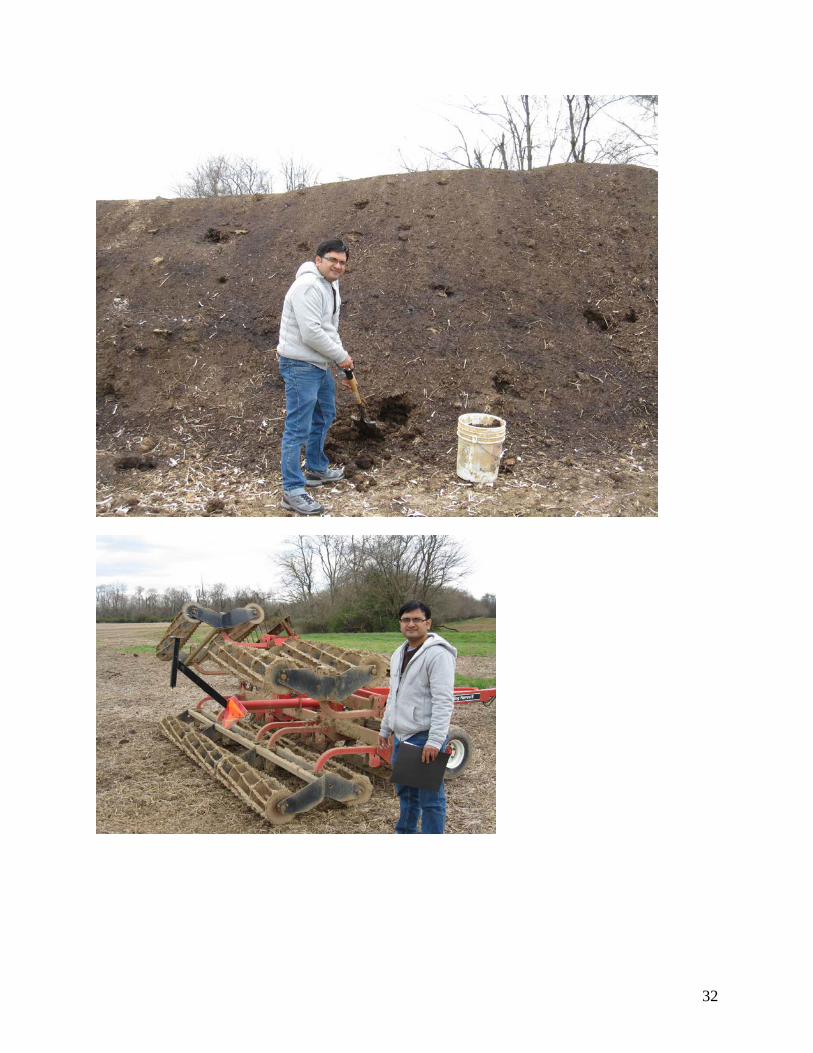
Agricultural watersheds: • Primary inputs – fertilizers, manure, atmospheric
deposition • Poultry manure N:P = 3:1 << that required for plant uptake
~ 8:1. Manure application rate for corn ~ 214 kgN/ha/yr • N species – nitrate, ammonium, organic N • Nitrate concentrations in runoff and groundwater may be as
high as 10 mg/L • Particulate concentrations in runoff compared to dissolved
forms are high
32
33
34
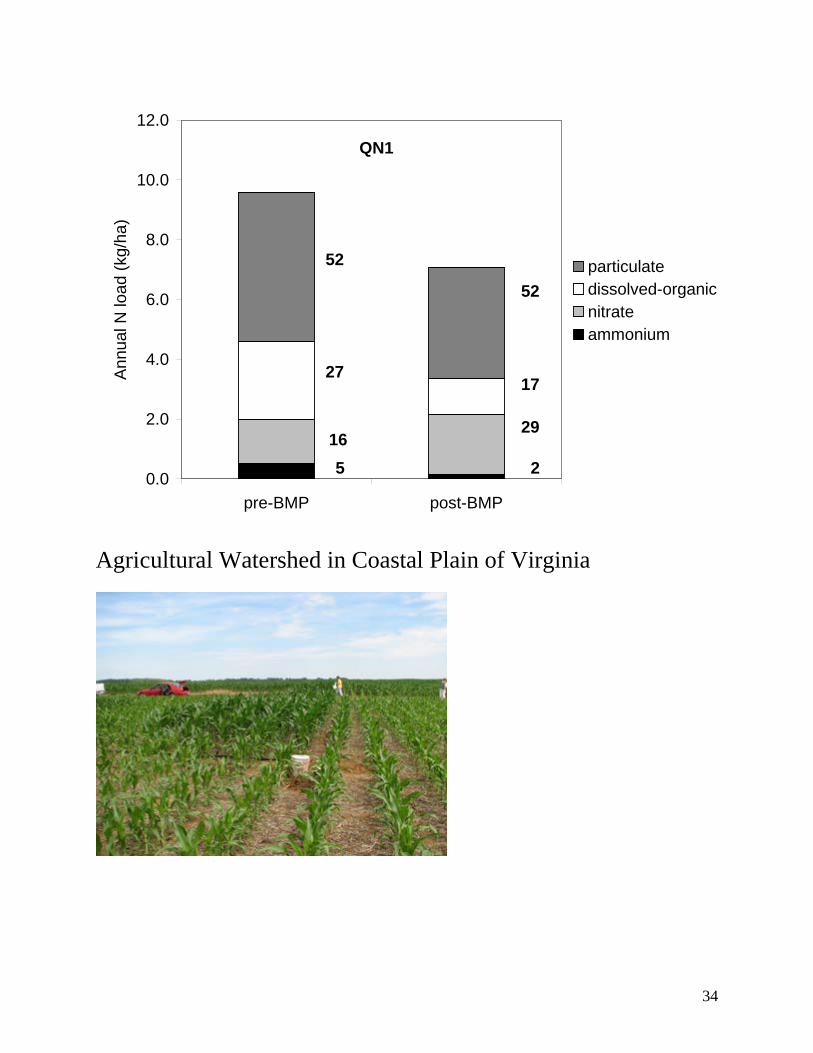
0.0
2.0
4.0
6.0
8.0
10.0
12.0
pre-BMP post-BMP
Ann
ual N
load
(kg/
ha)
particulatedissolved-organicnitrateammonium
52
27
165
52
17
29
2
QN1
Agricultural Watershed in Coastal Plain of Virginia
35
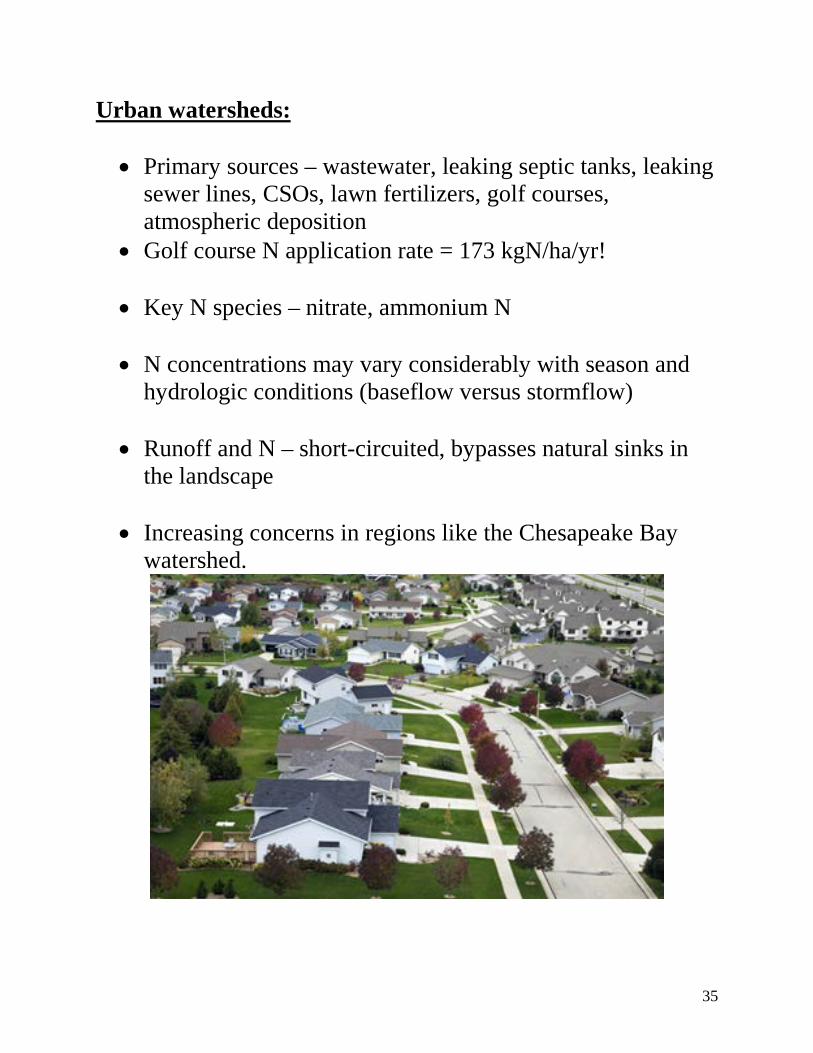
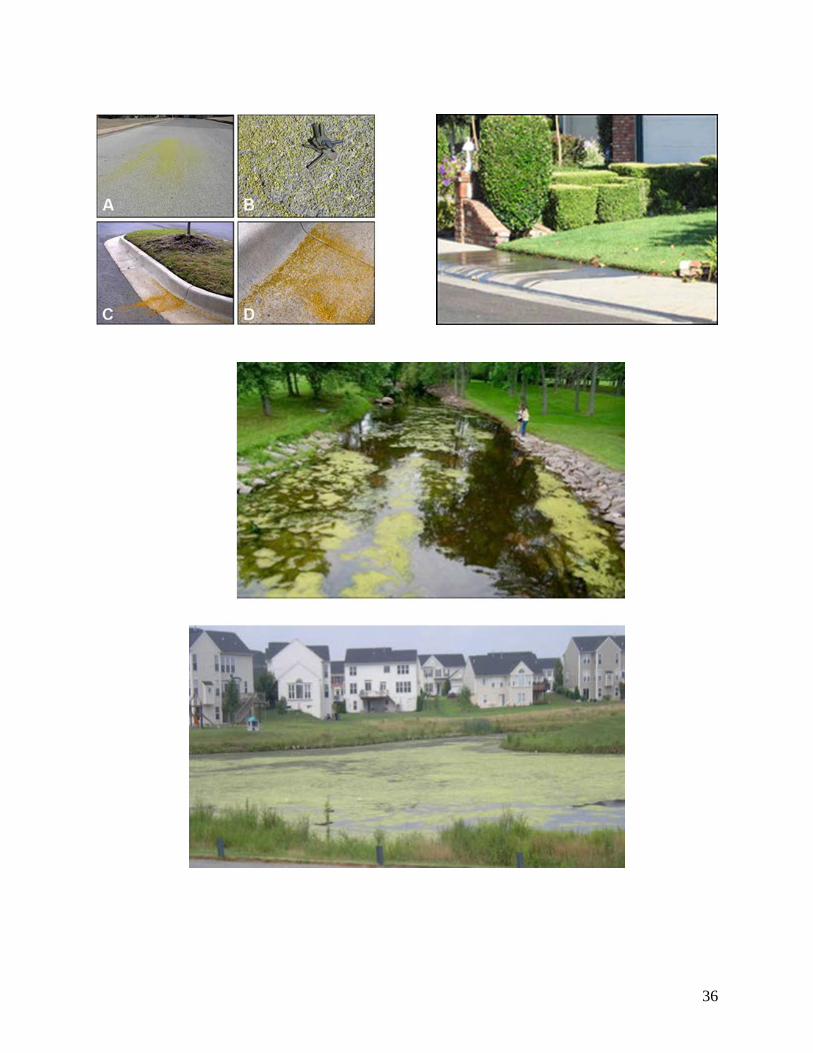
Urban watersheds: • Primary sources – wastewater, leaking septic tanks, leaking
sewer lines, CSOs, lawn fertilizers, golf courses, atmospheric deposition
• Golf course N application rate = 173 kgN/ha/yr! • Key N species – nitrate, ammonium N
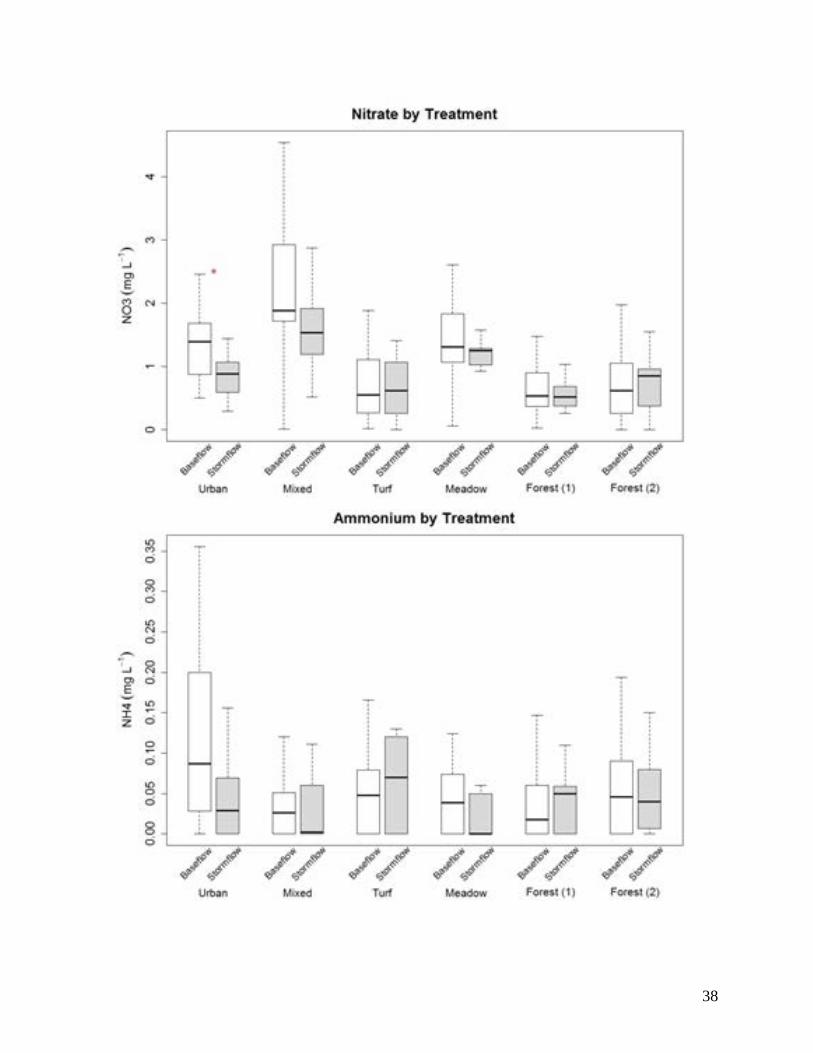
• N concentrations may vary considerably with season and
hydrologic conditions (baseflow versus stormflow)
• Runoff and N – short-circuited, bypasses natural sinks in the landscape
• Increasing concerns in regions like the Chesapeake Bay watershed.
36
37
38
39
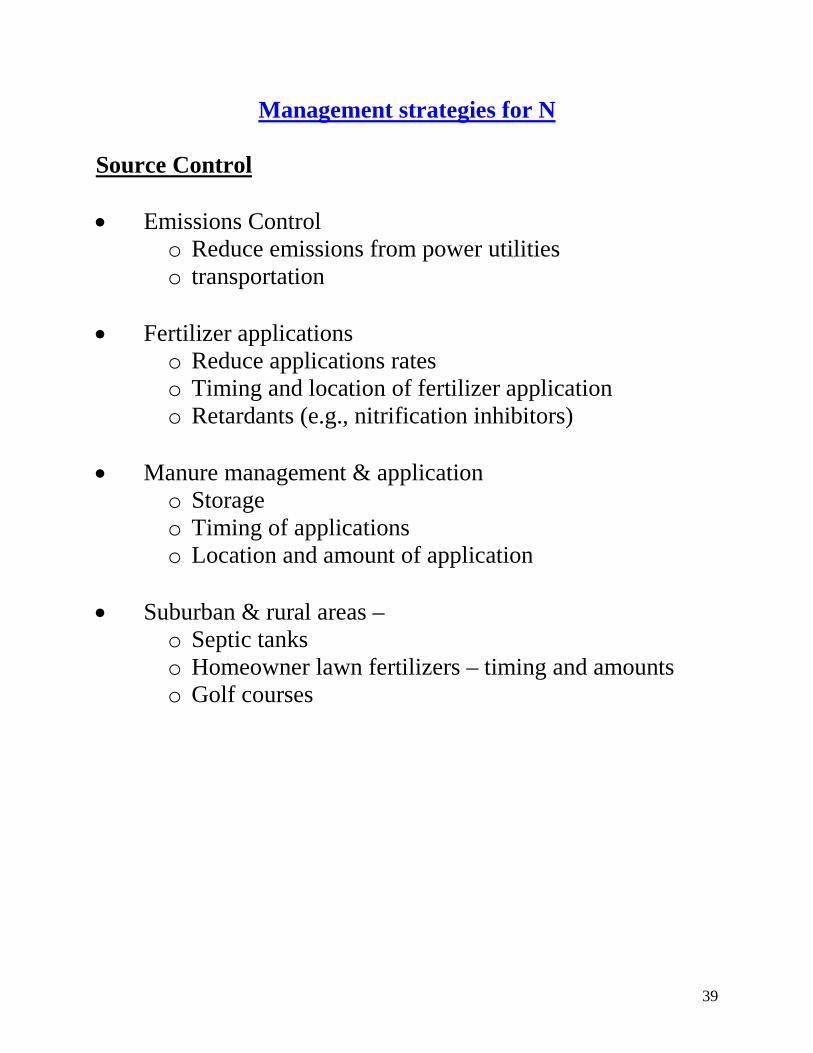
Management strategies for N Source Control • Emissions Control
o Reduce emissions from power utilities o transportation
• Fertilizer applications
o Reduce applications rates o Timing and location of fertilizer application o Retardants (e.g., nitrification inhibitors)
• Manure management & application
o Storage o Timing of applications o Location and amount of application
• Suburban & rural areas –
o Septic tanks o Homeowner lawn fertilizers – timing and amounts o Golf courses
40
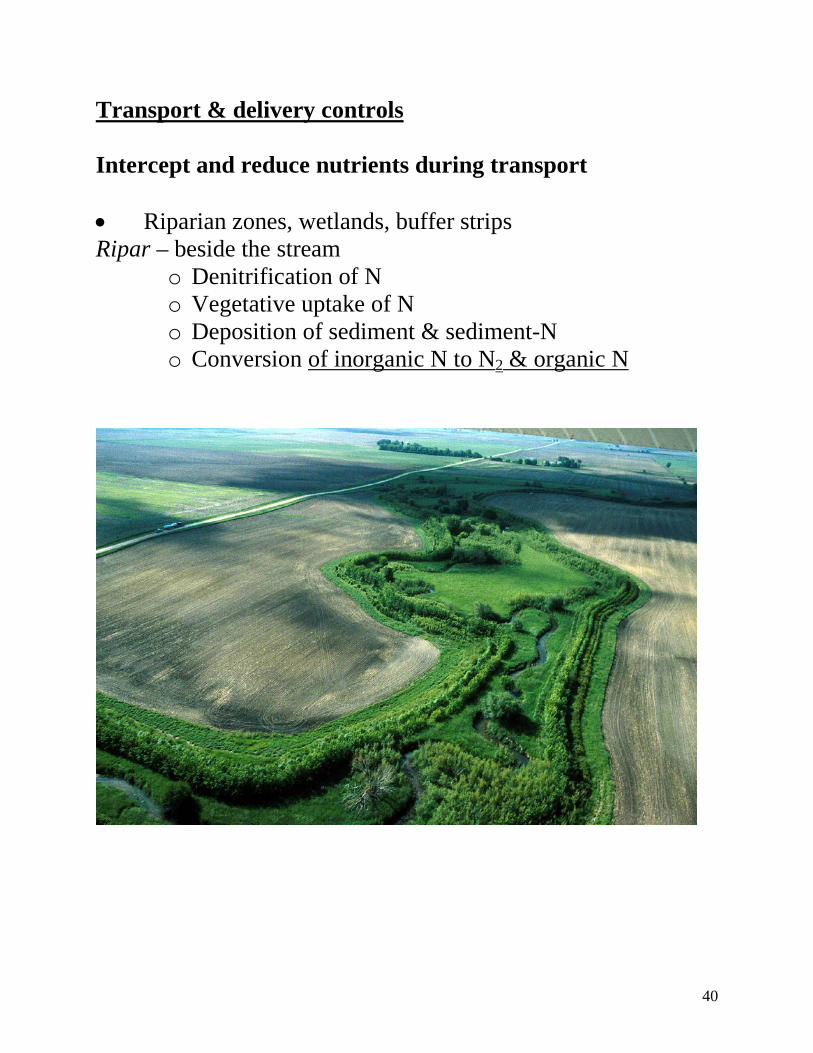
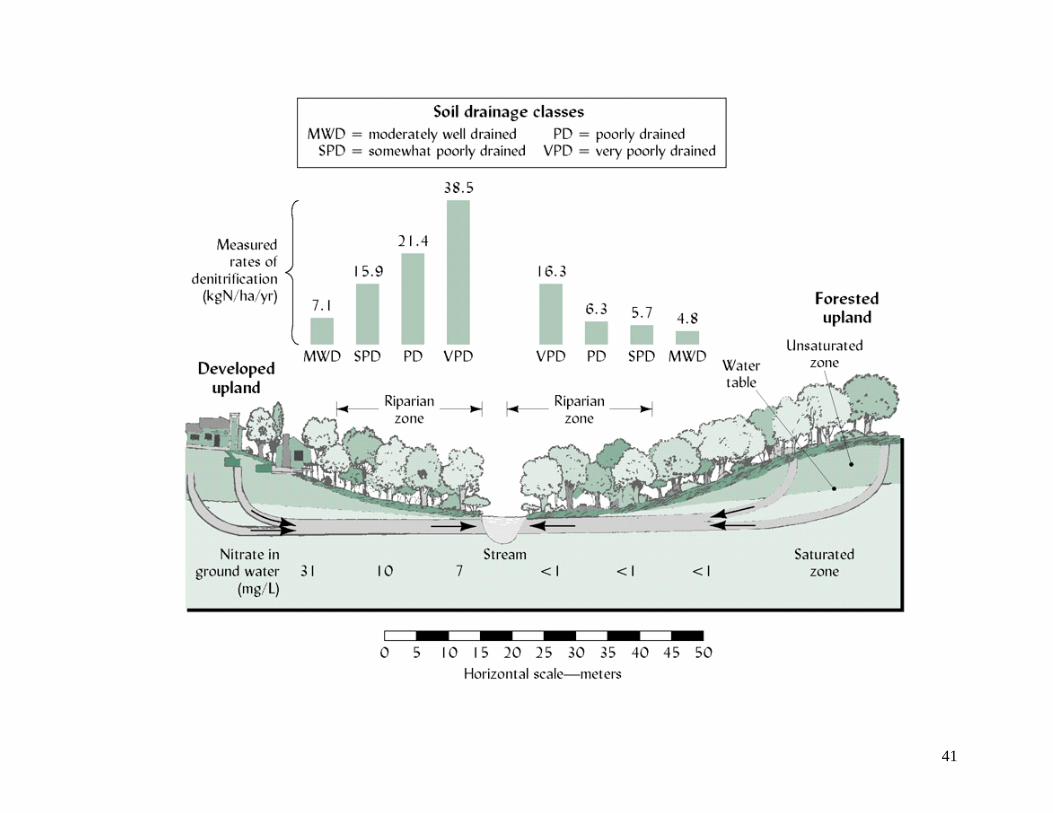
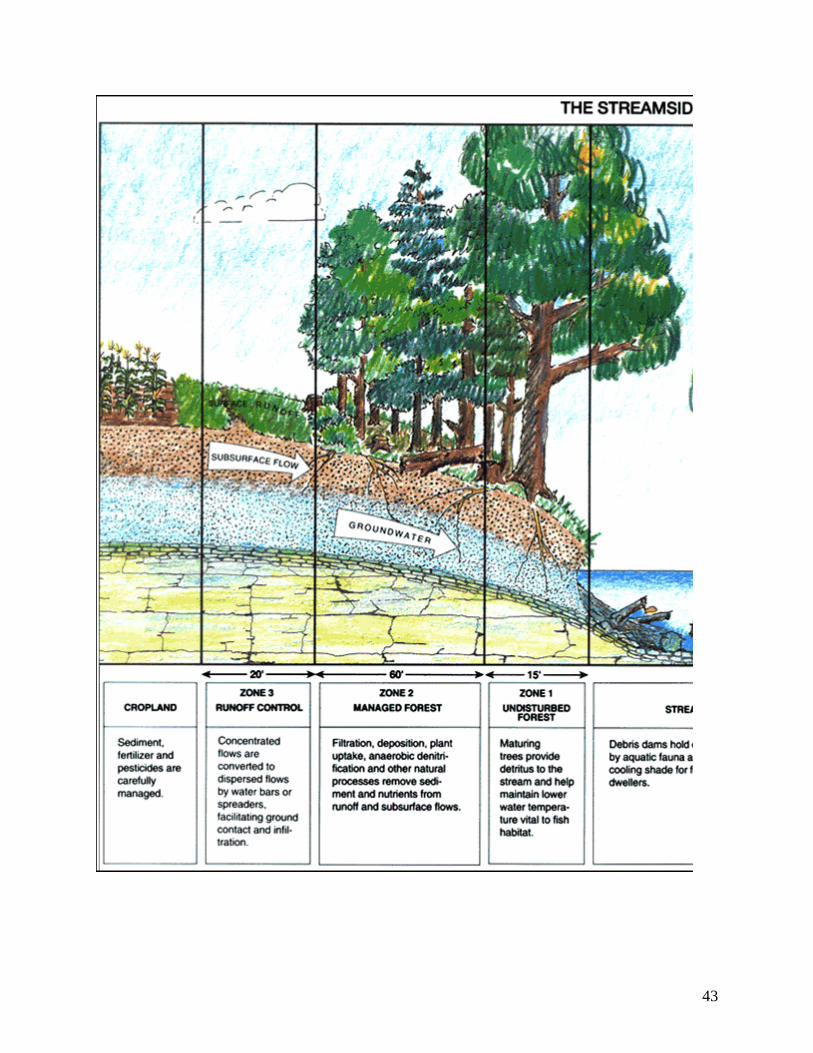
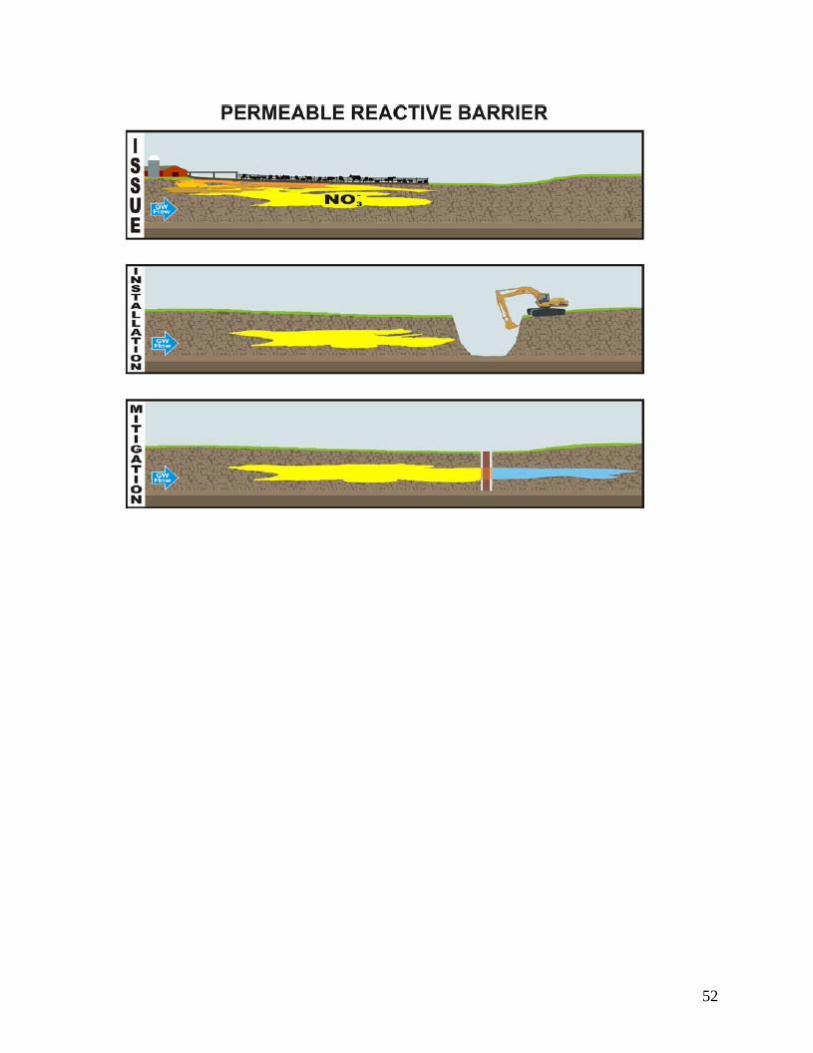
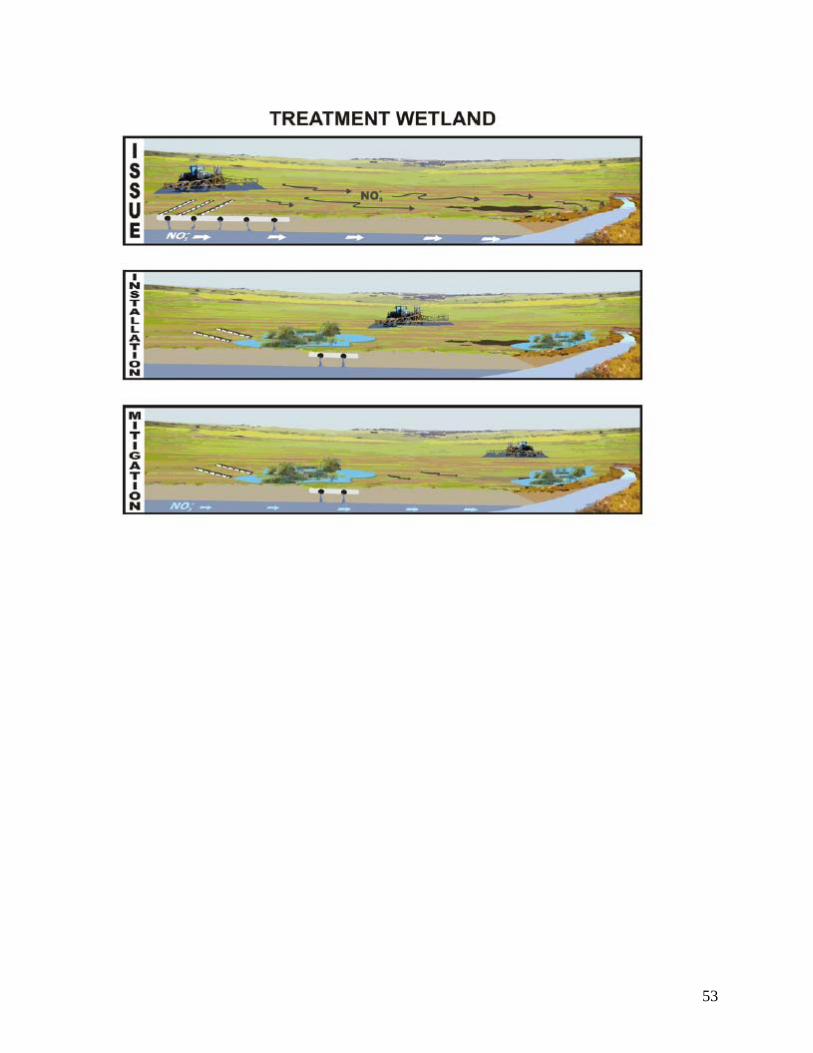
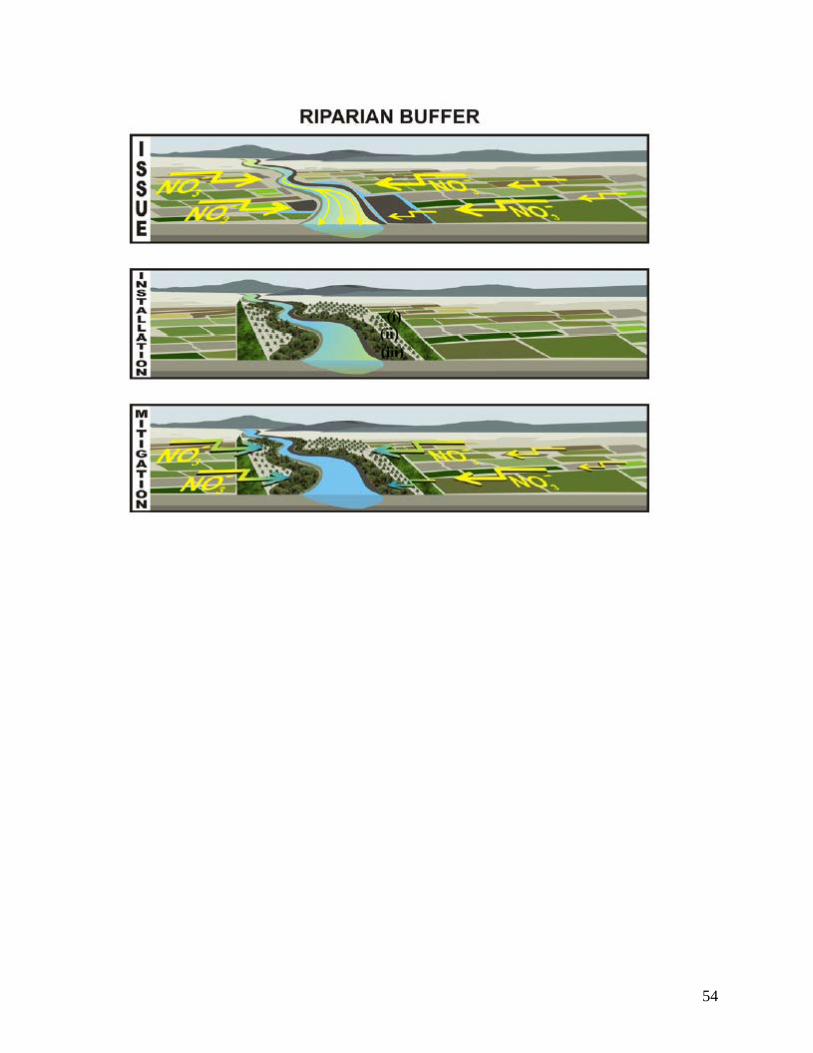
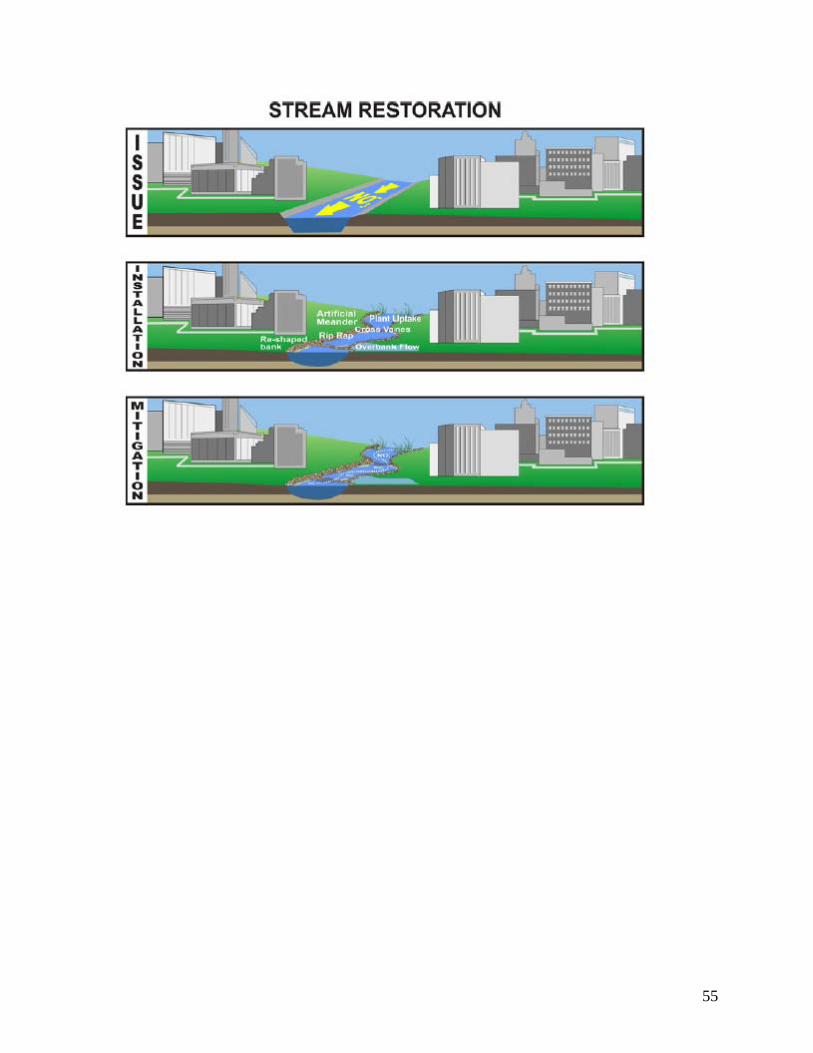
Transport & delivery controls Intercept and reduce nutrients during transport • Riparian zones, wetlands, buffer strips Ripar – beside the stream
o Denitrification of N o Vegetative uptake of N o Deposition of sediment & sediment-N o Conversion of inorganic N to N2 & organic N
41
42
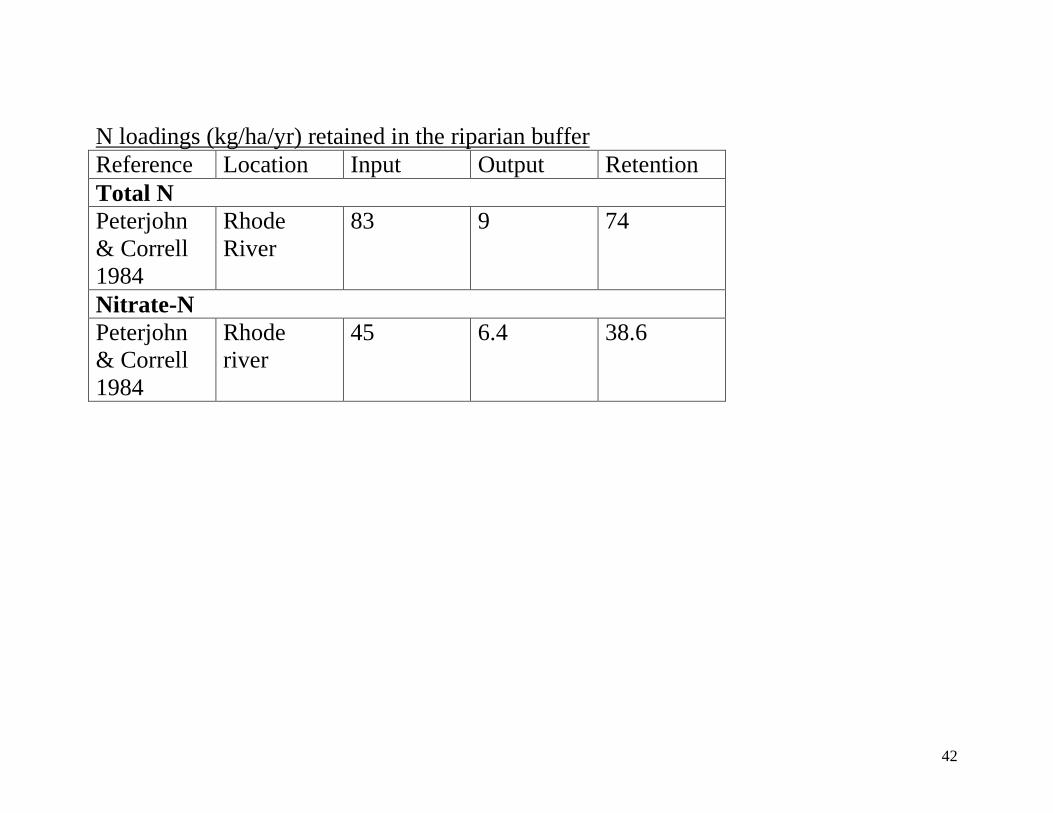
N loadings (kg/ha/yr) retained in the riparian buffer Reference Location Input Output Retention Total N Peterjohn & Correll 1984
Rhode River
83 9 74
Nitrate-N Peterjohn & Correll 1984
Rhode river
45 6.4 38.6
43
44
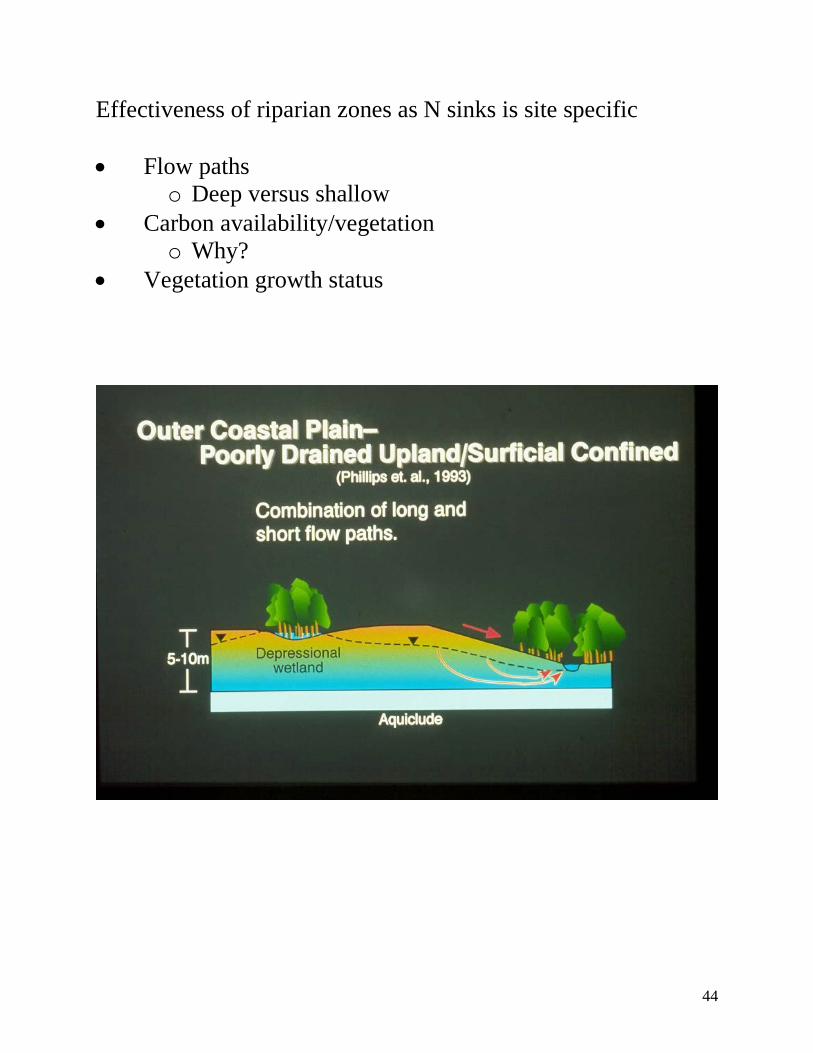
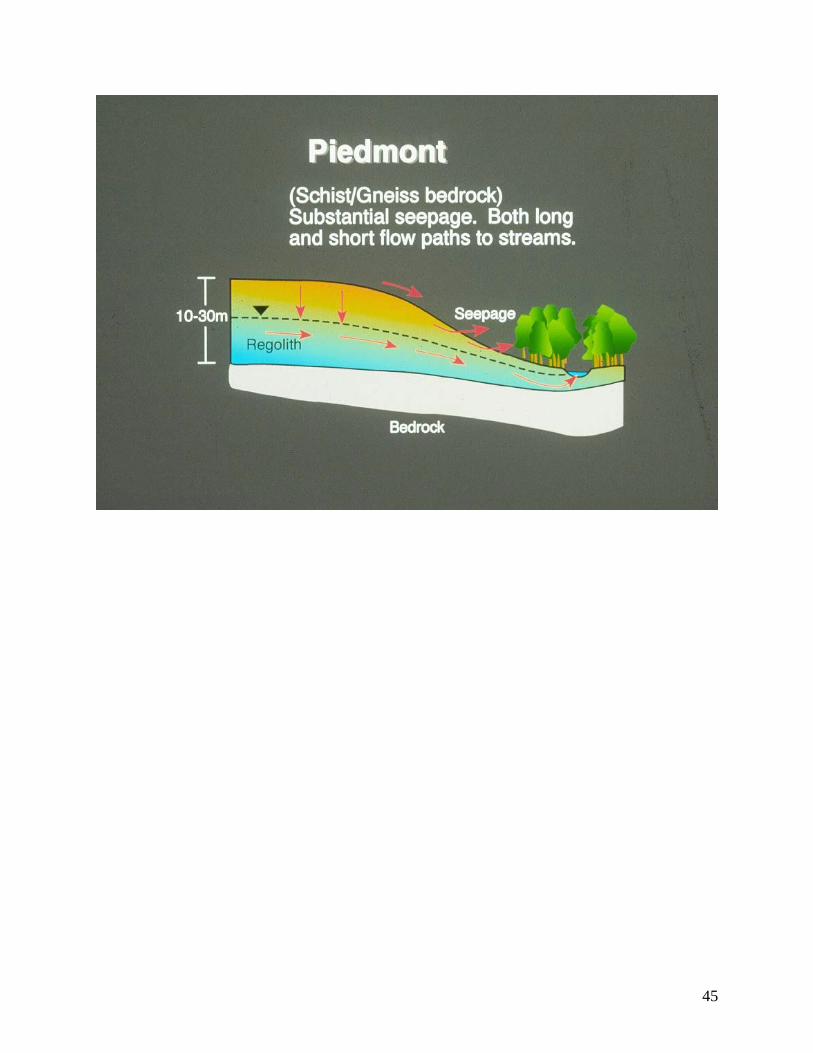
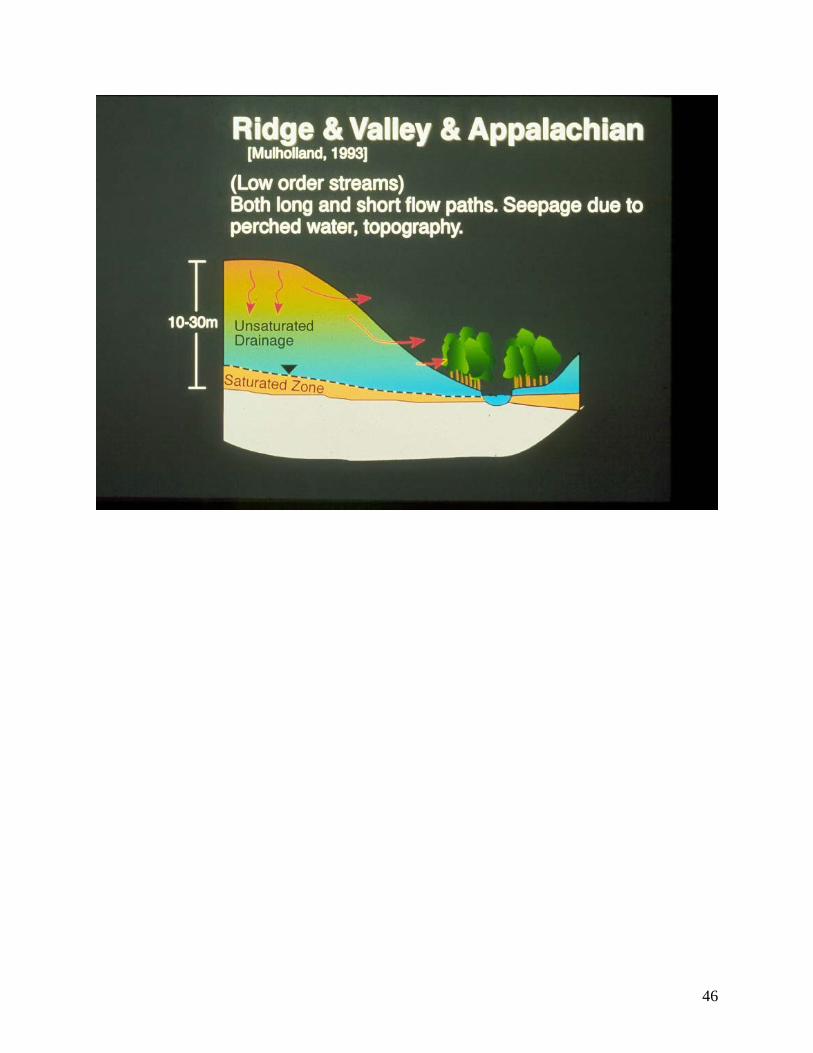
Effectiveness of riparian zones as N sinks is site specific • Flow paths
o Deep versus shallow • Carbon availability/vegetation
o Why? • Vegetation growth status
45
46
47
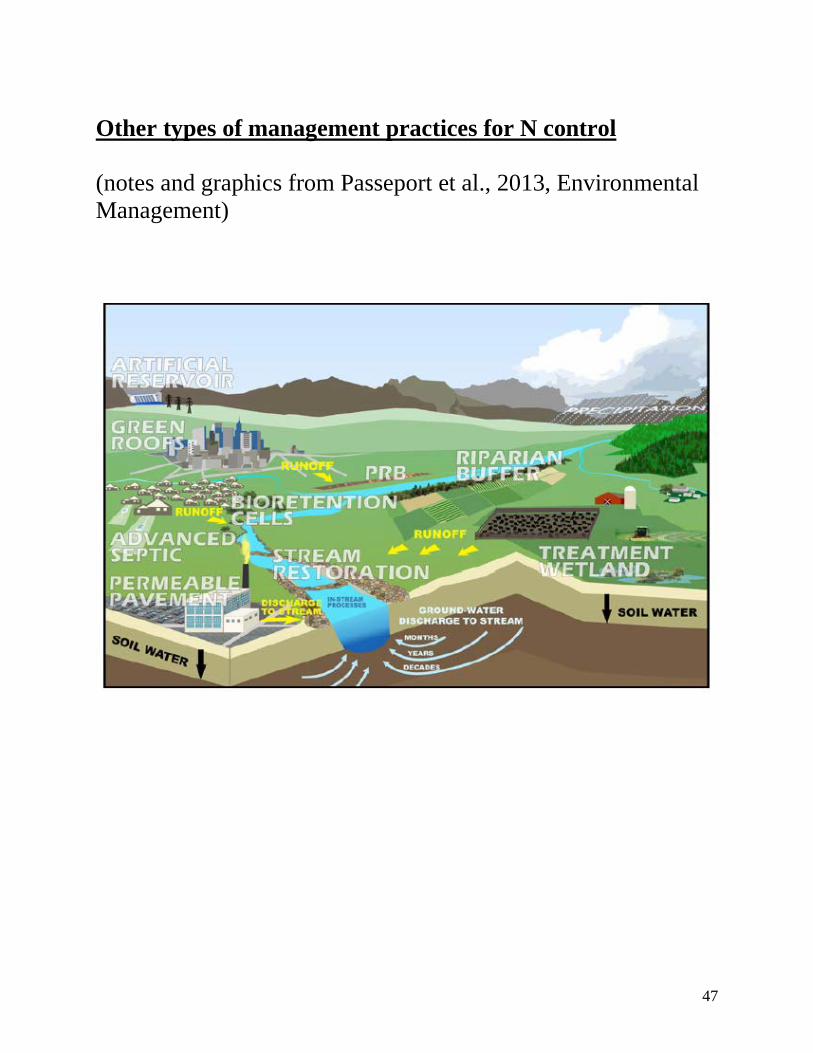
Other types of management practices for N control (notes and graphics from Passeport et al., 2013, Environmental Management)
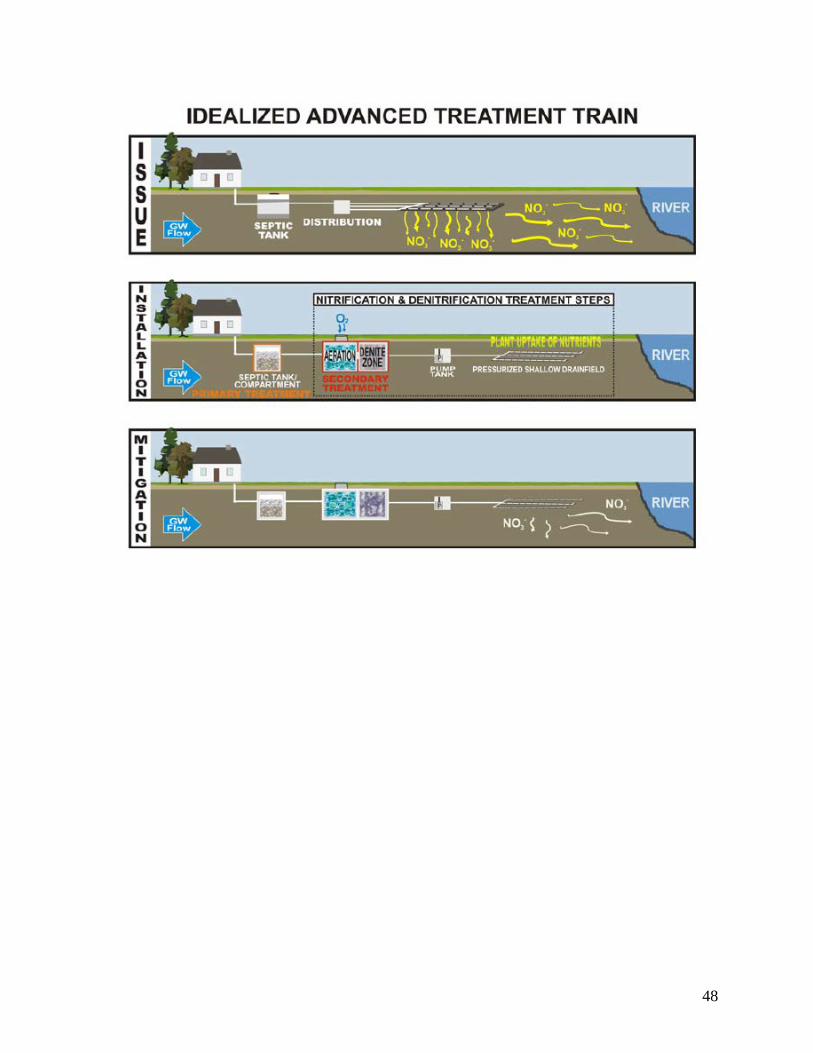
48
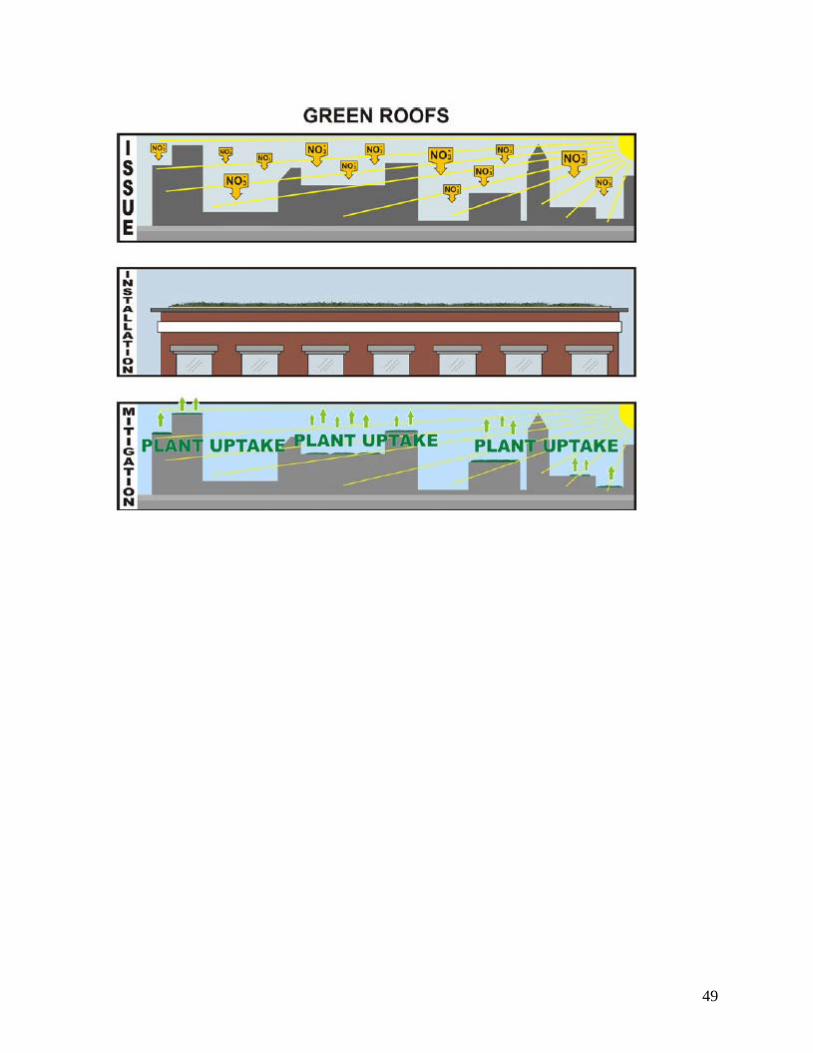
49
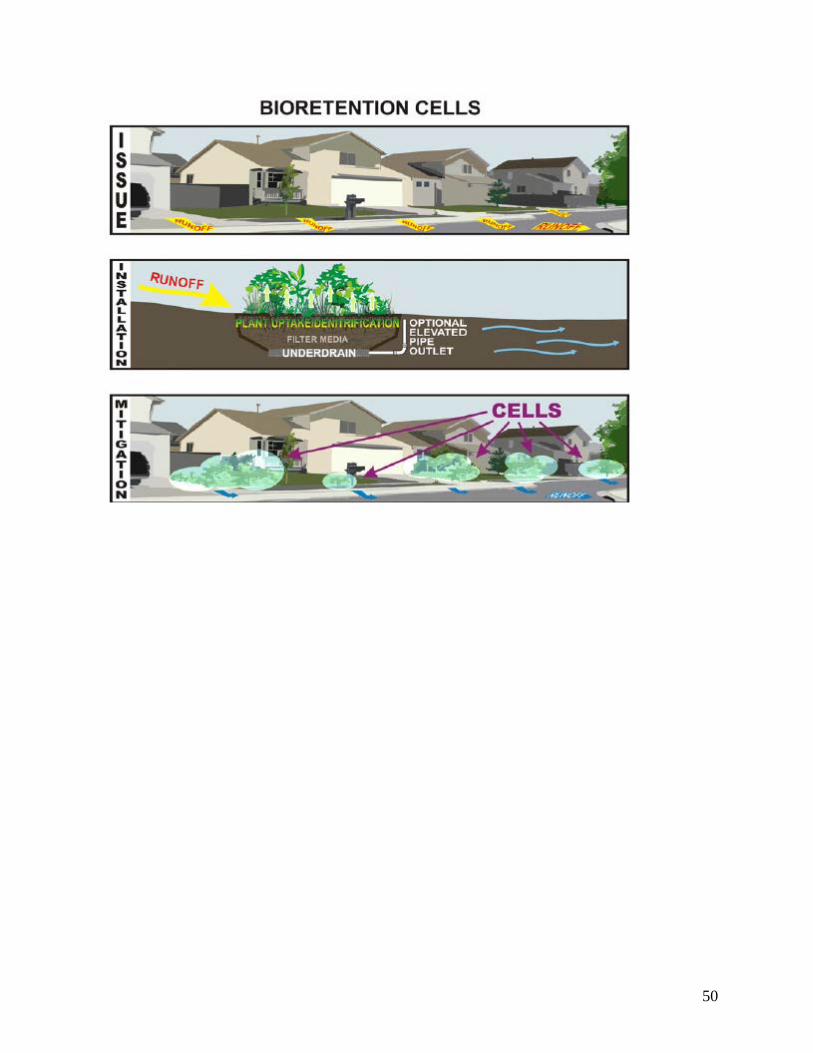
50
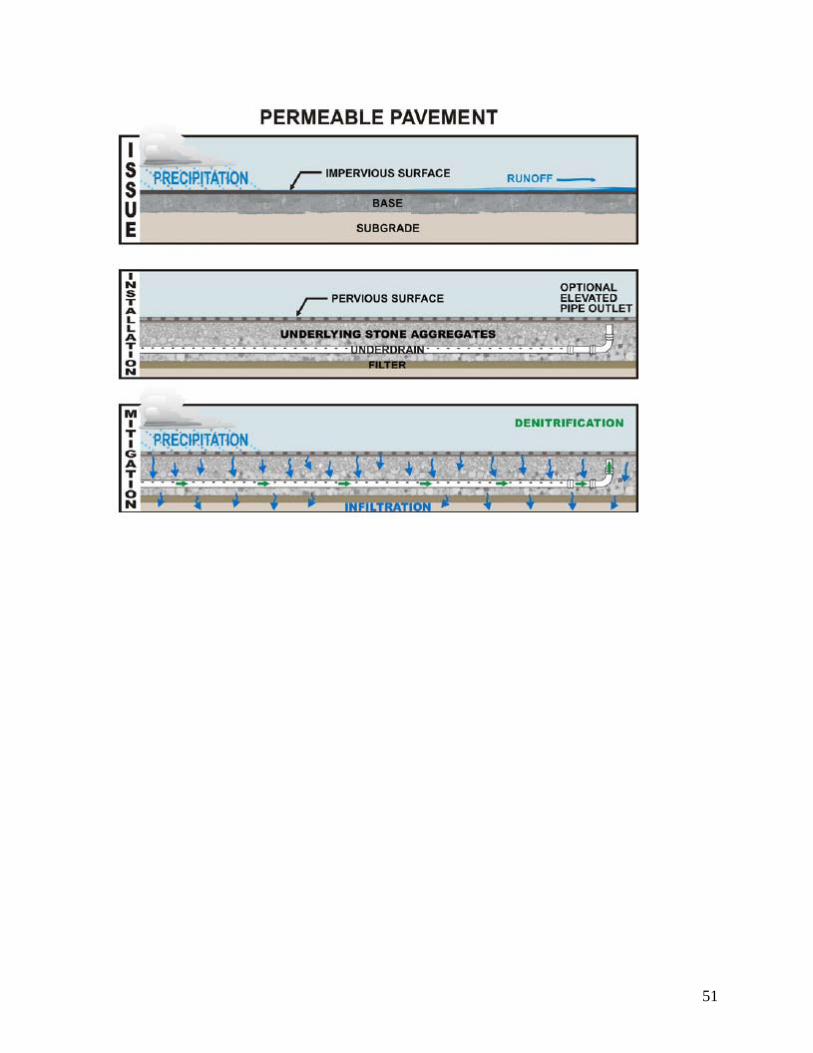
51
52
53
54
55
56
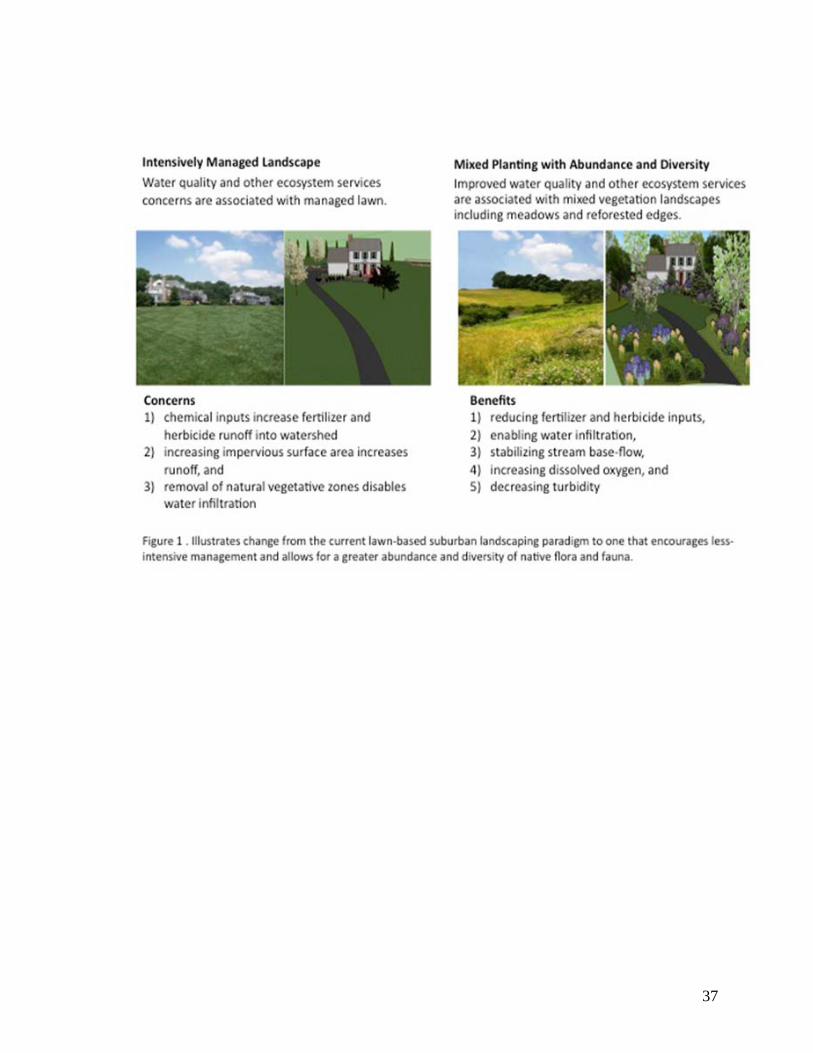
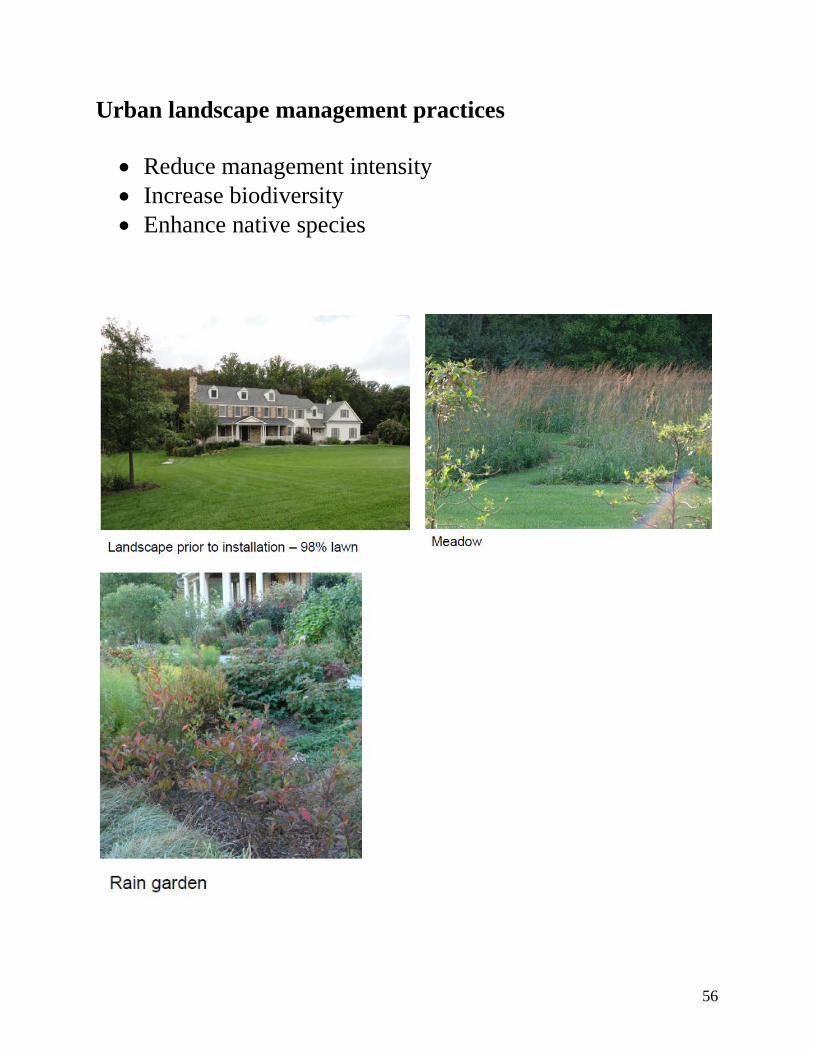
Urban landscape management practices • Reduce management intensity • Increase biodiversity • Enhance native species
57
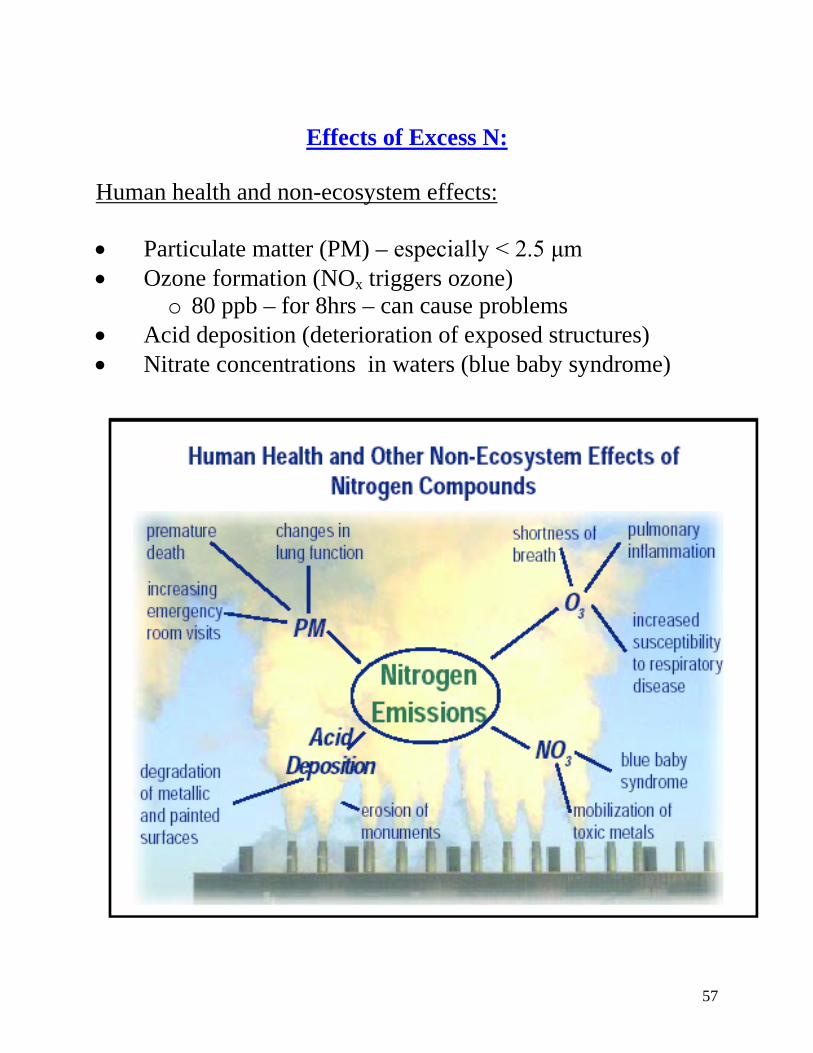
Effects of Excess N:
Human health and non-ecosystem effects: • Particulate matter (PM) – especially < 2.5 μm • Ozone formation (NOx triggers ozone)
o 80 ppb – for 8hrs – can cause problems • Acid deposition (deterioration of exposed structures) • Nitrate concentrations in waters (blue baby syndrome)
58
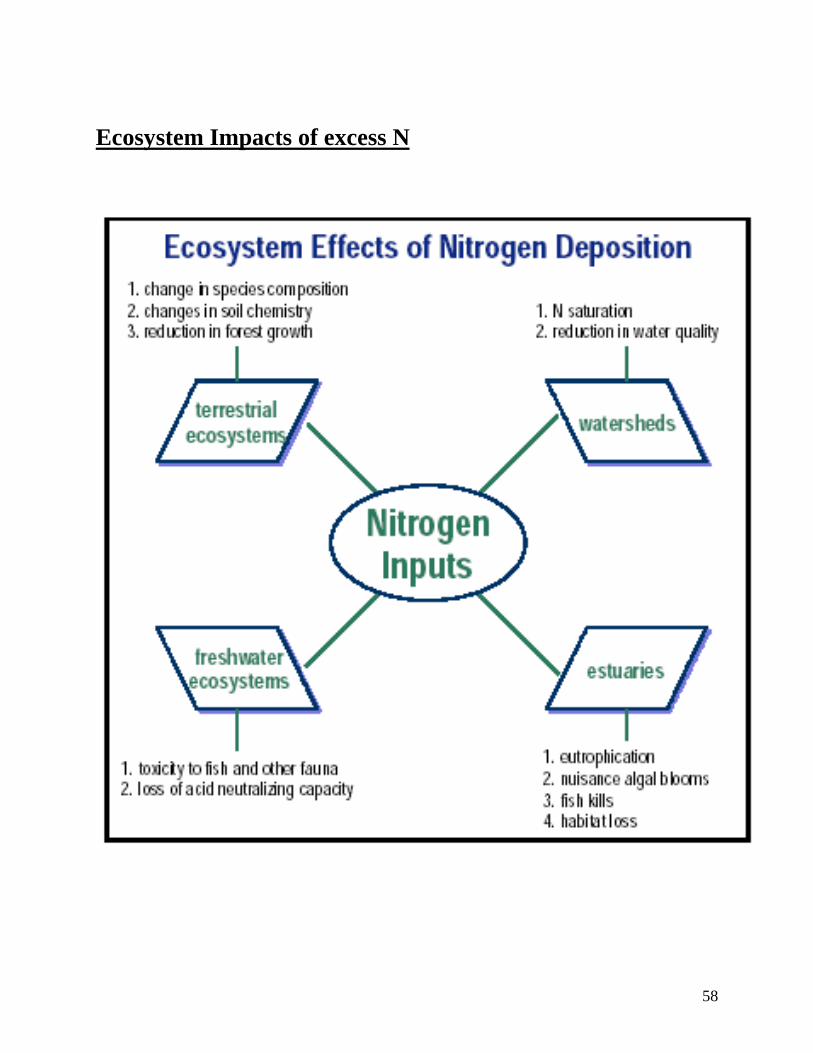
Ecosystem Impacts of excess N
59
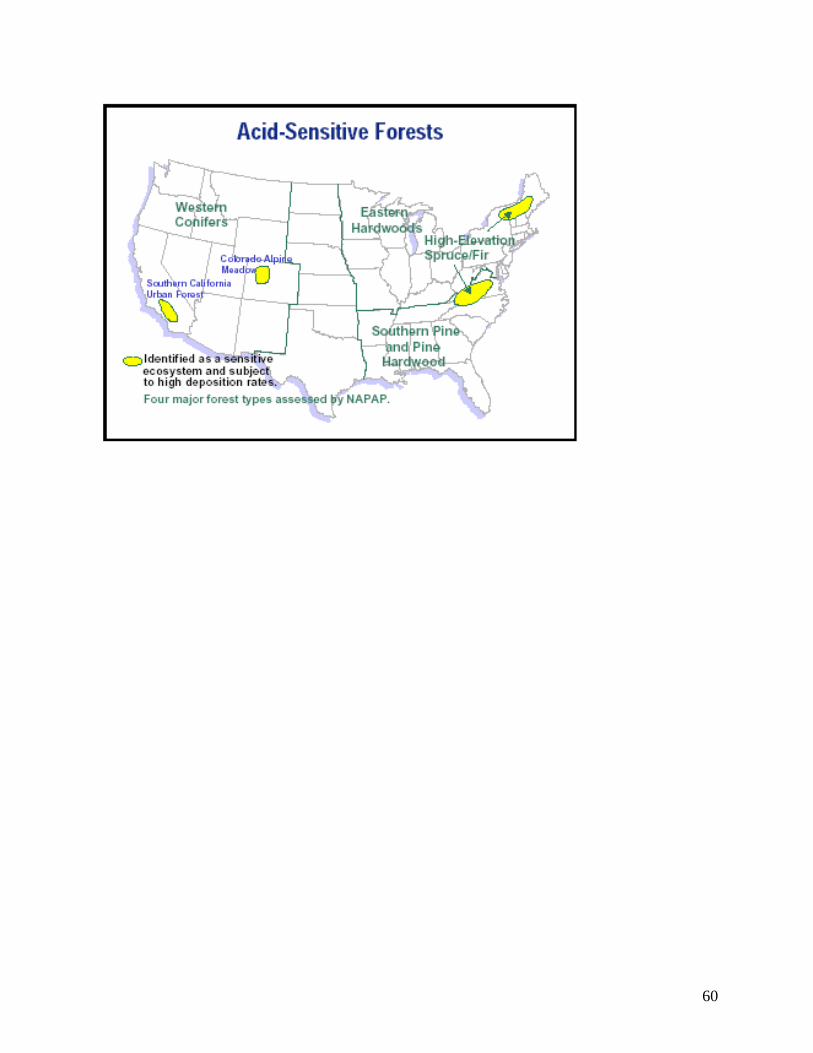
60
61
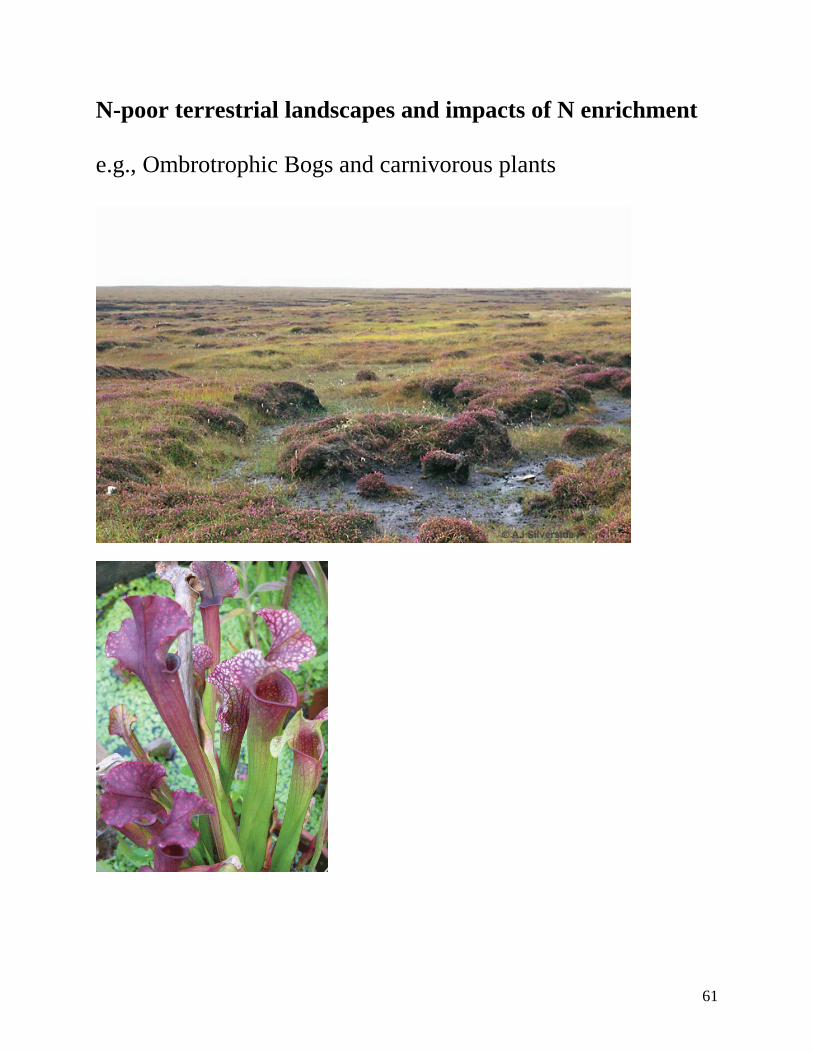
N-poor terrestrial landscapes and impacts of N enrichment e.g., Ombrotrophic Bogs and carnivorous plants
62
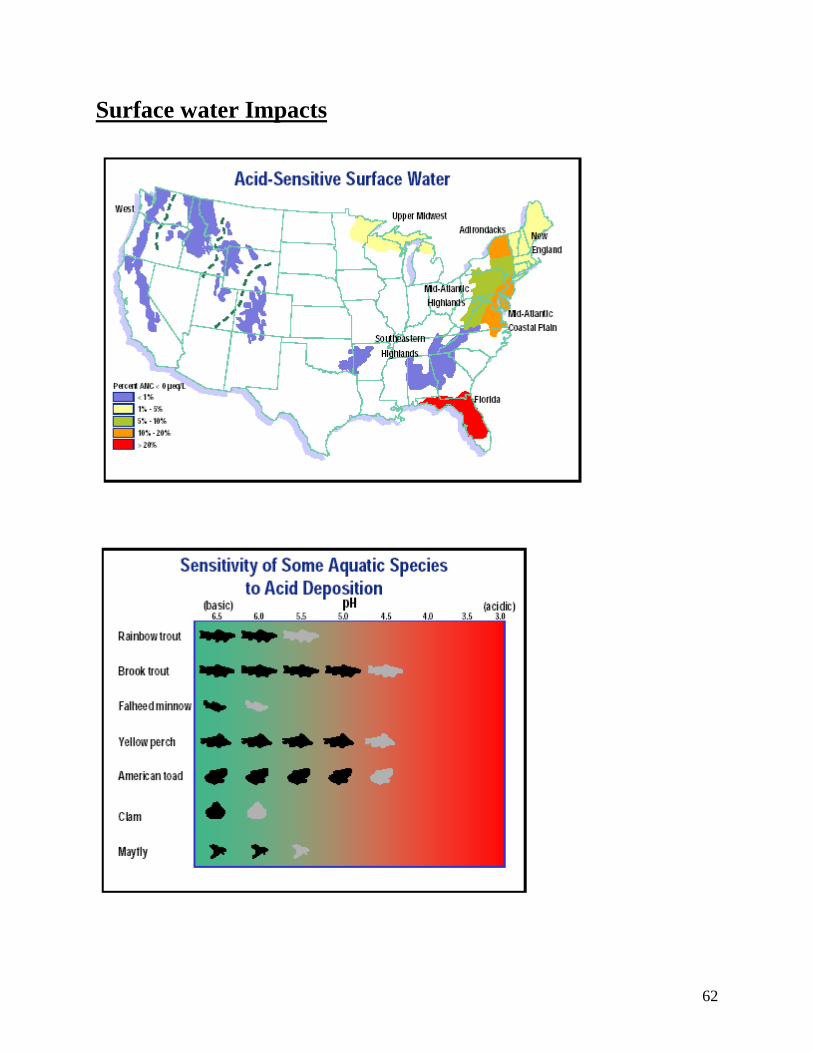
Surface water Impacts
63
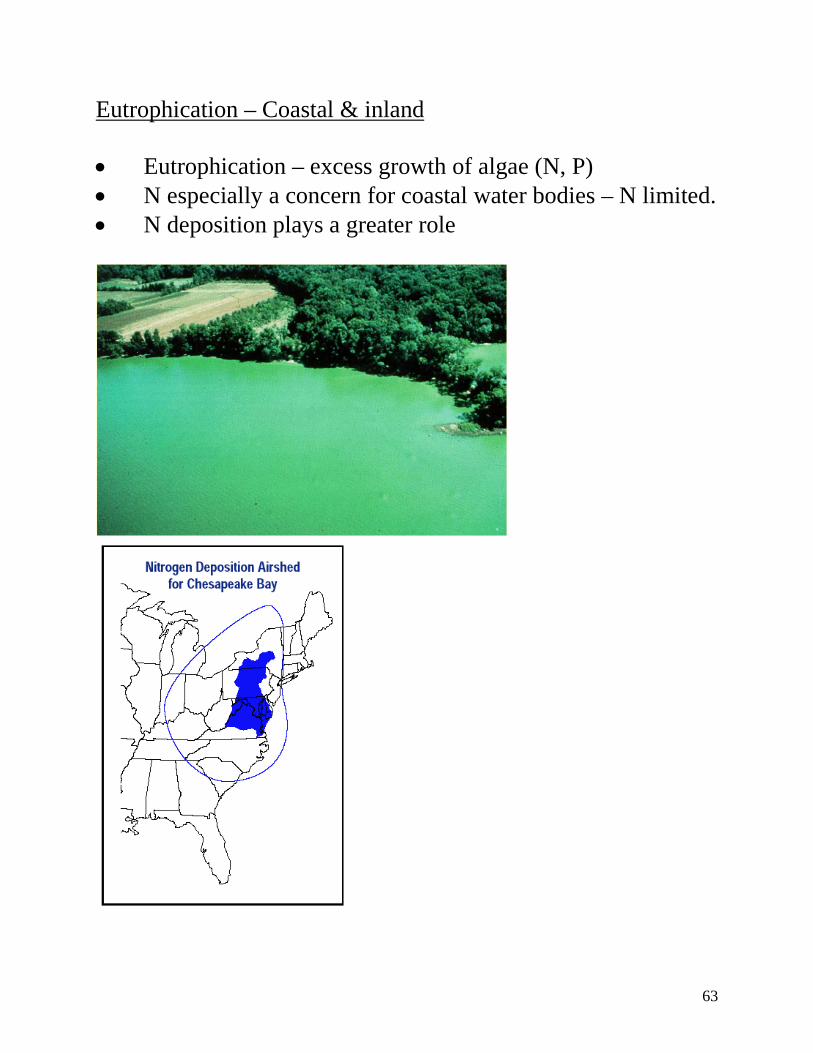
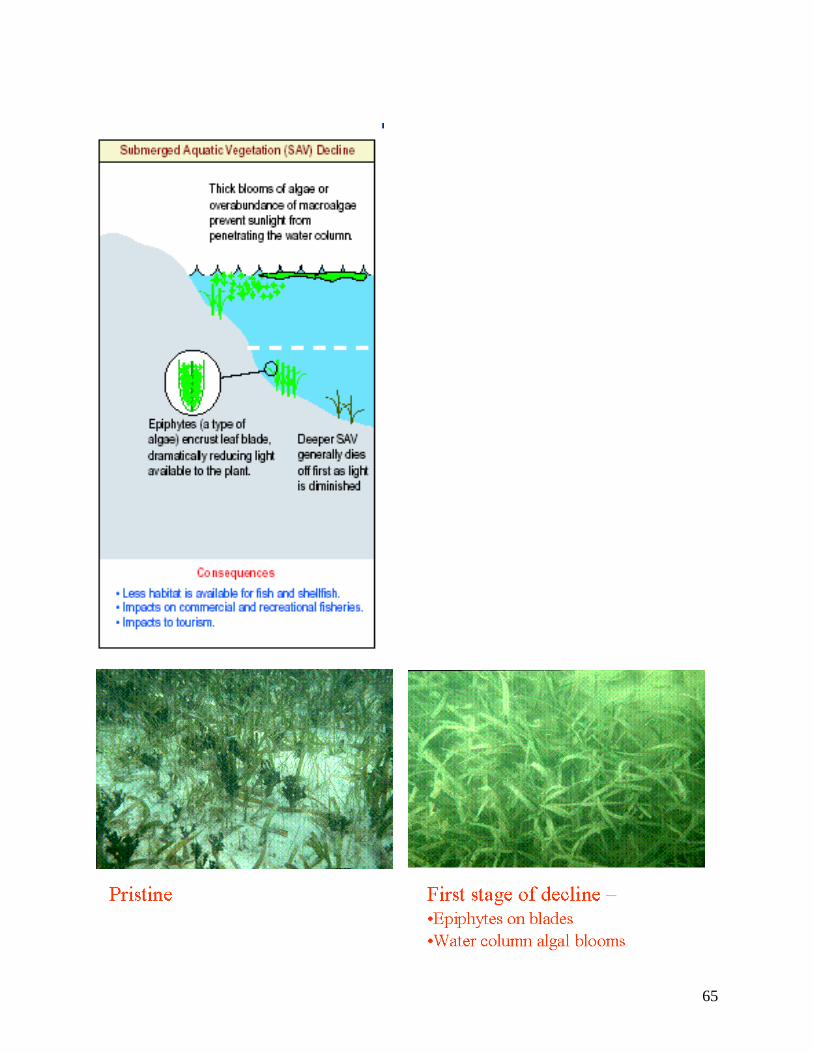
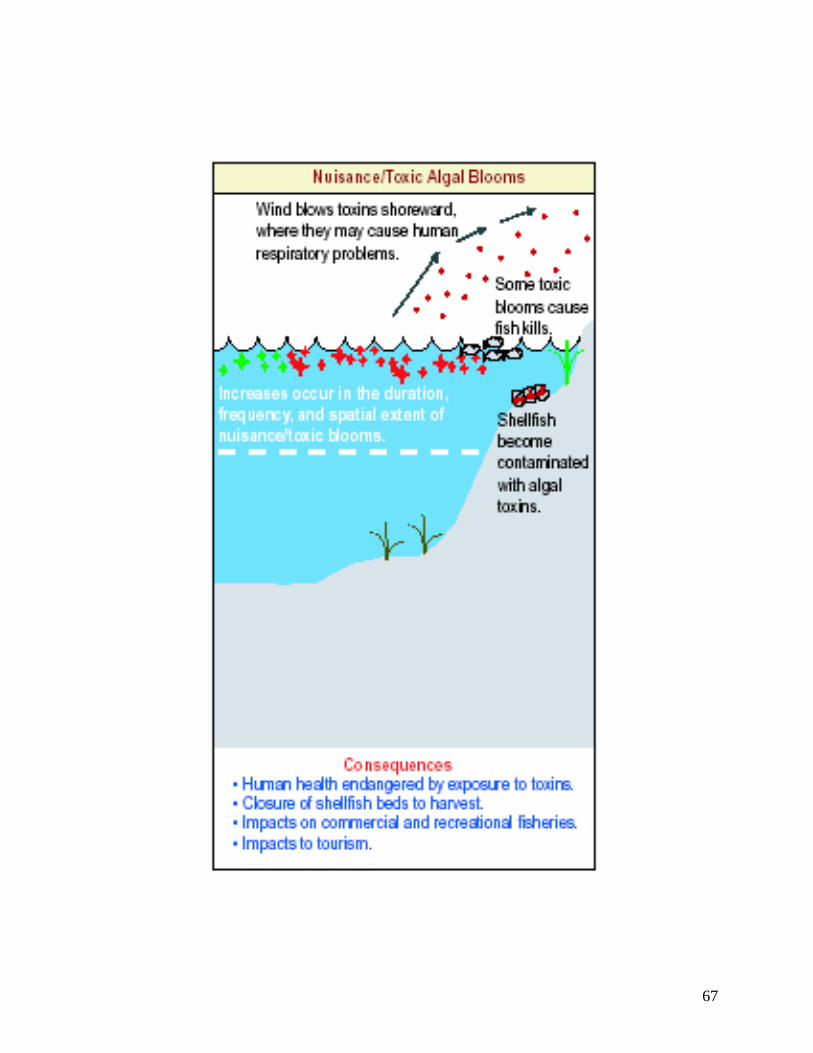
Eutrophication – Coastal & inland • Eutrophication – excess growth of algae (N, P) • N especially a concern for coastal water bodies – N limited. • N deposition plays a greater role
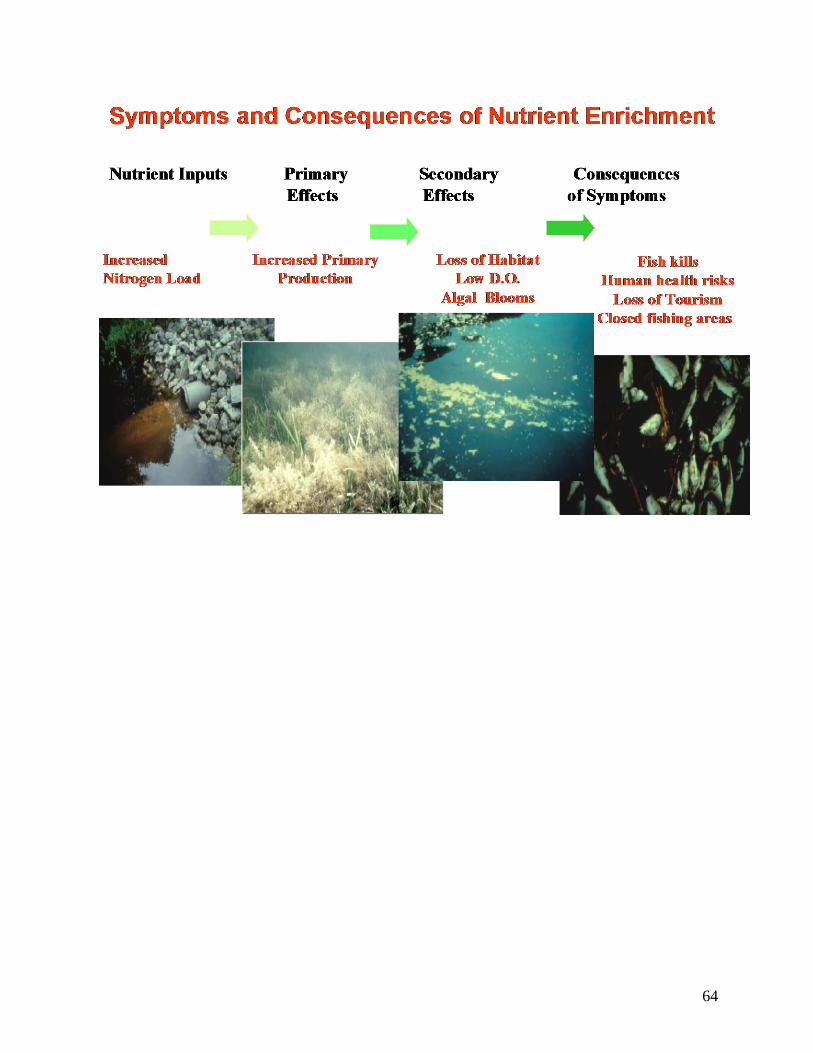
64
65
66
67
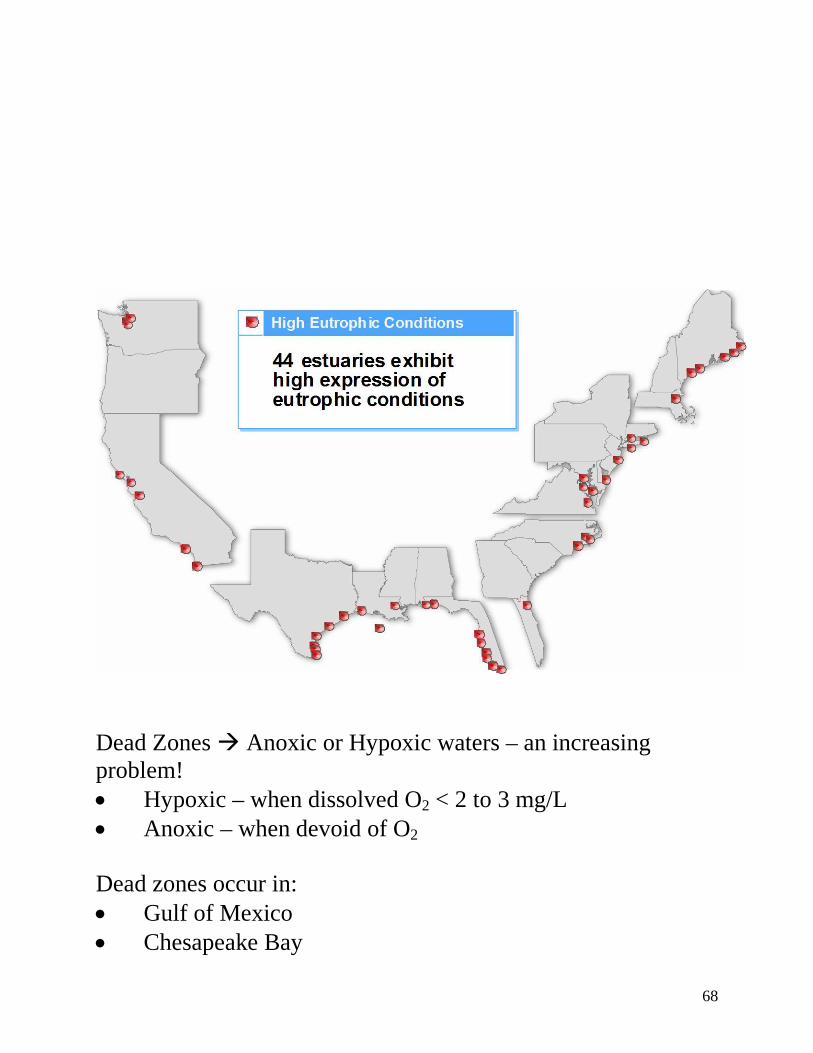
68
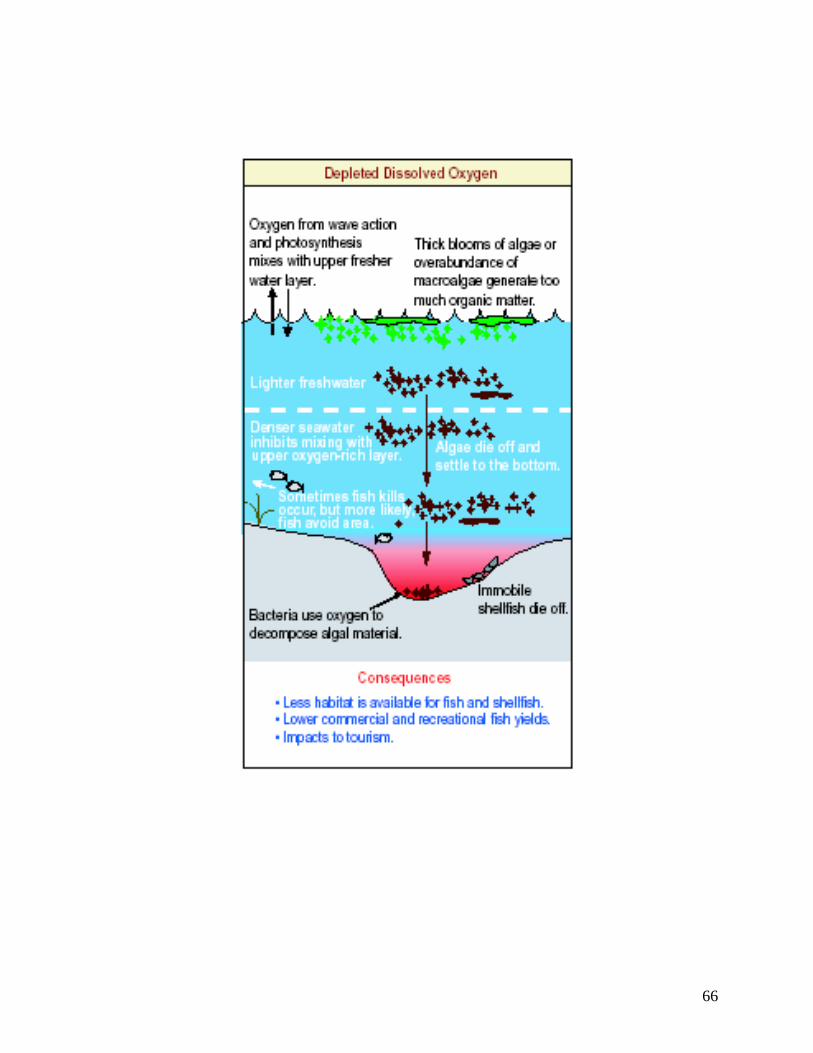
Dead Zones Anoxic or Hypoxic waters – an increasing problem! • Hypoxic – when dissolved O2 < 2 to 3 mg/L • Anoxic – when devoid of O2 Dead zones occur in: • Gulf of Mexico • Chesapeake Bay
69
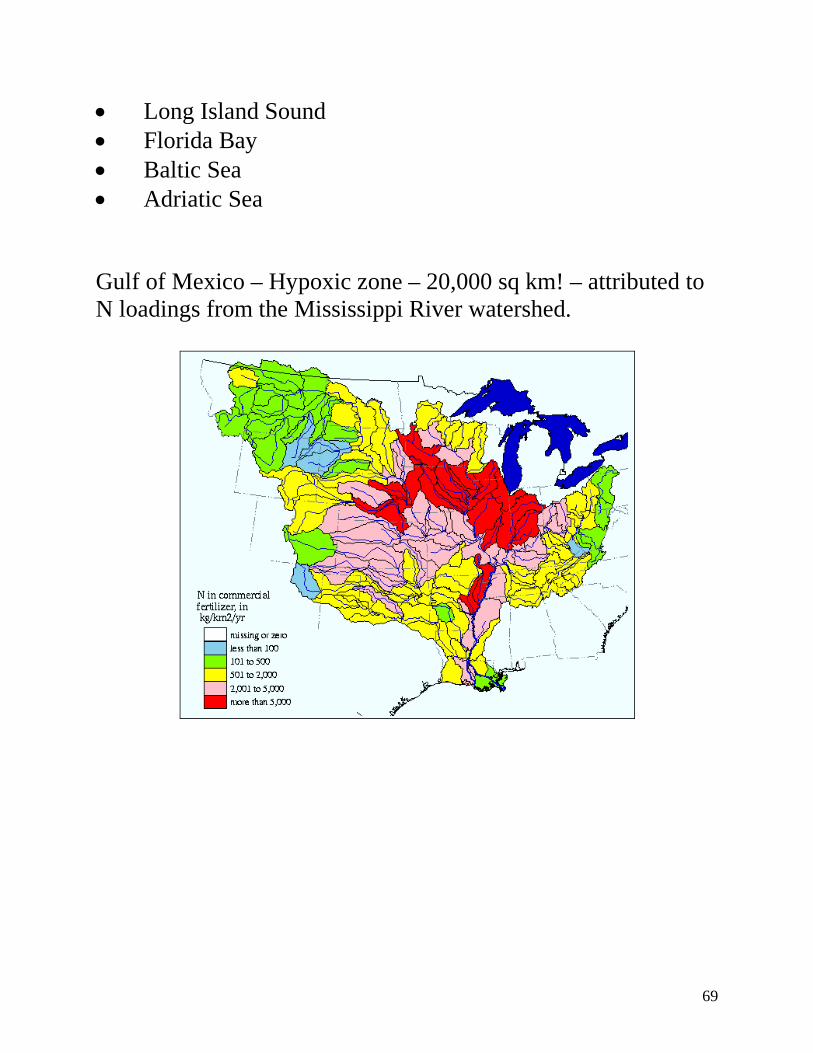
• Long Island Sound • Florida Bay • Baltic Sea • Adriatic Sea Gulf of Mexico – Hypoxic zone – 20,000 sq km! – attributed to N loadings from the Mississippi River watershed.