Groundwater Nitrogen Pollution and Assessment of Its...
8
Groundwater Nitrogen Pollution and Assessment of Its Health Risks: A Case Study of a Typical Village in Rural-Urban Continuum, China Yang Gao 1,3 *, Guirui Yu 1 *, Chunyan Luo 2 , Pei Zhou 3 1 Key Laboratory of Ecosystem Network Observation and Modeling, Institute of Geographic Sciences and Natural Resources Research, Chinese Academy of Sciences, Beijing, China, 2 Institute of Agricultural Resources and Regional Planning, CAAS, Beijing, China, 3 School of Agriculture and Biology, Shanghai Jiaotong University, Shanghai, China Abstract Protecting groundwater from nitrogen contamination is an important public-health concern and a major national environmental issue in China. In this study, we monitored water quality in 29 wells from 2009 to 2010 in a village in Shanghai city, whick belong to typical rural-urban continuum in China. The total N and NO 3 -N exhibited seasonal changes, and there were large fluctuations in NH 4 -N in residential areas, but without significant seasonal patterns. NO 2 -N in the water was not stable, but was present at high levels. Total N and NO 3 -N were significantly lower in residential areas than in agricultural areas. The groundwater quality in most wells belonged to Class III and IV in the Chinese water standard, which defines water that is unsuitable for human consumption. Our health risk assessments showed that NO 3 -N posed the greatest carcinogenic risk, with risk values ranging from 19 6 10 26 to 80 6 10 26 , which accounted for more than 90% of the total risk in the study area. Citation: Gao Y, Yu G, Luo C, Zhou P (2012) Groundwater Nitrogen Pollution and Assessment of Its Health Risks: A Case Study of a Typical Village in Rural-Urban Continuum, China. PLoS ONE 7(4): e33982. doi:10.1371/journal.pone.0033982 Editor: Alex J. Cannon, Pacific Climate Impacts Consortium, Canada Received November 17, 2011; Accepted February 20, 2012; Published April 13, 2012 Copyright: ß 2012 Gao et al. This is an open-access article distributed under the terms of the Creative Commons Attribution License, which permits unrestricted use, distribution, and reproduction in any medium, provided the original author and source are credited. Funding: This work was financially supported by National Key Basic Research Program (2010CB833504), and National Natural Science Foundation of China (40601097 and 30590381). The funders had no role in study design, data collection and analysis, decision to publish, or preparation of the manuscript. Competing Interests: The authors have declared that no competing interests exist. * E-mail: [email protected] (YG); [email protected] (GY) Introduction Groundwater is the major water supply for drinking and for the domestic, industrial, and agricultural sectors in the Shanghai region of China. One serious problem that affects the quality of the region’s groundwater is leaching of nutrients from the soil, which is especially evident in areas dominated by agriculture [1– 2]. Nitrogen percolates easily into the groundwater through the soil along with rainwater recharge or irrigation water. As a result, the shallow aquifers are more likely than deeper ones to initially suffer from contamination problems [3–4]. The application of large amounts of nitrogen fertilizers in regions of intensive agriculture contributes to excessive nitrogen accumulation in soils and excessive leaching into groundwater bodies [5–7]. Extensive irrigation and use of nitrogen (N) fertilizers together result in low N-use efficiency and high N loss [8]. Several studies have also reported increasing incidence of nitrogen pollution and dramatic increases in the nitrogen concentration in the groundwater of regions where intensive farming is practiced [9–11]. Because contaminated groundwater resources are often located in the vicinity of wells for drinking water, it is essential to determine how management practices in the area surrounding these wells will affect groundwater nitrogen concentrations, and particularly nitrate nitrogen (NO 3 -N). Nitrate is formed from fertilizers, decaying plants, manure and other organic residues. It is found in the air, soil, water and food (particularly in vegetables) and is produced naturally within the human body. In many cases, groundwater nitrate concentrations are currently approaching or exceeding the recommended 11.3 mg NO 3 -N L 21 drinking water standard (e.g., [12]). Excess nitrates (levels .50 mg L 21 ; [13]) in the drinking water cause health risks such as conversion of hemoglobin to methemoglobin, which depletes oxygen levels in the blood. Forman et al. [14] reported additional consequences among people who consumed drinking water containing high levels of nitrates: enlargement of the thyroid gland, increased incidence of 15 types of cancer and two kinds of birth defects, and even hypertension. In addition, increasing rates of stomach cancer caused by increasing nitrate intake have been reported [15]. In Shanghai, nitrogen pollution has become an increasingly serious problem. Villages in the Shanghai city are the main areas for developing urban agriculture, which can provide the main source of vegetables and fruits for many residents. Due to extensive irrigation and fertilizer use, non-point source pollution is the dominant form, and the non-point source nitrogen loading has substantially affected groundwater nitrogen concentrations [16]. Poinke and Urban [17] showed that the average nitrogen concentration in rural groundwater was five to seven times higher than that in adjacent forest-covered areas. Where groundwater is the main source of drinking, domestic, and agricultural water, potentially significant health risks are associated with the consumption of nitrate-rich groundwater. For this reason, it is important to study the nitrogen pollution problem in rural-urban continuum near Shanghai to determine the impact on food safety and health of the residents. The aim of the present study was PLoS ONE | www.plosone.org 1 April 2012 | Volume 7 | Issue 4 | e33982
Transcript of Groundwater Nitrogen Pollution and Assessment of Its...
Groundwater Nitrogen Pollution and Assessment of ItsHealth Risks: A Case Study of a Typical Village inRural-Urban Continuum, ChinaYang Gao1,3*, Guirui Yu1*, Chunyan Luo2, Pei Zhou3
1 Key Laboratory of Ecosystem Network Observation and Modeling, Institute of Geographic Sciences and Natural Resources Research, Chinese Academy of Sciences,
Beijing, China, 2 Institute of Agricultural Resources and Regional Planning, CAAS, Beijing, China, 3 School of Agriculture and Biology, Shanghai Jiaotong University,
Shanghai, China
Abstract
Protecting groundwater from nitrogen contamination is an important public-health concern and a major nationalenvironmental issue in China. In this study, we monitored water quality in 29 wells from 2009 to 2010 in a village inShanghai city, whick belong to typical rural-urban continuum in China. The total N and NO3-N exhibited seasonal changes,and there were large fluctuations in NH4-N in residential areas, but without significant seasonal patterns. NO2-N in the waterwas not stable, but was present at high levels. Total N and NO3-N were significantly lower in residential areas than inagricultural areas. The groundwater quality in most wells belonged to Class III and IV in the Chinese water standard, whichdefines water that is unsuitable for human consumption. Our health risk assessments showed that NO3-N posed thegreatest carcinogenic risk, with risk values ranging from 1961026 to 8061026, which accounted for more than 90% of thetotal risk in the study area.
Citation: Gao Y, Yu G, Luo C, Zhou P (2012) Groundwater Nitrogen Pollution and Assessment of Its Health Risks: A Case Study of a Typical Village in Rural-UrbanContinuum, China. PLoS ONE 7(4): e33982. doi:10.1371/journal.pone.0033982
Editor: Alex J. Cannon, Pacific Climate Impacts Consortium, Canada
Received November 17, 2011; Accepted February 20, 2012; Published April 13, 2012
Copyright: � 2012 Gao et al. This is an open-access article distributed under the terms of the Creative Commons Attribution License, which permits unrestricteduse, distribution, and reproduction in any medium, provided the original author and source are credited.
Funding: This work was financially supported by National Key Basic Research Program (2010CB833504), and National Natural Science Foundation of China(40601097 and 30590381). The funders had no role in study design, data collection and analysis, decision to publish, or preparation of the manuscript.
Competing Interests: The authors have declared that no competing interests exist.
* E-mail: [email protected] (YG); [email protected] (GY)
Introduction
Groundwater is the major water supply for drinking and for the
domestic, industrial, and agricultural sectors in the Shanghai
region of China. One serious problem that affects the quality of
the region’s groundwater is leaching of nutrients from the soil,
which is especially evident in areas dominated by agriculture [1–
2]. Nitrogen percolates easily into the groundwater through the
soil along with rainwater recharge or irrigation water. As a result,
the shallow aquifers are more likely than deeper ones to initially
suffer from contamination problems [3–4]. The application of
large amounts of nitrogen fertilizers in regions of intensive
agriculture contributes to excessive nitrogen accumulation in soils
and excessive leaching into groundwater bodies [5–7]. Extensive
irrigation and use of nitrogen (N) fertilizers together result in low
N-use efficiency and high N loss [8]. Several studies have also
reported increasing incidence of nitrogen pollution and dramatic
increases in the nitrogen concentration in the groundwater of
regions where intensive farming is practiced [9–11].
Because contaminated groundwater resources are often located
in the vicinity of wells for drinking water, it is essential to
determine how management practices in the area surrounding
these wells will affect groundwater nitrogen concentrations, and
particularly nitrate nitrogen (NO3-N). Nitrate is formed from
fertilizers, decaying plants, manure and other organic residues. It
is found in the air, soil, water and food (particularly in vegetables)
and is produced naturally within the human body. In many cases,
groundwater nitrate concentrations are currently approaching or
exceeding the recommended 11.3 mg NO3-N L21 drinking water
standard (e.g., [12]). Excess nitrates (levels .50 mg L21; [13]) in
the drinking water cause health risks such as conversion of
hemoglobin to methemoglobin, which depletes oxygen levels in
the blood. Forman et al. [14] reported additional consequences
among people who consumed drinking water containing high
levels of nitrates: enlargement of the thyroid gland, increased
incidence of 15 types of cancer and two kinds of birth defects, and
even hypertension. In addition, increasing rates of stomach cancer
caused by increasing nitrate intake have been reported [15].
In Shanghai, nitrogen pollution has become an increasingly
serious problem. Villages in the Shanghai city are the main areas
for developing urban agriculture, which can provide the main
source of vegetables and fruits for many residents. Due to extensive
irrigation and fertilizer use, non-point source pollution is the
dominant form, and the non-point source nitrogen loading has
substantially affected groundwater nitrogen concentrations [16].
Poinke and Urban [17] showed that the average nitrogen
concentration in rural groundwater was five to seven times higher
than that in adjacent forest-covered areas. Where groundwater is
the main source of drinking, domestic, and agricultural water,
potentially significant health risks are associated with the
consumption of nitrate-rich groundwater. For this reason, it is
important to study the nitrogen pollution problem in rural-urban
continuum near Shanghai to determine the impact on food safety
and health of the residents. The aim of the present study was
PLoS ONE | www.plosone.org 1 April 2012 | Volume 7 | Issue 4 | e33982
therefore to investigate seasonal changes in levels of nitrate and
other forms of nitrogen, and based on this data, to assess the health
risk for a typical village in Shanghai, thereby providing a scientific
basis for controlling nitrogen pollution and protecting groundwa-
ter safety.
Results
Changes in different types of nitrogen in thegroundwater of agricultural areas
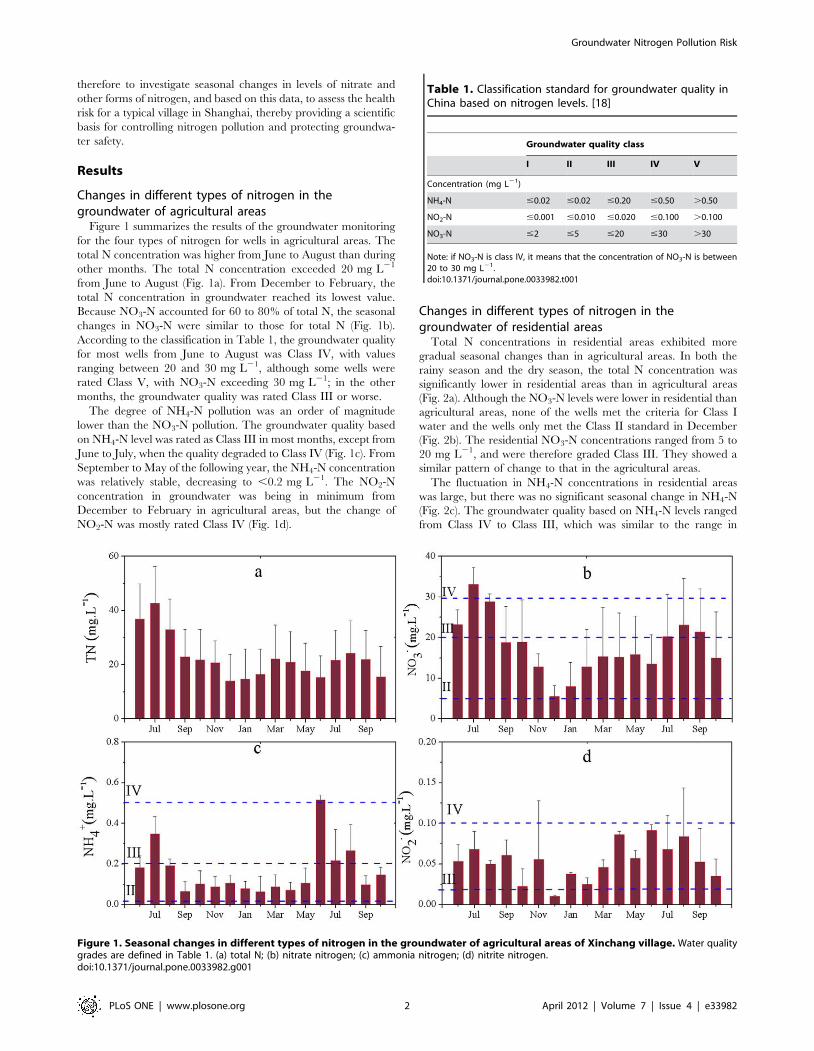
Figure 1 summarizes the results of the groundwater monitoring
for the four types of nitrogen for wells in agricultural areas. The
total N concentration was higher from June to August than during
other months. The total N concentration exceeded 20 mg L21
from June to August (Fig. 1a). From December to February, the
total N concentration in groundwater reached its lowest value.
Because NO3-N accounted for 60 to 80% of total N, the seasonal
changes in NO3-N were similar to those for total N (Fig. 1b).
According to the classification in Table 1, the groundwater quality
for most wells from June to August was Class IV, with values
ranging between 20 and 30 mg L21, although some wells were
rated Class V, with NO3-N exceeding 30 mg L21; in the other
months, the groundwater quality was rated Class III or worse.
The degree of NH4-N pollution was an order of magnitude
lower than the NO3-N pollution. The groundwater quality based
on NH4-N level was rated as Class III in most months, except from
June to July, when the quality degraded to Class IV (Fig. 1c). From
September to May of the following year, the NH4-N concentration
was relatively stable, decreasing to ,0.2 mg L21. The NO2-N
concentration in groundwater was being in minimum from
December to February in agricultural areas, but the change of
NO2-N was mostly rated Class IV (Fig. 1d).
Changes in different types of nitrogen in thegroundwater of residential areas
Total N concentrations in residential areas exhibited more
gradual seasonal changes than in agricultural areas. In both the
rainy season and the dry season, the total N concentration was
significantly lower in residential areas than in agricultural areas
(Fig. 2a). Although the NO3-N levels were lower in residential than
agricultural areas, none of the wells met the criteria for Class I
water and the wells only met the Class II standard in December
(Fig. 2b). The residential NO3-N concentrations ranged from 5 to
20 mg L21, and were therefore graded Class III. They showed a
similar pattern of change to that in the agricultural areas.
The fluctuation in NH4-N concentrations in residential areas
was large, but there was no significant seasonal change in NH4-N
(Fig. 2c). The groundwater quality based on NH4-N levels ranged
from Class IV to Class III, which was similar to the range in
Figure 1. Seasonal changes in different types of nitrogen in the groundwater of agricultural areas of Xinchang village. Water qualitygrades are defined in Table 1. (a) total N; (b) nitrate nitrogen; (c) ammonia nitrogen; (d) nitrite nitrogen.doi:10.1371/journal.pone.0033982.g001
Table 1. Classification standard for groundwater quality inChina based on nitrogen levels. [18]
Groundwater quality class
I II III IV V
Concentration (mg L21)
NH4-N #0.02 #0.02 #0.20 #0.50 .0.50
NO2-N #0.001 #0.010 #0.020 #0.100 .0.100
NO3-N #2 #5 #20 #30 .30
Note: if NO3-N is class IV, it means that the concentration of NO3-N is between20 to 30 mg L21.doi:10.1371/journal.pone.0033982.t001
Groundwater Nitrogen Pollution Risk
PLoS ONE | www.plosone.org 2 April 2012 | Volume 7 | Issue 4 | e33982
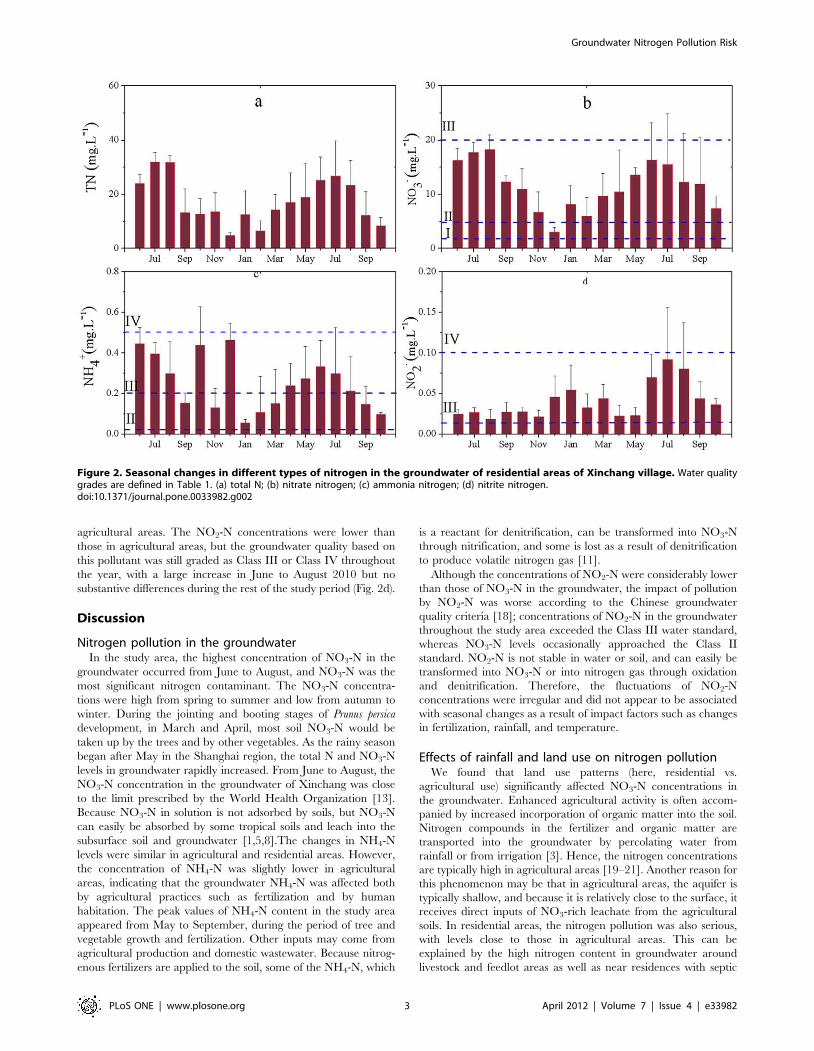
agricultural areas. The NO2-N concentrations were lower than
those in agricultural areas, but the groundwater quality based on
this pollutant was still graded as Class III or Class IV throughout
the year, with a large increase in June to August 2010 but no
substantive differences during the rest of the study period (Fig. 2d).
Discussion
Nitrogen pollution in the groundwaterIn the study area, the highest concentration of NO3-N in the
groundwater occurred from June to August, and NO3-N was the
most significant nitrogen contaminant. The NO3-N concentra-
tions were high from spring to summer and low from autumn to
winter. During the jointing and booting stages of Prunus persica
development, in March and April, most soil NO3-N would be
taken up by the trees and by other vegetables. As the rainy season
began after May in the Shanghai region, the total N and NO3-N
levels in groundwater rapidly increased. From June to August, the
NO3-N concentration in the groundwater of Xinchang was close
to the limit prescribed by the World Health Organization [13].
Because NO3-N in solution is not adsorbed by soils, but NO3-N
can easily be absorbed by some tropical soils and leach into the
subsurface soil and groundwater [1,5,8].The changes in NH4-N
levels were similar in agricultural and residential areas. However,
the concentration of NH4-N was slightly lower in agricultural
areas, indicating that the groundwater NH4-N was affected both
by agricultural practices such as fertilization and by human
habitation. The peak values of NH4-N content in the study area
appeared from May to September, during the period of tree and
vegetable growth and fertilization. Other inputs may come from
agricultural production and domestic wastewater. Because nitrog-
enous fertilizers are applied to the soil, some of the NH4-N, which
is a reactant for denitrification, can be transformed into NO3-N
through nitrification, and some is lost as a result of denitrification
to produce volatile nitrogen gas [11].
Although the concentrations of NO2-N were considerably lower
than those of NO3-N in the groundwater, the impact of pollution
by NO2-N was worse according to the Chinese groundwater
quality criteria [18]; concentrations of NO2-N in the groundwater
throughout the study area exceeded the Class III water standard,
whereas NO3-N levels occasionally approached the Class II
standard. NO2-N is not stable in water or soil, and can easily be
transformed into NO3-N or into nitrogen gas through oxidation
and denitrification. Therefore, the fluctuations of NO2-N
concentrations were irregular and did not appear to be associated
with seasonal changes as a result of impact factors such as changes
in fertilization, rainfall, and temperature.
Effects of rainfall and land use on nitrogen pollutionWe found that land use patterns (here, residential vs.
agricultural use) significantly affected NO3-N concentrations in
the groundwater. Enhanced agricultural activity is often accom-
panied by increased incorporation of organic matter into the soil.
Nitrogen compounds in the fertilizer and organic matter are
transported into the groundwater by percolating water from
rainfall or from irrigation [3]. Hence, the nitrogen concentrations
are typically high in agricultural areas [19–21]. Another reason for
this phenomenon may be that in agricultural areas, the aquifer is
typically shallow, and because it is relatively close to the surface, it
receives direct inputs of NO3-rich leachate from the agricultural
soils. In residential areas, the nitrogen pollution was also serious,
with levels close to those in agricultural areas. This can be
explained by the high nitrogen content in groundwater around
livestock and feedlot areas as well as near residences with septic
Figure 2. Seasonal changes in different types of nitrogen in the groundwater of residential areas of Xinchang village. Water qualitygrades are defined in Table 1. (a) total N; (b) nitrate nitrogen; (c) ammonia nitrogen; (d) nitrite nitrogen.doi:10.1371/journal.pone.0033982.g002
Groundwater Nitrogen Pollution Risk
PLoS ONE | www.plosone.org 3 April 2012 | Volume 7 | Issue 4 | e33982
tanks. Komar and Anderson [22] investigated the different
nitrogen sources in a rural environment using nitrogen isotopes
and obtained similar results to those in our study. Another reason
for our observed results may be that the aquifers in the agricultural
and residential areas are close to each other, so that leaching may
transport pollutants between them; as a result, the magnitude of
the difference in nitrogen contents in the groundwater would
decrease.
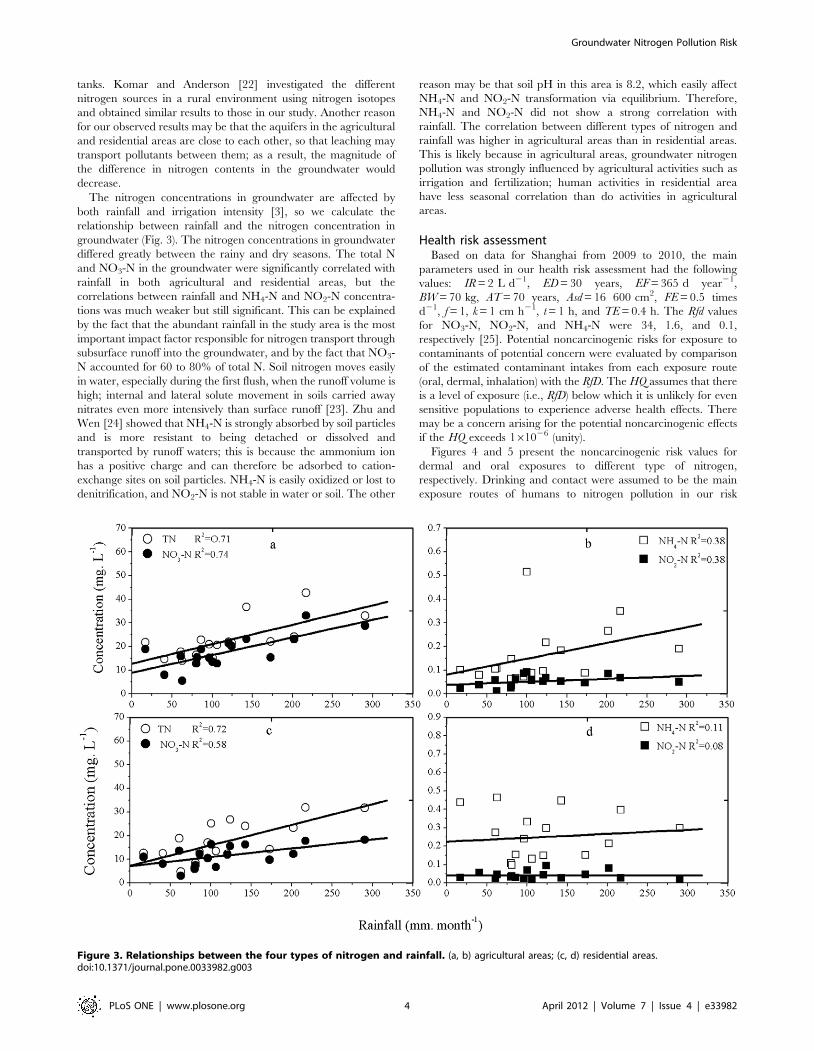
The nitrogen concentrations in groundwater are affected by
both rainfall and irrigation intensity [3], so we calculate the
relationship between rainfall and the nitrogen concentration in
groundwater (Fig. 3). The nitrogen concentrations in groundwater
differed greatly between the rainy and dry seasons. The total N
and NO3-N in the groundwater were significantly correlated with
rainfall in both agricultural and residential areas, but the
correlations between rainfall and NH4-N and NO2-N concentra-
tions was much weaker but still significant. This can be explained
by the fact that the abundant rainfall in the study area is the most
important impact factor responsible for nitrogen transport through
subsurface runoff into the groundwater, and by the fact that NO3-
N accounted for 60 to 80% of total N. Soil nitrogen moves easily
in water, especially during the first flush, when the runoff volume is
high; internal and lateral solute movement in soils carried away
nitrates even more intensively than surface runoff [23]. Zhu and
Wen [24] showed that NH4-N is strongly absorbed by soil particles
and is more resistant to being detached or dissolved and
transported by runoff waters; this is because the ammonium ion
has a positive charge and can therefore be adsorbed to cation-
exchange sites on soil particles. NH4-N is easily oxidized or lost to
denitrification, and NO2-N is not stable in water or soil. The other
reason may be that soil pH in this area is 8.2, which easily affect
NH4-N and NO2-N transformation via equilibrium. Therefore,
NH4-N and NO2-N did not show a strong correlation with
rainfall. The correlation between different types of nitrogen and
rainfall was higher in agricultural areas than in residential areas.
This is likely because in agricultural areas, groundwater nitrogen
pollution was strongly influenced by agricultural activities such as
irrigation and fertilization; human activities in residential area
have less seasonal correlation than do activities in agricultural
areas.
Health risk assessmentBased on data for Shanghai from 2009 to 2010, the main
parameters used in our health risk assessment had the following
values: IR = 2 L d21, ED = 30 years, EF = 365 d year21,
BW = 70 kg, AT = 70 years, Asd = 16 600 cm2, FE = 0.5 times
d21, f = 1, k = 1 cm h21, t = 1 h, and TE = 0.4 h. The Rfd values
for NO3-N, NO2-N, and NH4-N were 34, 1.6, and 0.1,
respectively [25]. Potential noncarcinogenic risks for exposure to
contaminants of potential concern were evaluated by comparison
of the estimated contaminant intakes from each exposure route
(oral, dermal, inhalation) with the RfD. The HQ assumes that there
is a level of exposure (i.e., RfD) below which it is unlikely for even
sensitive populations to experience adverse health effects. There
may be a concern arising for the potential noncarcinogenic effects
if the HQ exceeds 161026 (unity).
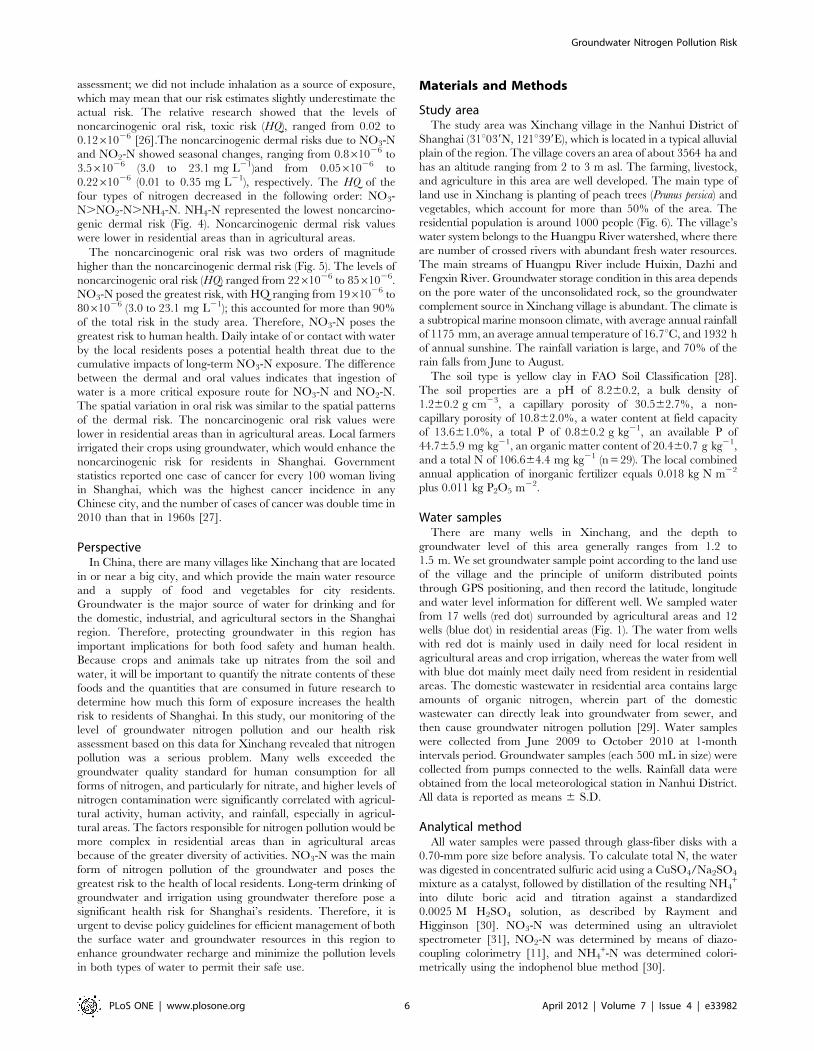
Figures 4 and 5 present the noncarcinogenic risk values for
dermal and oral exposures to different type of nitrogen,
respectively. Drinking and contact were assumed to be the main
exposure routes of humans to nitrogen pollution in our risk
Figure 3. Relationships between the four types of nitrogen and rainfall. (a, b) agricultural areas; (c, d) residential areas.doi:10.1371/journal.pone.0033982.g003
Groundwater Nitrogen Pollution Risk
PLoS ONE | www.plosone.org 4 April 2012 | Volume 7 | Issue 4 | e33982
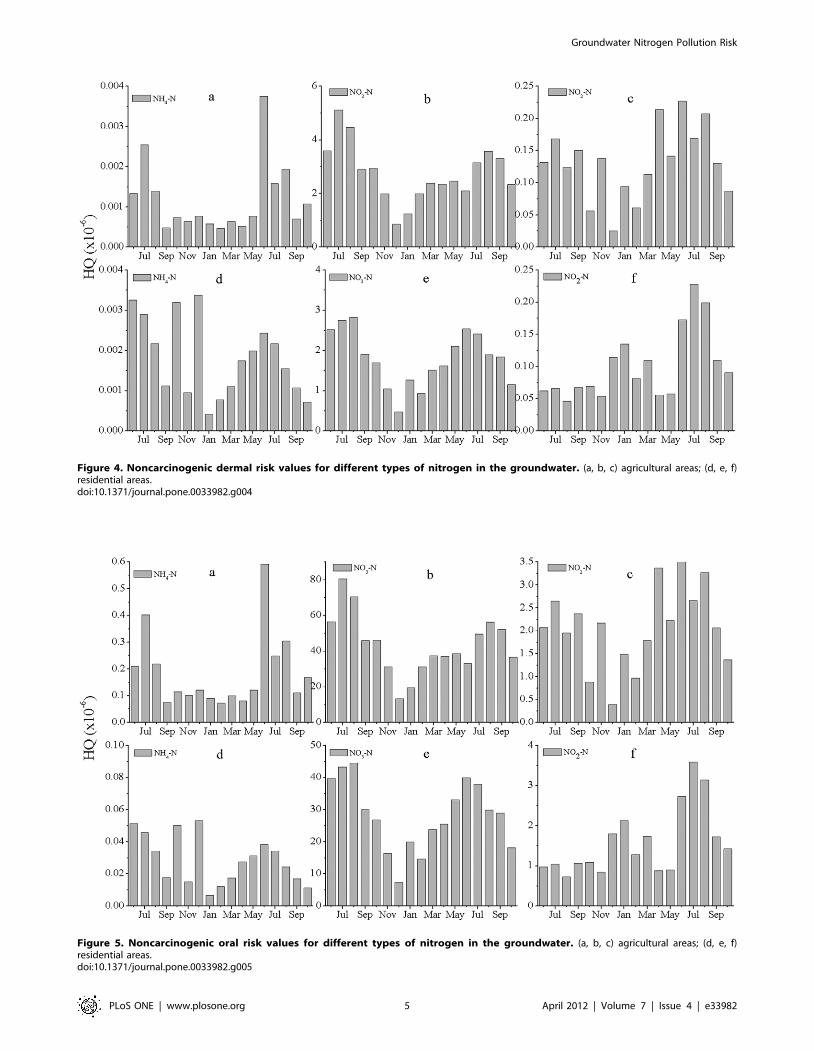
Figure 4. Noncarcinogenic dermal risk values for different types of nitrogen in the groundwater. (a, b, c) agricultural areas; (d, e, f)residential areas.doi:10.1371/journal.pone.0033982.g004
Figure 5. Noncarcinogenic oral risk values for different types of nitrogen in the groundwater. (a, b, c) agricultural areas; (d, e, f)residential areas.doi:10.1371/journal.pone.0033982.g005
Groundwater Nitrogen Pollution Risk
PLoS ONE | www.plosone.org 5 April 2012 | Volume 7 | Issue 4 | e33982
assessment; we did not include inhalation as a source of exposure,
which may mean that our risk estimates slightly underestimate the
actual risk. The relative research showed that the levels of
noncarcinogenic oral risk, toxic risk (HQ), ranged from 0.02 to
0.1261026 [26].The noncarcinogenic dermal risks due to NO3-N
and NO2-N showed seasonal changes, ranging from 0.861026 to
3.561026 (3.0 to 23.1 mg L21)and from 0.0561026 to
0.2261026 (0.01 to 0.35 mg L21), respectively. The HQ of the
four types of nitrogen decreased in the following order: NO3-
N.NO2-N.NH4-N. NH4-N represented the lowest noncarcino-
genic dermal risk (Fig. 4). Noncarcinogenic dermal risk values
were lower in residential areas than in agricultural areas.
The noncarcinogenic oral risk was two orders of magnitude
higher than the noncarcinogenic dermal risk (Fig. 5). The levels of
noncarcinogenic oral risk (HQ) ranged from 2261026 to 8561026.
NO3-N posed the greatest risk, with HQ ranging from 1961026 to
8061026 (3.0 to 23.1 mg L21); this accounted for more than 90%
of the total risk in the study area. Therefore, NO3-N poses the
greatest risk to human health. Daily intake of or contact with water
by the local residents poses a potential health threat due to the
cumulative impacts of long-term NO3-N exposure. The difference
between the dermal and oral values indicates that ingestion of
water is a more critical exposure route for NO3-N and NO2-N.
The spatial variation in oral risk was similar to the spatial patterns
of the dermal risk. The noncarcinogenic oral risk values were
lower in residential areas than in agricultural areas. Local farmers
irrigated their crops using groundwater, which would enhance the
noncarcinogenic risk for residents in Shanghai. Government
statistics reported one case of cancer for every 100 woman living
in Shanghai, which was the highest cancer incidence in any
Chinese city, and the number of cases of cancer was double time in
2010 than that in 1960s [27].
PerspectiveIn China, there are many villages like Xinchang that are located
in or near a big city, and which provide the main water resource
and a supply of food and vegetables for city residents.
Groundwater is the major source of water for drinking and for
the domestic, industrial, and agricultural sectors in the Shanghai
region. Therefore, protecting groundwater in this region has
important implications for both food safety and human health.
Because crops and animals take up nitrates from the soil and
water, it will be important to quantify the nitrate contents of these
foods and the quantities that are consumed in future research to
determine how much this form of exposure increases the health
risk to residents of Shanghai. In this study, our monitoring of the
level of groundwater nitrogen pollution and our health risk
assessment based on this data for Xinchang revealed that nitrogen
pollution was a serious problem. Many wells exceeded the
groundwater quality standard for human consumption for all
forms of nitrogen, and particularly for nitrate, and higher levels of
nitrogen contamination were significantly correlated with agricul-
tural activity, human activity, and rainfall, especially in agricul-
tural areas. The factors responsible for nitrogen pollution would be
more complex in residential areas than in agricultural areas
because of the greater diversity of activities. NO3-N was the main
form of nitrogen pollution of the groundwater and poses the
greatest risk to the health of local residents. Long-term drinking of
groundwater and irrigation using groundwater therefore pose a
significant health risk for Shanghai’s residents. Therefore, it is
urgent to devise policy guidelines for efficient management of both
the surface water and groundwater resources in this region to
enhance groundwater recharge and minimize the pollution levels
in both types of water to permit their safe use.
Materials and Methods
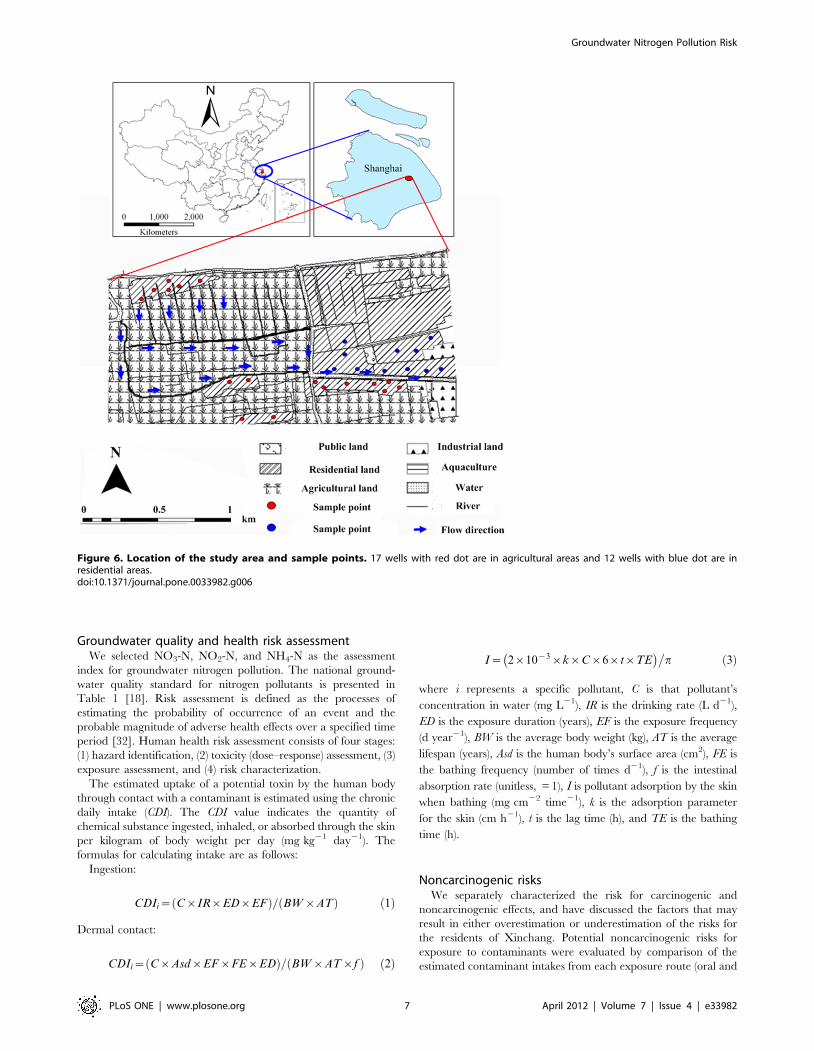
Study areaThe study area was Xinchang village in the Nanhui District of
Shanghai (31u039N, 121u399E), which is located in a typical alluvial
plain of the region. The village covers an area of about 3564 ha and
has an altitude ranging from 2 to 3 m asl. The farming, livestock,
and agriculture in this area are well developed. The main type of
land use in Xinchang is planting of peach trees (Prunus persica) and
vegetables, which account for more than 50% of the area. The
residential population is around 1000 people (Fig. 6). The village’s
water system belongs to the Huangpu River watershed, where there
are number of crossed rivers with abundant fresh water resources.
The main streams of Huangpu River include Huixin, Dazhi and
Fengxin River. Groundwater storage condition in this area depends
on the pore water of the unconsolidated rock, so the groundwater
complement source in Xinchang village is abundant. The climate is
a subtropical marine monsoon climate, with average annual rainfall
of 1175 mm, an average annual temperature of 16.7uC, and 1932 h
of annual sunshine. The rainfall variation is large, and 70% of the
rain falls from June to August.
The soil type is yellow clay in FAO Soil Classification [28].
The soil properties are a pH of 8.260.2, a bulk density of
1.260.2 g cm23, a capillary porosity of 30.562.7%, a non-
capillary porosity of 10.862.0%, a water content at field capacity
of 13.661.0%, a total P of 0.860.2 g kg21, an available P of
44.765.9 mg kg21, an organic matter content of 20.460.7 g kg21,
and a total N of 106.664.4 mg kg21 (n = 29). The local combined
annual application of inorganic fertilizer equals 0.018 kg N m22
plus 0.011 kg P2O5 m22.
Water samplesThere are many wells in Xinchang, and the depth to
groundwater level of this area generally ranges from 1.2 to
1.5 m. We set groundwater sample point according to the land use
of the village and the principle of uniform distributed points
through GPS positioning, and then record the latitude, longitude
and water level information for different well. We sampled water
from 17 wells (red dot) surrounded by agricultural areas and 12
wells (blue dot) in residential areas (Fig. 1). The water from wells
with red dot is mainly used in daily need for local resident in
agricultural areas and crop irrigation, whereas the water from well
with blue dot mainly meet daily need from resident in residential
areas. The domestic wastewater in residential area contains large
amounts of organic nitrogen, wherein part of the domestic
wastewater can directly leak into groundwater from sewer, and
then cause groundwater nitrogen pollution [29]. Water samples
were collected from June 2009 to October 2010 at 1-month
intervals period. Groundwater samples (each 500 mL in size) were
collected from pumps connected to the wells. Rainfall data were
obtained from the local meteorological station in Nanhui District.
All data is reported as means 6 S.D.
Analytical methodAll water samples were passed through glass-fiber disks with a
0.70-mm pore size before analysis. To calculate total N, the water
was digested in concentrated sulfuric acid using a CuSO4/Na2SO4
mixture as a catalyst, followed by distillation of the resulting NH4+
into dilute boric acid and titration against a standardized
0.0025 M H2SO4 solution, as described by Rayment and
Higginson [30]. NO3-N was determined using an ultraviolet
spectrometer [31], NO2-N was determined by means of diazo-
coupling colorimetry [11], and NH4+-N was determined colori-
metrically using the indophenol blue method [30].
Groundwater Nitrogen Pollution Risk
PLoS ONE | www.plosone.org 6 April 2012 | Volume 7 | Issue 4 | e33982
Groundwater quality and health risk assessmentWe selected NO3-N, NO2-N, and NH4-N as the assessment
index for groundwater nitrogen pollution. The national ground-
water quality standard for nitrogen pollutants is presented in
Table 1 [18]. Risk assessment is defined as the processes of
estimating the probability of occurrence of an event and the
probable magnitude of adverse health effects over a specified time
period [32]. Human health risk assessment consists of four stages:
(1) hazard identification, (2) toxicity (dose–response) assessment, (3)
exposure assessment, and (4) risk characterization.
The estimated uptake of a potential toxin by the human body
through contact with a contaminant is estimated using the chronic
daily intake (CDI). The CDI value indicates the quantity of
chemical substance ingested, inhaled, or absorbed through the skin
per kilogram of body weight per day (mg kg21 day21). The
formulas for calculating intake are as follows:
Ingestion:
CDIi~ C|IR|ED|EFð Þ= BW|ATð Þ ð1Þ
Dermal contact:
CDIi~ C|Asd|EF|FE|EDð Þ= BW|AT|fð Þ ð2Þ
I~ 2|10{3|k|C|6|t|TE� ��
p ð3Þ
where i represents a specific pollutant, C is that pollutant’s
concentration in water (mg L21), IR is the drinking rate (L d21),
ED is the exposure duration (years), EF is the exposure frequency
(d year21), BW is the average body weight (kg), AT is the average
lifespan (years), Asd is the human body’s surface area (cm2), FE is
the bathing frequency (number of times d21), f is the intestinal
absorption rate (unitless, = 1), I is pollutant adsorption by the skin
when bathing (mg cm22 time21), k is the adsorption parameter
for the skin (cm h21), t is the lag time (h), and TE is the bathing
time (h).
Noncarcinogenic risksWe separately characterized the risk for carcinogenic and
noncarcinogenic effects, and have discussed the factors that may
result in either overestimation or underestimation of the risks for
the residents of Xinchang. Potential noncarcinogenic risks for
exposure to contaminants were evaluated by comparison of the
estimated contaminant intakes from each exposure route (oral and
Figure 6. Location of the study area and sample points. 17 wells with red dot are in agricultural areas and 12 wells with blue dot are inresidential areas.doi:10.1371/journal.pone.0033982.g006
Groundwater Nitrogen Pollution Risk
PLoS ONE | www.plosone.org 7 April 2012 | Volume 7 | Issue 4 | e33982
dermal) with the reference dose (RfD, (mg kg21 day21) to produce
the hazard quotient (HQ, unitless), which is defined as follows [25]:
HQ~CDI|10{6�
Rfd ð4Þ
where HQ is hazard quotient (unitless); RfD is reference dose
(mg. kg21 day21).
Carcinogenic risksCarcinogenic risks were estimated as the incremental probabil-
ity of an individual developing cancer over a lifetime as a result of
exposure to a potential carcinogen. To do so, we used the
following linear low-dose carcinogenic risk equation for each
exposure route [25]:
CA~CDI|slope factor ð5Þ
where CA is the carcinogenic risk and ‘‘slope factor’’ is mg kg21
day21. Slope factor can be obtained from Risk Assessment
Information System [33]. If a site has multiple carcinogenic
contaminants, cancer risks for each carcinogen and each exposure
route can be added (based on the assumption of additivity of
effects) and compared with the accepted risk.
Acknowledgments
We thank Dr.Yafeng Wang in Research Center for Eco-Environmental
Sciences, Dr. Liang Mao in Shanghai Jiaotong University, and Geoffrey
Hart (Montreal, Canada) for his help in writing this paper. The authors
would also like to thank the anonymous reviewers for their helpful remarks.
Author Contributions
Conceived and designed the experiments: YG. Performed the experiments:
CL. Analyzed the data: YG. Contributed reagents/materials/analysis
tools: PZ GY. Wrote the paper: YG GY.
References
1. Zhu B, Wang T, You X, Gao MR (2008) Nutrient release from weathering ofpurplish rocks in the Sichuan Basin, China. Pedosphere 18(2): 257–264.
2. Gao Y, Zhu B, Zhou P, Tang JL, Wang T, et al. (2009) Effects of vegetationcover on phosphorus loss from a hillslope cropland of purple soil under
simulated rainfall: a case study in China. Nutrient Cycling in Agroecosystems 85:
263–273.3. Naik PK, Tambe JA, Dehury BN, Tiwari AN (2008) Impact of urbanization on
the groundwater regime in a fast growing city in central India. EnvironmentalMonitoring and Assessment 146: 339–373.
4. Gao Y, Zhu B, Wang T, Wang YF (2012) Seasonal change of non-point source
pollution-induced bioavailable phosphorus loss: a case study of SouthwesternChina. Journal of Hydrology 420–421: 373–379.
5. Zhu B, Wang T, Kuang FH, Luo ZX, Tang JL, et al. (2009) Measurements ofnitrate leaching from a hillslope cropland in the central Sichuan Basin, China.
Soil Science Society of America Journal 73(4): 1419–1426.6. Akhavan S, Abedi-Koupai J, Mousavi SF, Afyuni M, Eslamian SS, et al. (2010)
Application of SWAT model to investigate nitrate leaching in Hamadan–Bahar
Watershed, Iran. Agriculture Ecosystems and Environment 139: 675–688.7. Gao Y, Zhu B, Wang T, Tang JL, Zhou P, et al. (2010) Bioavailable phosphorus
transport from a hillslope cropland of purple soil under natural and simulatedrainfall. Environmental Monitoring and Assessment 171: 539–550.
8. Chen SF, Wu WL, Hu KL, Li W (2010) The effects of land use change and
irrigation water resource on nitrate contamination in shallow groundwater atcounty scale. Ecological Complexity 7: 131–138.
9. Adhikary PP, Chandrasekharan H, Chakraborty D, Kamble K (2010)Assessment of groundwater pollution in West Delhi, India using geostatistical
approach. Environmental Monitoring and Assessment 167: 599–615.
10. Hu KL, Huang YF, Li H, Li BG, Chen DL, et al. (2005) Spatial variability ofshallow groundwater level, electrical conductivity and nitrate concentration, and
risk assessment of nitrate contamination in North China Plain. EnvironmentInternational 31: 896–903.
11. Chen XM, Wo F, Chen C, Fang K (2010) Seasonal changes in theconcentrations of nitrogen and phosphorus in farmland drainage and
groundwater of the Taihu Lake region of China. Environmental Monitoring
and Assessment 169: 159–168.12. Jackson BM, Browne CA, Butler AP, Peach D, Wade AJ, et al. (2008) Nitrate
transport in chalk catchments: monitoring, modelling and policy implications.Environmental Science and Policy 11: 125–135.
13. WHO (2008) Guidelines for drinking-water quality- Third Edition Incorporat-
ing the first and second addenda. Volume 1. Recommendations. World HealthOrganization, Geneva website. Available: http://www.who.int/water_
sanitation_health/dwq/GDWPRecomdrev1and2.pdf. Accessed 10 Sept 2010.14. Forman D, Al-Dabbagh S, Doll R (1985) Nitrates, nitrites and gastric cancer in
Great Britain. Nature 313: 620–625.15. Payne MR (1993) Farm waste and nitrate pollution. In: Jones JG, ed. Agriculture
and the environment 63–73. Horwood, New York.
16. Huang HB, Gao Y, Cao JJ, Huang HY, Zhang X, et al. (2010) Nonpoint sourcepollution of nitrogen in groundwater and risk assessment in urban agricultural
region of Shanghai. Journal of Soil and Water Conservation 24(3): 56–70. (InChinese).
17. Poinke HB, Urban JB (1985) Effect of agricultural land-use on groundwaterquality in a small Pennsylvania watershed. Ground Water 23: 68–80.
18. State Environmental Protection Administration of China (1994) Chinese
groundwater quality criteria of classification, (GB/T14848-93), (pp. 23–32).Beijing: China Environmental Science Press (in Chinese).
19. Vidal M, Melgar J, Opez AL, Santoalla MC (2000) Spatial and temporalhydrochemical changes in groundwater under the contaminating effects of
fertilizers and wastewater. Journal of Environmental Management 60: 215–225.
20. Cepuder P, Shukla MK (2002) Groundwater nitrate in Austria: A case study inTullnerfeld. Nutrient Cycling in Agroecosystems 64: 301–315.
21. Reddy AGS, Kumar KN, Rao DS, Rao SS (2009) Assessment of nitratecontamination due to groundwater pollution in north eastern part of Anantapur
District, A.P. India. Environmental Monitoring and Assessment 148: 463–476.22. Komar SC, Anderson HW (1993) Nitrogen isotopes as indicators of nitrate
source in Minnesota sand plain aquifers. Groundwater 31(2): 250–270.
23. Yang JL, Zhang GL, Shi XZ, Wang HJ, Cao ZH, et al. (2009) Dynamic changesof nitrogen and phosphorus losses in ephemeral runoff processes by typical storm
events in Sichuan Basin, Southwest China. Soil & Tillage Research 105:292–299.
24. Zhu ZL, Wen QX (1992) Nitrogen of Chinese Soil. Jiangsu Science and
Technology Press, Nanjing.25. USEPA (1989) Risk assessment guidance for superfund, Vol. I, human health
evaluation manual. Part A: (interim final), EPA/540/1–89/002. Washington,DC: Office of Emergency and Remedial Response, U.S. Environmental
Protection Agency.
26. Li YL, Liu JL, Cao ZG, Lin C, Yang ZF (2010) Spatial distribution and healthrisk of heavy metals and polycyclic aromatic hydrocarbons (PAHs) in the water
of the Luanhe River Basin, China. Environmental Monitoring and Assessment163: 1–13.
27. Shanghai Municipal Center for Disease Control & Prevention (2010) website.Available: http://www.scdc.sh.cn/. Accessed 10 Sept 2010. (in Chinese).
28. Gong ZT Chinese Soil Taxonomy, Science Press, Beijing. (In Chinese).
29. Cao JJ, Gao Y, Huang HB, Huang HY, Mao L, Zhang X, et al. (2010) Outputcharacteristics of non-point nitrogen from a typical village region in Yangtze
Delta under an individual rainfall event. Environmental Science 31(11):2587–2593. (In Chinese).
30. Rayment GE, Higginson FR (1992) Australian laboratory handbook of soil and
water chemical methods. Inkata Press, Sydney.31. Committee of Analytical Method of Water and Wastewater (1989) Analytical
Method of Water and Wastewater. China Environmental Science Press, Beijing.(In Chinese).
32. Kolluru RV, Bartell SM, Pitblado RM, Stricoff RS (1996) Risk assessment andmanagement handbook. McGraw-Hill, New York.
33. USEPA Risk Assessment Information System [EB/OL] website. Available:
http://rais. ornl. gov/cgi-bin /tox / TOX- select ? select = nrad. Accessed 10Sept 2010.
Groundwater Nitrogen Pollution Risk
PLoS ONE | www.plosone.org 8 April 2012 | Volume 7 | Issue 4 | e33982