Nitrogen as the major factor influencing gene expression ...
12
Nitrogen as the major factor influencing gene expression in Yarrowia lipolytica Downloaded from: https://research.chalmers.se, 2022-04-03 00:39 UTC Citation for the original published paper (version of record): Hapeta, P., Kerkhoven, E., Lazar, Z. (2020) Nitrogen as the major factor influencing gene expression in Yarrowia lipolytica Biotechnology Reports, 27 http://dx.doi.org/10.1016/j.btre.2020.e00521 N.B. When citing this work, cite the original published paper. research.chalmers.se offers the possibility of retrieving research publications produced at Chalmers University of Technology. It covers all kind of research output: articles, dissertations, conference papers, reports etc. since 2004. research.chalmers.se is administrated and maintained by Chalmers Library (article starts on next page)
Transcript of Nitrogen as the major factor influencing gene expression ...
Nitrogen as the major factor influencing gene expression inYarrowia lipolytica
Downloaded from: https://research.chalmers.se, 2022-04-03 00:39 UTC
Citation for the original published paper (version of record):Hapeta, P., Kerkhoven, E., Lazar, Z. (2020)Nitrogen as the major factor influencing gene expression in Yarrowia lipolyticaBiotechnology Reports, 27http://dx.doi.org/10.1016/j.btre.2020.e00521
N.B. When citing this work, cite the original published paper.
research.chalmers.se offers the possibility of retrieving research publications produced at Chalmers University of Technology.It covers all kind of research output: articles, dissertations, conference papers, reports etc. since 2004.research.chalmers.se is administrated and maintained by Chalmers Library
(article starts on next page)

Biotechnology Reports 27 (2020) e00521
Nitrogen as the major factor influencing gene expression in Yarrowialipolytica
Piotr Hapetaa, Eduard J. Kerkhovenb,c, Zbigniew Lazara,*aDepartment of Biotechnology and Food Microbiology, Wroclaw University of Environmental and Life Sciences, Chelmonskiego 37, 51-630 Wroclaw, PolandbDepartment of Biology and Biological Engineering, Division of Systems and Synthetic Biology, Chalmers University of Technology, SE-412 96 Gothenburg,SwedencNovo Nordisk Foundation Center for Biosustainability, Chalmers University of Technology, SE-412 96 Gothenburg, Sweden
A R T I C L E I N F O
Article history:Received 23 June 2020Received in revised form 29 July 2020Accepted 25 August 2020
Keywords:YarrowialipolyticaRNAseqHexokinaseNitrogenGlycerol
A B S T R A C T
Yarrowia lipolytica is an important industrial microorganism used for the production of oleochemicals.The design of effective biotechnological processes with this cell factory requires an in-depth knowledgeof its metabolism. Here we present a transcriptomic study of Y. lipolytica grown in the presence of glyceroland glucose, and mixture of both at different carbon to nitrogen ratios. It emerged that the transcriptomiclandscape of Y. lipolytica is more sensitive to the nitrogen availability than to the utilized carbon source, asevidenced by more genes being differentially expressed in lower carbon to nitrogen ratio. Specifically,expression of hexokinase (HXK1) is significantly susceptible to changes in nitrogen concentrations. HighHXK1 expression in low nitrogen seems to impact other genes which are implicated in tricarboxylic acidcycle and erythritol biosynthesis. We further show that expression of HXK1 and two genes belonging tothe sugar porter family might be controlled by GATA-like zinc-finger proteins.© 2020 Published by Elsevier B.V. This is an open access article under the CC BY-NC-ND license (http://
creativecommons.org/licenses/by-nc-nd/4.0/).
Contents lists available at ScienceDirect
Biotechnology Reports
journal homepage: www.else vie r .com/ locat e/btre
1. Introduction
Microorganisms are under constant influence of ever-changingnutrient concentrations in their environments, hence sensing andadapting to those changes is crucial for survival. As a result ofevolution, several mechanisms helping in precise adaptation ofmicrobial physiology to the environment have developed. Viathese mechanisms, i.e. signalling pathways, many microorganismscan directly sense changes in the concentrations of variousnutrients, such as carbon and nitrogen sources, and adjust theirmetabolism to the environmental challenges. The cellular metab-olism can be adjusted through fine controlled expression of genesinvolved in utilization of a given nutrient or its derivatives. Theseevents can be observed in complex, often evolutionarily conservedregulatory processes, such as carbon catabolite repression (CCR)and nitrogen catabolite repression (NCR). Most of our currentunderstanding of CCR and NCR comes from observations ofinvestigating these processes in the model yeast Saccharomycescerevisiae as reviewed in [1,2], while only few studies have been
* Corresponding author at: Department of Biotechnology and Food Microbiology,Wroclaw University of Environmental and Life Sciences, Chelmonskiego 37, 51-630Wroclaw, Poland.
E-mail address: [email protected] (Z. Lazar).
https://doi.org/10.1016/j.btre.2020.e005212215-017X/© 2020 Published by Elsevier B.V. This is an open access article under the C
devoted to other industrially and environmentally relevantmicroorganisms such as the oleaginous yeast Yarrowia lipolytica.
The strictly aerobic yeast Y. lipolytica is a promising cell factoryfor production of valuable compounds, such as organic acids [3–5],polyhydroxy alcohols [6,7] and aromas [8]. High protein secretioncapacity [9] and FDA awarded GRAS status [10] makes the yeast apotential platform for therapeutic protein production [11]. Themost prominent characteristic of Y. lipolytica is, however, its abilityto accumulate large amounts of intracellular lipids that can reachup to 20 % of cell dry weight in wild-type strains [12]. This trait,together with its ability to use industrial wastes as substrates, e.g.crude glycerol [13], as well as a rapidly expanding range of geneticengineering tools [14–16] render Y. lipolytica an excellent producerof biofuels and other oleochemicals. To design efficient and cost-effective bioprocesses with this yeast, utilization of inexpensiveand sustainable raw materials combined with a deep, system-levelunderstanding of its metabolism are of great importance.
Y. lipolytica is able to use a plethora of cost-attractive carbonsources. Both, hydrophobic and hydrophilic substrates, such aslipids, glycerol or glucose [17,18] are readily utilized by this yeast.Glycerol is a cheap feedstock for bioprocesses due to its significantamounts generated as by-product of soap and biodiesel industries[19,20]. Glucose, on the other hand, is the most abundantmonosaccharide found in plant polymers such as starch andcellulose. Unlike the model yeast S. cerevisiae, Y. lipolytica utilizesglycerol exhibiting much higher growth rates [21]. Moreover, when
C BY-NC-ND license (http://creativecommons.org/licenses/by-nc-nd/4.0/).

Table 1Yeast strains used in this study.
Strain Genotype Reference
A101 Wild-type [24]W29 Wild-type [10]PHY94 MatA, leu2�270, ura3�302b, xpr2�322, hxk1, glk1, pTEF-HXK1 [Hapeta et al., in preparation]
2 P. Hapeta et al. / Biotechnology Reports 27 (2020) e00521
grown in a medium containing glycerol and glucose, glycerol isconsumed first or co-consumed with glucose [22] suggesting an asyet unknown regulatory mechanism(s) controlling this behaviour.An attempt to elucidate the background of this phenomenon usingwhole transcriptome sequencing under carbon limiting conditionshas recently been taken [23]. In the current work, we expand onthis by considering the interplay between carbon sources andcarbon to nitrogen ratios.
2. Materials and methods
2.1. Yeast strains and media
The main strain used throughout this study was the wild type Y.lipolytica A101 strain [24]. Strains W29 and PHY94 were used forcomparisons in gene expression analysis (Table 1). The strainswere routinely maintained in YPD medium consisting of 10 g/Lyeast extract, 10 g/L peptone, 20 g/L glucose or glycerol withoptional 10 g/L agar (for plates) at 28�C. For long-term storage thestrains were kept at �80 �C in 50 % glycerol. Composition of all theminimal media used in this study is listed in Table 2. The YNB(Yeast Nitrogen Base) medium was purchased from FormediumLtd., Hunstanton, UK. Glycerol and glucose stock solution were ofconcentration 500 g/L and cold-sterilized through 0.22 mmmembranes. A general representation of the performed experi-ments and strains used is presented in Fig. 1.
2.2. Shake-flask cultures
Cultivations were performed in 250 mL Erlenmeyer flasks with50 mL YNB medium. Prepared media were inoculated with biomassto an initial OD600 of 0.5 and incubated at 28 �C on a rotary shakerwith 3 Hz shaking speed. The samples for biomass and substrateutilization analyses were collected at 0, 6, 10 and 24 h of culture. In
Table 2YNB media variants used in this study.
Component Concentration [g/L]
Shake-flasksC/N 20 C/N 40
YNB 1.9NH4Cl 4.47 2.2Glucose 50Phosphate buffer pH 6.8 50 mM
Bioreactor batch modeC/N 20 C/N 40
YNB 1.9NH4Cl 1.78 0.89KH2PO4 1Glycerol 10.2Glucose 10
Bioreactor chemostat modeC/N 20 C/N 40
YNB 1.9NH4Cl 4.47 2.2KH2PO4 1Glycerol 50Glucose 50Glycerol + Glucose 25.2 + 24.6
early exponential growth phase (t = 10 h) 1 mL samples werecollected, flash-freezed in liquid nitrogen and kept at �80 �C priorto RNA extraction. Experiments were performed in triplicates.
2.3. Bioreactor cultures
The batch bioreactor cultures were performed in Biostat B Plusfermenters (Sartorius-Stedim, Germany) under following condi-tions: the working volume of 1500 mL, the temperature of 28 �C,the stirring rate of 10 Hz and the aeration of 0.6 vvm (vessel volumeper minute). pH was automatically maintained at pH 6.8 byaddition of 40 % (w/v) KOH. Initial OD600 was set to 0.5. Theexperiments were performed in biological duplicates.
2.4. Chemostat cultivations
The chemostat cultivations were carried out in Biostat B Plusfermenters (Sartorius-Stedim, Germany) under following condi-tions: the working volume of 750 mL, the temperature of 28 �C, thestirring rate of 10 Hz and the aeration of 0.6 vvm (volume of air pervolume of liquid per minute). pH was automatically maintained at6.8 by addition of 40 % (w/v) KOH. The dilution rate was set at 0.05/h. The process was held until the steady state (7–12 mediaexchanges, depending on applied carbon source), defined asconstant biomass and constant remaining substrate concentrationin the post-fermentation medium for at least 48 h were achieved.At steady states 10 mL samples were collected, flash-freezed inliquid nitrogen and kept at �80 �C prior to RNA extraction. Eachculture variant was carried out in biological duplicate.
2.5. RNA extraction
The RNA for transcriptome sequencing was obtained bydisrupting the cells using Mikro-Dismembrator U ball mill(Sartorius AG, Göttingen, Germany) and metal beads, followedby extraction using RNeasy Mini Kit (Qiagen, Hilden, Germany)according to the manufacturers’ protocol. RNA for qRT-PCR wereextracted using Total RNA Mini kit (A&A Biotechnology, Gdynia,Poland) according to the provided protocol. In both cases, extractedRNA was checked for quality using Biochrom WPA Biowave DNAspectrophotometer (Biochrom Ltd., Cambridge, UK).
2.6. Quantitative real-time PCR
Extracted RNA samples were treated with DNase (A&ABiotechnology, Gdynia, Poland) and reverse transcribed to cDNAusing Maxima First Strand cDNA Synthesis Kit for RT-qPCR(Thermo Scientific). The obtained cDNA samples were then usedfor qPCR reaction using Maxima SYBR Green qPCR Master Mix(Thermo Scientific) and primers listed in Table S1 on the PCRmaxEco 48 thermal cycler (Illumina, San Diego, CA). Expression ofgenes was standardized to the expression of actin (YlACT1,YALI0D08272g) gene.
2.7. RNA sequencing
The RNA samples from chemostat cultivations were sequencedby Novogene (Beijing, China) using HiSeq 4000 next-generation
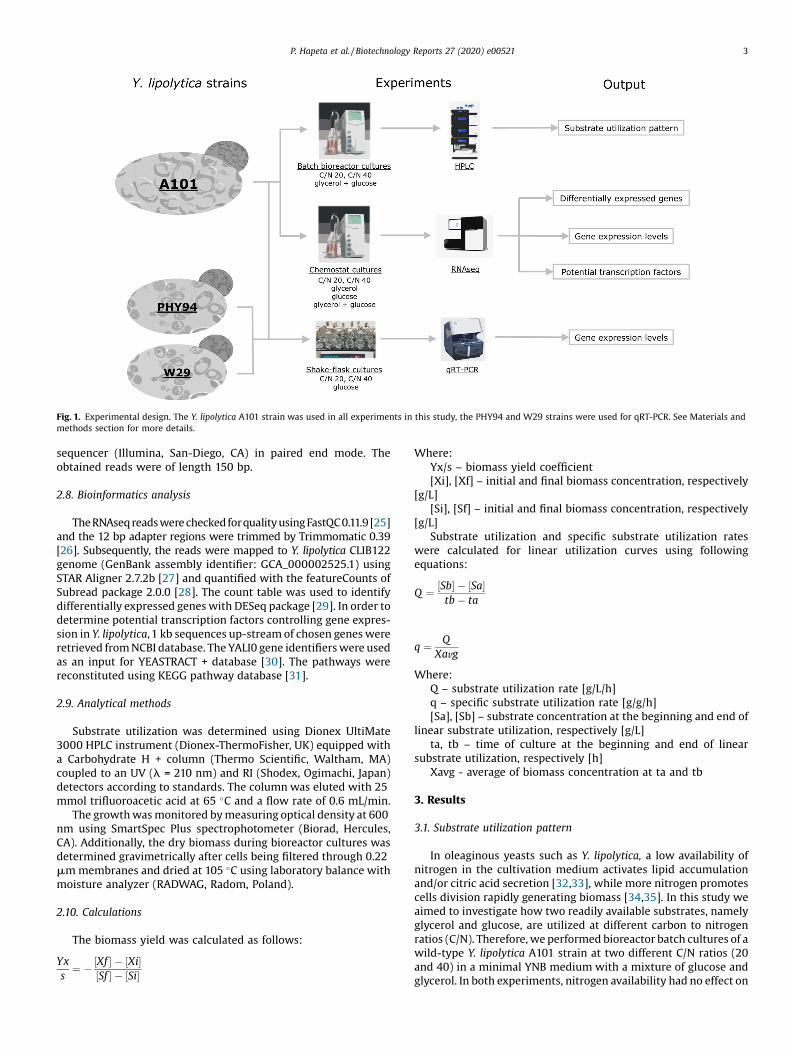
Fig. 1. Experimental design. The Y. lipolytica A101 strain was used in all experiments in this study, the PHY94 and W29 strains were used for qRT-PCR. See Materials andmethods section for more details.
P. Hapeta et al. / Biotechnology Reports 27 (2020) e00521 3
sequencer (Illumina, San-Diego, CA) in paired end mode. Theobtained reads were of length 150 bp.
2.8. Bioinformatics analysis
The RNAseq reads were checked forquality using FastQC0.11.9 [25]and the 12 bp adapter regions were trimmed by Trimmomatic 0.39[26]. Subsequently, the reads were mapped to Y. lipolytica CLIB122genome (GenBank assembly identifier: GCA_000002525.1) usingSTAR Aligner 2.7.2b [27] and quantified with the featureCounts ofSubread package 2.0.0 [28]. The count table was used to identifydifferentially expressed genes with DESeq package [29]. In order todetermine potential transcription factors controlling gene expres-sion in Y. lipolytica, 1 kb sequences up-stream of chosen genes wereretrieved from NCBI database. The YALI0 gene identifiers were usedas an input for YEASTRACT + database [30]. The pathways werereconstituted using KEGG pathway database [31].
2.9. Analytical methods
Substrate utilization was determined using Dionex UltiMate3000 HPLC instrument (Dionex-ThermoFisher, UK) equipped witha Carbohydrate H + column (Thermo Scientific, Waltham, MA)coupled to an UV (l = 210 nm) and RI (Shodex, Ogimachi, Japan)detectors according to standards. The column was eluted with 25mmol trifluoroacetic acid at 65 �C and a flow rate of 0.6 mL/min.
The growth was monitored by measuring optical density at 600nm using SmartSpec Plus spectrophotometer (Biorad, Hercules,CA). Additionally, the dry biomass during bioreactor cultures wasdetermined gravimetrically after cells being filtered through 0.22mm membranes and dried at 105 �C using laboratory balance withmoisture analyzer (RADWAG, Radom, Poland).
2.10. Calculations
The biomass yield was calculated as follows:
Yxs
¼ � Xf½ � � ½Xi�Sf½ � � Si½ �
Where:Yx/s – biomass yield coefficient[Xi], [Xf] – initial and final biomass concentration, respectively
[g/L][Si], [Sf] – initial and final biomass concentration, respectively
[g/L]Substrate utilization and specific substrate utilization rates
were calculated for linear utilization curves using followingequations:
Q ¼ Sb½ � � ½Sa�tb � ta
q ¼ QXavg
Where:Q – substrate utilization rate [g/L/h]q – specific substrate utilization rate [g/g/h][Sa], [Sb] – substrate concentration at the beginning and end of
linear substrate utilization, respectively [g/L]ta, tb – time of culture at the beginning and end of linear
substrate utilization, respectively [h]Xavg - average of biomass concentration at ta and tb
3. Results
3.1. Substrate utilization pattern
In oleaginous yeasts such as Y. lipolytica, a low availability ofnitrogen in the cultivation medium activates lipid accumulationand/or citric acid secretion [32,33], while more nitrogen promotescells division rapidly generating biomass [34,35]. In this study weaimed to investigate how two readily available substrates, namelyglycerol and glucose, are utilized at different carbon to nitrogenratios (C/N). Therefore, we performed bioreactor batch cultures of awild-type Y. lipolytica A101 strain at two different C/N ratios (20and 40) in a minimal YNB medium with a mixture of glucose andglycerol. In both experiments, nitrogen availability had no effect on
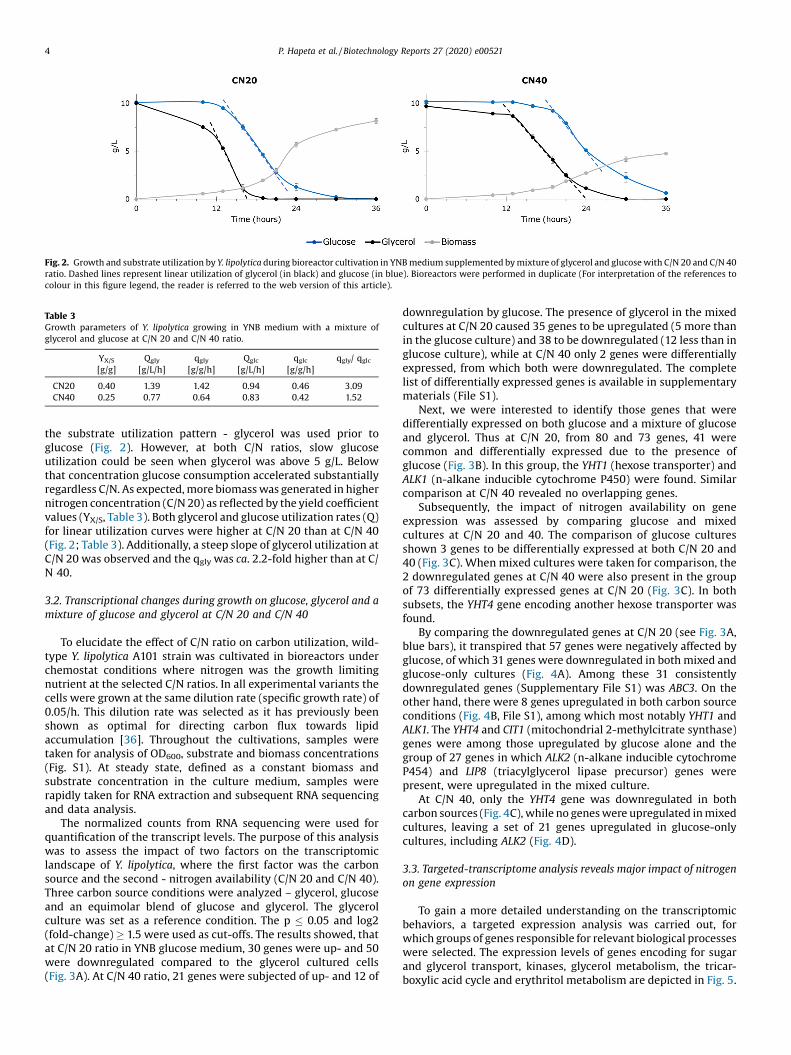
Fig. 2. Growth and substrate utilization by Y. lipolytica during bioreactor cultivation in YNB medium supplemented by mixture of glycerol and glucose with C/N 20 and C/N 40ratio. Dashed lines represent linear utilization of glycerol (in black) and glucose (in blue). Bioreactors were performed in duplicate (For interpretation of the references tocolour in this figure legend, the reader is referred to the web version of this article).
Table 3Growth parameters of Y. lipolytica growing in YNB medium with a mixture ofglycerol and glucose at C/N 20 and C/N 40 ratio.
YX/S
[g/g]Qgly
[g/L/h]qgly
[g/g/h]Qglc
[g/L/h]qglc
[g/g/h]qgly/ qglc
CN20 0.40 1.39 1.42 0.94 0.46 3.09CN40 0.25 0.77 0.64 0.83 0.42 1.52
4 P. Hapeta et al. / Biotechnology Reports 27 (2020) e00521
the substrate utilization pattern - glycerol was used prior toglucose (Fig. 2). However, at both C/N ratios, slow glucoseutilization could be seen when glycerol was above 5 g/L. Belowthat concentration glucose consumption accelerated substantiallyregardless C/N. As expected, more biomass was generated in highernitrogen concentration (C/N 20) as reflected by the yield coefficientvalues (YX/S, Table 3). Both glycerol and glucose utilization rates (Q)for linear utilization curves were higher at C/N 20 than at C/N 40(Fig. 2; Table 3). Additionally, a steep slope of glycerol utilization atC/N 20 was observed and the qgly was ca. 2.2-fold higher than at C/N 40.
3.2. Transcriptional changes during growth on glucose, glycerol and amixture of glucose and glycerol at C/N 20 and C/N 40
To elucidate the effect of C/N ratio on carbon utilization, wild-type Y. lipolytica A101 strain was cultivated in bioreactors underchemostat conditions where nitrogen was the growth limitingnutrient at the selected C/N ratios. In all experimental variants thecells were grown at the same dilution rate (specific growth rate) of0.05/h. This dilution rate was selected as it has previously beenshown as optimal for directing carbon flux towards lipidaccumulation [36]. Throughout the cultivations, samples weretaken for analysis of OD600, substrate and biomass concentrations(Fig. S1). At steady state, defined as a constant biomass andsubstrate concentration in the culture medium, samples wererapidly taken for RNA extraction and subsequent RNA sequencingand data analysis.
The normalized counts from RNA sequencing were used forquantification of the transcript levels. The purpose of this analysiswas to assess the impact of two factors on the transcriptomiclandscape of Y. lipolytica, where the first factor was the carbonsource and the second - nitrogen availability (C/N 20 and C/N 40).Three carbon source conditions were analyzed – glycerol, glucoseand an equimolar blend of glucose and glycerol. The glycerolculture was set as a reference condition. The p � 0.05 and log2(fold-change) � 1.5 were used as cut-offs. The results showed, thatat C/N 20 ratio in YNB glucose medium, 30 genes were up- and 50were downregulated compared to the glycerol cultured cells(Fig. 3A). At C/N 40 ratio, 21 genes were subjected of up- and 12 of
downregulation by glucose. The presence of glycerol in the mixedcultures at C/N 20 caused 35 genes to be upregulated (5 more thanin the glucose culture) and 38 to be downregulated (12 less than inglucose culture), while at C/N 40 only 2 genes were differentiallyexpressed, from which both were downregulated. The completelist of differentially expressed genes is available in supplementarymaterials (File S1).
Next, we were interested to identify those genes that weredifferentially expressed on both glucose and a mixture of glucoseand glycerol. Thus at C/N 20, from 80 and 73 genes, 41 werecommon and differentially expressed due to the presence ofglucose (Fig. 3B). In this group, the YHT1 (hexose transporter) andALK1 (n-alkane inducible cytochrome P450) were found. Similarcomparison at C/N 40 revealed no overlapping genes.
Subsequently, the impact of nitrogen availability on geneexpression was assessed by comparing glucose and mixedcultures at C/N 20 and 40. The comparison of glucose culturesshown 3 genes to be differentially expressed at both C/N 20 and40 (Fig. 3C). When mixed cultures were taken for comparison, the2 downregulated genes at C/N 40 were also present in the groupof 73 differentially expressed genes at C/N 20 (Fig. 3C). In bothsubsets, the YHT4 gene encoding another hexose transporter wasfound.
By comparing the downregulated genes at C/N 20 (see Fig. 3A,blue bars), it transpired that 57 genes were negatively affected byglucose, of which 31 genes were downregulated in both mixed andglucose-only cultures (Fig. 4A). Among these 31 consistentlydownregulated genes (Supplementary File S1) was ABC3. On theother hand, there were 8 genes upregulated in both carbon sourceconditions (Fig. 4B, File S1), among which most notably YHT1 andALK1. The YHT4 and CIT1 (mitochondrial 2-methylcitrate synthase)genes were among those upregulated by glucose alone and thegroup of 27 genes in which ALK2 (n-alkane inducible cytochromeP454) and LIP8 (triacylglycerol lipase precursor) genes werepresent, were upregulated in the mixed culture.
At C/N 40, only the YHT4 gene was downregulated in bothcarbon sources (Fig. 4C), while no genes were upregulated in mixedcultures, leaving a set of 21 genes upregulated in glucose-onlycultures, including ALK2 (Fig. 4D).
3.3. Targeted-transcriptome analysis reveals major impact of nitrogenon gene expression
To gain a more detailed understanding on the transcriptomicbehaviors, a targeted expression analysis was carried out, forwhich groups of genes responsible for relevant biological processeswere selected. The expression levels of genes encoding for sugarand glycerol transport, kinases, glycerol metabolism, the tricar-boxylic acid cycle and erythritol metabolism are depicted in Fig. 5.

Fig. 3. Up- and downregulated genes, and number of overlapping genes in the experimental conditions. The complete list of differentially expressed genes is available in FileS1 (Supplementary Materials).
P. Hapeta et al. / Biotechnology Reports 27 (2020) e00521 5
A first step in the metabolism of glucose and glycerol is theirinternalization through the plasma membrane. The most highlyexpressed known hexose transporters in all conditions were YHT1and YHT4. Five other genes from the sugar porter family, namelyYALI0B21230g, YALI0F6776g, YALI0F18084g and YALI0F23903gshowed similar expression pattern to YHT1 and YHT4, however,the expression levels were much lower than for YHT1 (Fig. 5A).Regarding glycerol transport, the Y. lipolytica FPS1 (YALI0F00462g)aquaglyceroporin homologue showed almost constant, highexpression levels across all conditions but with an increasedexpression on glycerol at C/N 40.
The consequence of glycerol and glucose uptake into the cellis their phosphorylation by relevant kinases, that allows theirincorporation into the central carbon metabolism. The mainglycerol phosphorylating protein in Y. lipolytica is aYALI0F00484g encoding glycerol kinase Gut1 which expressionwas higher at C/N 40 and the highest in cells cultivated onglycerol (Fig. 5B). The GUT1 gene is an element of the glycerol-3-phosphate pathway, which consist of two other genes, GUT2 andGPD1. Both of the later genes showed rather similar expressionprofiles. It has been proposed that Y. lipolytica has a secondaryglycerol dissimilation pathway [23,37]. According to the currentstate of knowledge, this still dubious DHA pathway could bepotentially encoded by 10 genes of which two (DAK2, GCY15)showed higher expression than the others in the present study(Fig. 5B).
In Y. lipolytica glucose is phosphorylated by either glucokinaseGlk1 or a hexokinase Hxk1. While expression levels of GLK1remained relatively constant across all conditions, the HXK1 geneexhibited drastically increased expression at C/N 40 compared to atC/N 20, appearing as the strongest signal of all analyzed genes inthis work (Fig. 5C). Additionally, the YALI0D16357g gene encoding
phosphofructokinase showed a more moderately increasedexpression at C/N 40 with the highest expression in the presenceof glucose. These changes could support a higher flux in glycolysiswhen nitrogen is less abundant. We were also interested toinvestigate the expression levels of Y. lipolytica SNF1 and MIG1homologues, which in S. cerevisiae form the core of the SNF1/MIG1pathway: components of the glucose repression mechanisms. Theexpression of SNF1 was not dependent on the carbon source,however slightly higher expression was observed when cells weregrown in lower nitrogen concentration (Fig. 5D).
Particularly increased expression was observed forYALI0C24101g gene encoding pyruvate carboxylase PYC1 at C/N40 (Fig. 5E). Notably, expression of ACO1, encoding aconitase, wasthe highest at C/N 40 with a particularly strong signal on glucose,while CIT2 (citrate synthase) showed over 3-fold lower expressionon glycerol than on glucose at C/N 40. The genes encoding enzymesfurther in the TCA cycle, such as those responsible for succinate tofumarate conversion (succinate dehydrogenase complex, SDH)showed in general low expression compared to the other TCAgenes, however, increased expression was observed duringcultivation on glucose at C/N 40 (Fig. 5E).
Y. lipolytica is also well known for its overproduction oferythritol, therefore, we checked expression level of genesencoding erythritol biosynthesis pathway (Fig. 5F). Four genesfrom this pathway revealed significant differences in expression onglucose at C/N 20 and C/N 40. These genes, namely TAL1, GCY15,ARA12 and GRE3 (also annotated to the DHA pathway), encodingtransaldolase and three erythrose reductases, respectively, showedlower expression when less nitrogen was available. A similarpattern was observed for genes from two other pathways – DAK2associated with glycerol metabolism, as well as IDH1, IDH2 and ICL1involved in the tricarboxylic acid cycle (TCA).
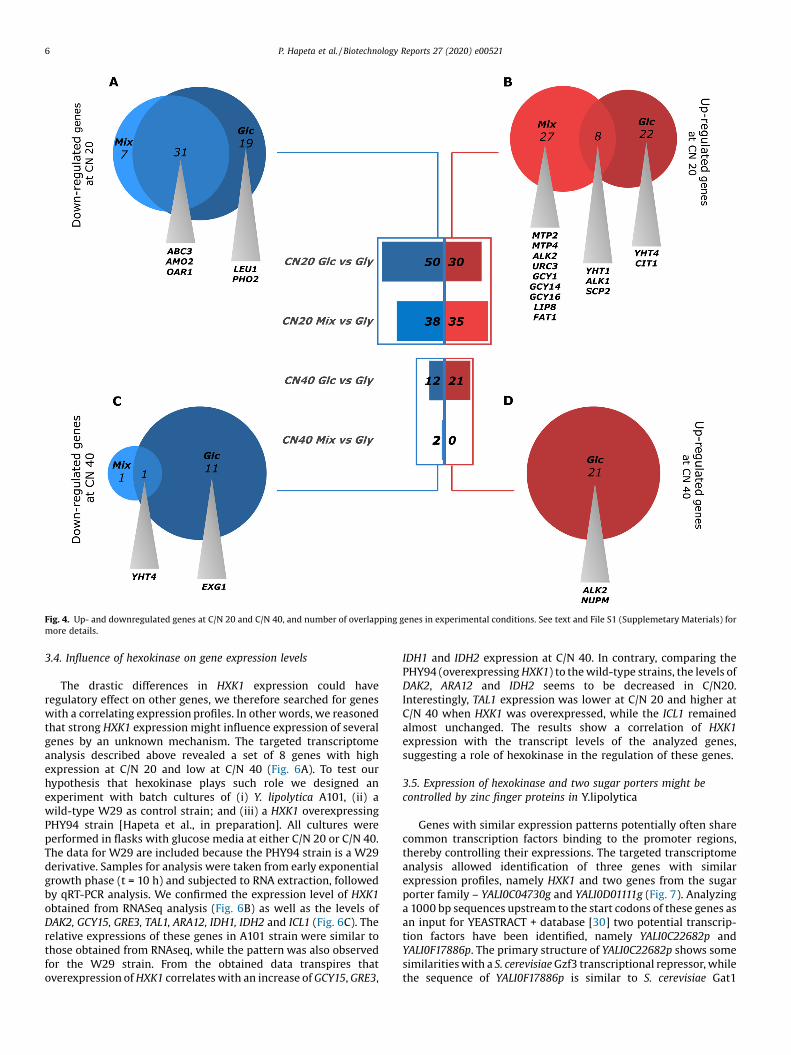
Fig. 4. Up- and downregulated genes at C/N 20 and C/N 40, and number of overlapping genes in experimental conditions. See text and File S1 (Supplemetary Materials) formore details.
6 P. Hapeta et al. / Biotechnology Reports 27 (2020) e00521
3.4. Influence of hexokinase on gene expression levels
The drastic differences in HXK1 expression could haveregulatory effect on other genes, we therefore searched for geneswith a correlating expression profiles. In other words, we reasonedthat strong HXK1 expression might influence expression of severalgenes by an unknown mechanism. The targeted transcriptomeanalysis described above revealed a set of 8 genes with highexpression at C/N 20 and low at C/N 40 (Fig. 6A). To test ourhypothesis that hexokinase plays such role we designed anexperiment with batch cultures of (i) Y. lipolytica A101, (ii) awild-type W29 as control strain; and (iii) a HXK1 overexpressingPHY94 strain [Hapeta et al., in preparation]. All cultures wereperformed in flasks with glucose media at either C/N 20 or C/N 40.The data for W29 are included because the PHY94 strain is a W29derivative. Samples for analysis were taken from early exponentialgrowth phase (t = 10 h) and subjected to RNA extraction, followedby qRT-PCR analysis. We confirmed the expression level of HXK1obtained from RNASeq analysis (Fig. 6B) as well as the levels ofDAK2, GCY15, GRE3, TAL1, ARA12, IDH1, IDH2 and ICL1 (Fig. 6C). Therelative expressions of these genes in A101 strain were similar tothose obtained from RNAseq, while the pattern was also observedfor the W29 strain. From the obtained data transpires thatoverexpression of HXK1 correlates with an increase of GCY15, GRE3,
IDH1 and IDH2 expression at C/N 40. In contrary, comparing thePHY94 (overexpressing HXK1) to the wild-type strains, the levels ofDAK2, ARA12 and IDH2 seems to be decreased in C/N20.Interestingly, TAL1 expression was lower at C/N 20 and higher atC/N 40 when HXK1 was overexpressed, while the ICL1 remainedalmost unchanged. The results show a correlation of HXK1expression with the transcript levels of the analyzed genes,suggesting a role of hexokinase in the regulation of these genes.
3.5. Expression of hexokinase and two sugar porters might becontrolled by zinc finger proteins in Y.lipolytica
Genes with similar expression patterns potentially often sharecommon transcription factors binding to the promoter regions,thereby controlling their expressions. The targeted transcriptomeanalysis allowed identification of three genes with similarexpression profiles, namely HXK1 and two genes from the sugarporter family – YALI0C04730g and YALI0D01111g (Fig. 7). Analyzinga 1000 bp sequences upstream to the start codons of these genes asan input for YEASTRACT + database [30] two potential transcrip-tion factors have been identified, namely YALI0C22682p andYALI0F17886p. The primary structure of YALI0C22682p shows somesimilarities with a S. cerevisiae Gzf3 transcriptional repressor, whilethe sequence of YALI0F17886p is similar to S. cerevisiae Gat1

Fig. 5. Targeted transcriptome analysis. A – transporter genes; B – glycerolmetabolism genes; C- kinases; D – SNF1 and MIG1; E – tricarboxylic acid cycle genes;F – erythritol biosynthesis genes.
P. Hapeta et al. / Biotechnology Reports 27 (2020) e00521 7
transcription factor for nitrogen regulation. In fact both Gzf3 andGat1 are GATA zinc finger proteins acting as transcription factorsfor the nitrogen catabolite repression genes. These two transcrip-tion factors in S. cerevisiae are the elements of the GATA generegulatory network and recognize the same core motif in thepromoter regions of their gene targets. All three promotersequences analyzed here contain such motifs (Fig. S2), whatindicates that expression of HXK1, YALI0C04730 g and YALI0D01111ggenes could be controlled by Gzf3 and/or Gat1 as indicated byYEASTRACT + database search.
4. Discussion
The present study focused on elucidating the molecularbackground of glucose and glycerol utilization patterns in theimportant industrial yeast Y. lipolytica and the impact of carbon tonitrogen ratio on its gene expression. One of the unique propertiesof this yeast is the preferential use of glycerol over glucose [22], aphenomenon described only for one other organism, the hal-oarchaeon Haloferax volcanii [38]. As in this latter microorganism aglycerol catabolite repression has been described, we hypothesizedthat a similar mechanism exists in Y. lipolytica as it has beenreported that glycerol represses n-alkane utilization [39]. Whilesome wild-type Y. lipolytica strains, show a co-utilization ofglycerol and glucose, including the W29 and H222 strains and theA101 strain presented here, other wild-type strains use glucoseonly when glycerol is completely depleted [23]. In our study asequential utilization of these two carbon sources was observed,however, glucose uptake began when glycerol concentrationdropped below 5 g/L. This suggests a mechanism which sensesglycerol (or carbon source in general) in the environment andallows for an efficient cell reprograming for the metabolism ofother, less preferable carbon sources such as glucose. The analyzedC/N ratios did not influence the substrate utilization pattern butvarying uptake rates of both substrates at tested C/N ratios wereobserved. Moreover, at C/N 20 a sequential utilization of substratesoccurred while at C/N 40 the substrates were co-utilized. This is inconcert with other studies at different culture modes, in whichglycerol was also used prior to glucose [22,23]. It seems, thatnitrogen availability does not influence the unique pattern ofsubstrate utilization in Y. lipolytica, however, there are somevariations in a mode of its utilization (co-utilization or sequential).We hypothesize, that this phenomenon might be connected to thefact, that in higher nitrogen concentrations (C/N 20) the cellularmachinery of Y. lipolytica is set for biomass production, while whennitrogen becomes scarce (C/N 40) the cells begin to store availablecarbon in storage molecules such as triacylglycerols (TAG) andglycogen. This could also explain slightly higher specific glucoseutilization rate at C/N 40, because expression levels of genesinvolved in TAG and glycogen biosynthesis are higher at C/N 40than at C/N 20 (Fig. S3). Interestingly, this expression pattern wasalso observed for genes responsible for lipid mobilization anddegradation (Fig. S3). Additionally, it has been previously reportedthat deletion of the glycogen synthase, a key enzyme in glycogenbiosynthesis pathway, increases TAG formation in Y. lipolytica [40].
The RNAseq analysis allowed for quantification and identifica-tion of differentially expressed genes during growth on glycerol,glucose and a mixture of both substrates at two C/N ratios. Thenumber of differentially expressed genes at C/N 20 was higher thanat C/N 40, indicating that nitrogen availability has a major impacton gene expression in the chemostat cultures, regardless carbonsource. However, a certain glycerol regulatory effect was observed,as its presence in the medium with glucose caused reduction in thenumber of downregulated genes at both C/N ratios (Fig. 3). In fact,the ALK1 gene implicated in n-alkane utilization was identified asdifferentially expressed on all carbon sources at C/N 20. Moreover,this gene was upregulated/derepressed by glucose and at the sametime downregulated by glycerol (Fig. 4), what confirms previousfindings [39]. In almost all tested conditions, the hexose trans-porters YHT1 or YHT4 were differentially expressed what suggeststhat glucose transport is particularly susceptible to changes incarbon source quality and nitrogen availability. Further, the YHT4was upregulated on glucose at C/N 20 as could be expected byexamining the function of its product – a high affinity glucosetransport [41]. It is puzzling however, that the same gene wasdownregulated on glucose at C/N 40 (Fig. 4).

Fig. 6. A. Expression levels in chemostat conditions in A101 strain; B. Expression of hexokinase under chemostat conditions and during shake-flask cultures in A101, W29 andPHY94; C. Expression levels during shake-flask cultivations. For clarity only transcript levels during glucose cultures are shown.
Fig. 7. A. Expression levels of HXK1 and two sugar porter family genes in presence of various carbon sources and C/N ratios; B. Consensus motifs recognized by Gzf3 and Gat1transcription factors.
8 P. Hapeta et al. / Biotechnology Reports 27 (2020) e00521
Recently, a transcriptomic analysis of two Y. lipolytica strainsgrowing in glucose, glycerol and a mixture of both substrates incarbon limiting conditions has been revealed [23]. In theirexperimental setup, the W29 strain showed 94 differentiallyexpressed genes when cultures on glycerol and glucose werecompared, while in the IBT strain 61 genes were identified asdifferentially expressed. The same comparison in our studyshowed 80 and 33 genes at C/N 20 and C/N 40, respectively. Thisindicates that the transcriptomic landscape of Y. lipolytica is strain-dependent and varies widely in different cultivation conditions.Our results show that less changes occur when less nitrogen isavailable and that its availability has higher impact on geneexpression than different carbon sources and further advanced our
understanding on the transcriptional changes in various cultiva-tion conditions.
The sugar uptake is not completely resolved in Y. lipolytica, asproven by the number of publications on that subject. The mostextensive study yet resulted in the identification of 24 proteinsbelonging to a sugar porter (SP) superfamily, from which 6 (Yht1-Yht6) were identified as hexose transporters. Among these, Yht1and Yht4 are the most important for glucose uptake [41]. Theexpression levels presented here confirm that YHT1 and YHT4 playa major role in glucose transport, however, their expression wasalso detected in glycerol cultures, what might indicate that sugartransporters in Y. lipolytica are not as strictly controlled as in S.cerevisiae [42]. The strongest signal from YHT1 at C/N 20 was

P. Hapeta et al. / Biotechnology Reports 27 (2020) e00521 9
detected when Y. lipolytica was grown in the presence of glucose. Adifferent situation occurred at C/N 40, where the highestexpression level was achieved in a mixed cultivation. This contrastswith the previous study, in which YHT1 was not much affected bythe carbon source, however, the cultivations were carried out incarbon-limiting conditions [23]. On the other hand, the upregu-lation of YHT4 on glycerol at C/N 40 was observed, a result similarto the IBT strain [23]. Notably, expression of 10 other genesencoding proteins belonging to SP family was detected (Fig. 5A). Inthis group, two, namely YALI0C04730g and YALI0D01111g showedan interesting expression pattern – they are expressed almostexclusively at low nitrogen concentration (C/N 40). TheYALI0C04730g seems to be also upregulated/derepressed byglucose. During identification and characterization of hexosetransporters in Y. lipolytica there were some evidences of this geneto be fructose transporter, however, the obtained results wereinconclusive [41 and Lazar personal communication]. The resultspresented here show that regulation of substrate uptake dependsnot only on the presence of carbon source but also on the nitrogenavailability and that additional sugar transporters might befunctional in Y. lipolytica at higher C/N ratio.
In Y. lipolytica the glycerol transport into the cell likely occursvia aquaglyceroporin which is an ortholog of S. cerevisiae Fps1 or aglycerol/H+-symporter encoded by a gene orthologous to STL1. Weobserved a very weak expression of STL1, but the expression levelsof gene encoding Fps1 (YlFPS1, YALI0F00462g) was the highest onglycerol (at C/N 40) confirming importance of this transporter forglycerol uptake. This result correlates with the recent study [23],where expression of YlFPS1 was strongly induced by glycerol butalso present, when the yeast grew on glucose and a blend ofglucose and glycerol. Until now, no in-depth study on the YlFps1has been conducted, but evidence for its glycerol transportingactivity was assessed in an experiment to improve glycerolconsumption in S. cerevisiae [43]. Altogether, the expression datasuggests that YlFps1 could be a major glycerol facilitator in Y.lipolytica.
Upon the uptake, glucose and glycerol are subsequentlyphosphorylated by kinases, what allows for their incorporationinto the central carbon metabolism. Glycerol in Y. lipolytica isassimilated via the glycerol-3-phosphate (G3P) pathway, of whichYlGut1 is a glycerol kinase [37,43]. The expression of GUT1 washigher in presence of glycerol at C/N 40 but remained constant at C/N 20 regardless of the carbon source used and its expression wasthe highest compared to the other components of the G3Ppathway, namely GUT2 and GPD1. This observation correlates withprevious reports [23,44]. Alongside the G3P pathway, a presence ofa putative catabolic DHA pathway for glycerol uptake in Y. lipolyticais still under consideration. This two-step pathway consists of anunidentified glycerol dehydrogenase and a dihydroxyacetonekinase [37,43]. Expression of genes putatively related to thispathway was detected, where the DAK2, a dihydroxyacetone kinaseortholog, expression was the strongest. This contrasts with anothertranscriptomic study conducted in carbon-limiting conditions[23], where two DAK genes showed similar expression, while onewas significantly lower expressed compared to the others.
Glucose in Y. lipolytica is phosphorylated by a glucokinase(YlGlk1) and a hexokinase (YlHxk1), which phosphorylates alsofructose [45,46]. The GLK1 gene, encoding glucokinase, wasexpressed in a constant manner across all tested conditions, whilesurprisingly, HXK1 gene encoding hexokinase, showed very strongexpression at C/N 40 (Fig. 5C). This could explain a higher specificglucose utilization rate (Table 3), suggesting higher flux of carbonthrough glycolysis. That could also be seen at the expression levelsof PFK1 at C/N 40. However, such drastic differences in HXK1expression and similar transcript levels in various carbon sourceconditions suggest that hexokinase in Y. lipolytica may contribute
to other cellular processes. Alongside its catalytic functions, it iswell known that in S. cerevisiae hexokinase 2 (Hxk2) plays a pivotalrole in the carbon catabolite repression phenomenon [47], being acomponent of a Snf1/Mig1 pathway [48]. The unusual behaviour ofYlHxk1 may stem from its peculiar structure, as 40 amino acid loopof unidentified function is present in its sequence [46]. This couldindicate an as yet to be elucidated regulatory mechanism in whichthe YlHxk1 protein is an important component.
As Y. lipolytica is well suited for overproduction of Krebs cycleintermediates such as citric acid [4] we were interested to seedifferences in expression of genes encoding this pathway. As itturned out some of the genes have been upregulated at C/N 40,with the PYC1 being the most significant example, alongside CIT2,ACO1 and FUM1 (Fig. 5E). It is generally known, that when Y.lipolytica is cultivated at low nitrogen concentration a higher fluxthrough TCA occurs leading to overproduction of some of TCAintermediates such as citric acid [3,4] what could explain theseresults. The expression levels of CIT2 and FUM1 were the highest inpresence of glycerol regardless of C/N, confirming that glycerol is agood substrate to use for overproduction of various TCA acids.Moreover, we observed that during cultivation on glucose ACO1was more strongly expressed than CIT2 while the oppositesituation took place on glycerol (Fig. 5E). From these findingswe hypothesize that when using glucose as sole carbon source Y.lipolytica is rather set for growth, while glycerol utilization causesoverproduction of citric acid. This could also explain high citric toisocitric ratios (high purity of citric acid) in the A101 strain and itsderivatives [6,49,50]. A relatively lower flux through the pentosephosphate pathway upon growth on glycerol in contrast to glucosecould also contribute to the overproduction of citric acid, as it isfeasible that insufficient NADPH precludes the formation of storagelipids.
Apart from citric acid, Y. lipolytica has been developed as apromising host for erythritol biosynthesis, especially from glycerol[6,51], therefore, we were interested to check the expression levelsof the erythritol biosynthesis pathway encoding genes. The genesinvolved in erythritol biosynthesis were generally similarlyexpressed, however, four genes, namely TAL1,GCY15, ARA12 andGRE3 exhibited interesting expression patterns at C/N 40. TAL1(YALI0F15587g) encodes a transaldolase while GCY15(YALI0F18590g), ARA12 (YALI0C13508g) and GRE3 (YALI0D07634g)encode erythrose reductases [52,53]. Their transcript levels werealmost the same when cultured on glycerol and a blend of glyceroland glucose but approximately two-fold lower when cultured onglucose alone, proving that glycerol is a well suited carbon sourcefor production of erythritol. Additionally, the expression data forerythritol biosynthesis pathway suggests that production of thispolyol in Y. lipolytica might be improved by cultivation in highernitrogen concentrations, however, this does not correlate withcurrent methods in which high C/N ratios (typically C/N 70) areused [51,54,55].
The same expression pattern as for TAL1, GCY15, ARA1 and, GRE3was observed for other genes not directly related to erythritolbiosynthesis, namely DAK2,IDH1, IDH2 and ICL1. Additionally, onglucose at C/N 20 their expression was noticeably higher than at C/N 40. We were interested to elucidate this pattern with very highexpression of hexokinase at C/N 40, so we used a hexokinaseoverexpressing strain to check for transcript levels of the abovegenes. Indeed, a clear impact of more highly expressed hexokinasecould be observed for GCY15, IDH1 and IDH2, as their expressionlevels at C/N 40 matched that of a wild-type at C/N 20. There is anevidence of HXK1 involvement in glucose catabolite repression ofthe LIP2 gene encoding extracellular lipase in Y. lipolytica [56].Taken together, it is feasible that HXK1 is an element of a generegulatory network, or acts in concert with other parts in atranscription controlling machinery, in which expression of genes
10 P. Hapeta et al. / Biotechnology Reports 27 (2020) e00521
depends on the hexokinase abundance. However, this hypothesisshould be tested in more detail.
As HXK1 was strongly upregulated at C/N 40 we were curious ifany of the analyzed genes showed similarity to the HXK1 expressionpattern, as often genes with similar expression profiles sharecommon transcription factors. Two genes encoding proteinsbelonging to the SP family, namely YALI0C04730 g and YALI0D01111g,were chosen due to strong expression at C/N 40 (Fig. 7). The analysisof promoter sequences revealed that motifs recognized by Gat1 andGzf3 zinc-finger protein homologues are present. Both of theproteins are GATA-type transcription factors in S. cerevisiae, andwhile Gat1 acts as an activator for nitrogen utilization genes in poornitrogen conditions [57], Gzf3 act as a repressor competing forbinding sites with Gat1 [58,59]. This is puzzling since HXK1,YALI0C04730 g and YALI0D01111 g are not directly implicated innitrogen metabolism but in the metabolism of carbon sources.However, with the data presented here one could assume, that thesegenes are upregulated by Gat1-like transcription factor in poornitrogen conditions (e.g. C/N 40) and downregulated by Gzf3, whenmore nitrogen is available (e.g. C/N 20). It will be of great importancefor the development of Y. lipolytica as even more robust cell factoryto analyze these interactions closer.
5. Conclusions
The present study focused on elucidating the molecularbackground of the unique glucose and glycerol utilization patternin the yeast Y. lipolytica and an influence of the interplay betweencarbon sources and carbon to nitrogen ratios on the global geneexpression using RNAseq based transcriptomics. The results showthat glycerol is used prior to glucose regardless nitrogenavailability and that C/N ratio is a stronger factor influencing geneexpression than carbon source. The major finding of this work isthat hexokinase (HXK1) expression is highly dependent onnitrogen concentration as at high C/N its expression levels weredrastically elevated compared to low C/N ratio. Furthermore, weshow that HXK1 expression in Y. lipolytica could be controlled viaGATA zinc-finger transcription factors and that hexokinase itselfcould influence expression of certain genes through an as yet to bediscovered mechanism.
Auhtor statement
PH designed the experiment, performed the experiments,wrote the manuscript, EJK designed the experiments, supervisedtranscriptome analysis, revised the manuscript, ZL designed theexperiments, revised the manuscript.
Funding
PH acknowledges funding from EMBO (Short-term Fellowshipno. 7499) and Wroclaw University of Environmental and LifeSciences (“Innowacyjny Doktorat”, grant no. D220/0006/17). EJKacknowledges funding from FORMAS (2018-00597). ZL acknowl-edges funding from National Science Center (“Miniatura 200, grantno. 2018/02/X/NZ9/00591).
Declaration of Competing Interest
None.
Acknowledgements
The authors would like to thank Dr. Magdalena Rakicka-Pustułka and Dr. Heber Gamboa-Melendez for critical commentson the final version of the manuscript.
Appendix A. Supplementary data
Supplementary material related to this article can be found, inthe online version, at doi:https://doi.org/10.1016/j.btre.2020.e00521.
References
[1] M. Fayyad-Kazan, A. Feller, E. Bodo, M. Boeckstaens, A.M. Marini, E. Dubois, I.Georis, Yeast nitrogen catabolite repression is sustained by signals distinctfrom glutamine and glutamate reservoirs, Mol. Microbiol. 99 (2) (2016) 360–379.
[2] K. Simpson-Lavy, M. Kupiec, Carbon catabolite repression in yeast is notlimited to glucose, Sci. Rep. 9 (1) (2019) 1–10.
[3] S. Papanikolaou, G. Aggelis, Biotechnological valorization of biodiesel derivedglycerol waste through production of single cell oil and citric acid by Yarrowialipolytica, Lipid Technol. 21 (4) (2009) 83–87.
[4] W. Rymowicz, A.R. Fatykhova, S.V. Kamzolova, A. Rywi�nska, I.G. Morgunov,Citric acid production from glycerol-containing waste of biodiesel industry byYarrowia lipolytica in batch, repeated batch, and cell recycle regimes, Appl.Microbiol. Biotechnol. 87 (3) (2010) 971–979.
[5] J. Zhou, X. Yin, C. Madzak, G. Du, J. Chen, Enhanced α-ketoglutarate productionin Yarrowia lipolytica WSH-Z06 by alteration of the acetyl-CoA metabolism, J.Biotechnol. 161 (3) (2012) 257–264.
[6] M. Rakicka, B. Rukowicz, A. Rywi�nska, Z. Lazar, W. Rymowicz, Technology ofefficient continuous erythritol production from glycerol, J. Clean. Prod. 139(2016) 905–913.
[7] L. Tomaszewska, A. Rywi�nska, W. Gładkowski, Production of erythritol andmannitol by Yarrowia lipolytica yeast in media containing glycerol, J. Ind.Microbiol. Biotechnol. 39 (9) (2012) 1333–1343.
[8] Y. Waché, M. Aguedo, A. Choquet, I.L. Gatfield, J.M. Nicaud, J.M. Belin, Role of β-oxidation enzymes in g-decalactone production by the yeast Yarrowialipolytica, Appl. Environ. Microbiol. 67 (12) (2001) 5700–5704.
[9] C. Madzak, Yarrowia lipolytica: recent achievements in heterologous proteinexpression and pathway engineering, Appl. Microbiol. Biotechnol. 99 (11)(2015) 4559–4577.
[10] G. Barth, C. Gaillardin, Yarrowia lipolytica, Nonconventional Yeasts inBiotechnology, Springer, Berlin, Heidelberg, 1996, pp. 313–388.
[11] K. De Pourcq, W. Vervecken, I. Dewerte, A. Valevska, A. Van Hecke, N.Callewaert, Engineering the yeast Yarrowia lipolytica for the production oftherapeutic proteins homogeneously glycosylated with Man 8 GlcNAc 2 andMan 5 GlcNAc 2, Microb. Cell Fact. 11 (1) (2012) 53.
[12] J.M. Nicaud, Yarrowia lipolytica, Yeast 29 (10) (2012) 409–418.[13] A. André, A. Chatzifragkou, P. Diamantopoulou, D. Sarris, A. Philippoussis, M.
Galiotou-Panayotou, S. Papanikolaou, Biotechnological conversions of bio-diesel-derived crude glycerol by Yarrowia lipolytica strains, Eng. Life Sci. 9 (6)(2009) 468–478.
[14] C. Holkenbrink, M.I. Dam, K.R. Kildegaard, J. Beder, J. Dahlin, D. DoménechBelda, I. Borodina, EasyCloneYALI: CRISPR/Cas9-based synthetic toolbox forengineering of the yeast Yarrowia lipolytica, Biotechnol. J. 13 (9) (2018)1700543.
[15] M. Larroude, Y.K. Park, P. Soudier, M. Kubiak, J.M. Nicaud, T. Rossignol, Amodular Golden Gate toolkit for Yarrowia lipolytica synthetic biology, Microb.Biotechnol. 12 (6) (2019) 1249–1259.
[16] C.M. Schwartz, M.S. Hussain, M. Blenner, I. Wheeldon, Synthetic RNApolymerase III promoters facilitate high-efficiency CRISPR-Cas9-mediatedgenome editing in Yarrowia lipolytica, ACS Synth. Biol. 5 (4) (2016) 356–359.
[17] P. Fickers, P.H. Benetti, Y. Waché, A. Marty, S. Mauersberger, M.S. Smit, J.M.Nicaud, Hydrophobic substrate utilisation by the yeast Yarrowia lipolytica, andits potential applications, FEMS Yeast Res. 5 (6–7) (2005) 527–543.
[18] S. Papanikolaou, A. Chatzifragkou, S. Fakas, M. Galiotou-Panayotou, M.Komaitis, J.M. Nicaud, G. Aggelis, Biosynthesis of lipids and organic acids byYarrowia lipolytica strains cultivated on glucose, Eur. J. Lipid Sci. Technol. 111(12) (2009) 1221–1232.
[19] J.R. Almeida, L.C. Fávaro, B.F. Quirino, Biodiesel biorefinery: opportunities andchallenges for microbial production of fuels and chemicals from glycerolwaste, Biotechnol. Biofuels 5 (1) (2012) 48.
[20] A. Chatzifragkou, S. Papanikolaou, Effect of impurities in biodiesel-derivedwaste glycerol on the performance and feasibility of biotechnologicalprocesses, Appl. Microbiol. Biotechnol. 95 (1) (2012) 13–27.
[21] M. Workman, P. Holt, J. Thykaer, Comparing cellular performance of Yarrowialipolytica during growth on glucose and glycerol in submerged cultivations,AMB Express 3 (1) (2013) 58.
[22] A. Rywi�nska, W. Rymowicz, B. _Zarowska, A. Skrzypi�nski, Comparison of citricacid production from glycerol and glucose by different strains of Yarrowialipolytica, World J. Microbiol. Biotechnol. 26 (7) (2010) 1217–1224.
[23] P. Lubuta, M. Workman, E.J. Kerkhoven, C.T. Workman, Investigating theinfluence of glycerol on the utilization of glucose in Yarrowia lipolytica usingRNA-Seq-Based transcriptomics, G3 Genes| Genomes| Genet. 9 (12) (2019)4059–4071.
[24] M. Wojtatowicz, W. Rymowicz, Effect of Inoculum on Kinetics and Yield ofCitric Acid Production on Glucose Media by Yarrowia Lipolytica A-101 ActaAlimentaria Polonica (Poland), (1991) .

P. Hapeta et al. / Biotechnology Reports 27 (2020) e00521 11
[25] S. Andrews, Babraham bioinformatics-FastQC a Quality Control Tool for HighThroughput Sequence Data (accessed 04.11.2019)URL:, (2010) . https://www.bioinformatics.babraham.ac.uk/projects/fastqc/.
[26] A.M. Bolger, M. Lohse, B. Usadel, Trimmomatic: a flexible trimmer for Illuminasequence data, Bioinformatics 30 (15) (2014) 2114–2120.
[27] A. Dobin, C.A. Davis, F. Schlesinger, J. Drenkow, C. Zaleski, S. Jha, T.R. Gingeras,STAR: ultrafast universal RNA-seq aligner, Bioinformatics 29 (1) (2013) 15–21.
[28] Y. Liao, G.K. Smyth, W. Shi, The Subread aligner: fast, accurate and scalable readmapping by seed-and-vote, Nucleic Acids Res. 41 (10) (2013) e108-e108.
[29] S. Anders, W. Huber, Differential expression analysis for sequence count data,Nat. Preced. (2010) 1-1.
[30] P.T. Monteiro, J. Oliveira, P. Pais, M. Antunes, M. Palma, M. Cavalheiro, M.N.Mota, YEASTRACT+: a portal for cross-species comparative genomics oftranscription regulation in yeasts, Nucleic Acids Res. 48 (D1) (2020) D642–D649.
[31] M. Kanehisa, S. Goto, KEGG: Kyoto Encyclopedia of Genes and Genomes,Nucleic Acids Res. 28 (2000) 27–30.
[32] A. Beopoulos, J. Cescut, R. Haddouche, J.L. Uribelarrea, C. Molina-Jouve, J.M.Nicaud, Yarrowia lipolytica as a model for bio-oil production, Prog. Lipid Res.48 (6) (2009) 375–387.
[33] I.G. Morgunov, S.V. Kamzolova, J.N. Lunina, The citric acid production from rawglycerol by Yarrowia lipolytica yeast and its regulation, Appl. Microbiol.Biotechnol. 97 (16) (2013) 7387–7397.
[34] P. Juszczyk, L. Tomaszewska, A. Kita, W. Rymowicz, Biomass production bynovel strains of Yarrowia lipolytica using raw glycerol, derived from biodieselproduction, Bioresour. Technol. 137 (2013) 124–131.
[35] N. Morin, J. Cescut, A. Beopoulos, G. Lelandais, V. Le Berre, J.L. Uribelarrea, J.M.Nicaud, Transcriptomic analyses during the transition from biomassproduction to lipid accumulation in the oleaginous yeast Yarrowia lipolytica,PLoS One 6 (11) (2011).
[36] S. Papanikolaou, G. Aggelis, Lipid production by Yarrowia lipolytica growing onindustrial glycerol in a single-stage continuous culture, Bioresour. Technol. 82(1) (2002) 43–49.
[37] T. Dulermo, J.M. Nicaud, Involvement of the G3P shuttle and β-oxidationpathway in the control of TAG synthesis and lipid accumulation in Yarrowialipolytica, Metab. Eng. 13 (5) (2011) 482–491.
[38] K.E. Sherwood, D.J. Cano, J.A. Maupin-Furlow, Glycerol-mediated repression ofglucose metabolism and glycerol kinase as the sole route of glycerolcatabolism in the haloarchaeon Haloferax volcanii, J. Bacteriol. 191 (13) (2009)4307–4315.
[39] K. Mori, R. Iwama, S. Kobayashi, H. Horiuchi, R. Fukuda, A. Ohta, Transcriptionalrepression by glycerol of genes involved in the assimilation of n-alkanes andfatty acids in yeast Yarrowia lipolytica, FEMS Yeast Res. 13 (2) (2013) 233–240.
[40] G. Bhutada, M. Kavš9cek, R. Ledesma-Amaro, S. Thomas, G.N. Rechberger, J.M.Nicaud, K. Natter, Sugar versus fat: elimination of glycogen storage improveslipid accumulation in Yarrowia lipolytica, FEMS Yeast Res. 17 (3) (2017).
[41] Z. Lazar, C. Neuvéglise, T. Rossignol, H. Devillers, N. Morin, M. Robak, A.M.Crutz-Le Coq, Characterization of hexose transporters in Yarrowia lipolyticareveals new groups of sugar porters involved in yeast growth, Fungal Genet.Biol. 100 (2017) 1–12.
[42] Ö. Kayikci, J. Nielsen, Glucose repression in Saccharomyces cerevisiae, FEMSYeast Res. 15 (6) (2015) fov068.
[43] M. Klein, Z.U. Islam, P.B. Knudsen, M. Carrillo, S. Swinnen, M. Workman, E.Nevoigt, The expression of glycerol facilitators from various yeast speciesimproves growth on glycerol of Saccharomyces cerevisiae, Metab. Eng.Commun. 3 (2016) 252–257.
[44] A. Makri, S. Fakas, G. Aggelis, Metabolic activities of biotechnological interestin Yarrowia lipolytica grown on glycerol in repeated batch cultures, Bioresour.Technol. 101 (7) (2010) 2351–2358.
[45] Z. Lazar, T. Dulermo, C. Neuvéglise, A.M. Crutz-Le Coq, J.M. Nicaud,Hexokinase—a limiting factor in lipid production from fructose in Yarrowialipolytica, Metab. Eng. 26 (2014) 89–99.
[46] T. Petit, C. Gancedo, Molecular cloning and characterization of the gene HXK1encoding the hexokinase from Yarrowia lipolytica, Yeast 15 (15) (1999) 1573–1584.
[47] J.M. Gancedo, Yeast carbon catabolite repression, Microbiol. Mol. Biol. Rev. 62(2) (1998) 334–361.
[48] M. Conrad, J. Schothorst, H.N. Kankipati, G. Van Zeebroeck, M. Rubio-Texeira, J.M. Thevelein, Nutrient sensing and signaling in the yeast Saccharomycescerevisiae, FEMS Microbiol. Rev. 38 (2) (2014) 254–299.
[49] W. Rymowicz, A. Rywi�nska, B. _Zarowska, P. Juszczyk, Citric acid productionfrom raw glycerol by acetate mutants of Yarrowia lipolytica, Chem. Pap. 60 (5)(2006) 391–394.
[50] D.A. Rzechonek, A. Dobrowolski, W. Rymowicz, A.M. Miro�nczuk, Asepticproduction of citric and isocitric acid from crude glycerol by geneticallymodified Yarrowia lipolytica, Bioresour. Technol. 271 (2019) 340–344.
[51] F. Carly, M. Vandermies, S. Telek, S. Steels, S. Thomas, J.M. Nicaud, P. Fickers,Enhancing erythritol productivity in Yarrowia lipolytica using metabolicengineering, Metab. Eng. 42 (2017) 19–24.
[52] T. Janek, A. Dobrowolski, A. Biegalska, A.M. Miro�nczuk, Characterization oferythrose reductase from Yarrowia lipolytica and its influence on erythritolsynthesis, Microb. Cell Fact. 16 (1) (2017) 118.
[53] H. Cheng, S. Wang, M. Bilal, X. Ge, C. Zhang, P. Fickers, H. Cheng, Identification,characterization of two NADPH-dependent erythrose reductases in the yeastYarrowia lipolytica and improvement of erythritol productivity usingmetabolic engineering, Microb. Cell Fact. 17 (1) (2018) 133.
[54] A.M. Miro�nczuk, A. Biegalska, A. Dobrowolski, Functional overexpression ofgenes involved in erythritol synthesis in the yeast Yarrowia lipolytica,Biotechnol. Biofuels 10 (1) (2017) 77.
[55] W. Rymowicz, A. Rywi�nska, M. Marcinkiewicz, High-yield production oferythritol from raw glycerol in fed-batch cultures of Yarrowia lipolytica,Biotechnol. Lett. 31 (3) (2009) 377–380.
[56] P. Fickers, J.M. Nicaud, J. Destain, P. Thonart, Involvement of hexokinase Hxk1in glucose catabolite repression of LIP2 encoding extracellular lipase in theyeast Yarrowia lipolytica, Curr. Microbiol. 50 (3) (2005) 133–137.
[57] I. Georis, A. Feller, F. Vierendeels, E. Dubois, The yeast GATA factor Gat1occupies a central position in nitrogen catabolite repression-sensitive geneactivation, Mol. Cell. Biol. 29 (13) (2009) 3803–3815.
[58] K.R. Pomraning, E.L. Bredeweg, S.E. Baker, Regulation of nitrogen metabolismby GATA zinc finger transcription factors in Yarrowia lipolytica, mSphere 2 (1)(2017) e00038–17.
[59] S. Soussi-Boudekou, S. Vissers, A. Urrestarazu, J.C. Jauniaux, B. André, Gzf3p, afourth GATA factor involved in nitrogen-regulated transcription inSaccharomyces cerevisiae, Mol. Microbiol. 23 (6) (1997) 1157–1168.