Nippon Shinyaku · Statements contained in this report con-cerning plans, predictions, and...
40
Nippon Shinyaku Co Ltd ANNUAL REPORT 2006 ANNUAL REPORT 2006 Nippon Shinyaku
-
Upload
trinhtuyen -
Category
Documents
-
view
214 -
download
0
Transcript of Nippon Shinyaku · Statements contained in this report con-cerning plans, predictions, and...

Ni
pp
on
Sh
in
ya
ku
Co
Lt
dA
NN
UA
LR
EP
OR
T2
00
6
A N N U A L R E P O R T 2006
Nippon Shinyaku
ProfileNIPPON SHINYAKU CO., LTD.
CONTENTS
1 Consolidated Financial Highlights2 At a Glance4 Message from the President6 Research and Development
10 Manufacturing12 Medical Representative Activity13 Recent Developments at Nippon Shinyaku14 Corporate Governance:
Basic Policy and Implementation15 Environmental Technology Section 16 Board of Directors and Corporate Auditors17 Financial Section18 Management’s Discussion & Analysis36 Corporate Directory & Service Network37 Investor Information
Forward-Looking Statements:
Statements contained in this report con-
cerning plans, predictions, and strategies
to improve future performance (“forward-
looking statements”) are based on informa-
tion currently available to the Company’s
management, and inevitably involve a cer-
tain element of risk and uncertainties.
Actual results may therefore differ from
those in the forward-looking statements.
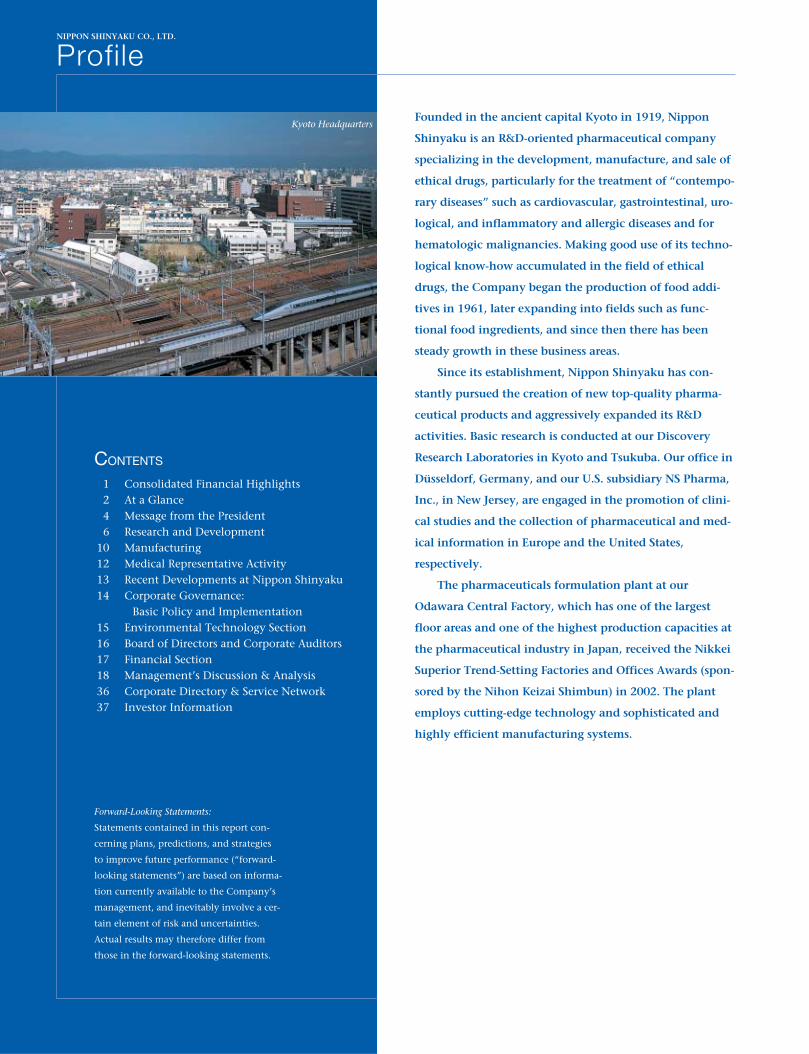
Founded in the ancient capital Kyoto in 1919, Nippon
Shinyaku is an R&D-oriented pharmaceutical company
specializing in the development, manufacture, and sale of
ethical drugs, particularly for the treatment of “contempo-
rary diseases” such as cardiovascular, gastrointestinal, uro-
logical, and inflammatory and allergic diseases and for
hematologic malignancies. Making good use of its techno-
logical know-how accumulated in the field of ethical
drugs, the Company began the production of food addi-
tives in 1961, later expanding into fields such as func-
tional food ingredients, and since then there has been
steady growth in these business areas.
Since its establishment, Nippon Shinyaku has con-
stantly pursued the creation of new top-quality pharma-
ceutical products and aggressively expanded its R&D
activities. Basic research is conducted at our Discovery
Research Laboratories in Kyoto and Tsukuba. Our office in
Düsseldorf, Germany, and our U.S. subsidiary NS Pharma,
Inc., in New Jersey, are engaged in the promotion of clini-
cal studies and the collection of pharmaceutical and med-
ical information in Europe and the United States,
respectively.
The pharmaceuticals formulation plant at our
Odawara Central Factory, which has one of the largest
floor areas and one of the highest production capacities at
the pharmaceutical industry in Japan, received the Nikkei
Superior Trend-Setting Factories and Offices Awards (spon-
sored by the Nihon Keizai Shimbun) in 2002. The plant
employs cutting-edge technology and sophisticated and
highly efficient manufacturing systems.
Kyoto Headquarters

1
Thousands ofMillions of yen U.S. dollars (Note 2)
Years ended March 31, 2006 and 2005 2006 2005 2006
Net sales ................................................................................... ¥ 53,947 ¥ 54,252 $461,086Income before income taxes and minority interests ............... 3,285 9,630 28,077Net income .............................................................................. 1,612 5,639 13,778
Amounts per share (in yen and U.S. dollars):Net income .......................................................................... ¥ 22.84 ¥ 81.22 $ 0.20Shareholders’ equity (Note 1) ............................................. 1,068.50 1,025.26 9,128
Total assets ............................................................................... ¥ 104,899 ¥ 98,910 $896,573Shareholders’ equity ................................................................ 75,412 70,010 644,547Investments in plant and equipment ...................................... 1,828 1,745 15,624R&D expenses .......................................................................... 10,071 8,479 86,077
Notes: 1. Calculated on the basis of the average of the balances at the beginning and at the end of the term.2. U.S. dollar amounts are converted from yen amounts at the rate of U.S.$1=¥117, the approximate exchange rate on March 31, 2006.
Consolidated Net Sales(Millions of yen)
2004 2005 2006
53,94751,326
54,252
Consolidated Net Income(Millions of yen)
2004 2005 2006
1,6121,536
5,639
ConsolidatedShareholders’ Equity(Millions of yen)
2004 2005 2006
65,39670,010
75,412
Consolidated Return on Average Equity(%)
2004 2005 2006
2.22.5
8.3
Consolidated Financial HighlightsNIPPON SHINYAKU CO., LTD. and Consolidated Subsidiaries

At a Glance
2
Protein preparationsPreservativesSeasonings & spicesHealth food materials
Pharmaceuticals
Functional Food
2003 2004 2005 (FY)2003 2004 2005 (FY) 2003 2004 2005 (FY)
10,196
12,00911,10513,112 13,146 12,925
2,4232,588 2,680
2003 2004 2005 (FY)
8,894 9,214 9,540
◆ Sales (Millions of yen) ◆ Sales (Millions of yen) ◆ Sales (Millions of yen)
◆ Sales (Millions of yen)
◆ Main Products
¥9,540 million
17.0%17.7%
N C UDrugs for Inflammation and Allergy
◆ Main Products ◆ Main Products Eviprostat®(herbal extracts) Remedy for Prostatic Hypertrophy
Bladderon®(flavoxate hydrochloride) Remedy for Pollakisuria
Estracyt®(estramustine sodium phosphate) Remedy for Prostatic Cancer
Urocalun®(quercus salicina extract) Remedy for Urinary Calculus
Urological Drugs
¥11,105 million
20.6%24.0%
¥12,925 million
5.0%
¥2,680 million
Hypen®(etodolac) Non-Steroidal Analgesic and Anti-inflammatory Agent
Livostin® Eye Drops(levocabastine hydrochloride) Remedy for Allergic Conjunctivitis
Livostin® Nasal Spray(levocabastine hydrochloride) Remedy for Allergic Rhinitis
Azunol® Gargle 4%A Gargle Liquid which Contains Azulene
Leftose®(lysozyme hydrochloride preparation)
Orcl®(actarit) Antirheumatic Agent
¥44,406 million83.0%82.3%
Sales breakdown Net sales ¥53,946 million
◆ Main Products Cylocide®(cytarabine) Remedy for Acute Leukemia and Solid Cancer
Cylocide®N(cytarabine) Remedy for relapsed and refractory acute leukemia andMalignant Lymphoma
Trisenox®
Remedy for relapsed and refractory acute promyelocyticleukemia
Amnolake®
Remedy for relapsed and refractory acute promyelocyticleukemia
Drugs for HematologicMalignancies

G A O
3
2003 2004 2005 (FY) 2003 2004 2005 (FY) 2003 2004 2005 (FY)
5,594 5,507 5,332 4,512 4,600 4,594
6,593 7,1857,770
◆ Sales (Millions of yen) ◆ Sales (Millions of yen) ◆ Sales (Millions of yen)
◆ Main Products ◆ Main Products Gaslon N®(irsogladine maleate) Remedy for Gastric Ulcer and Gastritis
Portolac®(lactitol hydrate) Antihyperammonemia Agent
Others (Including the proceedsfrom intellectual property rights)
Gastrointestinal Drugs
Cephadol®(difenidol hydrochloride) Antivertigo Agent
Iodocoat®
Agent for decubital ulcer and skin ulcer
Prulifloxacin®
Synthetic Antibacterial Agent
14.4%
¥7,770 million
9.8%
¥5,332 million
8.5%
¥4,594 million
Urajirogashi (Quercus salicina)
Product names followed by ®represent trademarks registered in Japan.
Akamegashiwa (Mallotus Japonicus)
◆ Main Products Selectol®(celiprolol hydrochloride) Remedy for Hypertension and Angina Pectoris
Glycoran®(metformin hydrochloride) Remedy for Diabetes
Odric®(ACE inhibitor) Anti-hypertensive Agent
Drugs for Cardiovascularand Metabolic Diseases

Japan is facing the prospect of a severe impact from its declin-
ing birthrate, as well a population that is aging with a
momentum unprecedented in the world. The future course of
its social security system, including pensions, national health
insurance, and social welfare and nursing care, is the subject
of intense debate. Above all, there is a high degree of interest
among the citizens of Japan about the greatest concern of the
aging population — health and the medical care system that
supports it. The question of how to design a sustainable med-
ical care system backed by sound finances is becoming a
major political issue.
Measures are being taken to curtail the costs of medical
care arising from the Japanese government’s need to reduce
its budgetary expenditures. These measures include pharma-
ceutical price reductions under the National Health Insurance
System and the promotion of the use of generic pharmaceuti-
cals. This is an equally pressing issue for the pharmaceutical
manufacturing industry.
Under these circumstances, Nippon Shinyaku is working
to enrich its drug pipeline and constantly bring innovative
new products to market to meet the needs of healthcare pro-
fessionals. We consider the achievement of a steady and sus-
tained sales trend and profit growth through these activities
to be the overarching management theme tied to our future
progress and expansion.
As we are required to demonstrate the safety and effective-
ness of our drug candidates based on global standards, it is
inevitable that research and development costs will increase.
Such increasing costs place pressure on the management of
pharmaceutical manufacturers and constitute a management
risk. To keep that risk to the minimum, we must efficiently
manage the direction of our research and development.
Nippon Shinyaku plans to diversify these risks through
Message from the President
4

5
development partnerships with other companies in the same
industry and with companies outside the industry, as well as
through joint research conducted by industry, government,
and academia. Last year, as part of our research on nucleic acid
drugs, we decided to participate in the Functional RNA Project,
a national project commissioned by NEDO (the New Energy
and Industrial Technology Development Organization), an
organization under the control of the Ministry of Economy,
Trade, and Industry.
At Nippon Shinyaku, we have followed an R&D policy
featuring five themes, as described below:
1. Development of innovative new drugs through in-house drug
discovery
2. Development of new drugs through in-licensing
3. Development of improved new drugs through the modification of
existing active ingredients
4. Additional indications to the Company’s own products
5. Improvement of the formulations of the Company’s own
products
We are not only a developer of innovative medicines: we
respond to the needs of healthcare professionals and use our
ingenuity to raise the value of our pharmaceutical products in
any little way we can, such as making dosages easier, or reduc-
ing side effects. In these ways, we are constantly exerting
effort to extend our products’ life cycles, and to increase
demand for the Company’s products.
While we focus on the areas of urology and inflamma-
tory/allergic diseases in our in-house new drug research, we
are also developing new agents for treating alcoholism, which
has a potential social impact reaching well beyond the
affected individual, and for intractable hematologic
malignancies.
Furthermore, as one of our internationally strategic prod-
ucts, we have granted a license to F. Hoffmann-La Roche Ltd.
of Switzerland, which has begun the full-fledged development
of a treatment for dyslipidemia, for which we have consider-
able expectations. Another licensee, the American company,
Innovive Pharmaceuticals, Inc., is aiming for the early devel-
opment of an agent for chronic myelogenous leukemia. In
terms of new formulation of our products, we have in recent
years increased revenues by launching a smaller size tablet for-
mulation for diabetes, as well as a portable gargle liquid and an
easy-to-use gel ointment for the treatment of skin ulcers.
In the functional food business, we are steadily expand-
ing our sales in the fields of health food materials and addi-
tives used for food processing. In addition, we plan to expand
our sales channels through the establishment of a health food
mail-order company, Laplus Pharma Co., Ltd. We also have
great expectations of expanding our functional food business.
Our goal is the development of innovative, unique phar-
maceuticals. Since the inauguration of our business, we have
proceeded in an enterprising spirit that does not shy away
from any challenge, as we continually make advances in
cutting-edge research that meet the demands of the times. At
Nippon Shinyaku, we hope to achieve innovative manage-
ment that can respond to the expectations of our investors
with a high-profile reputation among society at large. This
reputation will rest on our contribution to health care
through the provision of superior and unique pharmaceuticals.
Kazuto HatsuyamaPresident

Research and Development
6
2004 2005 2006
8,4798,263
Consolidated R&D Expenses Ratio to Net Sales(Millions of yen) (%)
15.6
10,071
18.7
16.1
DRUG DEVELOPMENT POLICYIn line with the global trend, mergers and reorganizations of
leading pharmaceutical companies are proceeding in Japan,
too. Certain medium-sized Japanese pharmaceutical compa-
nies have recently turned the focus of their attention to
generic drugs. Their appearance suggests future market expan-
sions of generic drugs, which will lead to increasingly severe
market competition for pharmaceutical manufacturers.
Nippon Shinyaku has over long years acquired its own in-
house technologies for drug discovery, and is using these
technologies as a basis for adopting cutting-edge techniques
that move forward research and development for the discov-
ery of entirely new drugs.
As a medium-sized company, Nippon Shinyaku aims to
be a specialty pharmaceutical maker focusing on the develop-
ment of new drugs for a characteristic niche market. Regarding
our in-house development, we are focusing on urology and
allergic/inflammatory disorders to maximize the efficiency of
financial and human resources investments.
In addition to these two areas, we are making efforts to
develop licensed drugs for urological and immunological dis-
orders, allergies, and hematological malignancies, among
other applications. All R&D activities are carried out with the
purpose of discovering, developing, and providing character-
istic new pharmaceuticals to patients as early as possible. As
for our original products, we establish development strategies,
which include overseas business development plans. At the
same time, when we discover drug candidates that lie outside
the scope of our own focus areas, we will look for the possibil-
ity of jointly developing these drugs with other companies or
licensing them out, in order to maximize their value.
We have established a dedicated section for the early
commercialization of our research pertaining to nucleic acid
drugs based on mass synthesis technologies of nucleic acids
established in our research laboratories.
RESULTS OF ACTIVITIESIn June of 2005, we launched Amnolake, a remedy for refrac-
tory/relapsed acute promyelocytic leukemia. With our prod-
ucts Trisenox, which is indicated for the same use, as well as
Cylocide and Cylocide N, used in the treatment of leukemia
and malignant lymphoma already on the market, our product
lineup in the area of hematologic malignancies has been
expanded. In December of 2005, we licensed out NS-187, a
drug we developed in-house for the treatment of chronic
myelogenous leukemia, to the U.S. company INNOVIVE
Pharmaceuticals Inc. INNOVIVE has begun preparations for
the commencement of a Phase I trial in the U.S. we have
7
acquired the marketing rights from Bayer Yakuhin, Ltd. for
Baynas® tablets, which have PGD2 and TXA2 receptor antago-
nistic properties and are used in the treatment of allergic
rhinitis, and we began sales in July of 2006.
In fiscal 2005, as a result of our aggressive promotion of
clinical trials for R&D compounds in the latter phase of clini-
cal development, our R&D costs reached approximately ¥10
billion (18.6% of total sales). Our NS-126 (novel steroid), used
in the treatment of allergic rhinitis, has completed its Phase
III trial, and we are currently preparing for application for
approval. Our centrally acting analgesic NS-315 is currently
undergoing a Phase III trial. Our NS-11 (acamprosate), an
agent used in the treatment of alcohol dependency, has com-
pleted the Phase I trial and has begun the Phase II trial.
In clinical trials being carried out overseas, NS-9, an agent
for treating metastatic liver cancer, has completed the Phase I
trial by NS Pharma, Inc. in the U.S. with regard to our
licensed-out compounds, the Phase II trial of NS-8, an agent
for overactive bladders, and the Phase I trial for NS-220, a
therapeutic agent for dyslipidemia, have both made progress.
In addition, Angelini ACRAF S.p.A. is preparing to launch our
quinolone antibacterial agent, prulifloxacin, in several
European countries outside Italy. The Phase III trial of
prulifloxacin has been started in the U.S. by Optimer
Pharmaceuticals, Inc., and our licensee in South Korea, Yuhan
Corp., has completed clinical trials and is preparing to apply
for approval.
DRUG DEVELOPMENT ORGANIZATION AND FUNCTIONDomestic
Nippon Shinyaku employs about 450 R&D staff. Collaborative
efforts by our Kyoto and Tsukuba Research Laboratories for
the rapid development of in-house compounds and the pro-
motion of the in-licensing activities have enabled us to build
up our pipeline. We are also strengthening our genomics-
based drug discovery research, including investigations into
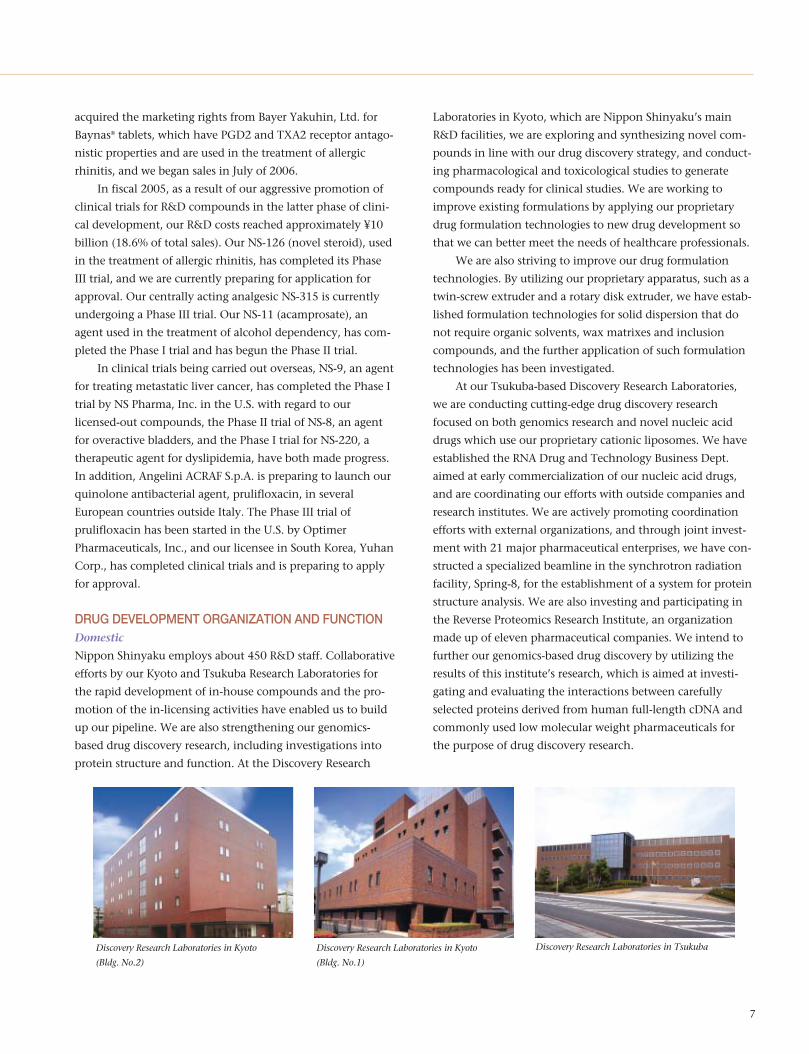
protein structure and function. At the Discovery Research
Laboratories in Kyoto, which are Nippon Shinyaku’s main
R&D facilities, we are exploring and synthesizing novel com-
pounds in line with our drug discovery strategy, and conduct-
ing pharmacological and toxicological studies to generate
compounds ready for clinical studies. We are working to
improve existing formulations by applying our proprietary
drug formulation technologies to new drug development so
that we can better meet the needs of healthcare professionals.
We are also striving to improve our drug formulation
technologies. By utilizing our proprietary apparatus, such as a
twin-screw extruder and a rotary disk extruder, we have estab-
lished formulation technologies for solid dispersion that do
not require organic solvents, wax matrixes and inclusion
compounds, and the further application of such formulation
technologies has been investigated.
At our Tsukuba-based Discovery Research Laboratories,
we are conducting cutting-edge drug discovery research
focused on both genomics research and novel nucleic acid
drugs which use our proprietary cationic liposomes. We have
established the RNA Drug and Technology Business Dept.
aimed at early commercialization of our nucleic acid drugs,
and are coordinating our efforts with outside companies and
research institutes. We are actively promoting coordination
efforts with external organizations, and through joint invest-
ment with 21 major pharmaceutical enterprises, we have con-
structed a specialized beamline in the synchrotron radiation
facility, Spring-8, for the establishment of a system for protein
structure analysis. We are also investing and participating in
the Reverse Proteomics Research Institute, an organization
made up of eleven pharmaceutical companies. We intend to
further our genomics-based drug discovery by utilizing the
results of this institute’s research, which is aimed at investi-
gating and evaluating the interactions between carefully
selected proteins derived from human full-length cDNA and
commonly used low molecular weight pharmaceuticals for
the purpose of drug discovery research.
Discovery Research Laboratories in Kyoto
(Bldg. No.1)
Discovery Research Laboratories in Kyoto
(Bldg. No.2)
Discovery Research Laboratories in Tsukuba

Research and Development
8
Developments in the Functional Food BusinessIn key protein products for our processed food business, we
began selling soy protein concentrate and soy protein isolate
in 2004 to reinforce our existing product lineup of egg white
powder, whey protein concentrate and wheat gluten. Growth
in sales of soy proteins has been buoyed by the technical sup-
port we provide to users.
In the health foods segment, we continue to develop
evidence-based health foods by verifying effectiveness in
human clinical trials. With Gekkeikan Sake Co., Ltd. , we
jointly developed Sakekasu (Sake Lees) Peptide R for its
hypotensive properties. In March 2006 we launched and
exhibited this product together with Morus Leaves extract
and Akamegashiwa extract at the Natural Products Expo West
2006 in Anaheim, California. We are also planning to carry
out R&D on whey peptides. In addition we are seeking
approval of Garcinia extract as a “Food for Specified Health
Use” (FOSHU).Further, in April 2006 we established Laplus
Pharma Co., Ltd., a mail-order health food subsidiary.
Regarding agents for improving food shelf life, in January
NS Pharma, Inc. in New Jersey
The Düsseldorf Office
International
Nippon Shinyaku established an overseas office in Düsseldorf,
Germany in 1991, and opened a New York office in 1997. In
1999, we upgraded the New York office to a subsidiary, NS
Pharma, Inc. (We later moved its base of operations to
Parsippany, New Jersey.) These overseas operations focus their
efforts on the collection of the latest information on new
drug development technologies and newly developed drug
candidates from the major pharmaceutical companies in
Europe and America, venture firms, and research institutions.
The office and the subsidiary, which also act as bases of opera-
tion for the Company’s clinical development efforts in
Europe and America, have played important roles in our con-
duct of clinical trials by using CROs. NS Pharma, Inc. has
recently completed the U.S. Phase I trial of NS-9, an agent for
the treatment of metastatic liver cancer, by using CROs.
Our target for the current term are to speedup the drug R&D process right up to applica-
tion for approval and to enrich our current R&D pipelines. Inthe field of new drug discovery, we are investing managementresources in a particularly focused manner in the therapeuticareas of urology, and inflammation/allergies. In addition, weare working to license-in new drugs from other companies inthe aforementioned two therapeutic areas as well as in bloodmalignancies. Regarding in-house-developed drugs that arecompetitive in overseas markets, we will be making efforts tomarket such drugs in various countries through the licensing-out as well as joint development.
To realize these goals, we will selectively focus managementresources on the most promising drug candidates and target
areas, and will work to appropriately and efficiently allocatemanagement resources on a priority basis. We will also adopt amore rigorous approach than hitherto to the evaluation ofR&D candidates, as well as risk management and schedulemanagement.
We are planning to set up a nucleic acid-based pharmaceu-tical business utilizing our own technology, based on ourrecent successes in RNA interference (RNAi) drug discoveryresearch. During the current business term, we will be offeringour services to other pharmaceuticals companies on a consign-ment basis in the production of RNA synthesis and the produc-tion of bulk RNA synthetic materials as well as drug deliverysystem. With these activities at the core, we hope to develop acommercially feasible nucleic acid-based pharmaceutical business.
Research & Development
Junichi Yano, Ph.D.Director: General Manager,
Research & Development Division

9
2006 we launched an agent that improves the shelf life of egg
products called NewRestol Tamagoyaki-yoh S, which is effec-
tive in the preservation of foods with pH factors ranging from
neutral to alkaline. Moreover, we are engaged in developing a
fungicide for steamed bread products. In response to demand
from the convenience store sector, we are also devoting efforts
to developing agents that preserve the freshness of vegetables.
DRUGS UNDER DEVELOPMENTNippon Shinyaku aims to place at least one compound per
year as a new product on the market. At present, we have four
Phase III, four Phase II (including those in preparation stage),
and three Phase I products (including one in the preparation
stage) in development. Of these, six are products that were
discovered in-house. Provided the development proceeds
smoothly, we can anticipate they will become the next gener-
ation of Nippon Shinyaku’s core products. The following
table shows our pipeline compounds, including details of
their development stage and expected indications.
◆ R&D compounds (As of July 2006)
< Domestic >
Stage Product name Generic name Therapeutic field Indications Development
Pre-registrationUrespan
temiverineurological overactive bladder original(Withdrawal planned) hydrochloride
Stage Code No. Generic name Therapeutic field Indications Development
Phase III NS-315tramadol
inflammation/allergynon-narcotic analgesic
licensed-in from Grünenthal GmbHhydrochloride (cancer pain)
Phase IIINS-126 inflammation/allergy
allergic rhinitis co-developed withPhase II bronchial asthma Hisamitsu Pharmaceutical Co., Inc.
Phase III HFT-290 fentanyl citrate inflammation/allergynarcotic analgesic co-developed with(cancer pain) Hisamitsu Pharmaceutical Co., Inc.
Phase II TRK-091tramadol
inflammation/allergynon-narcotic analgesic co-developed with
hydrochloride SR (low back pain) Toray Industries, Inc.
Phase II NS-11 acamprosate Others alcohol dependence licensed-in from Merck Sante S.A.S.
Phase I NS-8 urological overactive bladder original
< Overseas >
Stage Code No. Generic name Therapeutic field Indications Licensee
Phase IIINM441 prulifloxacin chemotherapeutics bacterial infections
Yuhan Corporation
Phase III Optimer Pharmaceuticals, Inc.
Phase II NS-8 urological overactive bladder APOGEPHA Arzneimittel GmbH
Preparation forHMN-214 chemotherapeutics solid tumor
TEVA PharmaceuticalPhase II Industries Ltd.
Phase I NS-9 chemotherapeutics hepatic cancer
Phase I NS-220 cardiovascular dyslipidemia F.Hoffmann-La Roche Ltd.
Preparation forNS-187 chemotherapeutics
chronic myelogenous INNOVIVEPhase I leukemia Pharmaceuticals, Inc.

Manufacturing
Nippon Shinyaku has four manufacturing plants: two phar-
maceutical plants — the Chitose Synthesis Plant for the pro-
duction of drug substances and the Odawara Central Factory
for solid formulations and injections — and two plants for
production of extracts and other food ingredients — the
Chitose Functional Food Plant and the Morioka Factory.
The mainstay Odawara Central Factory is located in the
city of Odawara in Kanagawa Prefecture, near such sightsee-
ing spots as Mount Fuji, Hakone, and Izu. The Factory began
operating in 1964 and has been refurbished through several
generations of new technology to enable higher production
volumes and compliance with the increasingly strict GMP
regulations. The Factory is currently located on a 54,000-
square meter site and boasts a total floor space of 28,000
square meters.
The Factory is equipped with integrated manufacturing
facilities for various processes, ranging from raw material
weighing to final packaging, for injectable formulations as
well as tablet, capsule, granule, powder, and other solid for-
mulations. A wide range of products is manufactured in
compliance with international-level hygiene and
cleanliness standards. The entire production system is
computer-controlled, ensuring efficient manufacturing man-
agement and advanced quality control systems for the timely
and reliable supply of product to the market. From March
2004, we began contract manufacturing of other companies’
products. We are continually striving to improve our produc-
tion processes, as they also contribute to improved Company
earnings.
We obtained ISO14001 accreditation for the Factory’s
environmental management systems in August 2004. We aim
to reduce our environmental impact, procure environmen-
tally friendly supplies, and improve our local environment,
and are building risk-management systems to address issues
related to earthquakes and other risks.
Our other pharmaceuticals plant, the Chitose Synthesis
Plant, is relatively new, having been completed in 1999
within the Chitose Airport Industrial Complex near the New
Chitose International Airport. The
Plant was established for the manufac-
ture of drug substance for in-house
development compounds from the
clinical trial stage, and it meets the
standards required for audits by over-
seas regulatory authorities. The Plant
produces some drug substances used
at the Odawara Central Factory and
has also begun manufacturing drug
10
Capital Investment and Depreciation in Last 3 Years (consolidated)(¥mn)
2004 2005 2006
1,184
1,8281,744
2004 2005 2006
2,221
2,754
2,548
◆ Capital Investment ◆ Depreciation Expenses
Chitose Synthesis Plant / Chitose Functional Food Plant Morioka Factory
Odawara Central Factory

substances for sale to other companies.
Synthesis plants generally have a greater environmental
impact than formulation plants, so we emphasized environ-
mental conservation at the Chitose Synthesis Plant from the
design stages. We are running our operations with a view to
protecting the environment, for example by obtaining
ISO14001 accreditation in 2002.
The Chitose Functional Food Plant is adjacent to the
Chitose Synthesis Plant and began operating in 1990, mainly
producing extracts from onions and red pepper. Recently, the
Plant has begun production of concentrated fruit juices using
fruit grown locally in Hokkaido, as well as various health food
ingredients.
Our other plant involved in functional food-related prod-
ucts — the Morioka Factory, in Iwate Prefecture, northern
Japan — began operating in 1966 for the manufacture of
extracts from various spices and food additives, including
agents to improve food shelf lives. The plant has recently
diversified into the production of health food ingredients.
We therefore have in place a highly efficient production
system through the operation of these four plants, as well as
the plant operated by our pharmaceuticals manufacturing
subsidiary Sioe Pharmaceutical Co., Ltd. at Amagasaki in
Hyogo Prefecture and the foodstuffs plant operated by our
subsidiary Tajima Syokuhin Kogyo Co., Ltd., also in Hyogo
Prefecture.
11
Every day, the staff of Nippon Shinyaku’sProduction Division devote their efforts to the
manufacture of products of a guaranteed high quality level, tominimize the adverse impact of the Company’s productionoperations on the natural environment, and to contribute tothe economic and cultural development of regional commu-nity in which we operate.
To ensure high product quality, we observe current goodmanufacturing practices (cGMP), and continually invest man-agement resources toward introducing leading-edge equipmentand facilities, as well as training employees. We are also con-stantly mindful of the need for effort to preserve the globalenvironment, to which end we have already obtained ISO14001 environmental management systems certification for
our flagship Odawara Central Factory. In addition, we regularlyapply for updating of this certification.
We encourage our employees to volunteer for neighbor-hood cleanup initiatives, which has the additional positiveeffect of strengthening ties with the communities in which ourplants and offices are located, which leads to the contributionto the economic and cultural development of each regionalcommunity in which we operate.
To ensure that Nippon Shinyaku never loses its reputationfor trustworthiness among the wider community, all the staffof the Production Division are working and studying toimprove themselves as employees and as responsible membersof society with pride in the community in which they work.
Production
Dr. Nobuyoshi SumiDirector: General Manager, International Business Division, Resource
Procurement Division & Production Division

Medical Representative Activity
12
We have 21 branches throughout Japan. We have adopted a
flat organizational framework, and there are only three ranks
in the branch organizations: branch manager, section head,
and medical representative. The branch managers attend busi-
ness meetings, the section heads attend nationwide section
head meetings, and the medical representatives attend product
promotion meetings as well as rank-based training sessions.
Our marketing staff at the head office use these meetings and
training sessions as opportunities to communicate directly
with front-line staff (i.e. staff who work at our branches).
With our focus on the relatively small areas of urology,
inflammation and allergy prevention, and hematological
malignancies, we are able to make effective visits to medical
institutions throughout Japan. We have designated these
areas based on analysis of the distribution of physicians who
are currently prescribing our existing medicines, and on an
analysis of the compounds that are scheduled for launching
and their projected marketability. As part of our goal of
strengthening our allergic rhinitis and allergy prevention area,
we will begin the sale in July of this year of the allergic rhini-
tis medication Baynas Tablets.
Our medical representatives attend monthly product
explanation sessions at their offices, allowing them to acquire
a high degree of knowledge in the aforementioned areas
regarding both diseases and our products.
From here on, we intend to improve the efficiency of the
detailed explanation of our products provided by our medical
representatives on their visits to doctors by enabling them to
more effectively utilize market analyses regarding our spe-
cialty areas. In this way, we aim to raise our medical represen-
tatives’ reputation for reliability among the nation’s doctors.
Nippon Shinyaku’s marketing is highlydependent on the professional skills of its
medical representatives, all of whom are very capable ofthinking for themselves and take a proactive approach todeveloping the Company’s business in the territories forwhich each of them are solely responsible, based on ourmarketing policies. We constantly urge them to furtherdeepen their background knowledge regarding the phar-maceutical products they market to healthcare profession-als, and to visit all the doctors on their lists morefrequently. The training of medical representatives is animportant part of the duties of our marketing managers,and they are required to accompany each medical repre-sentative under their authority on visits to doctors, so as todemonstrate directly how to effectively communicate with
the Company’s primary customers. Our particular strategy during the current term is to
raise profitability by focusing our marketing efforts ondrugs with high profit margins that are also expected tosell strongly. We have drawn up action plans covering ourprincipal products, and made exhaustive and detailed pre-sentations of important points to the doctors they visit,which are used as guidelines for medical representatives.
The Japanese authorities are constantly tighteningtheir rules and guidelines to curtail medical expensesunder the national health insurance system, but there isno magic formula that we in the marketing division canuse to bypass this problem. All our staff must maintain asense of urgency and unity in their work, and continue tofaithfully observe the fundamentals of marketing.
Marketing
Toshihiko SagoDirector: General Manager,
Marketing Division
13
Recent Developments at Nippon Shinyaku
New Products and Additional Indications
April, 2006
➜ Entered into a partnership with Bayer Yakuhin, Ltd. to
sell the allergic rhinitis medication “Baynas® Tablets”
in Japan
August, 2005
➜ Began sale of the decubital ulcer and skin ulcer med-
ication “Iodocoat ointment 0.9%”
July, 2005
➜ Began sale of the urinary calculus medication
“Urocalun Tablets 225 mg”
June, 2005
➜ Began sale of the refractory/relapsed acute promyelo-
cytic leukemia medication “Amnolake Tablets 2 mg”
Licensing and Joint Developments
December, 2005
➜ Concluded the license agreement with the American
company INNOVIVE Pharmaceuticals, Inc. for the
chronic myelogenous leukemia medication “NS-187”
Functional Food Company News
April, 2006
➜ Established an affiliated health food sales company
“Laplus Pharma, Co., Ltd.”
March, 2006
➜ Began sale of the product “Sakekasu (Sake Lees) Peptide
R,” jointly developed with Gekkeikan Sake Co., Ltd.
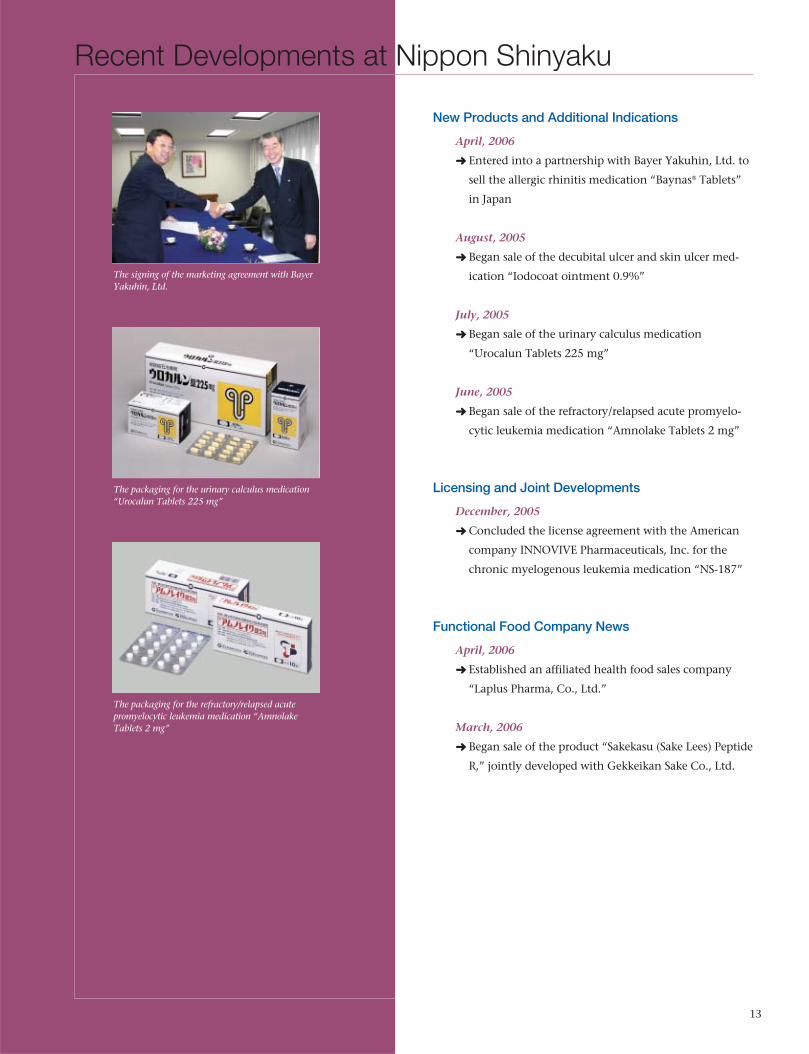
The signing of the marketing agreement with BayerYakuhin, Ltd.
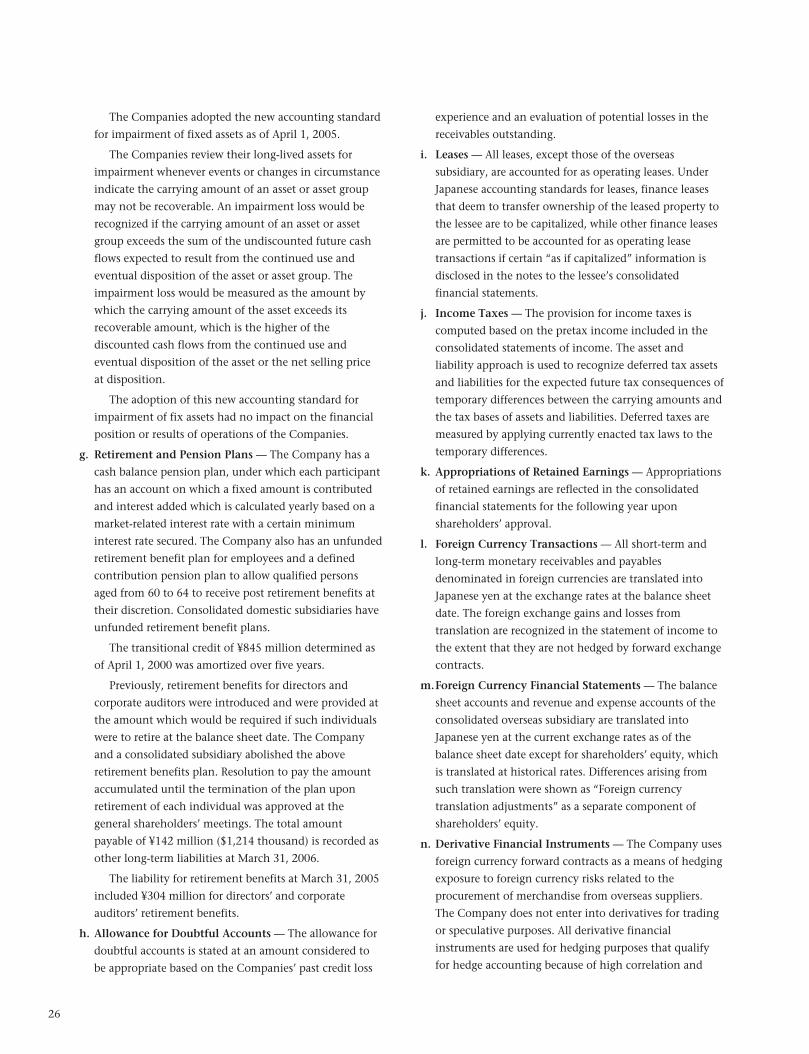
The packaging for the urinary calculus medication“Urocalun Tablets 225 mg”
The packaging for the refractory/relapsed acutepromyelocytic leukemia medication “AmnolakeTablets 2 mg”

Corporate Governance: Basic Policy and Implementation
14
At Nippon Shinyaku, we recognize corporate governance as
one of the most important issues facing management. We
are working to improve our internal control systems to
ensure transparent business administration and effective
business functions.
The Company’s Board of Directors comprises seven
members: the President, two Managing Directors, and four
Directors, all of whom play a role as members of the
supreme decision-making body. In principle, the Board
convenes once per month to decide on matters of primary
business as defined in the Board Regulations, and to super-
vise the state of affairs of our business operations. With
regard to any issues that are to be proposed to a Board
meeting, all directors and statutory auditors attend an
explanatory session for important cases beforehand. Staff
members of the department that originated the proposal
deliver presentations on the cases, giving relevant details,
and a question and answer session is conducted.
Currently, the term of office of directors of the
Company is one year. Aiming at further clarifying the man-
agement responsibilities of the Board of Directors and creat-
ing an optimal management structure that can respond
flexibly to changes in the operating environment, we have
adopted the executive officer system.
Instead of introducing a committee-based auditing sys-
tem, we maintain the conventional statutory auditor sys-
tem. Our Board of Auditors is composed of four statutory
auditors, two of whom are full-time auditors, the other two
being part-time external auditors. Corporate Auditors
attend all Board meetings, where they fulfill their manage-
ment oversight function as the Board of Auditors as a
whole. Corporate Auditors observe proceedings at meetings
of the Board of Directors so that the independence of the
accounting auditors(certified public accountants) is secured,
and through regular meetings with the accounting audi-
tors, they receive from accounting auditors the outlines of
the audit plans and information on the current status of
the interim audits. In addition, they keep in close contact
via their attendance during on-site audit sessions, and make
efforts to mutually improve the effectiveness of the audits
and overall audit efficiency. Corporate Auditors also main-
tain close contact with the Company’s internal auditing
staff so as to exchange opinions on their audit plans and
the results of audits.
In addition to supervision by the Corporate Auditors,
we also have an auditing function that reports directly to
the President and conducts operational audits for internal
controls in accordance with internal auditing guidelines.
Nippon Shinyaku’s overriding principle is respect for
human dignity, and we strive to conduct ourselves accord-
ing to high ethical standards, always keeping our contribu-
tion to society in mind. We recognize that such conduct is
closely associated with the improvement of our enterprise
value. An internal control system is one of our means to
that end, and it is a process implemented by all Company
staff. We do all we can to ensure full compliance with laws
and regulations, and seek effectiveness and efficiency in our
business affairs. We consider that it is our duty to provide
reasonable assurance that we will reach our objective of
securing the reliability of the financial reports derived
therein. On May 12, 2006, our Board of Directors resolved
on an “Agenda for the Establishment of an Internal Control
System.”
In the past, we have also drafted a “Charter of Business
Conduct,” a “Compliance Program Standards,” and more,
and we are making efforts to enlighten our employees on
the subject of corporate ethics, and to ensure that they all
maintain high ethical standards. We are furthering our
internal control framework by adding internal auditing
functions and functions for the promotion of corporate
ethics, and we are active as a center for the promotion of
internal controls.

15
Under the Board of Directors, Nippon Shinyaku has estab-
lished a corporate-level Environment Committee to deal
with key environmental issues across the Company. We
have also set up an environmental committee at each
branch office.
To protect the environment, we seek to minimize the
impact of our business activities in accordance with our
Basic Environmental Policy. We have voluntarily set envi-
ronmental preservation targets to ensure the systematic
promotion of our environmental initiatives.
We have chosen eight items in our drive to protect
the environment, including cutting CO2 emissions, reduc-
ing waste generated, more effective management of
chemical substances appropriately, and increasing our
procurement of “green” supplies.
As a company based in the city that where the Kyoto
Protocol was signed, we are actively working to cut our
carbon dioxide emissions in accordance with the Kyoto
City Global Warming Provisions, which went into effect
in April 2005 and the Kyoto Prefecture Global Warming
Provisions, which came into effect in April 2006.
We remain ISO14001 accredited for our environmen-
tal management systems after having our certificate
renewed on first-time inspection at the Chitose Plant in
November 2005. At the Odawara Central Factory, we had
already received an approval through mid-term inspection
in August 2005.
We are considering applying for inspection for
accreditation of our head office, our Discovery Research
Laboratories in Tsukuba, and our consolidated subsidiaries
in fiscal 2006 and subsequent years.
Our environmental impact is shown in the graphs left.
Environmental Technology Section
2000 2001 2003 200520042002
0.276
0.293
0.2610.256 0.246
Total energy consumption (1,000 GJ)
CO2 emissions (ton)
Water used (1,000m3)
Waste generated (ton)
200
250
300
350
2000 2001 2003 20052004200210,000
12,000
11,000
13,000
14,000
15,000
2000 2001 2003 2005200420020
100
200
300
400
500
600
2000 2001 2003 20052004 (Fiscal Year)
(Fiscal Year)
(Fiscal Year)
Total emissions (ton) Carbon dioxide emission intensity
Carbon dioxide emission intensity = Total CO2 emissions / sales (tons/millions of yen)
(Fiscal Year)
2002500
600580560540520
620640

Board of Directors and Corporate Auditors
16
As of June 29, 2006
President
Kazuto Hatsuyama
Managing Directors
Yoshihisa Shibata, Ph. D.(General Manager, Human Resources Division &Regulatory Division)
Shigenobu Maekawa(General Manager, Corporate Planning Division, Finance &Accounting Division, Information Systems Division)
Directors
Nobuyoshi Sumi, Dr. med. vet. (General Manager, International Business Division,Resource Procurement Division & Production Division)
Junichi Yano, Ph. D.(General Manager, Research & Development Division)
Toshihiko Sago(General Manager, Marketing Division)
Hiroshi Adachi(General Manager, Functional Food Division)
Corporate Auditors
Youichi Toriyama
Sadayasu Nagai
Kenji Ohishi
Yasuo Tanabe
Corporate Officers
Taro Sakurai(General Manager, Finance & Accounting Dept.)
Akira Miura (General Manager, Human Resources Dept.)
Tetsuya Yonekawa (General Manager, Regulatory Affairs Supervision &Assurance Division)
Kouichi Nakamichi, Ph. D.(General Manager, Odawara Central Factory)
Yojiro Ukai, Ph. D.(General Manager, Research & Development Division)
Kichiro Inoue, Ph. D.(General Manager, Discovery Research Laboratories)
Kazushige Itabashi (General Manager, Licensing & Business Development Dept.)
Toru Sakata (General Manager, Tokyo Business Office)
Hideo Arai (General Manager, Nagoya Business Office)
Takeshi Nomura (General Manager, Osaka Business Office)
(Front from left) Managing DirectorYoshihisa Shibata
PresidentKazuto Hatsuyama
Managing DirectorShigenobu Maekawa
(Back from left) DirectorToshihiko Sago
DirectorNobuyoshi Sumi
DirectorJunichi Yano
DirectorHiroshi Adachi

17
CONTENTS
18 Management’s Discussion & Analysis
20 Consolidated Balance Sheets
22 Consolidated Statements of Income
23 Consolidated Statements of Shareholders’ Equity
24 Consolidated Statements of Cash Flows
25 Notes to Consolidated Financial Statements
36 Independent Auditors’ Report
Millions of yen
Years ended March 31 2006 2 0 0 5 2004 2003 2002 2001
Net sales ......................................................... ¥53,947 ¥54,252 ¥51,326 ¥52,942 ¥50,587 ¥50,949
Income before income taxes and
minority interests ......................................... 3,285 9,630 3,262 4,474 4,534 6,245
Net income .................................................... 1,612 5,639 1,536 2,095 2,155 3,117
Amounts per share (in yen):
Basic net income ....................................... ¥22.84 ¥81.22 ¥21.50 ¥29.20 ¥30.68 ¥44.37
Cash dividends applicable to the year ...... 10.00 15.00 10.00 10.00 10.00 10.00
Total assets ..................................................... ¥104,899 ¥98,910 ¥104,008 ¥109,549 ¥103,871 ¥110,143
Shareholders’ equity ...................................... 75,412 70,010 65,396 61,614 61,770 61,788
Investments in plant and equipment ........... 1,184 1,745 1,829 4,370 2,959 8,886
R&D expenses ................................................ 10,071 8,479 8,263 7,885 7,023 6,618
Financial Section Six-Year Summary (Consolidated)NIPPON SHINYAKU CO., LTD. and Consolidated Subsidiaries

18
Financial StrategyThe Company maintains a sufficient level of retained earnings to reinforce its
financial position while channeling management resources into commercially
promising fields to improve competitiveness in the fast-evolving arena of
pharmaceutical research and development. At the same time, we remain
committed to adequate return of profit to our shareholders as a priority, under a
basic policy of continuous and stable dividend payment.
Liquidity and Capital ResourcesTotal assets of the Company at the end of the reporting term stood at ¥104,899
million (US$xx million), an increase of ¥5,989 million year-on-year. Declines in
cash and cash equivalents, trade receivables, other current assets, and plant
property and equipment were outweighed by increases in the value of
investment securities due to rising stock prices.
Total liabilities increased ¥579 million year-on-year to ¥29,350 million
(US$xx million). Short-term borrowings and accrued retirement benefits both
posted declines, which were more than offset by an increase in deferred tax
liabilities caused by rising stock prices.
Shareholders’ equity rose ¥5,402 million year-on-year to ¥75,412 million
(US$xx million), from increases in retained earnings and unrealized gains on
available-for-sale securities. The shareholders’ equity ratio rose 1.1 percentage
point year-on-year to 71.9%.
Turning to cash flows, net cash provided by operating activities rose ¥595
million year-on-year to ¥3,403 million (US$xx million). An increase in
inventory and a decline in other current liabilities was more than offset by
declines in trade receivables and other current assets.
Net cash used in investing activities rose by ¥2,821 million year-on-year to
¥3,330 million (US$xx million), due to declines in proceeds from redemption of
marketable securities and proceeds from sales of plant, property and equipment.
Net cash used in financing activities shrank ¥4,002 million to ¥2,392
million (US$xx million) due to a decline in expenditures for repayment of short-
term borrowings, which more than offset an increase in dividend payments.
As a result of the foregoing, cash and cash equivalents at the term-end
decreased by ¥2,198 million to ¥13,753 million (US$xx million).
The Company is committed to maintaining the soundness of its financial
position, while ensuring sufficient cash liquidity and funding for business
operations.
Consolidated Cash Flows (Millions of yen)
2004 2005 2006
Net cash provided by operating activities 4,068 2,808 3,403
Net cash used in investing activities (2,273) (509) (3,330)
Net cash used in financing activities (7,630) (6,394) (2,392)
Cash and cash equivalents, end of year 20,032 15,951 13,753
Consolidated Total Assets(Millions of yen)
2004 2005 2006
98,910
104,899104,008
Consolidated Stockholders’ Equity Ratio(%)
2004 2005 2006
70.8
62.9
71.9
Consolidated Cost of Sales(Millions of yen)
2004 2005 2006
23,245 23,369
21,461
Management’s Discussion and AnalysisNIPPON SHINYAKU CO., LTD.

19
Results of Operations (consolidated)The business environment facing the pharmaceutical industry in Japan
remained difficult during the term under review. An unavoidable drag on our
performance was strengthened government measures to curb medical costs into
the long term, amid debate over the need to reform the national health
insurance system in Japan in the face of increasing social welfare funding
problems as the population grows older and the birth rate declines.
The food sector also continues to face a difficult operating environment,
with consumption anemic and raw-material prices rising, but one bright spot is
growth in ingredients for functional foods amid rising health-awareness among
the Japanese people.
Against this backdrop, and despite the best efforts of the Company, sales
declined 0.6% year-on-year to ¥53,947 million (US$xx million), reflecting a
decrease in sales of anti-allergy agents after the pollen count in Japan fell well
short of the previous term’s level. Operating income declined 44.1% year-on-
year to ¥2,586 million (US$xx million), as efforts to reduce selling, general and
administrative expenses were outweighed by a substantial increase in research
and development costs. Net income declined a 71.4% year-on-year to ¥1,612
million (US$xx million), due to a steep fall in extraordinary gains: in the
previous term, extraordinary gains totaled ¥5,151 million deriving from the
settlement of pension fund operations on behalf of the government, and
proceeds mainly from the sale land, but in the reporting term, they only totaled
¥292 million, in proceeds from the sale of land.
Earnings by SegmentPharmaceutical business
In the pharmaceutical business, growth was recorded in mainstay products, such
as the overactive bladder agent Bladderon®, the nonsteroidal anti-inflammatory
analgesic Hypen®, the acute promyelocytic leukemia treatment Trisenox®, the
azulene gargle Azunol Gargle® and Gaslon N®, a remedy for gastric ulcer and
gastritis. But sales were anemic for antiallergy Livostin® eye-drops and nose-drops,
the benign prostatic hyperplasia agent Eviprostat™, the antirheumatic agent
Orcl®, and the hypertension and angina agent Selectol®. Against this backdrop,
we launched the new products Iodinecort ointment for treatment of decubital
ulcers and Amnolake®, a treatment for refractory/relapsed acute promyelocytic
leukemia.
In other businesses, although revenue from intellectual property-rights
declined substantially, we recorded strong growth in sales of the synthetic
antibacterial Prulifloxacin®. As a result of the above, sales declined 1.4% year-on-
year to ¥44,406 million.
Food business
Sales in the food business rose 3.5% year-on-year to ¥9,541 million. Health food
ingredients posted lackluster sales amid ongoing weakness in consumption and
rising raw-material costs, but effective marketing campaigns and a strengthened
lineup boosted sales of protein products.
Consolidated Selling, general and administrative expenses(Millions of yen)
2004 2005 2006
26,38527,992
26,390
Consolidated OperatingIncome(Millions of yen)
2004 2005 2006
4,622
2,586
3,475
Consolidated Sales by Industry Segment(Millions of yen)
2004 2005 2006
54,25251,326
PharmaceuticalsFoodstuffs
9,2158,894
45,037
53,9479,541
44,40642,432

20
Thousands of Millions of yen U.S. dollars (Note 1)
March 31, 2006 and 2005 2006 2005 2006
AssetsCurrent assets:
Cash and cash equivalents ............................................................. ¥ 13,753 ¥15,951 $117,547
Time deposits ................................................................................. 120 100 1,026
Marketable securities (Note 3) ........................................................ 500 800 4,274
Notes and accounts receivable:
Trade notes ................................................................................. 280 1,088 2,393
Trade accounts ........................................................................... 24,566 24,693 209,966
Other ........................................................................................... 306 133 2,615
Total notes and accounts receivable ................................... 25,152 25,914 214,974
Inventories (Note 4) ....................................................................... 9,211 8,496 78,726
Deferred tax assets (Note 10) .......................................................... 1,620 1,646 13,846
Other current assets ........................................................................ 1,074 2,116 9,180
Total current assets .............................................................. 51,430 55,023 439,573
Property, plant and equipment (Note 5):
Land ................................................................................................ 8,237 8,351 70,402
Buildings and structures ................................................................. 25,094 25,290 214,479
Machinery and equipment ............................................................ 11,454 11,414 97,897
Tools, furniture and fixtures .......................................................... 9,106 9,541 77,829
Construction in progress ................................................................ 39 7 333
Total ...................................................................................... 53,930 54,603 460,940
Accumulated depreciation ............................................................. (32,515) (32,272) (277,906)
Net property, plant and equipment ................................... 21,415 22,331 183,034
Investments and other assets:
Investment securities (Note 3) ....................................................... 26,406 15,316 225,692
Long-term prepaid expenses ........................................................... 2,825 3,041 24,145
Deferred tax assets (Note 10) .......................................................... 45 61 385
Other assets .................................................................................... 2,778 3,138 23,744
Total investments and other assets .................................... 32,054 21,556 273,966
Total ................................................................................................... ¥104,899 ¥98,910 $896,573
See notes to consolidated financial statements.
Consolidated Balance SheetsNIPPON SHINYAKU CO., LTD. and Consolidated Subsidiaries

21
Thousands of Millions of yen U.S. dollars (Note 1)
2006 2005 2006
Liabilities and Shareholders’ Equity
Current liabilities:
Short-term borrowings (Note 5) ..................................................... ¥ 30 ¥ 50 $ 256
Current portion of long-term debt (Note 5) .................................. 1,247 1,299 10,658
Notes and accounts payable:
Trade notes ................................................................................. 735 446 6,282
Trade accounts ........................................................................... 3,341 3,252 28,555
Other payables ........................................................................... 661 3,045 5,650
Total notes and accounts payable ...................................... 4,737 6,743 40,487
Income taxes payable ..................................................................... 404 1,174 3,453
Accrued expenses ............................................................................ 5,429 3,455 46,402
Deposits from customers ................................................................ 272 270 2,325
Other current liabilities .................................................................. 558 551 4,769
Total current liabilities ........................................................ 12,677 13,542 108,350
Long-term liabilities:
Long-term debt (Note 5) ................................................................. 2,424 3,671 20,718
Liability for retirement benefits (Note 6) ....................................... 9,980 11,199 85,299
Negative goodwill ........................................................................... 3 3 26
Deferred tax liability (Note 10) ...................................................... 3,950 182 33,761
Other long-term liabilities .............................................................. 316 174 2,701
Total long-term liabilities ................................................... 16,673 15,229 142,505
Minority interests .............................................................................. 137 129 1,171
Contingent liabilities (Note 11)
Shareholders’ equity (Notes 7 and 14):Common stock, authorized, 200,000,000 shares; issued 70,251,484 shares ... 5,174 5,174 44,222
Capital surplus................................................................................. 4,440 4,439 37,949
Retained earnings ........................................................................... 57,027 56,515 487,410
Unrealized gain on available-for-sale securities ............................. 10,148 5,218 86,735
Foreign currency translation adjustments ..................................... (1) (11) (9)
Treasury stock – at cost, 2,088,792 shares in 2006
and 2,034,407 shares in 2005........................................................ (1,376) (1,325) (11,760)
Total shareholders’ equity ................................................... 75,412 70,010 644,547
Total .................................................................................................... ¥104,899 ¥98,910 $896,573

22
Thousands of Millions of yen U.S. dollars (Note 1)
Years ended March 31, 2006 and 2005 2006 2005 2006
Net sales (Note 15) ............................................................................. ¥53,947 ¥54,252 $461,086
Cost and expenses (Note 15):
Cost of sales .................................................................................... 23,369 23,245 199,735
Selling, general and administrative expenses (Note 8) ...................... 27,992 26,385 239,248
Total ........................................................................................... 51,361 49,630 438,983
Operating income (Note 15) .................................................... 2,586 4,622 22,103
Other income (expenses):
Interest and dividend income ........................................................ 235 200 2,008
Interest expenses ............................................................................ (57) (90) (487)
Gain on sales of property, plant and equipment ........................... 292 1,370 2,496
Gain on transfer of the substitutional portion of the
governmental pension program .................................................. 3,781
Other – net ..................................................................................... 229 (253) 1,957
Other income – net .................................................................. 699 5,008 5,974
Income before income taxes and minority interests...................... 3,285 9,630 28,077
Income taxes (Note 10):
Current ........................................................................................... 1,279 2,013 10,932
Deferred ........................................................................................... 386 1,990 3,299
Total ........................................................................................... 1,665 4,003 14,231
Minority interests in net income (loss) ........................................... 8 (12) 68
Net income ........................................................................................ ¥ 1,612 ¥ 5,639 $ 13,778
Yen U.S. dollars
Amounts per common share (Notes 2.o and 13):
Basic net income ............................................................................ ¥22.84 ¥81.22 $ 0.20
Cash dividends applicable to the year ........................................... 10.00 15.00 0.09
See notes to consolidated financial statements.
Consolidated Statements of IncomeNIPPON SHINYAKU CO., LTD. and Consolidated Subsidiaries

23
Thousands Millions of yen
Outstanding Unrealized Foreignnumber of gain on currencyshares of Common Capital Retained available-for-sale translation Treasury
Years ended March 31, 2006 and 2005 common stock stock surplus earnings securities adjustments stock
Balance at April 1, 2004 ..................................... 68,793 ¥5,174 ¥4,439 ¥51,621 ¥ 5,049 ¥ (9) ¥ (878)
Net income ...................................................... 5,639
Cash dividends, ¥15.00 per share ................... (687)
Bonuses to directors and corporate auditors .... (58)
Net increase in unrealized gain
on available-for-sale securities ........................ 169
Net decrease in foreign currency
translation adjustments ................................. (2)
Repurchase of treasury stock ............................ (579) (450)
Disposal of treasury stock ................................. 3 3
Balance at March 31, 2005 ................................ 68,217 5,174 4,439 56,515 5,218 (11) (1,325)
Net income ...................................................... 1,612
Cash dividends, ¥10.00 per share ................... (1,023)
Bonuses to directors and corporate auditors .... (77)
Net increase in unrealized gain
on available-for-sale securities ........................ 4,930
Net increase in foreign currency
translation adjustments ................................. 10
Repurchase of treasury stock ............................ (59) (54)
Disposal of treasury stock ................................. 5 1 3
Balance at March 31, 2006 ................................ 68,163 ¥5,174 ¥4,440 ¥57,027 ¥10,148 ¥ (1) ¥(1,376)
Thousands of U.S. dollars (Note 1)
Unrealized Foreigngain on currency
Common Capital Retained available-for-sale translation Treasurystock surplus earnings securities adjustments stock
Balance at March 31, 2005 ................................ $44,222 $37,940 $483,034 $44,598 $(94) $(11,325)
Net income ...................................................... 13,778
Cash dividends, $0.09 per share ...................... (8,744)
Bonuses to directors and corporate auditors .... (658)
Net increase in unrealized gain on
available-for-sale securities.............................. 42,137
Net increase in foreign currency
translation adjustments ................................. 85
Repurchase of treasury stock ............................ (461)
Disposal of treasury stock ................................. 9 26
Balance at March 31, 2006 ................................ $44,222 $37,949 $487,410 $86,735 $ (9) $(11,760)
See notes to consolidated financial statements.
Consolidated Statements of Shareholders’ EquityNIPPON SHINYAKU CO., LTD. and Consolidated Subsidiaries

24
Thousands of Millions of yen U.S. dollars (Note 1)
Years ended March 31, 2006 and 2005 2006 2005 2006
Operating activities:
Income before income taxes and minority interests .......................... ¥ 3,285 ¥ 9,630 $ 28,077
Adjustments for:Income taxes – paid......................................................................... (2,001) (2,243) (17,103)Depreciation and amortization ...................................................... 2,692 3,016 23,009Gain on sales of property, plant and equipment............................ (292) (1,370) (2,496)Changes in assets and liabilities:
Decrease (increase) in notes and accounts receivable ................ 762 (2,126) 6,513(Increase) decrease in inventories .............................................. (715) 428 (6,111)Decrease (increase) in other current assets ................................ 1,039 (799) 8,880Increase in notes and accounts payable .................................... 378 292 3,231Increase (decrease) in other current liabilities ........................... 7 (46) 60Decrease in liability for retirement benefits .............................. (1,219) (5,159) (10,419)
Other – net ..................................................................................... (533) 1,185 (4,556)
Total adjustments ................................................................ 118 (6,822) 1,008
Net cash provided by operating activities .............................. 3,403 2,808 29,085
Investing activities:Proceeds from sales of property, plant and equipment ................. 344 1,569 2,940Proceeds from redemption of marketable securities ...................... 800 2,300 6,838Capital expenditures ...................................................................... (885) (2,384) (7,564)Purchases of investment securities ................................................. (3,434) (1,710) (29,350)Purchases of software ..................................................................... (64) (110) (547)Acquisition of the license rights ..................................................... (242) (265) (2,068)Other – net ..................................................................................... 151 91 1,290
Net cash used in investing activities .................................. (3,330) (509) (28,461)
Financing activities:Net decrease in short-term bank loans .......................................... (20) (3,980) (171)Proceeds from long-term bank loans ............................................. 20Repayments of long-term debt ....................................................... (1,298) (1,297) (11,094)Cash dividends paid ....................................................................... (1,023) (689) (8,744)Increase of treasury stock ............................................................... (50) (448) (427)Other – net ...................................................................................... (1) (8)
Net cash used in financing activities ..................................... (2,392) (6,394) (20,444)
Foreign currency translation adjustments on cash and cash equivalents ........................................................ 121 14 1,034
Net decrease in cash and cash equivalents ..................................... (2,198) (4,081) (18,786)Cash and cash equivalents, beginning of year .............................. 15,951 20,032 136,333
Cash and cash equivalents, end of year .......................................... ¥13,753 ¥15,951 $117,547
See notes to consolidated financial statements.
Consolidated Statements of Cash FlowsNIPPON SHINYAKU CO., LTD. and Consolidated Subsidiaries

25
1. BASIS OF PRESENTING THECONSOLIDATED FINANCIAL STATEMENTS
The accompanying consolidated financial statements have
been prepared in accordance with the provisions set forth in
the Japanese Securities and Exchange Law and its related
accounting regulations, and in conformity with accounting
principles generally accepted in Japan, which are different in
certain respects as to application and disclosure requirements
of International Financial Reporting Standards.
In preparing these consolidated financial statements,
certain reclassifications and rearrangements have been made
to the consolidated financial statements issued domestically in
order to present them in a form which is more familiar to
readers outside Japan.
The consolidated financial statements are stated in
Japanese yen, the currency of the country in which Nippon
Shinyaku Co., Ltd. (the “Company”) is incorporated and
operates. The translations of Japanese yen amounts into U.S.
dollar amounts are included solely for the convenience of
readers outside Japan and have been made at the rate of ¥117
to $1, the approximate rate of exchange at March 31, 2006.
Such translations should not be construed as representations
that the Japanese yen amounts could be converted into U.S.
dollars at that or any other rate.
2. SUMMARY OF SIGNIFICANT ACCOUNTINGPOLICIES
a. Consolidation — The consolidated financial statements
include the accounts of the Company and its significant
two domestic and one overseas subsidiaries (together, the
“Companies”). Consolidation of the remaining
subsidiary would not have a material effect on the
accompanying consolidated financial statements.
Under the control or influence concept, those
companies in which the Company, directly or indirectly,
is able to exercise control over operations are fully
consolidated, and those companies over which the
Companies have the ability to exercise significant
influence are accounted for by the equity method.
Investment in one unconsolidated subsidiary is stated
at cost. If the equity method of accounting had been
applied to the investment in this company, the effect on
the accompanying consolidated financial statements
would not be material.
The difference between the cost of an acquisition and
the fair value of the net assets of the acquired subsidiary
at the date of acquisition is reported as negative goodwill
in the accompanying consolidated balance sheets and is
being amortized over a period of five years.
All significant intercompany balances and
transactions have been eliminated in consolidation. All
material unrealized profit included in assets resulting
from transactions within the Companies is eliminated.
b. Cash Equivalents — Cash equivalents are short-term
investments that are readily convertible into cash and
that are exposed to insignificant risk of changes in value.
Cash equivalents include time deposits and short-term
investments, all of which mature or become due within
three months of the date of acquisition.
c. Marketable and Investment Securities — Marketable
and investment securities are classified and accounted
for, depending on management’s intent, as follows:
i) held-to-maturity debt securities, which management
has the positive intent and ability to hold to maturity,
are reported at amortized cost; and ii) available-for-sale
securities, which are not classified as held-to-maturity
securities and are reported at fair value, with unrealized
gains and losses, net of applicable taxes, reported as a
separate component of shareholders’ equity. Realized
gains and losses on available-for-sale securities are
included in earnings and are calculated by using the
moving-average method to determine the cost of
securities sold. All other securities are stated at cost, cost
being determined principally by the moving-average
method. Write-downs are recorded in earnings for
securities with a significant decline in value that is
considered to be other than temporary.
d. Inventories — Inventories are stated principally at cost
determined by the average method.
e. Property, Plant and Equipment — Property, plant and
equipment are stated at cost. Depreciation is principally
computed by the declining-balance method while the
straight-line method is applied to buildings acquired
after April 1, 1998. The range of useful lives is principally
from 15 to 50 years for buildings and structures, from
seven to nine years for machinery and equipment, and
from four to six years for tools, furniture and fixtures.
f. Long-lived Assets — In August 2002, the Business
Accounting Council (BAC) issued a Statement of Opinion,
Accounting for Impairment of Fixed Assets, and in October
2003 the Accounting Standards Board of Japan (ASBJ)
issued ASBJ Guidance No.6, Guidance for Accounting
Standard for Impairment of Fixed Assets. These new
pronouncements were effective for fiscal years beginning
on or after April 1, 2005 with early adoption permitted for
fiscal years ending on or after March 31, 2004.
Notes to Consolidated Financial StatementsYears ended March 31, 2006 and 2005 NIPPON SHINYAKU CO., LTD. and Consolidated Subsidiaries
26
The Companies adopted the new accounting standard
for impairment of fixed assets as of April 1, 2005.
The Companies review their long-lived assets for
impairment whenever events or changes in circumstance
indicate the carrying amount of an asset or asset group
may not be recoverable. An impairment loss would be
recognized if the carrying amount of an asset or asset
group exceeds the sum of the undiscounted future cash
flows expected to result from the continued use and
eventual disposition of the asset or asset group. The
impairment loss would be measured as the amount by
which the carrying amount of the asset exceeds its
recoverable amount, which is the higher of the
discounted cash flows from the continued use and
eventual disposition of the asset or the net selling price
at disposition.
The adoption of this new accounting standard for
impairment of fix assets had no impact on the financial
position or results of operations of the Companies.
g. Retirement and Pension Plans — The Company has a
cash balance pension plan, under which each participant
has an account on which a fixed amount is contributed
and interest added which is calculated yearly based on a
market-related interest rate with a certain minimum
interest rate secured. The Company also has an unfunded
retirement benefit plan for employees and a defined
contribution pension plan to allow qualified persons
aged from 60 to 64 to receive post retirement benefits at
their discretion. Consolidated domestic subsidiaries have
unfunded retirement benefit plans.
The transitional credit of ¥845 million determined as
of April 1, 2000 was amortized over five years.
Previously, retirement benefits for directors and
corporate auditors were introduced and were provided at
the amount which would be required if such individuals
were to retire at the balance sheet date. The Company
and a consolidated subsidiary abolished the above
retirement benefits plan. Resolution to pay the amount
accumulated until the termination of the plan upon
retirement of each individual was approved at the
general shareholders’ meetings. The total amount
payable of ¥142 million ($1,214 thousand) is recorded as
other long-term liabilities at March 31, 2006.
The liability for retirement benefits at March 31, 2005
included ¥304 million for directors’ and corporate
auditors’ retirement benefits.
h. Allowance for Doubtful Accounts — The allowance for
doubtful accounts is stated at an amount considered to
be appropriate based on the Companies’ past credit loss
experience and an evaluation of potential losses in the
receivables outstanding.
i. Leases — All leases, except those of the overseas
subsidiary, are accounted for as operating leases. Under
Japanese accounting standards for leases, finance leases
that deem to transfer ownership of the leased property to
the lessee are to be capitalized, while other finance leases
are permitted to be accounted for as operating lease
transactions if certain “as if capitalized” information is
disclosed in the notes to the lessee’s consolidated
financial statements.
j. Income Taxes — The provision for income taxes is
computed based on the pretax income included in the
consolidated statements of income. The asset and
liability approach is used to recognize deferred tax assets
and liabilities for the expected future tax consequences of
temporary differences between the carrying amounts and
the tax bases of assets and liabilities. Deferred taxes are
measured by applying currently enacted tax laws to the
temporary differences.
k. Appropriations of Retained Earnings — Appropriations
of retained earnings are reflected in the consolidated
financial statements for the following year upon
shareholders’ approval.
l. Foreign Currency Transactions — All short-term and
long-term monetary receivables and payables
denominated in foreign currencies are translated into
Japanese yen at the exchange rates at the balance sheet
date. The foreign exchange gains and losses from
translation are recognized in the statement of income to
the extent that they are not hedged by forward exchange
contracts.
m.Foreign Currency Financial Statements — The balance
sheet accounts and revenue and expense accounts of the
consolidated overseas subsidiary are translated into
Japanese yen at the current exchange rates as of the
balance sheet date except for shareholders’ equity, which
is translated at historical rates. Differences arising from
such translation were shown as “Foreign currency
translation adjustments” as a separate component of
shareholders’ equity.
n. Derivative Financial Instruments — The Company uses
foreign currency forward contracts as a means of hedging
exposure to foreign currency risks related to the
procurement of merchandise from overseas suppliers.
The Company does not enter into derivatives for trading
or speculative purposes. All derivative financial
instruments are used for hedging purposes that qualify
for hedge accounting because of high correlation and

27
effectiveness between the hedging instruments and the
hedged items, which are deferred until maturity of the
hedged transactions.
o. Per Share Information — Basic net income per share is
computed by dividing net income available to common
shareholders by the weighted-average number of
common shares outstanding for the period.
Cash dividends per share presented in the
accompanying consolidated statements of income are
dividends applicable to the respective years including
dividends to be paid after the end of the year.
p. New Accounting Pronouncements —
Business Combination and Business Separation
In October 2003, the Business Accounting Council (BAC)
issued a Statement of Opinion, Accounting for Business
Combinations, and on December 27, 2005 the Accounting
Standards Board of Japan (ASBJ) issued Accounting Standard
for Business Separations and ASBJ Guidance No. 10,
Guidance for Accounting Standard for Business Combinations
and Business Separations. These new accounting
pronouncements are effective for fiscal years beginning on
or after April 1, 2006.
The accounting standard for business combinations
allows companies to apply the pooling of interests
method of accounting only when certain specific criteria
are met such that the business combination is essentially
regarded as a uniting-of-interests. These specific criteria
are as follows:
(a) the consideration for the business combination
consists solely of common shares with voting rights,
(b) the ratio of voting rights of each predecessor
shareholder group after the business combination is
nearly equal, and
(c) there are no other factors that would indicate any
control exerted by any shareholder group other than
voting rights.
For business combinations that do not meet the uniting-
of-interests criteria, the business combination is
considered to be an acquisition and the purchase method
of accounting is required. This standard also prescribes
the accounting for combinations of entities under
common control and for joint ventures. Goodwill,
including negative goodwill, is to be systematically
amortized over 20 years or less, but is also subject to an
impairment test.
Under the accounting standard for business
separations, in a business separation where the interests
of the investor no longer continue and the investment is
settled, the difference between the fair value of the
consideration received for the transferred business and
the book value of net assets transferred to the separated
business is recognized as a gain or loss on business
separation in the statement of income. In a business
separation where the interests of the investor continue
and the investment is not settled, no such gain or loss on
business separation is recognized.
Stock options
On December 27, 2005, the ASBJ issued Accounting
Standard for Stock Options and related guidance. The new
standard and guidance are applicable to stock options
newly granted on and after May 1, 2006.
This standard requires companies to recognize
compensation expense for employee stock options based
on the fair value at the date of grant and over the vesting
period as consideration for receiving goods or services.
The standard also requires companies to account for
stock options granted to non-employees based on the fair
value of either the stock option or the goods or services
received. In the balance sheet, the stock option is
presented as a stock acquisition right as a separate
component of shareholders’ equity until exercised. The
standard covers equity-settled, share-based payment
transactions, but does not cover cash-settled, share-based
payment transactions. In addition, the standard allows
unlisted companies to measure options at their intrinsic
value if they cannot reliably estimate fair value.
Bonuses to directors and corporate auditors
Prior to the fiscal year ended March 31, 2005, bonuses to
directors and corporate auditors were accounted for as a
reduction of retained earnings in the fiscal year following
approval at the general shareholders meeting. The ASBJ
issued ASBJ Practical Issues Task Force (PITF) No. 13,
“Accounting Treatment for Bonuses to Directors and
Corporate Auditors,” which encouraged companies to
record bonuses to directors and corporate auditors on the
accrual basis with a related charge to income, but still
permitted the direct reduction of such bonuses from
retained earnings after approval of the appropriation of
retained earnings.
The ASBJ replaced the above accounting
pronouncement by issuing a new accounting standard
for bonuses to directors and corporate auditors on
November 29, 2005. Under the new accounting standard,
bonuses to directors and corporate auditors must be
expensed and are no longer allowed to be directly
charged to retained earnings. This accounting standard is
effective for fiscal years ending on or after May 1, 2006.

28
The companies must accrue bonuses to directors and
corporate auditors at the year end to which such bonuses
are attributable.
3. MARKETABLE AND INVESTMENTSECURITIES
Marketable and investment securities as of March 31, 2006
and 2005 consisted of the following:
Thousands ofMillions of yen U.S. dollars
March 31 2006 2005 2006
Current:
Government and corporate bonds ................... ¥ 500 ¥ 800 $ 4,274
Non-current:
Equity securities...................... ¥22,913 ¥12,517 $195,837
Government and corporate bonds ................... 2,696 2,700 23,043
Trust fund investments.......... 797 99 6,812
Total.................................... ¥26,406 ¥15,316 $225,692
Information regarding each category of securities classified as
available-for-sale and held-to-maturity at March 31, 2006 and
2005 were as follows:
Millions of yen
Unrealized Unrealized FairMarch 31, 2006 Cost gain loss value
Securities classified as:
Available-for-sale:
Equity securities ...... ¥5,318 ¥17,207 ¥22,525
Government and
corporate bonds .... 100 ¥ 3 97
Trust fund
investments ........... 801 4 797
Held-to-maturity ......... 3,099 35 3,064
Millions of yen
Unrealized Unrealized FairMarch 31, 2005 Cost gain loss value
Securities classified as:
Available-for-sale:
Equity securities ...... ¥3,290 ¥8,845 ¥12,135
Trust fund
investments ........... 100 ¥1 99
Held-to-maturity ......... 3,500 7 3,507
Thousands of U.S. dollars
Unrealized Unrealized FairMarch 31, 2006 Cost gain loss value
Securities classified as:
Available-for-sale:
Equity securities ...... $45,453 $147,068 $192,521
Government and
corporate bonds ..... 855 $ 26 849
Trust fund
investments ........... 6,846 34 6,812
Held-to-maturity ......... 26,487 299 26,188
Available-for-sale securities whose fair value is not readily
determinable as of March 31, 2006 and 2005 were as follows:
Carrying amount
Thousands ofMillions of yen U.S. dollars
March 31 2006 2005 2006
Available-for-sale:
Equity securities ..................... ¥388 ¥382 $3,316
Proceeds from sales of available-for-sale securities for the year
ended March 31, 2006 was ¥13 million ($111 thousand).
Gross realized gains on these sales, computed on the moving
average cost basis, was ¥5 million ($43 thousand) for the year
ended March 31, 2006.
The Companies disposed of corporate bonds which were
classified as held-to-maturity for the year ended March 31, 2006.
The management decided to dispose of these corporate bonds
because the rating of the bond issuer was lowered.
Proceeds from this sale of held-to-maturity debt securities
and realized loss on this sale were ¥188 million ($1,607
thousand) and ¥12 million ($103 thousand) for the year
ended March 31, 2006, respectively.
The carrying values of debt securities by contractual
maturities for securities classified as available-for-sale and
held-to-maturity at March 31, 2006 are as follows:
Thousands ofMillions of yen U.S. dollars
Available Held to Available Held toMarch 31, 2006 for Sale Maturity for Sale Maturity
Due in one year or less...... ¥ 500 $ 4,274
Due after one year
through five years......... ¥296 2,600 $2,530 22,222
Total ............................ ¥296 ¥3,100 $2,530 $26,496

29
4. INVENTORIES
Inventories at March 31, 2006 and 2005 consisted of the
following:
Thousands ofMillions of yen U.S. dollars
March 31 2006 2005 2006
Finished products and merchandise............................. ¥4,850 ¥4,081 $41,453
Work in process ......................... 1,533 1,951 13,102
Raw materials............................. 2,828 2,464 24,171
Total.................................... ¥9,211 ¥8,496 $78,726
5. SHORT-TERM BORROWINGS AND LONG-TERM DEBT
Short-term borrowings consisted of bank overdrafts, due
within one year.
The weighted average annual interest rate for short-term
bank loans at March 31, 2006 and 2005 was 0.8%.
Short-term borrowings at March 31, 2006 and 2005
consisted of the following:
Thousands ofMillions of yen U.S. dollars
March 31 2006 2005 2006
Loans from banks,
0.8% (2006 and 2005) ............. ¥30 ¥50 $256
Long-term debt at March 31, 2006 and 2005 consisted of the
following:
Thousands ofMillions of yen U.S. dollars
March 31 2006 2005 2006
Loan from financial institutions, 0.86% to 2.3% (2006 and 2005), due November 2012 ................... ¥3,670 ¥4,968 $31,368
Capital lease obligations ................ 1 2 8
Total.................................... 3,671 4,970 31,376
Less current portion................... (1,247) (1,299) (10,658)
Long-term debt, less current portion ..................................... ¥2,424 ¥3,671 $20,718
Annual maturities of long-term debt at March 31, 2006 were
as follows:
Thousands ofYear ending March 31 Millions of yen U.S. dollars
2007 ........................................... ¥1,247 $10,658
2008 ........................................... 1,202 10,274
2009 ........................................... 1,163 9,940
2010 ........................................... 31 265
2011 ........................................... 10 85
2012 and thereafter ................... 18 154
Total.................................... ¥3,671 $31,376
At March 31, 2006, the following assets were pledged as
collateral for certain short-term borrowings and long-term
debt (including current portion):
Thousands ofMillions of yen U.S. dollars
Property, plant and equipment, net of accumulated depreciation................................. ¥5,619 $48,026
Related liabilities:
Short-term borrowings............... ¥ 30 $ 256
Current portion of long-term debt .......................................... ¥1,088 $ 9,299
Long-term debt (excluding current portion) ....................... ¥2,127 $18,179
6. RETIREMENT BENEFITS
Employees of the Company and domestic subsidiaries
terminating their employment are entitled to lump-sum
severance payments based on the rate of pay at the time of
termination, length of service and certain other factors. If the
termination is involuntary or caused by death, the employees
are entitled to greater payments than in the case of voluntary
termination.
The Company had contributory trusteed pension plan
which funds a portion of the Company’s retirement benefits.
The contributory funded defined benefit pension plan, which
was established under the Japanese Welfare Pension Insurance
Law, covered a substitutional portion of the governmental
pension program managed by the Company on behalf of the
government and a corporate portion established at the
discretion of the Company.
In accordance with the Defined Benefit Pension Plan Law
enacted in April 2002, the Company applied for transfer of the
substitutional portion of past pension obligations to the
government and obtained approval by the Ministry of Health,
Labor and Welfare on April 1, 2004. Based upon the above

30
approval in April 2004, the Company recognized a gain on
transfer of the substitutional portion of the governmental
pension program in the amount of ¥3,769 million for the year
ended March 31, 2005.
The Company thereafter transferred the substitutional
portion of the pension obligations and related assets to the
government on August 27, 2004 and recognized ¥12 million
as income for the difference between the balance of the
retirement benefit liabilities brought forward and the amount
actually transferred for the year ended March 31, 2005.
The liability for employees’ retirement benefits at March
31, 2006 and 2005 consisted of the following:
Thousands ofMillions of yen U.S. dollars
March 31 2006 2005 2006
Projected benefit obligation... ¥25,524 ¥25,867 $218,154
Fair value of plan assets ......... (10,238) (8,196) (87,504)
Unrecognized actuarial loss ... (4,743) (6,168) (40,539)Unrecognized prior service cost............................. (563) (608) (4,812)
Net liability ............................ ¥ 9,980 ¥10,895 $ 85,299
The components of net periodic benefit costs for the years
ended March 31, 2006 and 2005 are as follows:
Thousands ofMillions of yen U.S. dollars
March 31 2006 2005 2006
Service cost................................. ¥ 938 ¥ 932 $ 8,017
Interest cost................................ 514 504 4,393
Expected return on plan assets ........................................ (326) (356) (2,786)
Amortization of transitional credit ........................................ (525)
Recognized actuarial loss ........... 482 436 4,119
Amortization of prior service cost ............................... 45 45 385
Premiums for defined contribution pension plan and other ......................... 54 165 462
Net periodic benefit costs ...... 1,707 1,201 14,590
Gain on transfer of the substitutional portion of thegovernmental pensionprogram.................................... (3,781)
Total ....................................... ¥1,707 ¥(2,580) $14,590
Assumptions used for the years ended March 31, 2006 and
2005 are set forth as follows:
2006 2005
Discount rate.................................... 2.0% 2.0%
Expected rate of return on plan assets... 4.0% 4.0%
Recognition period of
actuarial gain / loss ........................ 15 years 15 years
Amortization period of
transitional credit .......................... 5 years
Amortization period of
prior service cost ........................... 15 years 15 years
7. SHAREHOLDERS’ EQUITY
Through May 1, 2006, Japanese companies are subject to
the Commercial Code of Japan (the “Code”).
The Code requires that all shares of common stock be
issued with no par value and at least 50% of the issue price of
new shares is required to be recorded as common stock and
the remaining net proceeds are required to be presented as
additional paid-in capital, which is included in capital surplus.
The Code permits Japanese companies, upon approval of the
Board of Directors, to issue shares to existing shareholders
without consideration by way of a stock split. Such issuance of
shares generally does not give rise to changes within the
shareholders’ accounts.
The Code also provides that an amount of 10% or more of
the aggregate amount of cash dividends and certain other
appropriations of retained earnings associated with cash
outlays applicable to each period (such as bonuses to directors)
shall be appropriated as a legal reserve (a component of
retained earnings) until the total of such reserve and additional
paid-in capital equals 25% of common stock. The amount of
total legal reserve and additional paid-in capital that exceeds
25% of the common stock may be available for dividends by
resolution of the shareholders after transferring such excess in
accordance with the Code. In addition, the Code permits the
transfer of a portion of additional paid-in capital and legal
reserve to the common stock by resolution of the Board of
Directors.
The Code allows Japanese companies to purchase treasury
stock and dispose of such treasury stock upon resolution of the
Board of Directors. The aggregate purchased amount of treasury
stock cannot exceed the amount available for future dividends
plus the amount of common stock, additional paid-in capital or
legal reserve that could be transferred to retained earnings or
other capital surplus other than additional paid-in capital upon
approval of such transfer at the annual general meeting of
shareholders.
In addition to the provision that requires an appropriation

31
for a legal reserve in connection with the cash outlays, the
Code also imposes certain limitations on the amount of
capital surplus and retained earnings available for dividends.
The amount of capital surplus and retained earnings available
for dividends under the Code was ¥52,428 million ($448,103
thousand) as of March 31, 2006, based on the amount
recorded in the parent company’s general books of account.
Dividends are approved by the shareholders at a meeting
held subsequent to the end of the fiscal year to which the
dividends are applicable. Semiannual interim dividends may
also be paid upon resolution of the Board of Directors, subject
to certain limitations imposed by the Code.
On May 1, 2006, a new corporate law (the “Corporate Law”)
became effective, which reformed and replaced the Code with
various revisions that would, for the most part, be applicable to
events or transactions which occur on or after May 1, 2006 and
for the fiscal years ending on or after May 1, 2006. The
significant changes in the Corporate Law that affect financial
and accounting matters are summarized below;
(a) Dividends
Under the Corporate Law, companies can pay dividends at
any time during the fiscal year in addition to the year-end
dividend upon resolution at the shareholders meeting. For
companies that meet certain criteria such as;
(1) having the Board of Directors, (2) having independent
auditors, (3) having the Board of Corporate Auditors, and (4)
the term of service of the directors is prescribed as one year
rather than two years of normal term by its articles of
incorporation, the Board of Directors may declare dividends
(except for dividends in kind) if the company has prescribed
so in its articles of incorporation.
The Corporate Law permits companies to distribute
dividends-in-kind (non-cash assets) to shareholders subject
to a certain limitation and additional requirements.
Semiannual interim dividends may also be paid once a
year upon resolution by the Board of Directors if the articles
of incorporation of the company so stipulate. Under the
Code, certain limitations were imposed on the amount of
capital surplus and retained earnings available for
dividends. The Corporate Law also provides certain
limitations on the amounts available for dividends or the
purchase of treasury stock. The limitation is defined as the
amount available for distribution to the shareholders, but
the amount of net assets after dividends must be
maintained at no less than ¥3 million.
(b) Increases / decreases and transfer of common stock, reserve and
surplus
The Corporate Law requires that an amount equal to 10%
of dividends must be appropriated as a legal reserve (a
component of retained earnings) or as additional paid-in
capital (a component of capital surplus) depending on the
equity account charged upon the payment of such
dividends until the total of aggregate amount of legal
reserve and additional paid-in capital equals 25% of the
common stock. Under the Code, the aggregate amount of
additional paid-in capital and legal reserve that exceeds
25% of the common stock may be made available for
dividends by resolution of the shareholders. Under the
Corporate Law, the total amount of additional paid-in
capital and legal reserve may be reversed without limitation
of such threshold. The Corporate Law also provides that
common stock, legal reserve, additional paid-in capital,
other capital surplus and retained earnings can be
transferred among the accounts under certain conditions
upon resolution of the shareholders.
(c) Treasury stock and treasury stock acquisition rights
The Corporate Law also provides for companies to purchase
treasury stock and dispose of such treasury stock by
resolution of the Board of Directors. The amount of treasury
stock purchased cannot exceed the amount available for
distribution to the shareholders which is determined by
specific formula.
Under the Corporate Law, stock acquisition rights, which
were previously presented as a liability, are now presented as a
separate component of shareholders’ equity.
The Corporate Law also provides that companies can
purchase both treasury stock acquisition rights and treasury
stock. Such treasury stock acquisition rights are presented as
a separate component of shareholders’ equity or deducted
directly from stock acquisition rights.
On December 9, 2005, the Accounting Standards Board
of Japan (ASBJ) published a new accounting standard for
presentation of shareholders’ equity. Under this accounting
standard, certain items which were previously presented as
liabilities are now presented as components of shareholders’
equity. Such items include stock acquisition rights,
minority interest, and any deferred gain or loss on
derivatives accounted for under hedge accounting. This
standard is effective for fiscal years ending on or after May
1, 2006.
8. RESEARCH AND DEVELOPMENT COSTS
Research and development costs for the years ended March 31,
2006 and 2005 were ¥10,071 million ($86,077 thousand) and
¥8,479 million, respectively.
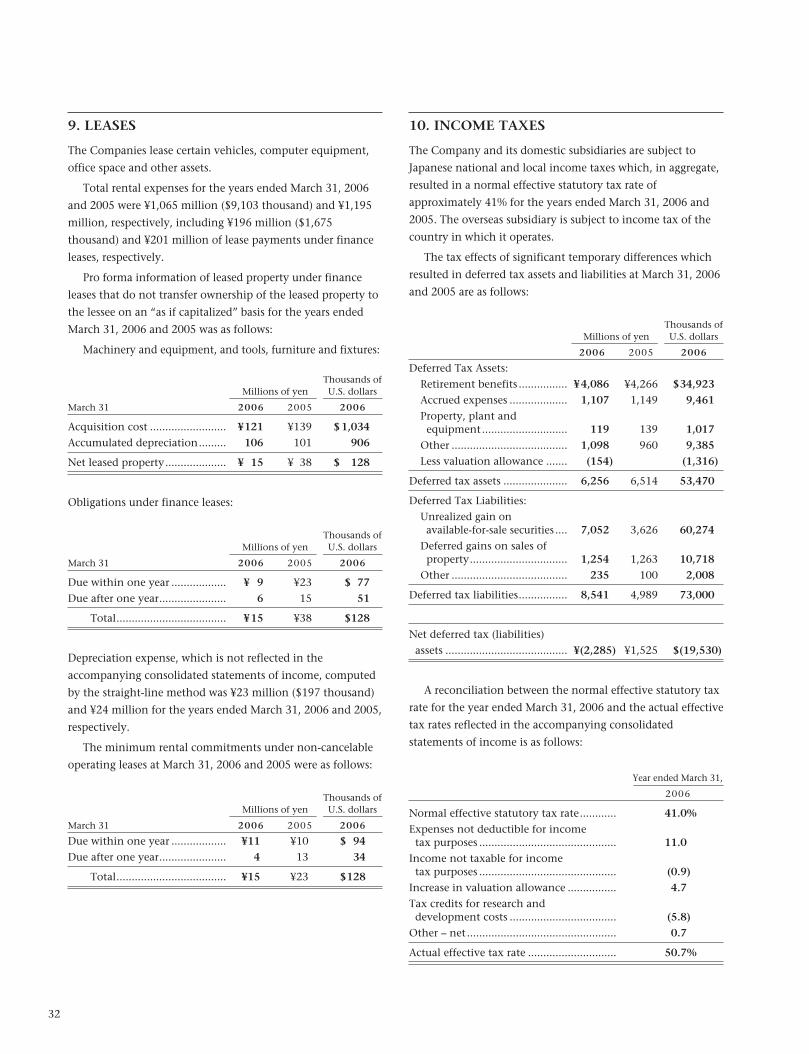
32
9. LEASES
The Companies lease certain vehicles, computer equipment,
office space and other assets.
Total rental expenses for the years ended March 31, 2006
and 2005 were ¥1,065 million ($9,103 thousand) and ¥1,195
million, respectively, including ¥196 million ($1,675
thousand) and ¥201 million of lease payments under finance
leases, respectively.
Pro forma information of leased property under finance
leases that do not transfer ownership of the leased property to
the lessee on an “as if capitalized” basis for the years ended
March 31, 2006 and 2005 was as follows:
Machinery and equipment, and tools, furniture and fixtures:
Thousands ofMillions of yen U.S. dollars
March 31 2006 2005 2006
Acquisition cost ......................... ¥121 ¥139 $1,034
Accumulated depreciation......... 106 101 906
Net leased property.................... ¥ 15 ¥ 38 $ 128
Obligations under finance leases:
Thousands ofMillions of yen U.S. dollars
March 31 2006 2005 2006
Due within one year .................. ¥ 9 ¥23 $ 77
Due after one year...................... 6 15 51
Total.................................... ¥15 ¥38 $128
Depreciation expense, which is not reflected in the
accompanying consolidated statements of income, computed
by the straight-line method was ¥23 million ($197 thousand)
and ¥24 million for the years ended March 31, 2006 and 2005,
respectively.
The minimum rental commitments under non-cancelable
operating leases at March 31, 2006 and 2005 were as follows:
Thousands ofMillions of yen U.S. dollars
March 31 2006 2005 2006
Due within one year .................. ¥11 ¥10 $ 94
Due after one year...................... 4 13 34
Total.................................... ¥15 ¥23 $128
10. INCOME TAXES
The Company and its domestic subsidiaries are subject to
Japanese national and local income taxes which, in aggregate,
resulted in a normal effective statutory tax rate of
approximately 41% for the years ended March 31, 2006 and
2005. The overseas subsidiary is subject to income tax of the
country in which it operates.
The tax effects of significant temporary differences which
resulted in deferred tax assets and liabilities at March 31, 2006
and 2005 are as follows:
Thousands ofMillions of yen U.S. dollars
2006 2005 2006
Deferred Tax Assets:
Retirement benefits ................ ¥4,086 ¥4,266 $34,923
Accrued expenses ................... 1,107 1,149 9,461
Property, plant and equipment............................ 119 139 1,017
Other ...................................... 1,098 960 9,385
Less valuation allowance ....... (154) (1,316)
Deferred tax assets ..................... 6,256 6,514 53,470
Deferred Tax Liabilities:
Unrealized gain on available-for-sale securities .... 7,052 3,626 60,274
Deferred gains on sales of property................................ 1,254 1,263 10,718
Other ...................................... 235 100 2,008
Deferred tax liabilities................ 8,541 4,989 73,000
Net deferred tax (liabilities)
assets ........................................ ¥(2,285) ¥1,525 $(19,530)
A reconciliation between the normal effective statutory tax
rate for the year ended March 31, 2006 and the actual effective
tax rates reflected in the accompanying consolidated
statements of income is as follows:
Year ended March 31,
2006
Normal effective statutory tax rate............ 41.0%
Expenses not deductible for income tax purposes ............................................. 11.0
Income not taxable for income tax purposes ............................................. (0.9)
Increase in valuation allowance ................ 4.7
Tax credits for research and development costs ................................... (5.8)
Other – net ................................................. 0.7
Actual effective tax rate ............................. 50.7%

33
As the difference between the normal effective statutory tax
rate and the actual effective tax rate reflected in the
accompanying consolidated statement of income for the year
ended March 31, 2005 is not more than 5% of the normal
effective statutory tax rate, a reconciliation has not been
disclosed.
11. CONTINGENT LIABILITIES
At March 31, 2006, contingent liabilities were ¥679 million
($5,803 thousand) representing loans guaranteed (jointly
guaranteed with six unrelated companies). There is an
agreement between the seven companies to equally share
liability.
In addition to above, ¥7 million ($60 thousand) of export
bill receivables were discounted with a financial institution for
which the Company is contingently liable at March 31, 2006.
12. DERIVATIVES
The Company has no internal policies which regulate derivative
transactions, since the Company’s derivative transactions are
specific foreign exchange forward contracts. However, it is the
Company’s basic practice not to use derivatives for trading or
speculative purposes. The Company has entered into foreign
exchange forward contracts to hedge foreign exchange risk
specifically associated with imported merchandise, as requested
by customers. Such derivative transactions are entered into to
hedge foreign currency exposures incorporated within the
Company’s business.
Because the counterparties to these derivatives are limited to
major financial institutions, the Company does not anticipate
any losses arising from credit risk.
Forward exchange contracted amounts which are assigned to
associated liabilities and are reflected in the consolidated
balance sheets at year-end are not subject to the disclosure of
market value information.
13. NET INCOME PER SHARE
Net income per share (“EPS”) for the years ended March 31,
2006 and 2005 is as follows:
Yen in Thousands millions of shares Yen Dollars
Net Weightedincome average shares EPS
For the year ended
March 31, 2006:
Basic EPS
Net income available to commonshareholders ........... ¥1,558 68,193 ¥22.84 $0.20
For the year ended
March 31, 2005:
Basic EPS
Net income available to commonshareholders ........... ¥ 5,570 68,583 ¥ 81.22
Diluted net income per share is not disclosed because there are
no dilutive securities outstanding.
14. SUBSEQUENT EVENTS
At the general shareholders’ meeting held on June 29, 2006,
the Company’s shareholders approved the following:
1) Payment of a year-end cash dividend of ¥5.00 ($0.04) per
share to holders of record at March 31, 2006 for a total of
¥341 million ($2,915 thousand).
2) Payment of bonuses to directors and corporate auditors of
¥54 million ($462 thousand).

34
15. SEGMENT INFORMATION
Information about industry segments of the Companies for the years ended March 31, 2006 and 2005 is as follows:
Industry Segments
a. Sales and Operating Income
Millions of yen Thousands of U.S. dollars
2006 2006
Functional Eliminations/ Functional Eliminations/Pharmaceuticals food Corporate Consolidated Pharmaceuticals food Corporate Consolidated
Sales to customers........... ¥44,406 ¥9,541 ¥53,947 $379,539 $81,547 $461,086
Intersegment sales .......... 4 ¥ (4) 34 $(34)
Total sales ................ 44,410 9,541 (4) 53,947 379,573 81,547 (34) 461,086
Operating expenses......... 41,969 9,396 (4) 51,361 358,709 80,308 (34) 438,983
Operating income .......... ¥ 2,441 ¥ 145 ¥Nil ¥ 2,586 $ 20,864 $ 1,239 $ Nil $ 22,103
b. Assets, Depreciation and Capital Expenditures
Millions of yen Thousands of U.S. dollars
2006 2006
Functional Eliminations/ Functional Eliminations/Pharmaceuticals food Corporate Consolidated Pharmaceuticals food Corporate Consolidated
Assets............................... ¥57,845 ¥7,162 ¥39,892 ¥104,899 $494,402 $61,214 $340,957 $896,573
Depreciation ................... 2,487 161 44 2,692 21,257 1,376 376 23,009
Capital expenditures....... 938 246 1,184 8,017 2,103 10,120
a. Sales and Operating Income
Millions of yen
2005
Functional Eliminations/Pharmaceuticals food Corporate Consolidated
Sales to customers........... ¥45,037 ¥9,215 ¥54,252
Intersegment sales .......... 4 ¥ (4)
Total sales ................ 45,041 9,215 (4) 54,252
Operating expenses......... 40,475 9,159 (4) 49,630
Operating income .......... ¥ 4,566 ¥ 56 ¥ Nil ¥ 4,622
b. Assets, Depreciation and Capital Expenditures
Millions of yen
2005
Functional Eliminations/Pharmaceuticals food Corporate Consolidated
Assets............................... ¥59,587 ¥7,103 ¥32,220 ¥98,910
Depreciation ................... 2,773 201 42 3,016
Capital expenditures....... 928 84 733 1,745
35
To the Board of Directors and Shareholders ofNippon Shinyaku Co., Ltd.:
We have audited the accompanying consolidated balance sheets of Nippon Shinyaku Co., Ltd. and consolidatedsubsidiaries as of March 31, 2006 and 2005, and the related consolidated statements of income, shareholders’ equity,and cash flows for the years then ended, all expressed in Japanese yen. These consolidated financial statements arethe responsibility of the Company’s management. Our responsibility is to express an opinion on these consolidatedfinancial statements based on our audits.
We conducted our audits in accordance with auditing standards generally accepted in Japan. Those standards requirethat we plan and perform the audit to obtain reasonable assurance about whether the financial statements are free ofmaterial misstatement. An audit includes examining, on a test basis, evidence supporting the amounts anddisclosures in the financial statements. An audit also includes assessing the accounting principles used andsignificant estimates made by management, as well as evaluating the overall financial statement presentation. Webelieve that our audits provide a reasonable basis for our opinion.
In our opinion, the consolidated financial statements referred to above present fairly, in all material respects, theconsolidated financial position of Nippon Shinyaku Co., Ltd. and consolidated subsidiaries as of March 31, 2006 and2005, and the consolidated results of their operations and their cash flows for the years then ended in conformitywith accounting principles generally accepted in Japan.
Our audits also comprehended the translation of Japanese yen amounts into U.S. dollar amounts and, in ouropinion, such translation has been made in conformity with the basis stated in Note 1. Such U.S. dollar amounts arepresented solely for the convenience of readers outside Japan.
June 29, 2006
Deloitte Touche TohmatsuSumitomoseimei Kyoto Building62, Tsukihoko-choShinmachi-higashiiru, Shijo-dori Shimogyo-ku, Kyoto 600-8492Japan
Tel: +81 (75) 222 0181Fax: +81 (75) 231 2703www.deloitte.com/jp
Independent Auditors’ ReportNIPPON SHINYAKU CO., LTD. and Consolidated Subsidiaries
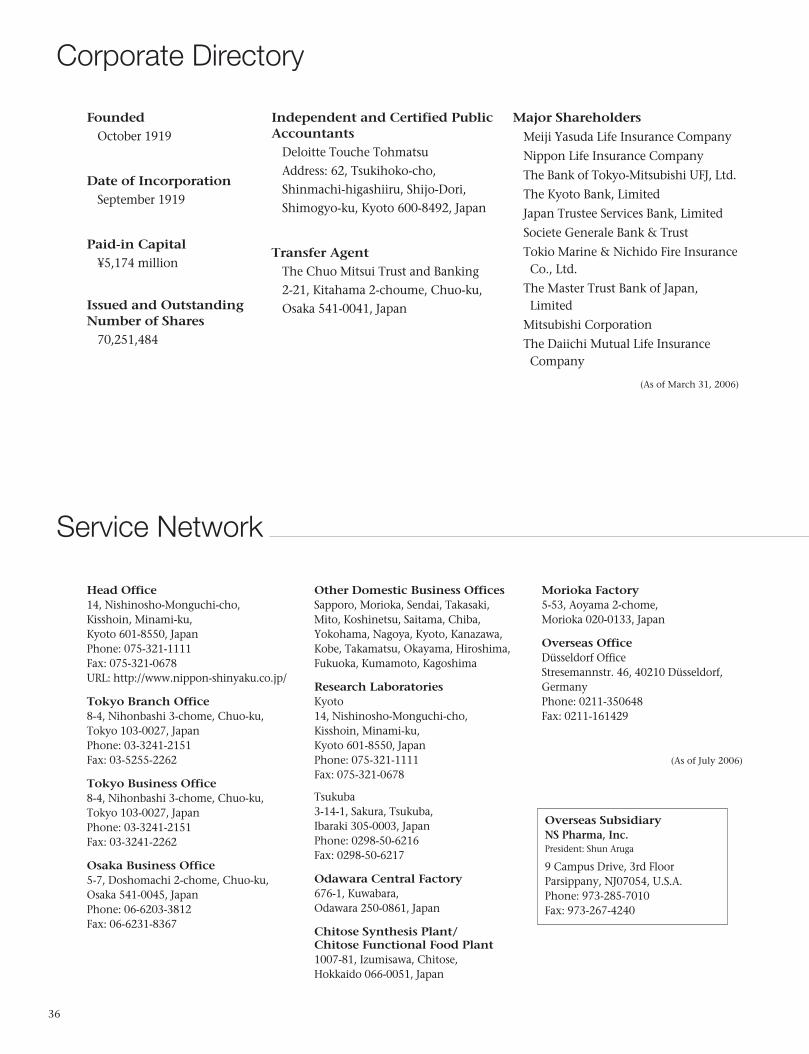
36
Head Office14, Nishinosho-Monguchi-cho,Kisshoin, Minami-ku, Kyoto 601-8550, JapanPhone: 075-321-1111Fax: 075-321-0678URL: http://www.nippon-shinyaku.co.jp/
Tokyo Branch Office8-4, Nihonbashi 3-chome, Chuo-ku,Tokyo 103-0027, JapanPhone: 03-3241-2151Fax: 03-5255-2262
Tokyo Business Office8-4, Nihonbashi 3-chome, Chuo-ku,Tokyo 103-0027, JapanPhone: 03-3241-2151Fax: 03-3241-2262
Osaka Business Office5-7, Doshomachi 2-chome, Chuo-ku,Osaka 541-0045, JapanPhone: 06-6203-3812Fax: 06-6231-8367
Other Domestic Business OfficesSapporo, Morioka, Sendai, Takasaki,Mito, Koshinetsu, Saitama, Chiba,Yokohama, Nagoya, Kyoto, Kanazawa,Kobe, Takamatsu, Okayama, Hiroshima,Fukuoka, Kumamoto, Kagoshima
Research LaboratoriesKyoto14, Nishinosho-Monguchi-cho,Kisshoin, Minami-ku, Kyoto 601-8550, JapanPhone: 075-321-1111Fax: 075-321-0678
Tsukuba3-14-1, Sakura, Tsukuba,Ibaraki 305-0003, JapanPhone: 0298-50-6216Fax: 0298-50-6217
Odawara Central Factory676-1, Kuwabara,Odawara 250-0861, Japan
Chitose Synthesis Plant/Chitose Functional Food Plant1007-81, Izumisawa, Chitose,Hokkaido 066-0051, Japan
Morioka Factory5-53, Aoyama 2-chome,Morioka 020-0133, Japan
Overseas OfficeDüsseldorf OfficeStresemannstr. 46, 40210 Düsseldorf,GermanyPhone: 0211-350648Fax: 0211-161429
(As of July 2006)
FoundedOctober 1919
Date of IncorporationSeptember 1919
Paid-in Capital¥5,174 million
Issued and Outstanding Number of Shares
70,251,484
Independent and Certified PublicAccountants
Deloitte Touche TohmatsuAddress: 62, Tsukihoko-cho, Shinmachi-higashiiru, Shijo-Dori,Shimogyo-ku, Kyoto 600-8492, Japan
Transfer AgentThe Chuo Mitsui Trust and Banking2-21, Kitahama 2-choume, Chuo-ku,Osaka 541-0041, Japan
Major Shareholders
Meiji Yasuda Life Insurance Company
Nippon Life Insurance Company
The Bank of Tokyo-Mitsubishi UFJ, Ltd.
The Kyoto Bank, Limited
Japan Trustee Services Bank, Limited
Societe Generale Bank & Trust
Tokio Marine & Nichido Fire Insurance Co., Ltd.
The Master Trust Bank of Japan, Limited
Mitsubishi Corporation
The Daiichi Mutual Life Insurance Company
(As of March 31, 2006)
Overseas SubsidiaryNS Pharma, Inc.President: Shun Aruga
9 Campus Drive, 3rd FloorParsippany, NJ07054, U.S.A.Phone: 973-285-7010Fax: 973-267-4240
Corporate Directory
Service Network

◆ Number of Shares Issued 70,251,484 Shares (100.00%)
◆ Number of Shareholders 7,363 (100.00%)
Distribution of Shareholders and Shares
Finance Institutions63 (0.85%)
Securities Corporations29 (0.39%)
Domestic Corporations133 (1.81%)
Foreign Investors102 (1.39%)
Individuals and Others7,036 (95.56%)
Finance Institutions31,339,785 Shares (44.61%)
Individuals and Others18,244,946 Shares
(25.97%)
Foreign Investors10,997,444 Shares
(15.65%)
Treasury Stock2,088,792 Shares
(2.97%)
Domestic Corporations7,224,976 Shares
(10.29%)
Securities Corporations355,541 Shares (0.51%)
Head Office
Tokyo Branch Office
Research Laboratories (Kyoto)
Research Laboratories (Tsukuba)
Odawara Central Factory
Morioka Factory
Chitose Synthesis Plant/Chitose Functional Food Plant
Stock Price Range
4,000
400
600
800
1,200
1,000
Stock price(Yen)
Trading volumes(Thousands of shares)
Apr.’04
May Apr. MayJune July Aug. Sept. Oct. Nov. Dec. Jan.’05
Feb. Mar. Apr. MayJune July Aug. Sept. Oct. Nov. Dec. Jan.’06
Feb. Mar.0
37
Investor Information

Ni
pp
on
S
hi
ny
ak
u
Co
.,L
td
.A
NN
UA
L
RE
PO
RT
2
00
6Printed in Japan1200 H18• 08