Nipomo Mesa Water RCS - Department of Water … Capacity Study 4 Nipomo Mesa Water Supply...
28
Resource Capacity Study Water Supply in the Nipomo Mesa Area November, 2004 Includes revisions directed by the Planning Commission at the September 23 public hearing and revisions directed by the Board of Supervisors at the November 2, 2004 public hearing. (See new map on page 9 and additions to text on page 21.) San Luis Obispo County Department of Planning and Building
Transcript of Nipomo Mesa Water RCS - Department of Water … Capacity Study 4 Nipomo Mesa Water Supply...

Resource Capacity Study Water Supply in the Nipomo Mesa Area
November, 2004
Includes revisions directed by the Planning Commission at the September 23 public hearing
and revisions directed by the Board of Supervisors at the
November 2, 2004 public hearing. (See new map on page 9 and additions to text on page 21.)
San Luis Obispo County
Department of Planning and Building

Resource Capacity Study 1 Nipomo Mesa Water Supply
Resource Capacity Study Water Supply in the Nipomo Mesa Area 1. INTRODUCTION / BACKGROUND Nipomo Mesa Water Studies. The Nipomo Mesa area has been the subject of several groundwater studies since 1958, the year when the California Department of Water Resources (DWR) “San Luis Obispo County Investigation” was published. This report identified the Nipomo Mesa as one of two groundwater basins in the Arroyo Grande Subunit. For the Nipomo Mesa “basin”, the report estimated that a safe yield of about 2,500 acre-feet per season could be achieved by lowering the water table to make room for the capture of additional natural recharge, by removal of extensive groves of eucalyptus trees and by reducing subsurface outflow. The 1958 study was followed by several additional groundwater studies, some commissioned by the County and some included as components of environmental impact reports associated with proposals for new development. Some of these studies have concluded that groundwater extraction in the Nipomo Mesa area has exceeded, is now exceeding, or will soon exceed the safe yield of that portion of the basin. Others have said that, since there is no evidence of overdraft, demand remains within the estimated safe yield. Of the most recent studies, the 1996 Woodlands Environmental Impact Report (EIR) concluded that the basin was not in overdraft. A groundwater study of the Arroyo Grande – Nipomo Mesa area by DWR, begun in 1993 and completed in 2002, has been difficult to interpret because it seems to be internally inconsistent. The study’s narrative states that the area is not in overdraft, yet the data in the study indicate the opposite. Meanwhile, the judge in the Santa Maria groundwater basin litigation has determined that the overall basin is not presently and has not historically been in a state of hydrologic overdraft and that evidence had not been presented to indicate overdraft in the Nipomo Mesa area of the basin. In 2003, the county asked S.S. Papadopulos and Associates, Environmental and Water-Resource Consultants (SSPA), to review the data and analysis of the 2002 DWR study and other studies of groundwater in the Nipomo Mesa area, to note consistencies and inconsistencies among the studies, and to provide additional analysis as needed to enhance understanding of the studies. SSPA was not asked to conduct any primary data collection nor to perform parallel water level analyses or construct separate water budgets for the basin or sub-basins. The Resource Management System. The county’s Resource Management System (RMS) is a mechanism for ensuring a balance between land development and the resources necessary to sustain such development. When a resource deficiency becomes apparent, efforts are made to determine how the resource capacity might be expanded, whether conservation measures could be introduced to extend the availability of unused capacity, or whether development should be limited or redirected

Resource Capacity Study 2 Nipomo Mesa Water Supply
to areas with remaining resource capacity. The RMS is designed to avoid adverse impacts from depletion of a resource. The RMS describes a resource in terms of its “level of severity”, based on the rate of depletion and an estimate of the remaining capacity, if any. In response to a staff recommended level of severity, the Board of Supervisors may direct that a Resource Capacity Study be conducted to provide additional details which would allow the Board to certify a level of severity and adopt whatever measures are needed to eliminate or reduce the potential for undesirable consequences. Several studies of the Nipomo Mesa area in the 70s and 80s suggested the possibility of groundwater overdraft. Based on these studies, Level of Severity 2 was recommended in the 1990 Annual Resource Summary Report and, in 1993, the county commissioned the DWR to conduct an update of its 1979 study of the Arroyo Grande – Nipomo Mesa area. The Board of Supervisors directed staff to conduct a resource capacity study for water supply in the Nipomo Mesa area, to be based on the DWR update, when it was completed, leading to certification of a level of severity and adoption of appropriate mitigation measures. As indicated above, the update was completed in 2002. By the time of it’s release, the Woodlands EIR had been certified and litigation was also underway to determine water rights in the Santa Maria basin. Because of contradictory conclusions among the various studies, the County retained SSPA to provide clarification. This document is the Resource Capacity Study for Water Supply in the Nipomo Mesa Area. It is organized in the following manner:
1. Introduction / background 2. Summary of the SSPA study 3. Discussion
a. Safe yield b. Methods for estimating safe yield c. DWR conclusions d. Overdraft.
4. Estimate of projected growth 5. Summary of water supply and demand 6. Measures to increase supply 7. Measures to extend resource capacity 8. Recommended Level of Severity 9. Recommended actions 10. Appendix A: Building Permits, Subdivision Status, General Plan Amendments 11. Appendix B: “Water – In Short Supply” 12. Appendix C: SSPA study

Resource Capacity Study 3 Nipomo Mesa Water Supply
2. SUMMARY OF THE NIPOMO MESA GROUNDWATER RESOURCE CAPACITY STUDY, S.S. Papadopulos & Associates, Inc. The complete study is included in Appendix C. Support for DWR supply and demand estimates. Review of the DWR study and water studies conducted for Nipomo area EIRs indicates that the DWR study presents a generally accurate portrayal of groundwater supply and demand for that portion of the Santa Maria groundwater basin located north of the Santa Maria River and for the Nipomo Mesa Hydrologic Study Area (HSA). (A map of the Nipomo Mesa HSA may be found on page 7. A map showing the extent of the entire basin is included as Figure 1 in appendix C, the SSPA study.) Because of limitations inherent in the computer models used in some of the EIR studies, these studies tend to overestimate the sustainable yield of the groundwater basin and underestimate future groundwater declines and potential for seawater intrusion. The SSPA study explains why some reports by other investigators do not agree that the Nipomo Mesa area is in overdraft:
1. They may focus on the impact of a specific project without accounting for the cumulative impacts of projected development elsewhere in the region;
2. They may not consider the probability of prolonged periods with less than average rainfall;
3. They may overestimate transmissivity of the aquifer along the coastal margin, resulting in an underestimate of water level decline and the potential for seawater intrusion;
4. They may not have fully accounted for the change in discharge from evapotranspiration due to removal of eucalyptus trees.
“Overdraft” for Nipomo Mesa. Since current and projected pumping beneath Nipomo Mesa exceeds inflow (average annual natural recharge plus subsurface inflow), the Nipomo Mesa portion of the Santa Maria Groundwater Basin is currently in overdraft. Projections of future demand indicate increasing overdraft. Although the DWR report “refrained from concluding that the basin or the Nipomo Mesa area of the basin was currently in overdraft”, it included several warnings that overdraft was likely if existing trends were to continue. The statement in the DWR report that the groundwater basin within San Luis Obispo County is currently not in overdraft because of “consistent subsurface outflow to the ocean and no evidence of sea water intrusion” is inconsistent with DWRs definition of overdraft. DWR defines overdraft as “the condition of a groundwater basin or subbasin in which the amount of water withdrawn by pumping exceeds the amount of water that recharges the basin over a period of years, during which water supply conditions approximate average conditions.” The DWR report appears to be internally inconsistent. The report’s data clearly indicate an increasing water budget deficit for the Nipomo Mesa area, and existing conditions correspond to the DWR’s own definition of overdraft. The SSPA study supports the
Resource Capacity Study 4 Nipomo Mesa Water Supply
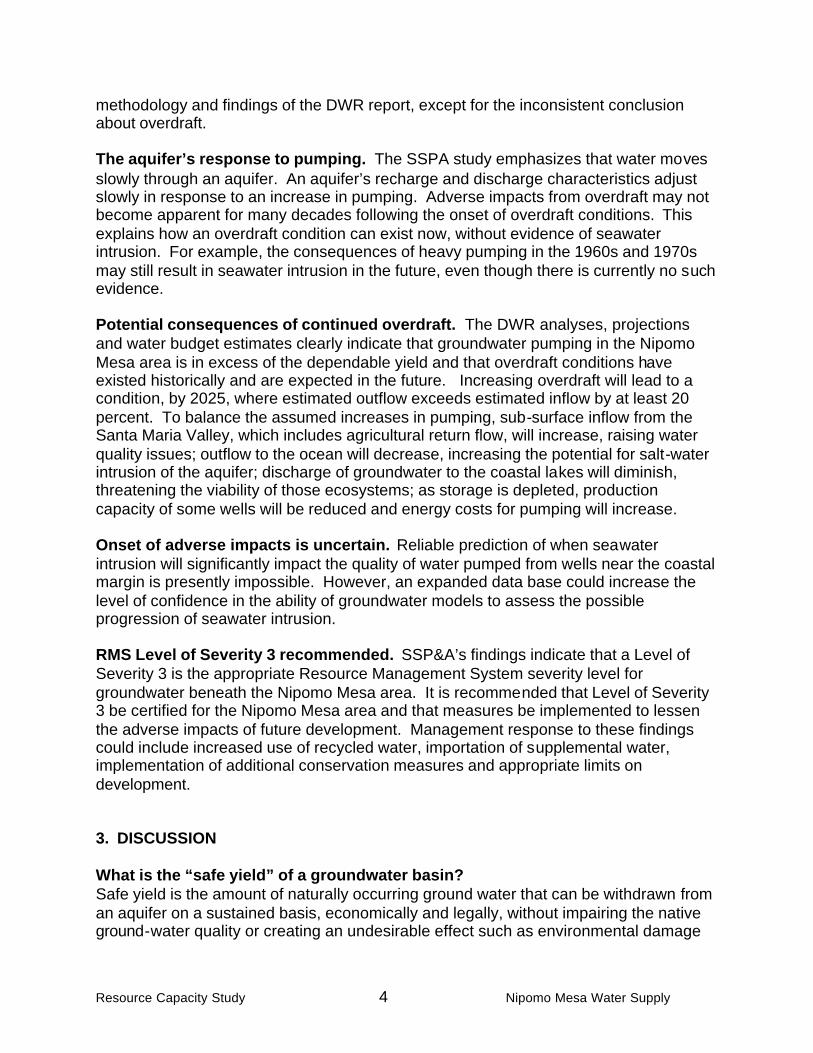
methodology and findings of the DWR report, except for the inconsistent conclusion about overdraft. The aquifer’s response to pumping. The SSPA study emphasizes that water moves slowly through an aquifer. An aquifer’s recharge and discharge characteristics adjust slowly in response to an increase in pumping. Adverse impacts from overdraft may not become apparent for many decades following the onset of overdraft conditions. This explains how an overdraft condition can exist now, without evidence of seawater intrusion. For example, the consequences of heavy pumping in the 1960s and 1970s may still result in seawater intrusion in the future, even though there is currently no such evidence. Potential consequences of continued overdraft. The DWR analyses, projections and water budget estimates clearly indicate that groundwater pumping in the Nipomo Mesa area is in excess of the dependable yield and that overdraft conditions have existed historically and are expected in the future. Increasing overdraft will lead to a condition, by 2025, where estimated outflow exceeds estimated inflow by at least 20 percent. To balance the assumed increases in pumping, sub-surface inflow from the Santa Maria Valley, which includes agricultural return flow, will increase, raising water quality issues; outflow to the ocean will decrease, increasing the potential for salt-water intrusion of the aquifer; discharge of groundwater to the coastal lakes will diminish, threatening the viability of those ecosystems; as storage is depleted, production capacity of some wells will be reduced and energy costs for pumping will increase. Onset of adverse impacts is uncertain. Reliable prediction of when seawater intrusion will significantly impact the quality of water pumped from wells near the coastal margin is presently impossible. However, an expanded data base could increase the level of confidence in the ability of groundwater models to assess the possible progression of seawater intrusion. RMS Level of Severity 3 recommended. SSP&A’s findings indicate that a Level of Severity 3 is the appropriate Resource Management System severity level for groundwater beneath the Nipomo Mesa area. It is recommended that Level of Severity 3 be certified for the Nipomo Mesa area and that measures be implemented to lessen the adverse impacts of future development. Management response to these findings could include increased use of recycled water, importation of supplemental water, implementation of additional conservation measures and appropriate limits on development. 3. DISCUSSION What is the “safe yield” of a groundwater basin? Safe yield is the amount of naturally occurring ground water that can be withdrawn from an aquifer on a sustained basis, economically and legally, without impairing the native ground-water quality or creating an undesirable effect such as environmental damage

Resource Capacity Study 5 Nipomo Mesa Water Supply
(C. W. Fetter, Applied Hydrogeology, Third Edition, 1994). “Undesirable effects” frequently cited as consequences of exceeding safe yield include: Reductions in streamflow; reductions in lake levels Drying of wetlands Subsidence of the land surface Degradation of water quality In coastal locations, seawater intrusion into the aquifer’s fresh water in storage Lowering water levels leading to increase in pumping cost What methods are used to estimate the safe yield of a groundwater basin? Water level analysis. Groundwater levels in wells fluctuate over time representing the continuous adjustment of groundwater in storage to changes in recharge and discharge. Fluctuation of water levels is caused by several factors, including pumpage, recharge from direct precipitation and streamflow, infiltration of applied water and subsurface inflows and outflows. Water level analysis is based on empirical measurement of water levels in both production wells and monitoring wells. Levels in individual wells are compared to levels in other wells throughout an aquifer to create a contour map showing elevations of the groundwater surface. Contour maps are useful for estimating the direction and rate of flow of groundwater within an aquifer. They are also used for estimating the amount of groundwater in storage. Observation of water levels over time can illuminate trends with implications about the long-term prospects for the basin. Because annual recharge from precipitation is highly variable, long-term analysis of water level trends must include representative periods of above average and below average rainfall. Determination of trends is based on a period of observation that is not biased by an unusually dry or wet year or series of years. Water budget analysis. Compilation of a water budget provides an estimate of each source of recharge and discharge to and from an aquifer. Estimates are based on a combination of empirical observation (rainfall data, stream flows, core samples, chemical analysis, well levels) and inference using logical assumptions. Water budgets are prepared to enable an understanding of the ways in which the groundwater basin adjusts to changes in recharge and discharge. Since natural recharge from precipitation cannot be increased, an increase in discharge (pumping) can only be offset by an equivalent decrease in other forms of discharge (i.e., outflow to the ocean, to streamflow, to evapotranspiration, transfer from storage) and/or by supplemental recharge (imported water, control of recharge by dams). “Dynamic equilibrium” is the process by which an aquifer adjusts to a change in recharge or discharge. The most common change we have to deal with is increased pumping. Depending on the transmissivity and storativity of the aquifer, achievement of a new equilibrium may not take place for decades following an increase in pumping. Equilibrium is achieved when the water removed by pumping is replaced by water that would otherwise have been discharged via ocean outflow or other sub-surface outflow such as outflow to a local stream or lake or to evapotranspiration. The cause and effect relationship between pumping and changes in various forms of discharge is not always appreciated, because pumping happens at the turn of a switch while the discharge
Resource Capacity Study 6 Nipomo Mesa Water Supply
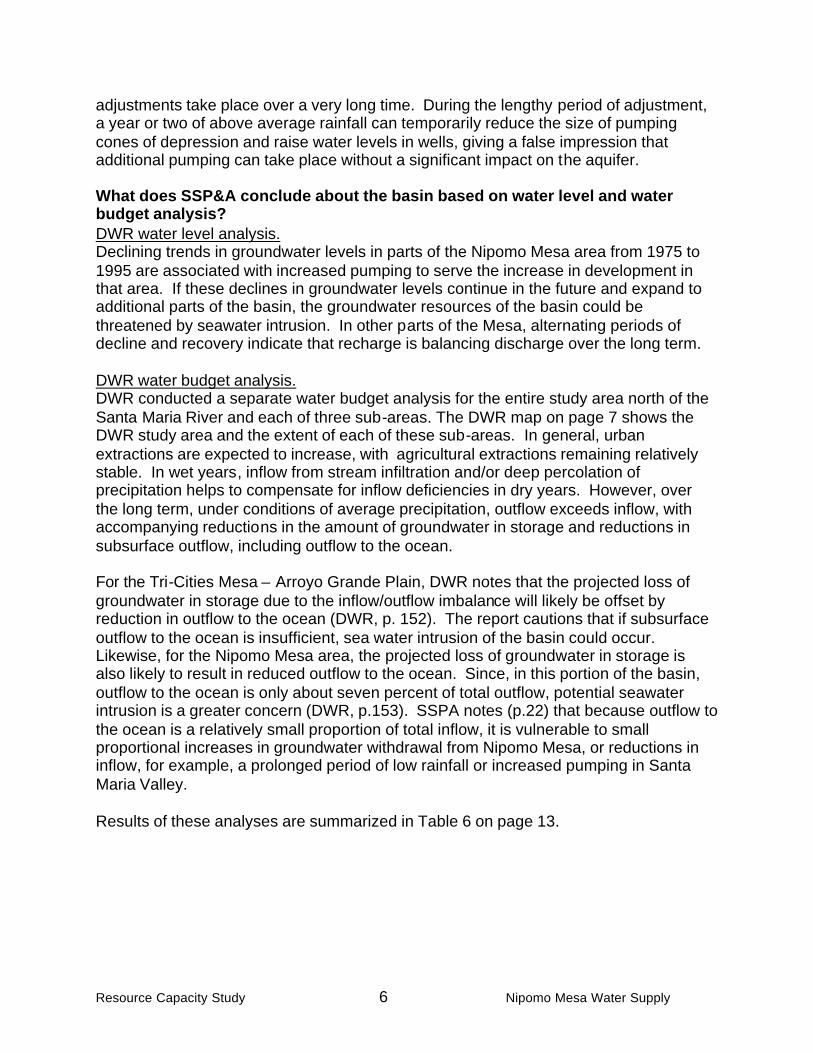
adjustments take place over a very long time. During the lengthy period of adjustment, a year or two of above average rainfall can temporarily reduce the size of pumping cones of depression and raise water levels in wells, giving a false impression that additional pumping can take place without a significant impact on the aquifer. What does SSP&A conclude about the basin based on water level and water budget analysis? DWR water level analysis. Declining trends in groundwater levels in parts of the Nipomo Mesa area from 1975 to 1995 are associated with increased pumping to serve the increase in development in that area. If these declines in groundwater levels continue in the future and expand to additional parts of the basin, the groundwater resources of the basin could be threatened by seawater intrusion. In other parts of the Mesa, alternating periods of decline and recovery indicate that recharge is balancing discharge over the long term. DWR water budget analysis. DWR conducted a separate water budget analysis for the entire study area north of the Santa Maria River and each of three sub-areas. The DWR map on page 7 shows the DWR study area and the extent of each of these sub-areas. In general, urban extractions are expected to increase, with agricultural extractions remaining relatively stable. In wet years, inflow from stream infiltration and/or deep percolation of precipitation helps to compensate for inflow deficiencies in dry years. However, over the long term, under conditions of average precipitation, outflow exceeds inflow, with accompanying reductions in the amount of groundwater in storage and reductions in subsurface outflow, including outflow to the ocean. For the Tri-Cities Mesa – Arroyo Grande Plain, DWR notes that the projected loss of groundwater in storage due to the inflow/outflow imbalance will likely be offset by reduction in outflow to the ocean (DWR, p. 152). The report cautions that if subsurface outflow to the ocean is insufficient, sea water intrusion of the basin could occur. Likewise, for the Nipomo Mesa area, the projected loss of groundwater in storage is also likely to result in reduced outflow to the ocean. Since, in this portion of the basin, outflow to the ocean is only about seven percent of total outflow, potential seawater intrusion is a greater concern (DWR, p.153). SSPA notes (p.22) that because outflow to the ocean is a relatively small proportion of total inflow, it is vulnerable to small proportional increases in groundwater withdrawal from Nipomo Mesa, or reductions in inflow, for example, a prolonged period of low rainfall or increased pumping in Santa Maria Valley. Results of these analyses are summarized in Table 6 on page 13.

Resource Capacity Study 7 Nipomo Mesa Water Supply
Adapted from Plate ES1 (DWR 2002) – Arroyo Grande – Nipomo Mesa Study Area

Resource Capacity Study 8 Nipomo Mesa Water Supply
What is overdraft? How can the apparent disagreement among experts regarding overdraft be understood? The answer may be as simple as the fact that different definitions of overdraft are referenced by different experts. For example, the DWR defines overdraft as “The condition of a groundwater basin or subbasin in which the amount of water withdrawn by pumping exceeds the amount of water that recharges the basin over a period of years, during which water supply conditions approximate average conditions.” The judge in the Santa Maria groundwater litigation includes evidence of an adverse consequence in his definition of overdraft: “The law defines ‘overdraft’ as extractions in excess of the safe yield of water from the aquifer, which over time will lead to a depletion of the water supply within a groundwater basin as manifested by permanent lowering of the water table.” “ … overdraft can be determined … by evidence of observed physical conditions in the Basin, such as declining underground water levels, seawater intrusion, declining water quality, or land subsidence over time .. “ The review by S.S. Papadopulos accepts the DWR definition because the county’s Resource Management System is designed to avoid adverse impacts from depletion of a resource. DWR says that overdraft exists when pumping exceeds recharge over a period of years, etc. without requiring a manifestation of adverse impacts. In fact, the DWR data, as interpreted by SSP&A, indicate that overdraft conditions have existed in the Nipomo Mesa area since about 1980. In contrast, the court’s definition of overdraft says that an adverse impact must already be evident. Thus, the court did not find overdraft based on documentation submitted by the litigants. In addition, differences between the DWR study and other studies regarding a finding of overdraft may be partially reconciled by adjusting some assumptions of the other studies to increase their ability to provide an accurate estimate of current and projected conditions. Adjustments could include the transmissivity of the aquifer, reduction of the amount of recharge assumed to be contributed by Twitchell Reservoir, a full accounting of the cumulative impact of new development, and fully incorporating in groundwater models the effect of removing eucalyptus trees with the attendant reduction in discharge due to evapotranspiration.

Resource Capacity Study 9 Nipomo Mesa Water Supply
4. ESTIMATE OF PROJECTED GROWTH The DWR 2002 study used historical population data and projections provided in 1996 by the State Department of Finance. For this Resource Capacity Study, projections are based on inspection of aerial photographs, reports of water service connections from NCSD and Cal Cities Water Company, and projected growth continuing at 2.3 percent per year, the maximum allowed by the county’s Growth Management Ordinance since 2000. At that rate of growth, some sub-areas will reach buildout before 2020: Nipomo (Cal Cities) (2013); Black Lake (2009); Callender-Garrett (2009); Palo Mesa (2013). Projections include no increase in dwelling units after buildout is achieved.
2.3% Growth Area (adapted from Figure 1, Growth Management Ordinance, Title 26) Note: Woodlands Specific Plan Area (shaded area) is not part of the Nipomo Mesa Water Conservation Area nor the 2.3% Growth Area.

Resource Capacity Study 10 Nipomo Mesa Water Supply
Table 1. Existing and Projected Dwelling Units, Nipomo Mesa HSA
Projections based on annual increase of 2.3 percent
Sub-area 2003 2010 2020 Buildout (2)
Nipomo (NCSD) (1) 2830 3318 4165 5878 Nipomo (Cal Cities) 1444 1693 1800 1800 Summit Station (NCSD) (1) 122 135 150 160 Black Lake (NCSD) (1) 491 559 559 559 Callendar-Garrett 218 250 250 250 Palo Mesa 917 1075 1150 1150 Woodlands 0 825 1320 1320 Rural area of Nipomo Mesa 670 785 986 2260 Total 6692 8640 10380 13377 Notes: (1) Based on June, 2004 urban and village reserve lines and NCSD service areas. (2) Buildout data from South County Area Plan Existing population and population projections in Table 2, below, are based on the number of persons per dwelling unit from the 2000 U.S. Census. Population for the urban community of Nipomo is based on 3.13 persons per unit. All other sub-areas are based on 2.61 persons per unit, the average for the unincorporated area of the county. A five percent vacancy rate is assumed for all sub-areas.
Table 2. Existing and Projected Population, Nipomo Mesa HSA Sub-area 2003 2010 2020 Buildout Nipomo (NCSD) 8415 9866 12385 17478 Nipomo (Cal Cities) 4294 5034 5352 5352 Summit Station (NCSD) 302 335 372 397 Black Lake (NCSD) 1217 1386 1386 1386 Callendar-Garrett 540 620 620 620 Palo Mesa 2274 2665 2851 2851 Woodlands 0 2046 3273 3273 Rural area of Nipomo Mesa 1661 1946 2445 5604 Total 18703 23898 28684 36961

Resource Capacity Study 11 Nipomo Mesa Water Supply
5. SUMMARY OF WATER SUPPLY AND DEMAND Water Supply and Demand, DWR 2002 In the 2002 DWR study, the water supply is expressed in terms of the dependable yield for the main Santa Maria Basin within San Luis Obispo County and for each of several divisions of the main basin. DWR defines dependable yield as “ … the average quantity of water that can be withdrawn from the basin over a period of time (during which water supply conditions approximate average conditions) without resulting in adverse effects … “. The “average conditions” referenced parenthetically by DWR are primarily the average annual precipitation, the assumption being that each year receives no more nor less than the average. In fact, some years will receive greater rainfall than the average and some will receive less. Following wet years, water levels will rise; following dry years, levels will fall. However, over the long term, the average precipitation provides the appropriate benchmark. DWR provides the following estimates of dependable yield (given as a range) for the main Santa Maria groundwater basin: Tri-Cities Mesa – Arroyo Grande Plain 4,000 afy to 5,600 afy Nipomo Mesa 4,800 afy to 6,000 afy Santa Maria Valley 11,100 afy to 13,000 afy Main Santa Maria Basin in SLO County 19,900 afy to 24,600 afy The following tables compare the estimated dependable yield to the estimated extractions for the base period, and for 2010 and 2020. The low end of the range is identified as the worst case and the high end of the range is identified as the best case. Projected deficits are highlighted with bold type and shading.
Table 3. Comparison of Dependable Yield and Extractions – Base Period
Source: DWR 2002, Tables 24, 25, 26, 27 and 29 (Acre-feet per year)
Tri-Cities Mesa Nipomo Mesa S. Maria Valley Main Basin Dependable Yield 4000 5600 4800 6000 11100 13000 19900 24600 Urban Extractions 2300 3400 500 6200 Ag Extractions 1500 1900 12300 15700 Other Extractions 100 1000 100 1200 Total Extractions 3900 6300 12900 23100 Surplus / Deficit +100 +1700 -1500 -300 -1800 +100 -3200 +1500

Resource Capacity Study 12 Nipomo Mesa Water Supply
Table 4. Comparison of Dependable Yield and Extractions – 2010
Source: DWR 2002, Tables 24, 25, 26, 27 and 29 (Acre-feet per year)
Tri-Cities Mesa Nipomo Mesa S. Maria Valley Main Basin Dependable Yield 4000 5600 4800 6000 11100 13000 19900 24600 Urban Extractions 3400 5200 700 9300 Ag Extractions 900 1600 10100 12600 Other Extractions 100 1000 100 1200 Total Extractions 4400 7800 10900 23100 Surplus / Deficit -400 +1200 -3000 -1800 +200 +2100 -3200 +1500
Table 5. Comparison of Dependable Yield and Extractions – 2020
Source: DWR 2002, Tables 24, 25, 26, 27 and 29 (Acre-feet per year)
Tri-Cities Mesa Nipomo Mesa S. Maria Valley Main Basin Dependable Yield 4000 5600 4800 6000 11100 13000 19900 24600 Urban Extractions 4400 6600 900 11900 Ag Extractions 900 1600 10700 13200 Other Extractions 100 1000 100 1200 Total Extractions 5400 9200 11700 26300 Surplus / Deficit -1400 +200 -4400 -3200 -600 +1300 -6400 -1700 This comparison of dependable yield and extractions indicates that for the worst case scenario, representing the lowest estimate of dependable yield, dependable yield is exceeded in the base period for the Nipomo Mesa, the Santa Maria Valley and the Main Basin. For 2010, dependable yield is exceeded in the Tri-Cities Mesa, Nipomo Mesa and the Main Basin. Dependable yield is not exceeded in the Santa Maria Valley due to reduced agricultural extractions. For 2020, extractions in all sub-areas and the Main Basin exceed the dependable yield. For the best case scenario, representing the highest estimate of dependable yield, the estimate for the Nipomo Mesa indicates a deficit in the base period. For the Nipomo Mesa, the deficit increases to 2010. In 2020, the Nipomo Mesa deficit increases again, and a deficit is also indicated for the Main Basin. DWR 2002 also compares total outflow to total inflow, indicating growing deficits from the base period through 2020.

Resource Capacity Study 13 Nipomo Mesa Water Supply
Table 6. Inflow, Outflow, Surplus/Deficit (1,000s of acre feet per year)
Source: DWR 2002, Tables 24, 25, 26 and 27
Base Period (1984 thru 1995) 2010 2020 Sub-area Inflow Outflow Surplus/Deficit Surplus/Deficit Surplus/Deficit
Main Basin 29200 33100 - 3900 - 4700 - 7100 Tri-Cities/A.G.Plain 7200 7100 + 100 - 500 - 1300 Nipomo Mesa 6800 8200 - 1400 - 2400 - 3800 Santa Maria Valley 18800 21400 - 2600 - 1800 - 2000 Trends in water demand, Master Water Plan Update, 2003 Water demand for the Nipomo Mesa has also been estimated by the County’s Master Water Plan Update. These estimates generally coincide with the DWR estimates for the Nipomo Mesa and the Santa Maria Valley.
Table 7. Water Demand, Water Planning Area 6
Master Water Plan Update, 2003 Acre feet per year
Nipomo Mesa Nipomo Valley Santa Maria
River Valley Suey Creek Total WPA6 Demand
Sector 2002 Buildout 2002 Buildout 2002 Buildout 2002 Buildout 2002 Buildout
Urban 3900 7340 3 320 0 0 0 0 3900 7670 Ag 2990 1900 4220 4120 12130 11740 3200 6420 22540 24180 Rural 2420 3350 490 730 140 220 30 50 3080 4350 Env Black Lake, Coastal Lakes, Oso Flaco Lakes (No estimate) Total 9310 12590 4713 5170 12270 11960 3230 6470 29520 36200 The following table, Table 8, is an expanded version of the Nipomo Mesa portion of the 2003 WPA6 table, above. In this table, urban extractions are broken out into sub-categories representing the major water-using entities on the mesa. Demand for 2003 reflects the actual demand as reported by NCSD and Cal Cities, and estimated demand for communities and rural areas not served by these purveyors, based on the number of residential units existing in 2003 and estimates of demand per unit. Golf courses are listed as a separate component of rural demand. Agricultural demand is based on estimates of the Master Water Plan Update, as modified through the deliberations of the Nipomo Water Forum.

Resource Capacity Study 14 Nipomo Mesa Water Supply
Table 8. Existing and Projected Extractions, Nipomo Mesa
(Acre-feet per year, no additional conservation)
Afy/DU 2003 2010 2020 Buildout
Nipomo (NCSD) 0.68 1924 2256 2832 3997 Nipomo (Cal Cities) 0.92 1328 1558 1656 1656 Summit Station (NCSD) 1.5 183 203 225 240 Black Lake (NCSD) 0.78 383 436 436 436 Callender-Garrett 0.50 109 125 125 125 Palo Mesa 0.78 715 839 897 897 Woodlands 0.64 0 528 845 845 Rural (Residential) 1.0 670 785 986 2260 Rural (Golf Courses) 300 700 700 700 Total Non-AG 5612 7430 8700 11156 Agriculture (1) 2990 2590 1900 1900 Total 8602 10020 10600 13056 Dependable Yield 6000 6000 6000 6000 Surplus <Deficit> <2602> <4020> <4600> <7056> Notes: (1) MWP shows WPA6 ag demand for 2020 = 23,860 to 31,770 afy. The 2003 MWP update shows demand reduced to a range between 19,260 and 28,450 afy, based on reduction in acreage from 1630 acres in 2002 to 980 acres in 2020. The lower end of the range is used in this table. Ag extractions are reduced accordingly. Buildout extractions for Nipomo (NCSD) and Rural (Residential) are based on dwelling unit buildout estimates from the South County Area Plan. For Nipomo (NCSD), buildout assumes redevelopment of under-built parcels to their full entitlement according to existing land use categories. Conclusion Regarding Water Demand for Nipomo Mesa DWR 2002 estimates that in 2020, the Nipomo Mesa will have urban extractions of about 6600 acre-feet per year (DWR, 2002, Table 5). The Master Water Plan Update estimates urban and rural non-agricultural extractions of about 10970 afy for the Nipomo Mesa at buildout (Table 1, page WPA6-2). The estimates of urban extractions in Table 8, above are generally consistent with the DWR and Master Water Plan estimates. The comprehensive compilation of extractions in Table 8, i ncluding projected agricultural extractions, indicates total extractions of about 8600 in 2003, increasing to 10020 in 2010, 10600 in 2020 and 13056 at buildout. In order to maintain the sustainability of the groundwater supply, total extractions would have to become stabilized at 6000 afy. Sustainability can be achieved through some combination of conservation and supply augmentation so that urban extractions do not exceed 3400 afy or that they increase by no more than the addition of supplemental water to the Nipomo Mesa portion of the basin. To address fully the projected deficits, a combination of conservation and additional supply totaling 4020 afy should be in place by 2010 and a combination equaling 4600 afy should be on line by 2020. For example, without any supplemental water, conservation would be the only mechanism for
Resource Capacity Study 15 Nipomo Mesa Water Supply
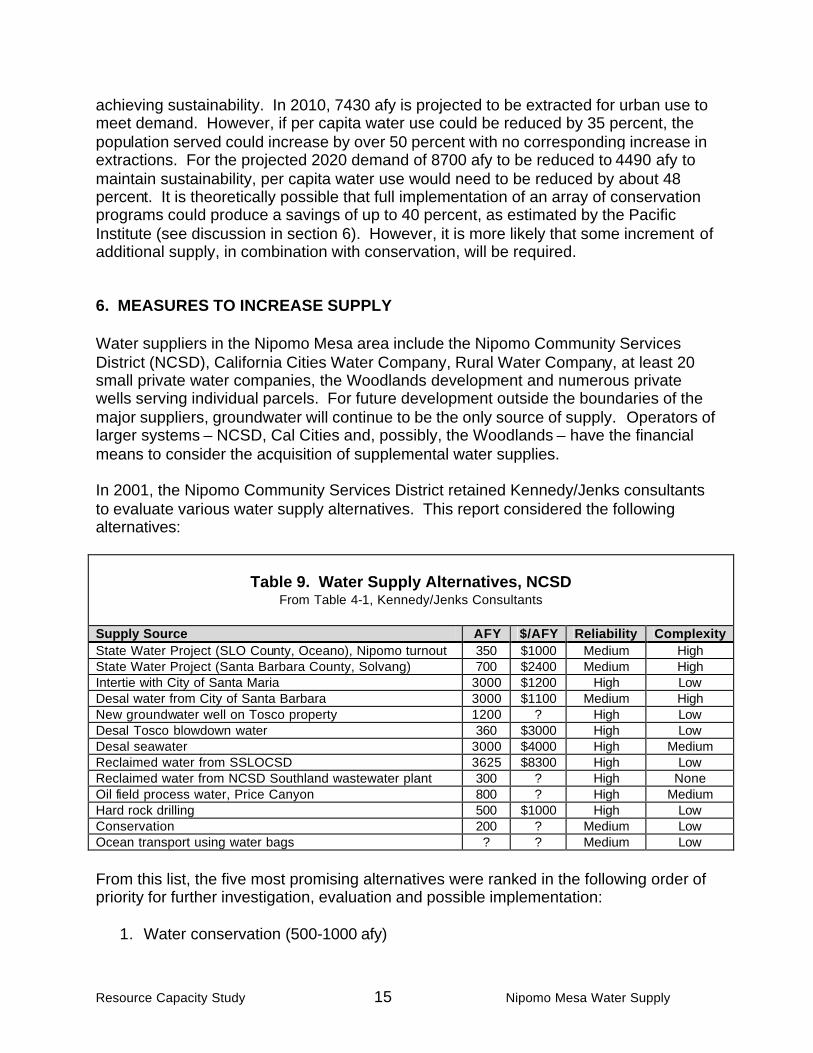
achieving sustainability. In 2010, 7430 afy is projected to be extracted for urban use to meet demand. However, if per capita water use could be reduced by 35 percent, the population served could increase by over 50 percent with no corresponding increase in extractions. For the projected 2020 demand of 8700 afy to be reduced to 4490 afy to maintain sustainability, per capita water use would need to be reduced by about 48 percent. It is theoretically possible that full implementation of an array of conservation programs could produce a savings of up to 40 percent, as estimated by the Pacific Institute (see discussion in section 6). However, it is more likely that some increment of additional supply, in combination with conservation, will be required. 6. MEASURES TO INCREASE SUPPLY Water suppliers in the Nipomo Mesa area include the Nipomo Community Services District (NCSD), California Cities Water Company, Rural Water Company, at least 20 small private water companies, the Woodlands development and numerous private wells serving individual parcels. For future development outside the boundaries of the major suppliers, groundwater will continue to be the only source of supply. Operators of larger systems – NCSD, Cal Cities and, possibly, the Woodlands – have the financial means to consider the acquisition of supplemental water supplies. In 2001, the Nipomo Community Services District retained Kennedy/Jenks consultants to evaluate various water supply alternatives. This report considered the following alternatives:
Table 9. Water Supply Alternatives, NCSD
From Table 4-1, Kennedy/Jenks Consultants
Supply Source AFY $/AFY Reliability Complexity State Water Project (SLO County, Oceano), Nipomo turnout 350 $1000 Medium High State Water Project (Santa Barbara County, Solvang) 700 $2400 Medium High Intertie with City of Santa Maria 3000 $1200 High Low Desal water from City of Santa Barbara 3000 $1100 Medium High New groundwater well on Tosco property 1200 ? High Low Desal Tosco blowdown water 360 $3000 High Low Desal seawater 3000 $4000 High Medium Reclaimed water from SSLOCSD 3625 $8300 High Low Reclaimed water from NCSD Southland wastewater plant 300 ? High None Oil field process water, Price Canyon 800 ? High Medium Hard rock drilling 500 $1000 High Low Conservation 200 ? Medium Low Ocean transport using water bags ? ? Medium Low From this list, the five most promising alternatives were ranked in the following order of priority for further investigation, evaluation and possible implementation:
1. Water conservation (500-1000 afy)

Resource Capacity Study 16 Nipomo Mesa Water Supply
2. Intertie with the City of Santa Maria (2000-3000 afy) 3. Desal process water and groundwater exchange with Tosco Refinery (1300 afy) 4. Recycled water / groundwater exchange with agricultural users (500-1000 afy) 5. Hard rock drilling (500-1000 afy)
7. MEASURES TO EXTEND RESOURCE CAPACITY Conservation Indoor residential water use. A recent publication by the Pacific Institute (1) estimates that indoor residential water use can be reduced by about 40 percent. Reductions could be achieved by replacement of toilets, shower heads, clothes washers and dishwashers and repairing leaks. Conversion to low water-use fixtures will occur gradually over the long term. It can also be accelerated through pro-active programs involving public education, the offer of financial incentives and the adoption by water purveyors of steeply-tiered rate structures that reward conservation and penalize unreasonable water use. The Pacific Institute suggests the following rate structure:
Table 10. Recommended Tiered Rate Structure Pacific Institute
Tier Water Use
(as percent of base allocation) Price per Unit
Used in Each Tier Low Volume Discount 0-40% Base Rate Conservation Base Rate 41-100% Base Rate Inefficient 101-150% 2x Base Rate Excessive 151-200% 4x Base Rate Wasteful 201% and above 8x Base Rate
Outdoor residential water use. Outdoor residential water use can also be reduced through the implementation of conservation measures. The Pacific Institute identifies a variety of such measures, ranging from relatively simple and inexpensive practices such as maintaining a proper irrigation schedule to more demanding practices such as retrofitting an irrigation system with new efficiency components or changing landscape design. Some of the possibilities are included in the following table. It is estimated that application of these measures could reduce outdoor residential water use by 25 to 40 percent. Excerpts from a recent article about water conservation are included in appendix B. (1) Waste Not, Want Not: The Potential for Water Conservation in California, Pacific Institute, November, 2003. The Pacific Institute for Studies in Development, Environment and Security is an independent, nonprofit organization that provides research and policy analysis on issues at the intersection of sustainable development, environmental protection, and international security. More information can be found at www.pacinst.org.
Resource Capacity Study 17 Nipomo Mesa Water Supply
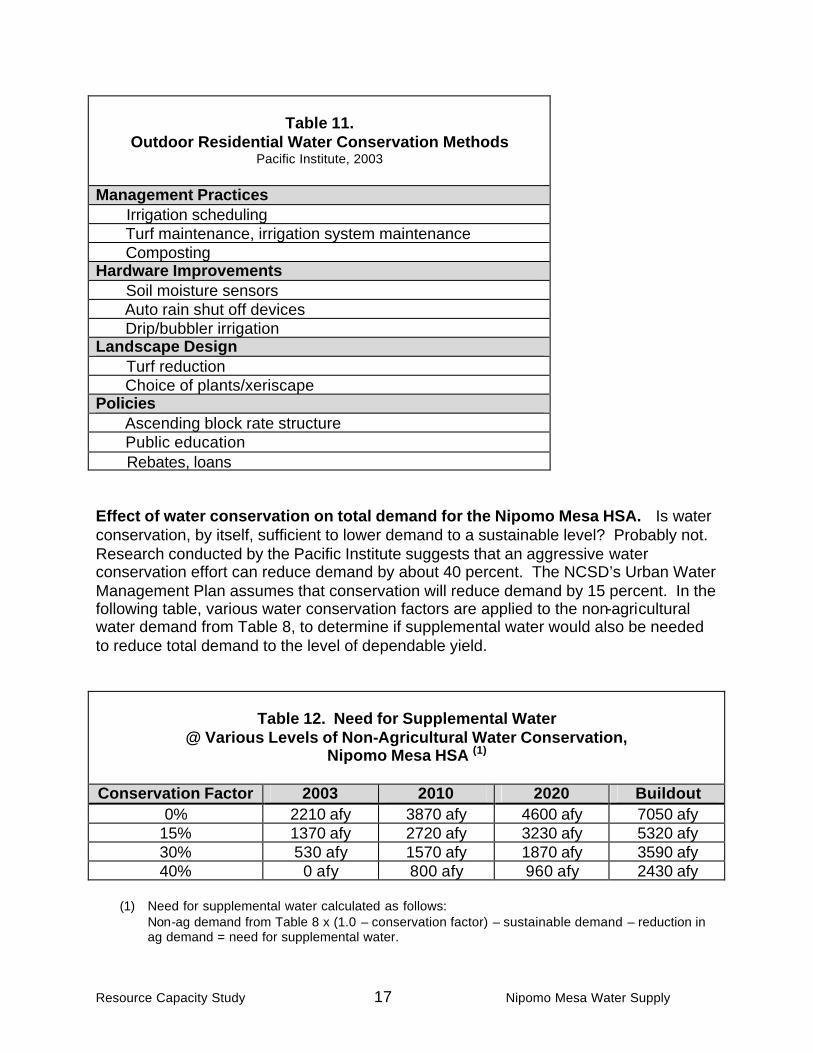
Table 11.
Outdoor Residential Water Conservation Methods Pacific Institute, 2003
Management Practices Irrigation scheduling Turf maintenance, irrigation system maintenance Composting Hardware Improvements Soil moisture sensors Auto rain shut off devices Drip/bubbler irrigation Landscape Design Turf reduction Choice of plants/xeriscape Policies Ascending block rate structure Public education Rebates, loans Effect of water conservation on total demand for the Nipomo Mesa HSA. Is water conservation, by itself, sufficient to lower demand to a sustainable level? Probably not. Research conducted by the Pacific Institute suggests that an aggressive water conservation effort can reduce demand by about 40 percent. The NCSD’s Urban Water Management Plan assumes that conservation will reduce demand by 15 percent. In the following table, various water conservation factors are applied to the non-agricultural water demand from Table 8, to determine if supplemental water would also be needed to reduce total demand to the level of dependable yield.
Table 12. Need for Supplemental Water
@ Various Levels of Non-Agricultural Water Conservation, Nipomo Mesa HSA (1)
Conservation Factor 2003 2010 2020 Buildout
0% 2210 afy 3870 afy 4600 afy 7050 afy 15% 1370 afy 2720 afy 3230 afy 5320 afy 30% 530 afy 1570 afy 1870 afy 3590 afy 40% 0 afy 800 afy 960 afy 2430 afy
(1) Need for supplemental water calculated as follows:
Non-ag demand from Table 8 x (1.0 – conservation factor) – sustainable demand – reduction in ag demand = need for supplemental water.

Resource Capacity Study 18 Nipomo Mesa Water Supply
8. RECOMMENDED LEVEL OF SEVERITY The county General Plan’s Framework for Planning contains a discussion of the objectives, procedures and criteria for levels of severity of the Resource Management System. Regarding water resources, the RMS indicates that “Level of Severity III exists when water demand equals the available resource; the amount of consumption has reached the dependable supply of the resource. A Level III may also exist if the time required to correct the problem is longer than the time available before the dependable supply is reached.” (page 3-19). Table F (page 3-18) summarizes levels of severity for water supply:
Table F RESOURCE DEFICIENCY CRITERIA FOR LEVELS OF SEVERITY
Level I Level II Level III Projected consumption estimated to exceed dependable supply within 9 years
7 year lead time to develop supplementary water for delivery to users
Resource is being used at or beyond its estimated dependable supply or will deplete dependable supply before new supplies can be developed
This Resource Capacity Study confirms that, for the Nipomo Mesa area, demand presently equals or exceeds the dependable yield. Therefore, Level of Severity III is recommended for the water resources of the Nipomo Mesa area. For other portions of the basin, demand may equal or exceed the dependable yield by 2010 before a supplemental water supply can reasonably be expected to be secured. Level of Severity II is recommended for the balance of the basin within San Luis Obispo County. 9. RECOMMENDED ACTIONS The Resource Management System includes three “action requirements” that accompany a Level of Severity III determination: If Level III is found to exist, the board shall make formal findings to that effect, citing the basis for the findings, and shall:
1. Institute appropriate measures (including capital programs) to correct the critical resource deficiency, or at least restore Level II so that severe restrictions will be unnecessary.
2. Adopt growth management or other urgency measures to initiate whatever restrictions are necessary to minimize or halt further resource depletion.
3. Enact a moratorium on land development, or other appropriate measures, in the area that is affected by the resource problem until such time that the project provides additional resource capacity to support such development.
Resource Capacity Study 19 Nipomo Mesa Water Supply
For the Nipomo Mesa area, the following measures are recommended for implementation:
1. Measures to correct the resource deficiency.
The county can initiate measures that involve the land use and building permitting process. However, since the county is not a water purveyor in the Nipomo Mesa area, some of these measures will need to be undertaken by the NCSD, Cal Cities Water Company and other community water systems, acting separately or as part of a coordinated effort.
Measures to be undertaken by the county:
• Implement an improved well-monitoring program fo r the Nipomo Mesa area. • Undertake a comprehensive water quality assessment and develop a water
quality monitoring program for the Nipomo Mesa area. • Require landscape plans for new development that include minimal turf areas,
low water use plant materials and drip irrigation systems with automatic controllers and auto rain shut-off devices. To accomplish this measure, planning area standards should be adopted to broaden the application of low-water use landscape requirements in the urban and rural areas of the Nipomo Mesa. The County’s landscape standards require submission of a landscape plan with applications for most types of land use permit approval, with certain exceptions. Landscape plans include the location and extent of permeable and impervious landscape materials, plant materials selected from an approved plant list, turf area not to exceed 20% of site area for parcels less than 1 acre or 20% of landscaped area for parcels on one acre or larger, and an irrigation plan indicating the method for achieving low volume, high efficiency irrigation. For the Nipomo Mesa area, standards should be added that would require landscape plans for home-owner installed landscapes as well as developer-installed landscapes and also to reduce the minimum size for exception from ordinance provisions from 2,500 square feet of irrigated area to 1,500 square feet. For development in rural areas, a standard should be added that would require a landscape plan for lot sizes up to five acres rather than two acres, as is currently required.
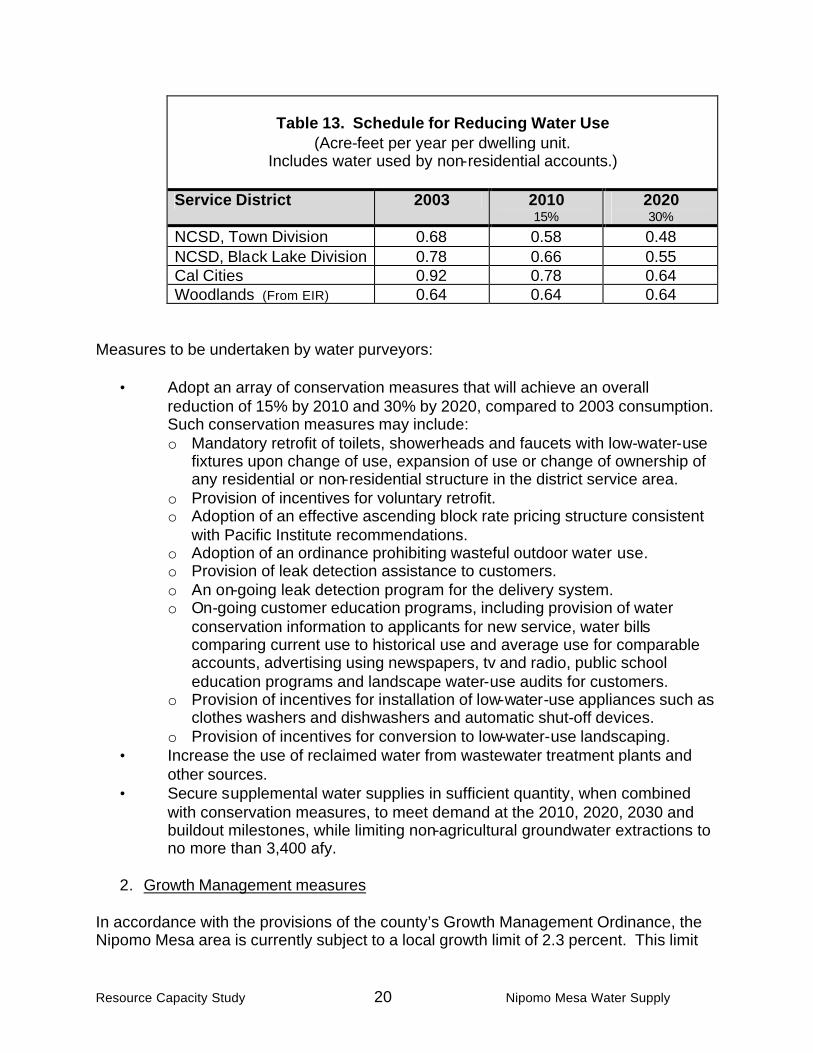
• Monitor water use per dwelling unit for NCSD, Cal Cities and Woodlands annually to determine progress toward achievement of conservation goals. Progress will be demonstrated by reducing or maintaining water use per dwelling unit according to the following schedule:
Resource Capacity Study 20 Nipomo Mesa Water Supply
Table 13. Schedule for Reducing Water Use
(Acre-feet per year per dwelling unit. Includes water used by non-residential accounts.)
Service District 2003 2010
15% 2020 30%
NCSD, Town Division 0.68 0.58 0.48 NCSD, Black Lake Division 0.78 0.66 0.55 Cal Cities 0.92 0.78 0.64 Woodlands (From EIR) 0.64 0.64 0.64
Measures to be undertaken by water purveyors:
• Adopt an array of conservation measures that will achieve an overall reduction of 15% by 2010 and 30% by 2020, compared to 2003 consumption. Such conservation measures may include: o Mandatory retrofit of toilets, showerheads and faucets with low-water-use
fixtures upon change of use, expansion of use or change of ownership of any residential or non-residential structure in the district service area.
o Provision of incentives for voluntary retrofit. o Adoption of an effective ascending block rate pricing structure consistent
with Pacific Institute recommendations. o Adoption of an ordinance prohibiting wasteful outdoor water use. o Provision of leak detection assistance to customers. o An on-going leak detection program for the delivery system. o On-going customer education programs, including provision of water
conservation information to applicants for new service, water bills comparing current use to historical use and average use for comparable accounts, advertising using newspapers, tv and radio, public school education programs and landscape water-use audits for customers.
o Provision of incentives for installation of low-water-use appliances such as clothes washers and dishwashers and automatic shut-off devices.
o Provision of incentives for conversion to low-water-use landscaping. • Increase the use of reclaimed water from wastewater treatment plants and
other sources. • Secure supplemental water supplies in sufficient quantity, when combined
with conservation measures, to meet demand at the 2010, 2020, 2030 and buildout milestones, while limiting non-agricultural groundwater extractions to no more than 3,400 afy.
2. Growth Management measures
In accordance with the provisions of the county’s Growth Management Ordinance, the Nipomo Mesa area is currently subject to a local growth limit of 2.3 percent. This limit

Resource Capacity Study 21 Nipomo Mesa Water Supply
should be retained while conservation programs and efforts to secure supplemental water are implemented. Meanwhile, water use per residential connection for the major water purveyors should be monitored to determine the effectiveness of their water conservation efforts. If the use rate does not begin to trend downward toward achievement of conservation objectives, consideration should be given to adoption of a lower growth limit. (A reduction in water use of 2.5% per year would lead to achievement of 15% conservation by 2010.) The annual hearing on the Growth Management Ordinance should include a report on Nipomo Mesa water use trends. Progress toward acquisition of supplemental water should also be monitored to determine the appropriateness of a lower growth limit. Consideration should be given to progressive decreases in the growth limit if progress toward conservation goals is insufficient. For example, the growth limit might be reduced by 0.4% for the year following a year in which additional water conservation of 2.5% is not achieved. In the absence of adequate conservation, the growth limit would decrease to 1.9% in 2005, to 1.5%, 1.1%, 0.7%, 0.3% in years 2006 through 2009 and would decrease to 0% in 2010. It would be possible to apply these factors throughout the Mesa or only within water districts that do not achieve conservation objectives. Growth limits do not apply within the Woodlands Specific Plan area. The Board of Supervisors has approved a phasing program for the Woodlands that is independent of the 2.3% growth limit for the balance of the Nipomo Mesa. The Woodlands is the only project that has proved its 20 year water supply, namely, dependable safe yield under the new State water law. The Board of Supervisors certified the Woodlands’ verification and, in fact, was further validated by the recent cour t decisions in the Santa Maria water litigation. In view of the years of work, including planning, analysis, Board findings and court decisions, any changes to the level of severity for the Nipomo Mesa, either now or in the future, should not apply to The Woodlands’ Village.
3. Land Development measures
• Adopt a planning area standard for the Nipomo Mesa to require requests for General Plan Amendments and land divisions to either demonstrate that no increase in water use would result from the proposed development, or to provide supplemental water to offset any projected increase.
• Building Permits should be issued only if the construction documents include indoor and outdoor water conservation measures.
A summary of these recommendations may be found on the following page.
Information about completed building permits, subdivision activity and general plan amendments in the South County Planning Area is provided in Appendix A.

Resource Capacity Study 22 Nipomo Mesa Water Supply
Summary of Recommendations Corrective Measures Responsible Entity
1 Improved well-monitoring program County 2 Water quality assessment and monitoring program County 3 Expand application of landscape standards County 4 Monitor progress toward conservation objectives County 5 Implement conservation programs Purveyors 6 Increase use of reclaimed water Purveyors 7 Secure supplemental water Purveyors Growth Management Measures 8 Retain 2.3% growth limit for Nipomo Mesa County 9 Reduce growth rate for insufficient conservation County Land Development Measures
10 GPAs required to demonstrate no increase in water use and/or provide supplemental water
County
11 Land divisions required to demonstrate no increase in water use and/or provide supplemental water
County
12 Building permits issued only if indoor and outdoor water conservation measures are included
County

Resource Capacity Study 23 Nipomo Mesa Water Supply
Appendix A Completed Building Permit History; Subdivision Status; General Plan Amendments
Completed Building Permits by Year, Nipomo Mesa
1994 1995 1996 1997 1998 1999 2000 2001 2002 2003
Nipomo 112 111 58 72 101 126 117 109 113 94
Los Berros 2 0 0 0 3 1 4 1 0 0
Callender Garrett 0 0 1 3 5 5 3 4 21 14
Palo Mesa 6 4 7 14 5 10 23 72 121 39
Black Lake 0 0 0 0 0 36 60 4 1 0
Balance of Mesa (1) 30 21 27 33 41 36 21 33 29 22
Total Mesa 150 136 93 122 155 214 228 223 285 169
Total Units @ year end 4719 4855 4948 5070 5225 5439 5667 5890 6175 6344
2.3% limit for new units (Limit in Nipomo Mesa area initiated in 2000) 125 130 142 146
Rural South County 40 49 46 52 63 45 24 47 41 32
South County Total 160 164 112 141 177 223 231 237 297 179
Note (1) “Balance of Mesa” is an estimated portion of the “Rural South County” number.

Resource Capacity Study 24 Nipomo Mesa Water Supply
Status of Subdivision Activity in South County Planning Area August, 2004
Maps with less than 20 lots
Maps with 20 or
more lots
Status Maps Lots Maps Lots
Building permits applied
for
Estimated
water demand per lot
Estimated
total water
demand
Received, no action 29 124 4 125 - 0.9 afy 224 afy Hearing scheduled 1 5 - - - 0.9 afy 5 afy Approved, not recorded 46 187 7 237 - 0.9 afy 382 afy Recorded 73 394 6 327 68 0.9 afy 649 afy Total 149 710 17 689 68 1260 afy (1) Estimated water demand represents a rough average of water use for the range of locations and water use estimates from Table 8, page 13. 1399 total lots less 68 already with building permits equals 1331 lots available for development. This represents about nine years of completed building permits at the rate of 2.3% per year currently allowed by the Growth Management Ordinance.
Status of General Plan Amendments in South County Planning Area
August, 2004
File # Request Status Comment Est. Change in Water Demand
G020020 CS to IND Authorized EIR in preparation probably negligible
G030009 AG to RR Authorized Initial study in preparation not significant G990013 AG to CR Authorized Initial study not yet begun – waiting for
project description from applicant unknown
G990027 RL to RS/CS Authorized On hold, new owner unknown G980008 Amend standards Authorized Summit Station. Hrg scheduled Dec 4 + 111 afy G030011 AG to RSF/RMF Received Not yet authorized. Includes 265
residential units + 170 afy
Status: “Authorized” means that the Board of Supervisors has directed staff to prepare the request for a public hearing to determine if the general plan amendment should be approved. “Received” means that the request has been submitted to staff, but further processing has not yet been authorized by the Board of Supervisors.
Resource Capacity Study 25 Nipomo Mesa Water Supply
11. Appendix B Water – in Short Supply Rebecca Bryant, excerpted from Urban Land, July 2003 Rober Hirsch of the USGS pinpoints the weakest links in the overall water supply system in the U.S.: first, overall capacity and second, ecological fragility. “Aquatic ecosystems are showing signs of stress because of the timing and rate of water extraction from groundwater and rivers.” Cities and regions that populate the American coast, including San Diego, Santa Barbara, and the San Francisco Bay Area, are all facing critical water shortages. Many of these rely heavily on groundwater. As pumps reach deeper and deeper into underground reservoirs, they draw in saline water. The solution, Hirsch says, is to search further inland for wells or river sources – or turn to desalination. The plunging cost of reverse osmosis, the escalating cost of developing freshwater sources, and the unreliability of those sources during periods of drought are favorably reconfiguring the economics of seawater desalination. In 2003, Tampa Bay (Florida) Water activated a 25 million-gallon-per-day desal plant that produces water at a cost of $2 per 1,000 gallons ($650 per acre-foot). San Diego County Water Authority is planning a 50 mgpd facility. Groundwater-dependent cities throughout the desert regions of the western states have been dipping deeper and deeper to pump groundwater reservoirs at greater and greater expense, while also coping with saltwater intrusion. Through higher water prices, xeriscaping, the use of low-flow appliances, and the purchase of surface water rights from farmers, desert communities are managing, sometimes just barely, to avert crisis. Aquifer storage and recovery are another possibility for both coastal and desert cities. Water extracted from streams during periods of abundant flow or from the outflow pipe of water treatment facilities is pumped into wells or spread over land and allowed to infiltrate. Since 1987, all developments in Scottsdale, Arizona, have paid a water resources acquisition fee. A state -of-the-art water campus treats wastewater to irrigation standards for golf courses. When irrigation demand drops, water is purified to drinking water standards and pumped underground. Water utilities try to plan for future needs by forecasting supply and demand, then developing strategies to meet their internally established reliability criteria. When shortages become apparent, the provider trys to adapt. The traditional approach was dams, pipelines, new wells, desal plants and water reclamation. Now, conservation is generally seen as the first line of defense against shortages. In New Mexico, the developer of a master-planned community worked with local officials throughout the planning process to develop a comprehensive water plan. At the

Resource Capacity Study 26 Nipomo Mesa Water Supply
homesite scale, low-flow appliances were installed, swimming pools were prohibited, xeriscaping was encouraged and irrigated areas were limited to 1,000 square feet. Actual consumption in 2001 averaged 58,600 gallons per unit per year, compared to 70,000 gallons in a typical municipal system. In 2002, with water restrictions and surcharges in place, use dropped to 48,900 gallons per unit. Beginning in 2003, each new home was equipped with a cistern to store rain water for future landscape irrigation. This was expected to reduce consumption further, to about 29,300 gallons per unit per year. A Los Angeles-based nonprofit group retrofitted an existing home with a cistern, water retention grading, vegetated swales to slow the flow of stormwater and filter pollutants, sunken gardens to hold rainwater until it could infiltrate the soil, redirected downspouts, and a drywell at the base of the driveway that captured runoff in a box of sand and crushed rock. In a public demonstration, a local fire department dumped two tons of water (about 500 gallons) on the roof; all of it remained on site. Catching rainwater as close as possible to its point of origin with low-tech, decentralized, on-site techniques is a strategy that saves money, replenishes groundwater, reduces pollutants and creates an urban environment with more green space, native landscaping, and trees.

Resource Capacity Study 27 Nipomo Mesa Water Supply
12. Appendix C Nipomo Mesa Groundwater Resource Capacity Study, San Luis Obispo County, California, S.S. Papadopulos & Associates, Inc., San Francisco, CA, March, 2004
This document may be accessed on the internet at www.slocountywater.org