NILS_METADATA426316,en.docx · Web viewThe owner of this document is NILS-RSU and any changes to...
93
Supported by funding from: Northern Ireland Longitudinal Study Metadata NILS-RSU NILS_RSU_FEB2018
Transcript of NILS_METADATA426316,en.docx · Web viewThe owner of this document is NILS-RSU and any changes to...

Supported by funding from:
Northern Ireland Longitudinal Study
MetadataNILS-RSU
NILS_RSU_FEB2018

Table of Contents01
INTRODUCTION
02 CORENILSDATA03 EVENTS04 BIRTHSSTATS05 DEATHSSTATS06 MARRIAGESTATS07 XAGES08 ADDRESS HISTORY09 MIGRATION EVENTS10 CENSUSP_198111 CENSUSHH_198112 CENSUSP_199113 CENSUSHH_199114 CENSUSP_200115 CENSUSHH_200116 CENSUS01_RELATIONSMATRIX17 CENSUSP_201118 CENSUSHH_201119 CENSUS11_RELATIONSMATRIX20 PROPERTIES21 XDEATH_DETAILS22 WEATHER23 POLLUTION24 WEATHER AND POLLUTION25 SCHOOL26 2001 PERSON IMPUTATION FLAGS27 2001 HOUSEHOLD IMPUTATION FLAGS28 2011 PERSON IMPUTATION FLAGS29 2011 HOUSEHOLD IMPUTATION FLAGS30 MATCH RATES31 DOCUMENT VERSION CONTROL
2

1. IntroductionThis document should be used in conjunction with the NILS Data Dictionary. The combined set of information provides full metadata for the NILS database.
The NILS Data Dictionary will provide the value labels for all the variables. This document includes a description of variables and some value labels that are essential for the understanding of the NILS structure and NILS sample membership.
The owner of this document is NILS-RSU and any changes to the document should be suggested to NILS-RSU who will make amendments if required.
Current Database Structure
The NILS Database has been subject to various structure changes in its lifespan which can mostly be attributed to the addition of various data over time.
On its initial launch the NILS-Core dataset consisted of a download of NILS members (persons with 1 of 104 birth dates) from what is now the BSO Health Card Registrations, who were identified as being 'Live' at April 2001. This data was linked to 2001 Census and Vital Events (Births, Deaths) information. At that point it was agreed that the NILS would be routinely updated with a bi-annual download of Health Card data and an annual download of births and deaths data.
With the further inclusion of 1981 Census, 1991 Census and 2011 Census data, the database structure has changed significantly, with the NILS-Core dataset now consisting of all NILS members identified as being 'Live' in at least one of the 34 health downloads (April 2001 to October 2017) or having a birth date before April 1991 and reported as having died or emigrated after April 1991. The NILS also includes Vital Events information of births registrations from 1974 onwards, deaths registrations from 1991 onwards, marriages registrations from 2005 onwards and widowerhoods of deaths registered from 1991 onwards.
Restricted Files and Restricted Variables
On occasion, further restricted or confidential information may be made available for the processing of derived variables for research projects. These variables are included in the database but are flagged with an X to indicate that researchers must justify their use during the initial application process.
NILS SolutionProperty Indicator Include XUPRN on all datasets where appropriate:
CORENILSDATA, ADDRESS_HISTORY, BIRTHSSTATS, CENSUSHH, MIGRATION_EVENTS
Capital Value Create an encrypted property number called XUPRN. The PROPERTIES table will have XUPRN as a key identifier with all property information such as Capital Value
Settlement Bands Attach to the census household table and properties tableAge at Specific Time Point An additional table called XAGES has been created with the age of each person at each
download from the BSO. For the current database this will include 34 different ages
Detailed Cause of Death An additional table XDEATH_DETAILS has been created containing detailed ICD09 and ICD10 codes for NILS deaths
Date of Registration vs. Date of Occurrence for Events
Vital events (including births and deaths) have 2 different dates associated with them. One is the date of the event taking place (e.g. date of birth and date of death) called the Occurrence Date and the other is the Date of Registration (i.e. the date the event was registered with the Registrar in the local offices).
Statistics on the number of events by Date of Registration do not change. Statistics on the number of events by Occurrence Date will change because of late registrations of events.
The Northern Ireland Registrar General’s annual report and other Vital Events publications use the Date of Registration to
3

produce the finalised fixed number of events. The Vital Events statistical coded data are not finalized until after the publication of the Registrar General’s annual report. This is because an intense QA process takes place verifying any anomalies in the data.
The following table, using births data, highlights the delay in getting finalised information on Births Occurrences.
Occurrence* Registration Publication** Months before MatchingJan-16 Feb-16 Aug-17 19Feb-16 Mar-16 Aug-17 18Mar-16 Apr-16 Aug-17 17Apr-16 May-16 Aug-17 16May-16 Jun-16 Aug-17 15Jun-16 Jul-16 Aug-17 14Jul-16 Aug-16 Aug-17 13
Aug-16 Sep-16 Aug-17 12Sep-16 Oct-16 Aug-17 11Oct-16 Nov-16 Aug-17 10Nov-16 Dec-16 Aug-17 9Dec-16 Jan-17 Aug-17 8Jan-17 Feb-17 Aug-18 19
Date-Stamped Database
It is planned to release a NILS database in Quarter 2 (July - September) and Quarter 4 (January - March) each year. The table below details the new information that will be added into the NILS at each download.
Quarter 2 Release Quarter 4 ReleaseHealth (April Download) Health (October Download)Pointer (May Download) Pointer (November Download)VLA (Annual Download) GRO Births (Latest available RG Report)
GRO Deaths (Latest available RG Report)GRO Marriages (Latest available RG Report)GRO Widowerhoods (Latest available RG Report)NIMS Update (Latest available RG Report)
The database will be called NILS_RSU_MMMYYYY. The current NILS database structure has been created and date stamped ‘NILS_RSU_FEB2018’.
Each database will have a table called DATA_RELEASED which indicates the time period which the data in each table covers. The NILS_RSU_FEB2018 database DATA_RELEASED table contents are shown below.
Any additional changes to the database such as the definition/format of a variable, improved coverage of, etc. will be recorded in the DATA_RELEASED table.
Data Date ReferenceCORENILSDATA APRIL 2001 to OCTOBER 2017 (34 downloads)XAGES APRIL 2001 to OCTOBER 2017 (34 downloads)ADDRESS_HISTORY APRIL 2001 to OCTOBER 2017 (34 downloads)MIGRATION_EVENTS APRIL 2001 to OCTOBER 2017 (34 downloads)EVENTS: BIRTHS OF NILS MEMBERS JANUARY 1974 to DECEMBER 2016 (Registrations)EVENTS: BIRTHS TO NILS MOTHERS JANUARY 1974 to DECEMBER 2016 (Registrations)EVENTS: BIRTHS TO NILS FATHERS JANUARY 1974 to DECEMBER 2016 (Registrations)EVENTS: DEATHS OF NILS MEMBERS JANUARY 1991 to DECEMBER 2016 (Registrations)EVENTS: WIDOWERHOODS OF NILS MEMBERS JANUARY 1991 to DECEMBER 2016 (Registrations)BIRTHSSTATS JANUARY 1974 to DECEMBER 2016 (Registrations)
4

DEATHSSTATS JANUARY 1991 to DECEMBER 2016 (Registrations)MARRIAGESSTATS JANUARY 2005 to DECEMBER 2016 (Registrations)CENSUSP_1981 5th APRIL 1981CENSUSHH_1981 5th APRIL 1981CENSUSP_1991 21st APRIL 1991CENSUSHH_1991 21st APRIL 1991CENSUSP_2001 29th APRIL 2001CENSUSHH_2001 29th APRIL 2001CENSUS01_RELATIONSMATRIX 29th APRIL 2001CENSUSP_2011 27th MARCH 2011CENSUSHH_2011 27th MARCH 2011CENSUS11_RELATIONSMATRIX 27th MARCH 2011SCHOOLS School Enrolment Data at institutional level as per the 2010/2011
Academic YearPROPERTIES Based on DECEMBER 2016 LPS Data & OCTOBER 2017 POINTER
DataWEATHER JANUARY 1981 to DECEMBER 2010POLLUTION JANUARY 2001 to DECEMBER 2016
5

SOA Geography Methodology
Over time the various Northern Ireland Census' have used different geographies and different methods of applying those geographies onto households within NI. To allow consistency of geographies over time for research purposes Super Output Areas have been deemed the most suitable. To allocate SOA for each Census the following methods have been used:
2001 Census - SOAs were created using the 2001 Census information2011 Census - New SOAs were created as new houses had been built and land shifted. They will be very similar to those created in 2001.1991 Census - Postcodes were collected. These were linked to the Central Postcode Directory in order to assign a 2001 SOA to the 1991 information.1981 Census - No postcode information was collected, however 1km grid square data for homes was used and the closest 2001 SOA was assigned.
Summary Analysis of Core NILS Data
The following table indicates the estimated count of core NILS members in 1981, 1991, 2001 and 2011, and shows the number of NILS members linked to each of the datasets.
1981 1991 2001 2011
NILS Members --- 493676 504748 538621
1 Census 340033 439560 457413 486683
2 Censuses 315590 X X
266549 X X
232384 X X
356404 X X
306165 X X
373513 X X
3 Censuses 252715 X X X
218003 X X X
217014 X X X
287819 X X X
4 Censuses 205645 X X X X
Vital Events 293806 Births of Babies
283057 Births to Mothers
251285 Births to Fathers
107736 Deaths
27124 Brides Married
25574 Grooms Married
37039 Widowerhoods
Migration Events 750974 Address Changes
2. Metadata for CORENILSDATATable Name: CORENILSDATA
6

Table Description: NILS members' core information based on Health Card Registrations. A person is chosen as a NILS member if the day and month of their date of birth falls on one of the 104 NILS dates. The NILS members are selected from the earliest available Health data download (April 2001) and identified as being 'Live' in at least one of the health downloads. To integrate the 1991 Census into NILS, NILS members born before April 1991 and who either died or emigrated between April 1991 and April 2001 were included.
Source of the Data: Business Services Organisation (BSO) Health Card RegistrationsNumber of Records: 771010Currency of the Data: Latest information included for 201710 (YYYYMM). This table is updated and
released every 6 months.Unique Identifier: NILSIDTables Linked to: Via NILSID: ADDRESS_HISTORY, CENSUSP_1981, CENSUSP_1991, CENSUSP_2001,
CENSUSP_2011, EVENTS, MIGRATION_EVENTS, XAGES
Via CURRENT_ADDRESS_XUPRN: PROPERTIES
Variables:Variable Name Variable Description Variable ValuesNILSID System generated unique reference number for NILS member
SOURCE This provides the source of the first time the record joined NILS. Many records have a source of 200104 (April 2001)
YYYY04 = April downloadof the given yearYYYY10 = October downloadof the given year
GENDER Gender of NILS member as recorded by the BSO M = MaleF = Female
C91_STATUS Indicates if a NILS member has been selected on having a NILS birth date prior to April 1991 and they have been identified as having died or emigrated by April 2001. This indicator should not be assumed to be the status of the NILS member at this time.
0 = Estimated as not being live at April 1991
L = Estimated as being live at April 1991
STATUSHISTORY_FULL Full status history of the person. This field is variable length and has one status flag for a NILS member for each download so one can identify if/when status has changed or define a NILS population at a particular point in time.
Users should note that persons reported as having a dead or emigrated status at April 2001 may have been linked to preceding Census or Vital Events data but status information is only available from April 2001.
Also it should be noted that it was decided that from the April 2005 download onwards, NILS members having a long-term emigrated or dead status would not be included in each new NILS download.
0 = Not on Health RegisterL = Live on Health RegisterE = Flagged as gone awayD = Flagged as deceased
STATUSHIST Summarised version of STATUSHISTORY_FULL -Main changes recorded only
See STATUSHISTORY_FULL
CURRENT_ADDRESS_SOA
Super Output Area of current address There are 890 valid SOA codesXXXXXXXX = Missing(Normally invalid postcode)00000000 = No code
CURRENT_ADDRESS_ XUPRN
Anonymised Property Reference Number of current address (can be used to link to PROPERTIES table)
DODMMM Month of death if flagged as deceased (i.e. status = 'D')DODYEAR Year of death if flagged as deceased (i.e. status = ‘D’)
7

Additional Information for CORENILSDATASOURCE
This identifies the number of records that were added to the NILS in each 6 month period. The majority of NILS records were added in the first download which took place in April 2001. The first four digits of the source indicate the year and the last two digits indicate in which download each record was added (04 = April download, 10 = October download).
Although downloads are referred to as April and October, the exact date is determined by the date the BSO took the quarterly extract of their data for GP payment purposes.
CORENILSDATA – Table 1 – Distribution of SOURCEYear April October2001 573579 48182002 4914 52772003 4680 50442004 5396 48592005 6283 61882006 6634 64202007 7616 72142008 6864 70712009 6106 61522010 5806 63512011 6201 61052012 5742 60802013 5851 59822014 6150 61222015 5936 62612016 5924 60992017 6054 5231
The source is an indication of when the person first appeared on the BSO downloads and not an indication of when the person became live in NILS. STATUSHISTORY_FULL should be used for that.
In each download the BSO provides information on all live people and people who used to live in Northern Ireland and are flagged as emigrated (see Table 4).
STATUSHISTORY_FULL
The NILS_RSU_FEB2018 database includes information on all downloads, and so the length of the STATUSHISTORY_FULL field is the same as the number of downloads (within the current download this equals 34 characters). This will change in future date-stamped database downloads when more downloads are added.
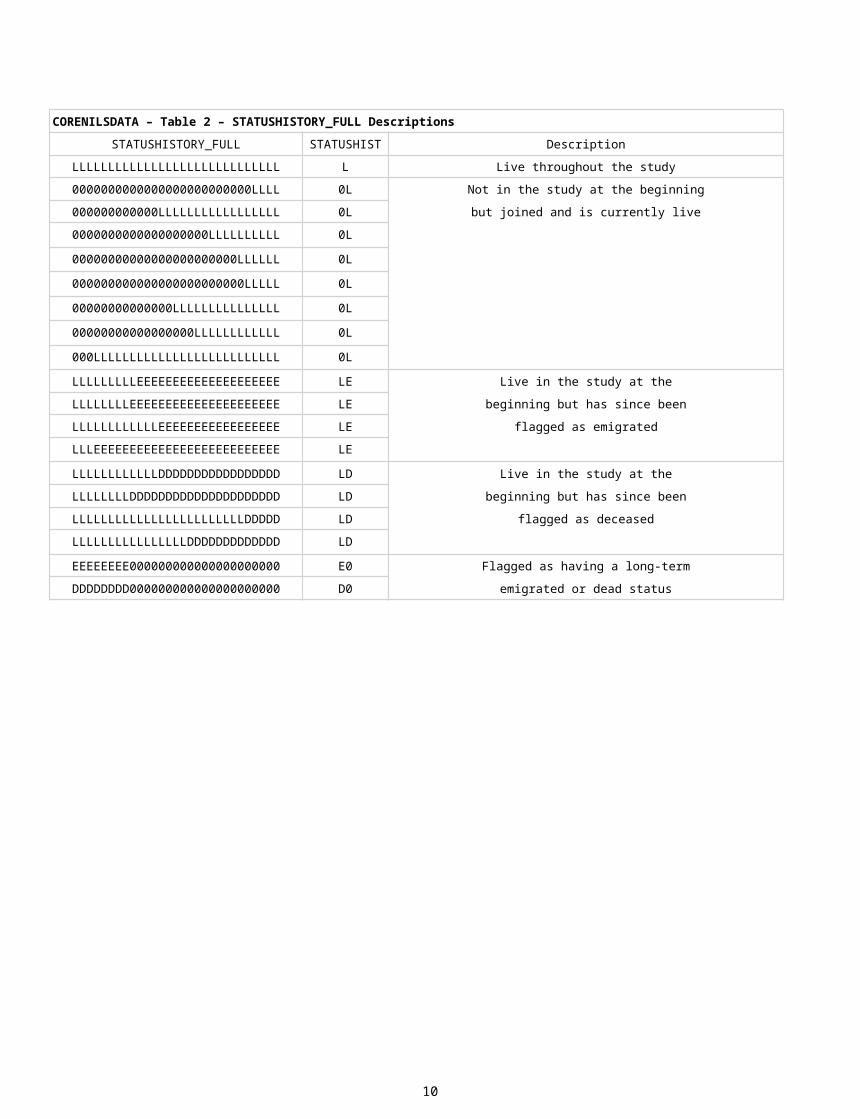
This variable gives details of the status of each NILS member at each download and it is essential that this is understood. The following table gives the most common values for STATUSHISTORY_FULL and has a brief description to illustrate what this variable means.
CORENILSDATA – Table 2 – STATUSHISTORY_FULL DescriptionsSTATUSHISTORY_FULL STATUSHIST Description
8

LLLLLLLLLLLLLLLLLLLLLLLLLLLLL L Live throughout the study0000000000000000000000000LLLL 0L Not in the study at the beginning000000000000LLLLLLLLLLLLLLLLL 0L but joined and is currently live0000000000000000000LLLLLLLLLL 0L00000000000000000000000LLLLLL 0L000000000000000000000000LLLLL 0L00000000000000LLLLLLLLLLLLLLL 0L00000000000000000LLLLLLLLLLLL 0L000LLLLLLLLLLLLLLLLLLLLLLLLLL 0L
LLLLLLLLLEEEEEEEEEEEEEEEEEEEE LE Live in the study at theLLLLLLLLEEEEEEEEEEEEEEEEEEEEE LE beginning but has since beenLLLLLLLLLLLLEEEEEEEEEEEEEEEEE LE flagged as emigrated
LLLEEEEEEEEEEEEEEEEEEEEEEEEEE LELLLLLLLLLLLLDDDDDDDDDDDDDDDDD LD Live in the study at the
LLLLLLLLDDDDDDDDDDDDDDDDDDDDD LD beginning but has since beenLLLLLLLLLLLLLLLLLLLLLLLLDDDDD LD flagged as deceased
LLLLLLLLLLLLLLLLDDDDDDDDDDDDD LDEEEEEEEE000000000000000000000 E0 Flagged as having a long-term
DDDDDDDD000000000000000000000 D0 emigrated or dead status
9
STATUSHIST
The following table shows the different combinations for STATUSHIST.
CORENILSDATA – Table 3 – STATUSHIST DistributionsSTATUSHIST Records
L 3746900L 155820LD 66581D0 43388LE 38657
0LE 30445LEL 14958E 7733EL 6596E0 6350
0LEL 4938L0 3257
LELE 26140LD 2027ELE 1698
0LELE 1643L0L 1404E0L 1358
LELEL 10520L0 887ELEL 628
0LELEL 431LELD 3980EL 3650L0L 294E0LE 266ELD 266
A NILS member could be flagged as a ‘0’ starting position if they were born after April 2001 or immigrated to Northern Ireland and have a NILS date of birth.
A person who was live in the study could drop out of the study, resulting in a STATUSHIST ending in ‘0’. This could happen if the person was removed from BSO records totally, had a date of birth which was changed to a non-NILS date, or were among a small number of records with a duplicate Central Health Index (CHI) or National Health Application and Infrastructure Services (NHAIS) number (approximately 500 per 1.6 million).
There may also be some inconsistent looking records. Examples of these include DL, DE, E0 and D0. These are likely to be administrative errors and are very small in number.
The following table shows the number of records in each of the statuses. As expected ‘0’ is smallest in the latest download (i.e. all babies and immigrants now have full records).
CORENILSDATA – Table 4 – STATUSHIST Distributions by Download
10

STATUSHISTDownload 0 D E L
1st Download 197431 43389 25442 504748 2nd Download 192683 45266 27180 505881 3rd Download 187831 47568 29200 506411 4th Download 182612 49638 31605 507155 5th Download 177976 51784 33465 507785 6th Download 172990 53795 35178 509047 7th Download 167636 55908 37922 509544 8th Download 162879 57846 39198 511087 9th Download 208705 16574 33919 51181210th Download 202446 18493 37950 51212111th Download 195744 20700 41176 51339012th Download 189398 22722 42496 51639413th Download 181741 25162 44831 51927614th Download 174575 27077 46399 52295915th Download 167811 29303 49738 52415816th Download 160788 31280 51705 52723717th Download 154765 33555 53598 52909218th Download 148657 35421 54410 53252219th Download 142917 37664 56828 53360120th Download 136646 39598 57857 53690921st Download 130528 41759 60102 53862122nd Download 124615 43668 61860 54086723rd Download 119056 45822 64337 54179524th Download 113113 47945 65955 54399725th Download 107451 50162 68669 54472826th Download 101553 52173 70086 54719827th Download 95024 54366 72139 54948128th Download 89026 56408 73423 55215329th Download 83263 58771 75675 55330130th Download 77125 60808 77147 55593031st Download 71351 63126 78609 55792432nd Download 65328 65201 80099 56038233rd Download 59344 67606 82032 56202834th Download 54190 69740 83891 563189
CURRENT_ADDRESS_SOA
Current address is the last known address for a NILS member. It can also be extracted from the ADDRESS_HISTORY table where CURRENT_FLAG = ‘C’. The following table shows the level of CURRENT_ADDRESS_SOA coverage.
CORENILSDATA – Table 5 – CURRENT_ADDRESS_SOA AssignmentSOA Code Description Records % DistributionXXXXXXXX Missing/invalid postcode 6772 0.9
Valid Valid SOA Code 764238 99.1The following table shows that the percentage of assigned SOAs is high no matter when the record was added to NILS.
CORENILSDATA – Table 6 – CURRENT_ADDRESS_SOA Assignment by SOURCEAPRIL DOWNLOAD OCTOBER DOWNLOAD
YEAR None Assigned Assigned Valid SOA
% Assigned None Assigned Assigned Valid SOA
% Assigned
2001 5597 567982 99.0 37 4781 99.22002 37 4877 99.2 36 5241 99.3
11

2003 52 4628 98.9 45 4999 99.12004 32 5364 99.4 38 4821 99.22005 63 6220 99.0 44 6144 99.32006 53 6581 99.2 54 6366 99.22007 64 7552 99.2 35 7179 99.52008 34 6830 99.5 43 7028 99.42009 26 6080 99.6 28 6124 99.52010 33 5773 99.4 37 6314 99.42011 25 6176 99.6 25 6080 99.62012 30 5712 99.5 31 6049 99.52013 42 5809 99.3 35 5947 99.42014 15 6135 99.8 25 6097 99.62015 23 5913 99.6 23 6238 99.62016 31 5893 99.5 32 6067 99.52017 21 6033 99.7 26 5205 99.5
CURRENT_ADDRESS_XUPRN
The coverage of XUPRN is lower than SOA but is still high at 95%. There are 33061 records which do not have a valid property identifier in NILS_RSU_FEB2018 current addresses.CORENILSDATA – Table 7 – CURRENT_ADDRESS_XUPRN Assignment
XUPRN Description Records % DistributionMISSING Missing (Invalid/Missing
UPRN)33061 4.3
Valid UPRN Valid Unique Property ID 737949 95.7
12

The following table shows there is a slight change in the percentage assignment of a property ID in each download.
CORENILSDATA – Table 8 – CURRENT_ADDRESS_XUPRN Assignment by SOURCEAPRIL DOWNLOAD OCTOBER DOWNLOAD
YEAR Records Valid UPRN % of Valid UPRN Records Valid UPRN % of Valid UPRN2001 573579 547530 95.5 4818 4608 95.62002 4914 4706 95.8 5277 5033 95.42003 4680 4446 95.0 5044 4815 95.52004 5396 5199 96.3 4859 4695 96.62005 6283 5996 95.4 6188 5989 96.82006 6634 6364 95.9 6420 6229 97.02007 7616 7280 95.6 7214 6977 96.72008 6864 6623 96.5 7071 6845 96.82009 6106 5865 96.1 6152 5969 97.02010 5806 5587 96.2 6351 6141 96.72011 6201 5987 96.5 6105 5931 97.12012 5742 5535 96.4 6080 5913 97.32013 5851 5630 96.2 5982 5789 96.82014 6150 5962 96.9 6122 5942 97.12015 5936 5742 96.7 6261 6076 97.02016 5924 5714 96.5 6099 5926 97.22017 6054 5831 96.3 5231 5074 97.0
Date of Death (Month and Year)
The total number of people who have been flagged as deceased in the NILS_RSU_FEB2018 database via STATUSHISTORY_FULL is 113098. All records flagged as deceased should have a date of death but this is not always the case.
The date of death recorded is the month and year that BSO staff entered onto the CHI or NHAIS when they were notified of the death. This may have come from the death certificate, a GP Practice, a family member or through a data cleansing exercise.
There are a smaller number of records within the latest year because only deaths notified to the BSO by April/October have been included. This therefore does not represent a full year’s data. These deceased records provide the basis for death events although not all of them will have a link to the DEATHSSTATS data. The following table shows the distribution of date of death.
13

CORENILSDATA – Table 9 – Death Distribution by DOD (MMM/YEAR)YEAR JAN FEB MAR APR MAY JUN JUL AUG SEP OCT NOV DEC TOTAL1991 460 362 388 334 339 316 306 270 285 318 321 400 40991992 400 410 374 308 351 322 342 297 350 346 322 386 42081993 382 333 424 394 366 315 342 311 328 347 426 473 44411994 423 337 398 365 358 351 366 284 341 368 351 341 42831995 425 346 383 362 345 323 330 335 312 333 354 445 42931996 432 402 400 303 355 286 322 274 320 338 335 400 41671997 473 385 322 299 368 315 371 302 321 303 370 364 41931998 396 363 404 351 320 364 334 338 316 333 330 396 42451999 528 399 373 319 332 313 379 345 322 316 308 495 44292000 496 385 334 327 361 301 307 315 318 348 337 372 42012001 427 359 384 374 350 319 316 352 340 352 335 411 43192002 389 349 343 321 318 347 309 350 336 332 344 388 41262003 402 363 357 335 349 333 326 328 352 366 380 371 42622004 403 341 357 376 360 305 320 313 313 352 326 394 41602005 351 358 388 345 333 350 309 316 288 300 345 354 40372006 366 343 417 360 326 336 351 316 333 354 354 361 42172007 404 383 384 341 311 296 300 322 306 339 329 384 40992008 404 381 400 344 312 335 327 313 314 311 376 416 42332009 460 359 371 344 294 299 304 304 314 337 347 383 41162010 406 308 364 317 360 345 295 317 313 329 365 378 40972011 404 339 349 349 330 328 286 306 316 312 337 387 40432012 369 349 414 384 373 323 336 341 303 323 332 405 42522013 415 358 426 381 348 284 347 304 303 327 345 385 42232014 395 366 384 344 339 300 346 341 335 359 352 409 42702015 469 395 398 350 357 364 303 317 327 381 317 417 43952016 403 338 390 345 343 343 333 315 326 363 384 408 42912017 449 389 376 319 373 333 340 296 294 0 0 0 3169
14

3. Metadata for EVENTSTable Name: EVENTSTable Description: This table gives the linking ID for all the vital event occurrences to a NILS member, or in the case
of widowerhoods, their spouse. It currently includes 7 types of events relating to births, deaths, marriages and the introduction of widowerhoods within the JUN2016 download. It will potentially be expanded over time to also include stillbirths, infant deaths, etc. Each NILS member can have many events. Only those with a valid link are included. Those that were expected to be matched but where a match could not be found are excluded.
Source of the Data: General Register Office (GRO)Number of Records: 1025621Currency of the Data: At each new release of the GRO data more events will be included. There is a significant increase
in the number of records from JUN2015 due to the addition of historical births information, from JAN2016 due to the addition of marriage information from 2005 onwards and from JUN2016 with the addition of widowerhood information from 1991 onwards.
Unique Identifier: NILSIDTables Linked to: Via LINKID:
Birth of a NILS member – GROBID to BIRTHSSTATSBirth of a baby to NILS member – GROBID to BIRTHSSTATSDeath of a NILS member – GRODID to DEATHSSTATSMarriage of a NILS member – GROMID to MARRIAGESSTATSWidowerhood of a NILS member – GRODID to DEATHSSTATS
Variables:Variable Name Variable Description Variable ValuesNILSID System generated unique reference number for NILS
memberEVENT_TYPE_NAME Name of event occurrence to NILS member
EVENT_TYPE_CODE Coded description to indicate the type of event occurred BF = Birth to NILS fatherBM = Birth to NILS motherBB = Birth of NILS babyDL = Death of NILS memberBR = Marriage of NILS brideGR = Marriage of NILS groomWH = Widowerhood of NILS member
LINKID System generated unique reference number for event occurrence to NILS member. Used to link corresponding Births, Deaths and Marriages information tables
Beginning with 'B' = Birth (GROBID)Beginning with 'D' = Death (GRODID)Beginning with 'M' = Marriage (GROMID)
15

Additional Information for EVENTSEVENT_TYPE
EVENTS – Table 1 – Number of Events by EVENT_TYPE_NAMEEvent Type Number Of Events
BIRTH 293806BIRTH TO NILS DAD 251285BIRTH TO NILS MUM 283057
DEATH 107736MARRIAGE BRIDE 27124
MARRIAGE GROOM 25574WIDOWERHOOD 37039
A birth can be represented 1, 2 or 3 times depending on whether the baby, mother and father are NILS members. A marriage can be represented 1 or 2 times depending on whether the bride and groom are NILS members. A death registration can be represented 1 or 2 times depending on whether the deceased and any potential spouse are NILS members. This figure may increase if infant deaths to NILS members are included.
EVENTS – Table 2 – Unique Birth, Death and Marriage EventsEvent Records
Number of Birth Event Records 828148Number of Unique Birth Registrations 625562
Number of Death Event Records 144775Number of Unique Death Registrations 129231
Number of Marriage Event Records 52698Number of Unique Marriage Registrations 45434
The probability of the birth having a NILS mum is 0.28, the probability of the birth having a NILS dad is 0.28, and the probability of the baby being a NILS member is 0.28.
The probability of each birth having a NILS mum, dad or baby is 0.627. Therefore approximately 62.7% of published births to Northern Ireland residents should be included in NILS.
The following table shows the number of records for each baby, mum and dad combination.
EVENTS – Table 3 – Combination of NILS Baby, Mum and DadCombination RecordsBaby Only 163214Mum Only 151664Dad Only 128301
Baby & Mum (No Dad) 59399Mum & Dad (No Baby) 51791Baby & Dad (No Mum) 50990
Baby, Mum & Dad 20203
The probability of the marriage having a NILS bride is 0.28, and the probability of the marriage having a NILS groom is 0.28.
The probability of each marriage having a NILS bride or groom is 0.482. Therefore approximately 48.2% of published marriages to Northern Ireland residents should be included in NILS.
The following table shows the number of records for each bride and groom combination.
EVENTS – Table 4 – Combination of NILS Bride and GroomCombination RecordsBride Only 19860
Groom Only 18310
16

Bride & Groom 7264
The probability of a death being of a NILS member is 0.28. In the 2011 Census, approximately 38.4% of NILS members were married and so the probability of a death being of a NILS member's spouse is approximately 0.38x0.28 = 0.11.
The probability of each death being of a NILS member or to a NILS member's spouse is 0.359. Therefore approximately 35.9% of published deaths to Northern Ireland residents should be included in NILS.
The following table shows the number of records for each death combination.
EVENTS - Table 5 - Combination of NILS members and their spouseCombination Records
Member Only 97035
Spouse Only 26307
Member & Spouse 10694
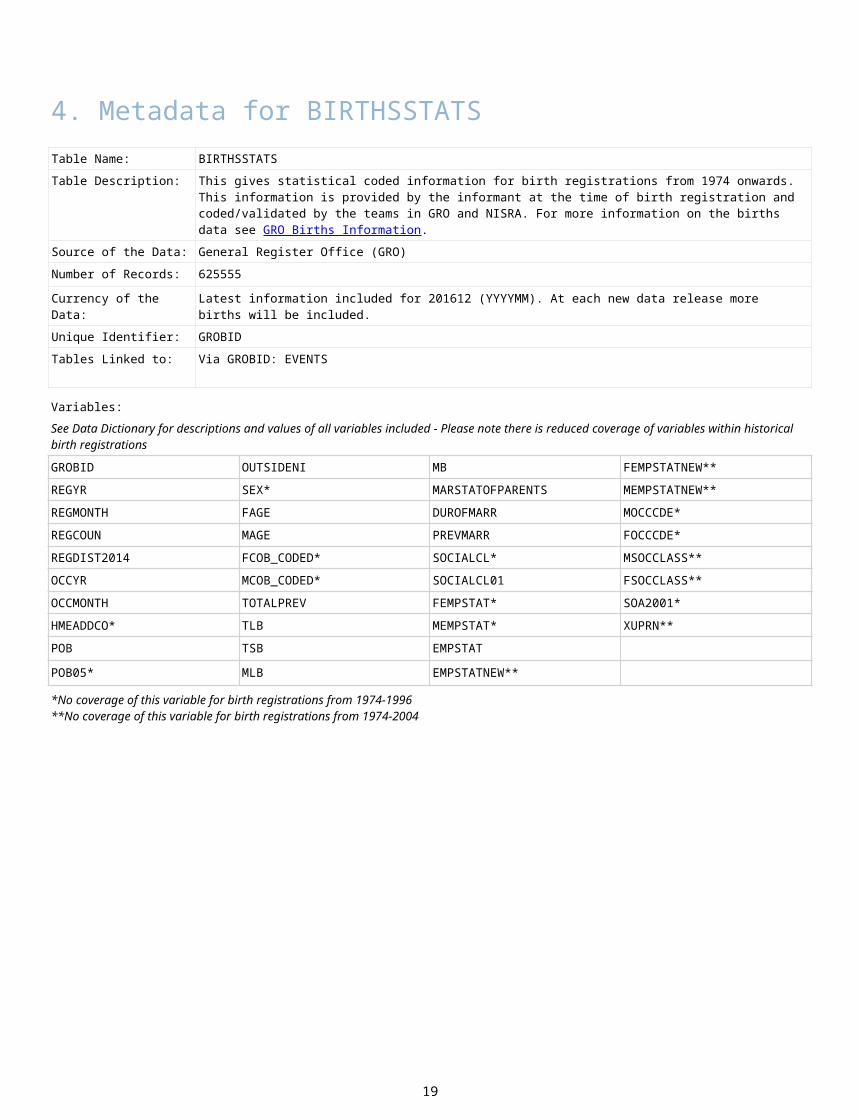
4. Metadata for BIRTHSSTATSTable Name: BIRTHSSTATSTable Description: This gives statistical coded information for birth registrations from 1974 onwards. This information is
provided by the informant at the time of birth registration and coded/validated by the teams in GRO and NISRA. For more information on the births data see GRO Births Information.
17

Source of the Data: General Register Office (GRO)Number of Records: 625555Currency of the Data: Latest information included for 201612 (YYYYMM). At each new data release more births will be
included.Unique Identifier: GROBIDTables Linked to: Via GROBID: EVENTS
Variables:See Data Dictionary for descriptions and values of all variables included - Please note there is reduced coverage of variables within historical birth registrations
GROBID OUTSIDENI MB FEMPSTATNEW**REGYR SEX* MARSTATOFPARENTS MEMPSTATNEW**REGMONTH FAGE DUROFMARR MOCCCDE*REGCOUN MAGE PREVMARR FOCCCDE*REGDIST2014 FCOB_CODED* SOCIALCL* MSOCCLASS**OCCYR MCOB_CODED* SOCIALCL01 FSOCCLASS**OCCMONTH TOTALPREV FEMPSTAT* SOA2001*HMEADDCO* TLB MEMPSTAT* XUPRN**POB TSB EMPSTATPOB05* MLB EMPSTATNEW***No coverage of this variable for birth registrations from 1974-1996**No coverage of this variable for birth registrations from 1974-2004
Additional Information for BIRTHSSTATSLegal Requirements
Babies born in Northern Ireland must be registered within 42 days of birth.
Who can register a birth?
For married couples either parent can register the birth on their own. However, in the case of a child born to an unmarried couple, the name of the father may only be recorded in the entry of birth if both parents attend and sign the registration together or a declaration of paternity is produced.
The following people may also register the birth:· Grandparent, uncle or aunt of the baby who has knowledge of the birth· Any person present at the birth
18
· Any person having charge of the child· The occupier of the premises where the baby was born· District Registrars in Northern Ireland
The following information is required to register a birth:· A birth registration form filled in by person registering the birth (usually mother)· Full name of the baby (any language providing any Unicode character is used)· Sex, date of birth, district and place of birth of the baby· Full names, dates of birth, addresses and occupations of parents
Declaration of Paternity
An unmarried father who registers the birth of his child jointly with the child’s natural mother, and has his name recorded on the birth registration form, will for children born on or after 15 April 2002, acquire parental responsibilities.
DATE OF BIRTH
The following table shows the distribution of date of birth.
19

20
AGE OF FATHER AND MOTHER (FAGE/MAGE)
The following figures show that the recorded ages of both fathers and mothers when their child is born are normally distributed. The average age of fathers is 31.1, whilst the average age for mothers is 28.4.
BIRTHSSTATS – Table 1 – Distribution of Births by OCCYR and OCCMONTHYEAR JAN FEB MAR APR MAY JUN JUL AUG SEP OCT NOV DEC TOTAL1974 1143 1028 1208 1237 1180 1089 1154 1070 1189 1148 1081 1074 136011975 1157 1023 1220 1124 1199 1144 1158 1079 1133 1064 926 1137 133641976 1179 1061 1240 1273 1258 1287 1188 1157 1101 1124 1033 1005 139061977 1130 1057 1207 1147 1254 1246 1238 1177 1174 1156 1038 1015 138391978 1169 1070 1197 1176 1281 1191 1159 1176 1327 1185 1136 1124 141911979 1222 1146 1376 1427 1438 1281 1316 1312 1285 1323 1146 1135 154071980 1218 1167 1395 1405 1470 1244 1385 1278 1317 1309 1098 1219 155051981 1166 1102 1283 1283 1252 1187 1155 1159 1234 1201 1048 1126 141961982 1191 1012 1151 1272 1191 1240 1125 1149 1206 1194 1067 1084 138821983 1208 1014 1286 1207 1242 1326 1209 1300 1301 1108 1108 1091 144001984 1173 1148 1248 1250 1291 1311 1190 1256 1220 1261 1156 1189 146931985 1267 1086 1300 1233 1228 1191 1261 1266 1275 1242 1094 1086 145291986 1216 1189 1417 1313 1308 1227 1258 1262 1263 1239 1078 1221 149911987 1283 1126 1265 1307 1353 1275 1176 1256 1271 1202 1105 1117 147361988 1282 1092 1275 1281 1337 1305 1296 1230 1269 1109 1078 1038 145921989 1158 1118 1221 1242 1219 1211 1221 1250 1197 1123 1113 1148 142211990 1166 1090 1291 1225 1251 1298 1193 1183 1281 1235 1125 1243 145811991 1258 1225 1369 1295 1300 1273 1330 1308 1296 1181 1220 1194 152491992 1248 1147 1354 1308 1332 1333 1210 1281 1312 1195 1091 1163 149741993 1181 1060 1271 1259 1327 1296 1192 1206 1284 1207 1187 1204 146741994 1213 1071 1241 1211 1287 1287 1183 1212 1230 1131 1160 1100 143261995 1170 1047 1210 1192 1198 1266 1209 1190 1238 1156 1123 1080 140791996 1267 1124 1202 1139 1199 1143 1213 1292 1240 1258 1177 1243 144971997 1215 1192 1301 1235 1253 1232 1244 1268 1233 1217 1061 1153 146041998 1211 1104 1247 1266 1317 1214 1276 1207 1299 1229 1053 1123 145461999 1160 1034 1257 1218 1215 1203 1177 1211 1288 1179 1054 1126 141222000 1219 991 1111 1062 1180 1146 1151 1167 1161 1109 1020 1142 134592001 1129 1030 1123 1133 1073 1172 1152 1204 1173 1161 1103 1053 135062002 1050 971 1151 1083 1126 1037 1112 1180 1147 1156 1074 1124 132112003 1049 1051 1081 1110 1107 1057 1236 1174 1101 1141 1082 1117 133062004 1163 972 1114 1121 1172 1124 1164 1159 1292 1289 1137 1119 138262005 1177 1038 1159 1175 1127 1207 1159 1257 1239 1139 1078 1131 138862006 1174 1070 1167 1173 1287 1225 1213 1271 1328 1242 1215 1183 145482007 1271 1154 1290 1189 1213 1221 1290 1369 1339 1376 1225 1283 152202008 1363 1220 1276 1354 1285 1258 1324 1341 1378 1427 1225 1309 157602009 1271 1178 1396 1300 1260 1320 1312 1288 1361 1289 1277 1332 155842010 1361 1196 1353 1277 1337 1328 1411 1294 1448 1361 1350 1355 160712011 1343 1173 1311 1271 1300 1273 1399 1313 1420 1267 1311 1278 156592012 1381 1237 1357 1318 1271 1295 1304 1360 1444 1388 1345 1285 159852013 1248 1159 1193 1229 1239 1166 1374 1306 1336 1247 1164 1228 148892014 1293 1145 1275 1274 1250 1190 1244 1386 1370 1345 1223 1272 152672015 1218 1051 1244 1215 1267 1191 1312 1319 1381 1340 1223 1272 150332016 1210 1129 1207 1174 1268 1279 1279 1297 1362 1243 1264 531 14243

21

HOME ADDRESS (HMEADDCO)
The following table shows NILS births registered within each district up to December 2014. This information is not available for birth registrations prior to 1997.
BIRTHSSTATS – Table 2 - Distribution of Births by DISTRICTDistrict Records % DistributionAntrim 8243 3.1Ards 9758 3.7
Armagh 8753 3.3Ballymena 8528 3.2Ballymoney 4270 1.6Banbridge 6917 2.6
Belfast 40120 15.2Carrickfergus 5016 1.9Castlereagh 8889 3.4Coleraine 7206 2.7
Cookstown 5158 2.0Craigavon 14599 5.5
Derry 17460 6.6Down 9921 3.8
Dungannon 9087 3.5Fermanagh 8870 3.4
Larne 3777 1.4Limavady 4739 1.8Lisburn 16904 6.4
Magherafelt 7249 2.8Moyle 1970 0.7
Newry & Mourne 16471 6.3Newtownabbey 11762 4.5
North Down 9592 3.6Omagh 7512 2.9
Strabane 5748 2.2NULL 4846 1.8
HOME ADDRESS (HMEADDCO)
22

The following table shows NILS births registered within each of the new council districts from January 2015 onwards.
BIRTHSSTATS – Table 3 - Distribution of Births by DISTRICTDistrict Records % Distribution
Antrim and Newtownabbey 2263 7.5Armagh, Banbridge and Craigavon 2075 6.9
Belfast 5462 18.2Causeway Coast and Glens 2059 6.9
Derry and Strabane 1477 4.9Fermanagh and Omagh 1784 6.0Lisburn and Castlereagh 2219 7.4
Mid and East Antrim 1914 6.4Mid Ulster 2655 8.9
Newry, Mourne and Down 3140 10.5North Down and Ards 1289 4.3
NULL 3642 12.1SEX
The following table shows the number and percentage of births for each gender.
BIRTHSSTATS – Table 4 - Distribution of Births by SEXGender Records % Distribution
Male 321039 51.3Female 304516 48.7
MARITAL STATUS OF PARENTS
The BIRTHSSTATS table includes information on the status of the relationship between parents at birth. The following table shows the distribution of marital status at the time of birth within Northern Ireland.BIRTHSSTATS – Table 5 - Distribution of Births by MARSTATOFPARENTS
Marital Status of Parents Records % DistributionMarried 489159 78.2
Mother Only 49256 7.9Mother and Father at same Address 40915 6.5
Mother and Father at different Address 46225 7.4
23

5. Metadata for DEATHSSTATSTable Name: DEATHSSTATSTable Description: This gives statistical coded information for death registrations from 1991 onwards. This
information is provided by the informant at the time of death registration and coded/validated by the teams in GRO and NISRA.
Source of the Data: General Register Office (GRO)Number of Records: 133987Currency of the Data: Latest information included for 201612 (YYYYMM). At each new data release more deaths will be
included.Unique Identifier: GRODID
Tables Linked to: Via GRODID: EVENTS, XDEATH_DETAILS
Variables:See Data Dictionary for descriptions and values of all variables included - Please note there is reduced coverage of variables within historical death registrationsGRODID DTHMNTH HMEDIST PLACEOFDEATHCODEDREGDIST DTHYR HYPERTENSION* SEXREGDIST2014 AGE ICD10CHAP** SOA_USRES*REGMNTH COUNTRYOFBIRTH** MAINCAUSE** SOCIALCLASSREGYR COUNTRYOFUSUALRESIDENCE* MARITAL SOCIALCLASS01BRTHMNTH EMPSTAT OCCCDE TYPEOFDTBRTHYR EMPSTAT05 OUTSIDENI TYPEOFDT05
*No coverage of this variable for death registrations from 1991-1996**No coverage of this variable for death registrations from 1991-2001
Additional Information for DEATHSSTATSLegal Requirements
In Northern Ireland a death should be registered within five days to allow funeral arrangements to be made. This is with the exception of deaths which have been referred to the coroner. A death can be registered with the registrar in the district in which the person died, or in the district in which the person normally lived, if within Northern Ireland.
A death which occurs in Northern Ireland can be registered by:· Any relative of the deceased who has knowledge of the details required to be registered (including a relative by
marriage)· A person present at the death· A person taking care of the funeral arrangement· The executor or administrator of the deceased’s estate· The governor, matron or chief officer of a public building where the death occurred· A person living in/responsible for a house/lodging/apartment where the death occurred· A person finding, or a person taking charge of the body
Most deaths are registered by a relative of the deceased. The registrar would normally only allow one of the others listed to do so if no relatives are available or they cannot be traced.
Information required for registering a death:· Full name, surname, maiden name (if applicable), date and place of birth of deceased· Date and place of death and usual address· Marital status (single, married, widowed or divorced)· Occupation of the deceased (if the deceased was a wife or widow, the full name and occupation of her husband or
deceased husband) will be required· If the deceased was a child the name and occupation of the father is required, or where parents aren't married the
name and occupation of the mother is required· The name and address of the deceased’s GP· Details of any pension apart from a state pension that the deceased held
24

DATE OF DEATH
25

The following tables show distribution of date of death by both year and month.
26
DEATHSSTATS – Table 1 – Distribution of Death by DTHYR and DTHMNTHYEAR JAN FEB MAR APR MAY JUN JUL AUG SEP OCT NOV DEC TOTAL1991 466 366 391 357 403 379 373 340 359 381 390 499 47041992 493 502 461 365 433 382 428 378 415 434 397 480 51681993 458 430 493 490 447 406 409 398 407 434 539 572 54831994 507 408 481 436 454 434 452 352 410 440 424 432 52301995 503 437 454 444 441 397 398 406 393 413 427 522 52351996 543 501 495 390 431 352 410 346 395 408 422 497 51901997 578 464 405 376 440 384 458 394 399 381 440 449 51681998 486 458 478 454 376 421 420 429 400 421 413 474 52301999 634 488 472 388 399 378 456 422 389 392 384 600 54022000 610 453 411 410 446 365 390 381 388 429 408 445 51362001 502 427 476 454 429 387 388 432 412 433 396 480 52162002 462 445 435 393 406 421 392 433 414 415 423 464 51032003 497 444 440 402 423 398 407 401 427 461 449 449 51982004 487 430 436 459 437 368 403 393 375 434 387 464 50732005 427 442 481 428 415 434 378 397 372 372 432 445 50232006 461 432 513 442 409 422 426 393 418 414 430 447 52072007 507 483 458 421 398 374 392 399 357 428 406 468 50912008 501 461 495 435 391 415 407 404 397 396 453 521 52762009 549 431 470 418 369 379 379 378 396 428 429 496 51222010 498 402 443 368 434 420 370 391 380 424 427 480 50372011 496 410 422 416 430 412 363 378 390 403 420 491 50312012 486 415 502 479 471 400 420 417 381 405 426 498 53002013 477 415 495 449 402 339 407 368 350 416 412 456 49862014 462 422 444 421 396 346 406 422 410 426 414 481 50502015 566 461 468 420 441 433 384 382 394 451 383 499 52822016 485 410 454 420 425 404 417 389 392 426 457 357 5036

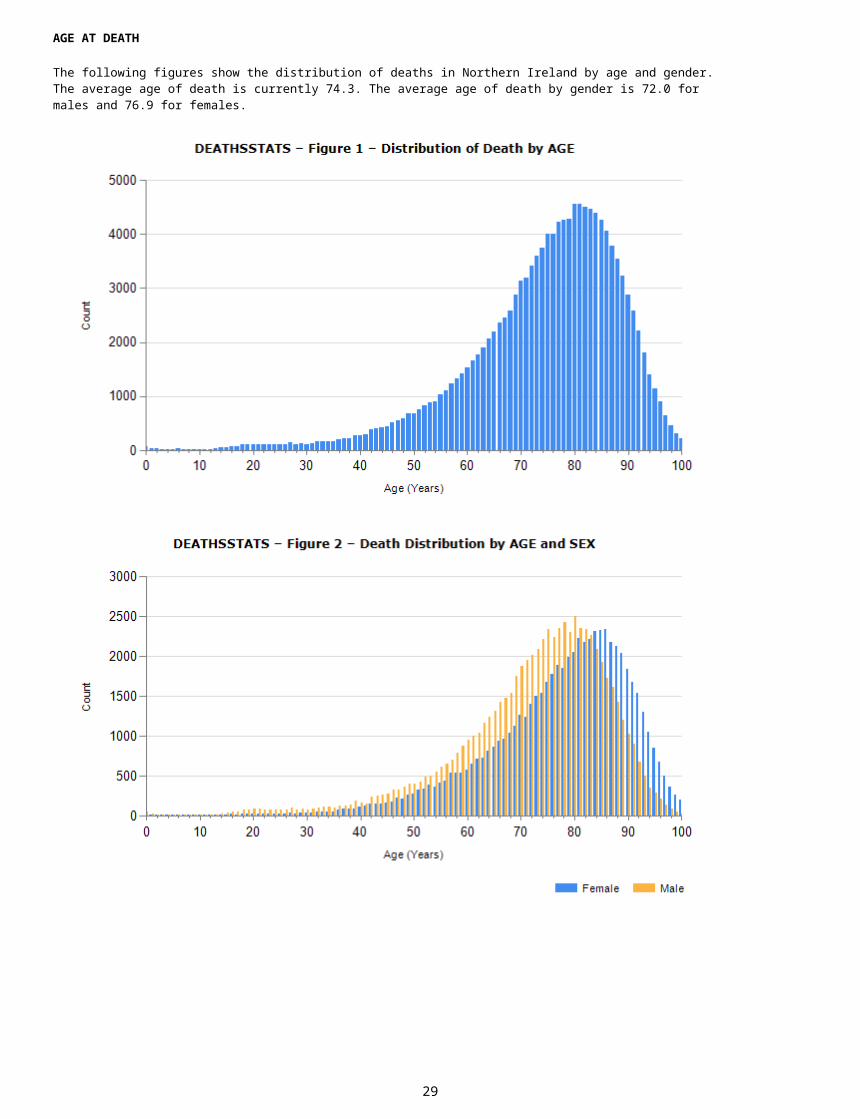
AGE AT DEATH
The following figures show the distribution of deaths in Northern Ireland by age and gender. The average age of death is currently 74.3. The average age of death by gender is 72.0 for males and 76.9 for females.
27

6. Metadata for MARRIAGESSTATSTable Name: MARRIAGESSTATSTable Description: This gives statistical coded information for marriage registrations from 2005 onwards. This
information is provided by the informant at the time of marriage registration and coded/validated by the teams in GRO and NISRA.
Source of the Data: General Register Office (GRO)Number of Records: 45434Currency of the Data: Latest information included for 201612 (YYYYMM). At each new data release more births will be
included.Unique Identifier: GROMIDTables Linked to: Via GROMID: EVENTS
Variables:See Data Dictionary for descriptions and values of all variables included - Please note there is reduced coverage of variables within historical birth registrations
GROMID BNATIONALITY GMARSTAT COHABITINGREGYR BMARSTAT GMARSTAT_CODED MARRTYPEREGMNTH BMARSTAT_CODED GEMPLDEF MARRLOCATIONREGDIST BEMPLDEF GEMPLSTAT DENOM_CODEDREGDIST2014 BEMPLSTAT GSOC PLACETYPEEVENTDIST BSOC GSOCIALCLASS VENUEEVENTDIST2014 BSOCIALCLASS GRETIRED BAGEMARRMARRYR BRETIRED BCCOUNTRY_CODED GAGEMARRMARRMNTH GSEX GCCOUNTRY_CODEDBSEX GCOB_CODED BFCOUNTRY_CODEDBCOB_CODED GNATIONALITY GFCOUNTRY_CODED
28
Additional Information for MARRIAGESSTATSLegal Requirements
Any two people can marry in Northern Ireland provided:
· Both are at least 16 years of age on the day of their marriage – anyone under 18 will need permission from their parent or guardian, or if appropriate a court order to allow their marriage to go ahead
· They are not related to each other in a way which would prevent their marrying· They are unmarried (any previous marriage must have been ended by divorce, death or annulment)· They are not the same sex· They are capable of understanding the nature of a marriage ceremony and of agreeing to marriage
Couples intending to marry in Northern Ireland have a choice of either a religious or civil ceremony. The following information is required to register a marriage:
· Full names, dates of birth, addresses and occupations of bride and groom· Signatures from you, your partner and 2 witnesses (over 16 years of age)
DATE OF MARRIAGE
The following table shows the distribution of date of marriage.
MARRIAGESSTATS – Table 1 – Distribution of Marriages by MARRYR and MARRMNTHYEAR JAN FEB MAR APR MAY JUN JUL AUG SEP OCT NOV DEC TOTAL2005 75 116 191 268 308 406 501 602 505 291 153 233 36492006 84 124 159 279 293 439 529 617 570 280 175 226 37752007 77 118 207 260 348 496 556 681 531 287 192 222 39752008 113 140 264 227 378 410 523 738 465 318 190 227 39932009 90 124 141 302 378 395 511 513 430 324 171 210 35892010 81 111 173 304 383 413 552 480 443 359 157 247 37032011 88 113 167 368 337 468 533 574 461 293 211 237 38502012 64 115 203 282 388 484 473 595 457 261 186 271 37792013 85 114 203 297 378 410 458 591 409 258 222 238 36632014 93 142 195 339 446 410 491 640 439 295 197 221 39082015 91 115 190 298 427 385 524 559 452 343 174 238 37962016 112 123 225 312 328 411 535 555 454 316 187 177 3735
AGE OF BRIDE AND GROOM
The following figures show that the recorded ages of both brides and grooms at marriage are normally distributed. The average age of brides is 30.9, whilst the average age for grooms is 33.1.
29

30

REGISTRATION DISTRICT
The following table shows NILS marriages registered within each district between January 2005 and December 2014.
MARRIAGESSTATS – Table 2 - Distribution of Marriages by REGDISTDistrict Records % DistributionAntrim 1256 2.8Ards 1254 2.8
Armagh 1550 3.4Ballymena 2012 4.4Ballymoney 601 1.3Banbridge 912 2.0
Belfast 6560 14.4Carrickfergus 949 2.1Castlereagh 936 2.1Coleraine 1428 3.1
Cookstown 1136 2.5Craigavon 1747 3.8
Derry 2453 5.4Down 1839 4.0
Dungannon 1488 3.3Fermanagh 1971 4.3
Larne 614 1.4Limavady 868 1.9Lisburn 2301 5.1
Magherafelt 1102 2.4Moyle 493 1.1
Newry & Mourne 2436 5.4Newtownabbey 997 2.2
North Down 2598 5.7Omagh 1339 2.9
Strabane 801 1.8NULL 3793 8.3
NEW REGISTRATION DISTRICT
The following table shows NILS marriages registered within each of the new districts from January 2015 onwards.
MARRIAGESSTATS – Table 3 - Distribution of Marriages by REGDISTDistrict Records % Distribution
Antrim and Newtownabbey 358 2.3Armagh, Banbridge and Craigavon 718 4.6
Belfast 1226 8.0Causeway Coast and Glens 669 4.4
Derry and Strabane 598 4.2Fermanagh and Omagh 684 4.0Lisburn and Castlereagh 449 3.0
Mid and East Antrim 691 4.6Mid Ulster 665 4.5
Newry, Mourne and Down 840 5.8North Down and Ards 681 4.5
MARRIAGE TYPE
31

The following table shows the number and percentage of type of marriage ceremony.
MARRIAGESSTATS – Table 4 - Distribution of Marriages by MARRTYPEMarriage Type Records % Distribution
Civil 13261 29.2Religious 32173 70.8
VENUE
The following table shows the number and percentage of marriage for each marriage venue classification.
MARRIAGESSTATS – Table 5 - Distribution of Marriages by VENUEVenue Records % Distribution
No Information Available 11 0.0Civil Marriage in Registrar's Office 7145 15.7Civil Marriage in Approved Venue 6113 13.5
Religious Marriage in a Church 29000 63.8Religious Marriage Outside a Church
(i.e. hotel, castle, etc.)3165 7.0
7. Metadata for XAGESTable Name: XAGES
32

Table Description: This table is a restricted X-file and information will only be provided when sufficient justification for use has been provided during the application process. It shows the calculated age of all NILS members at each bi-annual Health Card Registration data download. Age is only shown if the person is a live member. This is the most consistent form of age and is the only one available for all NILS members.
Source of the Data: Business Services Organisation (BSO) Health Card RegistrationsNumber of Records: 771010Currency of the Data: At each new download an additional age variable is created. Within the current table there are
34 age variables included. This table is updated and released every 6 months.
Unique Identifier: NILSID
Tables Linked to: Via NILSID: CORENILSDATA
Variables:Variable Name Variable Description Variable ValuesNILSID Unique IdentifierAGEATAPR91 Age at Apr 1991 These one-off values are calculated
using DOB taken from the Health data. Age ranges from 0 to approximately 110. Missing values occur where the NILS member is not flagged as liveAGEATAPR01 Age at Apr 2001 download
AGEATOCT01 Age at Oct 2001 download... ..AGEATAPR17 Age at Apr 2017 downloadAGEATOCT17 Age at Oct 2017 download
33

Additional Information for XAGESXAGES – Table 1 – Average Age At Various Time Points
Apr 1991 Apr 2001 Apr 2011 Oct 2017Average Age 33.5 35.8 37.5 38.8
Total 507731 504748 538621 563189Total Records 771010 771010 771010 771010
34

8. Metadata for ADDRESS HISTORY
Table Name: ADDRESS_HISTORYTable Description: Address details of NILS members derived from all Health Card Registration data downloads.
One record is added for each person for each download.Source of the Data: Business Services Organisation (BSO) Health Card Registrations
Number of Records: 21066881
Currency of the Data: Latest information included for 201710 (YYYYMM). This table is updated and released every 6 months.
Unique Identifier: NILSID
Tables Linked to: Via NILSID: CORENILSDATA
Via XUPRN: PROPERTIES
Variables:Variable Name Variable Description Variable ValuesNILSID System generated unique reference number
for NILS memberSOURCE This gives the date of the download that the
NILS member first joinedYYYY04 = April download of the given yearYYYY10 = October download of given year
CURRENT_FLAG This indicates whether an address is a current or previous address.
C = Current AddressP = Previous Address
CHANGE_TYPE This is used to identify why an address change occurrence and can also be used to get a summative total of address changes for a NILS member
NC = No address changeAC = Address changeEM = EmigrationRE = Re-EntrantNR = New Record (first occurrence of NILS member)
SOA2001 Super Output Area of the address 890 valid SOA codesNULL = Missing value (Normally invalid postcode)
XUPRN The Anonymised Property Reference Number
PREVADD Reference to Health Download when the NILS member was first identified as residing at the previous address
PREV_SOA2001 Super Output Area of previous addressPREV_XUPRN The Anonymised Property Reference Number
of the previous address
35

Additional Information for ADDRESS HISTORYWhat is an Address Change?
Address changes have been notified to the BSO by the patient, GP or through a data cleansing exercise. Any new address is entered using QuickAddress software and the system automatically updates the date of address change field. The new postcode and/or unique property reference number (UPRN) is stored. An address change on NILS is determined by change in postcode or UPRN.
Quality Assurance
As each new download is loaded onto NILS the migration events are created. The number of address changes may be sent to the BSO for quality assurance.
Data Issues
Some data cleansing of the BSO data may show up as an address change. This data does not pick up moves that occur within a six-month period, for example:
· If someone moves several times between 2 BSO downloads this would only be picked up as 1 move with the address set to the latest BSO download address
· If someone moved out of an address and back into the same address between 2 downloads this would not be recorded on NILS
The BSO changed IT systems from the Central Health Index (CHI) to the NHAIS system in 2005. There is a slight increase in the number of address changes (and hence migration events) at this time as the BSO worked closely with GPs to remove people from their lists who had emigrated and where the BSO had not been notified. BSO also carried out a significant address cleansing exercise during 2011 and 2012, resulting in an inflated number of address changes for both the 201110 and 201204 downloads.
If someone returns to Northern Ireland the Health Card Registration System is searched and the original record is reactivated. In a small number of cases the original record cannot be found and a new Health and Care number is created. NILS matching exercises may link this person to both the old and new numbers and therefore duplicate records are identified. Approximately 15-50 of these occur in every download of the NILS.
Dr Paul Barr has analysed BSO migration data and compared against the 2000-2001 Census Migration Data to look at timing of the migration events. In summary his research has shown that address change (migration) events did happen but there is a delay in notifying the BSO. This differs based on socio-economic characteristics. Therefore caution should be used when analysing the download of the move.
ADDRESS_HISTORY – Table 1 – Number of Address ChangesNumber Of Address Changes Records
1 1829172 918933 478344 241165 122476 62567 31798 17509 984
10 1306
SOURCE
The following table gives information on the number of records for each SOURCE variable.
36

ADDRESS_HISTORY – Table 2 – Distribution of SOURCEYear April October2001 573579 5783272002 583179 5883982003 593034 5980202004 603374 6081312005 548853 5551122006 561814 5681602007 575817 5829822008 589746 5967692009 602792 6089002010 614640 6209112011 627029 6329382012 638493 6444302013 650087 6559802014 662498 6684912015 674251 6803852016 686154 6921672017 698145 703295
CHANGE_TYPE
The following table gives details on type of address change.
ADDRESS_HISTORY – Table 3 – Distribution of CHANGE_TYPEDescription Change Type RecordsNew Record NR 771010
No Address Change NC 19410314Address Change AC 765377
Emigration EM 103243Re-entrant RE 16937
CURRENT_FLAG
The following table shows the number of current addresses (this should be the same number as the number of records in CORENILSDATA) and previous addresses.
ADDRESS_HISTORY – Table 4 – Distribution of CURRENT_FLAGCURRENT FLAG Records
C 771010P 20295871
ADDRESS_HISTORY – Table 5 – Distribution of CURRENT_FLAG (Live at Latest Source)
CURRENT FLAG RecordsC 563189P 15636605
Note: There are 563189 live records within the latest download
SOA2001
ADDRESS_HISTORY – Table 6 – Coverage of SOA2001SOACode Description Records % Distribution
NULL Missing/Invalid SOA Code 186824 0.9Valid Valid SOA Code 20880057 99.1
37

XUPRN
ADDRESS_HISTORY – Table 7 – Coverage of XUPRNXUPRN Description Records % DistributionMissing No Property ID Available 1151403 5.5Included Valid Property ID 19915478 94.5
38

9. Metadata for MIGRATION EVENTSTable Name: MIGRATION_EVENTSTable Description: Information on migration event occurrences derived from the Health Care Registration
System data downloads and in particular, the ADDRESS_HISTORY table. This includes internal migration, immigrants, emigration and information on re-entrants.
Source of the Data: Business Services Organisation (BSO) Health Card RegistrationsNumber of Records: 959050Currency of the Data: Latest information included for 201710 (YYYYMM). This table is updated and released every 6
months.Unique Identifier: NILSIDTables Linked to: Via NILSID: CORENILSDATA
Variables:Variable Name Variable Description Variable ValuesNILSID System generated unique reference number for NILS
memberDATEMOVED Date of migration event - This is a proxy for date moved.
It is determined by the date BSO is notified and the NILS is updated
CHANGETYPE Variable that identifies the type of migration event AC = Address ChangeEM = EmigrationIM = ImmigrantRE = Reentrant
OUTOF_SOA2001 Super Output Area of address moved out of 890 valid SOA codes'NULL' value includes missing and invalid postcodes
INTO_SOA2001 Super Output Area of address moved into See OUTOF_SOA2001OUTOF_XUPRN Anonymised Property Reference Number of address
moved out ofAn ID that can be used to link to PROPERTIES table
INTO_XUPRN Anonymised Property Reference Number of address moved into
See OUTOF_XUPRN
ORDER The order of the migration event since April 2001 1 is 1st, 2 is 2nd, etc.
39

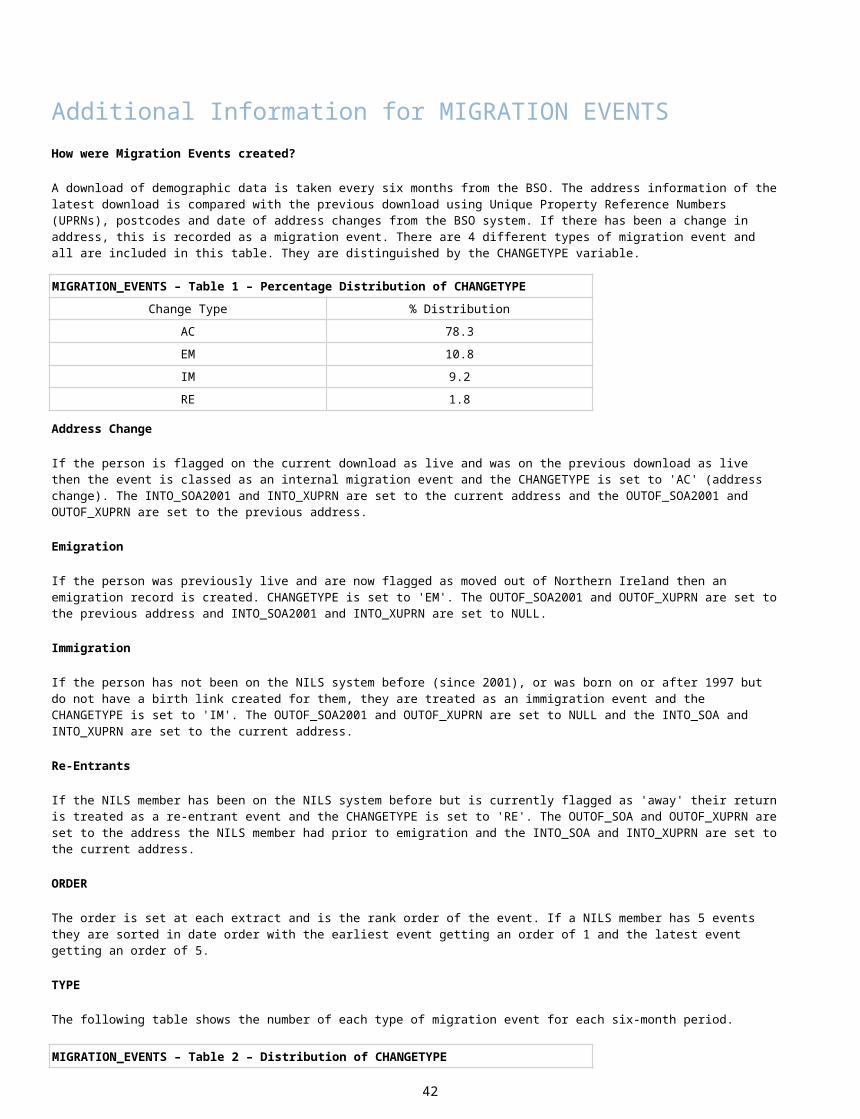
Additional Information for MIGRATION EVENTSHow were Migration Events created?
A download of demographic data is taken every six months from the BSO. The address information of the latest download is compared with the previous download using Unique Property Reference Numbers (UPRNs), postcodes and date of address changes from the BSO system. If there has been a change in address, this is recorded as a migration event. There are 4 different types of migration event and all are included in this table. They are distinguished by the CHANGETYPE variable.
MIGRATION_EVENTS – Table 1 – Percentage Distribution of CHANGETYPEChange Type % Distribution
AC 78.3EM 10.8IM 9.2RE 1.8
Address Change
If the person is flagged on the current download as live and was on the previous download as live then the event is classed as an internal migration event and the CHANGETYPE is set to 'AC' (address change). The INTO_SOA2001 and INTO_XUPRN are set to the current address and the OUTOF_SOA2001 and OUTOF_XUPRN are set to the previous address.
Emigration
If the person was previously live and are now flagged as moved out of Northern Ireland then an emigration record is created. CHANGETYPE is set to 'EM'. The OUTOF_SOA2001 and OUTOF_XUPRN are set to the previous address and INTO_SOA2001 and INTO_XUPRN are set to NULL.
Immigration
If the person has not been on the NILS system before (since 2001), or was born on or after 1997 but do not have a birth link created for them, they are treated as an immigration event and the CHANGETYPE is set to 'IM'. The OUTOF_SOA2001 and OUTOF_XUPRN are set to NULL and the INTO_SOA and INTO_XUPRN are set to the current address.
Re-Entrants
If the NILS member has been on the NILS system before but is currently flagged as 'away' their return is treated as a re-entrant event and the CHANGETYPE is set to 'RE'. The OUTOF_SOA and OUTOF_XUPRN are set to the address the NILS member had prior to emigration and the INTO_SOA and INTO_XUPRN are set to the current address.
ORDER
The order is set at each extract and is the rank order of the event. If a NILS member has 5 events they are sorted in date order with the earliest event getting an order of 1 and the latest event getting an order of 5.
TYPE
The following table shows the number of each type of migration event for each six-month period.
MIGRATION_EVENTS – Table 2 – Distribution of CHANGETYPEChange Type Records
AC 750974EM 103243IM 87896RE 16937
40

MIGRATION_EVENTS – Table 3 – Distribution of CHANGETYPE by DATEApril Download October Download
Year AC EM IM RE Records AC EM IM RE Records2001 0 0 0 0 0 19967 2865 2888 484 262042002 20317 3132 1994 419 25862 20272 3533 2191 464 264602003 19215 2896 1930 400 24441 20228 2761 2112 415 255162004 19427 3867 2417 373 26084 24908 2385 1984 460 297372005 12723 4077 3095 370 20265 22366 4907 2894 439 306062006 19687 4117 3551 362 27717 24331 2469 3102 536 304382007 23953 3557 4030 497 32037 22629 2911 3580 619 297392008 20613 4378 3422 469 28882 20813 3109 3352 488 277622009 20539 2925 2831 420 26715 21097 2048 2474 602 262212010 20273 3405 2430 426 26534 20037 2194 2465 563 252592011 19809 3138 2585 405 25937 34178 2846 2419 585 400282012 43958 3529 2271 456 50214 25460 2776 2320 545 311012013 22248 3682 2405 426 28761 27347 2752 2391 658 331482014 25342 3258 2852 586 32038 24672 2563 2566 612 304132015 23926 3266 2826 461 30479 23652 2595 2689 543 294792016 24921 2912 2690 1060 31583 20723 2686 2477 693 265792017 20817 2963 2886 534 27200 20526 2741 1777 567 25611
Note: The dates used are the dates of the download
OUTOF_SOA2001
The following table shows the proportion of records that had an SOA allocated. 'XXXXXX' are those that could not be allocated, most likely because the postcode was missing. '000000' are those where the postcode was valid but the CPD had not allocated an SOA.
MIGRATION_EVENTS – Table 4 – Coverage of OUTOF_SOA2001Out Of SOA2001 Description Records % Distribution
NULL Not Required/Not Linked to CPD 99687 10.4Valid Valid SOA Code 859363 89.6
The following tables show the number and proportion of records that had an OUTOF_SOA2001 allocated (excluding missing, '00000000' or 'XXXXXXXX' values) for each type of migration event.
MIGRATION_EVENTS – Table 5 – Coverage of OUTOF_SOA2001 by TYPEChange Type Out Of SOA2001 Records % Distribution
AC 741028 750974 98.7EM 102051 103243 98.8IM 0 87896 0.0RE 16284 16937 96.1
MIGRATION_EVENTS – Table 6 – Coverage of OUTOF_SOA2001 by DATEApril Download October Download
41
Year Out of SOA2001 % Distribution Out of SOA2001 % Distribution2001 0 0.0 22906 98.22002 23476 98.4 23875 98.42003 22204 98.6 23146 98.92004 23325 98.6 27034 97.42005 16891 98.4 27267 98.42006 23925 99.0 26925 98.52007 27726 99.0 25897 99.02008 25201 99.0 24171 99.02009 23632 98.9 23521 99.02010 23880 99.1 22581 99.12011 23098 98.9 36763 97.82012 47264 98.6 28172 97.92013 26158 99.2 29761 96.82014 28638 98.1 27596 99.12015 27479 99.4 26589 99.22016 28347 98.1 24012 99.62017 24250 99.7 23653 99.2
Note: Immigration events are excluded
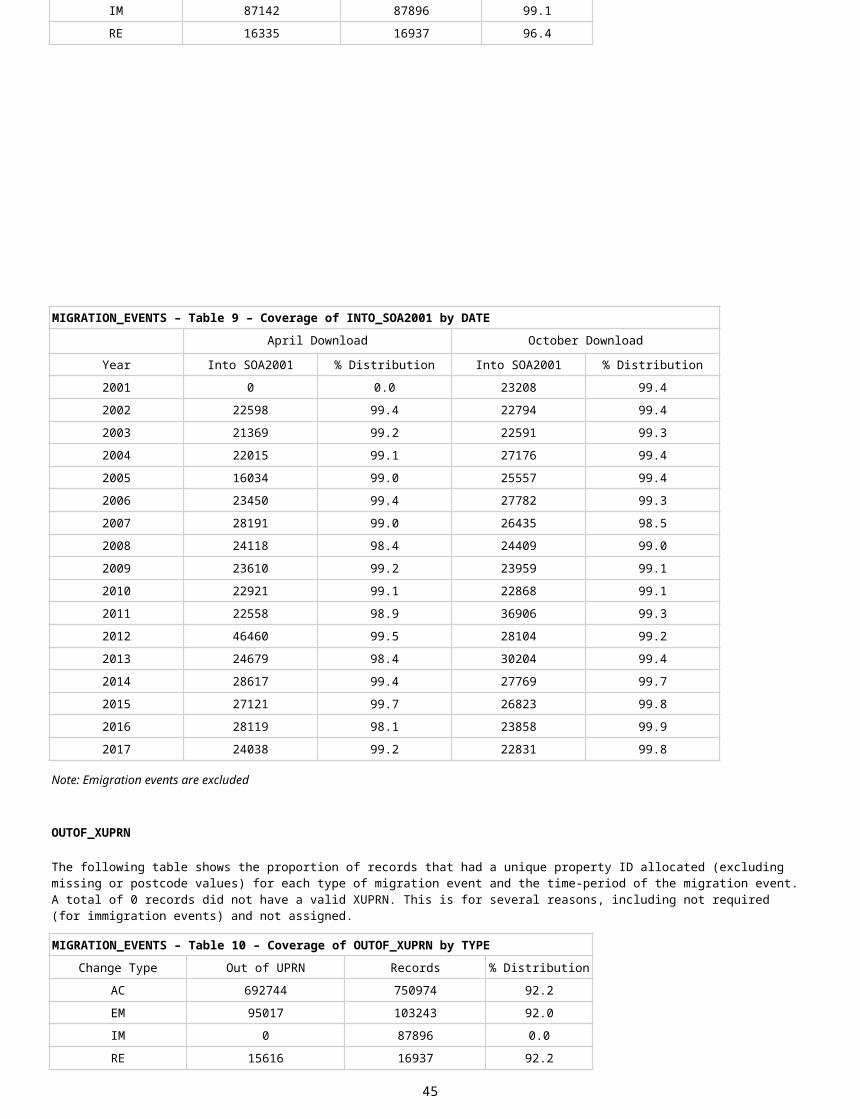
INTO_SOA2001
MIGRATION_EVENTS – Table 7 – Coverage of INTO_SOA2001Into SOA2001 Description Records % Distribution
NULL Not Required/Not Linked to CPD 109878 11.5Valid Valid SOA Code 849172 88.5
The following tables show the number and proportion of records that had an INTO_SOA2001 allocated (excluding missing, '00000000' and 'XXXXXXXX' values) for each type of migration event.
MIGRATION_EVENTS – Table 8 – Coverage of INTO_SOA2001 by TYPEChange Type Into SOA2001 Records % Distribution
AC 745695 750974 99.3EM 0 103243 0.0IM 87142 87896 99.1RE 16335 16937 96.4
MIGRATION_EVENTS – Table 9 – Coverage of INTO_SOA2001 by DATEApril Download October Download
Year Into SOA2001 % Distribution Into SOA2001 % Distribution2001 0 0.0 23208 99.42002 22598 99.4 22794 99.42003 21369 99.2 22591 99.3
42

2004 22015 99.1 27176 99.42005 16034 99.0 25557 99.42006 23450 99.4 27782 99.32007 28191 99.0 26435 98.52008 24118 98.4 24409 99.02009 23610 99.2 23959 99.12010 22921 99.1 22868 99.12011 22558 98.9 36906 99.32012 46460 99.5 28104 99.22013 24679 98.4 30204 99.42014 28617 99.4 27769 99.72015 27121 99.7 26823 99.82016 28119 98.1 23858 99.92017 24038 99.2 22831 99.8
Note: Emigration events are excluded
OUTOF_XUPRN
The following table shows the proportion of records that had a unique property ID allocated (excluding missing or postcode values) for each type of migration event and the time-period of the migration event. A total of 0 records did not have a valid XUPRN. This is for several reasons, including not required (for immigration events) and not assigned.
MIGRATION_EVENTS – Table 10 – Coverage of OUTOF_XUPRN by TYPEChange Type Out of UPRN Records % Distribution
AC 692744 750974 92.2EM 95017 103243 92.0IM 0 87896 0.0RE 15616 16937 92.2
MIGRATION_EVENTS – Table 11 – Coverage of OUTOF_XUPRN by DATEApril Download October Download
Year Out of UPRN % Distribution Out of UPRN % Distribution2001 0 0.0 21351 91.62002 21952 92.0 22395 92.32003 20862 92.7 21841 93.32004 21998 92.9 24839 89.52005 15793 92.0 25524 92.12006 22678 93.8 25100 91.8
43

2007 26196 93.5 24426 93.42008 23621 92.8 22735 93.12009 22232 93.1 22147 93.32010 22526 93.5 21262 93.32011 21754 93.2 31469 83.72012 44829 93.5 25821 89.72013 24019 91.1 25782 83.82014 26114 89.5 25352 91.02015 25333 91.6 23895 89.22016 28133 97.4 23776 98.62017 24042 98.9 23580 98.9
Note: Immigration events are excluded
INTO_XUPRN
MIGRATION_EVENTS – Table 12 – Coverage of INTO_XUPRN by TYPEChange Type Into UPRN Records % Distribution
AC 705162 750974 93.9EM 0 103243 0.0IM 80705 87896 91.8RE 15723 16937 92.8
MIGRATION_EVENTS – Table 13 – Coverage of INTO_XUPRN by DATEApril Download October Download
Year Into UPRN % Distribution Into UPRN % Distribution2001 0 0.0 22056 94.52002 21440 94.3 21873 95.42003 20386 94.6 21099 92.72004 20836 93.8 25513 93.32005 14233 87.9 23986 93.32006 21902 92.8 25827 92.32007 26354 92.5 24707 92.12008 22283 90.9 22790 92.42009 22039 92.6 22395 92.62010 21338 92.3 21305 92.42011 20848 91.4 35436 95.32012 43435 93.0 26063 92.02013 23024 91.8 28616 94.12014 26685 92.7 26054 93.62015 25508 93.7 25348 94.32016 27880 97.2 23672 99.12017 23954 98.8 22705 99.3
44
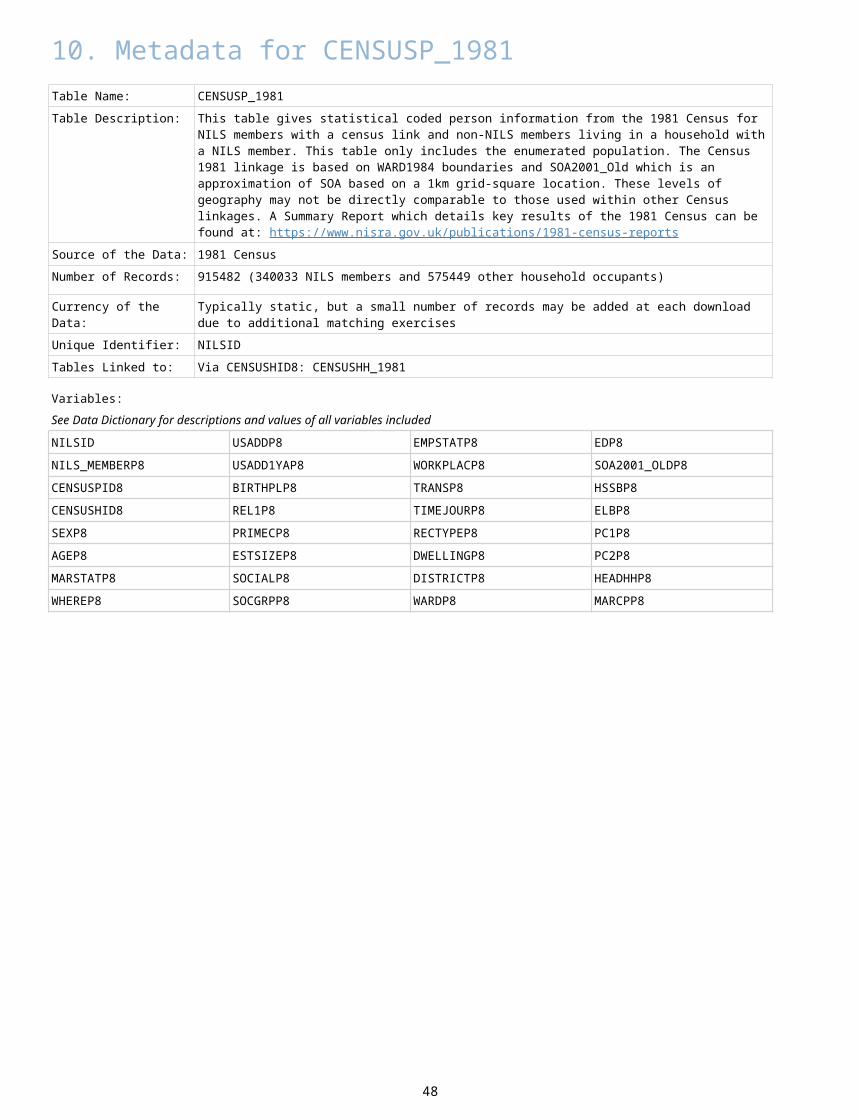
10. Metadata for CENSUSP_1981Table Name: CENSUSP_1981Table Description: This table gives statistical coded person information from the 1981 Census for NILS members
with a census link and non-NILS members living in a household with a NILS member. This table only includes the enumerated population. The Census 1981 linkage is based on WARD1984 boundaries and SOA2001_Old which is an approximation of SOA based on a 1km grid-square location. These levels of geography may not be directly comparable to those used within other Census linkages. A Summary Report which details key results of the 1981 Census can be found at: https://www.nisra.gov.uk/publications/1981-census-reports
Source of the Data: 1981 CensusNumber of Records: 915482 (340033 NILS members and 575449 other household occupants)
Currency of the Data: Typically static, but a small number of records may be added at each download due to additional matching exercises
Unique Identifier: NILSIDTables Linked to: Via CENSUSHID8: CENSUSHH_1981
Variables:See Data Dictionary for descriptions and values of all variables includedNILSID USADDP8 EMPSTATP8 EDP8NILS_MEMBERP8 USADD1YAP8 WORKPLACP8 SOA2001_OLDP8CENSUSPID8 BIRTHPLP8 TRANSP8 HSSBP8CENSUSHID8 REL1P8 TIMEJOURP8 ELBP8SEXP8 PRIMECP8 RECTYPEP8 PC1P8AGEP8 ESTSIZEP8 DWELLINGP8 PC2P8MARSTATP8 SOCIALP8 DISTRICTP8 HEADHHP8WHEREP8 SOCGRPP8 WARDP8 MARCPP8
11. Metadata for CENSUSHH_1981Table Name: CENSUSHH_1981
45

Table Description: This table gives statistical coded household information from the 1981 census for all NILS members with a census link. This table only includes households within the enumerated population. The Census 1981 linkage is based on WARD1984 boundaries and SOA2001_Old which is an approximation of SOA based on a 1km grid-square location. These levels of geography may not be directly comparable to those used within other Census linkages. A Summary Report which details key results of the 1981 Census can be found at: https://www.nisra.gov.uk/publications/1981-census-reports
Source of the Data: 1981 CensusNumber of Records: 227687Currency of the Data: Typically static, but a small number of records may be added at each download due to additional
matching exercisesUnique Identifier: CENSUSHID8Tables Linked to: Via CENSUSHID8: CENSUSP_1981
Variables:See Data Dictionary for descriptions and values of all variables includedCENSUSHID8 INWCH8 FUELH8 WARDH8ROOMSH8 OUTWCH8 INSULH8 EDH8SHAREH8 WATERH8 CARH8 SOA2001_OLDH8TENUREH8 SEWAGEH8 NOPERSH8 HSSBH8BATHH8 HEATH8 DISTRICTH8 ELBH8
12. Metadata for CENSUSP_1991Table Name: CENSUSP_1991Table Description: This table gives statistical coded person information from the 1991 Census for NILS members with
a census link and non-NILS members living in a household with a NILS member. This table only includes the enumerated population.
Source of the Data: 1991 Census
46

Number of Records: 1088336 (439560 NILS members and 648776 other household occupants)
Currency of the Data: Typically static, but a small number of records may be added at each download due to additional matching exercises
Unique Identifier: NILSIDTables Linked to: Via CENSUSHID9: CENSUSHH_1991
Variables:See Data Dictionary for descriptions and values of all variables includedNILSID MIGDETP9 SOCCLASSP9 NUTS3P9NILS_MEMBERP9 MIGDISTP9 SOCCLAS2P9 PARLCONP9CENSUSPID9 WMHOHP9 ESTSIZEP9 PERSNOP9CENSUSHID9 COBP9 WKADDCDP9 ECACMARWP9GENDER1P9 COB1P9 WK_SOA2001P9 MWPTEMPP9GENDERP9 RELIGIONP9 WK_SOA2001OLDP9 TEN60P9AGEP9 RELIGN1P9 TRANSPORP9 AMEN60P9AGE1P9 LTILLP9 FIRQUALP9 NOPER2P9AGE2P9 IRISHP9 SECQUALP9 NOPERUR2P9MARITALP9 PRIMARYP9 THIRQUALP9 ESTTYPEP9MARITAL1P9 SECONDP9 FOURQUALP9 DWELTYPEP9MARFEMP9 PARTFULLP9 FIFQUALP9 ACCTYPEP9RELATIONP9 ECONACTP9 SIXQUALP9 ACCDWELP9HEADHOUSP9 EMPSTATP9 RECTYPP9 TENUREP9FAMTYPEP9 EMPSTAT1P9 VOCSUBP9 SHARACCP9WHEREP9 CHECSUPPP9 VOCLEVP9 NOROOM1P9TOTCHILDP9 NOEARN1P9 DISTRICTP9 DENSITYP9LYCHILDP9 CURRENTP9 WARDP9 NOCARP9USADDCP9 OLDJOBP9 SOA2001P9 PENSHOUSP9TERMCODEP9 HOURSP9 SOA2001_OLDP9 AGECOMBP9UALYCODEP9 MAJOCCP9 ELBP9 NODECH1P9MIGTYPE1P9 SOCCODEP9 HSSBP9 PENSCOMBP9
13. Metadata for CENSUSHH_1991Table Name: CENSUSHH_1991Table Description: This table gives statistical coded household information from the 1991 census for all NILS members
with a census link. This table only includes households within the enumerated population.Source of the Data: 1991 CensusNumber of Records: 297281Currency of the Data: Typically static, but a small number of records may be added at each download due to additional
matching exercisesUnique Identifier: CENSUSHID9Tables Linked to: Via CENSUSHID9: CENSUSP_1991
Variables:See Data Dictionary for descriptions and values of all variables included
47
CENSUSHID9 ESTTYPEH9 NOEARNH9 ELBH9ACCTYPEH9 NOPERSH9 NOEARN1H9 HSSBH9NOROOMH9 NOPER2H9 NODECHH9 NUTS3H9DENSITYH9 NOMALEH9 NODECH1H9 PARLCONH9NOROOM1H9 NOFEMH9 DWELTYPEH9 SOA2001H9TENUREH9 NOPERURH9 ACCDWELH9 SOA2001_OLDH9BATHSHOWH9 NOPERUR2H9 ACCDWEL2H9 SEGCESH9TOILETH9 NOMALEURH9 SHARACCH9 USADDHHH9HEATINGH9 NOFEMLURH9 MIGDETH9 GENDERHHH9WATERH9 FAMTYPEH9 MIGDISTH9 AGEHHH9SEWAGEH9 PENSHOUSH9 MIGD1H9 MARHHH9NOCARH9 PENSCOMBH9 DISTRICTH9 COBHHH9RECTYPEH9 AGECOMBH9 WARDH9 RELHHH9
14. Metadata for CENSUSP_2001Table Name: CENSUSP_2001Table Description: This table gives statistical coded information from the 2001 census for NILS members with a census
link and non-NILS members living in a household with a NILS member. This table only includes the enumerated population. It also includes some students identified as being away at term time. To filter these out users should use the STU_INDP0 and TTADDP0 fields.
Source of the Data: 2001 CensusNumber of Records: 1066684 (457413 NILS members and 609271 other household occupants)
Currency of the Data: Typically static, but a small number of records may be added at each download due to additional matching exercises
Unique Identifier: NILSIDTables Linked to: Via CENSUSHID0: CENSUSHH_2001, CENSUS01_RELATIONSMATRIX
Variables:See Data Dictionary for descriptions and values of all variables includedNILSID CMMNITY_BCKGRNDP0 EDLEV05P0 WP_SOA2001P0NILS_MEMBERP0 RELUPBRP0 EDLEV06P0 TRVWDISTP0CENSUSPID0 COBP0 EDLEV07P0 TRVWDISTGROUPP0
48

CENSUSHID0 ETH_GRPP0 EDLEV08P0 TRV_OAP0SEXP0 ETHNICITYP0 EDLEV09P0 TRV_PARLP0WRKPEN_INDP0 GHEALTHP0 EDLEV10P0 TRAVWRKP0DEPPERSP0 UNPAIDCAREP0 EDLEV11P0 NOHOURSP0AGEP0 LLTIP0 EDLEV12P0 MGRPP0MARITALP0 MIGSTATP0 EDLEV13P0 PRSN_TYPP0LIVARRP0 COUNADD1YRP0 EDQUAL_HIGHP0 POSCOMMP0STU_INDP0 MIG_OAP0 ACTLWKP0 STUACCP0TTADDP0 MIG_PARLP0 ECACTP0 HHRPP0SOAENUMP0 MIG_HBP0 EMPSTATP0 FRPP0UNDERIRISHP0 MIG_ELBP0 YEARLSTWRKDP0 DEPCHLDP0SPEAKIRISHP0 MIG_NUTSP0 COMPSIZEP0 FAMSTATP0READIRISHP0 SOAADD1YRP0 OCCUPP0 GENINFAMP0WRITEIRISHP0 EDLEV01P0 NSSECP0 SOC90P0KNOWIRISHP0 EDLEV02P0 INDUSTRYP0 IMPUTEDPERSON_NOT
AWAYSTUDENTP0RELPRACP0 EDLEV03P0 WP_LOCP0 SETTLEMENTBANDP0RLGNP0 EDLEV04P0 WP_COUNTRYP0Imputation Variables:See Data Dictionary for descriptions and values of all variables includedGENDER_IMPP0 RELG_IMPP0 GHEALTH_IMPP0 EDU_IMPP0AGE_IMPP0 RELUPBR_IMPP0 UNPAIDCARE_IMPP0 ACTLW_IMPP0MARITAL_IMPP0 ETHNIC_IMPP0 LLTI_IMPP0
15. Metadata for CENSUSHH_2001Table Name: CENSUSHH_2001Table Description: This table gives statistical coded household information from the 2001 census for all NILS
members with a census link. This table only includes households within the enumerated population.
Source of the Data: 2001 CensusNumber of Records: 320741Currency of the Data: Typically static, but a small number of records may be added at each download due to additional
matching exercisesUnique Identifier: CENSUSHID0Tables Linked to: Via CENSUSHID0: CENSUSP_2001
(to get NILS or other household members)
Variables:See Data Dictionary for descriptions and values of all variables includedCENSUSHID0 ACCTYPEH0 HHWKRSTRANSH0 CEREGSTATH0SOAENUMH0 SELDCONTH0 HRP_SEXH0 CEAGE_ELDH0HHSIZEH0 HHROOMS_COUNTH0 HRP_AGEH0 CEAGE_ADH0HH17PLS_COUNTH0 PERSPERROOMH0 HRP_MARSTATH0 CEAGE_CLHDH0HHWRKG_COUNTH0 HHROOMSREQH0 HRP_COMMBACKH0 CETYP_PHYH0HHPEN_COUNTH0 OCCRATH0 HRP_RELH0 CETYP_LDH0HHADULST_COUNTH0 BATHSHOWH0 HRP_COBH0 CETYP_MHH0HHDEPCHLDH0 LWST_FLR_LVLH0 HRP_ETHGRPH0 CETYP_CNVH0HHDEPCHLD_COUNTH0 HHFLRS_COUNTH0 HRP_EDHLQH0 CETYP_DRUGH0HHSTUHOME_COUNTH0 CENTHEATH0 HRP_ECACTH0 CETYP_TLH0HHADEMP_COUNTH0 HHCARS_COUNTH0 HRP_OCCH0 CETYP_CIH0
49

HHPENSH0 OWNERSHIPH0 HRP_SOC90H0 CETYP_AIH0HHCARERSH0 TENUREH0 HRP_INDH0 CETYP_ELDH0HHOCCSTATH0 LNDLRDH0 HRP_NSSH0 CETYP_STH0HHLLTIH0 HHCOMBACKH0 HRP_SOCGRDH0 CETYP_PRSH0STUAWAYH0 HHETHRELH0 NS_DEP_EMPH0 CETYP_NURSH0HHCOMPH0 HHETHSTRH0 NS_DEP_EDUH0Q CETYP_AFH0HHFAMTYPEH0 HHMIG_INDH0 NS_DEP_HEAH0 CETYP_HMLSSH0HHADCHLDSTRH0 HHMIG_OAH0 NS_DEP_HOUSH0 CETYP_OTHH0HHFAM_COUNTH0 HHMIG_PARLH0 NS_DEP_TENH0 CETYP_NOURH0HHCARERS_COUNTH0 HHMIG_HBH0 CETYP_H0 XUPRNHHLLTI_COUNTH0 HHMIG_ELBH0 CEMANTYPEH0HHPEOPLE_COUNTH0 HHMIG_NUTSH0 CECOMBTYPEH0Imputation Variables:See Data Dictionary for descriptions and values of all variables includedCENTHEAT_IMPH0 CARS_IMPH0 TENURE_IMPH0
16. Metadata for CENSUS01_RELATIONSMATRIXTable Name: CENSUS01_RELATIONSMATRIXTable Description: This table gives statistical coded household information from the 2001 census for all NILS
members with a census link. This table only includes households within the enumerated population.
Source of the Data: 2001 CensusNumber of Records: 3167478Currency of the Data: Typically static, but a small number of records may be added at each download due to additional
matching exercisesUnique Identifier: CENSUSHID0Tables Linked to: Via CENSUSHID0: CENSUSP_2001
(to get NILS or other household members)
Variables:Variable Name Variable Description Variable ValuesCENSUSHID0 System Generated Unique Reference Number for the Census
Household RecordP1_CENSUSPID0 Person 1 Unique Reference NumberP2_CENSUSPID0 Person 2 Unique Reference NumberP2_TO_P1_RELATIONS0 Code indicating how Person 2 is related to Person 1 Values
1-9 = Relationship typeA-B = 'Other' relationshipX-Y = 'No code required'
50

Additional Information for CENSUS01_RELATIONSMATRIXP2_TO_P1_RELATIONS0
CENSUS01_RELATIONSMATRIX – Table 1 – Distribution of RelationshipRelationship Code Relationship Count % Distribution
1 Husband or Wife 415268 13.12 Partner 28052 0.93 Son or Daughter 822343 26.04 Stepchild 11995 0.45 Brother or Sister 828333 26.26 Mother or Father 822335 26.07 Stepmother or Stepfather 11994 0.48 Grandchild 18515 0.69 Grandparent 18515 0.6A Other Related 45043 1.4B Other Unrelated 53007 1.7X No code required 92078 2.9
51

17. Metadata for CENSUSP_2011Table Name: CENSUSP_2011
Table Description: This table gives statistical coded information from the 2011 census for NILS members with a census link and non- NILS members living in a household with a NILS member. This table only includes the enumerated population. It also includes some students identified as being away at term time. To filter these out users should use the STUDENTP1 and TERMINDP1 fields. People who are not identified as permanent residents of Northern Ireland can be excluded using the INTENTIONP1 field.
Source of the Data: 2011 CensusNumber of Records: 1088832 (486683 NILS members and 602149 other household occupants)
Currency of the Data: Typically static, but a small number of records may be added at each download due to additional matching exercises
Unique Identifier: NILSIDTables Linked to: Via CENSUSHID1: CENSUSHH_2011, CENSUS11_RELATIONSMATRIXVariables:See Data Dictionary for descriptions and values of all variables includedNILSID PSPTELP1 HEACONMHCP1 OCCP1NILS_MEMBERP1 NATIDBP1 HEACONLTP1 NSSECP1CENSUSPID1 NATIDIP1 HEACONDBP1 POSITIONP1CENSUSHID1 NATIDNIP1 HEACONMLP1 INDP1SEXP1 NATIDEP1 HEACONCIP1 INDEP1AGEP1 NATIDSP1 HEACONOCP1 INDUSTRY_CODEP1SCHOOLAGEP1 NATIDWP1 HEACONP1 HOURSP1PENP1 NATIDOP1 HEALTHP1 WKPLINDP1PENP01P1 NATIDUSP1 CARERP1 WKPLINTP1PENEXACTP1 IDENINTP1 QUALS01P1 WPS_ELB_2011P1WRKAGEP1 IDENUKP1 QUALS02P1 WPS_HSCT_2011P1ADULTLSP1 ETHP1 QUALS03P1 WPS_HSSB_2011P1WF65PLP1 ETHFULLP1 QUALS04P1 WPS_LA_CODE_2011P1AGGMAINLANGPRFP1 RELBTP1 QUALS05P1 WPS_SOA_CODE_2011P1AGEARRP1 RELBUP1 QUALS06P1 WPS_NUTS3_2011P1MARSTATP1 RELBTBUIP1 QUALS07P1 TRANSPORTP1STUDENTP1 MAINLANGP1 QUALS08P1 DCHP1TERMINDP1 MAINLANGPRFP1 QUALS09P1 ELARP1STAINDP1 AMAINLANGPRFP1 QUALS10P1 FMSP1STAP1 AGGMAINLANGP1 QUALS11P1 FRPP1COBP1 LANGPRFP1 QUALS12P1 HRPP1MIGORIGP1 ILANUP1 QUALS13P1 LARP1LRESP1 ILANSP1 QUALS14P1 PTRANSP1INTENTIONP1 ILANRP1 HLQP1 RLARP1YRARRP1 ILANWP1 VOLWORKP1 SOC2000P1CPRP1 USLANUP1 ACTLWP1 GENINFAMP1YRARR_YEARP1 USLANSP1 ECOP1 RESIDENCE_TYPEP1YRADINTP1 USLANRP1 ECOCATP1 DTWSPP1A1YR_HSCT_2011P1 USLANWP1 EMPLYGRPP1 YRADINDP1A1YR_HSSB_2011P1 IRISH1P1 AGGECOP1 MIGOAPUK11P1A1YR_LA_CODE_2011P1 IRISH2P1 LOOKWORKP1 YRADOAP1A1YR_ELB_2011P1 ULSTER1P1 AVAILWORKP1 YRADOA_MIGBABYP1A1YR_NUTS3_2011P1 ULSTER2P1 WAITWORKP1 MIGWARDPUK11P1
52

A1YR_SOA_CODE_2011P1 DISABILITYP1 EVERWORKP1 MIGBABY_INDPSSPUKP1 HEACONDP1 LASTYRWRKP1 IMPUTEDPSSPIP1 HEACONBP1 AGGLASTYRWRKP1 MIGSTATP1PSSPOP1 HEACONCDP1 UNEMPHISTP1 MIGSTATP1_NOMIGBABYPSSPNP1 HEACONMDP1 EMPSTATP1 SCHOOL_IDPSSPRTP1 HEACONLDP1 EMPLOYP1Imputation Variables:See Data Dictionary for descriptions and values of all variables includedSEX_IMPP1 IDENUK_IMPP1 QUALS07_IMPP1 LASTYRWRK_IMPP1AGE_IMPP1 MAINLANG_IMPP1 QUALS08_IMPP1 EMPSTAT_IMPP1MARSTAT_IMPP1 LANGPRF_IMPP1 QUALS09_IMPP1 INDUSTRY_CODE_IMPP1STUDENT_IMPP1 DISABILITY_IMPP1 QUALS10_IMPP1 HOURS_IMPP1TERMIND_IMPP1 HEALTH_IMPP1 QUALS11_IMPP1 WKPLIND_IMPP1COB_IMPP1 CARER_IMPP1 QUALS12_IMPP1 WKPLINT_IMPP1INTENTION_IMPP1 QUALS01_IMPP1 QUALS13_IMPP1 TRANSPORT_IMPP1YRARR_YEAR_IMPP1 QUALS02_IMPP1 EMPLYGRP_IMPP1 RESIDENCE_TYPE_IMPP1YRADINT_IMPP1 QUALS03_IMPP1 LOOKWORK_IMPP1 SCHOOL_ID_IMPP1PSSPRT_IMPP1 QUALS04_IMPP1 AVAILWORK_IMPP1PSPTEL_IMPP1 QUALS05_IMPP1 WAITWORK_IMPP1IDENINT_IMPP1 QUALS06_IMPP1 EVERWORK_IMPP1
18. Metadata for CENSUSHH_2011Table Name: CENSUSHH_2011Table Description: This table gives statistical coded household information from the 2011 census for all NILS members
with a census link. This table only includes households with the enumerated population.Source of the Data: 2011 CensusNumber of Records: 354514Currency of the Data: Typically static, but a small number of records may be added at each download due to additional
matching exercises
53

Unique Identifier: CENSUSHID1Tables Linked to: Via CENSUSHID1: CENSUSP_2011 (to get NILS or other household members)Variables:See Data Dictionary for descriptions and values of all variables includedCENSUSHID1 AGEGRP24H1 CLIENTS17H1 ILLH1SIZH1 AGEGRP64H1 CLIENTS18H1 ILLLITTLEH1HHCH1 AGEGRP65H1 CLIENTS19H1 ILLLOTH1HH_STRUCTUREH1 AGGETHH1 CLIENTS20H1 MEIGH1TYPACCOMH1 AHCH1 CLIENTS21H1 MNAGEMNTH1SELFCONH1 AHTH1 HRPCOBH1 HEACONAH1ROOMSH1 CEAH1 CRSH1 HEACONH1NORDH1 CECTMCEWSH1 DEPEDH1 NSSH1ADAPTWH1 CGHH1 DEPEMH1 NSTAH1ADAPTPMH1 CLIENTS01H1 DEPHDH1 P17H1ADAPTVH1 CLIENTS02H1 DEPHSH1 PENH1ADAPTHH1 CLIENTS03H1 DEPRIVEDH1 PPROOMH1ADAPTOH1 CLIENTS04H1 DEPTNH1 ROOMREQH1ADAPT1H1 CLIENTS05H1 DPCH1 STAH1ADAPT2H1 CLIENTS06H1 EILAH1 TEMPNATUREH1ADAPT3H1 CLIENTS07H1 ESTNATUREH1 USHC1H1CENHEATH1 CLIENTS08H1 ETHH1 USHC2H1TENUREH1 CLIENTS09H1 FAMH1 HHSDH1TENH1 CLIENTS10H1 FRM_RESP_CHNLH1 EA_ELB_2011H1TENDH1 CLIENTS11H1 HHLDLANGH1 EA_HSCT_2011H1LANDLORDH1 CLIENTS12H1 HHLSH1 EA_HSSB_2011H1CARSNOH1 CLIENTS13H1 IHC1H1 EA_LA_CODE_2011H1ADEMH1 CLIENTS14H1 IHC2H1 EA_NUTS3_2011H1ADTH1 CLIENTS15H1 ILAH1 EA_SOA_CODE_2011H1AGEGRP17H1 CLIENTS16H1 ILLADULTH1 XUPRNImputation Variables:See Data Dictionary for descriptions and values of all variables includedTYPACCOM_IMPH1 ROOMS_IMPH1 TENURE_IMPH1 CARSNO_IMPH1SELFCON_IMPH1 CENHEAT_IMPH1 LANDLORD_IMPH1
19. Metadata for CENSUS11_RELATIONSMATRIXTable Name: CENSUS11_RELATIONSMATRIXTable Description: This table gives statistical coded household information from the 2011 census for all NILS members
with a census link. This table only includes households within the enumerated population.
Source of the Data: 2011 CensusNumber of Records: 2959198Currency of the Data: Typically static, but a small number of records may be added at each download due to additional
matching exercisesUnique Identifier: CENSUSHID1Tables Linked to: Via CENSUSHID1: CENSUSP_2011 (to get NILS or other household members)
Variables:Variable Name Variable Description Variable ValuesCENSUSHID1 System Generated Unique Reference Number for the
Census Household Record
54

P1_CENSUSPID1 Person 1 Unique Reference NumberP1_NUMBER1 Person 1 Number within HouseholdP2_CENSUSPID1 Person 2 Unique Reference NumberP2_NUMBER1 Person 2 Number within HouseholdP2_TO_P1_RELATIONS1 Code indicating Relationship of Person 2 to Person 1 Values 1-13 indicate relationship type
55

Additional Information for CENSUS11_RELATIONSMATRIXP2_TO_P1_RELATIONS1
CENSUS11_RELATIONSMATRIX – Table 1 – Distribution of RelationshipP2 to P1 Code Relationship Count % Distribution
01 Husband or Wife 413996 14.002 Same-Sex Civil Partner 356 0.003 Partner 46992 1.604 Son or Daughter 793483 26.805 Stepchild 14724 0.506 Brother or Sister 684956 23.107 Stepbrother or Stepsister 24854 0.808 Mother or Father 793483 26.809 Stepmother or Stepfather 14724 0.510 Grandchild 20428 0.711 Grandparent 20428 0.712 Relation - Other 63466 2.113 Unrelated 67308 2.3
56
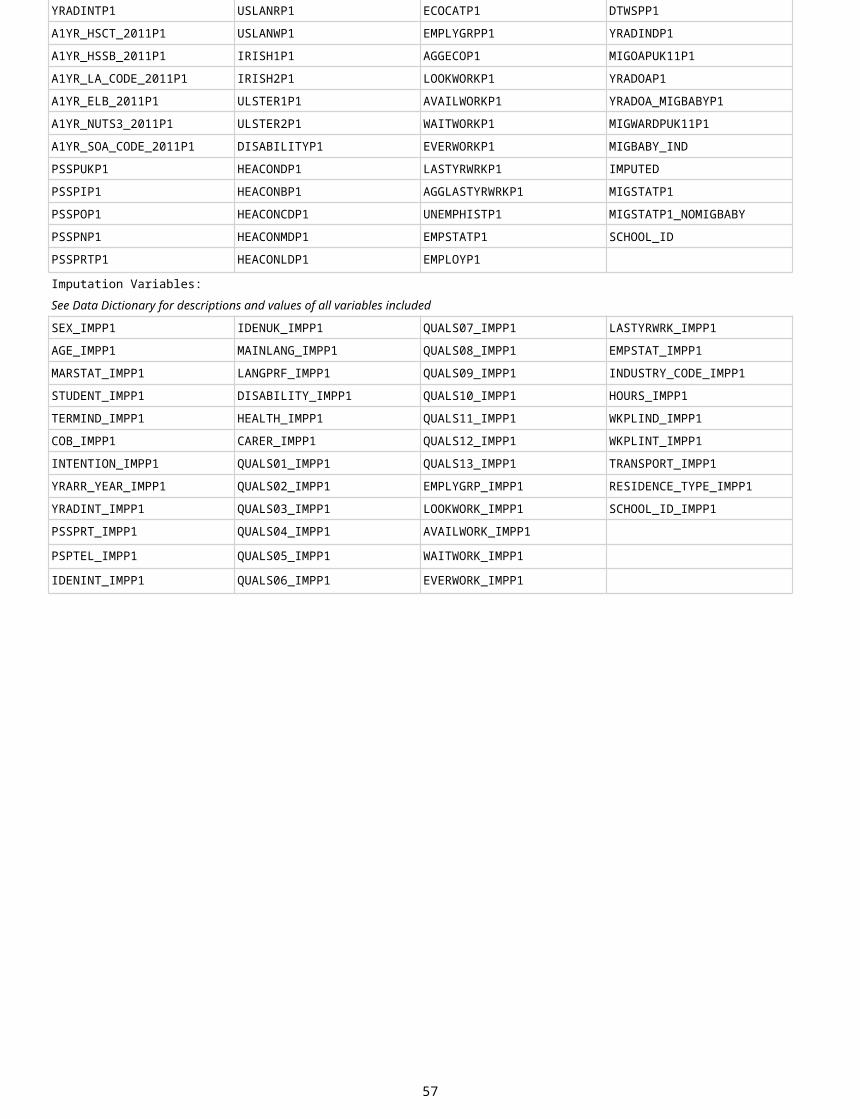
20. Metadata for PROPERTIESTable Name: PROPERTIESTable Description: This table gives the coded information from Land and Property Services POINTER product and
valuation lists, of which more information can be found at https://www.nidirect.gov.uk/articles/pointer. This table is based upon all properties listed in the latest available POINTER dataset linked to latest available LPS valuation list where possible.
Source of the Data: Land and Property Services (LPS)Number of Records: 995868Currency of the Data: Based on DECEMBER 2016 LPS Data & OCTOBER 2017 POINTER Data. At each new data release a
number of records may be added.Unique Identifier: XUPRNTables Linked to: Via XUPRN: CORENILSDATA, ADDRESS_HISTORY, CENSUSHH_2001, CENSUSHH_2011,
MIGRATION_EVENTS
Variables:See Data Dictionary for descriptions and values of all variables includedXUPRN HAB_ROOMS FLOOR CV_NON_EX3X_SETTLEMENTBAND TOTAL_BED PARKING CV_NON_EX5PRIMARY_CLASS BATHS GLAZING CV_NON_EX10SUB_CLASS HALF_BATHS HEATINGPROP_TYPE YEAR_BUILT CV_EXANC_SPACE STOREYS CV_NON_EX
Additional Information for PROPERTIESIssues
POINTER is a live database supplied by LPS on a monthly basis. Property information is linked to the latest available POINTER download. Work is continually ongoing to try and improve the quality of the data. These improvements may lead to slight changes in locational information across downloads.
CV_NON_EX is the domestic capital value based in 2005. There are currently no plans to change this to a more up to date capital value.
Approximately 95% of records have an XUPRN attached. Approximately 90-95% of property records have detailed property information from the valuation list. This gives about 85% of records with detailed property information
LPS are currently working on improving the link between XUPRN and the valuation list.
http://www.lpsni.gov.uk/index/property_rating.htm
SETTLEMENTBAND
Each property lies within a recorded settlement band. These settlement bands enable researchers to determine whether a property is located within an urban or rural area. Settlement bands A-E reflect urban areas, whilst settlement bands F-H indicate rural areas. The following table shows distribution of properties by urban/rural classification.
PROPERTIES – Table 1 – Distribution by SETTLEMENTBANDClassification Records % Distribution
RURAL 367485 36.9URBAN 628383 63.1
SUB-CLASS
The PROPERTIES table gives an indication of the classification of each property, which is recorded as Sub_Class. The table below indicates the top 5 most popular property sub-classes.
PROPERTIES – Table 2 – Distribution by SUB_CLASSSub-Class Records % Distribution
57
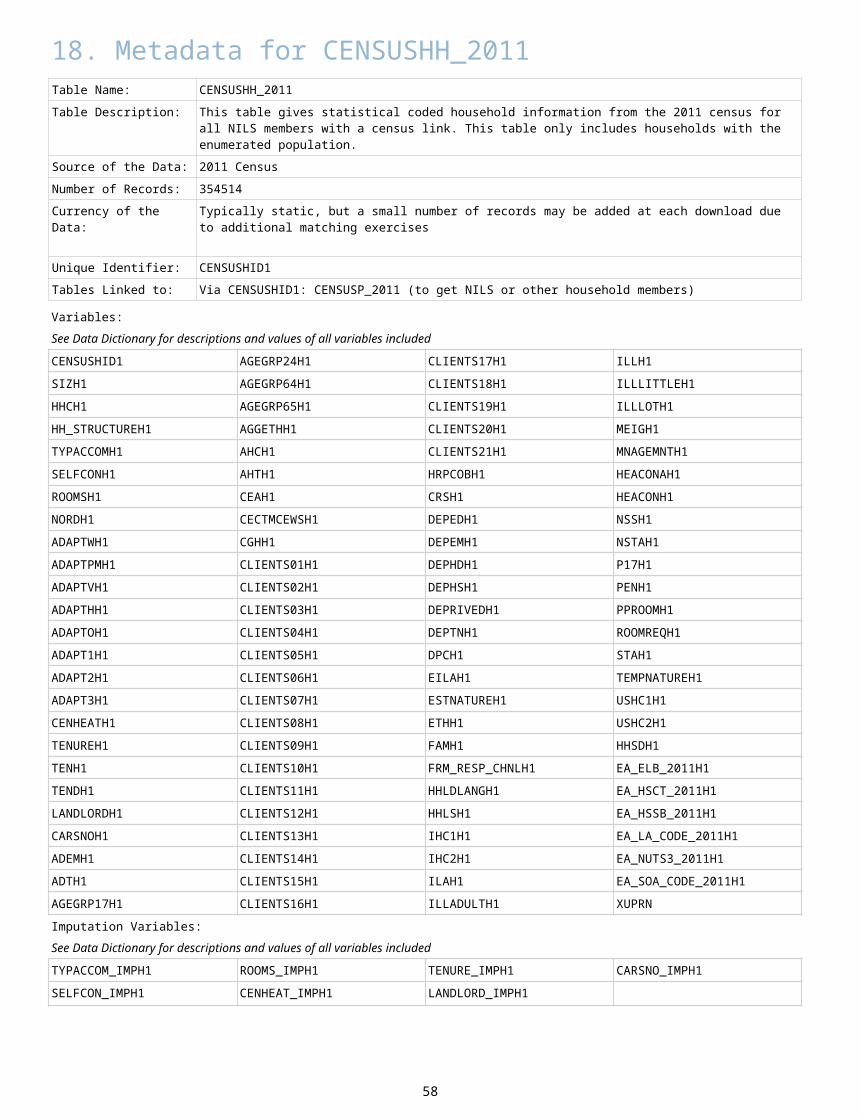
Detached 274288 27.5Terrace 224743 22.6
Semi-Detached 193442 19.4Apartment 67297 6.8
Converted Apartment 12882 1.3
58

21. Metadata for XDEATH_DETAILSTable Name: XDEATH_DETAILSTable Description: This table gives statistical coded information for the main cause of death and other subsequent
causes. This provides a summary of preceding cause of death variables and expands on the main cause of death provided within the DEATHSSTATS table. This information is coded/validated by the teams in GRO and NISRA. The content of this table is available through the initial application process on the proviso that appropriate research justification is demonstrated.
Source of the Data: General Register Office (GRO)Number of Records: 133987Currency of the Data: Latest information included for 201612 (YYYYMM).Unique Identifier: GRODIDTables Linked to: Via GRODID: EVENTS, DEATHSSTATS
Variables
Variable Name Variable Description Variable ValuesGRODID System generated unique reference number
for death eventX_DetailedICD09List International Classification of Diseases 9th
Revision. This classification is used for any death registration prior to 2001.
Alphanumeric coded cause of death (main cause listed first with subsequent causes in the remaining brackets)
X_DetailedICD10List International Classification of Diseases 10th Revision. This classification is used for any death registration from 2001 onwards.
See X_DetailedICD09List Variable Values
59

22. Metadata for WEATHERTable Name: WEATHERTable Description: This table provides background weather data at 5x5 km resolution which is modelled by the
Met Office every ten years. It is linked to the Pointer database based on the 5km grid square which has been translated from the British to Irish grid. Each household on the Pointer database is assigned a range of weather measures which can then be linked to other datasets via XUPRN.Further information on weather data is available at http://www.metoffice.gov.uk/climatechange/science/monitoring/ukcp09/download/
Source of the Data: Met OfficeNumber of Records: 995868Currency of the Data: JANUARY 1981 to DECEMBER 2010. Average over thirty year period - 1981-2010. Updated every
ten years. Last updated April 2012.Unique Identifier: XUPRNTables Linked to: Via XUPRN: CORENILSDATA, ADDRESS_HISTORY, CENSUSHH_2001, CENSUSHH_2011,
MIGRATION_EVENTS, PROPERTIES
Variables:See Data Dictionary for descriptions and values of all variables includedXUPRN SUNSHINE_XXX SNOWFALL_XXX SNOWLYING_XXXMAXTEMP_XXX AIRFROST_XXX GRDFROST_XXXRAINDAY1_XXX MEANTEMP_XXX MINTEMP_XXXHUMIDITY_XXX RAINDAYS10_XXX RAINFALL_XXX
Additional Information for WEATHERMissing valuesThere are some grid squares in each data set that do not have values. These are coastal squares for which the centre of the grid square is not located on the land (or is across the border with the Republic of Ireland) and therefore the model does not provide a concentration for. 0.5% of addresses on the Pointer dataset do not have weather attributes assigned. Some of the datasets being linked to may also have missing UPRNs and thus cannot have weather attributes linked to them.
Acknowledgements / Conditions of supplyPlease acknowledge the Met Office as source if using this data. The terms and conditions for the use of Met Office data are available at http://ukclimateprojections.metoffice.gov.uk/23476Met Office data is available for non-commercial uses only. Users should be aware of the following license agreement: http://www.nationalarchives.gov.uk/doc/non-commercial-government-licence/non-commercial-government-licence.htm
23. Metadata for POLLUTION
60

Table Name: POLLUTIONTable Description: This table provides background pollution data at 1x1 km resolution which is modelled by
DEFRA on an annual basis. It is linked to the Pointer database based on the 1km grid square which has been translated from the British to Irish grid. Each household on the Pointer database is assigned a range of pollution measures which can then be linked to other datasets via XUPRN.Further information on pollution data is available at http://uk-air.defra.gov.uk/data/pcm-data
Source of the Data: DEFRANumber of Records: 995868Currency of the Data: JANUARY 2001 to DECEMBER 2016. Data updated annually.Unique Identifier: XUPRNTables Linked to: Via XUPRN: CORENILSDATA, ADDRESS_HISTORY, CENSUSHH_2001, CENSUSHH_2011,
MIGRATION_EVENTS, PROPERTIES
Variables:See Data Dictionary for descriptions and values of all variables includedXUPRN PM2PT5_XXXX PM10_XXXXBENZENE_XXXX CO_XXXX NO2_XXXXNOX_XXXX OZONE_XXXX SO2_XXXX
Additional Information for POLLUTIONMissing valuesThere are some grid squares in each data set that do not have values associated with them. These are grid square for which the centre is not located on the land or is across the border with Republic of Ireland. 0.8% of properties on the Pointer dataset do not have pollution attributes assigned. Some of the datasets being linked to may also have missing UPRNs and thus cannot have pollution attributes assigned to them.
MethodologyThe models are continually updated and improved and so the methodology often changes each year. The most recent methodology report is for 2013 and can be found on the UK-AIR website. Users should be mindful of these year to year changes when comparing model outputs between years.
UnitsMost of the model outputs are annual means, represented in µg m-3. CO concentrations are represented in mg m-3. Specific units and information about the different metrics is provided in the table above.
UpdatesThe maps are produced over the summer each year and typically the latest updates are checked and approved by the autumn and made available on this website by mid-October.
AcknowledgementsPlease acknowledge Defra as source if using this data.
24. Metadata for WEATHER AND POLLUTIONTable Name: WEATHER AND POLLUTIONTable Description: This table contains a lookup of XUPRN to WEATHER ID and POLLUTION ID.Source of the Data: Met Office and DEFRANumber of Records: 995816
61

Currency of the Data: Typically static, but a small number of records may be added at each download due to additional matching exercises
Unique Identifier: XUPRNTables Linked to: Via WID: WEATHER
Via PID: POLLUTIONVariables
Variable Name Variable Description Variable ValuesXUPRN Anonymised Property Reference NumberWID Unique Weather IDPID Unique Pollution ID
62

25. Metadata for SCHOOLTable Name: SCHOOLTable Description: This table provides coded school level information which has been drawn from the annual school
census exercise carried out by the Department of Education. It is linked to the 2011 Census which included data on travel to place of work or study and subsequently can be linked to the CENSUSP_2011 table using SCHOOL_ID. The information was coded/validated by the teams in DE and Census Office and more information on school enrolment data can be found at https://www.education-ni.gov.uk/articles/school-enrolments-school-level-data
Source of the Data: Department of Education (DE)Number of Records: 1,120Currency of the Data: School Enrolment data 2010/11. Data will remain static.Unique Identifier: SCHOOL_IDTables Linked to: Via SCHOOL_ID: CENSUSP_2011
Variables:See Data Dictionary for descriptions and values of all variables includedSCHOOL_ID SCHOOL_IRISH_MEDIUM SCHOOL_NOPUPILS_SEN SCHOOL_PTRSCHOOL_TYPE SCHOOL_SIZE SCHOOL_AVAILABLE_SPACESSCHOOL_MANAGEMENT SCHOOL_NOPUPILS_FSM SCHOOL_ATTENDANCE
26. Metadata for 2001 PERSON IMPUTATION FLAGS63

Table Name: CENSUSP_2001Table Description: This table includes question level imputation flags for all person-level variables
Number of Records: 1066684Currency of the Data: Generated for 2001. This data is not updateable.Unique Identifier: CENSUSPID0Tables Linked to: Via CENSUSPID0: CENSUSP_2001Variables:Variable Name Variable Description Variable ValuesGENDER_IMPP0 Gender All variables have the same valuesAGE_IMPP0 Age 0 = No changeMARITAL_IMPP0 Marital Status 1 = No response (edited/missing)RELG_IMPP0 ReligionRELUPBR_IMPP0 Religion of UpbringingETHNIC_IMPP0 EthnicityGHEALTH_IMPP0 General HealthUNPAIDCARE_IMPP0 Provision of Unpaid CareLLTI_IMPP0 Limiting Long-Term IllnessEDU_IMPP0 EducationACTLW_IMPP0 Activity Last Week
64

Additional Information for 2001 PERSON IMPUTATION FLAGSHow were they created?
Imputation flags have been created for the NILS. These compare the original scanned response with the basic edit checks completed to the final census database that was used for published outputs and for the NILS variables. Not all variables are included in the original scanned database and therefore imputation flags can only be created for a subset of variables.
The processes in the 2001 Census which may have affected/changed the response to person or household questions are:
1. Edit and Imputation System (EDIS) – See below for further details2. Record Swapping – A small (undisclosed) percentage of the households had unique IDs swapped
For example GENPUK in original CENSUS_POSTEDIT_PERSON file was compared with DATA3/SEX in the final census database. Where the codes in the 2 files were the same the imputation flag (GENDER_IMPP0) was set to zero. Any change between the 2 files was set to 1. This included those where a valid value was changed and those where a missing value in the original file was changed to a valid value in the final file.
The following table shows the distribution of each of the imputation flags.
2001 IMPUTATION_FLAGS (PERSON) – Table 1 – Distributions
65
Imputation Flag Description Value Records % Distribution
GENDER_IMPP0 No change 0 1050206 99.1No response (edited/missing) 1 9713 0.9
AGE_IMPP0 No change 0 1031394 97.3No response (edited/missing) 1 28525 2.7
MARITAL_IMPP0 No change 0 1044508 98.5No response (edited/missing) 1 15411 1.5
RELG_IMPP0 No change 0 913187 86.2No response (edited/missing) 1 146732 13.8
RELUPBR_IMPP0 No change 0 1012239 95.5No response (edited/missing) 1 47680 4.5
ETHNIC_IMPP0 No change 0 1018894 96.1No response (edited/missing) 1 41025 3.9
GHEALTH_IMPP0 No change 0 1038799 98.0No response (edited/missing) 1 21120 2.0
UNPAIDCARE_IMPP0 No change 0 1039836 98.1No response (edited/missing) 1 20083 1.9
LLTI_IMPP0 No change 0 1006305 94.9No response (edited/missing) 1 53614 5.1
EDU_IMPP0 No change 0 995922 94.0No response (edited/missing) 1 63997 6.0
ACTLW_IMPP0 No change 0 689466 65.0No response (edited/missing) 1 370453 35.0

66

27. Metadata for 2001 HOUSEHOLD IMPUTATION FLAGSTable Name: CENSUSHH_2001Table Description: This table includes question level imputation flags for selected household-level variablesNumber of Records: 320741Currency of the Data: Generated for 2001. This data is not updateable.Unique Identifier: CENSUSHID0Tables Linked to: Via CENSUSHID0: CENSUSHH_2001
Variables:Variable Name Variable Description Variable ValuesCENTHEAT_IMPH0 Presence of Central Heating All variables have the same valuesCARS_IMPH0 Number of Cars 0 = No changeTENURE_IMPH0 Tenure of Household 1 = No response (edited/missing)
67

Additional Information for 2001 HOUSEHOLD IMPUTATION FLAGSHow were they created?
See Additional Information for 2001 PERSON IMPUTATION FLAGS.
The following table shows the distribution of each of the imputation flags.
2001 IMPUTATION_FLAGS (HOUSEHOLD) – Table 1 – Distributions
Imputation Flags Description Variable Value Records % DistributionCARS_IMPH0 No change 0 306563 95.8
No response (edited/missing) 1 13418 4.2CENTHEAT_IMPH0 No change 0 310890 97.2
No response (edited/missing) 1 9091 2.8TENURE_IMPH0 No change 0 303132 94.7
No response (edited/missing) 1 16849 5.3
68

More Detail on Item Imputation in 2001 Census
Although full completion of the census form is a statutory requirement, it is recognised that some census forms will not be fully completed for all questions, and it is impractical to return to each household to insist upon full completion. Further, the completion rate for most questions exceeds 90%.
The Census White Paper (CM 4253, 1999) announced that a system would be developed to impute responses to omitted questions in otherwise completed census forms. This was developed and applied to all questions, with the exception of religion, although it was applied to the derived variable of community background.
The purpose of the census is to produce a statistical portrait of the population, and the sole purpose of item imputation is to ensure that the portrait of the population is as complete and accurate as possible. One major benefit of the use of item imputation is that there is no longer a residual category in census outputs labeled ‘Not stated’.
Users generally appear to find this beneficial and seem to be content with the application of item imputation. Accordingly, the use of item imputation was incorporated into the 2001 methodology.
Methodology
The adjustment of census results for respondents who either failed to answer a question, answered inconsistently, or answered incorrectly was made possible using an Edit and Donor Imputation System (EDIS) that was derived for the 2001 Census. The system was created to fill in a number of gaps in the records for enumerated people and households. At a later stage in processing, the database was adjusted using the One Number Census process.EDIS contained four initial components:
· Multi-tick rules when more than one box was ticked but only one option allowed· Range checks to prevent answers being outside an acceptable range· Filter rules to resolve some inconsistencies and to decide which fields should be set to ‘No Code Required’
where questions were answered but should not have been, and· Edit rules to deal with missing items or responses which appeared to be in error or inconsistent when
compared with other data. Edit either set a specific value or left it to imputation to determine a value.
After the application of these components, the Imputation component was applied. The basis for the Imputation component is to search for a single ‘donor’ person to supply all the missing variables for a recipient person. The method searched for a donor person who was similar using a number of other census variables. A series of criteria were drawn up to determine what was meant by ‘similar’. A suitable selection of variables known as Primary Matching Variables was defined to match on for each missing item. Values were copied from the donor person to fill the missing values on the record of the recipient person.
If more than one suitable donor person was found a donor was selected from a similar household. This was based on the age, sex, marital status and relationship between the people in the household. For the Community Background, Ethnicity, Language, Address one year ago and Country of birth variables, the system also considered the responses given by the rest of the household. If there was still more than one suitable donor the person in the geographically closest household was picked.
A similar method was applied for household variables (e.g. tenure) and people living in communal establishments. If several people in a household had missing responses or some of the responses to the household questions were missing the system tried to select all the donors from the same household in order to preserve household structure.
The application of the EDIS system means that missing responses have been catered for in all Census topics (except a person’s current religion). The system was designed to remove bias that would otherwise have been created in the final statistics by missing responses. [Extracted from 2001 Census Methodology Paper]
More detail on Record Swapping
This procedure adds uncertainty to data by swapping the geographical location of a small sample of households with that of another household in the same District Council (or group of District Councils). The procedure was designed such that the integrity of swapped data was not substantially different among key variables from that of unswapped data. The percentage of records swapped and the basis on which they are swapped must remain confidential.
69

28. Metadata for 2011 PERSON IMPUTATION FLAGSTable Name: CENSUSP_2011Table Description: This table includes question level imputation flags for all person-level variables
Number of Records: 1088832Currency of the Data: Generated for 2011. This data is not updateable.Unique Identifier: CENSUSPID1Tables Linked to: Via CENSUSPID1: CENSUSP_2011Variables:Variable Name Variable Description Variable ValuesSEX_IMPP1 Gender All variables have same valuesAGE_IMPP1 Age 0 = No changeMARSTAT_IMPP1 Marital Status 1 = No response (edited/missing)STUDENT_IMPP1 Student IndicatorTERMIND_IMPP1 Term-Time IndicatorCOB_IMPP1 Country of BirthINTENTION_IMPP1 Intention to StayYRARR_YEAR_IMPP1 Year of arrivalYRADINT_IMPP1 Country One Year AgoPSSPRT_IMPP1 Passport ImputationPSPTEL_IMPP1 Passports HeldIDENINT_IMPP1 National Identity (Country)IDENUK_IMPP1 UK National IdentityMAINLANG_IMPP1 Main LanguageLANGPRF_IMPP1 Language ProficiencyDISABILITY_IMPP1 DisabilityHEALTH_IMPP1 HealthCARER_IMPP1 CareQUALS01_IMPP1 Qualifications Level 1QUALS02_IMPP1 Qualifications Level 2QUALS03_IMPP1 Qualifications Level 3QUALS04_IMPP1 Qualifications Level 4QUALS05_IMPP1 Qualifications Level 5QUALS06_IMPP1 Qualifications Level 6QUALS07_IMPP1 Qualifications Level 7QUALS08_IMPP1 Qualifications Level 8QUALS09_IMPP1 Qualifications Level 9QUALS10_IMPP1 Qualifications Level 10QUALS11_IMPP1 Qualifications Level 11QUALS12_IMPP1 Qualifications Level 12QUALS13_IMPP1 Qualifications Level 13EMPLYGRP_IMPP1 Employment - In WorkLOOKWORK_IMPP1 Looking for WorkAVAILWORK_IMPP1 Available for WorkWAITWORK_IMPP1 Waiting to Start a JobEVERWORK_IMPP1 Ever WorkedLASTYRWRK_IMPP1 Year Last WorkedEMPSTAT_IMPP1 Employment StatusINDUSTRY_CODE_IMPP1 Industry of Work
70

HOURS_IMPP1 Hours WorkedWKPLIND_IMPP1 Workplace/Study IndicatorWKPLINT_IMPP1 Workplace/Study CountryTRANSPORT_IMPP1 Method of Travel to WorkRESIDENCE_TYPE_IMPP1 Residence TypeSCHOOL_ID_IMPP1 School Identifier
71
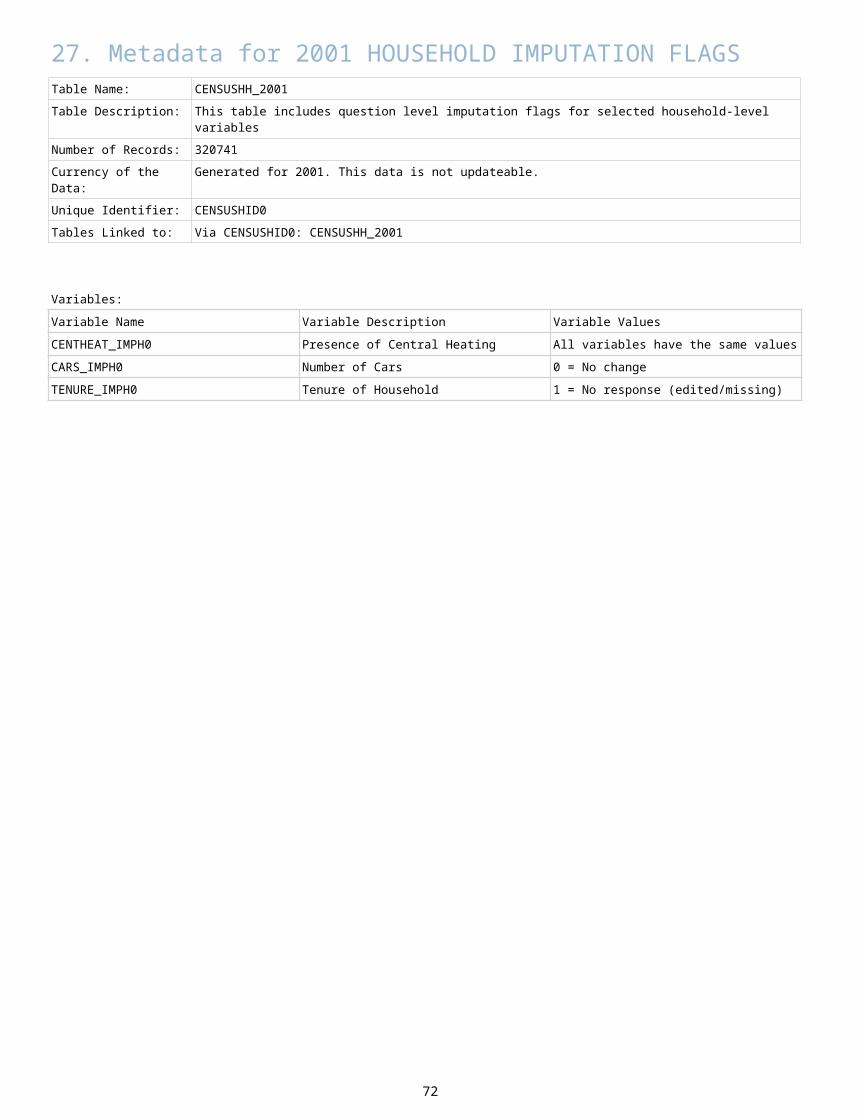
Additional Information for 2011 PERSON IMPUTATION FLAGSHow were they created?
A system was used in 2011, similar to that in 2001, to impute responses to omitted questions in otherwise complete Census forms. This was developed and applied to all questions, with the exception of religion although it was applied to the derived variable of community background. Respondents who answered inconsistently or incorrectly had their responses edited.
In addition to completing incomplete returns through item imputation, additional people were imputed, sometimes within existing households, and this may have affected household composition/relationship variables.
As well as this, a small (undisclosed) percentage of the households had their records slightly modified by random record swapping. This involved 'swapping' a sample of records with similar records in other geographical areas.
Imputation flags have been created for a number of variables within the NILS. These compare the original scanned response with the basic edit checks completed (initial extract) to the final census database that was used for published outputs and for the NILS variables. For a small number of variables the edit checks were completed after the initial extract which may result in a higher level of 'edit/imputation'.
The following table shows the distribution of each of the imputation flags.
2011 IMPUTATION_FLAGS (PERSON) – Table 1 – Distributions
Imputation Flag Description Records % DistributionAGE_IMPP1 No response (edited/missing) 47250 4.3AVAILWORK_IMPP1 No response (edited/missing) 27213 2.5CARER_IMPP1 No response (edited/missing) 84715 7.8COB_IMPP1 No response (edited/missing) 56296 5.2DISABILITY_IMPP1 No response (edited/missing) 75578 6.9EMPLYGRP_IMPP1 No response (edited/missing) 47368 4.4EMPSTAT_IMPP1 No response (edited/missing) 56856 5.2EVERWORK_IMPP1 No response (edited/missing) 94047 8.6HEALTH_IMPP1 No response (edited/missing) 62927 5.8HOURS_IMPP1 No response (edited/missing) 59304 5.4IDENINT_IMPP1 No response (edited/missing) 3649 0.3IDENUK_IMPP1 No response (edited/missing) 68579 6.3INDUSTRY_CODE_IMPP1 No response (edited/missing) 650 0.1INTENTION_IMPP1 No response (edited/missing) 31039 2.9LANGPRF_IMPP1 No response (edited/missing) 336037 30.9LASTYRWRK_IMPP1 No response (edited/missing) 64353 5.9LOOKWORK_IMPP1 No response (edited/missing) 50919 4.7MAINLANG_IMPP1 No response (edited/missing) 63723 5.9MARSTAT_IMPP1 No response (edited/missing) 95415 8.8PSPTEL_IMPP1 No response (edited/missing) 3153 0.3PSSPRT_IMPP1 No response (edited/missing) 70944 6.5QUALS01_IMPP1 No response (edited/missing) 66351 6.1QUALS02_IMPP1 No response (edited/missing) 66324 6.1QUALS03_IMPP1 No response (edited/missing) 66357 6.1QUALS04_IMPP1 No response (edited/missing) 66336 6.1QUALS05_IMPP1 No response (edited/missing) 66317 6.1QUALS06_IMPP1 No response (edited/missing) 66333 6.1QUALS07_IMPP1 No response (edited/missing) 66325 6.1QUALS08_IMPP1 No response (edited/missing) 66331 6.1QUALS09_IMPP1 No response (edited/missing) 66319 6.1QUALS10_IMPP1 No response (edited/missing) 66332 6.1
72

QUALS11_IMPP1 No response (edited/missing) 66329 6.1QUALS12_IMPP1 No response (edited/missing) 81497 7.5QUALS13_IMPP1 No response (edited/missing) 68403 6.3RESIDENCE_TYPE_IMPP1 No response (edited/missing) 45820 4.2SEX_IMPP1 No response (edited/missing) 45498 4.2STUDENT_IMPP1 No response (edited/missing) 88083 8.1TERMIND_IMPP1 No response (edited/missing) 71241 6.5TRANSPORT_IMPP1 No response (edited/missing) 198700 18.2WAITWORK_IMPP1 No response (edited/missing) 23910 2.2WKPLIND_IMPP1 No response (edited/missing) 472982 43.4WKPLINT_IMPP1 No response (edited/missing) 87736 8.1YRADINT_IMPP1 No response (edited/missing) 2763 0.3YRARR_YEAR_IMPP1 No response (edited/missing) 18372 1.7
73

29. Metadata for 2011 HOUSEHOLD IMPUTATION FLAGSTable Name: CENSUSHH_2011Table Description: This table includes question level imputation flags for selected household-level variablesNumber of Records: 354514Currency of the Data: Generated for 2011. This data is not updateable.
Unique Identifier: CENSUSHID1Tables Linked to: Via CENSUSHID1: CENSUSHH_2011
Variables:Variable Name Variable Description Variable ValuesCENSUSHID Census Household IDTYPACCOM_IMPH1 Accommodation Type All variables have the same valuesTENURE_IMPH1 Tenure 0 = No changeSELFCON_IMPH1 Self Contained 1 = No response (edited/missing)ROOMS_IMPH1 Number of RoomsLANDLORD_IMPH1 LandlordCENHEAT_IMPH1 Central HeatingCARSNO_IMPH1 Number of Cars/Vans
74

Additional Information for 2011 HOUSEHOLD IMPUTATION FLAGSHow were they created?
See Additional Information for 2011 PERSON IMPUTATION FLAGS.
The following table shows the distribution of each of the imputation flags.
2011 IMPUTATION_FLAGS (HOUSEHOLD) – Table 1 – Distributions
75
Imputation Flags Description Variable Value Records % DistributionCARSNO_IMPH1 No change 0 346330 97.7
No response (edited/missing) 1 8184 2.3CENHEAT_IMPH1 No change 0 348378 98.3
No response (edited/missing) 1 6136 1.7LANDLORD_IMPH1 No change 0 346527 97.7
No response (edited/missing) 1 7987 2.3ROOMS_IMPH1 No change 0 346722 97.8
No response (edited/missing) 1 7792 2.2SELFCON_IMPH1 No change 0 346614 97.8
No response (edited/missing) 1 7900 2.2TENURE_IMPH1 No change 0 346028 97.6
No response (edited/missing) 1 8486 2.4TYPACCOM_IMPH1 No change 0 346383 97.7
No response (edited/missing) 1 8131 2.3

More Detail on Imputation in 2011 Census
Although there is a legal obligation to complete a Census return, a small minority of individuals failed to provide information for all questions, or in some instances provided inconsistent information. As it is NISRA’s policy to report estimates for the entire population, imputation was utilised to “fill the gaps” and correct for both non-response and item inconsistency, using information based on recorded Census returns.
Methodology
Item Edit and Imputation was used to correct for inconsistencies and item non-response, ensuring all records were complete and consistent. This strategy used a similar but enhanced version of the framework adopted in 2001. It was undertaken as part of the Downstream Processing (DSP) Project at ONS and was harmonised across the UK.
Prior to imputation, capture and coding rules were applied to the data. Complex coding was used to assign numerical values to written text and tick boxes. Any invalid responses were flagged for imputation. Determinations were made to responses to resolved combinations of tick and text. The data was subject to checks to ensure each question response was within a predefined range. Missing data was also flagged. Reconcile Multiple Responses (RMR) was also used to remove false persons or duplicate persons/households. Filter Rules and Derived Variables for Processing (FRDVP) was used to correct data by applying edits to correct for questionnaire routing errors.
Item Imputation was achieved using Canadian Census Edit and Imputation System (CANCEIS). This is a donor-based edit and imputation system that simultaneously:
· Apply nearest-neighbour donor imputation· Apply deterministic edits and maintain consistency
Donors were selected based on matching variables. The database was divided up into three geographic units. Each geographic unit was subsequently broken down into household and person imputation. Household questions were imputed within a single module based on similar characteristics. Person imputation was based on 4 modules. The aim here was to group variables that help predict each other, in order to maximise the number of donors for a given group:
· Demographics – age, sex, marital status, student, activity last week· Culture – ethnicity, country of birth, language, passports· Health – general health, disability, long-term condition· Labour Market – economic activity, hours worked, qualifications
These matching variables were weighted according to several factors including how well they would predict other values and how highly they should be prioritised when resolving inconsistencies. For example, as age is often a good predictor of other demographic variables this was given a high weighting, therefore observed ages were prioritised over other values if changes were required. Northings and Eastings were used to control for geographical differences and find donors from similar areas. Each record was checked for consistency before imputation. Any items which failed the checks were marked for imputation along with missing items.
There were 31 edit rules used which were broadly based on 2001. For example, if aged between 5 and 15 then the individual must be in full-time education. Some rules were updated to account for any changes since 2001. For example, there was removal of the rule that did not allow same-sex couples. This was replaced with rules that said married couples should be opposite-sex and civil partners had to be same-sex.
In general, most Item Imputation Rates were reassuringly low. Those for the key demographic variable were very low, while those for health, education and economic questions were only slightly higher. Although rates were higher for some variables, these were regarded as acceptably so and also tended to be relatively high in England and Wales. For example, in the case of ‘Workplace/Study Address’ respondents may have omitted to tick the correct box and simply entered their work address. Where possible, steps were taken to validate such responses. Similar actions were taken for both Person and Household questions. It should be noted however, that item non-response adjustment was not applied to the religion question.
An ONS paper on the Item Edit and Imputation Process can be found at:https://www.ons.gov.uk/census/2011census/howourcensusworks/howdidwedoin2011
More detail on Record Swapping
As an additional method of statistical disclosure control, a small percentage of households had their records slightly modified by random record swapping. Here a sample of records were ‘swapped’ with similar records in other geographical areas adding an additional level of protection to the data. The percentage of records swapped and the basis on which they are swapped must remain confidential.
76
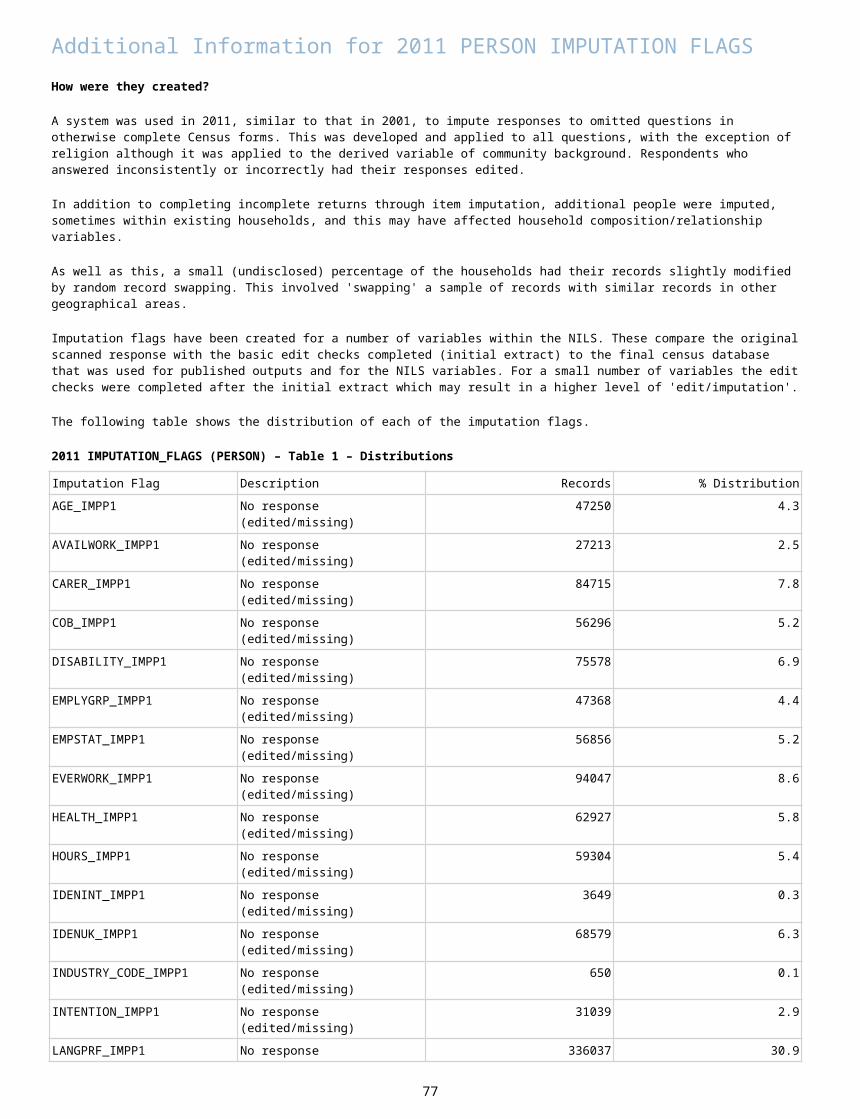
30. Meta Data for MATCH RATESBirths of NILS Members
Match rates for births of NILS members are based upon NILS members born on or after 1st April 1997 and the number of links of General Register Office Birth Registrations from 1974 onwards. Birth year is taken from Health Records and may have some variation to that recorded on the corresponding GRO record. A raw match rate is provided alongside an adjusted match rate to allow for list inflation in the health data (circa 4.4%).
MATCH_RATES – Table 1 – Births of NILS MembersYear of Birth Total Linked to GRO Raw Match Rate Adjusted Match Rate1974 9735 6492 66.7% 69.8%1975 9330 6191 66.4% 69.4%1976 9703 6610 68.1% 71.3%1977 9772 6651 68.1% 71.2%1978 10201 6753 66.2% 69.2%1979 10880 7348 67.5% 70.6%1980 10739 7103 66.1% 69.2%1981 10417 6944 66.7% 69.7%1982 10657 7036 66.0% 69.1%1983 10680 7138 66.8% 69.9%1984 10823 7540 69.7% 72.9%1985 10455 7295 69.8% 73.0%1986 10444 7420 71.0% 74.3%1987 10247 7468 72.9% 76.2%1988 9950 7297 73.3% 76.7%1989 9782 7232 73.9% 77.3%1990 9960 7493 75.2% 78.7%1991 9273 7070 76.2% 79.8%1992 8869 6877 77.5% 81.1%1993 8690 6834 78.6% 82.3%1994 8344 6628 79.4% 83.1%1995 8159 6605 81.0% 84.7%1996 8230 6805 82.7% 86.5%1997 7791 6492 83.3% 87.2%1998 7781 6568 84.4% 88.3%1999 7757 6564 84.6% 88.5%2000 7427 6277 84.5% 88.4%2001 7427 6276 84.5% 88.4%2002 7054 5898 83.6% 87.5%2003 7048 5913 83.9% 87.8%2004 7477 6425 85.9% 89.9%2005 7326 6340 86.5% 90.5%2006 7594 6653 87.6% 91.6%2007 7789 6929 89.0% 93.1%2008 7712 6950 90.1% 94.3%2009 7762 7033 90.6% 94.8%2010 8093 7434 91.9% 96.1%2011 7675 7092 92.4% 96.7%2012 7958 7341 92.2% 96.5%2013 7244 6767 93.4% 97.7%2014 7133 6750 94.6% 99.0%
77

2015 7006 6696 95.6% 100.0%2016 6917 6580 95.1% 99.5%Note: GRO births data is provided by year of registration and on average consists of 95% of births occurring in the same year with 5% of birth records having occurred in the previous year. Therefore the match rate for the most recent year of birth may be lower than previous years but will increase with inclusion of the next year of GRO birth registration data.
Deaths of NILS Members
Match rates for deaths of NILS members are based upon NILS members who have died on or after April 2001 and number of links of General Register Office Death Registrations from 1991 onwards. Death year is taken from Health Records and may have some variation to that recorded on the corresponding GRO record. A raw match rate is provided alongside an adjusted match rate to allow for list inflation in the health data (circa 4.4%)
MATCH_RATES – Table 2 – Deaths of NILS MembersYear of Death Total Linked to GRO Raw Match Rate Adjusted Match Rate1991 4099 4069 99.3% 103.8%1992 4208 4142 98.4% 103.0%1993 4441 4397 99.0% 103.6%1994 4283 4234 98.9% 103.4%1995 4293 4246 98.9% 103.5%1996 4167 4115 98.8% 103.3%1997 4193 4153 99.0% 103.6%1998 4246 4175 98.3% 102.9%1999 4430 4365 98.5% 103.1%2000 4201 4143 98.6% 103.2%2001 4319 4210 97.5% 102.0%2002 4126 4032 97.7% 102.2%2003 4263 4153 97.4% 101.9%2004 4163 4040 97.0% 101.5%2005 4039 3945 97.7% 102.2%2006 4220 4119 97.6% 102.1%2007 4102 4015 97.9% 102.4%2008 4233 4159 98.3% 102.8%2009 4117 4041 98.2% 102.7%2010 4098 4040 98.6% 103.1%2011 4045 3964 98.0% 102.5%2012 4254 4177 98.2% 102.7%2013 4224 4164 98.6% 103.1%2014 4273 4177 97.8% 102.3%2015 4396 4325 98.4% 102.9%2016 4292 4085 95.2% 99.6%Note: GRO deaths data is provided by year of registration and on average consists of 95% of deaths occurring in the same year with 5% of death records having occurred the previous year. Therefore the match rate for the most recent year of death may be lower than previous years but will increase with the inclusion of the next year of GRO death registration data.
78

Births to NILS Mothers
The expected number of births to NILS Mothers can only be estimated by using a count of mothers in the GRO records having one of the NILS sample birth dates. A match rate can then be calculated by using this estimated total and number of GRO births mother's records linked to NILS members.
MATCH_RATES – Table 3 – Births to NILS MothersRegistration Year Total Linked to GRO Match Rate1974 7512 6043 80.4%1975 7367 5964 81%1976 7494 6293 84%1977 7237 6108 84.4%1978 7441 6269 84.2%1979 7989 6857 85.8%1980 8098 6894 85.1%1981 7735 6145 79.4%1982 7675 5872 76.5%1983 7767 6246 80.4%1984 7860 6213 79%1985 7859 6204 78.9%1986 8020 6519 81.3%1987 7925 6395 80.7%1988 7880 6336 80.4%1989 7402 6079 82.1%1990 7530 6194 82.3%1991 7481 7015 93.8%1992 7274 6965 95.8%1993 7097 6703 94.4%1994 6914 6592 95.3%1995 6798 6570 96.6%1996 7005 6893 98.4%1997 6829 6788 99.4%1998 6798 6754 99.4%1999 6434 6395 99.4%2000 6221 6195 99.6%2001 6305 6228 98.8%2002 6190 6133 99.1%2003 6284 6205 98.7%2004 6494 6378 98.2%2005 6446 6368 98.8%2006 6855 6758 98.6%2007 7179 7097 98.9%2008 7591 7491 98.7%2009 7296 7217 98.9%2010 7395 7303 98.8%2011 7394 7304 98.8%2012 7459 7428 99.6%2013 6927 6897 99.6%2014 7032 7026 99.9%2015 7051 7016 99.5%2016 6904 6835 99.0%
Note: The total number of NILS Mothers from 1974-1996 is based on a sample of 28.5% of the total number of records for that Registration Year due to limited coverage of mother's birth date prior to 1997.
79

Births to NILS Fathers
The expected number of births to NILS Fathers can only be estimated using a count of fathers in the GRO records having one of the NILS sample birth dates. A match rate can then be calculated by using this estimated total and number of GRO births father's records linked to NILS members.
MATCH_RATES – Table 4 – Births to NILS FathersRegistration Year Total Linked to GRO Match Rate1974 7512 5487 73%1975 7367 5431 73.7%1976 7494 5621 75%1977 7237 5530 76.4%1978 7441 5709 76.7%1979 7989 6213 77.8%1980 8098 6413 79.2%1981 7735 5512 71.3%1982 7675 5369 70%1983 7767 5520 71.1%1984 7860 5508 70.1%1985 7859 5399 68.7%1986 8020 5595 69.8%1987 7925 5324 67.2%1988 7880 5343 67.8%1989 7402 5091 68.8%1990 7530 5322 70.7%1991 7481 6283 84%1992 7274 5996 82.4%1993 7097 5929 83.5%1994 6914 5727 82.8%1995 6798 5346 78.6%1996 7005 5436 77.6%1997 6193 6102 98.5%1998 6062 5978 98.6%1999 5937 5836 98.3%2000 5588 5453 97.6%2001 5752 5636 98.0%2002 5617 5459 97.2%2003 5604 5434 97.0%2004 5865 5652 96.4%2005 5905 5733 97.1%2006 6156 5965 96.9%2007 6475 6248 96.5%2008 6897 6676 96.8%2009 6606 6415 97.1%2010 6867 6783 98.8%2011 6718 6529 97.2%2012 6824 6674 97.8%2013 6490 6375 98.2%2014 6726 6532 97.1%2015 6633 6497 97.9%2016 6568 6338 96.5%
Note: The total number of NILS Fathers from 1974-1996 is based on a sample of 28.5% of the total number of records for that Registration Year due to limited coverage of father's birth date prior to 1997.
80

Marriages to NILS Brides
The expected number of marriages to NILS Brides can only be estimated by using a count of brides in the GRO records having one of the NILS sample birth dates. A match rate can then be calculated by using this estimated total and number of GRO marriage bride records linked to NILS members. A raw match rate is provided alongside an adjusted match rate to allow for brides who have been married in Northern Ireland but have no future intention to stay here (as indicated on marriage registration form).
MATCH_RATES – Table 5 – Marriages to NILS BridesRegistration Year
Total Linked to GRO Raw Match Rate Adjusted Match Rate
2005 2248 2142 95.3% 100.2%2006 2355 2261 96.0% 103.5%2007 2523 2431 96.4% 105.2%2008 2532 2439 96.3% 105.5%2009 2251 2152 95.6% 105.1%2010 2336 2232 95.5% 104.2%2011 2404 2298 95.6% 103.7%2012 2356 2221 94.3% 102.6%2013 2315 2205 95.2% 100.5%2014 2460 2327 94.6% 100.8%2015 2424 2260 93.2% 100.1%2016 2368 2224 93.9% 105.2%
Marriages to NILS Grooms
The expected number of marriages to NILS Grooms can only be estimated by using a count of grooms in the GRO records having one of the NILS sample birth dates. A match rate can then be calculated by using this estimated total and number of GRO marriage groom records linked to NILS members. A raw match rate is provided alongside an adjusted match rate to allow for grooms who have been married in Northern Ireland but have no future intention to stay here (as indicated on marriage registration form).
MATCH_RATES – Table 6 – Marriages to NILS GroomsRegistration Year
Total Linked to GRO Raw Match Rate Adjusted Match Rate
2005 2326 2067 88.9% 93.7%2006 2323 2133 91.8% 97.8%2007 2466 2209 89.6% 98.0%2008 2414 2200 91.1% 99.0%2009 2210 1992 90.1% 98.2%2010 2288 2046 89.4% 97.7%2011 2375 2136 89.9% 98.5%2012 2420 2170 89.7% 97.1%2013 2344 2127 90.7% 97.5%2014 2497 2230 89.3% 96.4%2015 2375 2136 89.9% 96.2%2016 2424 2185 90.1% 100.4%
Widowerhoods of NILS Members
The expected number of widowerhoods of NILS members can only be estimated by taking a sample of 28.5% of the total number of deaths from the General Register Office Death Registrations. These deaths will have occurred after 21st April 1991 (Census date) and relate to individuals who have been recorded as married. A match rate can then be calculated by using this estimated total and the number of NILS members that link to a Northern Ireland Census (1991, 2001 or 2011) who had a partner that died according to the Northern Ireland Mortality Study (NIMS). A raw match rate is provided alongside an adjusted match rate to account for Census person imputation.
81

MATCH_RATES - Table 7 - Widowerhoods of NILS MembersYear of Death Total Linked to GRO Raw Match Rate Adjusted Match Rate1991 1129 875 77.5% 77.5%1992 1721 1457 84.7% 84.7%1993 1756 1504 85.6% 85.6%1994 1690 1385 82.0% 82.0%1995 1685 1413 83.9% 83.9%1996 1652 1439 87.1% 87.1%1997 1640 1388 84.6% 84.6%1998 1648 1489 90.4% 90.4%1999 1680 1463 87.1% 87.1%2000 1567 1399 89.3% 89.3%2001 1542 1444 93.6% 98.2%2002 1576 1482 94.0% 98.6%2003 1574 1496 95.0% 99.6%2004 1559 1477 94.7% 99.3%2005 1522 1502 98.7% 103.3%2006 1562 1508 96.5% 101.1%2007 1579 1479 93.7% 98.3%2008 1572 1517 96.5% 101.1%2009 1518 1507 99.3% 103.9%2010 1566 1416 90.4% 95.0%2011 1547 1529 98.8% 103.6%2012 1606 1587 98.8% 103.6%2013 1592 1287 80.8% 85.6%2014 1594 1290 80.9% 85.7%2015 1652 1342 81.2% 86.0%2016 1617 1369 84.7% 89.5%
NILS Members to Census
Census 2001 & Census 2011For the 2001 and 2011 Census to Health linkages the expected number of NILS members was estimated using a count of records within the April 2001 and April 2011 BSO downloads respectively, where current status indicated the individual to be 'live'. The number of live records was adjusted for list inflation and imputation (see Table 9) to give the maximum number of records expected to be linked. A match rate was calculated using this estimated total and number of Census records linked to NILS members.
Census 1991For the 1991 Census, using an average of the 2001 and 2011 proportions, an estimate of the number of expected eligible NILS members based on the total Census count was produced. Again, this number has been adjusted for list inflation, however unlike 2001 and 2011, there is no estimated enumeration undercount which needs to be factored into the overall match rate calculation.
MATCH_RATES – Table 8 – NILS Members to CensusCensus Total Linked to Census Match Rate2011 490758 486711 99.2%2001 457884 457470 99.9%1991 448096 439593 98.1%
List Inflation and Imputation
List inflation can be caused by population movement without GP knowledge e.g. people emigrating, migrants returning home and deaths of residents outside the jurisdiction. Another identified causation is non-entitled users such as Republic of Ireland residents accessing Northern Ireland health services.
Person Imputation was carried out as part of both the 2001 and 2011 Census. These imputed
82

records cannot be matched to NILS data as they do not have any of the key demographic information to enable matching.
Rates for list inflation and person imputation for each of the Censuses are given below.
MATCH_RATES – Table 9 – Adjustment Rates for List Inflation & Person ImputationCensus List Inflation Person Imputation2011 4.1% 4.8%2001 4.7% 4.6%1991 4.7% N/A
Census 1981For the 1981 Census linkage, 1991 Census information was used to estimate the number of expected eligible NILS members who were live in 1981. As the Health Card data was not used as the spine in this instance of matching, list inflation is not an issue. There was also no estimated enumeration undercount in the 1981 Census to factor into the overall match rate calculation. As this match method is not directly comparable to the matching used within the other Census linkages, backwards linkage figures have also been created for the 1991 and 2001 Census linkages for comparison purposes.
MATCH_RATES – Table 10 – Backward Linkage ComparisonsCensus Members Identified in
Subsequent CensusMembers Linked Match Rate
1981 364,818 314,151 86.1%1991 390,452 354,016 90.7%2001 422,175 370,417 87.7%
83
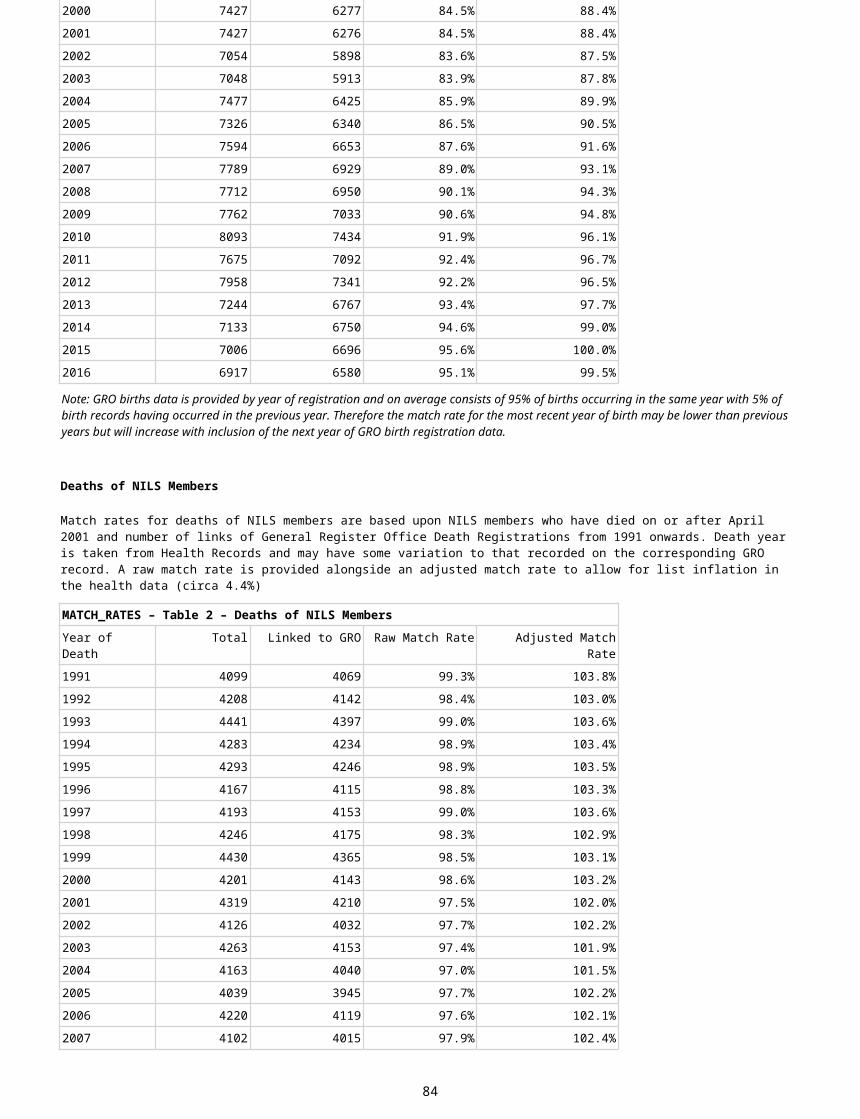
84
19. Meta Data for MATCH_RATESBirths of NILS Members
Match rates for births of NILS members are based upon NILS members born on or after 1st April 1997 and the number of links of General Register Office Birth Registrations from 1974 onwards. Birth year is taken from Health Records and may have some variation to that recorded on the corresponding GRO record. A raw match rate is provided alongside an adjusted match rate to allow for list inflation in the health data (circa 4.4%)
MATCH_RATES – Table 1 – Births of NILS MembersYear of Birth Total Linked to GRO Raw Match Rate Adjusted Match Rate1974 9735 6492 66.7% 69.8%1975 9330 6191 66.4% 69.4%1976 9703 6610 68.1% 71.3%1977 9772 6651 68.1% 71.2%1978 10201 6753 66.2% 69.2%1979 10880 7348 67.5% 70.6%1980 10739 7103 66.1% 69.2%1981 10417 6944 66.7% 69.7%1982 10657 7036 66.0% 69.1%1983 10680 7138 66.8% 69.9%1984 10823 7540 69.7% 72.9%1985 10455 7295 69.8% 73.0%1986 10444 7420 71.0% 74.3%1987 10247 7468 72.9% 76.2%1988 9950 7297 73.3% 76.7%1989 9782 7232 73.9% 77.3%1990 9960 7493 75.2% 78.7%1991 9273 7070 76.2% 79.8%1992 8869 6877 77.5% 81.1%1993 8690 6834 78.6% 82.3%1994 8344 6628 79.4% 83.1%1995 8159 6605 81.0% 84.7%1996 8230 6805 82.7% 86.5%1997 7791 6492 83.3% 87.2%1998 7781 6568 84.4% 88.3%1999 7757 6564 84.6% 88.5%2000 7427 6277 84.5% 88.4%2001 7427 6276 84.5% 88.4%2002 7054 5898 83.6% 87.5%2003 7048 5913 83.9% 87.8%2004 7477 6425 85.9% 89.9%2005 7326 6340 86.5% 90.5%2006 7594 6653 87.6% 91.6%2007 7789 6929 89.0% 93.1%2008 7712 6950 90.1% 94.3%2009 7762 7033 90.6% 94.8%2010 8093 7434 91.9% 96.1%2011 7675 7092 92.4% 96.7%2012 7958 7341 92.2% 96.5%2013 7244 6767 93.4% 97.7%2014 7133 6750 94.6% 99.0%2015 7006 6696 95.6% 100.0%2016 6917 6580 95.1% 99.5%Note: GRO births data is provided by year of registration and on average consists of 95% of births occurring in the same year with 5% of birth records having occurred in the previous
Version: Changes Made: Made by:V1.1 RSU comments taken into consideration Maire
Finalisation of all tables and creation of database MaireV1.2 Updated for new data release DaryllV1.3 Updated for 2011 link release (beta-test version) MaireV1.31 Updated with values for 2011 link release (beta-test version) MaireV1.32 Updated with values for 2011 link release (final version) AndrewV1.4 Updated for new data release ShannonV1.5 Metadata information reviewed ShannonV1.51 Updated for 1991 full-link release ShannonV1.6 Updated for 1981 link and historical births data release ShannonV1.7 Updated for new data release with MarriagesStats data SineadV1.8 Updated for widowerhoods and migration variables. SineadV1.9 Updated to add WEATHER and POLLUTION tables. Full review of Metadata. GlynnV2.0 Summer 2017 Updated for NILS Release. Review metadata. CatherineV2.1 November 2017 Updated to include School Data. Full review of metadata. GlynnV2.2 February 2018 Information update. Glynn
31. Document Version Control

85
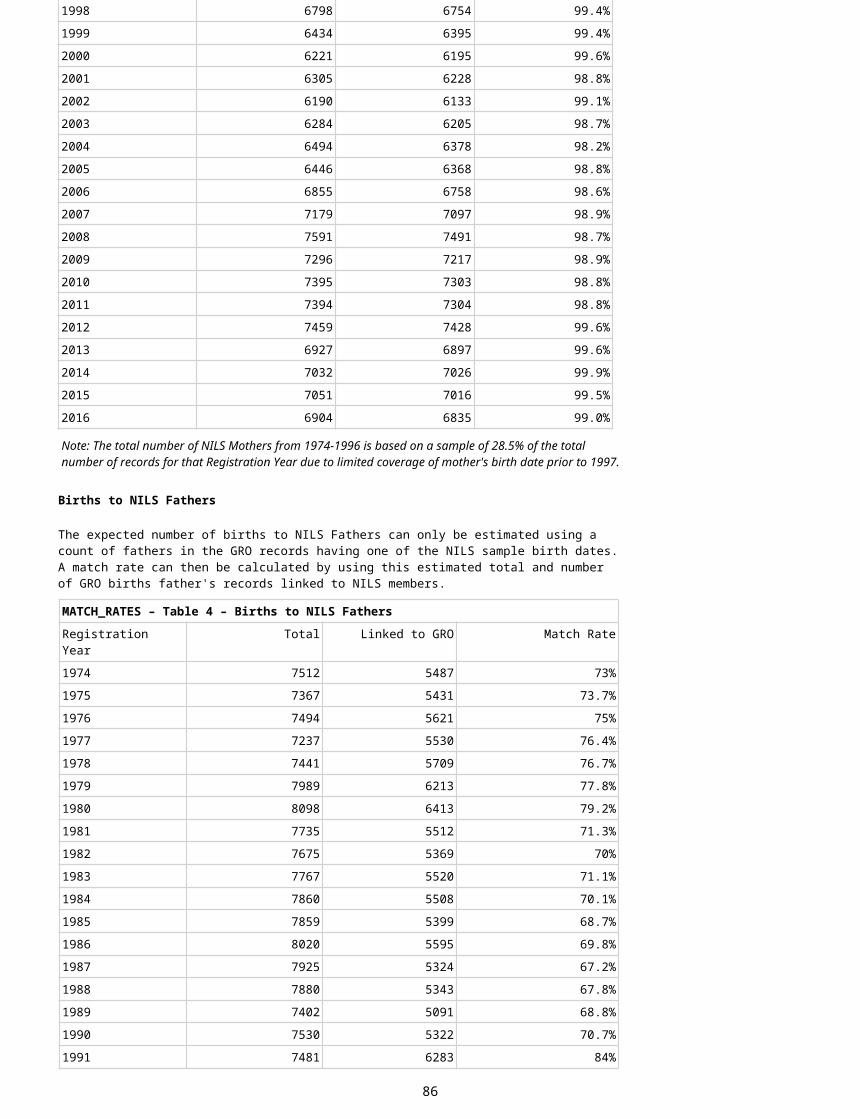
86