Nielsen. THE MOBILE ROADMAP
22
THE MOBILE ROADMAP A GUIDE FROM MOBILE ADVERTISING CHALLENGES TO MEASUREMENT SOLUTIONS
-
Upload
dmytro-lysiuk -
Category
Marketing
-
view
264 -
download
3
description
A GUIDE FROM MOBILE ADVERTISING CHALLENGES TO MEASUREMENT SOLUTIONS
Transcript of Nielsen. THE MOBILE ROADMAP
1Copyright © 2014 The Nielsen Company
T H E M O B I L E R O A D M A PA GUIDE FROM MOBILE ADVERTISING CHALLENGES TO MEASUREMENT SOLUTIONS
2 THE MOBILE ROADMAP
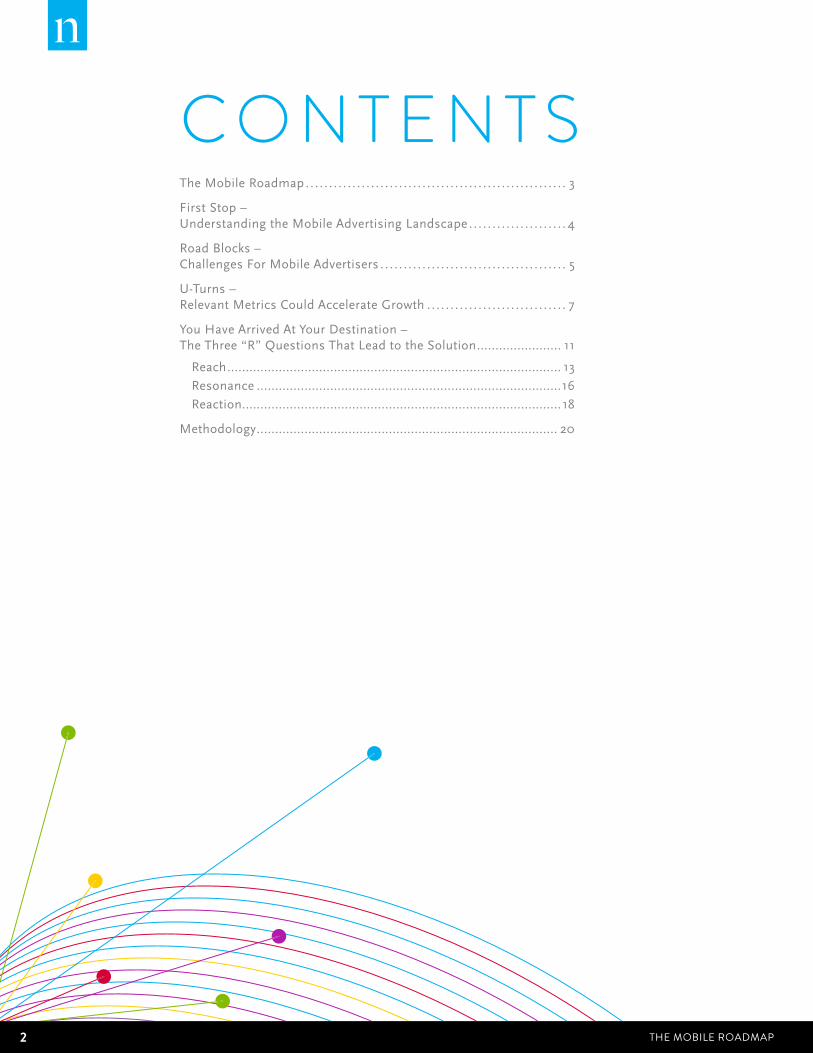
C O N T E N T SThe Mobile Roadmap . . . . . . . . . . . . . . . . . . . . . . . . . . . . . . . . . . . . . . . . . . . . . . . . . . . . . . . . 3
First Stop – Understanding the Mobile Advertising Landscape . . . . . . . . . . . . . . . . . . . . . 4
Road Blocks – Challenges For Mobile Advertisers . . . . . . . . . . . . . . . . . . . . . . . . . . . . . . . . . . . . . . . . 5
U-Turns – Relevant Metrics Could Accelerate Growth . . . . . . . . . . . . . . . . . . . . . . . . . . . . . . 7
You Have Arrived At Your Destination – The Three “R” Questions That Lead to the Solution ....................... 11
Reach ........................................................................................... 13
Resonance ...................................................................................16
Reaction....................................................................................... 18
Methodology .................................................................................. 20
3THE MOBILE ROADMAP Copyright © 2014 The Nielsen Company
T H E M O B I L E R O A D M A P
The new mobile medium represents an appealing opportunity for brand
marketers - enabling them to reach a pool of consumers that are growing
by the day anytime and anywhere. Because of its relative youth, however,
there is still confusion over how best to engage in mobile advertising.
Differences in technology mean that marketers cannot always employ
the same best practices in mobile that are used for television or online
advertising.
Unlike the online medium, mobile is relatively nascent in being adopted for
branding purposes. Even at this stage, mobile marketers and media owners
identified the inability to measure the effectiveness of their mobile efforts
consistently with other media as one of their biggest pain points, and a
significant barrier to mobile growth.
Based on interviews with advertisers, agencies, and media providers, this
Mobile Roadmap, addresses the challenges advertisers are experiencing
in mobile advertising, and addresses the solutions available to provide the
most return on their financial investment.
4 THE MOBILE ROADMAP
Mobile devices have come a long way since their heavy, brick-like
predecessors were first introduced in 1983. These devices are now
much more than on-the-go telephones, morphing and growing into
a companion that is always on and always with us. Smartphones
now make up 70 percent of all mobile phones in the U.S., up from
18 percent just four years ago. We now spend so much time on our
phones (34 hours monthly) that it has surpassed time spent on our
computers (27 hours monthly).
Brand marketers are starting to experiment with mobile in
their advertising campaigns to stay in front of consumers.
Eighty-eight percent of the advertisers and 90 percent of the
agencies we surveyed told us they had bought some form of
mobile advertising in the past 12 months.
When compared with online and TV, mobile advertising is
a young medium and still relatively new to most marketers.
The majority of advertisers surveyed (82%) had three years
or less experience with mobile, with 21 percent “just getting
started.” Agencies were in a similar position, with 70 percent of
respondents having three years or less experience with mobile.
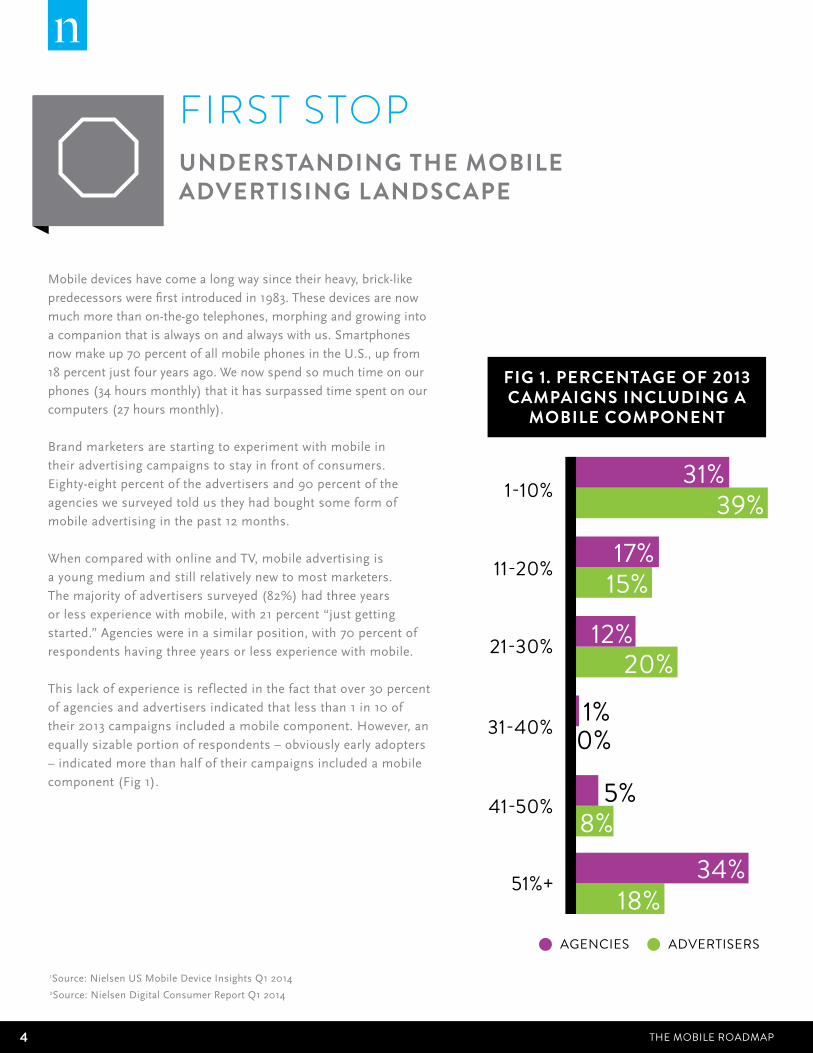
This lack of experience is reflected in the fact that over 30 percent
of agencies and advertisers indicated that less than 1 in 10 of
their 2013 campaigns included a mobile component. However, an
equally sizable portion of respondents – obviously early adopters
– indicated more than half of their campaigns included a mobile
component (Fig 1).
1Source: Nielsen US Mobile Device Insights Q1 20142Source: Nielsen Digital Consumer Report Q1 2014
31% 39%
15%
12% 20%
5% 8%
34% 18%
1% 0%
17%
AGENCIES ADVERTISERS
1-10%
11-20%
21-30%
31-40%
41-50%
51%+
FIG 1. PERCENTAGE OF 2013 CAMPAIGNS INCLUDING A
MOBILE COMPONENT
FIRST STOP UNDERSTANDING THE MOBILE ADVERTISING LANDSCAPE
5THE MOBILE ROADMAP Copyright © 2014 The Nielsen Company
R O A D B L O C K S CHALLENGES FOR MOBILE ADVERTISING
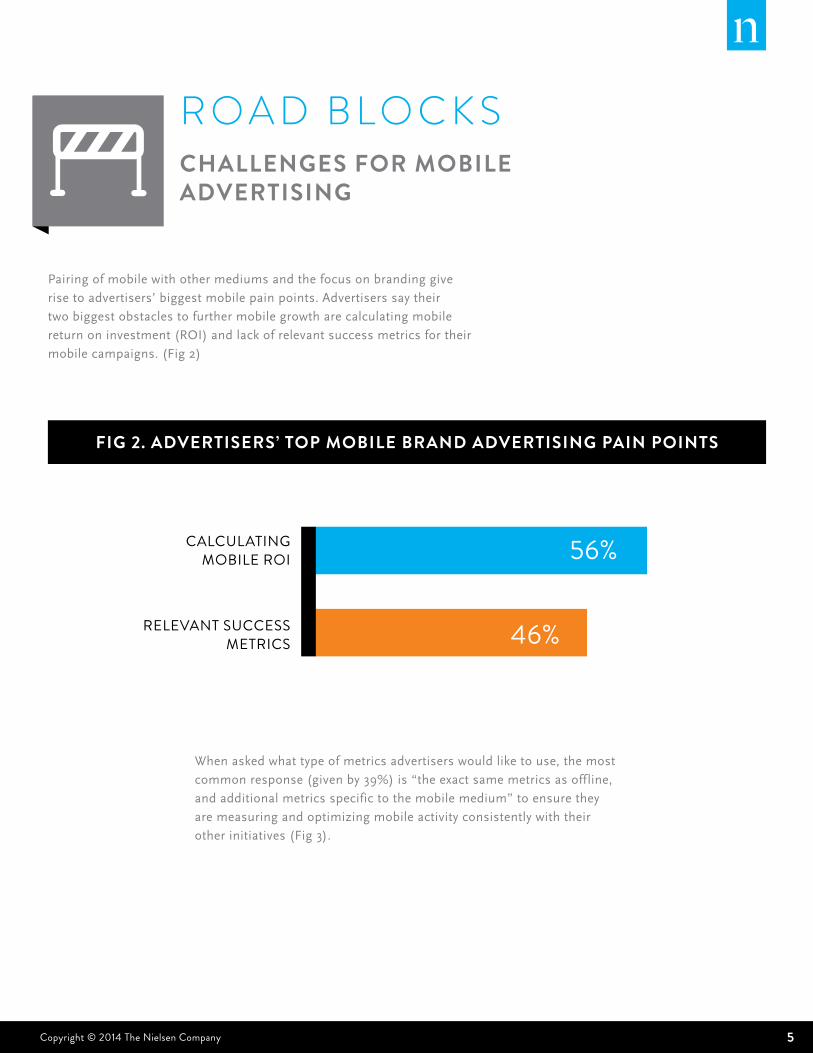
Pairing of mobile with other mediums and the focus on branding give
rise to advertisers’ biggest mobile pain points. Advertisers say their
two biggest obstacles to further mobile growth are calculating mobile
return on investment (ROI) and lack of relevant success metrics for their
mobile campaigns. (Fig 2)
FIG 2. ADVERTISERS’ TOP MOBILE BRAND ADVERTISING PAIN POINTS
CALCULATING MOBILE ROI
RELEVANT SUCCESS METRICS
56%
46%
When asked what type of metrics advertisers would like to use, the most
common response (given by 39%) is “the exact same metrics as offline,
and additional metrics specific to the mobile medium” to ensure they
are measuring and optimizing mobile activity consistently with their
other initiatives (Fig 3).
6 THE MOBILE ROADMAP
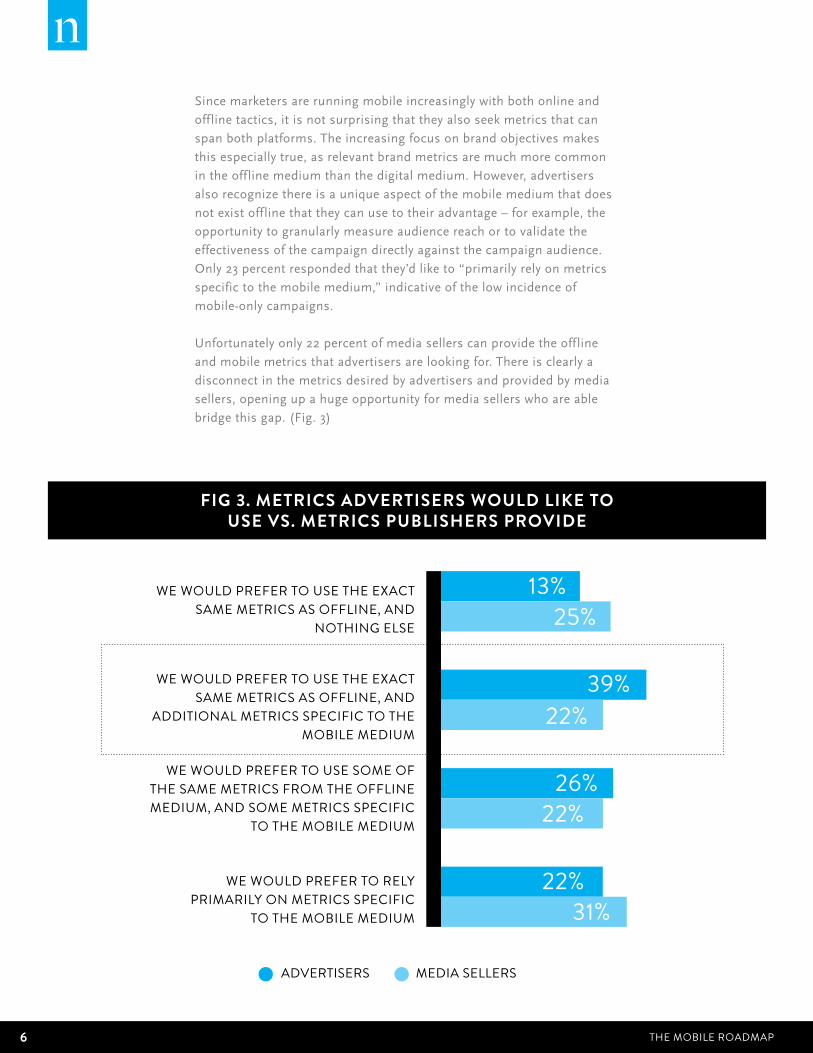
FIG 3. METRICS ADVERTISERS WOULD LIKE TOUSE VS. METRICS PUBLISHERS PROVIDE
Since marketers are running mobile increasingly with both online and
offline tactics, it is not surprising that they also seek metrics that can
span both platforms. The increasing focus on brand objectives makes
this especially true, as relevant brand metrics are much more common
in the offline medium than the digital medium. However, advertisers
also recognize there is a unique aspect of the mobile medium that does
not exist offline that they can use to their advantage – for example, the
opportunity to granularly measure audience reach or to validate the
effectiveness of the campaign directly against the campaign audience.
Only 23 percent responded that they’d like to “primarily rely on metrics
specific to the mobile medium,” indicative of the low incidence of
mobile-only campaigns.
Unfortunately only 22 percent of media sellers can provide the offline
and mobile metrics that advertisers are looking for. There is clearly a
disconnect in the metrics desired by advertisers and provided by media
sellers, opening up a huge opportunity for media sellers who are able
bridge this gap. (Fig. 3)
WE WOULD PREFER TO USE THE EXACT SAME METRICS AS OFFLINE, AND
NOTHING ELSE
WE WOULD PREFER TO USE THE EXACT SAME METRICS AS OFFLINE, AND
ADDITIONAL METRICS SPECIFIC TO THE MOBILE MEDIUM
WE WOULD PREFER TO USE SOME OF THE SAME METRICS FROM THE OFFLINE MEDIUM, AND SOME METRICS SPECIFIC
TO THE MOBILE MEDIUM
WE WOULD PREFER TO RELY PRIMARILY ON METRICS SPECIFIC
TO THE MOBILE MEDIUM
13%
39%
26%
22%
25%
22%
22%
31%
ADVERTISERS MEDIA SELLERS
7THE MOBILE ROADMAP Copyright © 2014 The Nielsen Company
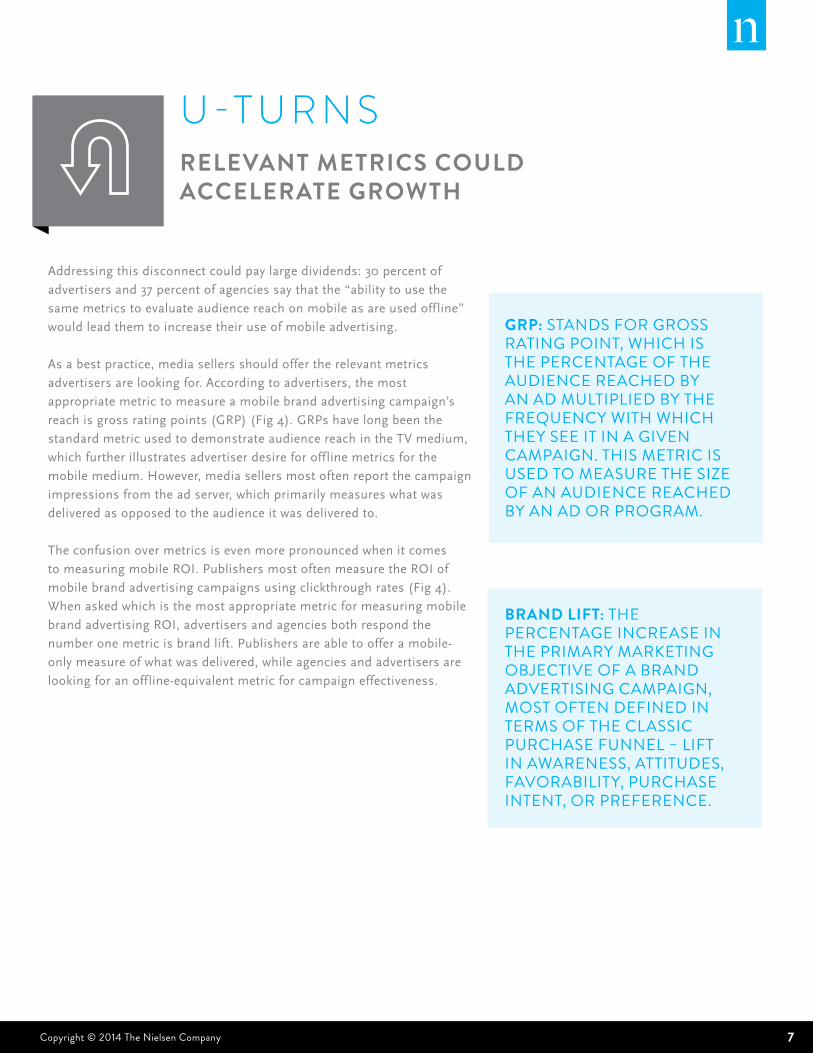
Addressing this disconnect could pay large dividends: 30 percent of
advertisers and 37 percent of agencies say that the “ability to use the
same metrics to evaluate audience reach on mobile as are used offline”
would lead them to increase their use of mobile advertising.
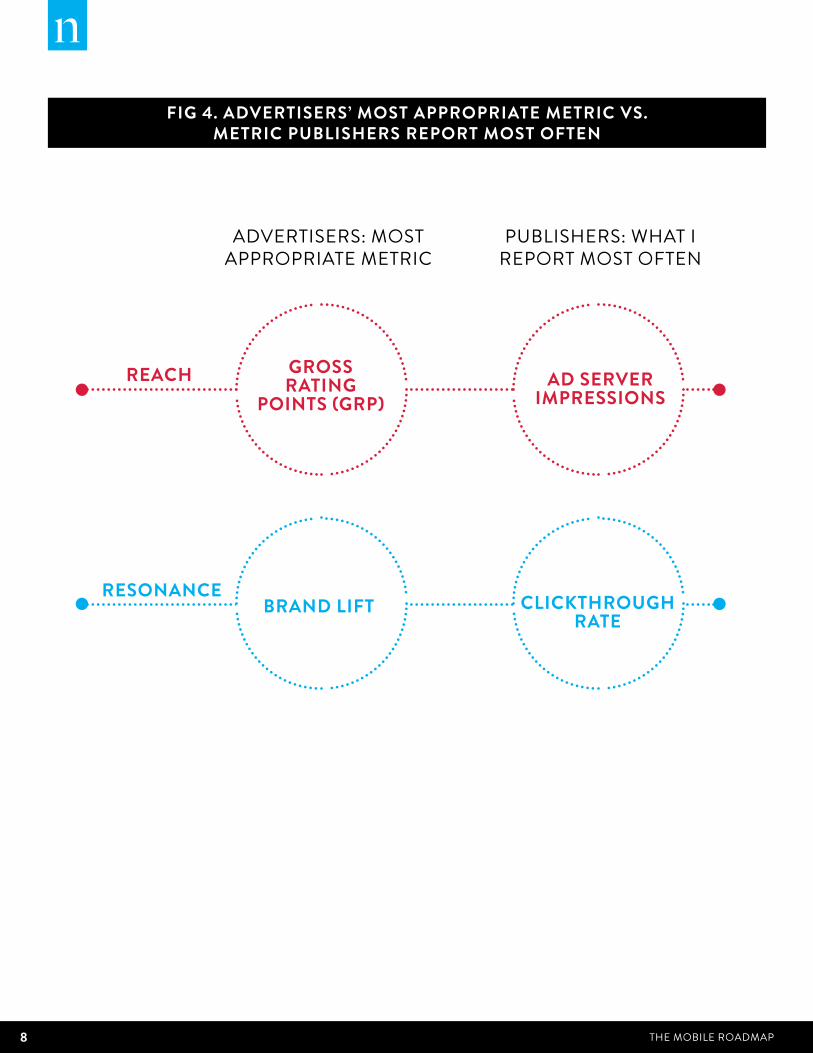
As a best practice, media sellers should offer the relevant metrics
advertisers are looking for. According to advertisers, the most
appropriate metric to measure a mobile brand advertising campaign’s
reach is gross rating points (GRP) (Fig 4). GRPs have long been the
standard metric used to demonstrate audience reach in the TV medium,
which further illustrates advertiser desire for offline metrics for the
mobile medium. However, media sellers most often report the campaign
impressions from the ad server, which primarily measures what was
delivered as opposed to the audience it was delivered to.
The confusion over metrics is even more pronounced when it comes
to measuring mobile ROI. Publishers most often measure the ROI of
mobile brand advertising campaigns using clickthrough rates (Fig 4).
When asked which is the most appropriate metric for measuring mobile
brand advertising ROI, advertisers and agencies both respond the
number one metric is brand lift. Publishers are able to offer a mobile-
only measure of what was delivered, while agencies and advertisers are
looking for an offline-equivalent metric for campaign effectiveness.
GRP: STANDS FOR GROSS RATING POINT, WHICH IS THE PERCENTAGE OF THE AUDIENCE REACHED BY AN AD MULTIPLIED BY THE FREQUENCY WITH WHICH THEY SEE IT IN A GIVEN CAMPAIGN. THIS METRIC IS USED TO MEASURE THE SIZE OF AN AUDIENCE REACHED BY AN AD OR PROGRAM.
BRAND LIFT: THE PERCENTAGE INCREASE IN THE PRIMARY MARKETING OBJECTIVE OF A BRAND ADVERTISING CAMPAIGN, MOST OFTEN DEFINED IN TERMS OF THE CLASSIC PURCHASE FUNNEL – LIFT IN AWARENESS, ATTITUDES, FAVORABILITY, PURCHASE INTENT, OR PREFERENCE.
U-T U R N S RELEVANT METRICS COULD ACCELERATE GROWTH
8 THE MOBILE ROADMAP
FIG 4. ADVERTISERS’ MOST APPROPRIATE METRIC VS.METRIC PUBLISHERS REPORT MOST OFTEN
GROSS RATING
POINTS (GRP)REACH
RESONANCEBRAND LIFT
AD SERVER IMPRESSIONS
CLICKTHROUGH RATE
ADVERTISERS: MOST APPROPRIATE METRIC
PUBLISHERS: WHAT I REPORT MOST OFTEN
9THE MOBILE ROADMAP Copyright © 2014 The Nielsen Company
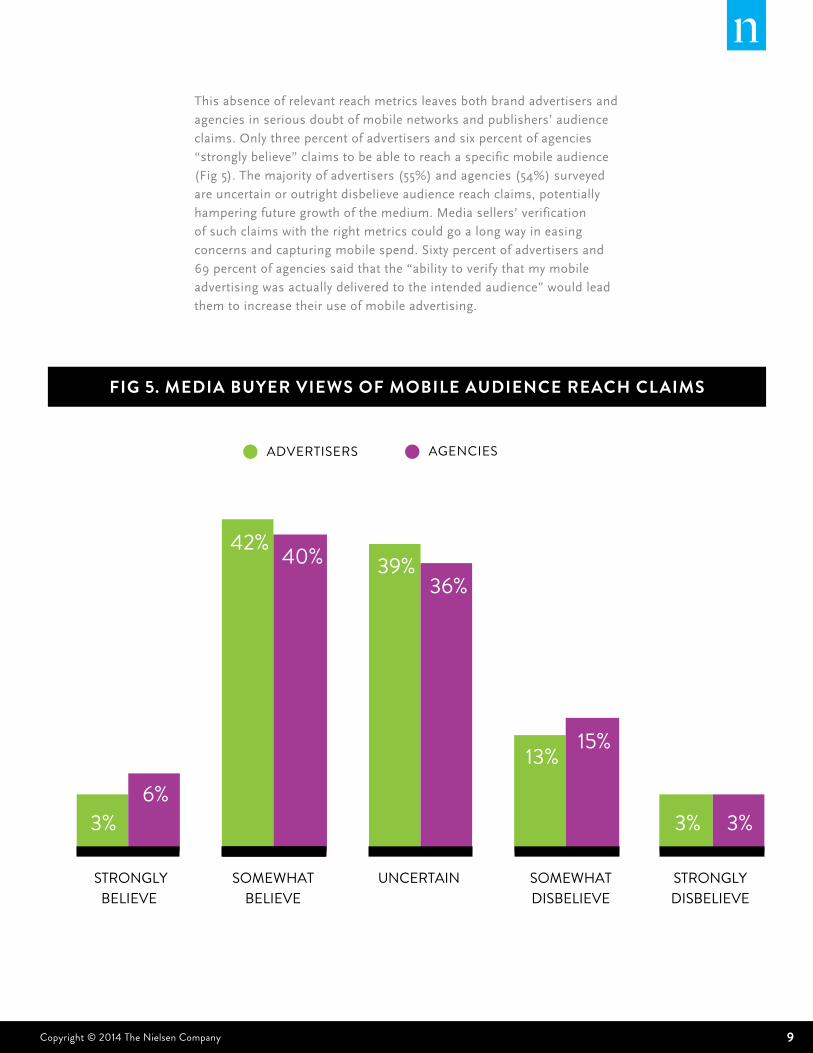
This absence of relevant reach metrics leaves both brand advertisers and
agencies in serious doubt of mobile networks and publishers’ audience
claims. Only three percent of advertisers and six percent of agencies
“strongly believe” claims to be able to reach a specific mobile audience
(Fig 5). The majority of advertisers (55%) and agencies (54%) surveyed
are uncertain or outright disbelieve audience reach claims, potentially
hampering future growth of the medium. Media sellers’ verification
of such claims with the right metrics could go a long way in easing
concerns and capturing mobile spend. Sixty percent of advertisers and
69 percent of agencies said that the “ability to verify that my mobile
advertising was actually delivered to the intended audience” would lead
them to increase their use of mobile advertising.
FIG 5. MEDIA BUYER VIEWS OF MOBILE AUDIENCE REACH CLAIMS
ADVERTISERS AGENCIES
3%
42% 39%
13%
3% 6%
40% 36%
15%
3%
STRONGLYBELIEVE
SOMEWHAT BELIEVE
UNCERTAIN SOMEWHATDISBELIEVE
STRONGLY DISBELIEVE
10 THE MOBILE ROADMAP
ADVERTISERS AGENCIES
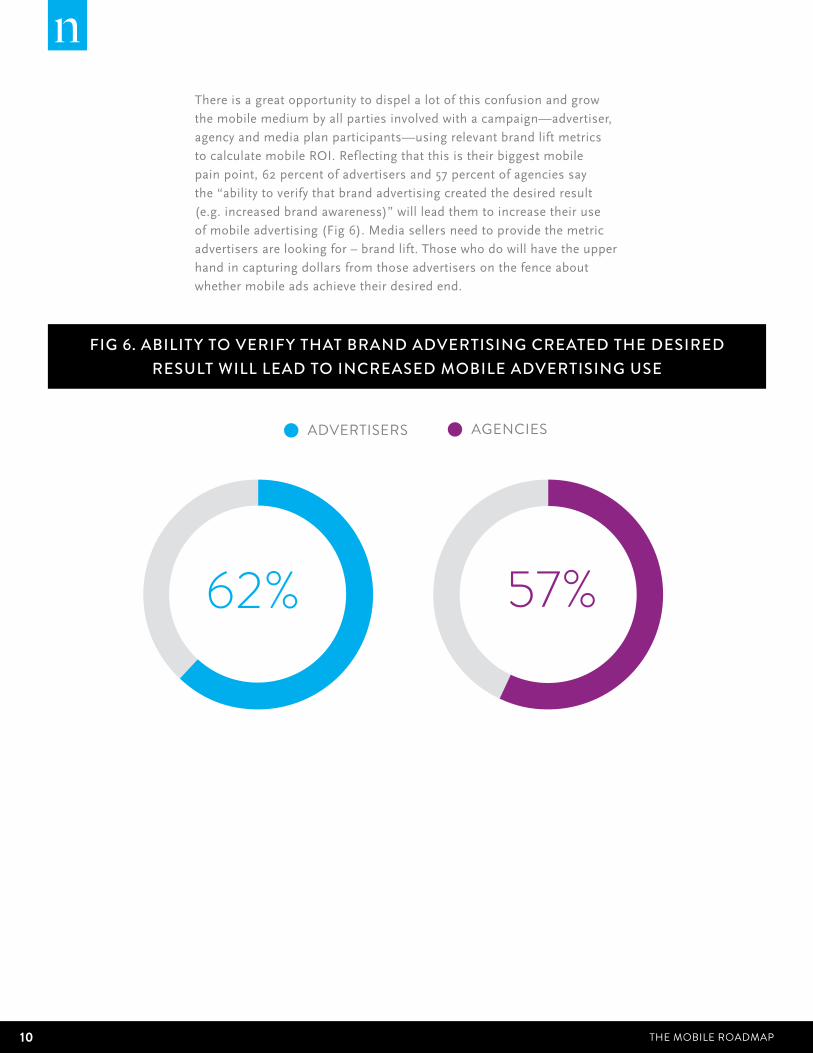
There is a great opportunity to dispel a lot of this confusion and grow
the mobile medium by all parties involved with a campaign—advertiser,
agency and media plan participants—using relevant brand lift metrics
to calculate mobile ROI. Reflecting that this is their biggest mobile
pain point, 62 percent of advertisers and 57 percent of agencies say
the “ability to verify that brand advertising created the desired result
(e.g. increased brand awareness)” will lead them to increase their use
of mobile advertising (Fig 6). Media sellers need to provide the metric
advertisers are looking for – brand lift. Those who do will have the upper
hand in capturing dollars from those advertisers on the fence about
whether mobile ads achieve their desired end.
FIG 6. ABILITY TO VERIFY THAT BRAND ADVERTISING CREATED THE DESIRED RESULT WILL LEAD TO INCREASED MOBILE ADVERTISING USE
62% 57%
11THE MOBILE ROADMAP Copyright © 2014 The Nielsen Company
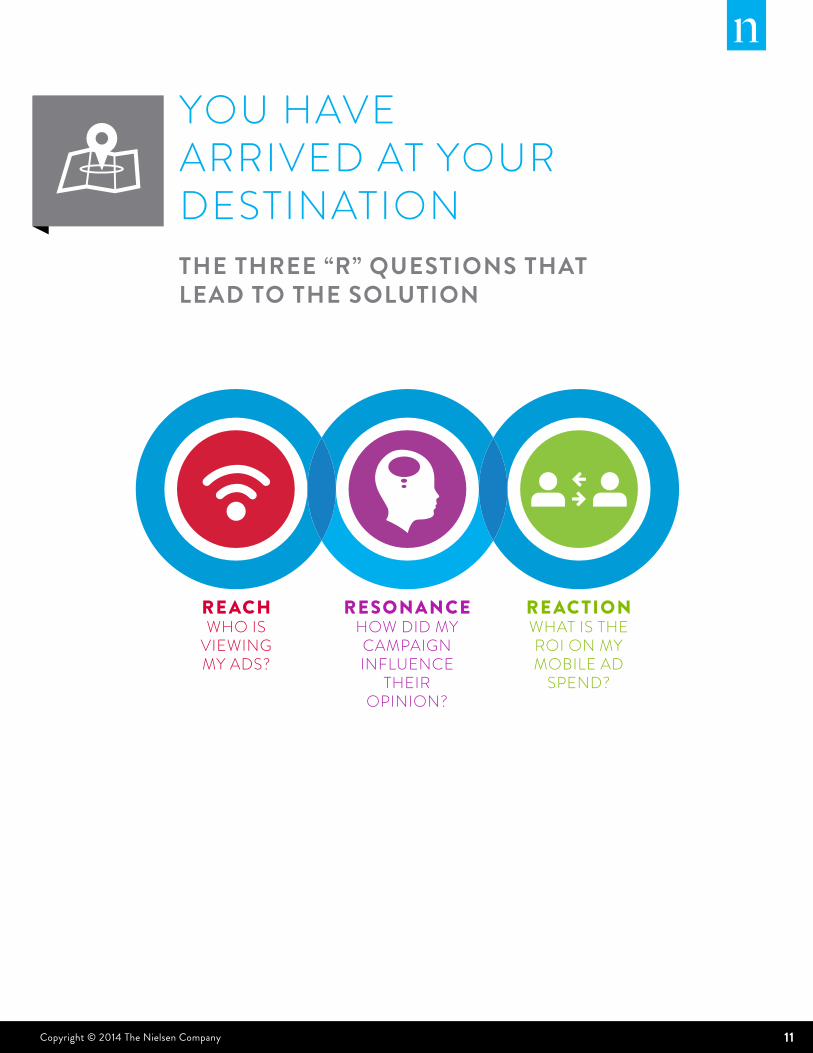
YOU HAVE ARRIVED AT YOUR DESTINATION
RE ACHWHO IS
VIEWING MY ADS?
THE THREE “R” QUESTIONS THAT LEAD TO THE SOLUTION
RESONANCEHOW DID MY
CAMPAIGN INFLUENCE
THEIR OPINION?
RE AC TIONWHAT IS THE ROI ON MY MOBILE AD
SPEND?
12 THE MOBILE ROADMAP
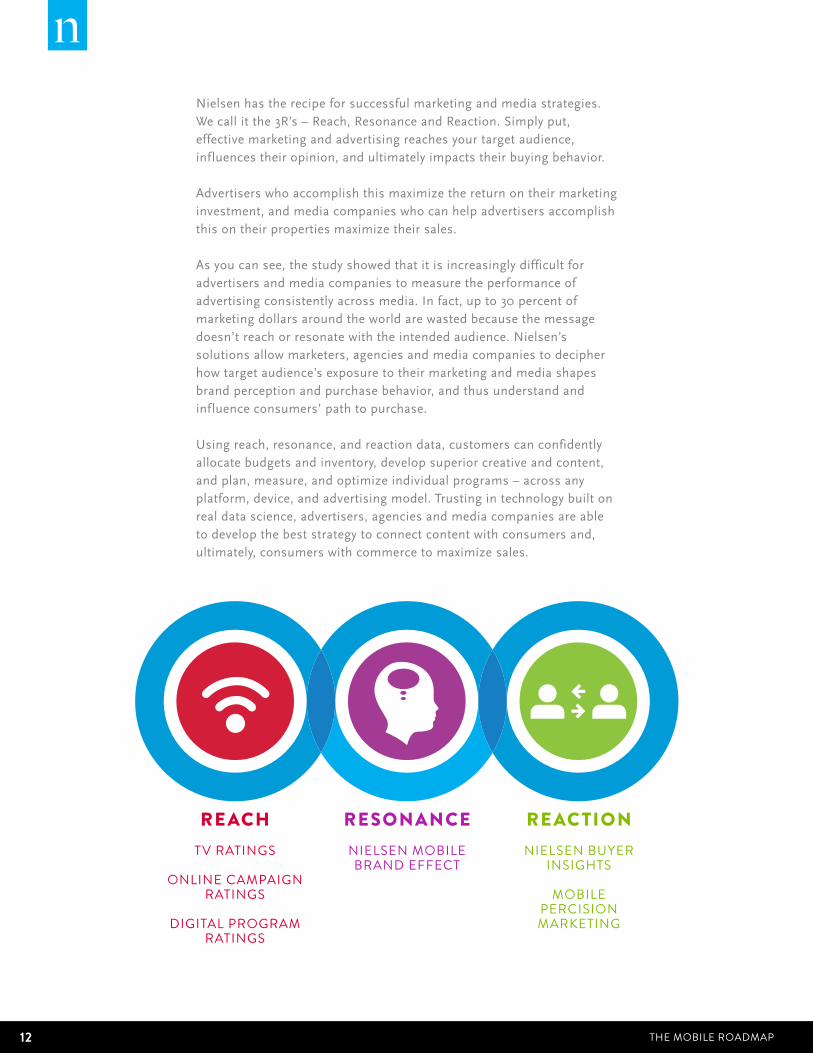
Nielsen has the recipe for successful marketing and media strategies. We call it the 3R’s – Reach, Resonance and Reaction. Simply put, effective marketing and advertising reaches your target audience, influences their opinion, and ultimately impacts their buying behavior.
Advertisers who accomplish this maximize the return on their marketing investment, and media companies who can help advertisers accomplish this on their properties maximize their sales.
As you can see, the study showed that it is increasingly difficult for advertisers and media companies to measure the performance of advertising consistently across media. In fact, up to 30 percent of marketing dollars around the world are wasted because the message doesn’t reach or resonate with the intended audience. Nielsen’s solutions allow marketers, agencies and media companies to decipher how target audience’s exposure to their marketing and media shapes brand perception and purchase behavior, and thus understand and influence consumers’ path to purchase.
Using reach, resonance, and reaction data, customers can confidently allocate budgets and inventory, develop superior creative and content, and plan, measure, and optimize individual programs – across any platform, device, and advertising model. Trusting in technology built on real data science, advertisers, agencies and media companies are able to develop the best strategy to connect content with consumers and, ultimately, consumers with commerce to maximize sales.
RE ACHTV RATINGS
ONLINE CAMPAIGN RATINGS
DIGITAL PROGRAM RATINGS
RESONANCENIELSEN MOBILE BRAND EFFECT
RE AC TIONNIELSEN BUYER
INSIGHTS
MOBILE PERCISION MARKETING
13THE MOBILE ROADMAP Copyright © 2014 The Nielsen Company
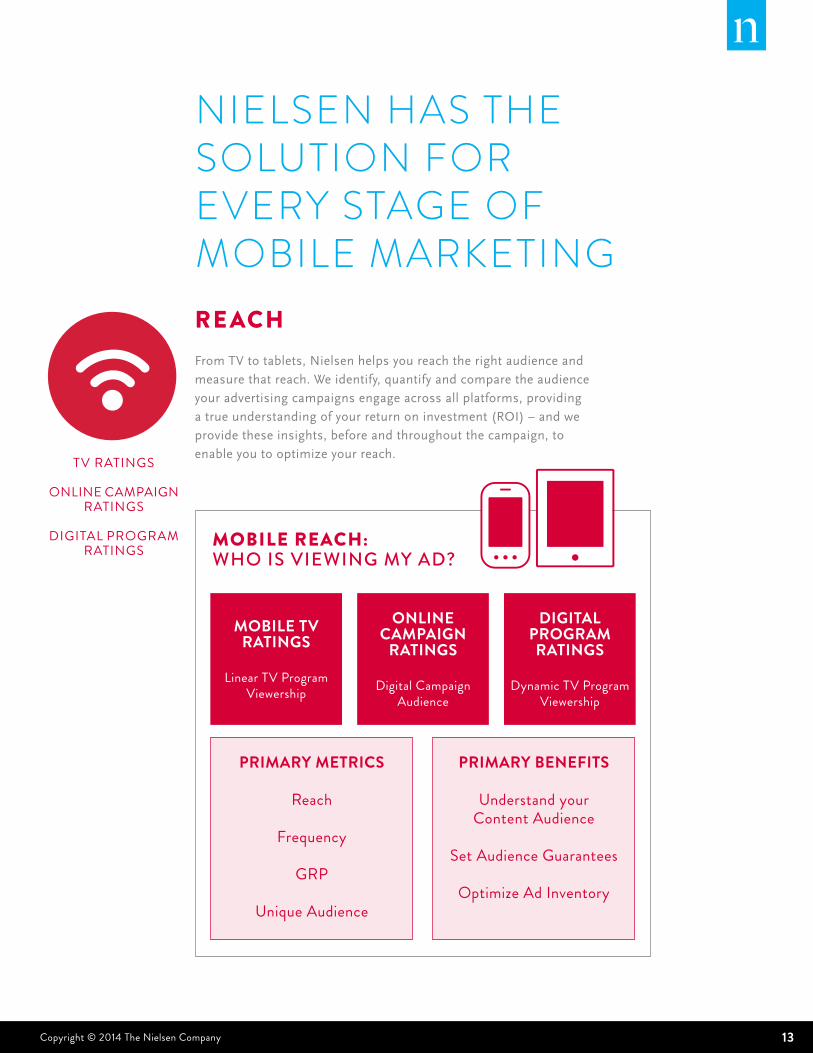
RE ACHFrom TV to tablets, Nielsen helps you reach the right audience and
measure that reach. We identify, quantify and compare the audience
your advertising campaigns engage across all platforms, providing
a true understanding of your return on investment (ROI) – and we
provide these insights, before and throughout the campaign, to
enable you to optimize your reach.TV RATINGS
ONLINE CAMPAIGN RATINGS
DIGITAL PROGRAM RATINGS
NIELSEN HAS THE SOLUTION FOR EVERY STAGE OF MOBILE MARKETING
MOBILE REACH: WHO IS VIEWING MY AD?
MOBILE TV RATINGS
Linear TV Program Viewership
ONLINE CAMPAIGN
RATINGS
Digital Campaign Audience
DIGITAL PROGRAM RATINGS
Dynamic TV Program Viewership
PRIMARY METRICS
Reach
Frequency
GRP
Unique Audience
PRIMARY BENEFITS
Understand your Content Audience
Set Audience Guarantees
Optimize Ad Inventory

14 THE MOBILE ROADMAP
MOBILE TELEVISION RATINGS IS AN AUDIENCE MEASUREMENT TOOL FOR TV NETWORKS TO UNDERSTAND RATINGS FROM VIEWERS ON MOBILE DEVICES.
RE ACH
HOW IT WORKS:
ONLINE CAMPAIGN RATINGS IS AN AUDIENCE MEASUREMENT TOOL THAT MEASURES EXACTLY WHO IS EXPOSED TO A DIGITAL CAMPAIGN BY REACH, FREQUENCY AND GRP.
SINGLE SDK TAG &
WATERMARK
COUNT & ASSIGNViews and
Demos
CALIBRATE CALCULATE Reach,
Frequency, GRP
REPORT Live+7 Schedule
WHAT IT HELPS YOU DO:UNDERSTAND ALL VIEWERSComposite and Hispanic Audiences Reported
MEASURE ADDITION TO STANDARD VIEWINGLive, Live+SD, Live+3, Live+7
SELL INVENTORY BASED ON TOTAL AUDIENCELinear Advertisements placed in front of mobile viewers
HOW IT WORKS:
NIELSEN TAG
COUNT & ASSIGNViews and Demos via Facebook
CALIBRATECross-Platform Homes Panel, Mobile Survey
CALCULATE Reach,
Frequency, GRP
REPORT Overnight
WHAT IT HELPS YOU DO:UNDERSTAND AUDIENCE DELIVERYIn-flight reach, frequency, GRP and on-target rate
MEASURE AD VIEWABILITYPartnership with Integral Ad Science
SET AUDIENCE GUARANTEESMeet realistic benchmarks
15THE MOBILE ROADMAP Copyright © 2014 The Nielsen Company
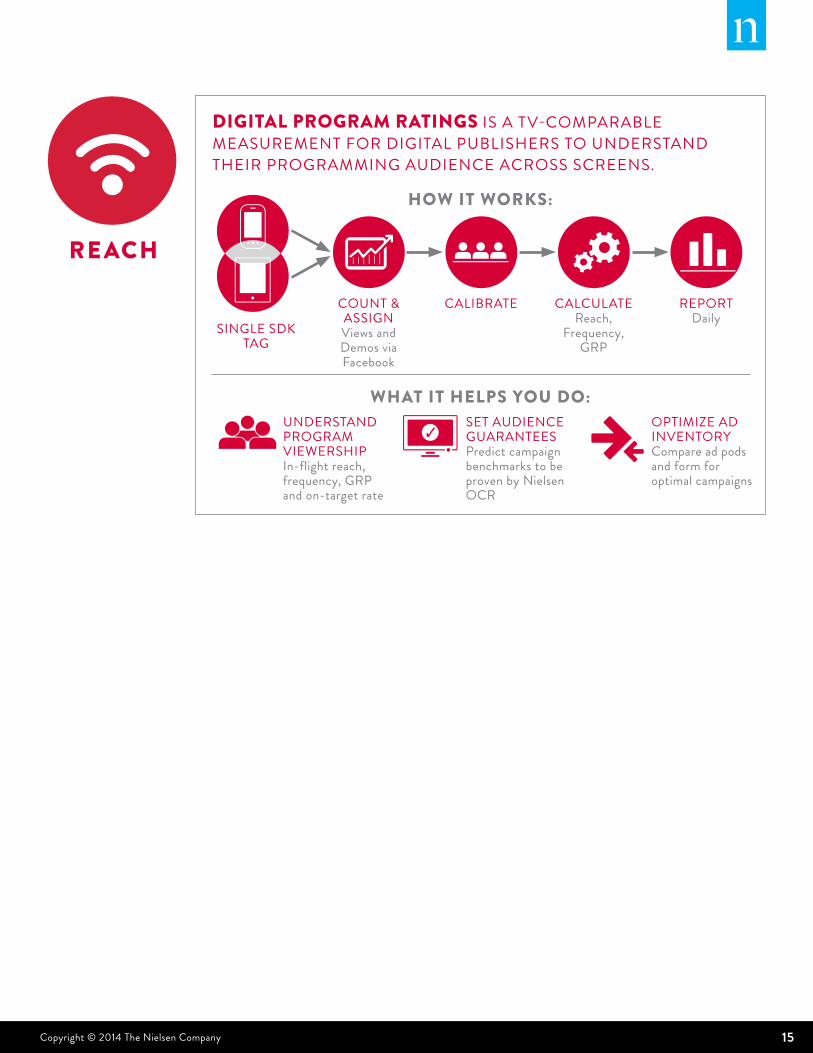
RE ACH
DIGITAL PROGRAM RATINGS IS A TV-COMPARABLE MEASUREMENT FOR DIGITAL PUBLISHERS TO UNDERSTAND THEIR PROGRAMMING AUDIENCE ACROSS SCREENS.
HOW IT WORKS:
SINGLE SDK TAG
COUNT & ASSIGNViews and Demos via Facebook
CALIBRATE CALCULATE Reach,
Frequency, GRP
REPORT Daily
WHAT IT HELPS YOU DO:UNDERSTAND PROGRAM VIEWERSHIPIn-flight reach, frequency, GRP and on-target rate
SET AUDIENCE GUARANTEESPredict campaign benchmarks to be proven by Nielsen OCR
OPTIMIZE AD INVENTORYCompare ad pods and form for optimal campaigns
16 THE MOBILE ROADMAP
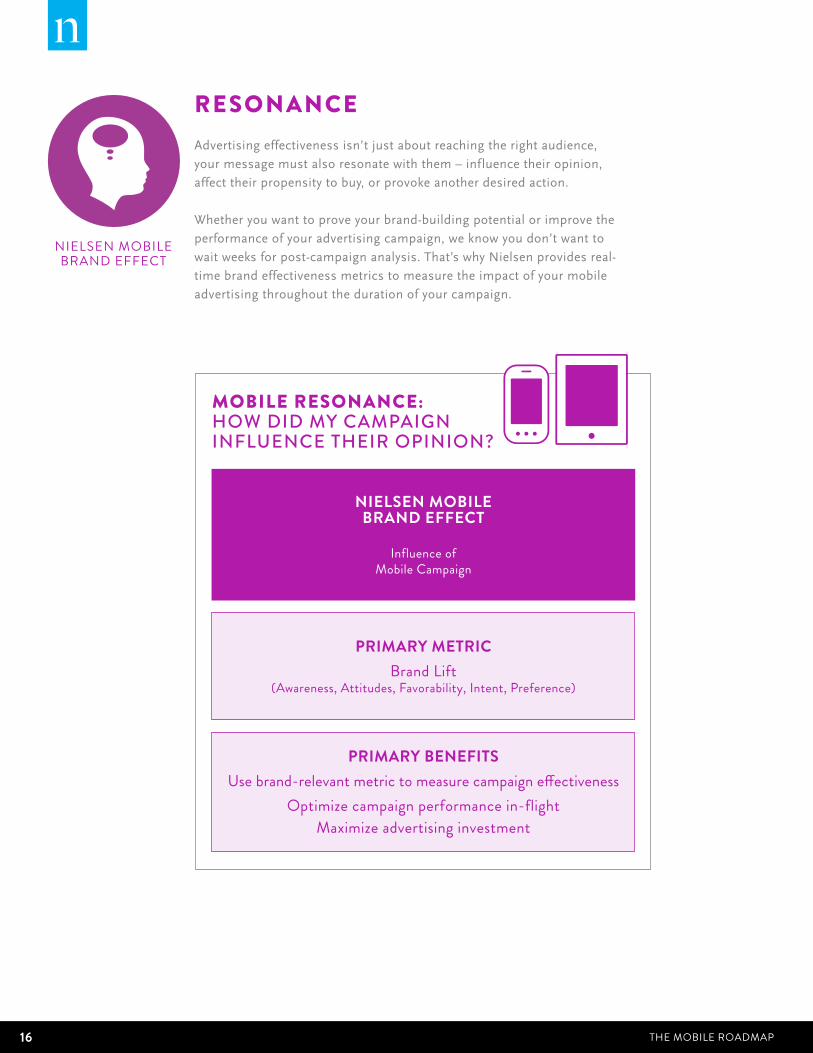
RESONANCEAdvertising effectiveness isn’t just about reaching the right audience,
your message must also resonate with them – influence their opinion,
affect their propensity to buy, or provoke another desired action.
Whether you want to prove your brand-building potential or improve the
performance of your advertising campaign, we know you don’t want to
wait weeks for post-campaign analysis. That’s why Nielsen provides real-
time brand effectiveness metrics to measure the impact of your mobile
advertising throughout the duration of your campaign.
NIELSEN MOBILE BRAND EFFECT
MOBILE RESONANCE: HOW DID MY CAMPAIGN INFLUENCE THEIR OPINION?
NIELSEN MOBILE BRAND EFFECT
Influence of Mobile Campaign
PRIMARY METRICBrand Lift
(Awareness, Attitudes, Favorability, Intent, Preference)
PRIMARY BENEFITSUse brand-relevant metric to measure campaign effectiveness
Optimize campaign performance in-flightMaximize advertising investment
17THE MOBILE ROADMAP Copyright © 2014 The Nielsen Company
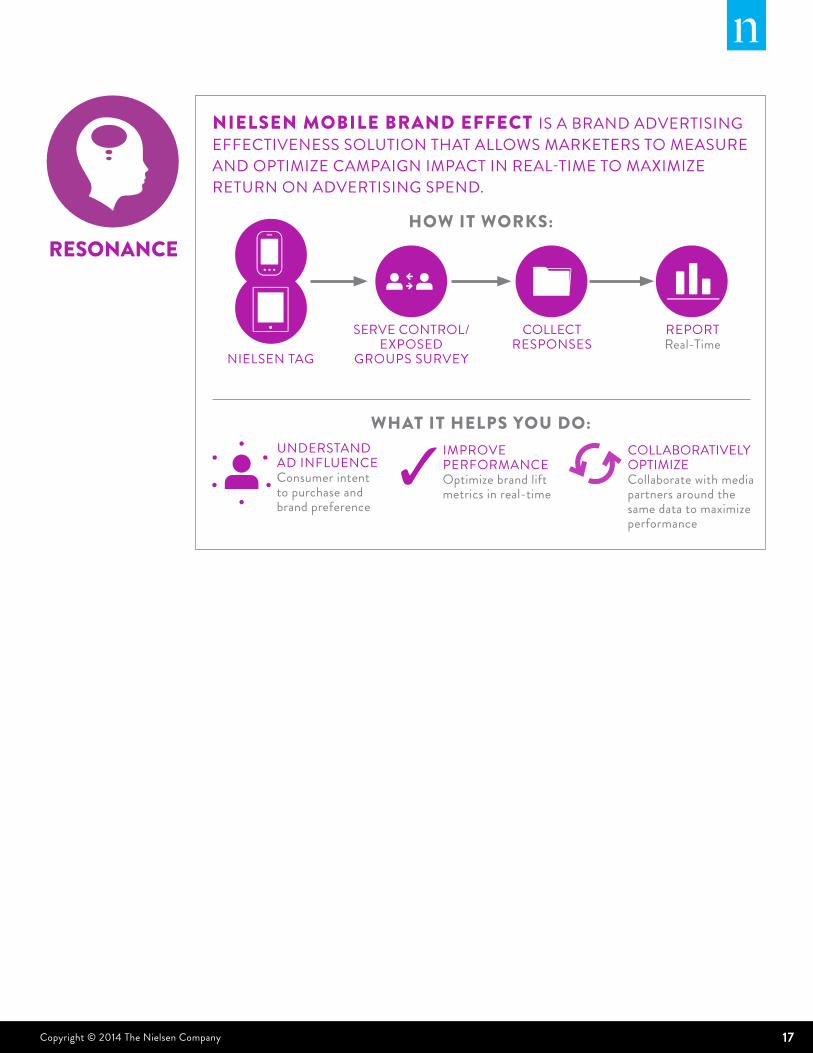
RESONANCE
NIELSEN MOBILE BRAND EFFECT IS A BRAND ADVERTISING EFFECTIVENESS SOLUTION THAT ALLOWS MARKETERS TO MEASURE AND OPTIMIZE CAMPAIGN IMPACT IN REAL-TIME TO MAXIMIZE RETURN ON ADVERTISING SPEND.
HOW IT WORKS:
NIELSEN TAG
SERVE CONTROL/EXPOSED
GROUPS SURVEY
COLLECT RESPONSES
REPORT Real-Time
WHAT IT HELPS YOU DO:IMPROVE PERFORMANCEOptimize brand lift metrics in real-time
COLLABORATIVELY OPTIMIZECollaborate with media partners around the same data to maximize performance
UNDERSTAND AD INFLUENCEConsumer intent to purchase and brand preference
18 THE MOBILE ROADMAP
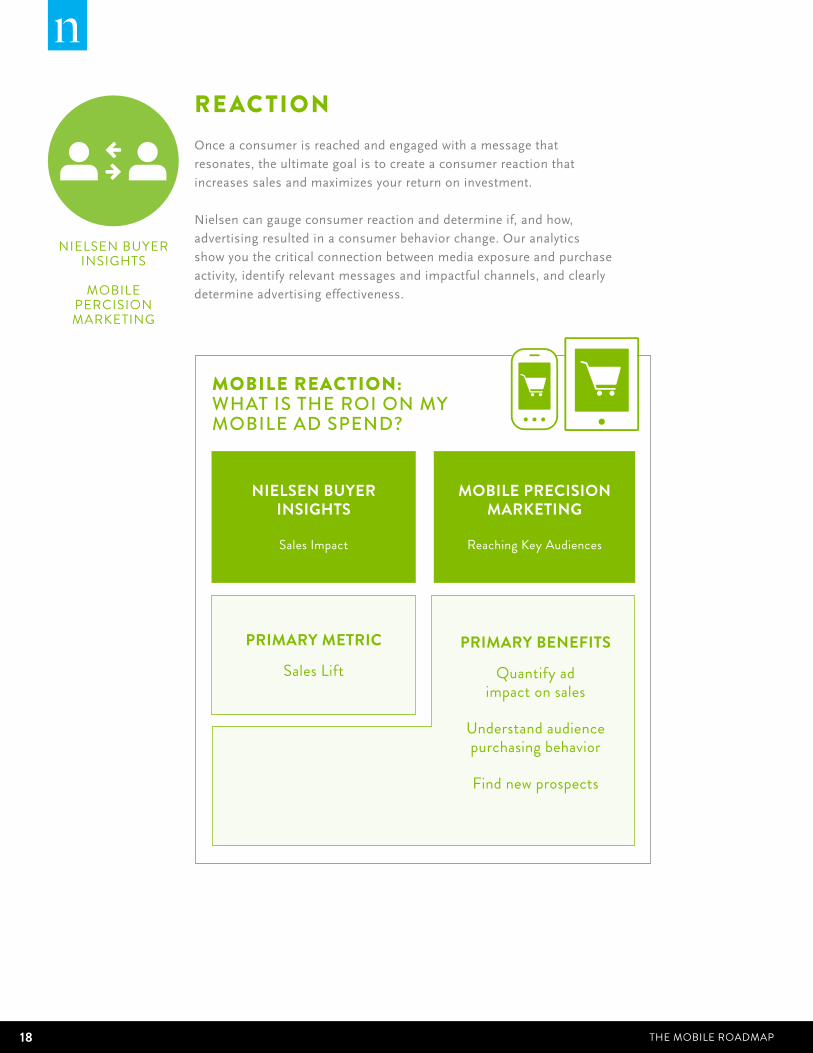
RE AC TIONOnce a consumer is reached and engaged with a message that
resonates, the ultimate goal is to create a consumer reaction that
increases sales and maximizes your return on investment.
Nielsen can gauge consumer reaction and determine if, and how,
advertising resulted in a consumer behavior change. Our analytics
show you the critical connection between media exposure and purchase
activity, identify relevant messages and impactful channels, and clearly
determine advertising effectiveness.
NIELSEN BUYER INSIGHTS
MOBILE PERCISION MARKETING
MOBILE REACTION: WHAT IS THE ROI ON MY MOBILE AD SPEND?
NIELSEN BUYER INSIGHTS
Sales Impact
MOBILE PRECISION MARKETING
Reaching Key Audiences
PRIMARY METRIC
Sales Lift
PRIMARY BENEFITS
Quantify ad impact on sales
Understand audience purchasing behavior
Find new prospects
19THE MOBILE ROADMAP Copyright © 2014 The Nielsen Company
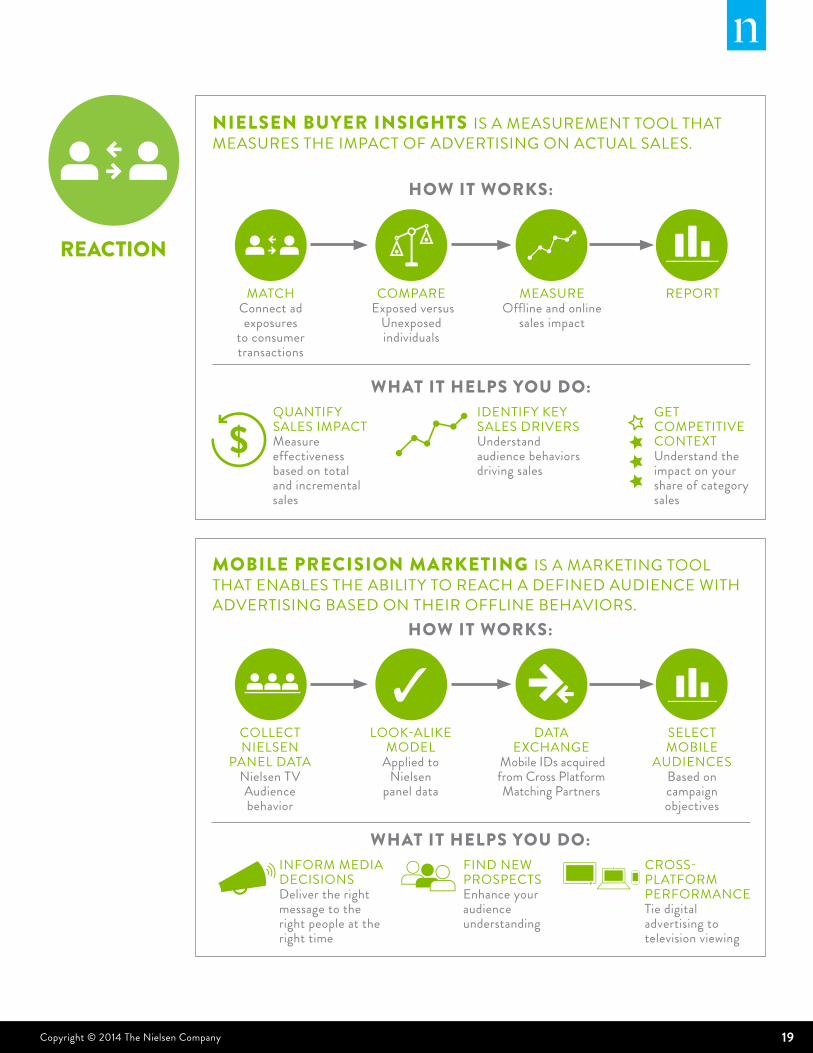
REACTION
COLLECT NIELSEN
PANEL DATANielsen TV Audience behavior
LOOK-ALIKE MODEL
Applied to Nielsen
panel data
DATA EXCHANGE
Mobile IDs acquired from Cross Platform Matching Partners
SELECT MOBILE
AUDIENCESBased on campaign objectives
NIELSEN BUYER INSIGHTS IS A MEASUREMENT TOOL THAT MEASURES THE IMPACT OF ADVERTISING ON ACTUAL SALES.
HOW IT WORKS:
MOBILE PRECISION MARKETING IS A MARKETING TOOL THAT ENABLES THE ABILITY TO REACH A DEFINED AUDIENCE WITH ADVERTISING BASED ON THEIR OFFLINE BEHAVIORS.
MATCH Connect ad exposures
to consumer transactions
COMPARE Exposed versus
Unexposed individuals
MEASURE Offline and online
sales impact
REPORT
WHAT IT HELPS YOU DO:QUANTIFY SALES IMPACTMeasure effectiveness based on total and incremental sales
IDENTIFY KEY SALES DRIVERSUnderstand audience behaviors driving sales
GET COMPETITIVE CONTEXTUnderstand the impact on your share of category sales
HOW IT WORKS:
WHAT IT HELPS YOU DO:INFORM MEDIA DECISIONSDeliver the right message to the right people at the right time
FIND NEW PROSPECTSEnhance your audience understanding
CROSS-PLATFORM PERFORMANCETie digital advertising to television viewing
20 THE MOBILE ROADMAP
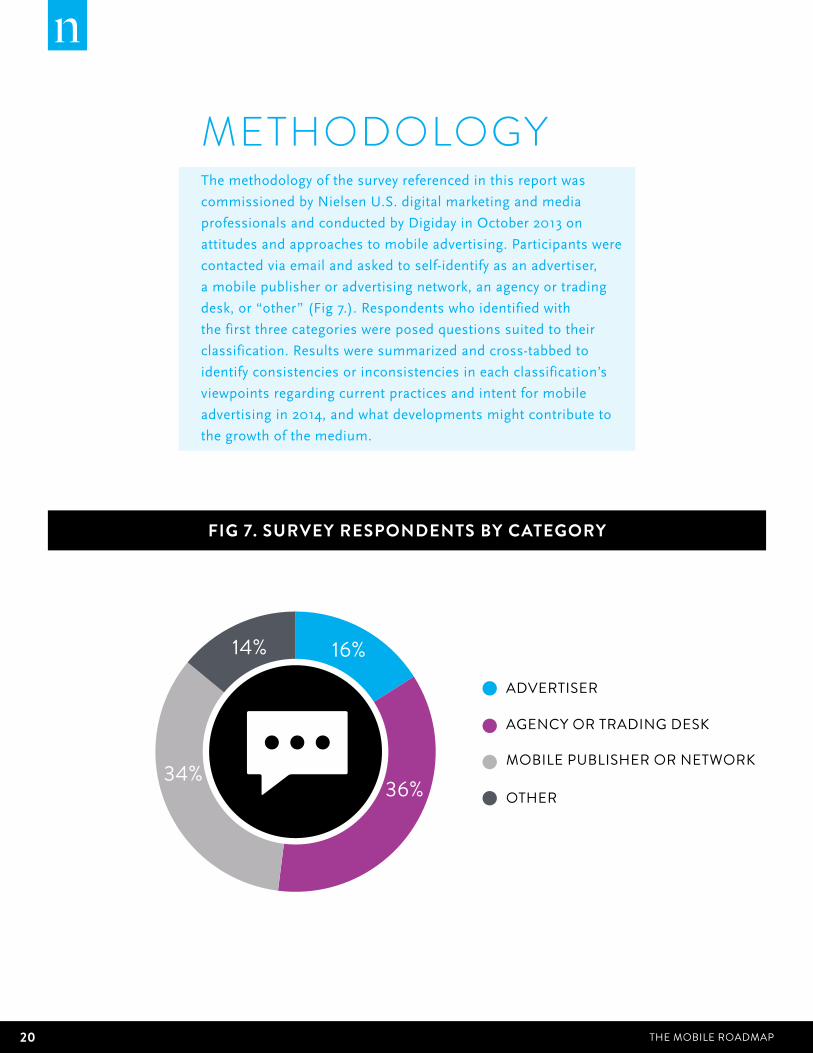
METHODOLOGYThe methodology of the survey referenced in this report was
commissioned by Nielsen U.S. digital marketing and media
professionals and conducted by Digiday in October 2013 on
attitudes and approaches to mobile advertising. Participants were
contacted via email and asked to self-identify as an advertiser,
a mobile publisher or advertising network, an agency or trading
desk, or “other” (Fig 7.). Respondents who identified with
the first three categories were posed questions suited to their
classification. Results were summarized and cross-tabbed to
identify consistencies or inconsistencies in each classification’s
viewpoints regarding current practices and intent for mobile
advertising in 2014, and what developments might contribute to
the growth of the medium.
FIG 7. SURVEY RESPONDENTS BY CATEGORY
16%14%
ADVERTISER
AGENCY OR TRADING DESK
MOBILE PUBLISHER OR NETWORK
OTHER36%34%
21THE MOBILE ROADMAP Copyright © 2014 The Nielsen Company
ABOUT NIELSEN Nielsen Holdings N.V. (NYSE: NLSN) is a global information and
measurement company with leading market positions in marketing
and consumer information, television and other media measurement,
online intelligence and mobile measurement. Nielsen has a presence in
approximately 100 countries, with headquarters in New York, USA and
Diemen, the Netherlands.
For more information about the various Nielsen services and solutions
highlighted in this report, please contact Darren Ellis at
Need more information about mobile? Visit our website,
www.nielsen.com, today.
Copyright © 2014 The Nielsen Company. All rights reserved. Nielsen and the Nielsen logo are trademarks or registered trademarks of CZT/ACN Trademarks, L.L.C. Other product and service names are trademarks or registered trademarks of their respective companies. 14/7479

22 THE MOBILE ROADMAP