NIELSEN MUSIC U.S. MUSIC 360how they engage with music with the industry’s leading study of music...
12
U.S. MUSIC 360 2017 REPORT HIGHLIGHTS NIELSEN MUSIC
Transcript of NIELSEN MUSIC U.S. MUSIC 360how they engage with music with the industry’s leading study of music...

1
U.S. MUSIC 3602017 REPORT HIGHLIGHTS
NIELSEN MUSIC

2
INTRODUCTIONThis year’s Music 360 survey reflects the continuing changing nature of the music industry and listener habits.
Technology, of course, has been driving these changes for some time but one of the major themes we see emerging from this year’s study is how this is changing the ways listeners are crafting and shaping their own music experiences. Listening to music seems to be more of an individual experience than ever before, through playlist curation, choice of device and management of what is shared across personal social media channels. We see major opportunities for brands to be part of this exciting, shifting dynamic.
As the industry’s most trusted source for music consumer insights, we’re proud to share highlights from our latest annual Music 360 report, examining curation, streaming and exclusive content, the impact of technology, the continuing success story of radio and the influence of social media.
To access the full report with expanded insights, please reach out to me at [email protected].
I’d also be happy to take you through Nielsen Music’s suite of data-driven solutions, which can help optimize your business by enhancing fan engagement, maximizing music consumption, building brand partnership opportunities for artists and valuing the impact of live music events. We hope you enjoy these highlights, and I look forward to connecting with you soon.
Erin Crawford SVP Nielsen Entertainment, General Manager Nielsen Music

Copyright © 2017 The Nielsen Company 3
NOW IN ITS SIXTH YEAR,
THIS REPORT IS A COMPREHENSIVE,
IN-DEPTH STUDY OF CONSUMER
INTERACTION WITH MUSIC IN
THE UNITED STATES – WHO MUSIC
FANS ARE, AND THE BRANDS,
DEVICES AND SERVICES THEY LOVE.
THE FOLLOWING PAGES OFFER
A SNAPSHOT OF THE NIELSEN MUSIC
360 REPORT, HIGHLIGHTING
THE U.S. MUSIC LANDSCAPE IN 2017.
THIS YEAR’SHEADLINES
Get the complete
Nielsen U.S. Music 360 2017 Report
Email: [email protected]
1 | PLAYLISTING/CURATION IS ON THE RISE.
2 | MORE LISTENERS ARE DISCOVERING MUSIC.
3 | EXCLUSIVE CONTENT IS A PRIZED ASSET.
4 | AS STREAMING INCREASES, RADIO CONTINUES TO HOLD ITS OWN.
5 | TECHNOLOGY IS CHANGING MUSIC HABITS AT HOME AND IN-CAR.
6 | MAJOR BRAND OPPORTUNITIES AS SOCIAL AND STREAMING SERVICES INTERSECT.

4
Playlisting is becoming an increasingly important component of the music listening experience, with 58% of listeners creating their own playlist, and 32% sharing playlists with others. Selecting tracks and crafting playlists has become an activity in its own right. Self-curated lists top engagement time, though top song, genre/mood playlists and those created by artists and industry leaders also have a place in listeners’ repertoires of options.
Among those who stream music online, playlisting is widespread and part of a large majority (74%) of the music experience. The ability to create play-lists is regarded as important, while playlists shared by family and friends are used more often than those created by industry experts or artists.
PLAYLISTING/CURATION IS ON THE RISE
35%Use public playlists based on genres or moods
Use public playlists depending on popularity (e.g., top songs)
Use playlists shared by friends or family
Use playlists curated by industry experts or music artists
50%Self-curate playlists
58%
74%
32%SHARE PL AYLISTS WITH OTHERS (24% IN 2016)
OF LISTENERS CRE ATE THEIR OWN PL AYLIST (57% IN 2016)
OF THOSE WHO STRE AM MUSIC ONLINE PL AYLIST
• IMPORTANCE OF MUSIC CUR ATION/PL AYLISTS
• USAGE OF PL AYLISTS AMONG MUSIC STRE AMERS
• PL AYLIST CUR ATION SOURCE (SELF-CRE ATED VS. MUSIC SERVICE VS. OTHER USERS)
INVEST IN THE FULL U.S. MUSIC 360 REPORT 2017 FOR THESE INSIGHTS
OF THOSE WHO STRE AM MUSIC ONLINE:
38% 44% 48%AGREE THAT PL AYLISTS ARE AN IMPORTANT PART OF THEIR STRE AMING E XPERIENCE
LOVE CRE ATING THEIR OWN PL AYLISTS WHEN USING STRE AMING SERVICES
PREFER CUR ATING THEIR OWN PL AYLISTS TO LISTENING TO PL AYLISTS CRE ATED BY OTHERS
For the full insight, get the
Nielsen U.S. Music 360 2017 Report
Email: [email protected]
Copyright © 2017 The Nielsen Company 5
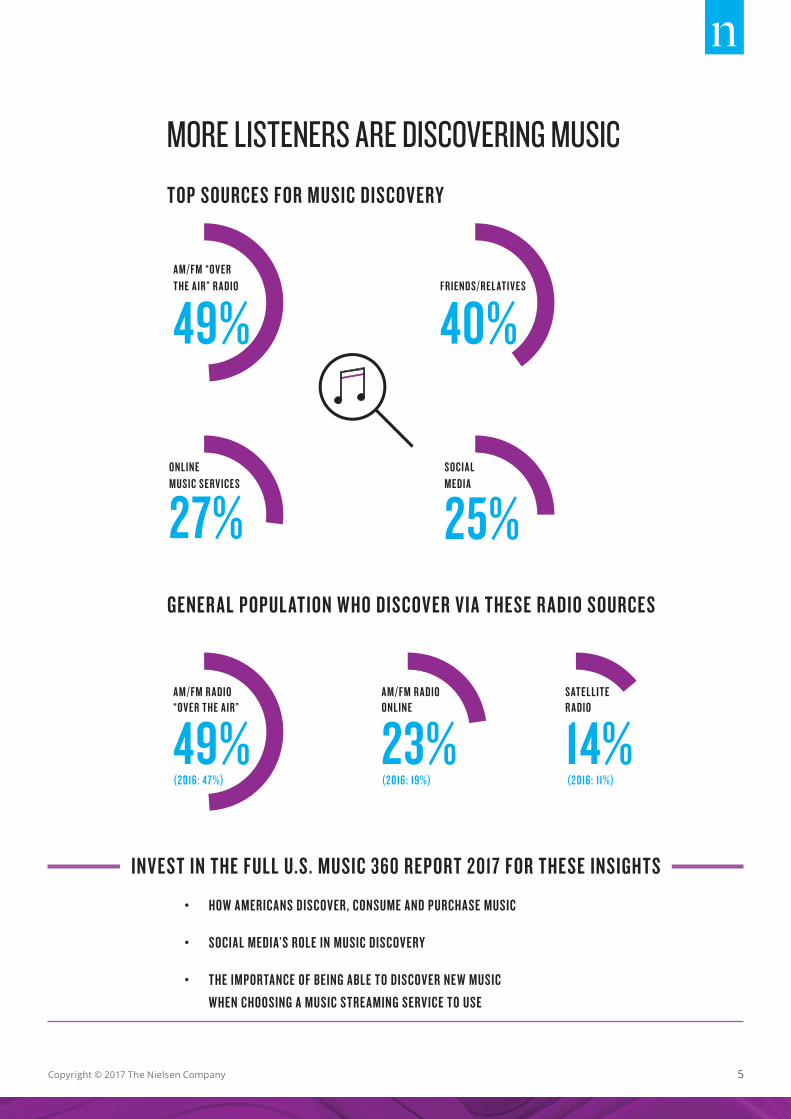
MORE LISTENERS ARE DISCOVERING MUSIC
• HOW AMERICANS DISCOVER, CONSUME AND PURCHASE MUSIC
• SOCIAL MEDIA’S ROLE IN MUSIC DISCOVERY
• THE IMPORTANCE OF BEING ABLE TO DISCOVER NE W MUSIC WHEN CHOOSING A MUSIC STRE AMING SERVICE TO USE
INVEST IN THE FULL U.S. MUSIC 360 REPORT 2017 FOR THESE INSIGHTS
TOP SOURCES FOR MUSIC DISCOVERY
49%A M/FM “OV ER THE A IR” R A DIO
40%FRIENDS/REL ATI V E S
27%ONLINE MUSIC SERV ICE S
GENER AL POPUL ATION WHO DISCOVER VIA THESE R ADIO SOURCES
23%A M/FM R A DIO ONLINE
14%SATELLITE R A DIO
49%A M/FM R A DIO “OV ER THE A IR”
(2016: 47 %) (2016: 19%) (2016: 11%)
25%SOCI A L MEDI A

6
TUNING IN: RADIO MAKES WAVESRadio continues to be the primary way listeners discover music. The raft of new technologies and devices are opening up new discovery methods, but also providing new ways for radio stations to deliver content – most notably via streaming.
EXCLUSIVE CONTENT IS A PRIZED ASSET
OF THOSE WHO DISCOVER MUSIC THROUGH ONLINE SERVICES REGARD “BEST E XCLUSIVE CONTENT” AS ONE OF THE TOP 5 MOST IMPORTANT FACTORS IN THE SELECTION OF SERVICE.18%
OF MUSIC LISTENERS SAY THAT ONE OF THE THINGS THE Y LIKE MOST ABOUT LISTENING TO TR ADITIONAL R ADIO – AND THAT ADD TO THE ENJOYMENT OF THE MUSIC – ARE THE DJS.37%
72%OF ONLINE MUSIC STRE AMERS LISTEN TO SOME FORM OF R ADIO
• THE ROLE OF R ADIO IN MUSIC ENGAGEMENT
• A LOOK AT AM/FM “OVER THE AIR”, AM/FM ONLINE STRE AMING, AND SATELLITE R ADIOS’ UNIQUE AUDIENCES
• THE INTERSECTION BE T WEEN R ADIO AND ONLINE STRE AMING AMONG MUSIC LISTENERS
INVEST IN THE FULL U.S. MUSIC 360 REPORT 2017 FOR THESE INSIGHTS

Copyright © 2017 The Nielsen Company 7
New technologies and the latest devices are enabling listeners to seamlessly engage with music anywhere, any time. Smartphones, laptops and tablets still top the list for music engagement at home, and radio still dominates in-car, but new technology is becoming more and more relevant.
Music listeners use an average of 3.4 devices weekly to engage with music (teens and Millennials average 3.8). Those currently paying for services to stream music use an average of 4.7, while weekly AM/FM radio streamers use 5.5 on average.
TECHNOLOGY IS CHANGING LISTENING HABITS
HOW AND WHERE MUSIC LISTENERS LISTEN (WEEKLY BASIS; SELECTED)
3.4DE VICES ARE USED BY MUSIC LISTENERS WEEKLY TO ENGAGE WITH MUSIC
29% IN-CAR
44% AT HOME
(including new methods of listening such as Smart TV, Internet-to-TV streaming and voice-controlled devices)
(including the likes of AM/FM radio - 72% - as well as connected devices, using a data plan on a connected device to access music through an online platform, and in-car Wifi.)
• ROLE OF NE W TECHNOLOGY IN MUSIC LISTENING
• MOST POPUL AR DE VICES FOR MUSIC
• TECHNOLOGY FOR PERSONALIZING MUSIC AT-HOME, IN-CAR, AND ON-THE-GO
INVEST IN THE FULL U.S. MUSIC 360 REPORT 2017 FOR THESE INSIGHTS

8
As with other forms of entertainment, social media has become an integral part of the music experience, an outlet for listeners and fans to discover new songs and artists, forge direct connections with artists, and a place to share and chat with other like-minded individuals. This is set to continue as streaming services and social platforms continue to explore ways to futher integrate.
SOCIAL AND STREAMING SERVICES ARE INTERSECTING
55%OF ALL MUSIC LISTENERS USE SOCIAL MEDIA TO FOLLOW OR STAY INFORMED ABOUT MUSICIANS THE Y LIKE.
T YPE OF SOCIAL MEDIA CONTENT MUSIC FANS ARE LOOKING FOR (SELECTED)
1 2 3 UPCOMING ALBUM NE WS
54%
UPCOMING TOUR NE WS/DATES
50%
BEHIND THE SCENES OF AN ARTIST’S LIFE
48%
• SOCIAL MEDIA USAGE FOR MUSIC ACTIVITIES
• MUSIC ARTIST FOLLOWING AND IMPACT
• WHAT MUSIC LISTENERS WANT VS. E XPECT TO FIND ON SOCIAL MEDIA
INVEST IN THE FULL U.S. MUSIC 360 REPORT 2017 FOR THESE INSIGHTS

Copyright © 2017 The Nielsen Company 9
49%
% OF GENER AL POPUL ATION THAT WOULD VIE W A BR AND MORE FAVOR ABLY IF THE Y…
For brands, as well as artists and bands, live music events – concerts, tours and festivals – continue to be essential elements in reaching fans. For any sponsor or endorser, brand favorability tends to be an important metric in determining the success of an investment. Understanding what moves the needle for music fans and attendees is key to any successful activation or campaign.
BRAND ENGAGEMENT AT LIVE EVENTS
OFFERED FREE GIVE AWAYS (SUNGL ASSES, T-SHIRTS, E TC.) AT A MUSIC FESTIVAL:
IF A BR AND OFFERED THIS, WHAT ACTIONS WOULD YOU BE LIKELY TO TAKE?
47% 46% 44%OFFERED FREEBIES THAT ME T PR ACTICAL NEEDS (E.G., WATER, SUNBLOCK) AT A LIVE E VENT
OFFERED FREE ACCESS TO MUSIC (E.G., A SUBSCRIP TION TO A STRE AMING SERVICE, CD OR VINYL)
PUT UP AN AIR-CONDITIONED TENT AT A MUSIC FESTIVAL
24% Find out more information about the brand
15% Buy products or services from brand
13% 12%
5%
For the full insight, get the
Nielsen U.S. Music 360 2017 Report
Email: [email protected] ?
• SOURCE OF LIVE MUSIC AWARENESS AND MOST POPUL AR LIVE MUSIC E VENTS
• BR AND ACTIVATIONS THAT WILL DRIVE MOST FAVOR ABILIT Y AND ACTION
• BR AND OPPORTUNITIES FOR THE MUSIC PARTNERSHIPS
INVEST IN THE FULL U.S. MUSIC 360 REPORT 2017 FOR THESE INSIGHTS
10
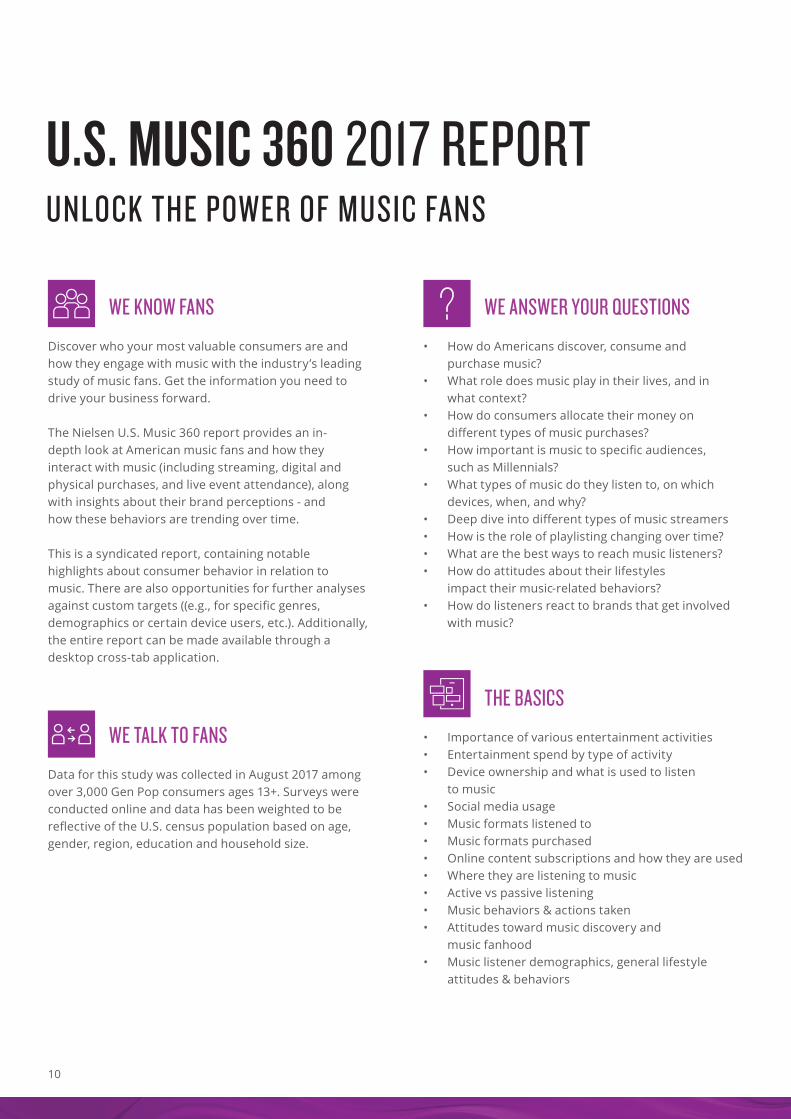
WE KNOW FANS
Discover who your most valuable consumers are and how they engage with music with the industry’s leading study of music fans. Get the information you need to drive your business forward.
The Nielsen U.S. Music 360 report provides an in- depth look at American music fans and how they interact with music (including streaming, digital and physical purchases, and live event attendance), along with insights about their brand perceptions - and how these behaviors are trending over time.
This is a syndicated report, containing notable highlights about consumer behavior in relation to music. There are also opportunities for further analyses against custom targets ((e.g., for specific genres, demographics or certain device users, etc.). Additionally, the entire report can be made available through a desktop cross-tab application.
WE TALK TO FANS
Data for this study was collected in August 2017 among over 3,000 Gen Pop consumers ages 13+. Surveys were conducted online and data has been weighted to be reflective of the U.S. census population based on age, gender, region, education and household size.
WE ANSWER YOUR QUESTIONS
• How do Americans discover, consume and purchase music?
• What role does music play in their lives, and in what context?
• How do consumers allocate their money on different types of music purchases?
• How important is music to specific audiences, such as Millennials?
• What types of music do they listen to, on which devices, when, and why?
• Deep dive into different types of music streamers• How is the role of playlisting changing over time?• What are the best ways to reach music listeners?• How do attitudes about their lifestyles
impact their music-related behaviors?• How do listeners react to brands that get involved
with music?
THE BASICS
• Importance of various entertainment activities• Entertainment spend by type of activity• Device ownership and what is used to listen
to music• Social media usage• Music formats listened to• Music formats purchased• Online content subscriptions and how they are used• Where they are listening to music• Active vs passive listening• Music behaviors & actions taken• Attitudes toward music discovery and
music fanhood• Music listener demographics, general lifestyle
attitudes & behaviors
U.S. MUSIC 360 2017 REPORTUNLOCK THE POWER OF MUSIC FANS

Copyright © 2017 The Nielsen Company 11
ONLINE MUSIC SERVICES
• Awareness, opinion, favorability toward online music services
• Usage of online music services, including types of services (free, trial, pay)
• Willingness to pay• Attitudes toward ads• Duration of service usage• Importance of music curation/playlists• Usage of playlists • Playlist curation source (self-created vs.
music service vs. other users)
ARTISTS & GENRES
• How listeners discover new artists/songs• Following artists, including social behavior• How listeners information on artists/live events
and what types of information• Genres listened to
LIVE MUSIC & BRANDS
• Music events attended• Where tickets purchased• Source of awareness• Smartphone and social media behaviors at
music events• Music festival awareness, attendance, interest/
intent and social following• Brand engagement favorability• Participation/importance of music festival activities
AUDIENCE INSIGHTS
• Teens• Millennials• Hispanics• Music streaming subscribers: current, paid, free,
lapsed• Radio listeners• Paid streamers• Social media users at platform level
ADDITIONAL TOPICS
• Number of hours spent with music as primary vs. background activity
• Windowing and actions taken if song not available• Heavy vs. light social users• Music award shows watched
(AVAILABLE UPON REQUEST)
Get the complete Nielsen U.S. Music 360 2017 Report
Email: [email protected]
Note: Reflects preliminary content summary; final content is at sole discretion of the Nielsen Company and may change without notice

ABOUT NIELSEN
Nielsen Holdings plc (NYSE: NLSN) is a global performance management company that provides a comprehensive understanding of what consumers watch and buy. Nielsen’s Watch segment provides media and advertising clients with Nielsen Total Audience measurement services for all devices on which content — video, audio and text — is consumed. The Buy segment offers consumer packaged goods manufacturers and retailers the industry’s only global view of retail performance measurement. By integrating information from its Watch and Buy segments and other data sources, Nielsen also provides its clients with analytics that help improve performance. Nielsen, an S&P 500 company, has operations in over 100 countries, covering more than 90% of the world’s population. For more information, visit www.nielsen.com. Photography: Front-Cover: Istock/shironosov; Page 3: Istock/Geber86; Page 6: Istock/Davizro


![Los Angeles Update on U.S. Hispanic Radio & Digital [July 2014 - Nielsen]](https://static.fdocuments.in/doc/165x107/557317d3d8b42aae7b8b45a6/los-angeles-update-on-us-hispanic-radio-digital-july-2014-nielsen.jpg)


![U.S. Hispanics Ahead of Digital Curve - Nielsen Consumer Report [Feb 2014]](https://static.fdocuments.in/doc/165x107/547bdde5b379596a2b8b4eac/us-hispanics-ahead-of-digital-curve-nielsen-consumer-report-feb-2014.jpg)