Nielsen Lab - Åbo Akademi Universityweb.abo.fi/projekt/poke/Saarenmaa/Nielsen Lab Larsson.pdf ·...
42
Nielsen Lab Systems and Synthetic Biology Chalmers University of Technology Sweden
-
Upload
nguyenphuc -
Category
Documents
-
view
225 -
download
0
Transcript of Nielsen Lab - Åbo Akademi Universityweb.abo.fi/projekt/poke/Saarenmaa/Nielsen Lab Larsson.pdf ·...
Nielsen Lab Systems and Synthetic Biology
Chalmers University of Technology
Sweden

Systems and Synthetic Biology
Professor Jens Nielsen
Group Leader
Professor Ivan Mijakovic Professor Christer Larsson Docent Dina Petranovic Assistant Prof. Sergio Bordel
Assistant Prof. Intawat Nookaew
19 Post Docs
25 PhD students
5 Visiting PhD students
8 MSc students
7 Research Engineers/Technicians
2 Admin
2

Nielsen Lab Organization
Sys2Bio
Dry lab
Systems medicine
Human metabolism-
related diseases
Gut microbiota metabolism-
related diseases
In silico Metabolic
Engineering
Wet lab
Yeast Systems Biology
In vivo Metabolic
Engineering #1
Biochemicals
Biofuels
Proteins
In vivo Metabolic
Engineering #2
3
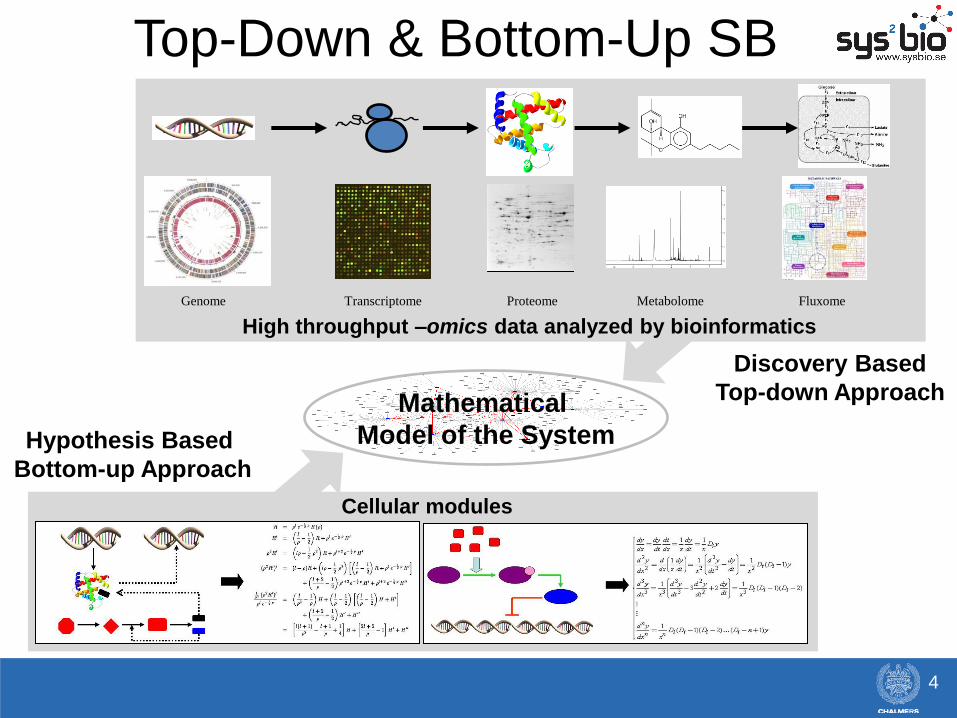
High throughput –omics data analyzed by bioinformatics
Cellular modules
Hypothesis Based
Bottom-up Approach
Discovery Based
Top-down Approach Mathematical
Model of the System
Genome Transcriptome Proteome Metabolome Fluxome
Top-Down & Bottom-Up SB
4

A
B
C
D
E1
E2
E3
E4
P2
P3
P1
P5
P4
Gene Reaction
Enzyme Protein
ATP ADP
NAD+ NADH
Genome Scale
Metabolic Model
Network
Dependent
Analysis
Model
Simulations
Independent Analysis Network Dependent Analysis
Co-regulated
Subnetwork
Identified
Genome-Scale Metabolic Models Genome-scale metabolic models (GEMs) provide gene-protein-reaction
connections and hereby allow for context dependent analysis
PNAS (2005) 102:2685-2689; Mol. Sys. Biol. (2006) 2:50
Curr. Op. Microbiol. (2010) 13:255-262; J. Int. Med. 271:142-154 5
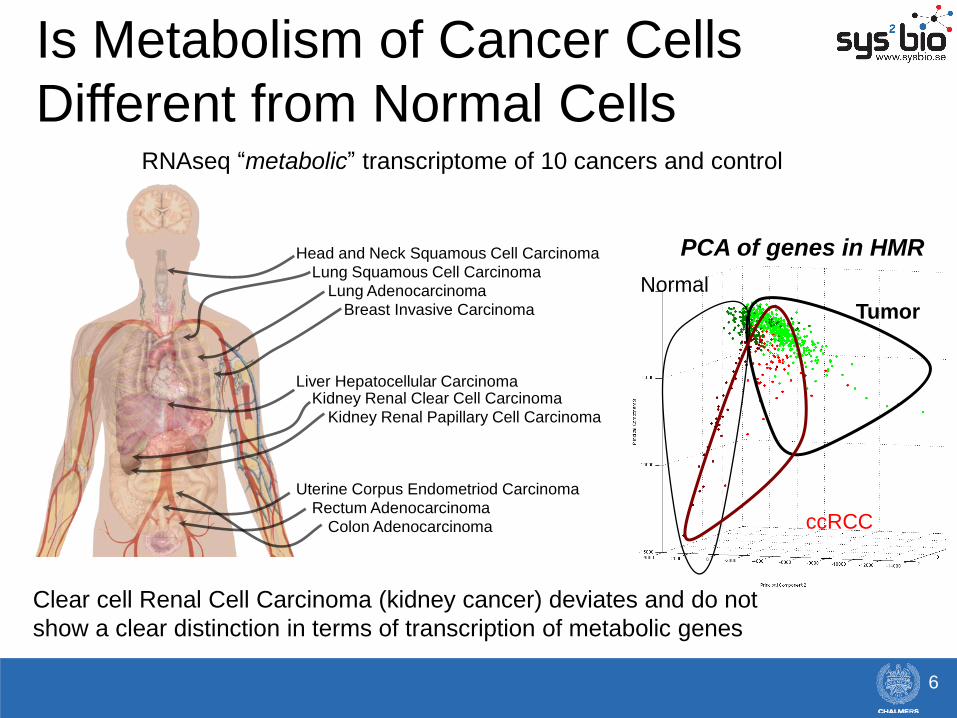
Head and Neck Squamous Cell Carcinoma
Lung Squamous Cell Carcinoma
Lung Adenocarcinoma
Breast Invasive Carcinoma
Liver Hepatocellular Carcinoma Kidney Renal Clear Cell Carcinoma
Kidney Renal Papillary Cell Carcinoma
Uterine Corpus Endometriod Carcinoma
Rectum Adenocarcinoma
Colon Adenocarcinoma
RNAseq “metabolic” transcriptome of 10 cancers and control
Normal
Tumor
ccRCC
Is Metabolism of Cancer Cells
Different from Normal Cells
Clear cell Renal Cell Carcinoma (kidney cancer) deviates and do not
show a clear distinction in terms of transcription of metabolic genes
PCA of genes in HMR
6
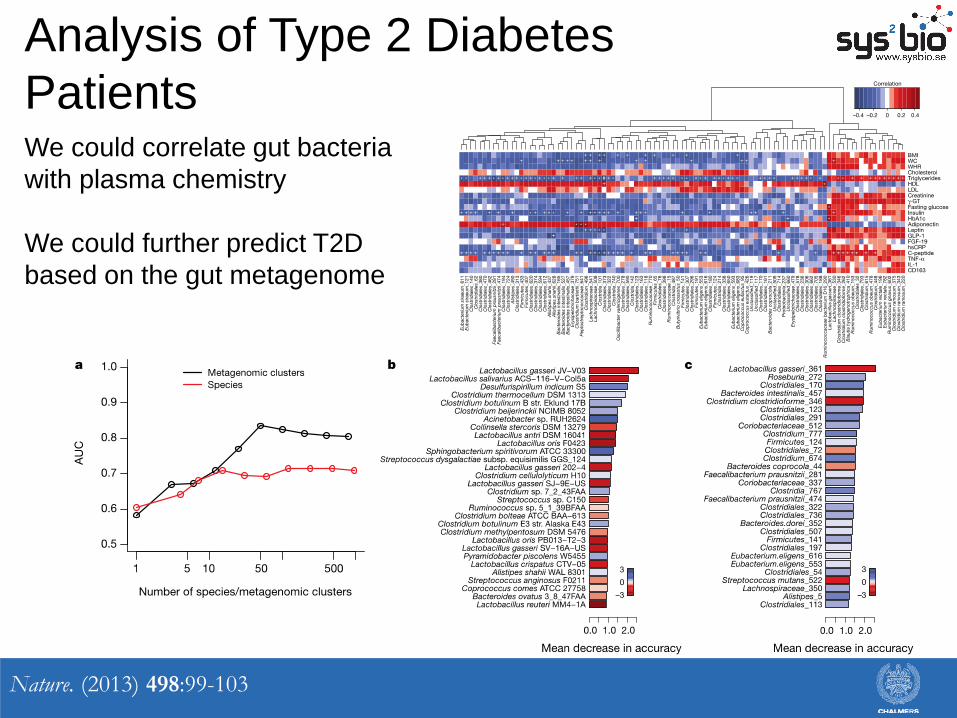
Analysis of Type 2 Diabetes
Patients
Nature. (2013) 498:99-103
We could correlate gut bacteria
with plasma chemistry
We could further predict T2D
based on the gut metagenome
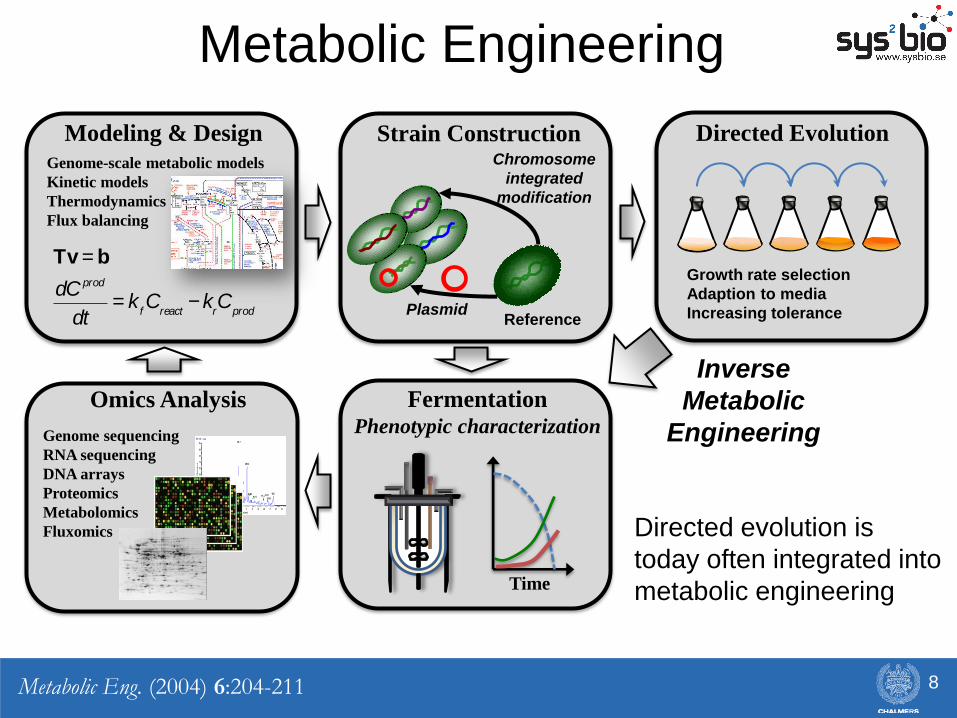
Modeling & Design Strain Construction
Fermentation Phenotypic characterization
Omics Analysis
Reference Plasmid
Chromosome
integrated
modification
Tv = b
dC prod
dt= k
fC
react- k
rC
prod
Genome sequencing
RNA sequencing
DNA arrays
Proteomics
Metabolomics
Fluxomics
Genome-scale metabolic models
Kinetic models
Thermodynamics
Flux balancing
Time
Metabolic Engineering
8
Directed Evolution
Growth rate selection
Adaption to media
Increasing tolerance
Inverse
Metabolic
Engineering
Directed evolution is
today often integrated into
metabolic engineering
Metabolic Eng. (2004) 6:204-211

• Extremely well-characterized
• Many online databases with information on
genome, as well as different omics data
• Genetically tractable
• GRAS (Generally Regarded as Safe)
• Robust industrial organism
Many advantages:
Bioethanol
Baker’s yeast
Wine & Beer
Resveratrol
Insulin precursors
Vaccines (HPV, Hepatatis)
A widely used cell factory Ongoing developments of novel cell
factories:
Fuels (butanol, biodiesel)
Commodity chemicals (malate,
succinate, 3-OH propionic acid)
Fine chemicals (isoprenoids)
Food ingredients (PUFAs)
Protein drugs
Yeast as a Platform Cell Factory
FEMS Yeast Research (2008) 8:122-131
FEMS Yeast Research (2012) 12:228-248 9
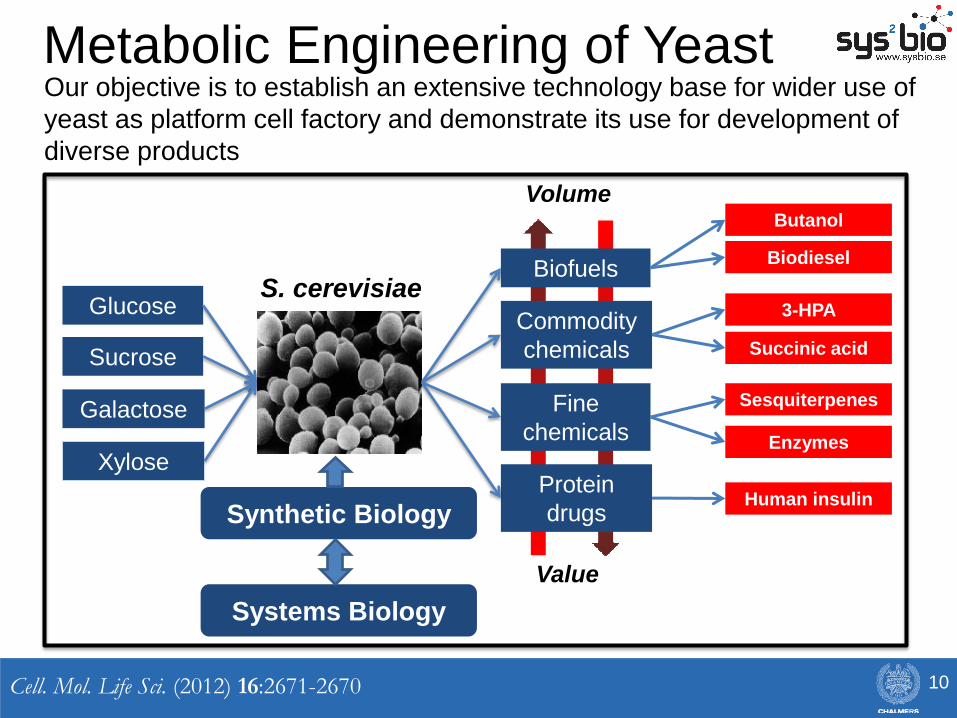
Glucose
Sucrose
Galactose
Xylose
Fine
chemicals
Biofuels
Commodity
chemicals
Protein
drugs
Volume
Value
Butanol
Biodiesel
3-HPA
Succinic acid
Sesquiterpenes
Enzymes
Human insulin
S. cerevisiae
Metabolic Engineering of Yeast Our objective is to establish an extensive technology base for wider use of
yeast as platform cell factory and demonstrate its use for development of
diverse products
Synthetic Biology
Systems Biology
10 Cell. Mol. Life Sci. (2012) 16:2671-2670
Butanol production and tolerance in
Saccharomyces cerevisiae
Payam Ghiaci
Francisca Lameiras
Joakim Norbeck
Intawat Nookaew
Christer Larsson
Chalmers University of Technology, Dept Chemical and
Biological Engineering - Systems Biology, Gothenburg,
Sweden

Bio-fuels; Butanol vs Ethanol
Why butanol?
•Butanol has a higher energy content compared to ethanol • Lower water absorption and volatility compared to ethanol • Existing distribution systems can be used • Can be used in conventional engines without or with less modifications
Why yeast?
•Outstanding history of human usage and exploitation under large-scale industrial conditions •Can cope with harsh and/or nutrient poor conditions such as, e.g. Lignocellulosic substrates • Amenable to genetic manipulations
Why not butanol?
Butanol is very toxic to the producing organisms
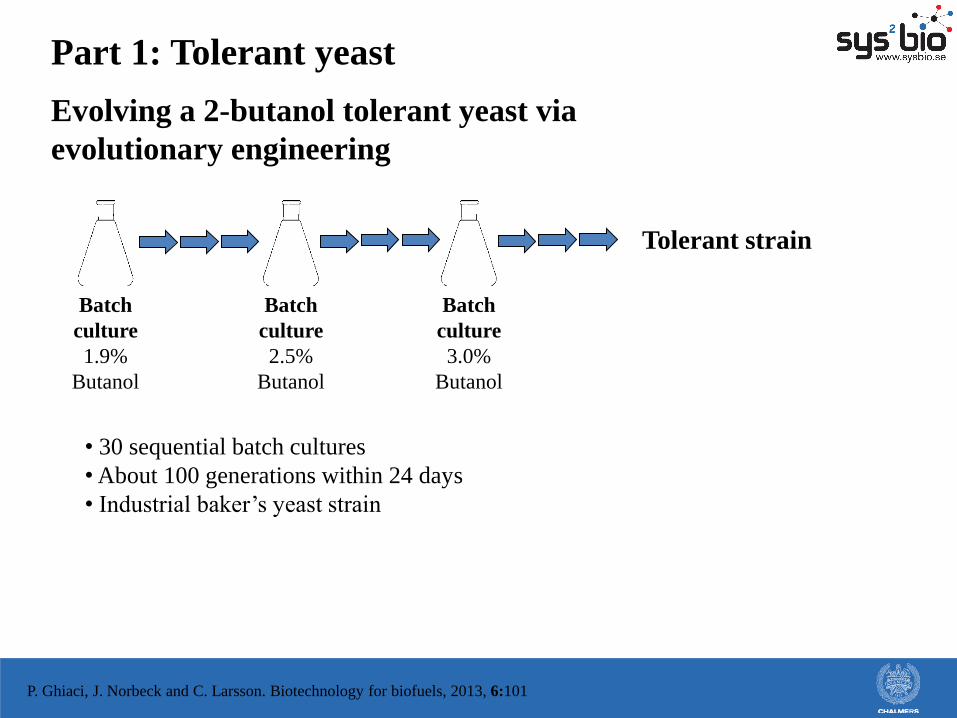
Evolving a 2-butanol tolerant yeast via
evolutionary engineering
Batch
culture
1.9%
Butanol
Batch
culture
2.5%
Butanol
Batch
culture
3.0%
Butanol
Tolerant strain
• 30 sequential batch cultures
• About 100 generations within 24 days
• Industrial baker’s yeast strain
P. Ghiaci, J. Norbeck and C. Larsson. Biotechnology for biofuels, 2013, 6:101
Part 1: Tolerant yeast
0
0,2
0,4
0,6
0,8
1
1,2
0 20 40 60O
D 6
00
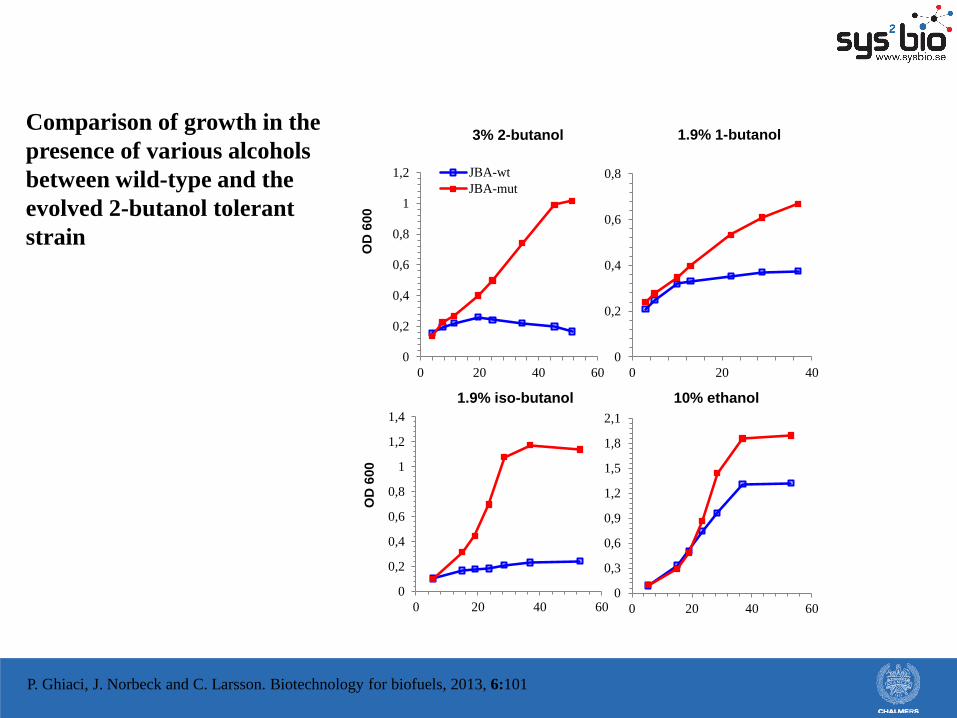
3% 2-butanol
JBA-wt
JBA-mut
0
0,2
0,4
0,6
0,8
0 20 40
1.9% 1-butanol
0
0,2
0,4
0,6
0,8
1
1,2
1,4
0 20 40 60
OD
600
1.9% iso-butanol
0
0,3
0,6
0,9
1,2
1,5
1,8
2,1
0 20 40 60
10% ethanol
Comparison of growth in the
presence of various alcohols
between wild-type and the
evolved 2-butanol tolerant
strain
P. Ghiaci, J. Norbeck and C. Larsson. Biotechnology for biofuels, 2013, 6:101

Characterization of evolved mutant; protein expression
and lipid analysis.
Growth conditions
1. Chemostat culture, D = 0.1 h-1, with 2.5% 2-butanol
2. Batch culture with 1.2% 2-butanol (µ identical between mutant and
wild-type)

Protein expression profile by MS; comparison wild-type vs evolved mutant
Gene Corresponding protein Fold change Mitochondrial
location
PIM1 Lon protease homolog 2.86 X
MAM33 Mitochondrial acidic protein MAM33 2.72 X
CYT1 Cytochrome c1, heme protein 2.09 X
GLO1 Lactoylglutathione lyase 2.01
HSP42 Heat shock protein 42 1.97 *
AIM2 Protein AIM2 1.94 X
FUN30 Uncharacterized ATP-dependent helicase FUN30 1.88 * X
HOR2 (DL)-glycerol-3-phosphatase 2 1.81 *
MCR1 NADH-cytochrome b5 reductase 2 1.80 * X
GLK1 Glucokinase-1 1.74 *
MRPL38 54S ribosomal protein L38 1.70 * X
QCR6 Cytochrome b-c1 complex subunit 6 1.67 X
EDE1 EH domain-containing and endocytosis protein 1 1.65
MSS116 ATP-dependent RNA helicase MSS116 1.65 * X
YPL088W Putative aryl-alcohol dehydrogenase YPL088W 1.64 *
ATP4 ATP synthase subunit 4 1.62 X
ATP17 ATP synthase subunit f 1.62 * X
PEP4 Saccharopepsin 1.62
LSP1 Sphingolipid long chain base-responsive protein LSP1 1.62
QCR2 Cytochrome b-c1 complex subunit 2 1.61 X
COX4 Cytochrome c oxidase subunit 4 1.59 X
ZWF1 Glucose-6-phosphate 1-dehydrogenase 1.59
ECM33 Cell wall protein ECM33 1.58
GVP36 Protein GVP36 1.57
CCP1 Cytochrome c peroxidase 1.57 X
CAR2 Ornithine aminotransferase 1.57 *
AAC2 ADP, ATP carrier protein 2 1.56 X
CYC1 Cytochrome c iso-1 1.56 * X
ATP1 ATP synthase subunit alpha 1.55 * X
ATP2 ATP synthase subunit beta 1.54 * X
CPR3 Peptidyl-prolyl cis-trans isomerase C 1.54 X
KGD1 2-oxoglutarate dehydrogenase 1.54 X
QCR7 Cytochrome b-c1 complex subunit 7 1.53 X
MRP8 Uncharacterized protein MRP8 1.51 *
• ~1100 proteins quantified (also
membrane proteins)
• Expression of ribosomal proteins was
not changed
• 34 proteins were up-regulated 1.5 fold
or more (95% significance)
• 21 of these were mitochondrial and 12
components of respiratory chain
• Glo1, Hsp42 and Gpp2 were the most
up-regulated non-mitochondrial
proteins
• 12 proteins down-regulated 1.5 times
or more (95% significance)
P. Ghiaci, J. Norbeck and C. Larsson. Biotechnology for biofuels,
2013, 6:101

Verification of protein expression data by individual overexpression of Glo1,
Hsp4, Gpp2 and Hap4
0
0,2
0,4
0,6
0,8
1
1,2
1,4
1,6
0 10 20 30 40 50
Time (h)
3% 2-butanol
wt
mut
wt+gpp2 Gpp2 overexpression improved
2-butanol tolerance
Glo1, Hsp42 and Hap4
overexpression did not improve
2-butanol tolerance
P. Ghiaci, J. Norbeck and C. Larsson. Biotechnology for biofuels, 2013, 6:101
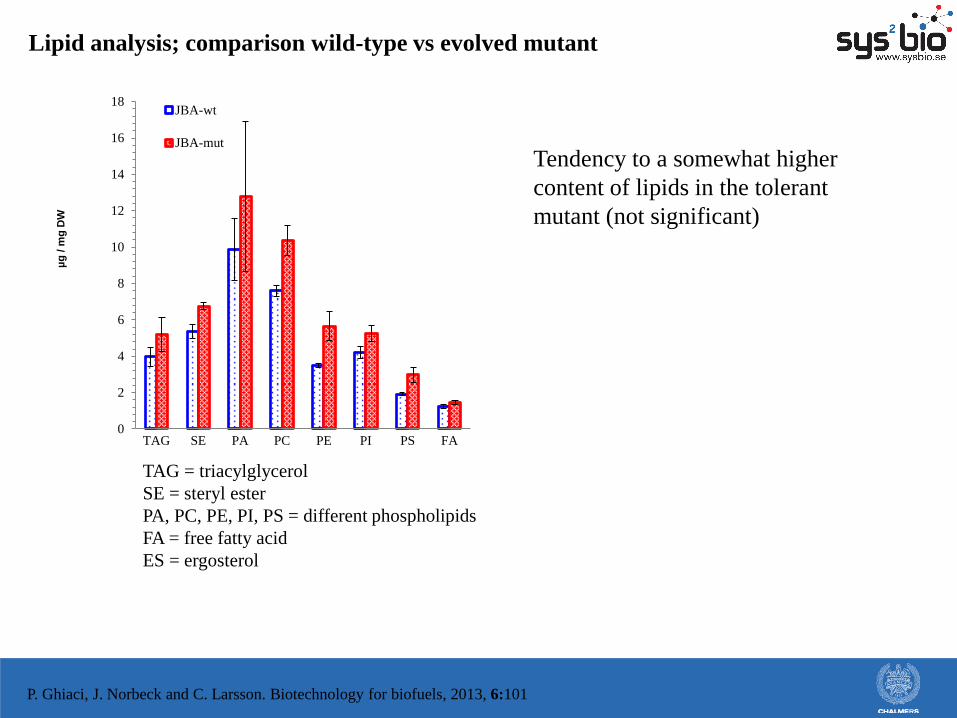
Lipid analysis; comparison wild-type vs evolved mutant
0
2
4
6
8
10
12
14
16
18
TAG SE PA PC PE PI PS FA
µg
/ m
g D
W
JBA-wt
JBA-mut
TAG = triacylglycerol
SE = steryl ester
PA, PC, PE, PI, PS = different phospholipids
FA = free fatty acid
ES = ergosterol
Tendency to a somewhat higher
content of lipids in the tolerant
mutant (not significant)
P. Ghiaci, J. Norbeck and C. Larsson. Biotechnology for biofuels, 2013, 6:101

Growth characteristics; comparison wild-type vs evolved mutant during
growth with 1.2% 2-butanol
mm
ole
Gly
cero
l
0,5
1,5
2,5
3,5
4,5
5,5
6,5
7,5
8,5
9,5
0
50
100
150
200
250
0 2 4 6 8
mm
ole
Eth
an
ol
Time (h)
EtOH wt
EtOH mut
Gly wt
Gly mut
Growth characteristics were very
similar
2-butanol tolerant mutant had a
slightly lower ethanol and higher
glycerol production consistent with
proteomics data
P. Ghiaci, J. Norbeck and C. Larsson. Biotechnology for biofuels, 2013, 6:101
Whole genome sequencing and comparison
between wild-type vs evolved mutant

No
rmal
ized
co
ver
age
(div
isio
n b
y m
edia
n-v
alue
for
chro
moso
me
II)
Position in genome
Butanol tolerance correlates with a loss of ploidy for most chromosomes. (we have sequenced with approximately 1000 reads/bp)
Plot of normalized sequence coverage (100 bp average) against position in genome.
Blue is JBA-wt and red is JBA-mut.
Chromosomes II, IX and XIII are tetraploid in both strains,
chromosome VIII is pentaploid in JBA-wt.
All other chromosomes are triploid in JBA-mut and tetraploid in JBA-wt.
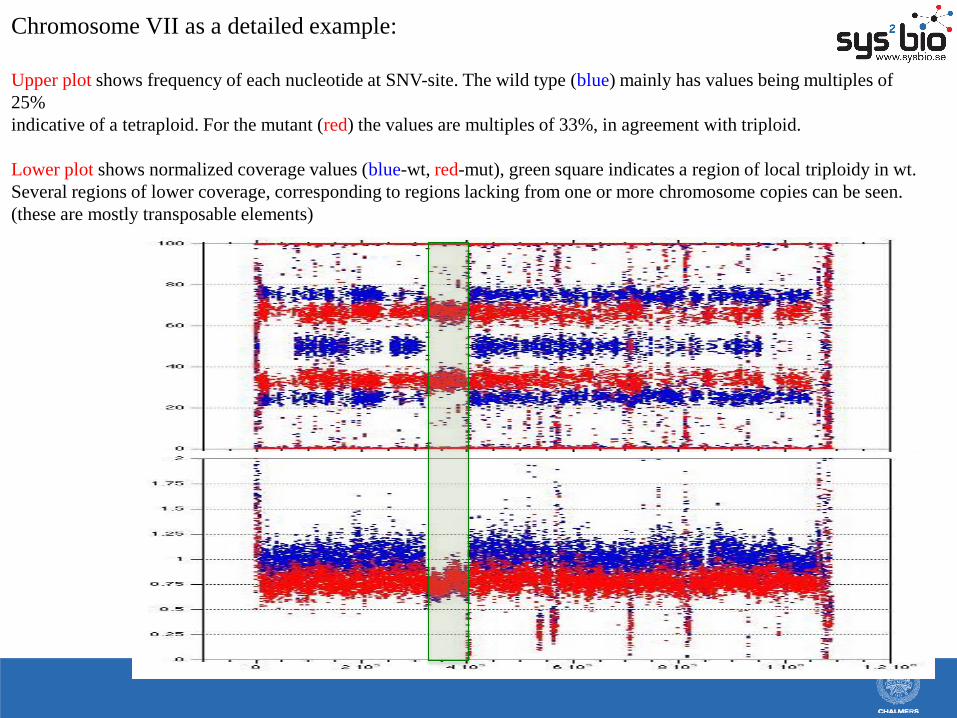
Chromosome VII as a detailed example:
Upper plot shows frequency of each nucleotide at SNV-site. The wild type (blue) mainly has values being multiples of
25%
indicative of a tetraploid. For the mutant (red) the values are multiples of 33%, in agreement with triploid.
Lower plot shows normalized coverage values (blue-wt, red-mut), green square indicates a region of local triploidy in wt.
Several regions of lower coverage, corresponding to regions lacking from one or more chromosome copies can be seen.
(these are mostly transposable elements)
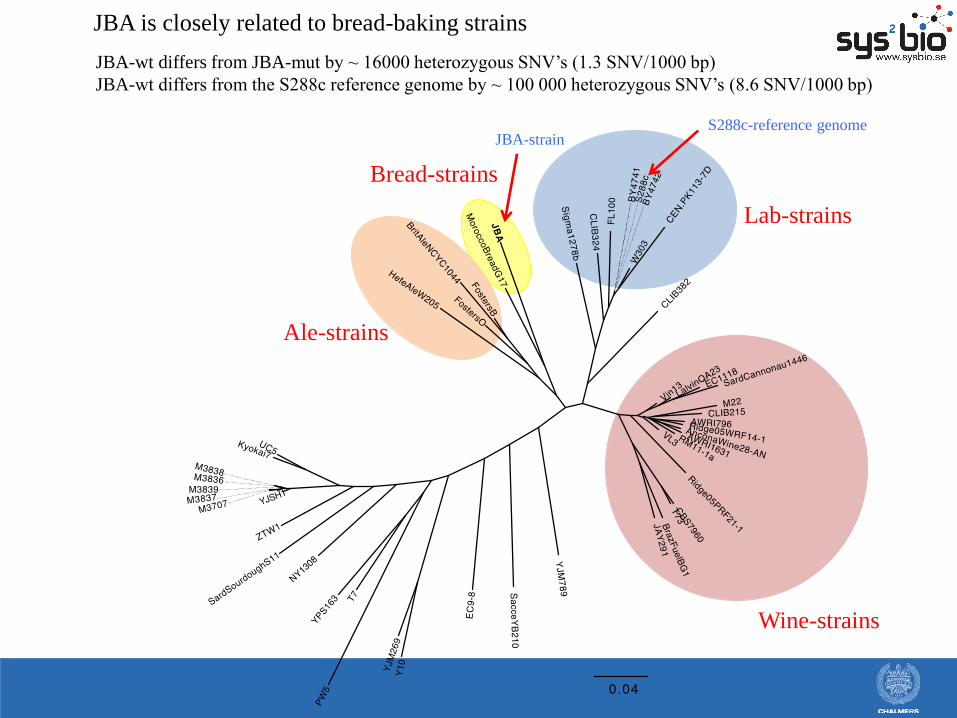
Lab-strains
Wine-strains
Ale-strains
Bread-strains
JBA is closely related to bread-baking strains
JBA-wt differs from JBA-mut by ~ 16000 heterozygous SNV’s (1.3 SNV/1000 bp)
JBA-wt differs from the S288c reference genome by ~ 100 000 heterozygous SNV’s (8.6 SNV/1000 bp)
S288c-reference genome JBA-strain

Conclusion from genome sequencing:
There are major changes in the genomic composition of
JBA-wt and JBA-mutant which was surprising since there
were few changes in the proteome
No differences in genes corresponding to proteins with an altered expression
level between wild-type and mutant could be detected
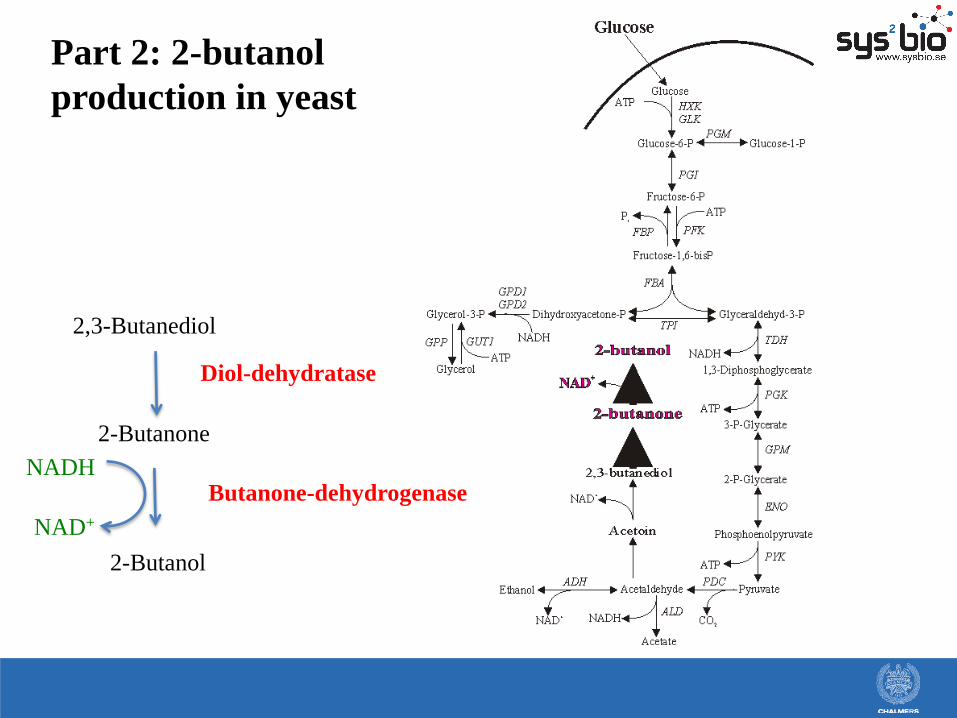
Part 2: 2-butanol
production in yeast
2,3-Butanediol
2-Butanone
2-Butanol
Diol-dehydratase
Butanone-dehydrogenase NADH
NAD+
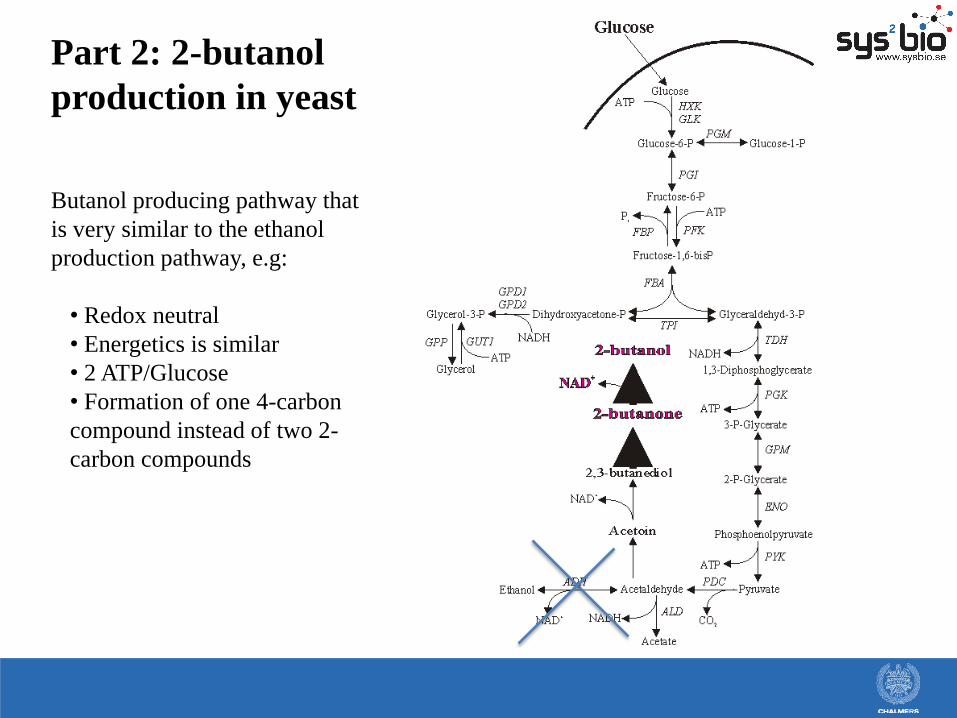
Part 2: 2-butanol
production in yeast
Butanol producing pathway that
is very similar to the ethanol
production pathway, e.g:
• Redox neutral
• Energetics is similar
• 2 ATP/Glucose
• Formation of one 4-carbon
compound instead of two 2-
carbon compounds

Strain Source
meso-2,3-
butanediol
consumption 2-butanone
consumption
L. plantarum 16 strains ethanol pilot plant, Örnsköldsvik No Not tested
L. pantheris 8 strains ethanol pilot plant, Örnsköldsvik No Not tested
L. rossiae 2 strains ethanol pilot plant, Örnsköldsvik No Not tested
L. paracasei 1 strain ethanol pilot plant, Örnsköldsvik No Not tested
L. fermenum 1 strain ethanol pilot plant, Örnsköldsvik No Not tested
L. paracollinoids 1 strain ethanol pilot plant, Örnsköldsvik No Not tested
L. malefermentas 1 strain CCUG 32206 No Not tested
L. buchneri LB 12 ethanol pilot plant, Örnsköldsvik Yes Yes
LB 16 ethanol pilot plant, Örnsköldsvik Yes Yes
L. brevis SE 20 ethanol pilot plant, Örnsköldsvik Yes Yes
SE 31 ethanol pilot plant, Örnsköldsvik Yes Yes
LB 215 CCUG 21531 Yes Yes
LB 219 CCUG 21959 Yes Yes
LB 350 CCUG 35039 Yes Yes
LB 368 CCUG 36840 Yes Yes
LB 399 CCUG 39980 Yes Yes
LB 443 CCUG 44317 Yes Yes
LB 579 CCUG 57950 Yes Yes
LB 734 CNRZ 734 Yes Yes
The required enzyme
activities are reported to
be present in Lactobacilli
and specifically L. Brevis
How to find the required enzymes?
No conversion of 2,3-
butanediol into 2-butanol
in MRS medium but
when using a defined
medium (SM2)...............
0
0,1
0,2
0,3
0,4
0,5
0,6
0,7
0,8
0,9
0 20 40 60 80 100 120 140 160 180
2-B
uta
no
l g
/ L
Time (hr)
215
579
734
SE20
SE31
368
443
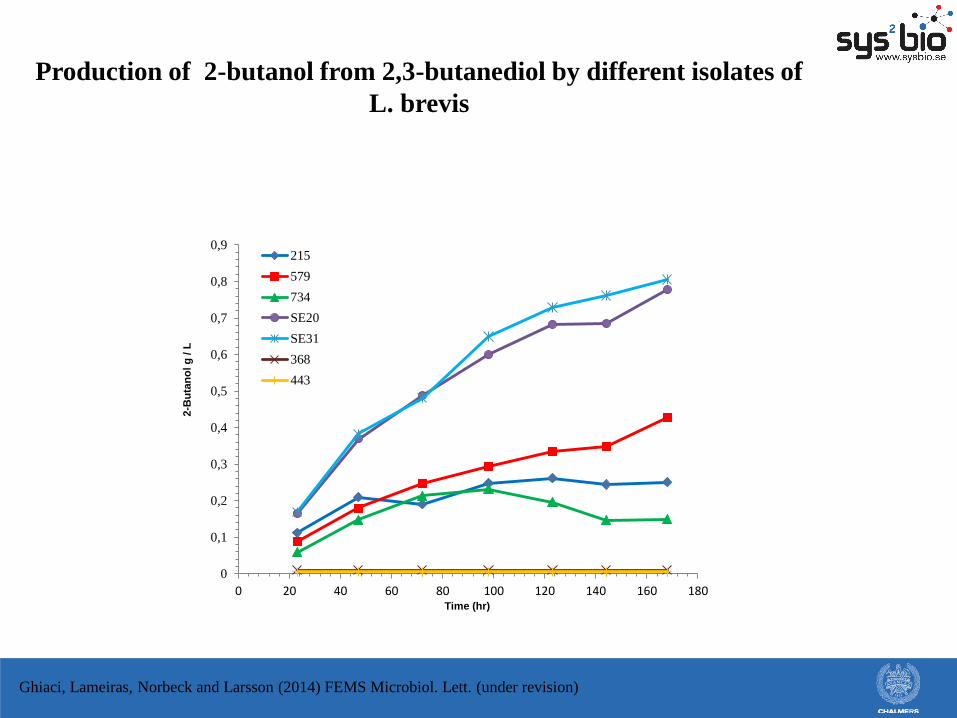
Production of 2-butanol from 2,3-butanediol by different isolates of
L. brevis
Ghiaci, Lameiras, Norbeck and Larsson (2014) FEMS Microbiol. Lett. (under revision)

0
0,1
0,2
0,3
0,4
0,5
0,6
0,7
0,8
0,9
0 50 100 150 200
2-B
uta
no
l g
/ L
Time (hr)
21
5
57
9
73
4
Production of 2-butanol from 2,3-butanediol by different isolates of
L. brevis
Specific activity (µmol min-1 g-1)
Grown in 1,2-propanediol 2,3-butanediol glycerol 1,3-propanediol
SM2 < 0.1 < 0.1 < 0.1 < 0.1
SM2 + 1,2-
propanediol 0.19 ± 0.001 0.08 ± 0.001 0.10 ± 0.001 0.11 ± 0.001
SM2 + 2,3-
butanediol 0.13 ± 0.001 0.10 ± 0.002 0.22 ± 0.001 0.16 ± 0.001
The diol-dehydratase is induced by the
presence of propanediol as well as butanediol
and shows activity also with glycerol
Ghiaci, Lameiras, Norbeck and Larsson (2014) FEMS Microbiol. Lett. (under revision)
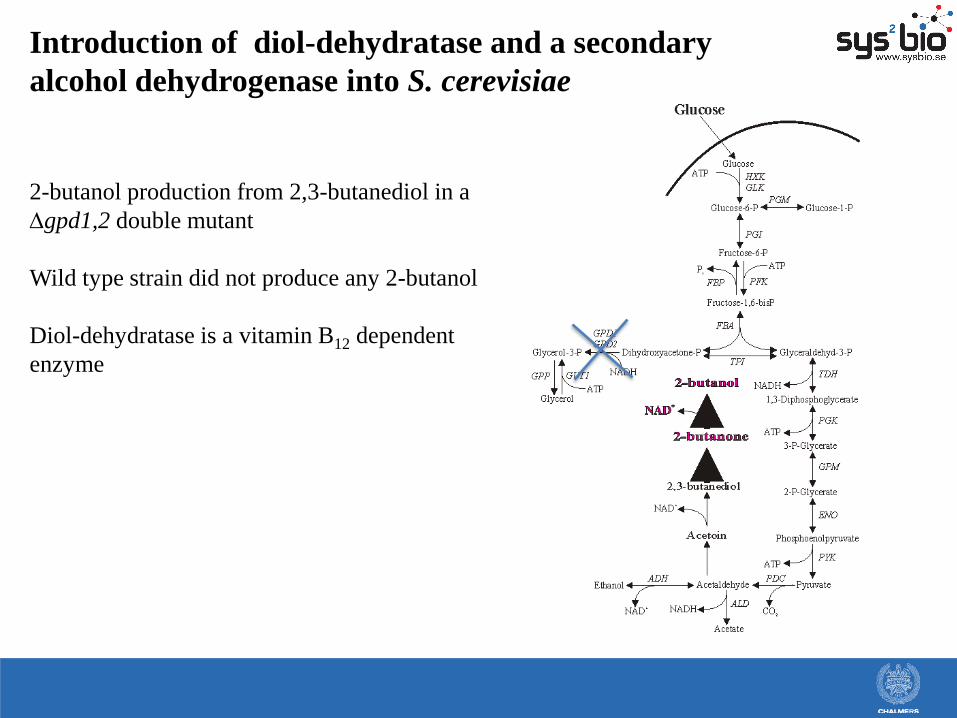
Introduction of diol-dehydratase and a secondary
alcohol dehydrogenase into S. cerevisiae
2-butanol production from 2,3-butanediol in a
Dgpd1,2 double mutant
Wild type strain did not produce any 2-butanol
Diol-dehydratase is a vitamin B12 dependent
enzyme
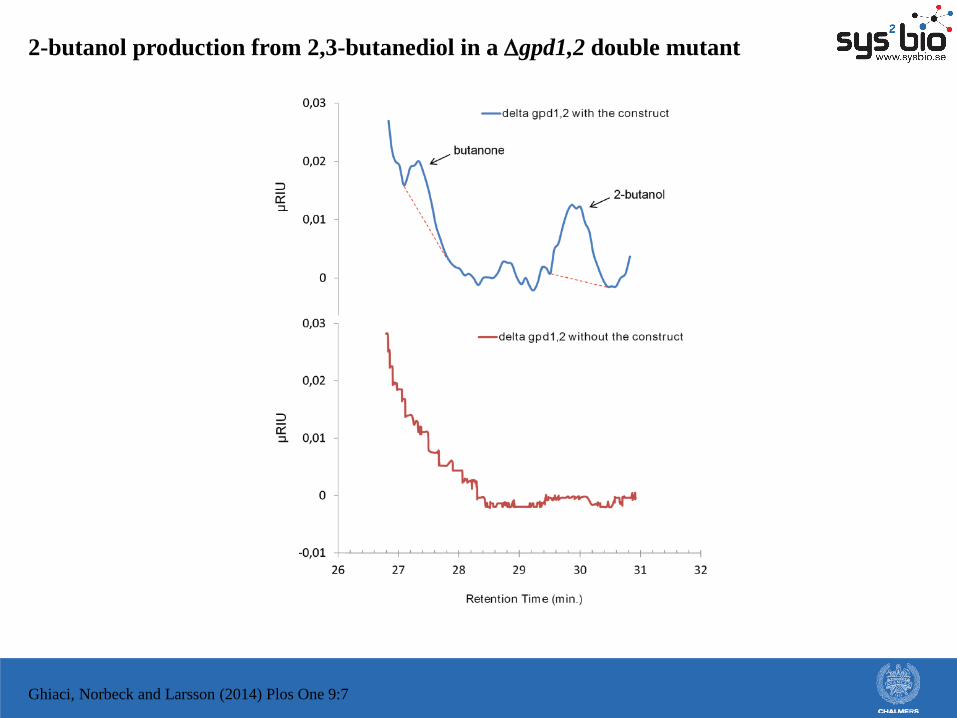
2-butanol production from 2,3-butanediol in a Dgpd1,2 double mutant
Ghiaci, Norbeck and Larsson (2014) Plos One 9:7
Conclusions
• Evolutionary engineering increased the 2-butanol tolerance with more than 50%
• The evolved strain showed an enhanced tolerance to other isomers of butanol as well as
other alcohols
• The evolved strain showed an enhanced expression of many mitochondrial and respiratory
proteins
• Increased expression of glycerol-3-phosphate phosphatase (Gpp2) increased 2-butanol
tolerance in yeast
• The capacity to produce 2-butanol from 2,3-butanediol seems widespread among strains
of L. Brevis
• B12 dependent 2-butanol production is established in S. cerevisiae
Transforming Saccharomyces
cerevisiae into an ethylene producing
organism • Nina Johansson
• Paul Quehl
• Karl Persson
• Joakim Norbeck
• Christer Larsson
• Chalmers University of Technology, Dept Chemical and
Biological Engineering - Systems Biology, Gothenburg,
Sweden

Why ethylene in yeast?
• Bulk chemical (124 million tons/year)
• Fossil based production
• Yeast has an outstanding history of human usage and
exploitation under large-scale industrial conditions
• Can cope with harsh and/or nutrient poor conditions
such as, e.g. Lignocellulosic substrates
• Amenable to genetic manipulations

Three different ethylene producing pathways are identified
1½ NAD+ O2, OH-
S-adenosyl methionine (SAM)
Methionine
Plant pathway
KMBA pathway EFE pathway
Microbial pathways
1-aminocyclopropane-1-carboxylic acid (ACC)
ACS (ACC synthase)
Ethylene
ACO (ACC oxidase)CO2, HCN
½ O2
5'-methylthioadenine
Yang cycle
Methionine
2-Keto-4-methylthiobutyric acid (KMBA)
2 O2
1½ NADH, H+
HO•
Methionine aminotransferase
Ethylene
CO2, methanethiol
2-oxoglutarate
EFEO2
CO2, H2O
Ethylene
O2, arginineCO2, H2O
succinate, guanidine, P5C
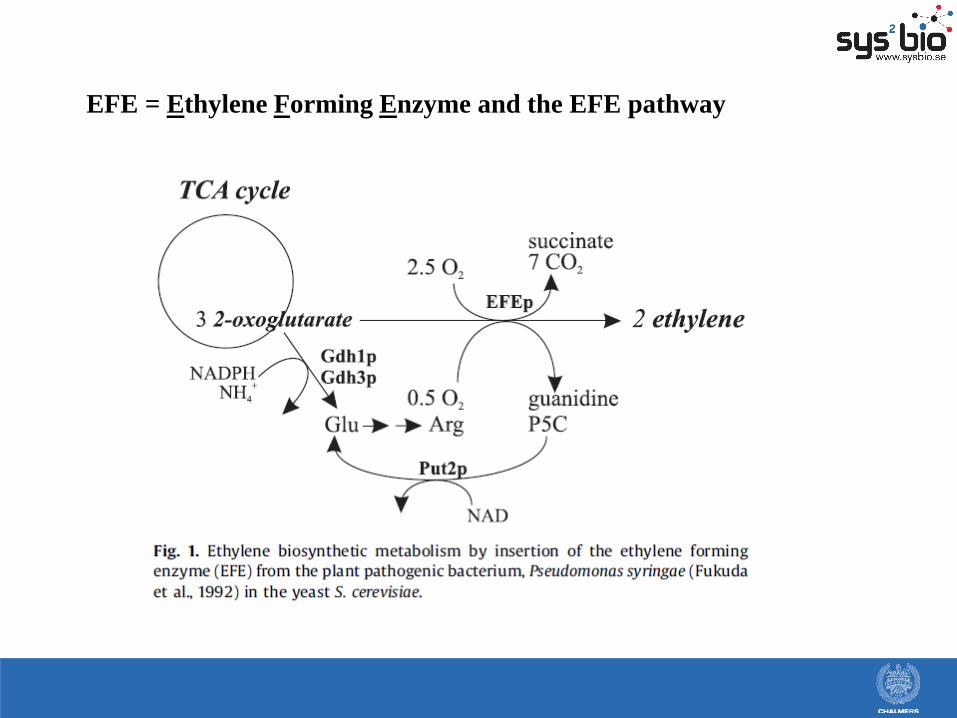
EFE = Ethylene Forming Enzyme and the EFE pathway
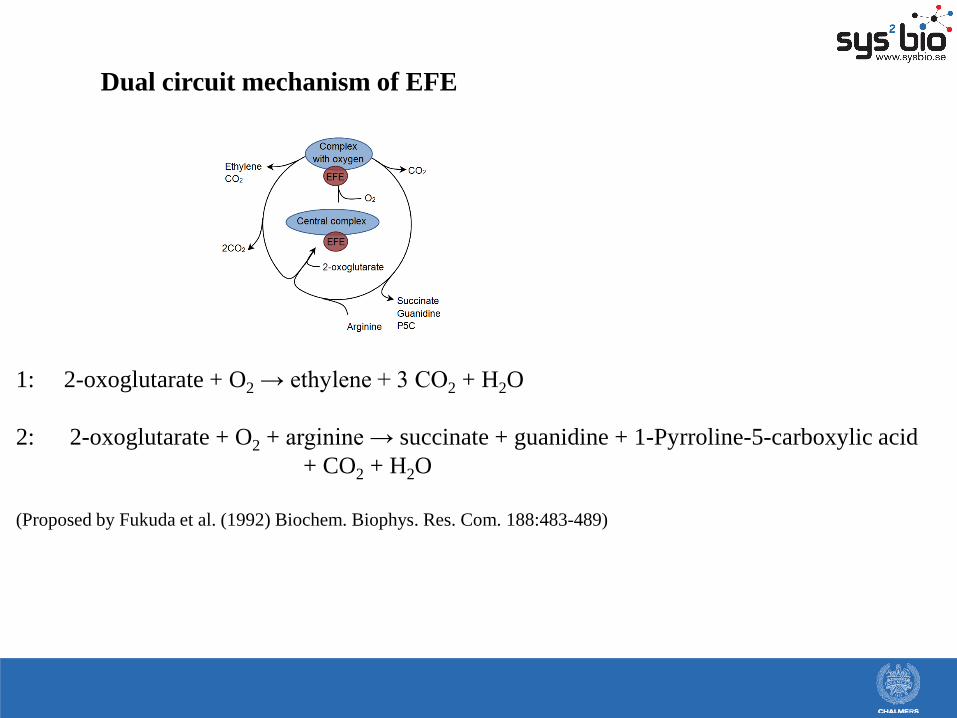
Dual circuit mechanism of EFE
1: 2-oxoglutarate + O2 → ethylene + 3 CO2 + H2O
2: 2-oxoglutarate + O2 + arginine → succinate + guanidine + 1-Pyrroline-5-carboxylic acid
+ CO2 + H2O
(Proposed by Fukuda et al. (1992) Biochem. Biophys. Res. Com. 188:483-489)

Metabolic modelling identified oxygen and respiration of NADH as
key factors for efficient ethylene production
Ethylene production at different levels of dissolved
oxygen. Chemostat cultivation at D = 0.1h-1
Condition
Ethylene
Specific productivity
[µg gDW-1 h-1]
Productivity
[µg LCulture-1 h-1]
Reference condition 30.4 ± 2.8 178 ± 25
+ 7.5 mM Benzoate 50.3 ± 1.3 37.7 ± 0.9
+ 1 mM Azide 0 0
Table 2
The effect of respiration rate on ethylene formation
Larsson et al (2011) IET Systems biology 5:245
Johansson et al (2013) Microbial cell factories 12:89
Oxygen important due to:
1. EFE poor affinity for O2
2. Required for NADH
oxidation
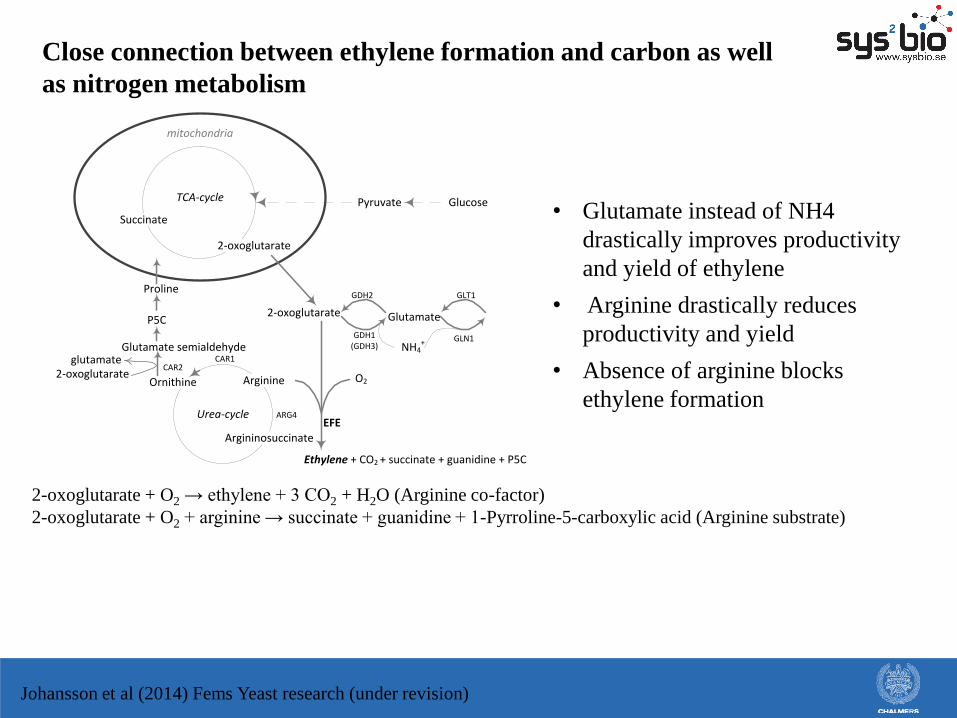
Close connection between ethylene formation and carbon as well
as nitrogen metabolism
GlucosePyruvate
2-oxoglutarate
TCA-cycle
Succinate
Glutamate
Arginine
Glutamate semialdehyde
Urea-cycle
NH4+
mitochondria
GDH1(GDH3)
GDH2 GLT1
GLN1
ARG4
CAR1
2-oxoglutarate
Argininosuccinate
Ornithine
CAR2glutamate
2-oxoglutarate
Ethylene + CO2 + succinate + guanidine + P5C
Proline
O2
EFE
P5C
Johansson et al (2014) Fems Yeast research (under revision)
• Glutamate instead of NH4
drastically improves productivity
and yield of ethylene
• Arginine drastically reduces
productivity and yield
• Absence of arginine blocks
ethylene formation
2-oxoglutarate + O2 → ethylene + 3 CO2 + H2O (Arginine co-factor)
2-oxoglutarate + O2 + arginine → succinate + guanidine + 1-Pyrroline-5-carboxylic acid (Arginine substrate)
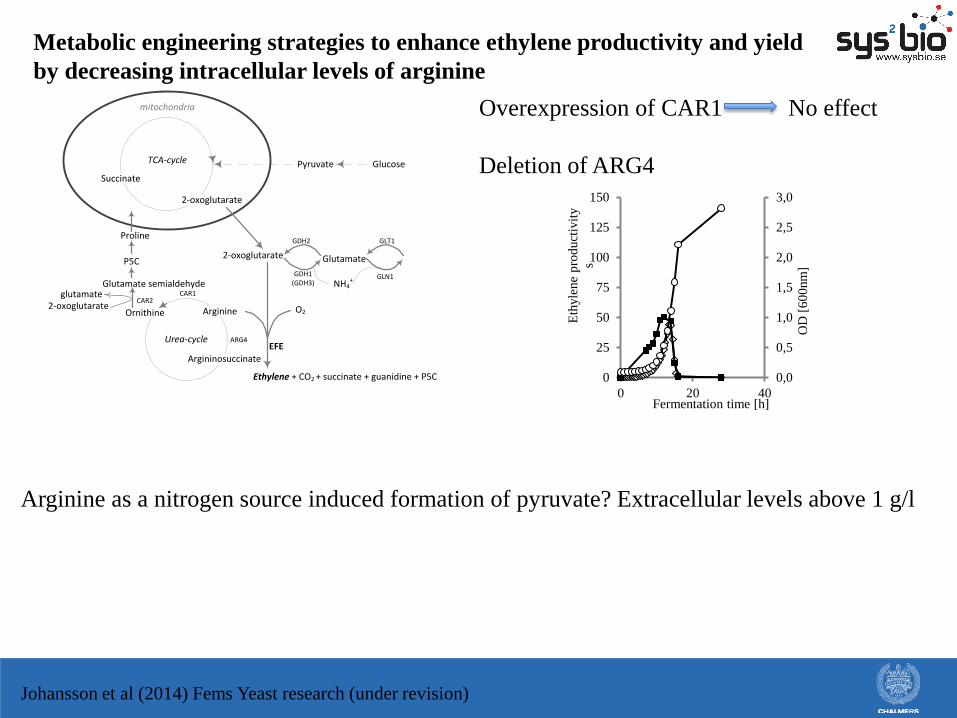
Metabolic engineering strategies to enhance ethylene productivity and yield
by decreasing intracellular levels of arginine
GlucosePyruvate
2-oxoglutarate
TCA-cycle
Succinate
Glutamate
Arginine
Glutamate semialdehyde
Urea-cycle
NH4+
mitochondria
GDH1(GDH3)
GDH2 GLT1
GLN1
ARG4
CAR1
2-oxoglutarate
Argininosuccinate
Ornithine
CAR2glutamate
2-oxoglutarate
Ethylene + CO2 + succinate + guanidine + P5C
Proline
O2
EFE
P5C
Overexpression of CAR1 No effect
Deletion of ARG4
0,0
0,5
1,0
1,5
2,0
2,5
3,0
0
25
50
75
100
125
150
0 20 40
OD
[6
00
nm
]
Eth
yle
ne
pro
duct
ivit
y
s
Fermentation time [h]
Johansson et al (2014) Fems Yeast research (under revision)
Arginine as a nitrogen source induced formation of pyruvate? Extracellular levels above 1 g/l

Structure function studies of EFE
Attempts to determine structure using NMR and crystallography failed!
But
Predicted structure from sequence homology with a dioxygenase from
Arabidopsis thaliana
L22
V172
A199
E235
I254
F278
I304
H189
H268
D191
Nonmodelled“loop”ofaa210-232
withV212&E213
I322(C-terminalaa323-350notinmodel)
N-terminalH233
Comparison of amino acid sequence of three EFE’s
where one did not produce ethylene identified
amino acids correlating with ethylene production
(indicated in the figure)
Johansson et al BMC Biochemistry (submitted)

Acknowledgements
Financial support from the Swedish Energy Agency,
Chalmers Energy Area of Advance and the European
community’s seventh framework programme (FP7-241566-
BIOCORE) is gratefully acknowledged
Thank you and questions?