Niagara county survey - Cornell University
40
Ketterings, Q.M., H. Krol, W.S. Reid and N. Herendeen (2003). Niagara County Soil Sample Survey 1995-2001. CSS Extension Bulletin E03-29. 40 pages. 1 Soil Sample Survey Niagara Co. Samples analyzed by CNAL in 1995-2001 Apple production is important in Niagara County, especially on the glacial outwash soils close to Lake Ontario and along the streams draining to Lake Ontario. The cooling effect of the lake improves the chances for successful pollination in the spring plus contributes to flavor development in the fall. Soil testing is used regularly by commercial apple producers to optimize quality and quantity of production while minimizing the risk of nutrient losses to the environment. Summary compiled by Quirine M. Ketterings, Hettie Krol, W. Shaw Reid & Nathan Herendeen Nutrient Management Spear Program: http://nmsp.css.cornell.edu/ Photo by Paul Le Mark Ketch of Russell Farms Appleton, NY
Transcript of Niagara county survey - Cornell University

Ketterings, Q.M., H. Krol, W.S. Reid and N. Herendeen (2003). Niagara County Soil Sample Survey 1995-2001. CSS Extension Bulletin E03-29. 40 pages.
1
Soil Sample Survey
Niagara Co. Samples analyzed by CNAL in 1995-2001
Apple production is important in Niagara County, especially on the glacial outwash soils close to Lake Ontario and along the streams draining to Lake Ontario. The cooling effect of the lake improves the chances for successful pollination in the spring plus contributes to flavor development in the fall. Soil testing is used regularly by commercial apple producers to optimize quality and quantity of production while minimizing the risk of nutrient losses to the environment.
Summary compiled by
Quirine M. Ketterings, Hettie Krol, W. Shaw Reid & Nathan Herendeen
Nutrient Management Spear Program: http://nmsp.css.cornell.edu/
Photo by Paul Lehman
Mark Ketch of Russell Farms Appleton, NY

Ketterings, Q.M., H. Krol, W.S. Reid and N. Herendeen (2003). Niagara County Soil Sample Survey 1995-2001. CSS Extension Bulletin E03-29. 40 pages.
2
Soil Sample Survey
Niagara Co. Samples analyzed by CNAL in 1995-2001
Summary compiled by
Quirine Ketterings and Hettie Krol Nutrient Management Spear Program Department of Crop and Soil Sciences 817 Bradfield Hall, Cornell University
Ithaca NY 14853
W. Shaw Reid Professor Emeritus
Department of Crop and Soil Sciences
Nathan Herendeen Senior Extension Associate – Field Crops
Cornell Cooperative Extension – North West New York Team
November 19, 2003
Correct Citation:
Ketterings, Q.M., H. Krol, W.S. Reid, and N Herendeen (2003). Soil samples survey of Niagara County. Samples analyzed by the Cornell Nutrient Analysis Laboratory in 1995-2001. CSS Extension Bulletin E03-29. 39 pages.
Front page photo courtesy of Paul E. Lehman, Extension Educator, Niagara County.

Ketterings, Q.M., H. Krol, W.S. Reid and N. Herendeen (2003). Niagara County Soil Sample Survey 1995-2001. CSS Extension Bulletin E03-29. 40 pages.
3
Table of Content
1. General Survey Summary................................................................................................4 2. Cropping Systems ..........................................................................................................11
2.1 Samples for Home and Garden................................................................................11 2.2 Samples for Commercial Production.......................................................................12
3. Soil Types ......................................................................................................................14 3.1 Samples for Home and Garden................................................................................14 3.2 Samples for Commercial Production.......................................................................15
4. Organic Matter ...............................................................................................................17 4.1 Samples for Home and Garden................................................................................17 4.2 Samples for Commercial Production.......................................................................18
5. pH ..................................................................................................................................19 5.1 Samples for Home and Garden................................................................................19 5.2 Samples for Commercial Production.......................................................................20
6. Phosphorus.....................................................................................................................21 6.1 Samples for Home and Garden................................................................................21 6.2 Samples for Commercial Production.......................................................................22
7. Potassium.......................................................................................................................23 7.1 Samples for Home and Garden................................................................................23 7.2 Samples for Commercial Production.......................................................................26
8. Magnesium ....................................................................................................................29 8.1 Samples for Home and Garden................................................................................29 8.2 Samples for Commercial Production.......................................................................30
9. Iron.................................................................................................................................31 9.1 Samples for Home and Garden................................................................................31 9.2 Samples for Commercial Production.......................................................................32
10. Manganese ...................................................................................................................33 10.1 Samples for Home and Garden..............................................................................33 10.2 Samples for Commercial Production.....................................................................34
11. Zinc ..............................................................................................................................35 11.1 Samples for Home and Garden..............................................................................35 11.2 Samples for Commercial Production.....................................................................36
Appendix: Cornell Crop Codes .........................................................................................37

4
1. General Survey Summary
Niagara County is located in the northwest corner of New York, north of Buffalo. It is bordered by Lake Ontario on the north and Ontario, Canada on the west. It contains over 339,000 acres of land area. Roughly 50 % of the area is used for farm production. Niagara County is noted for Niagara Falls where the north flowing Niagara River drops nearly 200 feet as it goes over the crest of the Niagara escarpment. The county lies entirely in the Ontario and Huron Lake Plains region. The northern lake plain begins at Lake Ontario, where the elevation is 246 feet above sea level. It extends to the foot of the Niagara escarpment. There the elevation increases sharply to crest of the escarpment, about 600 elevation. The Huron Plain part of the county extends from that crest southward into Erie County. It has a high point of 680 feet at Bunker Hill near the southeast corner of the county and a low of 575 feet at the mouth of Tonawanda Creek. The soils in the north are dominated by glacial till that was greatly modified by glacial outwash and/or glacial lake sediments. The soils in the south are derived from high carbonate materials deposited by glacial advance across the Niagara dolomite limestone escarpment. However, glacial outwash materials and/or lacustrine sediments also modified much of this area. Small areas of wetlands occur throughout the county, the result of massive glacial outwash during the period of glacial recession from western New York. Several small areas were drained and farmed as organic soils or muckland for many years. Most have been abandoned for agricultural purposes. Additional areas of wetlands are protected in the federal Iroquois Wildlife Refuge and the state Tonawanda Wildlife Area, in the southeast corner of the county. These areas are seasonal feeding and resting sites to many migratory waterfowl, especially Canada geese. The agriculture of Niagara County is diverse. Dairy farming is the largest single generator of farm income. Livestock producers market beef, hogs and sheep from Niagara County. Thousands of acres are devoted to field and forage crops to support the dairy and livestock industry. Hay, grain and soybean crops not used locally are exported to areas throughout the eastern United States.

Ketterings, Q.M., H. Krol, W.S. Reid and N. Herendeen (2003). Niagara County Soil Sample Survey 1995-2001. CSS Extension Bulletin E03-29. 40 pages.
5
Tree fruit production is next in farm income creation, with large acreages of apples plus smaller acreages of cherries, peaches, pears and plums. Apples are stored, packed and marketed throughout the eastern US and overseas markets from Niagara County facilities. Vegetable crops comprise the next largest segment of the agricultural economy. Crops grown for processing include peas, snap beans, sweet corn and dry beans. Fresh vegetables produced include all the above plus cabbage, potatoes, cucumbers, squash, pumpkins, peppers and tomatoes. Bedding plants and ornamentals are important commodities on farms with greenhouses and nursery stock. Small fruits such as strawberries and blueberries are grown for fresh market. Niagara County has small and large dairy farms and several grass based dairy farms. There are a number of farms that have found niche markets for fresh produce and/or use their facilities for agri-tourism. The number of farms with recreational horse boarding and training facilities is on the increase. All the above industries rely heavily on soil testing to maintain optimum production while protecting the agricultural environment from nutrient runoff. This survey summarizes the soil test results from Niagara County soil samples submitted for analyses to the Cornell Nutrient Analysis Laboratory (CNAL) during 1995-2001. The total number of samples analyzed in these years amounted to 1146. Of these 1146 samples, 928 (81%) were submitted to obtain fertilizer recommendations for commercial production while 218 samples (19%) were submitted as home and garden samples. Fourty-nine percent of the home and garden soil samples were submitted to request fertilizer recommendations for lawns while others requested recommendations mostly for perennials and home garden vegetable production. People submitting samples for commercial production requested fertilizer recommendations for apple production (28%), corn grain or silage (15%), soybeans (8%), alfalfa, alfalfa/grass or alfalfa/trefoil mixtures (6%), while a few producers were planning on growing other crops including small grains, vegetables, and fruit trees.

Ketterings, Q.M., H. Krol, W.S. Reid and N. Herendeen (2003). Niagara County Soil Sample Survey 1995-2001. CSS Extension Bulletin E03-29. 40 pages.
6
0
50
100
150
200
250
300
Num
ber o
f sam
ples
1995 1996 1997 1998 1999 2000 2001
Samples for commercial productionSamples for home and garden
Homeowners
Commercial
Total
1995 13 1995 117 130 1996 32 1996 187 219 1997 31 1997 131 162 1998 21 1998 175 196 1999 81 1999 120 201 2000 14 2000 135 149 2001 26 2001 63 89 Total
218 Total 928 1146
Home and garden samples in Niagara County were dominantly sandy loam soils belonging to soil management group 4 (44%). Twenty-five percent belonged to soil management group 2. Group 3 was represented by 22% of all samples and 9% was classified as sandy (soil management group 5). The following table on page 7 gives descriptions of each of the soil management groups.

Ketterings, Q.M., H. Krol, W.S. Reid and N. Herendeen (2003). Niagara County Soil Sample Survey 1995-2001. CSS Extension Bulletin E03-29. 40 pages.
7
Soil Management Groups for New York
1
Fine-textured soils developed from clayey lake sediments and medium- to fine-textured soils developed from lake sediments.
2
Medium- to fine-textured soils developed from calcareous glacial till and medium-textured to moderately fine-textured soils developed from slightly calcareous glacial till mixed with shale and medium-textured soils developed in recent alluvium.
3
Moderately coarse textured soil developed from glacial outwash and recent alluvium and medium-textured acid soil developed on glacial till.
4
Coarse- to medium-textured soils formed from glacial till or glacial outwash.
5
Coarse- to very coarse-textured soils formed from gravelly or sandy glacial outwash or glacial lake beach ridges or deltas.
6 Organic or muck soils with more than 80% organic matter.
Of the samples submitted for commercial production, 49% belonged to soil management group 2. One percent was from soil management group 1. Twenty-seven percent belonged to soil management group 3 while 19% were classified group 4 and 4% were from group 5. The five most common soil series were Rhinebeck (11%), Hilton (11%), Collamer (10%), Odessa (8%) and Appleton (8%). These soils represent 2% (Rhinebeck), 9% (Hilton), 3% (Collamer), 8% (Odessa), and 9% (Appleton) of the total 334,170 acres in the county. Organic matter levels, as measured by loss on ignition, ranged from less than 1% to almost 60% with median values ranging from 3.6 to 4.7% organic matter for home and garden samples and from 2.2 to 3.0 for samples submitted for commercial production. Sixty-three percent of the home and garden samples had between 2 and 5% organic matter with 15% testing between 2 and 2.9% organic matter, 23% between 3.0 and 3.9% organic matter and 25% between 4.0 and 4.9% organic matter. Thirty-one percent of the soils submitted for home and garden tested >4.9% in organic matter while 6% has less than 2% organic matter. Of the samples submitted for commercial production, 23%

Ketterings, Q.M., H. Krol, W.S. Reid and N. Herendeen (2003). Niagara County Soil Sample Survey 1995-2001. CSS Extension Bulletin E03-29. 40 pages.
8
contained less than 2% organic matter, 40% percent of the samples had between 2 and 2.9% organic matter, 23% contained between 3 and 4% organic matter, 9% tested between 4.0 and 4.9% while 5% had organic matter concentrations of 5.0% or greater. In total, 84% of the samples had organic matter levels between 1.0 and 3.9%. Soil pH in water (1:1 extraction ratio) varied from pH 3.4 to 8.5 with the median for home and garden samples ranging from pH 7.0 to pH 7.5 and for samples submitted for commercial production ranging from pH 6.1 to pH 6.5. Of the home and garden samples, 46% tested between pH 6.0 and 7.4 while 45% had a pH of 7.5 or greater. For the samples submitted for commercial production, 10% tested lower than pH 5.5. Extractable nutrients such as phosphorus (P), potassium (K), magnesium (Mg), calcium (Ca), iron (Fe), manganese (Mn), and zinc (Zn) were measured using the Morgan solution and extraction method (Morgan, 1941). This solution contains sodium acetate buffered at a pH of 4.8. Soil test P levels of <1 lb P/acre are classified as very low. Between 1-3 lbs P/acre is low. Medium is between 4-8 lbs P/acre. High testing soils have P levels between 9 and 39 lbs P/acre and soils with >39 lbs P/acre are classified as very high. Of the home and garden samples, 14% tested low, 23% tested medium, 34% tested high and 29% tested very high. This meant that 63% tested high or very high in P. Phosphorus levels for samples for commercial production in Niagara County were slightly lower than the state average (50% tests high or very high in P). Five percent of the samples tested very high in P. Twenty-three percent were low in P, 33% tested medium for P while 39% of the submitted samples were classified as high in soil test P. This means that 44% tested high or very high in P. There were no clear trends in P levels over the 7 years. Classifications for potassium depend on soil management group. The fine-textured soils of soil management group 1 have a greater K supplying capacity than the coarse textured sandy soils (soil management group 5). Classification for each of the management groups in the above table represent very low, low, medium, high and very high. So for example for soil management group 5 and 6, <60 lbs K/acre means the soil is very low in K, between 60 and 114 lbs K/acre is low, 115-164 lbs K/acre is medium, 165-269 lbs K/acre is high and >269 lbs K/acre is classified as very high (see the table on page 9).

Ketterings, Q.M., H. Krol, W.S. Reid and N. Herendeen (2003). Niagara County Soil Sample Survey 1995-2001. CSS Extension Bulletin E03-29. 40 pages.
9
Potassium classifications depend on soil test K levels and soil management group.
Potassium Soil Test Value (Morgan extraction in lbs K/acre)
Soil Management
Group
Very low
Low
Medium
High
Very High
1
<35
35-64
65-94
95-149
>149
2 <40 40-69 70-99 100-164 >164 3 <45 45-79 80-119 120-199 >199 4 <55 55-99 100-149 150-239 >239
5 and 6 <60 60-114 115-164 165-269 >269
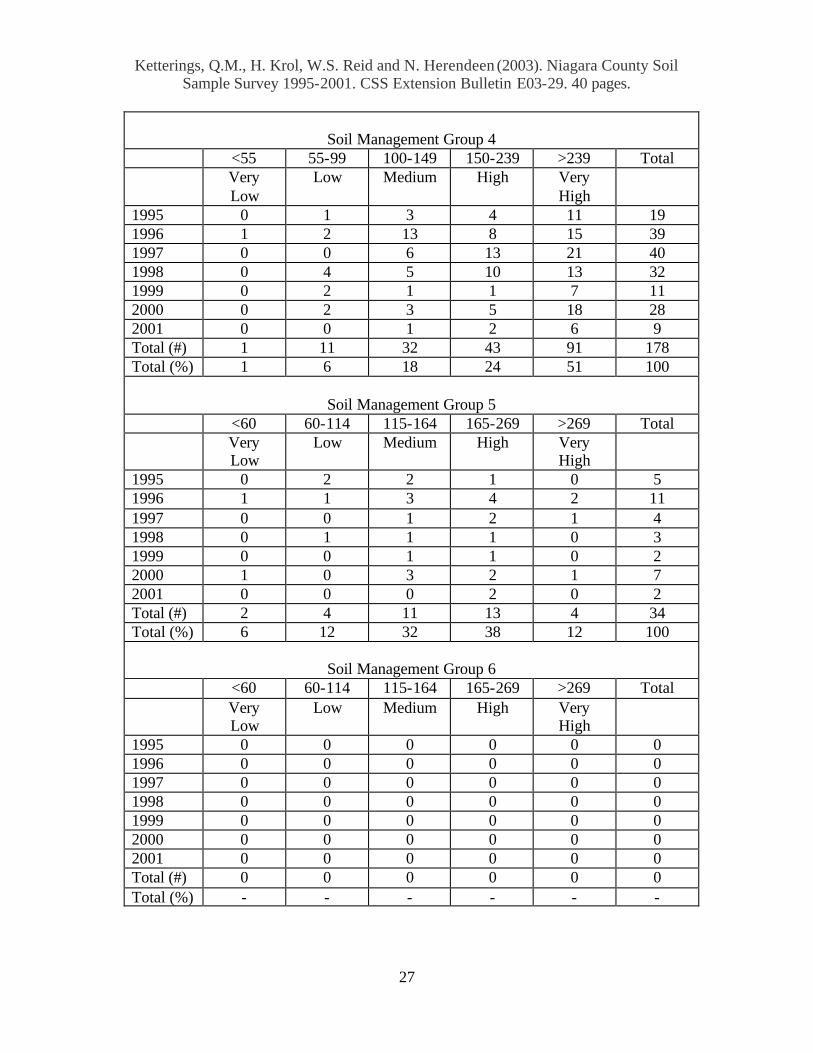
Of the home and garden samples, 8% was classified as low in potassium. Seventeen percent tested medium, 32% high and 43% very high. For samples submitted for commercial production, 1% tested very low in K, 6% tested low, 18% tested medium, 29% tested high and 46% tested very high in potassium. As with phosphorus, there were no trends over the 7 years of soil sampling. Soils test very low for magnesium if Morgan extractable Mg is less than 20 lbs Mg/acre. Low testing soils have 20-65 lbs Morgan Mg per acre. Soils with 66-100 lbs Mg/acre test medium for magnesium. High testing soils have 101-199 lbs Mg/acre while soils with more than 200 lbs Mg/acre in the Morgan extraction are classified as very high in Mg. Magnesium levels ranged from less than 10 to almost 6000 lbs Mg/acre (Morgan extraction). There were only two samples that tested very low in Mg. Most soils tested high or very high for Mg (99% of the homeowner soils and 95% of the soils of the commercial growers). No more than 2 of the homeowner soils and 4% of the commercial growers’ soil tested low or medium in Mg. Thus, magnesium deficiency is not likely to occur in Niagara County provided the soil pH is maintained in the desirable range. Soils with more than 50 lbs Morgan extractable Fe per acre test excessive for Fe. Anything lower than 50 lbs Fe/acre is considered normal. Iron levels fell for 92-95% in the normal range with 8% of the home and garden samples and 5% of the samples for commercial production testing excessive for Fe. Similarly, most soils (89-98%) for both groups tested normal for manganese. Soils with more than 100 lbs Morgan extractable Mn per acre are classified as excessive in Mn. Anything less than 100 lbs Mn per acre is

Ketterings, Q.M., H. Krol, W.S. Reid and N. Herendeen (2003). Niagara County Soil Sample Survey 1995-2001. CSS Extension Bulletin E03-29. 40 pages.
10
classified as normal. Soils with less than 0.5 lb zinc per acre in the Morgan extraction are classified as low in Zn. Medium testing soils have between 0.5 and 1 lb of Morgan extractable Zn per acre. If more than 1 lb of Zn/acre is extracted with the Morgan solution, the soil tests high in Zn. For the home and garden samples, 93% tested high for zinc while 7% tested medium. Of the samples for commercial production, 4% tested low in zinc, 27% tested medium while 70% was high in zinc. In the following sections, the summary tables for each of the soil fertility indicators described above are given. The appendix contains the crop codes used in section 2.
Reference
• Morgan, M.F. (1941). Chemical soil diagnosis by the universal soil testing system.
Connecticut Agricultural Experimental Station. Bulletin 450.

Ketterings, Q.M., H. Krol, W.S. Reid and N. Herendeen (2003). Niagara County Soil Sample Survey 1995-2001. CSS Extension Bulletin E03-29. 40 pages.
11
2. Cropping Systems
2.1 Samples for Home and Garden Crops for which recommendations are requested by homeowners:
1995
1996
1997
1998
1999
2000
2001
Total
%
ALG 0 0 1 0 1 0 2 4 2 APR 0 0 0 0 0 1 0 1 0 ATF 0 1 0 0 1 0 1 3 1 FAR 0 5 0 0 8 0 0 13 6 FLA 0 1 1 0 8 1 0 11 5 GEN 0 0 0 0 4 0 0 4 2 LAW 6 16 22 12 40 7 3 106 49 MVG 3 2 4 1 3 3 5 21 10 OTH 0 0 0 0 1 0 0 1 0 PER 2 0 0 5 2 0 3 12 6 SAG 2 7 3 2 12 2 12 40 18 TRF 0 0 0 1 0 0 0 1 0 Unknown 0 0 0 0 1 0 0 1 0 Total 13 32 31 21 81 14 26 218 100
Notes: See Appendix for Cornell crop codes.

Ketterings, Q.M., H. Krol, W.S. Reid and N. Herendeen (2003). Niagara County Soil Sample Survey 1995-2001. CSS Extension Bulletin E03-29. 40 pages.
12
2.2 Samples for Commercial Production Crops for which recommendations are requested for commercial production: Current year crop
1995
1996
1997
1998
1999
2000
2001
Total
%
ABE/ABT 5 2 1 3 4 3 1 19 2 ACT 0 2 0 0 0 0 0 2 0 AGE/AGT 6 4 5 4 5 0 0 24 3 ALE/ALT 1 1 0 2 2 0 0 6 1 APP 4 50 59 48 37 45 14 257 28 BCE/BCT 0 8 1 0 0 0 0 9 1 BDR/BND 5 0 0 0 0 3 0 8 1 BGE/BGT 6 5 0 4 0 3 1 19 2 BSP 0 0 0 0 0 0 3 3 0 BSS 0 0 0 0 0 0 1 1 0 BTE/BTT 0 2 0 0 0 1 0 3 0 BUK 1 0 0 0 0 0 0 1 0 CBP 7 9 6 16 9 0 2 49 5 CBS 0 2 1 2 1 0 0 6 1 CGE/CGT 7 0 2 0 0 0 2 11 1 CHS 2 6 7 7 0 4 0 26 3 CHT 0 4 0 0 1 1 0 6 1 CKS 0 0 1 0 0 0 0 1 0 CLE/CLT 0 0 1 0 0 0 4 5 1 COG/COS 23 35 7 33 23 16 6 143 15 GIE/GIT 0 0 0 0 0 0 1 1 0 GPA 4 3 7 4 6 16 3 43 5 GPF 0 0 1 0 0 0 1 2 0 GPV 0 0 0 0 0 0 2 2 0 GRE/GRT 2 3 0 0 2 2 0 9 1 IDL 0 0 1 0 0 3 0 4 0 MIX 0 5 2 1 1 2 1 12 1 MML 1 1 0 0 0 1 1 4 0 NEC 0 0 1 0 0 0 0 1 0 OAS 0 1 0 0 0 0 1 2 0 OAT 0 0 0 0 3 1 0 4 0 ONP 0 0 0 1 0 0 0 1 0 ONS 0 0 0 0 0 1 0 1 0 OTH 0 2 0 0 2 0 0 4 0 PAR 0 3 1 3 0 3 0 10 1

Ketterings, Q.M., H. Krol, W.S. Reid and N. Herendeen (2003). Niagara County Soil Sample Survey 1995-2001. CSS Extension Bulletin E03-29. 40 pages.
13
Current year crop
1995
1996
1997
1998
1999
2000
2001
Total
%
PCH 2 5 1 3 0 4 0 15 2 PEA 0 1 2 1 0 0 0 4 0 PGE/PGT 1 0 0 0 3 1 0 5 1 PIE/PIT 0 0 0 0 5 0 1 6 1 PLE/PLT 0 0 0 0 1 0 0 1 0 PLM 0 0 0 0 0 2 0 2 0 PNE/PNT 0 0 0 0 2 0 0 2 0 POT 0 0 0 1 0 0 0 1 0 PRN 0 2 2 2 0 2 0 8 1 PUM 2 1 2 2 2 0 0 9 1 RSF 0 0 0 0 1 0 0 1 0 SOG 1 0 2 0 0 0 1 4 0 SOY 10 13 0 28 8 10 3 72 8 STS 2 0 1 2 1 2 0 8 1 SUN 0 0 0 0 0 2 0 2 0 SWC 11 6 10 3 0 4 6 40 4 TME 2 1 0 0 0 1 1 5 1 TOM 1 0 0 2 0 0 0 3 0 TRE/TRT 0 1 0 1 0 0 0 2 0 WHT 10 1 6 2 0 2 6 27 3 Unknown 1 8 1 0 1 0 1 12 1 Total 117 187 131 175 120 135 63 928 100
Notes: See Appendix for Cornell crop codes.

Ketterings, Q.M., H. Krol, W.S. Reid and N. Herendeen (2003). Niagara County Soil Sample Survey 1995-2001. CSS Extension Bulletin E03-29. 40 pages.
14
3. Soil Types
3.1 Samples for Home and Garden Soil types (soil management groups) for home and garden samples:
1995 1996
1997
1998
1999
2000
2001
Total
SMG 1 (clayey) 0 0 0 0 0 0 0 0 SMG 2 (silty) 3 10 16 9 8 6 3 55 SMG 3 (silt loam) 1 8 9 1 24 3 3 49 SMG 4 (sandy loam) 6 10 4 10 42 4 19 95 SMG 5 (sandy) 3 4 2 1 7 1 1 19 SMG 6 (mucky) 0 0 0 0 0 0 0 0 Total 13 32 31 21 81 14 26 218

Ketterings, Q.M., H. Krol, W.S. Reid and N. Herendeen (2003). Niagara County Soil Sample Survey 1995-2001. CSS Extension Bulletin E03-29. 40 pages.
15
3.2 Samples for Commercial Production
Soil series for samples submitted for commercial production: Name
SMG
1995
1996
1997
1998
1999
2000
2001
Total
Altmar 5 0 7 0 1 0 2 1 11 Appleton 2 9 10 4 24 9 10 7 73 Arkport 4 0 16 14 8 1 15 1 55 Bombay 4 0 0 0 0 0 4 0 4 Canandaigua 3 2 2 0 0 0 0 0 4 Cayuga 2 5 0 3 0 2 0 3 13 Cazenovia 2 1 0 0 1 0 0 0 2 Cheektowaga 5 0 0 0 0 0 0 1 1 Churchville 2 0 1 1 1 2 3 0 8 Claverack 4 2 5 4 2 2 1 0 16 Collamer 3 4 18 12 22 11 22 0 89 Colonie 5 0 1 3 2 0 0 0 6 Cosad 4 3 3 0 1 2 0 1 10 Dunkirk 3 0 7 4 7 1 0 1 20 Elnora 5 4 2 0 0 1 3 0 10 Fonda 2 0 0 1 0 0 0 0 1 Fredon 4 1 1 0 1 0 1 1 5 Galen 4 1 1 3 5 0 1 0 11 Hamlin 2 0 2 0 0 0 0 0 2 Hilton 2 10 20 9 18 27 14 6 104 Howard 3 4 7 16 7 4 9 6 53 Hudson 2 1 2 0 0 0 1 1 5 Lairdsville 2 0 0 0 0 0 2 0 2 Lakemont 5 1 1 1 0 1 2 0 6 Lamson 4 0 0 4 2 0 0 0 6 Lockport 2 1 0 0 0 0 0 0 1 Madalin 1 2 0 0 2 7 0 0 11 Massena 4 0 0 5 0 0 0 1 6 Minoa 4 1 3 4 8 1 0 0 17 Niagara 3 3 2 4 3 2 2 2 18 Odessa 2 21 15 3 6 12 12 5 74 Ontario 2 3 2 4 9 3 2 0 23 Otisville 4 11 9 5 5 2 3 4 39 Ovid 2 6 9 0 5 9 3 11 43 Phelps 3 7 10 11 8 7 10 6 59 Raynham 3 4 0 0 1 0 0 0 5

Ketterings, Q.M., H. Krol, W.S. Reid and N. Herendeen (2003). Niagara County Soil Sample Survey 1995-2001. CSS Extension Bulletin E03-29. 40 pages.
16
Name
SMG
1995
1996
1997
1998
1999
2000
2001
Total
Rhinebeck 2 10 30 14 26 11 9 4 104 Stafford 4 0 0 0 0 0 0 1 1 Sun 4 0 1 1 0 3 3 0 8 unknown - 0 0 1 0 0 1 0 2 Total - 117 187 131 175 120 135 63 928

Ketterings, Q.M., H. Krol, W.S. Reid and N. Herendeen (2003). Niagara County Soil Sample Survey 1995-2001. CSS Extension Bulletin E03-29. 40 pages.
17
4. Organic Matter
4.1 Samples for Home and Garden Number of home and garden samples within each % organic matter range:
<1%
1.0-1.9
2.0-2.9
3.0-3.9
4.0-4.9
5.0-5.9
6.0-6.9
>6.9
Total
1995 0 3 3 0 4 0 0 3 13 1996 0 2 7 7 12 2 1 1 32 1997 0 0 6 10 5 5 2 3 31 1998 0 0 3 11 5 2 0 0 21 1999 0 3 8 14 21 16 6 13 81 2000 0 0 3 2 2 4 1 2 14 2001 2 2 2 6 6 4 1 3 26 Total 2 10 32 50 55 33 11 25 218
1995
1996
1997
1998
1999
2000
2001
Lowest: 1.1 1.7 2.2 2.5 1.3 2.0 0.2 Highest: 16.2 24.8 9.9 5.9 59.9 15.6 10.7 Mean: 5.0 4.4 4.4 3.8 7.7 5.5 4.2 Median: 4.0 4.0 3.8 3.6 4.7 4.9 4.1
Percent of home and garden samples within each % organic matter range:
<1%
1.0-1.9
2.0-2.9
3.0-3.9
4.0-4.9
5.0-5.9
6.0-6.9
>6.9
Total
1995 0 23 23 0 31 0 0 23 100 1996 0 6 22 22 38 6 3 3 100 1997 0 0 19 32 16 16 6 10 100 1998 0 0 14 52 24 10 0 0 100 1999 0 4 10 17 26 20 7 16 100 2000 0 0 21 14 14 29 7 14 100 2001 8 8 8 23 23 15 4 12 100 Total 1 5 15 23 25 15 5 11 100

Ketterings, Q.M., H. Krol, W.S. Reid and N. Herendeen (2003). Niagara County Soil Sample Survey 1995-2001. CSS Extension Bulletin E03-29. 40 pages.
18
4.2 Samples for Commercial Production Number of samples for commercial production within each % organic matter range:
<1%
1.0-1.9
2.0-2.9
3.0-3.9
4.0-4.9
5.0-5.9
6.0-6.9
>6.9
Total
1995 1 14 42 28 20 6 5 1 117 1996 7 40 69 52 10 5 3 1 187 1997 1 45 55 25 2 2 1 0 131 1998 1 35 78 46 14 0 0 1 175 1999 0 10 52 33 17 4 2 2 120 2000 4 37 54 16 17 4 2 1 135 2001 2 15 22 13 3 2 3 3 63 Total 16 196 372 213 83 23 16 9 928
1995
1996
1997
1998
1999
2000
2001
Lowest: 0.7 0.1 0.8 0.7 1.1 0.7 0.5 Highest: 7.2 7.4 6.3 7.1 9.0 7.3 8.4 Mean: 3.3 2.7 2.4 2.7 3.2 2.7 3.0 Median: 3.0 2.7 2.2 2.6 2.9 2.4 2.7
Percent of samples for commercial production within each % organic matter range:
<1%
1.0-1.9
2.0-2.9
3.0-3.9
4.0-4.9
5.0-5.9
6.0-6.9
>6.9
Total
1995 1 12 36 24 17 5 4 1 100 1996 4 21 37 28 5 3 2 1 100 1997 1 34 42 19 2 2 1 0 100 1998 1 20 45 26 8 0 0 1 100 1999 0 8 43 28 14 3 2 2 100 2000 3 27 40 12 13 3 1 1 100 2001 3 24 35 21 5 3 5 5 100 Total 2 21 40 23 9 2 2 1 100

Ketterings, Q.M., H. Krol, W.S. Reid and N. Herendeen (2003). Niagara County Soil Sample Survey 1995-2001. CSS Extension Bulletin E03-29. 40 pages.
19
5. pH
5.1 Samples for Home and Garden Number of home and garden samples within each pH range:
1995
1996
1997
1998
1999
2000
2001
Lowest: 6.3 4.4 6.5 6.1 5.2 4.8 5.0 Highest: 7.8 7.8 7.9 7.7 8.5 8.0 8.3 Mean: - - - - - - - Median: 7.3 7.1 7.4 7.2 7.5 7.0 7.5
Percent of home and garden samples within each pH range:
<4.5
4.5-4.9
5.0-5.4
5.5-5.9
6.0-6.4
6.5-6.9
7.0-7.4
7.5-7.9
8.0-8.4
>8.4
Total
1995 0 0 0 0 8 23 31 38 0 0 100 1996 3 0 3 6 13 19 31 25 0 0 100 1997 0 0 0 0 0 16 42 42 0 0 100 1998 0 0 0 0 14 24 29 33 0 0 100 1999 0 0 4 9 1 5 25 40 16 1 100 2000 0 7 0 7 14 14 21 29 7 0 100 2001 0 0 4 0 8 8 23 35 23 0 100 Total 0 0 2 5 6 12 28 36 9 0 100
<4.5
4.5-4.9
5.0-5.4
5.5-5.9
6.0-6.4
6.5-6.9
7.0-7.4
7.5-7.9
8.0-8.4
>8.4
Total
1995 0 0 0 0 1 3 4 5 0 0 13 1996 1 0 1 2 4 6 10 8 0 0 32 1997 0 0 0 0 0 5 13 13 0 0 31 1998 0 0 0 0 3 5 6 7 0 0 21 1999 0 0 3 7 1 4 20 32 13 1 81 2000 0 1 0 1 2 2 3 4 1 0 14 2001 0 0 1 0 2 2 6 9 6 0 26 Total 1 1 5 10 13 27 62 78 20 1 218

Ketterings, Q.M., H. Krol, W.S. Reid and N. Herendeen (2003). Niagara County Soil Sample Survey 1995-2001. CSS Extension Bulletin E03-29. 40 pages.
20
5.2 Samples for Commercial Production Number of samples for commercial production within each pH range:
<4.5
4.5-4.9
5.0-5.4
5.5-5.9
6.0-6.4
6.5-6.9
7.0-7.4
7.5-7.9
8.0-8.4
>8.4
Total
1995 1 2 8 23 38 33 12 0 0 0 117 1996 1 4 19 41 65 42 11 4 0 0 187 1997* 4 5 11 32 42 24 9 1 0 0 128 1998 0 2 4 25 51 59 28 6 0 0 175 1999 0 0 10 25 27 38 18 2 0 0 120 2000 3 4 11 22 33 34 22 6 0 0 135 2001 0 1 0 11 32 10 6 3 0 0 63 Total 9 18 63 179 288 240 106 22 0 0 925
*Three samples were not analyzed for pH in 1997.
1995
1996
1997
1998
1999
2000
2001
Lowest: 4.3 4.4 3.4 4.8 5.0 4.0 4.7 Highest: 7.3 7.7 7.5 7.9 7.5 7.8 7.9 Mean: - - - - - - - Median: 6.3 6.1 6.1 6.5 6.4 6.4 6.2
Percent of samples for commercial production within each pH range:
<4.5
4.5-4.9
5.0-5.4
5.5-5.9
6.0-6.4
6.5-6.9
7.0-7.4
7.5-7.9
8.0-8.4
>8.4
Total
1995 1 2 7 20 32 28 10 0 0 0 100 1996 1 2 10 22 35 22 6 2 0 0 100 1997 3 4 9 25 33 19 7 1 0 0 100 1998 0 1 2 14 29 34 16 3 0 0 100 1999 0 0 8 21 23 32 15 2 0 0 100 2000 2 3 8 16 24 25 16 4 0 0 100 2001 0 2 0 17 51 16 10 5 0 0 100 Total 1 2 7 19 31 26 11 2 0 0 100

Ketterings, Q.M., H. Krol, W.S. Reid and N. Herendeen (2003). Niagara County Soil Sample Survey 1995-2001. CSS Extension Bulletin E03-29. 40 pages.
21
6. Phosphorus
6.1 Samples for Home and Garden Number of home and garden samples within each range Morgan extractable P range (lbs/acre Morgan P):
<1
1-3
4-8
9-39
40-60
61-80
81-100
101-150
151-200
>200
Total
VL L M H VH VH VH VH VH VH 1995 0 4 1 5 0 0 0 0 0 3 13 1996 0 9 6 12 0 1 1 2 0 1 32 1997 0 2 13 9 4 2 0 1 0 0 31 1998 0 3 3 8 3 0 1 1 1 1 21 1999 0 10 17 31 4 6 2 3 0 8 81 2000 0 0 2 6 1 1 1 2 0 1 14 2001 0 2 8 3 6 3 0 1 0 3 26 Total 0 30 50 74 18 13 5 10 1 17 218
VL = very low, L = low, M = medium, H = high, VH = very high.
1995 1996 1997 1998 1999 2000 2001 Lowest: 1 1 1 1 1 4 2 Highest: 864 273 120 216 1773 795 518 Mean: 121 29 23 43 161 104 70 Median: 16 10 10 19 16 37 40
Percent of home and garden samples within each Morgan extractable phosphorus range:
<1
1-3
4-8
9-39
40-60
61-80
81-100
101-150
151-200
>200
Total
VL L M H VH VH VH VH VH VH 1995 0 31 8 38 0 0 0 0 0 23 100 1996 0 28 19 38 0 3 3 6 0 3 100 1997 0 6 42 29 13 6 0 3 0 0 100 1998 0 14 14 38 14 0 5 5 5 5 100 1999 0 12 21 38 5 7 2 4 0 10 100 2000 0 0 14 43 7 7 7 14 0 7 100 2001 0 8 31 12 23 12 0 4 0 12 100 Total 0 14 23 34 8 6 2 5 0 8 100
VL = very low, L = low, M = medium, H = high, VH = very high.

Ketterings, Q.M., H. Krol, W.S. Reid and N. Herendeen (2003). Niagara County Soil Sample Survey 1995-2001. CSS Extension Bulletin E03-29. 40 pages.
22
6.2 Samples for Commercial Production Number of samples submitted for commercial production within each Morgan extractable phosphorus (lbs P/acre) range:
<1
1-3
4-8
9-39
40-60
61-80
81-100
101-150
151-200
>200
Total
VL L M H VH VH VH VH VH VH 1995 0 36 33 42 3 2 0 0 0 1 117 1996 0 61 58 57 8 2 0 1 0 0 187 1997 0 20 41 63 6 0 0 1 0 0 131 1998 0 28 63 78 1 1 0 4 0 0 175 1999 0 28 42 40 6 2 2 0 0 0 120 2000 0 31 50 51 2 0 0 0 1 0 135 2001 0 14 15 29 3 1 0 1 0 0 63 Total 0 218 302 360 29 8 2 7 1 1 928
VL = very low, L = low, M = medium, H = high, VH = very high.
1995
1996
1997
1998
1999
2000
2001
Lowest: 1 1 1 1 1 1 1 Highest: 243 167 145 145 94 153 115 Mean: 13 12 15 14 14 10 15 Median: 6 5 9 8 7 7 9
Percent of samples submitted for commercial production within each Morgan P range:
<1
1-3
4-8
9-39
40-60
61-80
81-100
101-150
151-200
>200
Total
1995 0 31 28 36 3 2 0 0 0 1 100 1996 0 33 31 30 4 1 0 1 0 0 100 1997 0 15 31 48 5 0 0 1 0 0 100 1998 0 16 36 45 1 1 0 2 0 0 100 1999 0 23 35 33 5 2 2 0 0 0 100 2000 0 23 37 38 1 0 0 0 1 0 100 2001 0 22 24 46 5 2 0 2 0 0 100 Total 0 23 33 39 3 1 0 1 0 0 100
VL = very low, L = low, M = medium, H = high, VH = very high.

Ketterings, Q.M., H. Krol, W.S. Reid and N. Herendeen (2003). Niagara County Soil Sample Survey 1995-2001. CSS Extension Bulletin E03-29. 40 pages.
23
7. Potassium
7.1 Samples for Home and Garden Number of home and garden samples within each K range (lbs K/acre Morgan extraction):
Soil Management Group 1 <35 35-64 65-94 95-149 >149 Total Very Low Low Medium High Very High 1995 0 0 0 0 0 0 1996 0 0 0 0 0 0 1997 0 0 0 0 0 0 1998 0 0 0 0 0 0 1999 0 0 0 0 0 0 2000 0 0 0 0 0 0 2001 0 0 0 0 0 0 Total (#) 0 0 0 0 0 0 Total (%) - - - - - -
Soil Management Group 2 <40 40-69 70-99 100-164 >164 Total Very Low Low Medium High Very High 1995 0 0 0 1 2 3 1996 0 0 3 4 3 10 1997 0 3 3 5 5 16 1998 0 0 0 3 6 9 1999 0 0 0 1 7 8 2000 0 0 0 0 6 6 2001 0 0 0 0 3 3 Total (#) 0 3 6 14 32 55 Total (%) 0 5 11 25 58 100
Soil Management Group 3 <45 45-79 80-119 120-199 >199 Total Very Low Low Medium High Very High 1995 0 0 1 0 0 1 1996 0 1 4 3 0 8 1997 0 1 2 1 5 9 1998 0 0 0 0 1 1 1999 0 0 0 6 18 24 2000 0 0 2 1 0 3 2001 0 1 0 0 2 3 Total (#) 0 3 9 11 26 49 Total (%) 0 6 18 22 53 100

Ketterings, Q.M., H. Krol, W.S. Reid and N. Herendeen (2003). Niagara County Soil Sample Survey 1995-2001. CSS Extension Bulletin E03-29. 40 pages.
24
Soil Management Group 4 <55 55-99 100-149 150-239 >239 Total Very
Low Low Medium High Very
High
1995 0 1 0 2 3 6 1996 0 3 1 3 3 10 1997 0 2 1 1 0 4 1998 0 1 1 5 3 10 1999 0 0 9 19 14 42 2000 0 0 0 1 3 4 2001 2 2 3 6 6 19 Total (#) 2 9 15 37 32 95 Total (%) 2 9 16 39 34 100
Soil Management Group 5
<60 60-114 115-164 165-269 >269 Total Very
Low Low Medium High Very
High
1995 0 0 1 2 0 3 1996 0 2 1 0 1 4 1997 0 0 1 0 1 2 1998 0 0 0 1 0 1 1999 0 0 2 4 1 7 2000 0 0 1 0 0 1 2001 0 0 0 0 1 1 Total (#) 0 2 6 7 4 19 Total (%) 0 11 32 37 21 100
Soil Management Group 6
<60 60-114 115-164 165-269 >269 Total Very
Low Low Medium High Very
High
1995 0 0 0 0 0 0 1996 0 0 0 0 0 0 1997 0 0 0 0 0 0 1998 0 0 0 0 0 0 1999 0 0 0 0 0 0 2000 0 0 0 0 0 0 2001 0 0 0 0 0 0 Total (#) 0 0 0 0 0 0 Total (%) - - - - - -

Ketterings, Q.M., H. Krol, W.S. Reid and N. Herendeen (2003). Niagara County Soil Sample Survey 1995-2001. CSS Extension Bulletin E03-29. 40 pages.
25
Number of home and garden samples within each potassium classification: Summary (#)
Very Low
Low
Medium
High
Very High
Total
1995 0 1 2 5 5 13 1996 0 6 9 10 7 32 1997 0 6 7 7 11 31 1998 0 1 1 9 10 21 1999 0 0 11 30 40 81 2000 0 0 3 2 9 14 2001 2 3 3 6 12 26 Total # 2 17 36 69 94 218
1995
1996
1997
1998
1999
2000
2001
Lowest: 70 55 50 98 119 88 33 Highest: 3126 913 416 562 5387 1467 1099 Mean: 482 193 160 205 681 453 266 Median: 193 140 133 178 218 381 214
Percent of samples submitted for home and garden within each potassium classification. Summary (%)
Very Low
Low
Medium
High
Very High
Total
1995 0 8 15 38 38 100 1996 0 19 28 31 22 100 1997 0 19 23 23 35 100 1998 0 5 5 43 48 100 1999 0 0 14 37 49 100 2000 0 0 21 14 64 100 2001 8 12 12 23 46 100 Grand Total 1 8 17 32 43 100

Ketterings, Q.M., H. Krol, W.S. Reid and N. Herendeen (2003). Niagara County Soil Sample Survey 1995-2001. CSS Extension Bulletin E03-29. 40 pages.
26
7.2 Samples for Commercial Production Number of samples submitted for commercial production within each potassium (lbs K/acre Morgan extraction) range:
Soil Management Group 1 <35 35-64 65-94 95-149 >149 Total Very Low Low Medium High Very High 1995 0 0 0 1 1 2 1996 0 0 0 0 0 0 1997 0 0 0 0 0 0 1998 0 0 0 1 1 2 1999 0 0 2 1 4 7 2000 0 0 0 0 0 0 2001 0 0 0 0 0 0 Total (#) 0 0 2 3 6 11 Total (%) 0 0 18 27 55 100
Soil Management Group 2 <40 40-69 70-99 100-164 >164 Total Very Low Low Medium High Very High 1995 1 3 14 26 23 67 1996 0 5 19 28 39 91 1997 0 1 5 9 24 39 1998 1 3 17 33 36 90 1999 1 9 14 19 32 75 2000 0 4 11 14 27 56 2001 1 1 6 13 15 36 Total (#) 4 26 86 142 196 454 Total (%) 1 6 19 31 43 100
Soil Management Group 3 <45 45-79 80-119 120-199 >199 Total Very Low Low Medium High Very High 1995 1 0 6 6 11 24 1996 0 6 12 13 15 46 1997 0 2 4 13 28 47 1998 0 2 4 11 31 48 1999 0 0 1 3 21 25 2000 0 5 6 19 13 43 2001 0 0 0 5 11 16 Total (#) 1 15 33 70 130 249 Total (%) 0 6 13 28 52 100
Ketterings, Q.M., H. Krol, W.S. Reid and N. Herendeen (2003). Niagara County Soil Sample Survey 1995-2001. CSS Extension Bulletin E03-29. 40 pages.
27
Soil Management Group 4
<55 55-99 100-149 150-239 >239 Total Very
Low Low Medium High Very
High
1995 0 1 3 4 11 19 1996 1 2 13 8 15 39 1997 0 0 6 13 21 40 1998 0 4 5 10 13 32 1999 0 2 1 1 7 11 2000 0 2 3 5 18 28 2001 0 0 1 2 6 9 Total (#) 1 11 32 43 91 178 Total (%) 1 6 18 24 51 100
Soil Management Group 5
<60 60-114 115-164 165-269 >269 Total Very
Low Low Medium High Very
High
1995 0 2 2 1 0 5 1996 1 1 3 4 2 11 1997 0 0 1 2 1 4 1998 0 1 1 1 0 3 1999 0 0 1 1 0 2 2000 1 0 3 2 1 7 2001 0 0 0 2 0 2 Total (#) 2 4 11 13 4 34 Total (%) 6 12 32 38 12 100
Soil Management Group 6
<60 60-114 115-164 165-269 >269 Total Very
Low Low Medium High Very
High
1995 0 0 0 0 0 0 1996 0 0 0 0 0 0 1997 0 0 0 0 0 0 1998 0 0 0 0 0 0 1999 0 0 0 0 0 0 2000 0 0 0 0 0 0 2001 0 0 0 0 0 0 Total (#) 0 0 0 0 0 0 Total (%) - - - - - -

Ketterings, Q.M., H. Krol, W.S. Reid and N. Herendeen (2003). Niagara County Soil Sample Survey 1995-2001. CSS Extension Bulletin E03-29. 40 pages.
28
Number of samples submitted for commercial production within each potassium classification. Summary (#)
Very Low
Low
Medium
High
Very High
Un-
known
Total
1995 2 6 25 38 46 0 117 1996 2 14 47 53 71 0 187 1997 0 3 16 37 74 1 131 1998 1 10 27 56 81 0 175 1999 1 11 19 25 64 0 120 2000 1 11 23 40 59 1 135 2001 1 1 7 22 32 0 63 Grand Total 8 56 164 271 427 2 928
1995
1996
1997
1998
1999
2000
2001
Lowest: 36 38 49 29 29 48 34 Highest: 974 927 713 677 1370 1079 601 Mean: 186 197 245 212 243 235 225 Median: 145 153 226 170 216 186 186
Percent of samples submitted for commercial production within each potassium classification.
% summary
Very Low
Low
Medium
High
Very High
Un-
known
Total
1995 2 5 21 32 39 0 100 1996 1 7 25 28 38 0 100 1997 0 2 12 28 56 1 100 1998 1 6 15 32 46 0 100 1999 1 9 16 21 53 0 100 2000 1 8 17 30 44 1 100 2001 2 2 11 35 51 0 100 Grand Total 1 6 18 29 46 0 100

Ketterings, Q.M., H. Krol, W.S. Reid and N. Herendeen (2003). Niagara County Soil Sample Survey 1995-2001. CSS Extension Bulletin E03-29. 40 pages.
29
8. Magnesium
8.1 Samples for Home and Garden
Number of home and garden samples within each Mg range (lbs Morgan Mg/acre):
<20
20-65
66-100
101-199
>199
Total
Very Low
Low Medium High Very High
1995 0 0 0 2 11 13 1996 0 0 1 0 31 32 1997 0 0 0 0 31 31 1998 0 0 0 0 21 21 1999 0 0 0 1 80 81 2000 0 0 1 0 13 14 2001 0 0 0 0 26 26 Total 0 0 2 3 213 218
1995
1996
1997
1998
1999
2000
2001
Lowest: 107 82 291 298 148 73 274 Highest: 1589 2234 1693 1017 5724 1809 1469 Mean: 700 620 708 577 1119 757 721 Median: 597 569 650 582 767 658 616
Percent of home and garden samples within each Mg range (lbs Morgan Mg/acre):
<20
20-65
66-100
101-199
>199
Total
Very Low
Low Medium High Very High
1995 0 0 0 15 85 100 1996 0 0 3 0 97 100 1997 0 0 0 0 100 100 1998 0 0 0 0 100 100 1999 0 0 0 1 99 100 2000 0 0 7 0 93 100 2001 0 0 0 0 100 100 Total 0 0 1 1 98 100

Ketterings, Q.M., H. Krol, W.S. Reid and N. Herendeen (2003). Niagara County Soil Sample Survey 1995-2001. CSS Extension Bulletin E03-29. 40 pages.
30
8.2 Samples for Commercial Production Number of samples submitted for commercial production within each Mg range (lbs Mg/acre Morgan extraction):
<20
20-65
66-100
101-199
>199
Total
Very Low
Low Medium High Very High
1995 1 1 2 21 92 117 1996 1 2 10 31 143 187 1997 0 2 8 35 86 131 1998 0 2 1 31 141 175 1999 0 0 0 10 110 120 2000 0 2 11 29 93 135 2001 0 1 0 13 49 63 Total 2 10 32 170 714 928
1995
1996
1997
1998
1999
2000
2001
Lowest: 8 11 50 52 101 55 23 Highest: 1944 2647 1344 1371 1527 1676 1453 Mean: 461 461 303 395 521 423 427 Median: 353 326 256 320 406 333 339
Percent of samples submitted for commercial production within each magnesium range (lbs Mg/acre Morgan extraction):
<20
20-65
66-100
101-199
>199
Total
Very Low
Low Medium High Very High
1995 1 1 2 18 79 100 1996 1 1 5 17 76 100 1997 0 2 6 27 66 100 1998 0 1 1 18 81 100 1999 0 0 0 8 92 100 2000 0 1 8 21 69 100 2001 0 2 0 21 78 100 Total 0 1 3 18 77 100

Ketterings, Q.M., H. Krol, W.S. Reid and N. Herendeen (2003). Niagara County Soil Sample Survey 1995-2001. CSS Extension Bulletin E03-29. 40 pages.
31
9. Iron
9.1 Samples for Home and Garden Iron (lbs Fe/acre Morgan extraction) in samples for home and garden: Total number of samples: Percentages:
0-49
>49
Total
0-49
>49
Total
Normal Excessive Normal Excessive 1995 12 1 13 92 8 100 1996 28 4 32 88 13 100 1997 31 0 31 100 0 100 1998 21 0 21 100 0 100 1999 73 8 81 90 10 100 2000 12 2 14 86 14 100 2001 24 2 26 92 8 100 Total 201 17 218 92 8 100
1995
1996
1997
1998
1999
2000
2001
Lowest: 2 2 2 2 1 3 2 Highest: 59 209 17 33 155 151 86 Mean: 14 33 8 8 16 25 15 Median: 6 20 8 5 5 13 8
Ketterings, Q.M., H. Krol, W.S. Reid and N. Herendeen (2003). Niagara County Soil Sample Survey 1995-2001. CSS Extension Bulletin E03-29. 40 pages.
32
9.2 Samples for Commercial Production Iron (lbs Fe/acre Morgan extraction) in samples submitted for commercial production: Total number of samples: Percentages:
0-49
>49
Total
0-49
>49
Total
Normal Excessive Normal Excessive 1995 98 19 117 84 16 100 1996 179 8 187 96 4 100 1997 127 4 131 97 3 100 1998 170 5 175 97 3 100 1999 117 3 120 98 3 100 2000 128 7 135 95 5 100 2001 58 5 63 92 8 100 Total 877 51 928 95 5 100
1995
1996
1997
1998
1999
2000
2001
Lowest: 1 2 1 1 1 1 1 Highest: 432 253 133 95 112 220 132 Mean: 27 17 14 11 12 16 17 Median: 12 10 8 7 8 7 8

Ketterings, Q.M., H. Krol, W.S. Reid and N. Herendeen (2003). Niagara County Soil Sample Survey 1995-2001. CSS Extension Bulletin E03-29. 40 pages.
33
10. Manganese
10.1 Samples for Home and Garden Manganese (lbs Mn/acre Morgan extraction) in samples for home and garden: Total number of samples: Percentages:
0-99
>99
Total
0-99
>99
Total
Normal Excessive Normal Excessive 1995 12 1 13 92 8 100 1996 31 1 32 97 3 100 1997 28 3 31 90 10 100 1998 21 0 21 100 0 100 1999 69 12 81 85 15 100 2000 13 1 14 93 7 100 2001 21 5 26 81 19 100 Total 195 23 218 89 11 100
1995
1996
1997
1998
1999
2000
2001
Lowest: 14 13 8 19 14 13 21 Highest: 217 162 222 61 205 138 202 Mean: 53 45 52 35 52 57 69 Median: 39 32 45 32 38 57 53

Ketterings, Q.M., H. Krol, W.S. Reid and N. Herendeen (2003). Niagara County Soil Sample Survey 1995-2001. CSS Extension Bulletin E03-29. 40 pages.
34
10.2 Samples for Commercial Production Manganese (lbs Mn/acre Morgan extraction) in samples for commercial production: Total number of samples: Percentages:
0-99
>99
Total
0-99
>99
Total
Normal Excessive Normal Excessive 1995 116 1 117 99 1 100 1996 186 1 187 99 1 100 1997 125 6 131 95 5 100 1998 171 4 175 98 2 100 1999 118 2 120 98 2 100 2000 131 4 135 97 3 100 2001 62 1 63 98 2 100 Total 909 19 928 98 2 100
1995
1996
1997
1998
1999
2000
2001
Lowest: 5 4 7 8 8 6 13 Highest: 103 367 179 123 151 170 147 Mean: 33 30 36 31 34 30 39 Median: 28 26 27 25 31 24 33

Ketterings, Q.M., H. Krol, W.S. Reid and N. Herendeen (2003). Niagara County Soil Sample Survey 1995-2001. CSS Extension Bulletin E03-29. 40 pages.
35
11. Zinc
11.1 Samples for Home and Garden Zinc (lbs Zn/acre Morgan extraction) in samples for home and garden: Total number of samples: Percentages:
1995
1996
1997
1998
1999
2000
2001
Lowest: 0.6 1.0 0.9 1.4 0.3 1.5 0.9 Highest: 16.9 15.0 22.0 18.2 36.3 41.0 99.5 Mean: 4.7 3.9 4.6 6.6 6.5 7.9 14.1 Median: 1.7 2.3 2.2 4.1 3.0 2.9 7.6
<0.5
0.5-1.0
>1
Total
<0.5
0.5-1.0
>1
Total
Low Medium High Low Medium High 1995 0 2 11 13 0 15 85 100 1996 0 2 30 32 0 6 94 100 1997 0 2 29 31 0 6 94 100 1998 0 0 21 21 0 0 100 100 1999 1 7 73 81 1 9 90 100 2000 0 0 14 14 0 0 100 100 2001 0 2 24 26 0 8 92 100 Total 1 15 202 218 0 7 93 100

Ketterings, Q.M., H. Krol, W.S. Reid and N. Herendeen (2003). Niagara County Soil Sample Survey 1995-2001. CSS Extension Bulletin E03-29. 40 pages.
36
11.2 Samples for Commercial Production Zinc (lbs Zn/acre Morgan extraction) in samples for commercial production: Total number of samples: Percentages:
<0.5
0.5-1.0
>1
Total
<0.5
0.5-1.0
>1
Total
Low Medium High Low Medium High 1995 5 25 87 117 4 21 74 100 1996 6 46 135 187 3 25 72 100 1997 1 28 102 131 1 21 78 100 1998 8 76 91 175 5 43 52 100 1999 4 31 85 120 3 26 71 100 2000 9 27 99 135 7 20 73 100 2001 0 14 49 63 0 22 78 100 Total 33 247 648 928 4 27 70 100
1995
1996
1997
1998
1999
2000
2001
Lowest: 0.4 0.1 0.4 0.3 0.2 0.1 0.5 Highest: 10.4 14.4 19.6 41.4 13.1 87.8 21.1 Mean: 1.9 2.3 2.6 2.0 1.9 6.0 2.8 Median: 1.6 1.7 1.8 1.1 1.4 2.0 2.1

Ketterings, Q.M., H. Krol, W.S. Reid and N. Herendeen (2003). Niagara County Soil Sample Survey 1995-2001. CSS Extension Bulletin E03-29. 40 pages.
37
Appendix: Cornell Crop Codes
Crop codes are used in the Cornell Nutrient Analyses Laboratory.
Crop Code
Crop Description
Alfalfa
ABE Alfalfa trefoil grass, Establishment ABT Alfalfa trefoil grass, Established AGE Alfalfa grass, Establishment AGT Alfalfa grass, Established ALE Alfalfa, Establishment ALT Alfalfa, Established
Birdsfoot BCE Birdsfoot trefoil clover, Establishment BCT Birdsfoot trefoil clover, Established BGE Birdsfoot trefoil grass, Establishment BGT Birdsfoot trefoil grass, Established BSE Birdsfoot trefoil seed, Establishment BST Birdsfoot trefoil seed, Established BTE Birdsfoot trefoil, Establishment BTT Birdsfoot trefoil, Established
Barley
BSP Spring barley BSS Spring barley with legumes BUK Buckwheat BWI Winter barley BWS Winter barley with legumes
Clover CGE Clover grass, Establishment CGT Clover grass, Established CLE Clover, Establishment CLT Clover, Established CSE Clover seed production, Establishment CST Clover seed production, Established

Ketterings, Q.M., H. Krol, W.S. Reid and N. Herendeen (2003). Niagara County Soil Sample Survey 1995-2001. CSS Extension Bulletin E03-29. 40 pages.
38
Crop Code
Crop Description
Corn COG Corn grain COS Corn silage
Grasses, pastures, covercrops
GIE Grasses intensively managed, Establishment GIT Grasses intensively managed, Established GRE Grasses, Establishment GRT Grasses, Established PGE Pasture, Establishment PGT Pasture improved grasses, Established PIE Pasture intensively grazed, Establishment PIT Pasture intensively grazed, Established PLE Pasture with legumes, Establishment PLT Pasture with legumes, Established PNT Pasture native grasses PNE Pasture native grasses, Established RYC Rye cover crop RYS Rye seed production TRP Triticale peas
Small grains MIL Millet OAS Oats with legume OAT Oats SOF Sorghum forage SOG Sorghum grain SOY Soybeans SSH Sorghum sudan hybrid SUD Sudangrass WHS Wheat with legume WHT Wheat
Others ACT ALG APP
Apricots Ornamentals, Adapted to pH 4.5-6 Apples

Ketterings, Q.M., H. Krol, W.S. Reid and N. Herendeen (2003). Niagara County Soil Sample Survey 1995-2001. CSS Extension Bulletin E03-29. 40 pages.
39
Crop Code
Crop Description
APR ATF ASP BDR/BND BLU/BLB CBP CBS CEM CHS CHT CKS END FAR FLA GEN GPA GPF GPV HRB IDL LAW LET MIX/MVG MML NEC ONP ONS OTH PAR PEA PCH PER PLM POP POT/PTO PRK PRN PUM ROD
Asparagus (homeowners) Athletic Field Asparagus (commercial) Beans-dry Blueberries Cabbage, Transplanted Cabbage, Seeded Cemetery Cherries, Sweet Cherries, Tart Cucumber, Seeded Endives Fairway Flowering Annuals Green Grapes, American Grapes, French-American Grapes, Vinifera Herbs Idle land Lawn Lettuce Mixed vegetables Muskmelon Nectarines Onion, Transplanted Onion, Seeded Other Pears Peas Peaches Perennials Plums Popcorn Potatoes Park Prunes Pumpkins Roadside

Ketterings, Q.M., H. Krol, W.S. Reid and N. Herendeen (2003). Niagara County Soil Sample Survey 1995-2001. CSS Extension Bulletin E03-29. 40 pages.
40
Crop Code
Crop Description
ROS ROU RSF RSP RSS SAG SQS SQW STE STR STS SUN SWC TME TOM TRE TRF TRT
Roses Rough Raspberries, Fall Raspberries (homeowners) Raspberries, Summer Ornamentals adapted to pH 6.0 to 7.5 Squash, Summer Squash, Winter Strawberries, Ever Strawberries (homeowners) Strawberries, Spring Sunflowers Sweet corn Tomatoes, Early Tomatoes Christmas trees, Established Tree fruits Christmas trees, Topdressing