NGA Project Strong-Motion Database - ust.hk
22
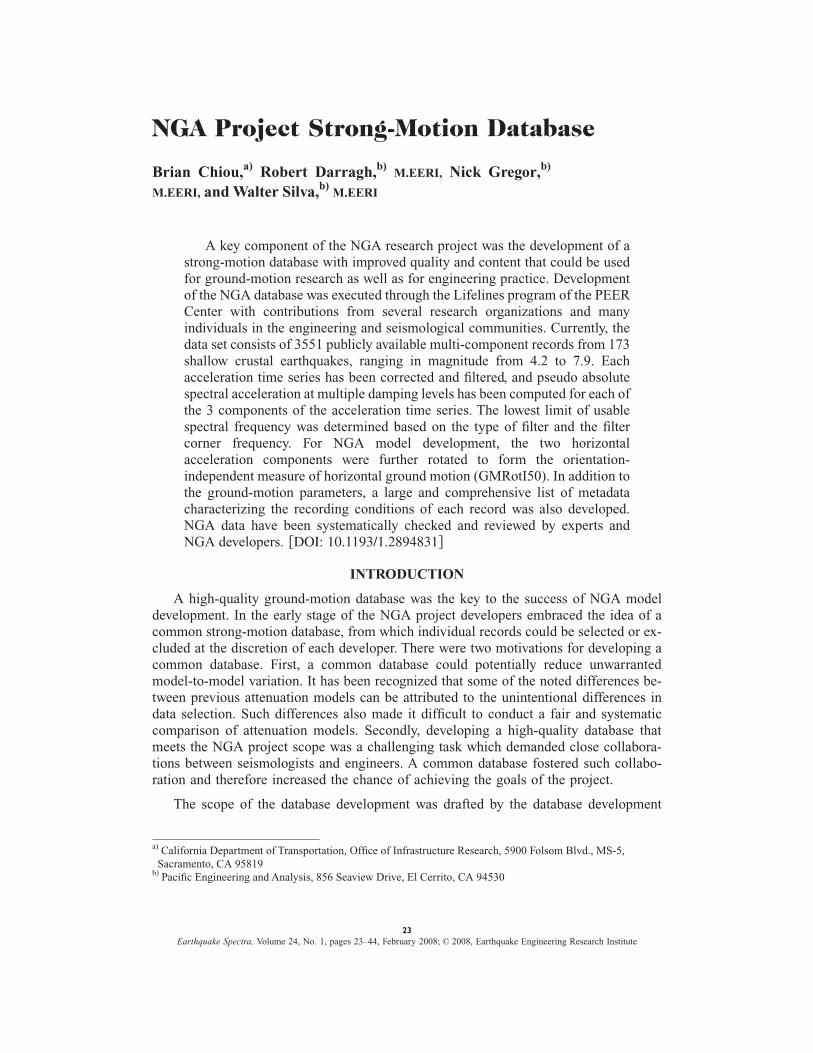
NGA Project Strong-Motion Database Brian Chiou, a) Robert Darragh, b) M.EERI, Nick Gregor, b) M.EERI, and Walter Silva, b) M.EERI A key component of the NGA research project was the development of a strong-motion database with improved quality and content that could be used for ground-motion research as well as for engineering practice. Development of the NGA database was executed through the Lifelines program of the PEER Center with contributions from several research organizations and many individuals in the engineering and seismological communities. Currently, the data set consists of 3551 publicly available multi-component records from 173 shallow crustal earthquakes, ranging in magnitude from 4.2 to 7.9. Each acceleration time series has been corrected and filtered, and pseudo absolute spectral acceleration at multiple damping levels has been computed for each of the 3 components of the acceleration time series. The lowest limit of usable spectral frequency was determined based on the type of filter and the filter corner frequency. For NGA model development, the two horizontal acceleration components were further rotated to form the orientation- independent measure of horizontal ground motion (GMRotI50). In addition to the ground-motion parameters, a large and comprehensive list of metadata characterizing the recording conditions of each record was also developed. NGA data have been systematically checked and reviewed by experts and NGA developers. DOI: 10.1193/1.2894831 INTRODUCTION A high-quality ground-motion database was the key to the success of NGA model development. In the early stage of the NGA project developers embraced the idea of a common strong-motion database, from which individual records could be selected or ex- cluded at the discretion of each developer.There were two motivations for developing a common database. First, a common database could potentially reduce unwarranted model-to-model variation. It has been recognized that some of the noted differences be- tween previous attenuation models can be attributed to the unintentional differences in data selection. Such differences also made it difficult to conduct a fair and systematic comparison of attenuation models. Secondly, developing a high-quality database that meets the NGA project scope was a challenging task which demanded close collabora- tions between seismologists and engineers. A common database fostered such collabo- ration and therefore increased the chance of achieving the goals of the project. The scope of the database development was drafted by the database development a) California Department of Transportation, Office of Infrastructure Research, 5900 Folsom Blvd., MS-5, Sacramento, CA 95819 b) Pacific Engineering and Analysis, 856 Seaview Drive, El Cerrito, CA 94530 23 Earthquake Spectra, Volume 24, No. 1, pages 23–44, February 2008; © 2008, Earthquake Engineering Research Institute
Transcript of NGA Project Strong-Motion Database - ust.hk
NGA Project Strong-Motion Database
Brian Chiou,a) Robert Darragh,b)M.EERI, Nick Gregor,b)
M.EERI, and Walter Silva,b)M.EERI
A key component of the NGA research project was the development of astrong-motion database with improved quality and content that could be usedfor ground-motion research as well as for engineering practice. Developmentof the NGA database was executed through the Lifelines program of the PEERCenter with contributions from several research organizations and manyindividuals in the engineering and seismological communities. Currently, thedata set consists of 3551 publicly available multi-component records from 173shallow crustal earthquakes, ranging in magnitude from 4.2 to 7.9. Eachacceleration time series has been corrected and filtered, and pseudo absolutespectral acceleration at multiple damping levels has been computed for each ofthe 3 components of the acceleration time series. The lowest limit of usablespectral frequency was determined based on the type of filter and the filtercorner frequency. For NGA model development, the two horizontalacceleration components were further rotated to form the orientation-independent measure of horizontal ground motion (GMRotI50). In addition tothe ground-motion parameters, a large and comprehensive list of metadatacharacterizing the recording conditions of each record was also developed.NGA data have been systematically checked and reviewed by experts andNGA developers. �DOI: 10.1193/1.2894831�
INTRODUCTION
A high-quality ground-motion database was the key to the success of NGA modeldevelopment. In the early stage of the NGA project developers embraced the idea of acommon strong-motion database, from which individual records could be selected or ex-cluded at the discretion of each developer. There were two motivations for developing acommon database. First, a common database could potentially reduce unwarrantedmodel-to-model variation. It has been recognized that some of the noted differences be-tween previous attenuation models can be attributed to the unintentional differences indata selection. Such differences also made it difficult to conduct a fair and systematiccomparison of attenuation models. Secondly, developing a high-quality database thatmeets the NGA project scope was a challenging task which demanded close collabora-tions between seismologists and engineers. A common database fostered such collabo-ration and therefore increased the chance of achieving the goals of the project.
The scope of the database development was drafted by the database development
a) California Department of Transportation, Office of Infrastructure Research, 5900 Folsom Blvd., MS-5,Sacramento, CA 95819
b)
Pacific Engineering and Analysis, 856 Seaview Drive, El Cerrito, CA 9453023Earthquake Spectra, Volume 24, No. 1, pages 23–44, February 2008; © 2008, Earthquake Engineering Research Institute

24 B. CHIOU ET AL.
team and reviewed by a large group of participants at the NGA kickoff meeting on Oc-tober 24, 2002 and two subsequent NGA workshops in 2003. The final scope covered awide range of information, including many predictor variables judged by NGA develop-ers and other researchers to be worthy of consideration for the model development andother future research.
This paper is to serve as a general reference for the NGA database. The first part ofthis paper gives an overview of the NGA database development. The flat file document(Appendix A, on line) provides the basic documentation of the NGA data. The secondpart of this paper documents in more detail the strong-motion record processing, finitefault models, and site conditions, all of which are essential to the NGA model develop-ment.
NGA DATABASE
The NGA database was built on the existing PEER Strong-Motion Database (http://peer.berkeley.edu/smcat/), which was developed by Pacific Engineering & Analysis (Pa-cific Engineering) during the 1990s. The goals of the NGA database development werestraightforward, (1) fill the data gap in existing PEER database with recent earthquakes,and (2) greatly expand the supporting information (metadata) to meet the needs of theambitious scope of model development set by the NGA project (Power et al., 2008, thisvolume). Another significant effort of the database development is the systematic re-views and checking of collected data. When conflicts were identified, resolution typi-cally involved data review and as appropriate soliciting comments from NGA developersand other researchers. The efforts of updating and expanding the PEER database beganin 2003. By the end of 2004 the main database was completed. The subsequent effortsfocused on reviews, errata reports, and limited updates as information, such as VS30 (av-erage shear-wave velocity to 30-meter depth) of strong-motion stations in Taiwan andCalifornia, became available. Many individuals and agencies contributed data and ex-pertise during the course of database development. In several cases the data were madeavailable to NGA project prior to publication.
The NGA data collection included acceleration time series of the multi-componentrecordings and supporting information about the earthquakes and recordings. Time se-ries were stored on a hard disk as text files. Each acceleration time series has been re-viewed by Pacific Engineering in a consistent manner, as will be discussed later. Com-patible velocity and displacement time series as well as response spectra at multiplespectral damping levels were calculated and also stored as text files, all in a commonformat. For the development of NGA models, the two horizontal acceleration compo-nents were further rotated to form the orientation-independent measure of horizontalground motion (GMRotI50, Boore et al., 2006). A record was also rotated to the strike-normal and strike-parallel directions, if the strong-motion sensor orientation and strike-parallel direction were known.
Metadata were stored in 4 tables: record catalog, earthquake source, strong-motionstation, and propagation path. To facilitate the collection, maintenance, and query ofmetadata, we implemented a simple data linkage model to relate the tables. The record

NGA PROJECT STRONG-MOTION DATABASE 25
catalog is the master table as it holds the list of available strong-motion records and, foreach record, the directory and file names of time series and response spectra. It alsoholds the unique identifiers of each record, earthquake, and strong-motion station fromwhich a record was collected. These identifiers served as the primary keys linking eachrecord to supporting information stored in the other three tables. Earthquake identifica-tion was created according to the order by which earthquakes were entered into the cata-log, not by the chronological order of earthquake occurrence. The same ordering crite-rion was applied to record identification and station identification. If a strong-motionstation was moved more than 100 meters from its original location we followed Califor-nia Strong Motion Instrumentation program (CSMIP) practice and assigned a new sta-tion identification to it. Examples of such stations are Tarzana—Cedar Hills and LakeHughes #12.
Earthquake identification number ranges from 0001 to 0175, but two earthquakes(ID 0146, the 1992 Joshua Tree, California, earthquake; and ID 0158, the 2000 LomaLinda, California, earthquake) were not populated with data due to time and resourceconstraints, making the total number of earthquakes in the NGA database 173. A mapshowing the geographic distribution of earthquakes is given in Figure 1. The type ofearthquake targeted by NGA was shallow crustal earthquake from active tectonic re-gions world wide, but with a focus on earthquakes in California. The new earthquakes(relative to those used by, say, Abrahamson and Silva, 1997) include the 1999 HectorMine, California, earthquake; 1999 Kocaeli and Duzce, Turkey, earthquakes; 1999 Chi-Chi, Taiwan, earthquake and five major aftershocks; several well-recorded moderateearthquakes in California; 2003 Nenana Mountain and Denali, Alaska, earthquakes, andseveral earthquakes from extensional tectonic regimes.
Figure 1. Map showing the epicenter distribution of the 173 earthquakes in the NGA database.

26 B. CHIOU ET AL.
RECORD CATALOG
The NGA record catalog currently contains 3551 strong-motion records obtainedfrom about 35 agencies. Most of them are from the strong-motion networks operated bythe California Geological Survey Strong Motion Instrumentation Program (CSMIP), theU.S. Geological Survey (USGS), and the Central Weather Bureau of Taiwan (CWB).About half of the records came from the 1999 Chi-Chi, Taiwan, earthquake and its 5aftershocks. Figure 2 shows the magnitude-distance distribution of the new strong-motion records, superimposed on the pre-1995 data. Earthquakes in regions outsideCalifornia are the primary source for data at large �M�7� magnitudes.
EARTHQUAKE SOURCE TABLE
The earthquake source table contains basic information about the seismic source, in-cluding origin date and time, moment magnitude (M), hypocenter location, faultingmechanism, occurrence of primary surface rupture, and tectonic environment, amongothers. In addition, finite fault models for 63 earthquakes were collected and systemati-cally evaluated. The finite fault model provided additional information such as the di-mension of fault rupture and depth to the top of rupture. Discussions of the collectionand evaluation of finite fault models are provided later in this paper in the section ‘FiniteFault Models’.
Figure 2. Magnitude and distance distribution of strong-motion records in the NGA database.
NGA PROJECT STRONG-MOTION DATABASE 27
STRONG-MOTION STATION TABLE
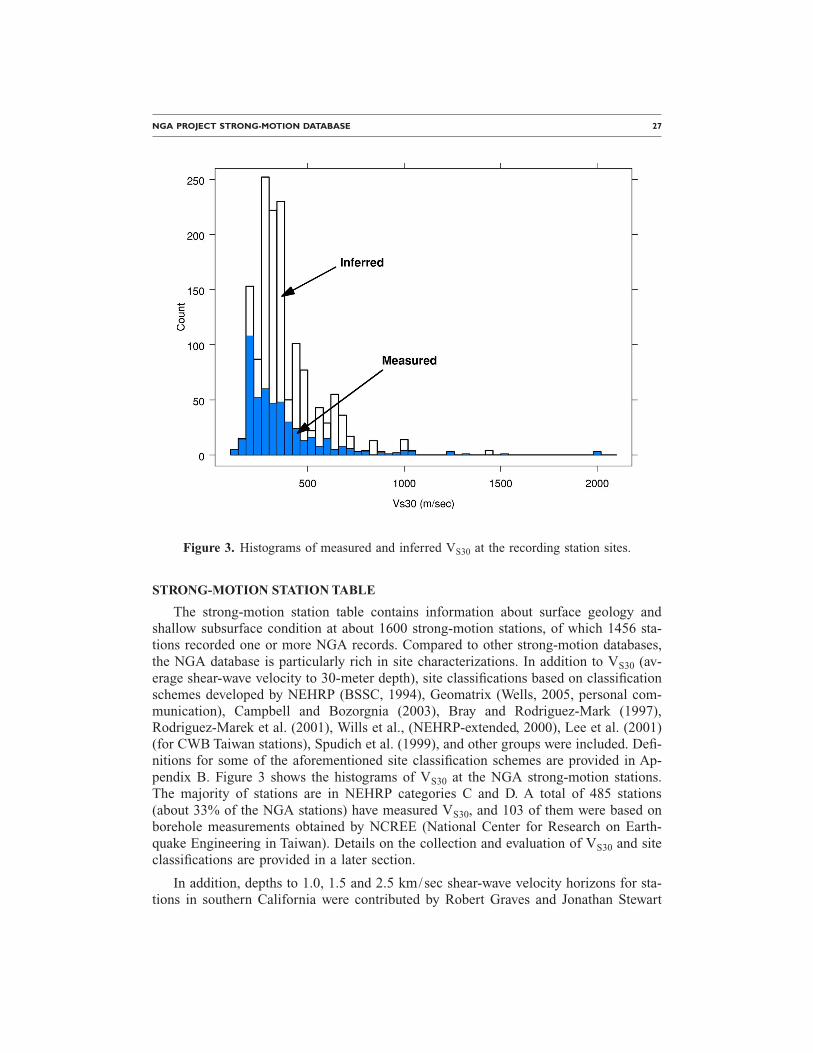
The strong-motion station table contains information about surface geology andshallow subsurface condition at about 1600 strong-motion stations, of which 1456 sta-tions recorded one or more NGA records. Compared to other strong-motion databases,the NGA database is particularly rich in site characterizations. In addition to VS30 (av-erage shear-wave velocity to 30-meter depth), site classifications based on classificationschemes developed by NEHRP (BSSC, 1994), Geomatrix (Wells, 2005, personal com-munication), Campbell and Bozorgnia (2003), Bray and Rodriguez-Mark (1997),Rodriguez-Marek et al. (2001), Wills et al., (NEHRP-extended, 2000), Lee et al. (2001)(for CWB Taiwan stations), Spudich et al. (1999), and other groups were included. Defi-nitions for some of the aforementioned site classification schemes are provided in Ap-pendix B. Figure 3 shows the histograms of VS30 at the NGA strong-motion stations.The majority of stations are in NEHRP categories C and D. A total of 485 stations(about 33% of the NGA stations) have measured VS30, and 103 of them were based onborehole measurements obtained by NCREE (National Center for Research on Earth-quake Engineering in Taiwan). Details on the collection and evaluation of VS30 and siteclassifications are provided in a later section.
In addition, depths to 1.0, 1.5 and 2.5 km/sec shear-wave velocity horizons for sta-tions in southern California were contributed by Robert Graves and Jonathan Stewart
Figure 3. Histograms of measured and inferred VS30 at the recording station sites.

28 B. CHIOU ET AL.
(2004, personal communication) based on the SCEC-3D model (Magistrale et al., 1996),by Boatwright et al. (2004) for stations in the San Francisco Bay area, and by Graves(1994) for stations in the Eel River basin in northern California. Depth data at a stationwere superseded by values obtained from borehole data, provided a borehole exists andpenetrates the velocity horizon. Additional information about sedimentary basins anddepth to basement rock were contributed by Somerville et al. (2002) and Campbell(2003, personal communication), respectively.
The station table also contains information on instrument location. Coordinates ofthe strong-motion stations (latitude and longitude) were compiled from information pub-lished by the operating agencies. Information on housing structure type and location ofinstrument inside the structure were used by NGA developers to determine if a record isappropriate to be used as a free-field record. The key instrument location information isGeomatrix’s classification of structure type and instrument location (Geomatrix’s 1st let-ter; see Appendix B for definition). Donald Wells systematically reviewed and updatedGeomatrix’s classification. Campbell and Bozorgnia (2003) contributed additional infor-mation about instrument housing and location inside a structure.
PROPAGATION PATH TABLE
Key metadata in the propagation path table include various distance measures, hang-ing wall indicator, directivity parameters, and radiation pattern coefficients. They werederived from information in the earthquake source table, the finite fault models, and thestation coordinates. Nancy Collins and her colleagues at the URS Corporation reviewedand checked the path metadata of an early version of the NGA database.
Calculation of the path metadata was somewhat complicated for a non-vertical finitefault with multiple fault segments. An algorithm developed by Robert Youngs (personalcommunication) was used to project the down-dip extension of a multi-segment fault. Abrief description of this algorithm is given in Appendix A of Spudich and Chiou (2008,this issue), along with the definitions of several directivity parameters for the case of amulti-segment fault.
The strike-parallel direction at a recording site is ambiguous when the finite faultmodel has a variable strike direction. The consensus definition reached by the NGA de-velopers is that the strike-parallel direction is the average fault strike direction over nomore than a 20-km stretch of fault length beginning at the closest point on the fault andmoving towards the epicenter.
NGA FLAT FILE AND DATA DOCUMENTATION
To deliver data to NGA developers in a single table for use in regression analysis, aflat file was created by merging ground-motion parameters and key metadata. The NGAflat file1 included PGA, PGV, PGD, and (5%-damped) pseudo absolute spectral accel-eration at 105 periods, all being GMRotI50. It also included 126 columns of metadata,even though many of these were not used by the NGA developers. The flat file also fa-
1
Available via http://peer.berkeley.edu/products/nga�project.html
NGA PROJECT STRONG-MOTION DATABASE 29
cilitated the timely and efficient dissemination of the core NGA data to the research andengineering communities. Flat files for other components of ground-motion parameters,such as pseudo spectral accelerations for strike-normal, strike-parallel, and vertical com-ponents, were also created.
A document was prepared in 2005 with the objective to provide basic definitions andsome explanations of each data column in the flat file. A revised copy is included here asAppendix A (on line). The flat file document has been and will continue to be the basicdocumentation of NGA data. The rest of this paper gives supplemental and enhanceddocumentation, specifically about strong-motion record processing, finite fault models,and site conditions.
STRONG-MOTION RECORD PROCESSING
Strong-motion record processing has two major objectives to make the data usefulfor engineering analysis: (1) correction for the response of the strong-motion instrumentitself; and (2) reduction of random noise in the recorded time series. A large portion ofthe NGA recordings were processed by Pacific Engineering using the PEER processingprocedure (Figure 4); the remaining recordings were entered into the database withoutadditional processing (pass-through records).
PEER RECORD PROCESSING PROCEDURE
The PEER processing concentrated on extending both the high- and low-frequencyranges of the useable signal in the recordings (spectral accelerations) on an individualcomponent basis. This processing scheme (Figure 4) consists generally of low- and high-pass causal or acausal Butterworth filters applied in the frequency domain. Corner fre-quencies were selected by visual examination of the Fourier amplitude spectra and inte-grated displacements. If necessary, a simple baseline correction was applied for caseswhere filtering did not remove non-physical trends in the displacement time series. Thebaseline correction consisted of fitting a polynomial (degree greater than two) to the dis-placement time series and subtraction of the corresponding acceleration from the filteredacceleration time series. Examples of PEER processing results at both high- and low-frequencies can be found in Darragh et al. (2004).
PASS-THROUGH RECORDS
There are two main reasons why many records were entered into the NGA databasewithout additional processing (Darragh et al., 2004). First, more recent digitally-recorded data generally do not benefit from additional processing and were entered intothe database after review of the Fourier amplitude spectra and time series (for example,for glitches). Second, some acceleration data (for example, CSMIP data starting with the1992 Cape Mendocino earthquake) were available only in Volume II format (filtered andbase-line corrected). These data were simply entered into the database in standard for-mat after a similar review. A pass-through record was identified as ‘#’ in the column‘PEA Processing Flag’ of NGA flat file. Filter type and filter corner frequency used inthe processing of a pass-through record were also entered into the database, if they wereavailable.

30 B. CHIOU ET AL.
REVIEWS OF TIME SERIES AND RESPONSE SPECTRA
The processing by Pacific Engineering was in general different than the processingdone by the agency that collected the data. This was necessarily the case as record pro-cessing largely relies on judgment as to where (in frequency) noise has significantly con-taminated a recording at both high- and low-frequency ranges. More importantly, record
Figure 4. PEER record processing procedure.
NGA PROJECT STRONG-MOTION DATABASE 31
processing (filtering) must, by definition, distort a record (side effects) and different pro-cessing procedures result in different side effects or distortions. Record processors arefaced with the dilemma as to which set of side effects are the most or least desirable. Theuse of causal versus acausal filters discussed later is an example of such a dilemma.
The NGA strong-motion time series and (5%-damped) pseudo spectral accelerationswere extensively reviewed at the NGA-COSMOS Joint Working Group Meeting on DataProcessing on March 17th, 2004, and a summary was presented at the InternationalWorkshop on Strong-Motion Record Processing sponsored by COSMOS. At the NGA-COSMOS joint meeting the results of a large number of time domain and spectral do-main (5%-damped pseudo spectral acceleration) comparisons were presented and dis-cussed. Two hundred and seventy-one time domain and spectral domain comparisonswere made between the NGA and the California Geological Survey Strong Motion In-strumentation Program (CSMIP) Volume II and III data sets. The comparison includedall records common to both data sets. The processed records are from 34 Californiaearthquakes ranging from the 1979 Imperial Valley earthquake to the 1989 Loma Prietaearthquake. Similar comparisons were made on strong motion data from a smaller set of16 earthquakes processed by the USGS. These data started with the 1974 Hollister earth-quake and ended with the 1989 Loma Prieta earthquake. Forty-eight time domain and108 spectral domain comparisons were presented.
The differences in response spectra between NGA records and those processed byeither CGS or USGS were mainly associated with: 1) selection of the high-pass and low-pass filter corner frequencies that define the effective passband; and 2) the type of filterused (causal or acausal). The presented comparisons showed that the different process-ing procedures produced zero difference, on average, in elastic response spectra acrossthe useable (common) frequency band. Outside of the common useable bandwidth, largespectra differences may be observed due to differences in the filter corner frequencies.Incidentally, on a number of records the PEER processing resulted in an expanded band-width due to the selection of filters independently on each component rather than an en-tire record (3 components) or on a policy basis.
Acausal filtering results in fewer phase distortions as discussed in Boore and Akkar(2003), Boore and Bommer (2005), and Boore (2005). The greater distortion presentwith causal filtering may affect spectral values, especially inelastic spectra, at frequen-cies much higher than the high-pass filter corner frequency. This occurs because the re-sponse spectrum measures a peak value in the time domain, and this measurement isaffected by the phasing of the ground motion over a wide frequency range. The Booreand Akkar (2003) work presented the analysis from two recordings from the HectorMine earthquake and a limited number of other recordings. They state “the question onwhether to use causal or acausal filters depends on the intended use of the data, desir-ability for compatible processed acceleration, velocity and displacement time series andconsiderations of computer storage space.” An advantage of causally filtered time histo-ries is compatibility; that is, velocity, displacement and response spectra computed fromthe acceleration time series will match the data provided. In contrast, acausal filters re-quire that the padded portions of the processed time series also be distributed to main-tain compatibility between time histories and spectra (see Boore and Bommer, 2005, for

32 B. CHIOU ET AL.
more discussion). Additionally, causal filters have a significantly steeper spectral falloffcompared to acausal filters that results in a wider useable bandwidth. The phase distor-tion, however, can distort the displacement time series, particularly at periods near thefilter corner period. On the other hand, acausal filters generally result in an artificial andsignificant ramp in displacement, preceding the arrival of long period energy from thesource. For analyses of spatial arrays, where relative timing is important, causal filteringis preferred, as is done in seismological observatories for earthquake locations.
The sensitivity to filtering method presented by Pacific Engineering at the NGA-COSMOS joint working group meeting showed that for most of the nearly 1000 com-ponents studied the elastic response spectra differences associated with the different fil-tering methods are small and they do not appear to result in systematic high or low biasof spectra within the common pass band. Bazzurro et al. (2004), in another large spectraldomain study, support the above observation. They found that elastic and inelastic spec-tra from causal and acausal filtered records are statistically indistinguishable from eachother provided the same filter order and corner frequencies have been used. The causallyfiltered records however result in a slightly larger variability in both elastic and inelasticresponse. It was concluded that the effects of filter causality on NGA regression resultsare considered to be insignificant.
An exception to the above conclusion is for a small group of near-source recordshaving large static displacements (i.e. tectonic displacements). Standard PEER process-ing of the time histories does not allow for the displacements to have a static offset orresidual displacement (i.e., frequency=0 Hz). To preserve the static displacement, astatic baseline correction method such as those described in Iwan et al. (1985), Grazier(1979), and Darragh et al. (2004) could be used in lieu of a high-pass filtering. The peakground displacement and, to a lesser extent, peak ground velocity values for PEER pro-cessed records are typically lower than for static baseline corrected cases. Interestingly,a comparison of the peak-to-peak displacement shows that the value from the standardPEER processed time history is approximately the same as the value from the staticbaseline corrected time history (Darragh et al., 2004). This suggests that the standardprocessing, which does not preserve static fields, may result in similar dynamic loads tostructures. As noted by Boore (2001), the difference in the acceleration response spectrabetween time histories which have been processed using a standard approach and thoseusing a static baseline correction approach are relatively small for periods less thanabout 20 seconds, which is greater than the maximum 10 second period used in thePEER-NGA data set.
ASSESSMENT OF USABLE FREQUENCY RANGE
Response spectral values were provided to a highest frequency of 100 Hz in theNGA database. For sites in western North America, peak ground acceleration (PGA) isequivalent to the 100 Hz spectral value (5% damped PSA) even at hard rock locations.
In contrast, at low frequencies, the minimum useable frequency is a critical issue.For example, the causal 5-pole Butterworth filters commonly used in PEER processinghas a significant reduction (0.707, or −3 db) in response at the filter corner frequency.Hence it was recommended that the usable bandwidth of these records for the purpose of

NGA PROJECT STRONG-MOTION DATABASE 33
engineering analysis extend from 100 Hz to the high-pass corner frequency multipliedby a factor of 1.25 (Abrahamson and Silva, 1997). With the 1.25 factor (1.5 factor foracausal 5-pole Butterworth filter), the lowest usable spectral frequency is the Fourier fre-quency at which the filter response is about −1/2 db down from the maximum response.Using the same −1/2 db criterion, the recommended low-frequency limit for each pass-through record was selected according to the Butterworth filter order and the number offilter passes used in the record processing, as recommended by Boore (2004, personalcommunication). For records filtered with an Ormbsy filter, a factor of 1 was used be-cause of the slow decay of filter response beyond the corner frequency.
FINITE FAULT MODELS
An earthquake’s finite fault model is a critical piece of information from which nu-merous other source and path metadata were derived. In the NGA database the finitefault geometry was defined by the end points on the top edge of rupture, depth to thebottom edge of rupture, and fault dip angle. The finite fault geometry was typically ob-tained, in the order of preference, from field observation of primary surface rupture, slipmodel obtained by inversions of waveform and geodetic data, and observation of after-shock distribution. When a slip model was available, that model was also used to extractinformation about the rise time, rupture velocity, and other metadata related to the spa-tial distribution of (coseismic) fault slip.
The NGA finite fault models were built on three model collections previously usedin ground-motion attenuation studies: PEER-NEAR (Silva et al., 1999a), USGS-YM(Spudich et al., 1996), and Chiou and others (2000). PEER-NEAR is a set of finite faultmodels for shallow crustal earthquakes collected by Pacific Engineering. USGS-YM, de-veloped by USGS for the Yucca Mountain Project, is for earthquakes in extensional re-gimes. These two model collections supplement each other, with only eight earthquakesoverlap between them. The third collection (Chiou et al., 2000) overlaps considerablywith PEER-NEAR but contains several obscure models that are not in PEER-NEAR. Wealso expanded the collection by adding models for other earthquakes, especially morerecent events. In total, finite fault models for 63 earthquakes were collected. Informationabout each finite fault model was obtained directly from the researchers or was extractedfrom their publications. Some of the older models were presented in figures, thereforecoordinates defining the fault rupture limits were manually digitized from those figures.We converted every model to a uniform format and to a latitude/longitude coordinatesystem.
The areal extent of the rupture was a main issue in evaluating the finite fault model.When a model included regions of zero or low level of slip near the edges, the modelarea was reduced or trimmed back. The consensus reached among the NGA developersand other attending seismologists at the June 2004 NGA developers meeting was thatregions with more than 50 cm of coseismic slip should not be trimmed off. Also, it wasagreed that the final model should maintain the primary surface rupture observed in thefield.
If there were more than one rupture model for an earthquake, a careful evaluation of

34 B. CHIOU ET AL.
the available models was conducted to develop a preferred model. In general, the dimen-sion of the preferred model is close to the average of the available models. The preferredfinite fault models went through several iterations of reviews by NGA Working Group#4 (during a meeting in September 2003) and the NGA developers (during two devel-oper meetings in May and June of 2004). Furthermore, Paul Somerville, Nancy Collins,and their colleagues at URS Corporation systematically reviewed the finite fault modelsand provided useful feedback and recommendations that were incorporated into the finalmodels.
SITE CONDITIONS
The PEER-NGA project attempted to collect all publicly available site condition in-formation at strong-motion stations in the NGA strong-motion database. Appendix Bprovides definitions for several of the site classifications collected during the project.These are the Geomatrix 3-letter site classification (Wells, 2005, personal communica-tion), NEHRP site classification (BSSC, 1994), Spudich et al., (1999) site classificationfor extensional regimes, extended NEHRP (Wills et al., 2000), and Campbell and Bo-zorgnia GEOCODE (2003).
The project supported various investigations to systematically fill in the missing siteinformation with an emphasis on VS30. For example, Geomatrix’s site classification atthe Chi-Chi recording stations initially was missing but later assigned by Donald Wellsusing geological maps of Taiwan. Wills and Clahan (2004, 2006) provided estimates ofVS30 for many California stations using surface geology (Table 2). Kayen et al. (2005)acquired SASW (Spectral Analysis of Surface Wave) data and developed shear-wave ve-locity profiles at 60 California strong-motion stations identified by the NGA project andsome of the resulting VS30 values were incorporated into the NGA database.
In addition, two approaches were adopted to assign site categories for regions ofsparse data. These were classifications in special studies available to the project and siteclassification correlation matrices (e.g. Table 1). Table 1 shows the correlation matrix forSpudich et al. (1999) and Geomatrix site classifications. This table, along with other
Table 1. Spudich et al. (1999) site classification with Geomatrix correla-tion matrix from all profiles in the Pacific Engineering profile database
GeomatrixA
GeomatrixB
GeomatrixC
GeomatrixD
GeomatrixE Total
Spudich 0 4 0 1 0 0 5Spudich 1 10 1 0 0 0 11Spudich 2 3 3 2 1 0 9Spudich 5 0 1 5 3 0 9Spudich 6 0 3 15 39 0 57Spudich 7 0 4 2 0 0 6
Total 17 12 25 43 0 97

NGA PROJECT STRONG-MOTION DATABASE 35
available information, was used to assign a Geomatrix classification at strong-motionstations in extensional regimes that had a Spudich et al. (1999) classification.
ESTIMATION OF VS30
The following hierarchy was used to estimate a VS30 value for each strong-motionstation in the NGA database. First, measured VS30 values were obtained from the PacificEngineering profile data set of over 1500 interpreted VS profiles. The USGS, ROSRINE,CUREE, NCREE, Agbabian and Associates, Shannon and Wilson, Caltrans, and otherorganizations measured the shear-wave velocity for these profiles. Only profiles with VS
measurements at depth greater than or equal to 20 m were usually considered, with the20 m shear-wave velocity extrapolated to 30 m to estimate VS30. To be consistent withthe USGS in assignment of VS30 values to a location, measurements within 300 m of asite were considered to be located at the recording location (Borcherdt, 2002).
Second, VS30 values were inferred from site geology for California stations that re-corded the Northridge earthquake from the analysis by Borcherdt (2003, personal com-munication; Borcherdt and Fumal, 2002) and for other California stations from the sur-face geology assignments by Wills and Clahan (2004, 2006) (Table 2).
Third, VS30 values were inferred for non-California sites from regional VS30 profilesdeveloped by Pacific Engineering (e.g. Kobe, Japan, Silva et al., 1999b). Also, VS30 val-ues were inferred from the Geomatrix site classification or Spudich et al. (1999) siteclassification (Table 3).
An alternative inference of VS30 was developed for Central Weather Bureau, Taiwansites using a Taiwan-specific relation of VS30 as a function of Geomatrix’s classificationand station elevation (Chiou and Wen, 2006, personal communication). This relation, de-scribed in Appendix C of Chiou and Youngs (2006), is reproduced in Table 4.
Fourth, VS30 values were obtained from measured VIC (Vibration Instruments Com-pany Ltd., Tokyo, Japan) data (high-frequency Rayleigh wave measurement) or inferredfrom maps of VS30 for Anchorage, Alaska (Martirosyan et al., 2002).
VS30 UNCERTAINTY
The preferred VS30 value for a site is considered to reflect the median estimate ofVS30, or the mean estimate of ln�VS30�. The assignment of uncertainty (epistemic vari-ability) to VS30 is dependent on the estimation method used and judgment by PacificEngineering (Figure 5). The estimate of the VS30 uncertainty for sites with measuredshear-wave velocities was the outcome of an analysis of variance on closely spaced VS30measurements in the Pacific Engineering profile database. The uncertainty at these sitesis nonzero because measurements may have been made up to 300 m (Borcherdt, 2002)from the recording station and hence includes considerable epistemic variability (uncer-tainty) due to varying shear-wave velocity near the site. For example, at Gilroy #2 (NE-HRP D site) there are 16 nearby measurements of VS30 estimated from velocities ob-tained from a variety of surface and borehole methods. These measurements yield astandard deviation of 0.08 in natural logarithmic units. A value of 0.10 is used in Figure5 based on these results and similar cluster analyses at other sites.
36 B. CHIOU ET AL.
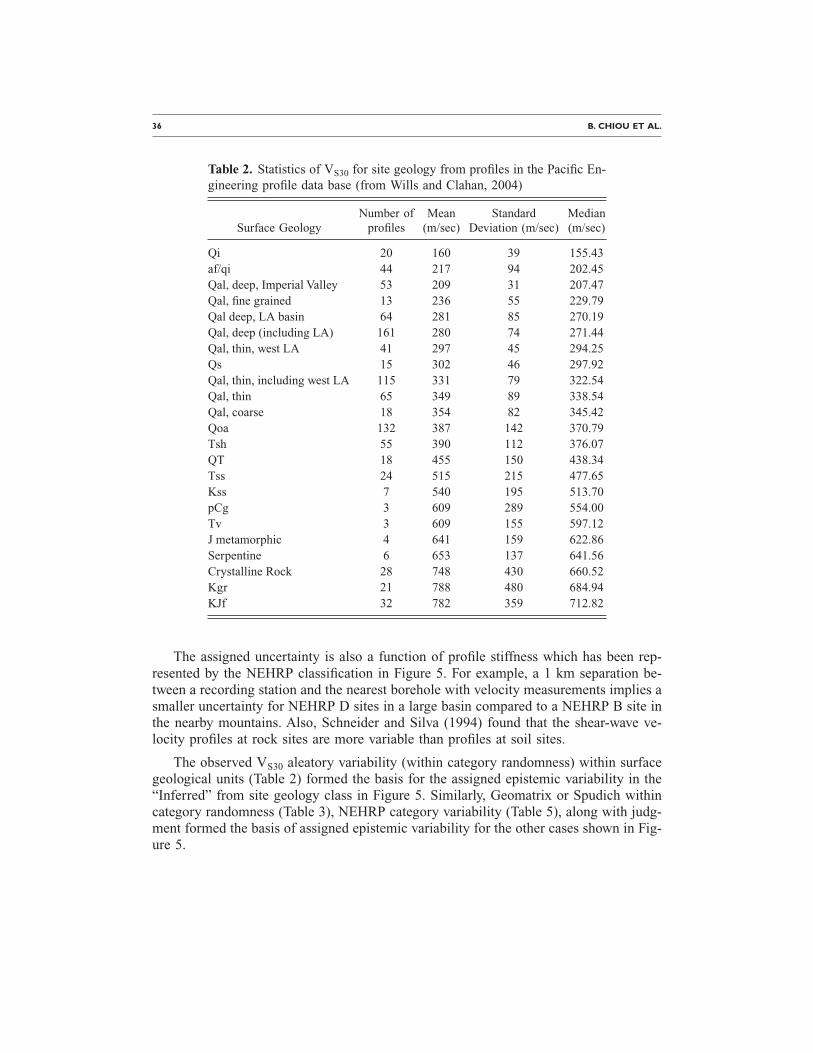
The assigned uncertainty is also a function of profile stiffness which has been rep-resented by the NEHRP classification in Figure 5. For example, a 1 km separation be-tween a recording station and the nearest borehole with velocity measurements implies asmaller uncertainty for NEHRP D sites in a large basin compared to a NEHRP B site inthe nearby mountains. Also, Schneider and Silva (1994) found that the shear-wave ve-locity profiles at rock sites are more variable than profiles at soil sites.
The observed VS30 aleatory variability (within category randomness) within surfacegeological units (Table 2) formed the basis for the assigned epistemic variability in the“Inferred” from site geology class in Figure 5. Similarly, Geomatrix or Spudich withincategory randomness (Table 3), NEHRP category variability (Table 5), along with judg-ment formed the basis of assigned epistemic variability for the other cases shown in Fig-ure 5.
Table 2. Statistics of VS30 for site geology from profiles in the Pacific En-gineering profile data base (from Wills and Clahan, 2004)
Surface GeologyNumber of
profilesMean
(m/sec)Standard
Deviation (m/sec)Median(m/sec)
Qi 20 160 39 155.43af/qi 44 217 94 202.45Qal, deep, Imperial Valley 53 209 31 207.47Qal, fine grained 13 236 55 229.79Qal deep, LA basin 64 281 85 270.19Qal, deep (including LA) 161 280 74 271.44Qal, thin, west LA 41 297 45 294.25Qs 15 302 46 297.92Qal, thin, including west LA 115 331 79 322.54Qal, thin 65 349 89 338.54Qal, coarse 18 354 82 345.42Qoa 132 387 142 370.79Tsh 55 390 112 376.07QT 18 455 150 438.34Tss 24 515 215 477.65Kss 7 540 195 513.70pCg 3 609 289 554.00Tv 3 609 155 597.12J metamorphic 4 641 159 622.86Serpentine 6 653 137 641.56Crystalline Rock 28 748 430 660.52Kgr 21 788 480 684.94KJf 32 782 359 712.82

NGA PROJECT STRONG-MOTION DATABASE 37
Table 4. Taiwan-specific Vs30 relation based on profiles from Taiwan.ln�Vs30�= ln��1�+ ln��2�− ln��1� /1+e�ln��3�−ln�Elv��/�4.
Geomatrix 3rd
Letter �1 �2 �3 �4 �
Numberof DataPoints
A 552 680a 244 0.1154 0.3174 15B 418 579 107.1 0.3850 0.2294 35C — — — — — 4b
D 228 509 39.4 0.373 0.2953 91E 201 405 38.2 0.087 0.1810 18
Total=163c
Elv is the elevation of recording station in meters.a This parameter value is fixed by judgment.b There are insufficient data to derive a relationship. To estimate Vs30, one could use therelationship for category D.c
Table 3. Statistics of VS30 for Geomatrix, Campbell and Bozorgnia GEO-CODE, and Spudich et al. site classifications from all profiles in the Pa-cific Engineering profile database
Geomatrix 3rd LetterMedian VS30
(m/s)
StandardDeviation of
ln�VS30�Mean VS30
(m/s)
StandardDeviation ofVS30 (m/s)
A 659.6 0.416 720.2 324.2B 424.8 0.431 464.3 211.0C 338.6 0.203 345.4 70.4D 274.5 0.335 291.4 110.5E 191.3 0.290 199.4 61.4
Campbell Geocode Median VS30
(m/s)Standard
Deviation ofln�VS30�
Mean VS30
(m/s)Standard
Deviation ofVS30 (m/s)
A 259.4 0.268 269.8 84.3B 375.7 0.386 387.7 101.7C 463.4 0.242 476.2 107.6D 824.6 0.346 869.6 274.4E 749.5 0.387 801.4 282.9F 195.5 0.393 215.5 134.1
Spudich Median VS30
(m/s)Standard
Deviation ofln�VS30�
Mean VS30
(m/s)Standard
Deviation ofVS30 (m/s)
2 362.4 ¯ 362.4 ¯
6 215.2 0.174 218.7 44.1
Two data points in Geomatrix-B category were removed.

38 B. CHIOU ET AL.
ACKNOWLEDGMENTS
The authors gratefully acknowledge the sharing of strong-motion catalog\databaseand other documentation by the NGA model developers. This project would not havesucceeded without their unselfish contributions of time, data, informal reviews, andguidance. In particular, the authors want to thank Dave Boore for his thoughtful sugges-tions and careful reviews which resulted in many improvements to the database.
In addition, many individuals and organizations also contributed data and expertiseto the database development. These individuals and organizations are Agbabian and As-sociates, ALYESKA, Jack Boatwright, Roger Borcherdt, Jon Bray, Central Weather Bu-
Figure 5. Epistemic variability (uncertainty) of mean ln�VS30� estimate for a recording site.
Table 5. NEHRP Category mean (median) VS30 estimates and aleatoryvariability computed from all profiles in the Pacific Engineering profile da-tabase.
NEHRPCategory
MedianVS30
(m/sec)
StandardDeviation of
ln�VS30�Mean VS30
(m/sec)
StandardDeviation ofVS30 (m/sec)
Numberof Profiles
A 1745.3 0.122 1756.0 212.1 6B 967.6 0.169 981.6 173.5 56C 450.5 0.189 459.1 94.6 479D 258.2 0.208 263.8 54.2 886E 152.5 0.172 154.5 22.3 129

NGA PROJECT STRONG-MOTION DATABASE 39
reau of Taiwan, California Department of Transportation, CEORKA, CGS/SMIP DataCenter, Kandilli Observatory and Earthquake Engineering Research Institute ofBogaçizi University, Kevin Clahan, COSMOS, CUREE, Doug Dreger, Bill Ellsworth,ESD, Vladimir Graizer, Rob Graves, Moh Huang, Istanbul Technical University, JapanMeteorological Association, Japan Railroad, Rob Kayen, LADWP, Kandilli Observatoryand Earthquake Engineering Research Institute of Bogaçizi University, William H.K.Lee Martin Mai, NCREE, Bob Nigbor, Mark Petersen, Maury Power, Ellen Rathje, CliffRoblee, Kyle Rollins, ROSRINE, SCEC, Linda Seekins, Seismic Networks (CIT, ISC,UCB, USGS, SCSN), Shannon And Wilson, Tony Shakal, Jaime Steidl, Chris Stevens,Paul Somerville, Paul Spudich, Jon Stewart, Ken Stokoe, USC, USGS/NSMP Data Cen-ter, URS Corporation, Dave Wald, Jennie Watson-Lamprey, Donald Wells, Kuo-LiangWen, Chris Wills, and Yuehua Zeng. The staff and agencies listed above that record, pro-cess and disseminate strong motion data are acknowledged for their long-term efforts inthis field.
This study was sponsored by PEER Center’s Program of Applied Earthquake Engi-neering Research of Lifelines Systems supported by the California Department of Trans-portation, the California Energy Commission, and the Pacific Gas & Electric Company.This work made use of the Earthquake Engineering Research Centers Shared Facilitiessupported by the National Science Foundation under award number EEC-9701568through the PEER Center. Any opinions, findings, and conclusion or recommendationsexpressed in this material are those of the authors and do not necessarily reflect those ofthe National Science Foundation.
Constructive suggestions from Maury Power allowed the authors to improve thismanuscript. Finally, thanks to the editors of the special issue for their patience and as-sistance in publishing this paper.
APPENDIX B: SITE CLASSIFICATION DEFINITIONS
GEOMATRIX 3-LETTER SITE CLASSIFICATION
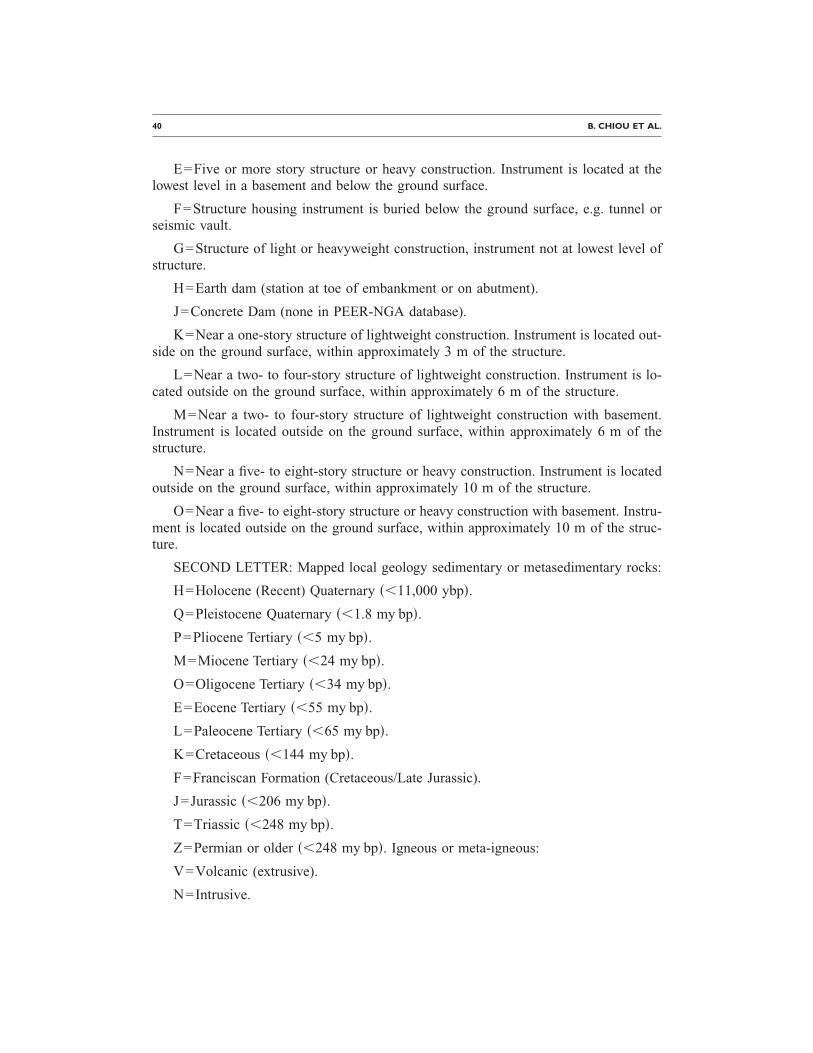
FIRST LETTER: Instrument Structure Type (Donald Wells, personal communica-tion, 2005)
I=Free-field instrument or instrument shelter. Instrument is located at or within sev-eral feet of the ground surface, and not adjacent to any structure.
A=One-story structure of lightweight construction. Instrument is located at the low-est level and within several feet of the ground surface.
B=Two- to four-story structure of lightweight construction, or tall one-storywarehouse-type building. Instrument is located at the lowest level and within several feetof the ground surface.
C=One- to four-story structure of lightweight construction. Instrument is located atthe lowest level in a basement and below the ground surface.
D=Five or more story structure or heavy construction. Instrument is located at thelowest level and within several feet of the ground surface.
40 B. CHIOU ET AL.
E=Five or more story structure or heavy construction. Instrument is located at thelowest level in a basement and below the ground surface.
F=Structure housing instrument is buried below the ground surface, e.g. tunnel orseismic vault.
G=Structure of light or heavyweight construction, instrument not at lowest level ofstructure.
H=Earth dam (station at toe of embankment or on abutment).
J=Concrete Dam (none in PEER-NGA database).
K=Near a one-story structure of lightweight construction. Instrument is located out-side on the ground surface, within approximately 3 m of the structure.
L=Near a two- to four-story structure of lightweight construction. Instrument is lo-cated outside on the ground surface, within approximately 6 m of the structure.
M=Near a two- to four-story structure of lightweight construction with basement.Instrument is located outside on the ground surface, within approximately 6 m of thestructure.
N=Near a five- to eight-story structure or heavy construction. Instrument is locatedoutside on the ground surface, within approximately 10 m of the structure.
O=Near a five- to eight-story structure or heavy construction with basement. Instru-ment is located outside on the ground surface, within approximately 10 m of the struc-ture.
SECOND LETTER: Mapped local geology sedimentary or metasedimentary rocks:
H=Holocene (Recent) Quaternary ��11,000 ybp�.
Q=Pleistocene Quaternary ��1.8 my bp�.
P=Pliocene Tertiary ��5 my bp�.
M=Miocene Tertiary ��24 my bp�.
O=Oligocene Tertiary ��34 my bp�.
E=Eocene Tertiary ��55 my bp�.
L=Paleocene Tertiary ��65 my bp�.
K=Cretaceous ��144 my bp�.
F=Franciscan Formation (Cretaceous/Late Jurassic).
J=Jurassic ��206 my bp�.
T=Triassic ��248 my bp�.
Z=Permian or older ��248 my bp�. Igneous or meta-igneous:
V=Volcanic (extrusive).
N=Intrusive.

NGA PROJECT STRONG-MOTION DATABASE 41
G=Granitic.
THIRD LETTER: Geotechnical subsurface characteristics
A=Rock. Instrument on rock �Vs�600 mps� or �5 m of soil over rock.
B=Shallow (stiff) soil. Instrument on/in soil profile up to 20 m thick overlying rock.
C=Deep narrow soil. Instrument on/in soil profile at least 20 m thick overlyingrock, In a narrow canyon or valley no more than several km wide.
D=Deep broad soil. Instrument on/in soil profile at least 20 m thick overlying rock,in a broad valley.
E=Soft deep soil. Instrument on/in deep soil profile with average Vs�150 mps.
NEHRP SITE CLASSIFICATION (BSSC, 1994)
Average shear-wave velocity to a depth of 30 m is:
A�1500 m/s
B=760 m/s–1500 m/s
C=360 m/s–760 m/s
D=180 m/s–360 m/s
E�180 m/s
SITE CLASSIFICATION FOR EXTENSIONAL TECTONIC REGIMES
Spudich et al., (1999)
0=Unknown rock site
1=Hard rock site, soil �5 m over hard rock
2=Soft rock site, soil �5 m over soft rock
5=Soil, unknown depth
6=Deep soil, �20 m thick
7=Shallow soil, 5 m⇐ thickness⇐20 m
NEHRP—UBC (extended) Site Classification
Wills et al. (2000), personal communication (2003)
B: Plutonic and metamorphic rocks, most volcanic rocks, coarse sedimentary rocksof Cretaceous age and older.
BC: Franciscan Complex rocks of the Transverse Ranges which tend to be moresheared, Cretaceous siltstones, or mudstone.
C: Franciscan mélange and serpentine, sedimentary rocks of Oligocene to Creta-ceous age or coarse-grained sedimentary rocks of younger age.
42 B. CHIOU ET AL.
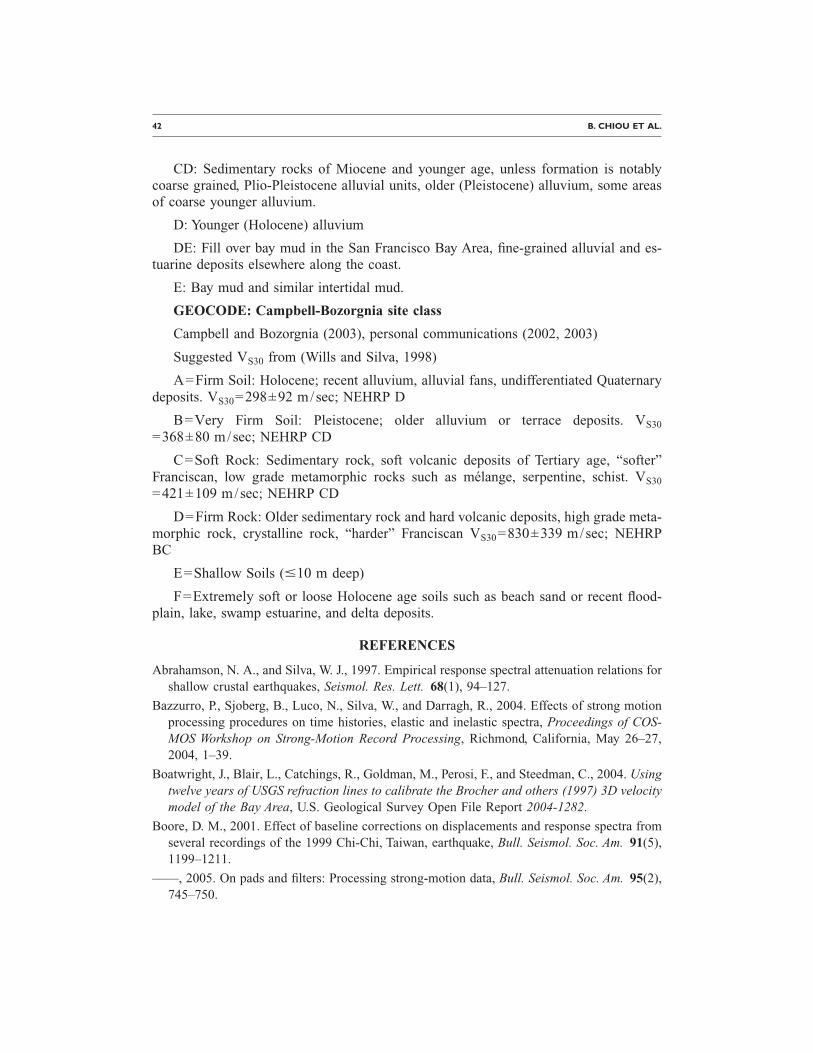
CD: Sedimentary rocks of Miocene and younger age, unless formation is notablycoarse grained, Plio-Pleistocene alluvial units, older (Pleistocene) alluvium, some areasof coarse younger alluvium.
D: Younger (Holocene) alluvium
DE: Fill over bay mud in the San Francisco Bay Area, fine-grained alluvial and es-tuarine deposits elsewhere along the coast.
E: Bay mud and similar intertidal mud.
GEOCODE: Campbell-Bozorgnia site class
Campbell and Bozorgnia (2003), personal communications (2002, 2003)
Suggested VS30 from (Wills and Silva, 1998)
A=Firm Soil: Holocene; recent alluvium, alluvial fans, undifferentiated Quaternarydeposits. VS30=298±92 m/sec; NEHRP D
B=Very Firm Soil: Pleistocene; older alluvium or terrace deposits. VS30
=368±80 m/sec; NEHRP CD
C=Soft Rock: Sedimentary rock, soft volcanic deposits of Tertiary age, “softer”Franciscan, low grade metamorphic rocks such as mélange, serpentine, schist. VS30
=421±109 m/sec; NEHRP CD
D=Firm Rock: Older sedimentary rock and hard volcanic deposits, high grade meta-morphic rock, crystalline rock, “harder” Franciscan VS30=830±339 m/sec; NEHRPBC
E=Shallow Soils (�10 m deep)
F=Extremely soft or loose Holocene age soils such as beach sand or recent flood-plain, lake, swamp estuarine, and delta deposits.
REFERENCES
Abrahamson, N. A., and Silva, W. J., 1997. Empirical response spectral attenuation relations forshallow crustal earthquakes, Seismol. Res. Lett. 68(1), 94–127.
Bazzurro, P., Sjoberg, B., Luco, N., Silva, W., and Darragh, R., 2004. Effects of strong motionprocessing procedures on time histories, elastic and inelastic spectra, Proceedings of COS-MOS Workshop on Strong-Motion Record Processing, Richmond, California, May 26–27,2004, 1–39.
Boatwright, J., Blair, L., Catchings, R., Goldman, M., Perosi, F., and Steedman, C., 2004. Usingtwelve years of USGS refraction lines to calibrate the Brocher and others (1997) 3D velocitymodel of the Bay Area, U.S. Geological Survey Open File Report 2004-1282.
Boore, D. M., 2001. Effect of baseline corrections on displacements and response spectra fromseveral recordings of the 1999 Chi-Chi, Taiwan, earthquake, Bull. Seismol. Soc. Am. 91(5),1199–1211.
––—, 2005. On pads and filters: Processing strong-motion data, Bull. Seismol. Soc. Am. 95(2),745–750.

NGA PROJECT STRONG-MOTION DATABASE 43
Boore, D. M., and Akkar, S., 2003. Effects of causal and acausal filters on elastic and inelasticresponse spectra, Earthquake Eng. Struct. Dyn. 32, 1729–1748.
Boore, D. M., and Bommer, J. J., 2005. Processing of strong-motion accelerograms: Needs, op-tions and consequences, Soil Dyn. Earthquake Eng. 25, 93–115.
Boore, D. M., Watson-Lamprey, J., and Abrahamson, N. A., 2006. GMRotD and GMRotI:Orientation-independent measures of ground motion, Bull. Seismol. Soc. Am. 96(4a), 1502–1511.
Borcherdt, R. D., 2002. Empirical evidence for acceleration-dependent amplification factors,Bull. Seismol. Soc. Am. 92(2), 761–782.
Borcherdt, R. D., and Fumal, T. E., 2002. Shear-wave velocity compilation for Northridgestrong-motion recording sites, U.S. Geological Survey Open File Report 2002-107.
Bray, J. D., and Rodriguez-Marek, A., 1997. Geotechnical site categories proceedings, FirstPEER-PG&E Workshop on Seismic Reliability of Utility Lifelines, San Francisco, CA, Au-gust.
BSSC, 1994. NEHRP recommended provisions for seismic regulations for new buildings, Part1—Provisions, FEMA 222A, Federal Emergency Management Agency.
Campbell, K. W., and Bozorgnia, Y., 2003. Updated near-source ground-motion (attenuation)relations for the horizontal and vertical components of peak ground acceleration and accel-eration response spectra, Bull. Seismol. Soc. Am. 93(1), 314–331.
Chiou, S.-J., Makdisi, F. I., and Youngs, R. R., 2000. Style-of-faulting and footwall/hangingwall effects on strong ground motion, FY 1995 NEHRP Award Number 1434-95-G-2614,final report, 21 p.
Chiou, B. S.-J., and Youngs, R. R., 2006. Chiou and Youngs PEER-NGA empirical ground mo-tion model for the average horizontal component of peak acceleration and pseudo-spectralacceleration for spectral periods of 0.01 to 10 Seconds, Report submitted to PEER, June,2006.
Darragh, B., Silva, W., and Gregor, N., 2004. Strong motion record processing procedures forthe PEER center, Proceedings of COSMOS Workshop on Strong-Motion Record Processing,Richmond, California, May 26–27, 2004, 1–12.
Graves, R. W., 1994. Simulating the 3D basin response in the Portland and Puget Sound re-gions from large subduction zone earthquakes, USGS Award: 1434-93-G-2327, AnnualTechnical Report.
Grazier, V. M., 1979. Determination of the true ground displacement by using strong motionrecords, Izvestiya Academy of Sciences, Izv., Acad. Sci., USSR, Phys. Solid Earth 15(12),875–885.
Iwan, W. D., Moser, M. A., and Peng, C.-Y., 1985. Some observations on strong-motion earth-quake measurement using a digital accelerograph, Bull. Seismol. Soc. Am. 75(5), 1225–1246.
Kayen, R., Thompson, E., Minasian, D., and Carkin, B., 2005. Shear-wave velocity of theground near sixty California strong motion recording sites by the Spectral Analysis of Sur-face Waves (SASW) method and harmonic-wave sources, U.S. Geological Survey Open-FileReport 2005-1366.
Lee, C.-T., Cheng, C.-T., Liao, C.-W., and Tsai, Y.-B., 2001. Site classification of Taiwan free-field strong-motion stations, Bull. Seismol. Soc. Am. 91(5), 1283–1297.
44 B. CHIOU ET AL.
Magistrale, H., McLaughlin, K., and Day, D., 1996. A geology-based 3D velocity model of theLos Angeles basin sediments, Bull. Seismol. Soc. Am. 86(4), 1161–1166.
Martirosyan, A., Dutta, U., Biswas, U., Papageorgiou, N., and Combellick, R., 2002. Determi-nation of site response in Anchorage, Alaska, on the basis of spectral ratio methods, Earth-quake Spectra 18(1), 85–104.
Power, M., Chiou, B., Abrahamson, N., Bozorgnia, Y., Shantz, T., and Roblee, C., 2008. Anoverview of the NGA project, Earthquake Spectra 24(1), 3–21.
Schneider, J. F., and Silva, W. J., 1994. What is rock? Implications for site response estimation,Seismol. Res. Lett. 65(1), 44.
Silva, W. J., Gregor, N., and Darragh, B., 1999a. Near fault ground motions, A PEARL reportto PG&E/CEC/Caltrans, Award No. SA2193-59652.
Silva, W. J., Costantino, C., and Iwasaki, Y., 1999b. Assessment of liquefaction potential for the1995 Kobe, Japan earthquake including finite-source effects, Prepared for U.S. Army Water-ways Experiment Station, Corps of Engineers Contract #DACW39-97-k-0015.
Somerville, P. G., Collins, N., Graves, R., and Pitarka, A., 2002. Development of an engineer-ing model of basin generated surface waves, Proceedings of SMIP03 Seminar on Utilizationof Strong-Motion Data, p. 1–21.
Spudich, P., Fletcher, J. B., Hellweg, M., Boatwright, J., Sullivan, C., Joyner, W. B., Hanks, T.C., Boore, D. M., McGarr, A., Baker, L. M., and Lindh, A. G., 1996. Earthquake groundmotions in extensional tectonic regimes, U.S. Geological Survey Open File Report 96-292.
Spudich, P., Joyner, W. B., Lindh, A. G., Boore, D. M., Margaris, B. M., and Fletcher, J. B.,1999. SEA99: A revised ground motion prediction relation for use in extensional tectonicregimes, Bull. Seismol. Soc. Am. 89(5), 1156-1170.
Spudich, P., and Chiou, B. S. J., 2008. Directivity in NGA earthquake ground motions: analysisusing isochrone theory, Earthquake Spectra 24(1), 279–298.
Rodriguez-Marek, A., Bray, J. D., and Abrahamson, N. A., 2001. An empirically based geo-technical seismic site response procedure, Earthquake Spectra 17(1), 65–87.
Wills, C. J., Petersen, M., Bryant, W. A., Reichle, M., Saucedo, G. J., Tan, S., Taylor, G., andTreiman, J., 2000. A site-conditions map for California based on geology and shear-wavevelocity, Bull. Seismol. Soc. Am. 90(6B), S187-S208.
Wills, C. J., and Silva, W., 1998. Shear wave velocity characteristics of geologic units in Cali-fornia, Earthquake Spectra 14(3), 533–556.
Wills, C. J., and Clahan, K. B., 2004. NGA: Site condition metadata from geology, final project1L05 to PEER.
––—, 2006. Developing a map of geologically defined site-condition categories for California,Bull. Seismol. Soc. Am. 96(4A), 1483–1501.
(Received 7 December 2007; accepted 30 January 2008�