NFI woodland ecological condition in Scotland: …...NFI woodland condition classifications 4 NFI...
34
NFI condition classifications NFI woodland ecological condition in Scotland: classification results National Forest Inventory Issued by: National Forest Inventory, Forestry Commission, 231 Corstorphine Road, Edinburgh, EH12 7AT Date: Feb 2020 Enquiries: Ben Ditchburn, 0300 067 5561 [email protected] Statistician: David Ross [email protected] Website: www.forestresearch.gov.uk/inventory www.forestresearch.gov.uk/forecast
Transcript of NFI woodland ecological condition in Scotland: …...NFI woodland condition classifications 4 NFI...
NFI condition classifications
NFI woodland ecological
condition in Scotland:
classification results
National Forest Inventory
Issued by: National Forest Inventory, Forestry Commission,
231 Corstorphine Road, Edinburgh, EH12 7AT
Date: Feb 2020
Enquiries: Ben Ditchburn, 0300 067 5561
Statistician: David Ross
Website: www.forestresearch.gov.uk/inventory
www.forestresearch.gov.uk/forecast

NFI woodland condition classifications
2 NFI Condition Statistics
Summary The National Forest Inventory (NFI) for Great Britain provides information concerning
the size, distribution and composition of forests and woodlands including woodland
ecological condition. Data enabling the calculation of 15 ecological condition indicators
were measured as part of the NFI survey cycle 2010-2015 and compared to a
benchmark of a stand of ancient semi-natural woodland (ASNW) in good condition. This
enabled woodland stands to be classified as favourable, intermediate or unfavourable in
terms of their ecological condition. These results can be calculated by woodland type,
habitat type, country and region.
This report contains the classification results broken down by woodland type (native,
non-native and ‘near-native and fragments’). A series of complementary reports has
been produced to describe the methodology used, to set out the underpinning statistics
on the condition indicators and classes, and to summarise the results. Figure 1.1
illustrates the report and data products available.
For a brief summary of the work or for full details of the methodology please refer to:
• NFI Woodland ecological condition in Great Britain: Executive Summary
• NFI Woodland ecological condition in Great Britain: Methodology
For the statistical results for other countries please refer to:
• NFI Woodland ecological condition in [country1]: Statistics
For the classification results for the individual British countries please refer to:
• NFI Woodland ecological condition in [country1]: Classification Results
Results for individual priority woodland habitat types can be found in the supporting
data:
• NFI Woodland Ecological Condition in [country]: Supporting Data2
1 There are four separate reports; Great Britain, England, Scotland and Wales 2 Supporting/additional data is available in Excel spreadsheets

NFI woodland condition classifications
3 NFI Condition Statistics
Figure 1.1 A schematic diagram to illustrate the link between all the reports
published by the NFI on the study of woodland ecological condition in Great
Britain.
Notes: [green boxes] = published reports; [grey box] = detail available in supporting spreadsheets; [pink box] = over-arching theme. GB = Great Britain.
Ten reports have been published in relation to woodland ecological condition, namely;
executive summary, methodology, statistics and classification results:
1. The Executive Summary spans all three topics presenting an overview of the
methodology, key results and sign-posting to more detail;
2. The methodology describes the survey methodology and the calculation of the
condition scores;
3. The statistics reports describe the key statistical results, one for each of the three
countries and Great Britain, broken by native woodland type1 and;
4. The classification results describe woodland ecological condition (as calculated by the
NFI Condition Calculator, see Methodology) one for each of the three countries and Great
Britain by woodland type.
1 The written reports cover native woodland type, the supplementary data includes regional breakdowns and statistics and classification by priority habitat types as well.
NFI woodland condition classifications
4 NFI Condition Statistics
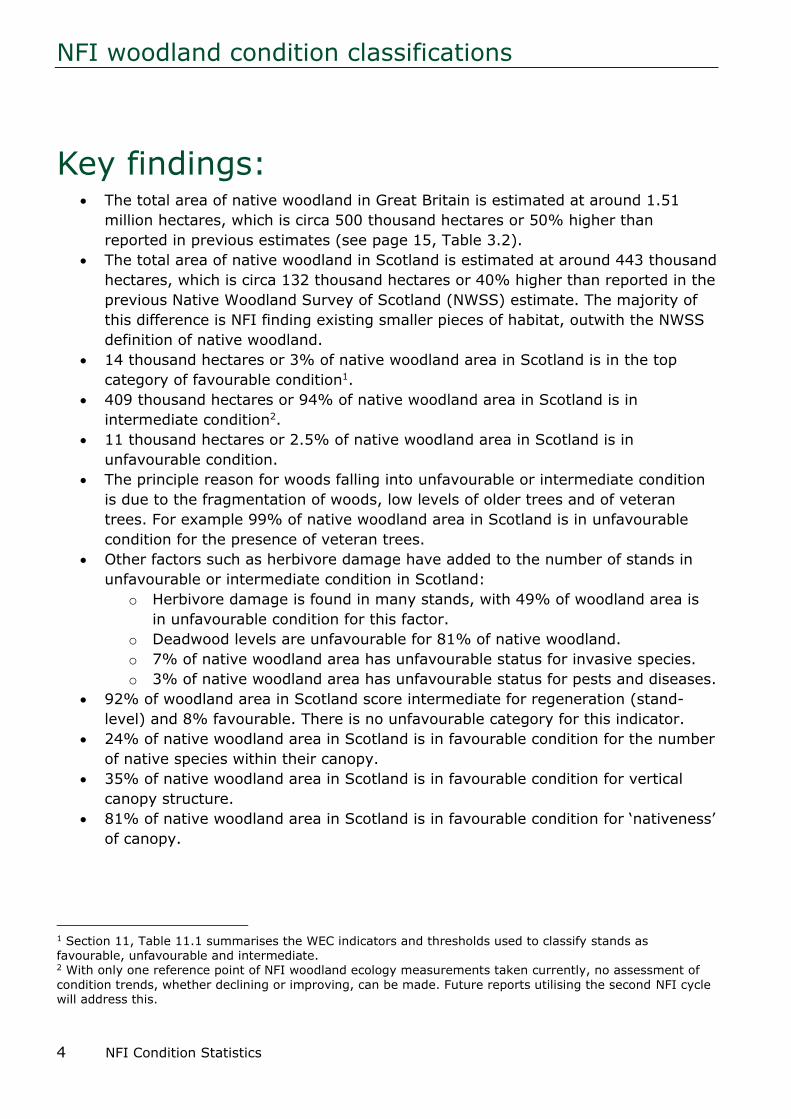
Key findings: • The total area of native woodland in Great Britain is estimated at around 1.51
million hectares, which is circa 500 thousand hectares or 50% higher than
reported in previous estimates (see page 15, Table 3.2).
• The total area of native woodland in Scotland is estimated at around 443 thousand
hectares, which is circa 132 thousand hectares or 40% higher than reported in the
previous Native Woodland Survey of Scotland (NWSS) estimate. The majority of
this difference is NFI finding existing smaller pieces of habitat, outwith the NWSS
definition of native woodland.
• 14 thousand hectares or 3% of native woodland area in Scotland is in the top
category of favourable condition1.
• 409 thousand hectares or 94% of native woodland area in Scotland is in
intermediate condition2.
• 11 thousand hectares or 2.5% of native woodland area in Scotland is in
unfavourable condition.
• The principle reason for woods falling into unfavourable or intermediate condition
is due to the fragmentation of woods, low levels of older trees and of veteran
trees. For example 99% of native woodland area in Scotland is in unfavourable
condition for the presence of veteran trees.
• Other factors such as herbivore damage have added to the number of stands in
unfavourable or intermediate condition in Scotland:
o Herbivore damage is found in many stands, with 49% of woodland area is
in unfavourable condition for this factor.
o Deadwood levels are unfavourable for 81% of native woodland.
o 7% of native woodland area has unfavourable status for invasive species.
o 3% of native woodland area has unfavourable status for pests and diseases.
• 92% of woodland area in Scotland score intermediate for regeneration (stand-
level) and 8% favourable. There is no unfavourable category for this indicator.
• 24% of native woodland area in Scotland is in favourable condition for the number
of native species within their canopy.
• 35% of native woodland area in Scotland is in favourable condition for vertical
canopy structure.
• 81% of native woodland area in Scotland is in favourable condition for ‘nativeness’
of canopy.
1 Section 11, Table 11.1 summarises the WEC indicators and thresholds used to classify stands as favourable, unfavourable and intermediate. 2 With only one reference point of NFI woodland ecology measurements taken currently, no assessment of
condition trends, whether declining or improving, can be made. Future reports utilising the second NFI cycle will address this.

NFI woodland condition classifications
5 NFI Condition Statistics
Contents
1 Introduction .............................................................................................. 7
1.1 Aim ....................................................................................................... 7
1.2 The importance of understanding the ecological condition of Scotland’s woodlands
............................................................................................................ 7
1.3 Measuring ecological condition ................................................................... 8
1.3.1 The NFI Map: an overview 9
1.3.2 NFI woodland sample evaluation: an overview 9
1.3.3 Ecological condition classification 10
1.3.4 Extrapolating NFI field survey statistics to a reporting area 10
1.3.5 The NFI Condition Calculator: an overview 11
1.3.6 Woodland and woodland type definitions 11
2 Results .................................................................................................. 13
2.1 Standard error ...................................................................................... 13
3 Woodland habitat type and woodland native type .......................................... 14
4 Stand-level condition classification results for native woodland area in Scotland . 16
5 Stand-level condition classification results for near native woodland and fragments
in Scotland ............................................................................................. 18
6 Stand-level condition classification results for non-native woodland stands in
Scotland ................................................................................................. 20
7 Condition scoring distribution ..................................................................... 22
8 Discussion .............................................................................................. 23
8.1 Woodland habitat area ............................................................................ 23
8.2 Classification of woodland condition .......................................................... 24
8.3 Conclusion ............................................................................................ 26
8.4 Future work .......................................................................................... 26
9 References ............................................................................................. 27
10 Glossary ................................................................................................. 27
11 Annex .................................................................................................... 33
12 NFI national reports ................................................................................. 34
NFI woodland condition classifications
6 NFI Condition Statistics
Figures
Figure 1.1 A schematic diagram to illustrate the link between all the reports published
by the NFI on the study of woodland ecological condition in Great Britain. ................... 3
Figure 4.1 The proportion of each woodland ecological condition class, for each WEC
indicator in native woodland stands in Scotland ..................................................... 17
Figure 5.1 The proportion of each woodland ecological condition class, for each WEC
indicator type in near-native woodland and fragments in Scotland ............................ 19
Figure 6.1 The proportion of each woodland ecological condition class, for each WEC
indicator type in non-native woodland stands in Scotland ........................................ 21
Figure 7.1 The overall distribution of ecological condition class by woodland type in
Scotland ......................................................................................................... 22
Tables
Table 3.1 Area of woodland by habitat type for each country and region of GB .......... 14
Table 3.2 Area of woodland by woodland type for each country and region of GB ....... 15
Table 4.1 Area of native woodland stands in Scotland classified as favourable,
intermediate or unfavourable for each of the 15 WEC indicators ............................... 16
Table 5.1 Area of near-native woodland and fragments in Scotland classified by
woodland ecological condition for each of the 15 WEC indicators .............................. 18
Table 6.1 Area of non-native woodland stands in Scotland classified by woodland
ecological condition classification for each of the 15 WEC indicators .......................... 20
Table 11.1 Classification threshold summary ...................................................... 33

NFI woodland condition classifications
7 NFI Condition Statistics
1 Introduction Scottish woodlands are dynamic entities and their ecological condition changes in
response to factors such as changing woodland management, general land use practices
and climate change. There is a growing requirement across government, non-
governmental organisations and the private sector for a better understanding of the
ecological condition of Scottish woodlands, which can be used to inform the targeting of
resources and woodland management in support of biodiversity and ecological resilience.
This is the most extensive direct field-based assessment of woodland ecological condition
to have been carried out in Scotland, covering both native and non-native woods. The
study has been run in combination with the National Forest Inventory (NFI) that records
the size, distribution and composition of woodland in Great Britain.
1.1 Aim The purpose of this report is to present the area and proportion of woodland in three
woodland ecological condition classes (favourable, intermediate, unfavourable) for
native, non-native and ‘near-native and fragments’ woodland in Scotland. Classification
results by woodland habitat type are available in the supporting Excel tables.
1.2 The importance of understanding the ecological condition of Scotland’s woodlands
There are several drivers for monitoring woodland ecological condition. The primary
objective is to provide government with statistics that reflect woodland ecological
condition and the main factors that impact condition, so that they can make informed
decisions concerning the current state of woodland ecological condition and its
management. Secondly, it is the UK’s national and international requirement to monitor
woodland condition. The UK government signed the following global and pan-European
(EU) agreements in 1992 which led to commitments concerning the protection of
biodiversity:
• The global Convention on Biological Diversity (CBD: https://www.cbd.int).
Contracting parties are required to develop and enforce national strategies to
identify, conserve and protect existing biodiversity. Article 7 of the convention
focuses on the requirement to monitor biodiversity.
• The EU Habitats Directive (Directive 92/43/EEC) aims to promote the
maintenance of biodiversity by requiring Member States to take measures to
maintain or restore natural habitats and wild species listed on its Annexes to a
favourable conservation status (JNCC, 2018). Article 17 of the directive
specifically requires members to report an assessment of the conservation status
of species and habitats listed on the Annexes of the Directive every 6 years.

NFI woodland condition classifications
8 NFI Condition Statistics
1.3 Measuring ecological condition The National Forest Inventory (NFI) field survey assesses a large, stratified random
sample of woodlands across GB on a 5-year rolling cycle using a standardised protocol.
Detailed data on various attributes are collected from approximately 15,100 one-hectare
sample squares that are partially or entirely covered by forest, including clear-felled
areas, according to the woodland map. The first cycle ran from 2010 to 2015 and the
second cycle commenced in 2015 (to be completed in 2020). The survey provides an
extensive, in-depth and spatially explicit record of our forests and woodlands.
This report provides a brief overview of the methodology used to assess woodland
condition using the first cycle of NFI survey data, but full details are provided in the
complementary report, ‘NFI woodland ecological condition in Great Britain:
Methodology’.
To assess the ecological condition of the NFI survey woodlands, 15 woodland ecological
condition (WEC) indicators were devised, reviewed and agreed by the NFI WEC working
group, a group of specialists from Natural Scotland, Forestry Commission, Forestry
England, Scottish Forestry, Scottish Natural Heritage, Natural Resources Wales and the
Welsh Government:
1. Age distribution of trees
2. Herbivore damage
3. Invasive plant species
4. Number of native trees
5. Occupancy of native trees
6. Open space
7. Proportion of favourable land cover
8. Woodland regeneration (stand-level) 1
9. Woodland regeneration (square-level)
10. Tree health
11. Vegetation and ground flora
12. Woodland vertical structure
13. Veteran trees
14. Volume of deadwood
15. Total area of woodland
Alongside the WEC indicators listed above (i.e. stand-level indicators), total woodland
area and woodland area loss were designated as population-level indicators (i.e.
1 Component group = Homogeneous areas that are too small (<0.05 ha) to practically map as a discrete section using Geographic Information System (GIS) software in the field, but with most of the same defining characteristics as a section. Section = within each sample square, the forest was stratified into different
woodland stands or ‘sections’.

NFI woodland condition classifications
9 NFI Condition Statistics
national-level indicators) and are reported upon and evaluated separately (see Forestry
Statistics) to the condition classification results reported here. The national-level
estimates were derived from the NFI woodland map, augmented by the NFI fieldwork.
Both the national-level indicators and stand-level indicators are pertinent to the overall,
national picture of habitat condition and should be considered together.
1.3.1 The NFI Map: an overview
Data on the location and extent of all forests and woodlands in the UK (≥0.5 hectares) is
created, stored and maintained by the National Forest Inventory (NFI) as a digital
woodland map. The map provides current and historical information on the distribution,
type and size of forests and woodland in the UK. The digital woodland map is produced
using aerial photography, satellite imagery and administrative records and updated
annually.
1.3.2 NFI woodland sample evaluation: an overview
NFI sample squares were located within the NFI mapped area using a stratified random
approach. Surveyors classify the area within each one hectare NFI sample square into
forest and non-forest. The forested area(s) within the sample square are then further
stratified into smaller units of homogenous canopy type based on differences in features
such as woodland habitat and tree species, or more subtle factors such as condition and
thinning history. Such contiguous ‘units’ of woodland are referred to as ‘stands’ for the
purposes of these reports. Within each forest stand, information on species, age,
management regime and other data is collected to enable assessment of each of the 15
ecological indicators described above.
Typically, there are multiple stands which may also be further divisible within each
sample square. This means, from the circa 15,000 sample squares covered by the NFI,
33,000 forest stands in Great Britain have been assessed for ecological condition, of
which circa 6,000 sample squares and circa 14,900 forest stands were in Scotland.
Within each stand two or three 100 m2 (0.01 hectare) circular plots were randomly
located. Within each of these circular plots, stocking was assessed and species, age,
grid location and diameter at breast height (DBH) was recorded for all trees ≥4 cm DBH.
A total of 650,000 trees were measured, of which 240,000 trees were measured in
Scotland. Transects were also conducted within each circular plot to assess the volume
of lying deadwood, seedlings and saplings.
Each of the sample squares are marked on the ground with metal pegs and their exact
location recorded by GPS to allow for quality assurance checks and future assessment.
All field measurements and information are subject to quality assurance checks.

NFI woodland condition classifications
10 NFI Condition Statistics
1.3.3 Ecological condition classification
The NFI WEC working group established a process for using the WEC indicator data to
classify and score woodlands according to their expected condition. Briefly, the process
developed involves the following steps:
1. Collect data on the WEC indicators as part of the NFI field survey.
2. Supply statistics on these indicators e.g. ‘x% of woodland stands showed
evidence of regeneration’.
3. Using ancient semi-natural woodland (ASNW) in good condition as a benchmark
(see below), define thresholds for classifying woodland stands into ‘favourable’,
‘intermediate’ or ‘unfavourable’ status for each WEC indicator (NB there is no
‘unfavourable’ category for stand-level regeneration).
4. Assign numerical scores to these categories and combine these scores for all WEC
indicators to provide an overall condition status score for each woodland stand.
5. Define thresholds to apply to the combined scores in order to classify woodland
stands into overall ‘favourable’, ‘intermediate’ or ‘unfavourable’ status.
6. Supply information on the classification and scores of woodlands e.g. ‘x% of
woodland stands were classified as being in favourable condition for the
regeneration indicator’.
7. Use the results from the first survey cycle as a baseline against which changes in
condition can be measured for monitoring purposes using data from future
surveys.
The indicators and classification thresholds were selected with reference to other work
(e.g. the Common Standards Monitoring approach for protected sites (JNCC, 2003)), the
best available scientific evidence, expert opinion and each country’s current policy needs
and targets. For example, to determine a ‘favourable’ level of seedlings, saplings and
small trees, a combination of published evidence and expert opinion was used. Details of
thresholds used can be found in the methodology report.
1.3.4 Extrapolating NFI field survey statistics to a reporting area
The data collected within each survey sample square (used for the 15 WEC indicators),
the derived scores and the classifications, were extrapolated and aggregated to the
areas of woodland recorded in the NFI map (e.g. woodland type) using standard
statistical survey methodology (refer to methodology report for more information). The
classifications of each stand can also be extrapolated up to any sub class of woodland
area, such as woodland type or habitat type (minimum size approx. 30, 000 ha,
depending on variance within the population and what is being reported) and in turn
broken down by any geographic area, such as by country or NFI region, as in this report.
This report presents the results for different woodland types (native, near-native and
fragments’, non-native) for Scotland, results specifically for England, Wales and GB are

NFI woodland condition classifications
11 NFI Condition Statistics
presented in companion reports (Figure 1.1). Results for individual priority woodland
habitats are available in the supplementary data.
1.3.5 The NFI Condition Calculator: an overview
To report on condition using the NFI data an analytical tool was developed, referred to
herein as the NFI ‘Condition Calculator’. This tool allows the detailed data recorded in
each NFI survey square to be analysed alongside the NFI woodland map and other data.
It automatically produces the stand-level condition results per woodland type and
aggregated statistics for the reporting area. The advantages of establishing an
automated reporting tool are that results can be generated on demand using a
consistent approach. The Condition Calculator will therefore allow the data from future
cycles of the NFI to be analysed using the same procedures, enabling reliable
comparisons for reporting on change.
1.3.6 Woodland and woodland type definitions
Woodland
An area of land over 0.5 hectares in extent, with 20% or more tree canopy cover, or the
potential to achieve that based upon established trees.
Native woodland
Stands with 50% or more native tree species occupancy in the upper canopy that either:
• Form a discrete woodland parcel with a minimum area of 0.5 ha.
• Form a woodland stand with a minimum area of 0.1 ha that is part of a woodland
that is 0.5 ha or larger.
Non-native woodland
Stands with less than 40% native species occupancy sitting within a woodland of any
size.
Near native and fragments
Stands that fail to meet the criteria for native or non-native woodland specified above
are classified as ‘near native and fragments’. Defining this category allows all woodland
area to be assessed and reported on for its ecological condition status. Pinpointing these
areas of woodland may help inform targeted restoration, as they may represent
previously native woodland area that has been overplanted with non-natives.
The near native and fragments woodland type can be subdivided into two subclasses:
1. Near native: have a native canopy cover of somewhere between 40% to 49% and thus are ‘nearly’ native.
2. Fragments: have 50% or more native tree species occupancy in the upper canopy but fall under the minimum size threshold of 0.1 ha, falling in the size range 0.05 ha to 0.099 ha.

NFI woodland condition classifications
12 NFI Condition Statistics
Not determinable
Areas classified as ‘not determinable’ apply to woodland areas that cannot be classified
due to insufficient tree or other attribute information, such as areas without canopy
cover and clear-fell sites with a weak vegetation layer. These form less than 0.5% of the
whole woodland population.

NFI woodland condition classifications
13 NFI Condition Statistics
2 Results Presented here are the scores of the woodland ecological condition assessment of
woodland in Scotland by woodland type. Given the large volume of data gathered in this
study it was decided that the reports would focus on results by country and woodland
type. Results by habitat type and region are available in the supporting data Excel
spreadsheets.
The nominal baseline date for estimates is an average of 2013 (mid-point of the survey)
and the time period over which the full series of field samples were collected was
January 2010 to January 2016.
All areas are rounded to the nearest 100 hectares. In some breakdowns, the estimates
in the body of the table may not sum to the quoted total because each individual value,
including the total, has been independently generated by the estimation procedure used
for results from the NFI sample survey.
2.1 Standard error Along with these estimates, associated sampling standard errors have also been
calculated and reported, giving a measure of accuracy, conditional upon the underlying
assumptions. The sampling standard error will account for random variation arising from
the selection of the sample and random measurement errors. However, standard error
will not account for any systematic biases in the field measurements but it is unlikely
that any substantial biases of this nature are present in the survey data because the
quality assurance processes account for this. Any standard error greater than 25% is
reported in amber text and represents a lower degree of assurance in the estimates.
NFI woodland condition classifications
14 NFI Condition Statistics
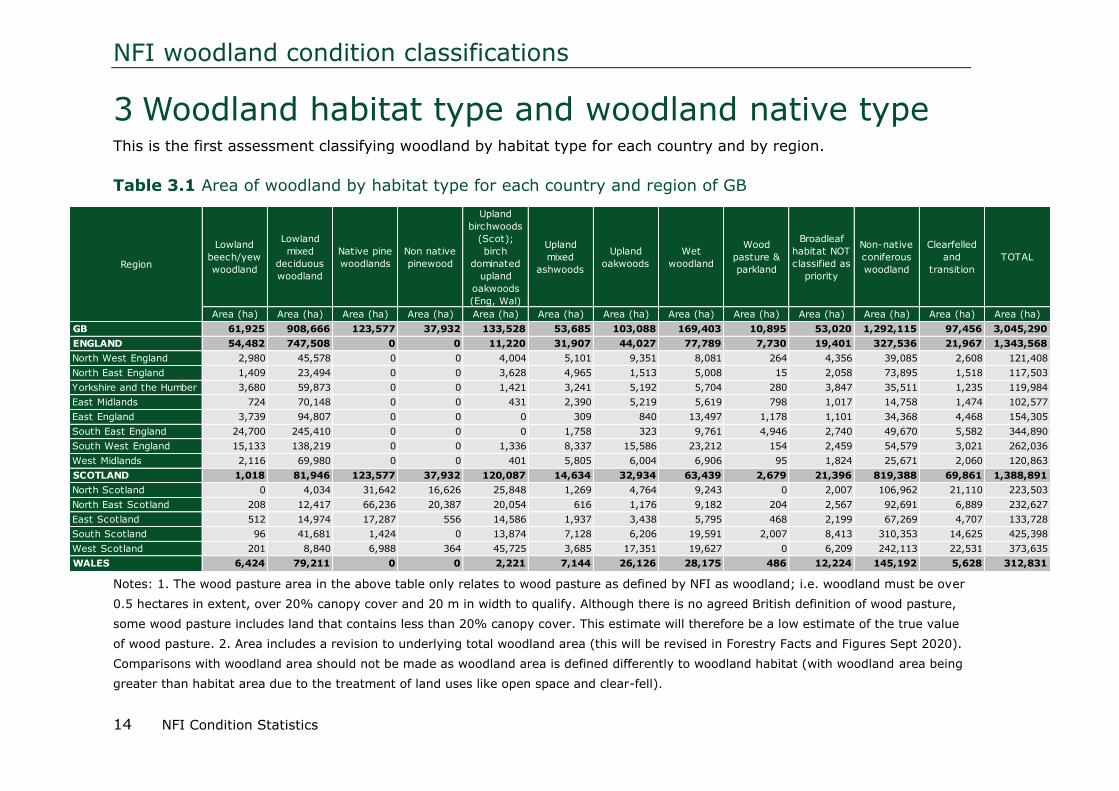
3 Woodland habitat type and woodland native type This is the first assessment classifying woodland by habitat type for each country and by region.
Table 3.1 Area of woodland by habitat type for each country and region of GB
Notes: 1. The wood pasture area in the above table only relates to wood pasture as defined by NFI as woodland; i.e. woodland must be over
0.5 hectares in extent, over 20% canopy cover and 20 m in width to qualify. Although there is no agreed British definition of wood pasture,
some wood pasture includes land that contains less than 20% canopy cover. This estimate will therefore be a low estimate of the true value
of wood pasture. 2. Area includes a revision to underlying total woodland area (this will be revised in Forestry Facts and Figures Sept 2020).
Comparisons with woodland area should not be made as woodland area is defined differently to woodland habitat (with woodland area being
greater than habitat area due to the treatment of land uses like open space and clear-fell).
Lowland
beech/yew
woodland
Lowland
mixed
deciduous
woodland
Native pine
woodlands
Non native
pinewood
Upland
birchwoods
(Scot);
birch
dominated
upland
oakwoods
(Eng, Wal)
Upland
mixed
ashwoods
Upland
oakwoods
Wet
woodland
Wood
pasture &
parkland
Broadleaf
habitat NOT
classified as
priority
Non-native
coniferous
woodland
Clearfelled
and
transition
TOTAL
Area (ha) Area (ha) Area (ha) Area (ha) Area (ha) Area (ha) Area (ha) Area (ha) Area (ha) Area (ha) Area (ha) Area (ha) Area (ha)
GB 61,925 908,666 123,577 37,932 133,528 53,685 103,088 169,403 10,895 53,020 1,292,115 97,456 3,045,290
ENGLAND 54,482 747,508 0 0 11,220 31,907 44,027 77,789 7,730 19,401 327,536 21,967 1,343,568
North West England 2,980 45,578 0 0 4,004 5,101 9,351 8,081 264 4,356 39,085 2,608 121,408
North East England 1,409 23,494 0 0 3,628 4,965 1,513 5,008 15 2,058 73,895 1,518 117,503
Yorkshire and the Humber 3,680 59,873 0 0 1,421 3,241 5,192 5,704 280 3,847 35,511 1,235 119,984
East Midlands 724 70,148 0 0 431 2,390 5,219 5,619 798 1,017 14,758 1,474 102,577
East England 3,739 94,807 0 0 0 309 840 13,497 1,178 1,101 34,368 4,468 154,305
South East England 24,700 245,410 0 0 0 1,758 323 9,761 4,946 2,740 49,670 5,582 344,890
South West England 15,133 138,219 0 0 1,336 8,337 15,586 23,212 154 2,459 54,579 3,021 262,036
West Midlands 2,116 69,980 0 0 401 5,805 6,004 6,906 95 1,824 25,671 2,060 120,863
SCOTLAND 1,018 81,946 123,577 37,932 120,087 14,634 32,934 63,439 2,679 21,396 819,388 69,861 1,388,891
North Scotland 0 4,034 31,642 16,626 25,848 1,269 4,764 9,243 0 2,007 106,962 21,110 223,503
North East Scotland 208 12,417 66,236 20,387 20,054 616 1,176 9,182 204 2,567 92,691 6,889 232,627
East Scotland 512 14,974 17,287 556 14,586 1,937 3,438 5,795 468 2,199 67,269 4,707 133,728
South Scotland 96 41,681 1,424 0 13,874 7,128 6,206 19,591 2,007 8,413 310,353 14,625 425,398
West Scotland 201 8,840 6,988 364 45,725 3,685 17,351 19,627 0 6,209 242,113 22,531 373,635
WALES 6,424 79,211 0 0 2,221 7,144 26,126 28,175 486 12,224 145,192 5,628 312,831
Region

NFI woodland condition classifications
15 NFI Condition Statistics
Table 3.2 Area of woodland by woodland type for each country and region of GB
Notes: 1. Woodland types are defined in Section 1.3. 2. Area includes a revision to underlying total
woodland area (this will be revised in Forestry Facts and Figures Sept 2020). Comparisons with woodland
area should not be made as woodland area is defined differently to woodland habitat (with woodland area
being greater than habitat area due to the treatment of land uses like open space and clear-fell
This is the first assessment of the extent of native woodland and priority habitat type,
across the whole of Scotland, based on a balanced stratified random sample of
woodlands. There have been two previous assessments of native woodland extent; The
Native Woodland Survey of Scotland (NWSS) and an analysis carried out using National
Vegetation Classification (NVC) survey information. NWSS is a census of native woods,
with a nominal date of 2012, which identified and mapped the location, extent, type and
condition of all of Scotland's native and nearly native woods, as well as plantations on
ancient woodland sites (PAWS). As two relatively recent assessments, the NFI and
NWSS estimates broadly align, although some differences emerge due to the different
methodologies used. In comparison, JNCC created estimates of the area of priority
habitat types in 2008 using National Vegetation Classification (NVC) data and 2,648
samples taken in ancient and recent woods throughout Britain (Rodwell 1991).
Differences between these and the NFI results largely arise from the lower sample size
and non-random sampling associated with the NVC dataset. In general, due to the
methodological differences, direct comparisons between the three datasets should not be
made.
NativeNear native &
fragmentsNon native
Not
determinableTotal
Area (ha) Area (ha) Area (ha) Area (ha) Area (ha)
GB 1,507,105 56,776 1,461,267 19,629 3,044,777
ENGLAND 914,095 29,459 398,186 1,706 1,343,446
North West England 73,932 2,329 45,152 421 121,834
North East England 36,201 3,005 77,982 149 117,338
Yorkshire and the Humber 68,954 3,783 46,837 271 119,845
East Midlands 73,964 2,305 26,272 37 102,577
East England 107,595 3,323 43,206 181 154,306
South East England 280,796 6,494 57,302 308 344,901
South West England 186,732 4,654 70,192 205 261,782
West Midlands 85,920 3,566 31,243 134 120,863
SCOTLAND 442,611 20,313 908,259 17,205 1,388,388
North Scotland 94,541 3,303 119,908 5,751 223,503
North East Scotland 111,260 3,781 115,197 2,248 232,485
East Scotland 48,860 2,647 80,049 2,171 133,728
South Scotland 78,739 7,026 336,526 2,709 425,000
West Scotland 109,211 3,556 256,579 4,327 373,672
WALES 150,399 7,004 154,822 718 312,943
Region

NFI woodland condition classifications
16 NFI Condition Statistics
4 Stand-level condition classification results for native woodland area in
Scotland
Table 4.1 Area of native woodland stands in Scotland classified as favourable,
intermediate or unfavourable for each of the 15 WEC indicators
Notes:
1. SE = standard error. Amber text = values with SE >25%.
2. Native is defined in Section 1.3.6.
3. Woodland ecological condition classification categories and indicators are defined in the methodology
report.
4. For more information refer to the methodology report.
5. Classification thresholds for ground flora; favourable, unfavourable and intermediate are adjusted for
different woodland NVC types, with ‘more’ being expected of nutrient rich types than nutrient poor
types.
Area
(000 ha)SE%
Area
(000 ha)SE%
Area
(000 ha)SE%
Ground flora 41.2 5.3 367.4 1.9 34.1 6.9
Tree pests and diseases 13.2 9.2 66.0 4.8 363.5 1.9
Invasive species 31.8 7.5 3.3 22.8 407.5 1.7
Herbivores / grazing pressure 234.9 2.7 36.6 5.0 171.1 3.0
Regeneration at component group level 0.0 – 405.0 1.7 37.6 6.2
Number of native tree and/or shrub species 179.1 2.8 156.6 3.9 106.9 3.3
Deadwood volume (m3 per ha) 360.5 1.9 61.6 4.8 20.4 8.1
Vertical structure 100.6 5.9 188.2 2.8 153.9 2.8
Veteran trees 436.8 1.6 2.3 25.2 3.5 24.1
Age distribution of tree species 189.3 3.2 211.1 2.5 42.3 6.0
Nativeness of occupancy 59.5 4.5 25.9 7.4 357.2 1.9
Proportion of open space 355.9 2.0 77.2 4.0 0.7 51.0
Proportion of woodland / favourable habitat 22.5 25.4 46.8 6.3 373.3 1.7
Size of woodland parcel 53.8 11.8 46.4 5.9 342.3 1.9
Regeneration at population level 37.3 6.9 335.4 2.0 69.9 4.6
Overall ecological condition score 10.8 53.3 409.3 1.6 13.8 11.4
Intermediate Favourable
Native
Unfavourable

NFI woodland condition classifications
17 NFI Condition Statistics
Figure 4.1 The proportion of each woodland ecological condition class, for each
WEC indicator in native woodland stands in Scotland
Notes:
1. Native is defined in Section 1.3.6
2. Woodland ecological condition classification categories and indicators are defined in methodology
report.
3. For more information refer to the methodology report.
4. Classification thresholds for ground flora; favourable, unfavourable and intermediate are adjusted for
different woodland NVC types, with ‘more’ being expected of nutrient rich types than nutrient poor
types.

NFI woodland condition classifications
18 NFI Condition Statistics
5 Stand-level condition classification results for near native woodland and
fragments in Scotland
Table 5.1 Area of near-native woodland and fragments in Scotland classified by
woodland ecological condition for each of the 15 WEC indicators
Notes:
1. SE = standard error. Amber text = values with SE > 25%.
2. Woodland type is defined in Section 1.3.6.
3. Woodland ecological condition classification categories and indicators are defined in methodology
report.
4. For more information refer to the methodology report.
5. Size of woodland parcel: Fragments tend to occur in larger woods, therefore the results may reflect
the overplanting of native woodland with large non-native plantation woods. NFI reports on
woodland area (2012) evidence that non-native woods are larger on average than native woods.
6. Classification thresholds for ground flora; favourable, unfavourable and intermediate are adjusted for
different woodland NVC types, with ‘more’ being expected of nutrient rich types than nutrient poor
types.
Area
(000 ha)SE%
Area
(000 ha)SE%
Area
(000 ha)SE%
Ground flora 2.8 33.3 15.8 8.1 1.7 24.0
Tree pests and diseases 0.2 34.8 2.9 22.2 17.2 8.7
Invasive species 4.2 18.9 < 0.1 63.3 16.1 8.9
Herbivores / grazing pressure 10.3 12.2 2.1 15.6 7.8 12.5
Regeneration at component group level 0.0 – 19.3 8.2 1.0 33.0
Number of native tree and/or shrub species 9.0 10.2 6.2 17.3 5.1 16.0
Deadwood volume (m3 per ha) 15.9 9.1 2.9 19.8 1.6 29.3
Vertical structure 3.9 12.3 7.4 14.8 9.1 12.3
Veteran trees 20.0 8.1 0.0 – 0.3 65.3
Age distribution of tree species 8.6 9.1 9.7 13.6 2.0 27.4
Nativeness of occupancy 17.4 8.1 0.1 38.9 2.8 28.8
Proportion of open space 19.7 8.8 2.7 15.1 < 0.1 51.1
Proportion of woodland / favourable habitat 0.6 40.6 2.6 22.5 17.1 8.8
Size of woodland parcel 3.2 29.3 2.4 18.8 14.7 8.5
Regeneration at population level 1.8 26.7 15.9 9.4 2.6 16.3
Overall ecological condition score 1.0 30.5 21.4 8.2 < 0.1 56.0
Intermediate Favourable
Near native & fragments
Unfavourable

NFI woodland condition classifications
19 NFI Condition Statistics
Figure 5.1 The proportion of each woodland ecological condition class, for each
WEC indicator type in near-native woodland and fragments in Scotland
Notes:
1. Woodland type is defined in Section 1.3.6.
2. Woodland ecological condition classification categories and indicators are defined in methodology
report.
3. For more information refer to the methodology report.
4. Size of woodland parcel: Fragments tend to occur in larger woods, therefore the results may reflect
the overplanting of native woodland with large non-native plantation woods. NFI reports on
woodland area (2012) evidence that non-native woods are larger on average than native woods.
5. Classification thresholds for ground flora; favourable, unfavourable and intermediate are adjusted for
different woodland NVC types, with ‘more’ being expected of nutrient rich types than nutrient poor
types.

NFI woodland condition classifications
20 NFI Condition Statistics
6 Stand-level condition classification results for non-native woodland stands
in Scotland
Table 6.1 Area of non-native woodland stands in Scotland classified by woodland
ecological condition classification for each of the 15 WEC indicators
Notes:
1. SE = standard error. Amber text = values with SE >25%.
2. Non-native is defined in Section 1.3.6.
3. Woodland ecological condition classification categories and indicators are defined in methodology
report.
4. For more information refer to the methodology report.
5. Classification thresholds for ground flora; favourable, unfavourable and intermediate are adjusted for
different woodland NVC types, with ‘more’ being expected of nutrient rich types than nutrient poor
types.
Area
(000 ha)SE%
Area
(000 ha)SE%
Area
(000 ha)SE%
Ground flora 128.5 3.2 716.1 1.0 63.7 5.0
Tree pests and diseases 21.6 6.5 112.5 3.8 774.2 0.9
Invasive species 40.0 6.3 1.7 23.6 866.5 0.7
Herbivores / grazing pressure 435.0 1.6 91.9 3.8 381.4 1.8
Regeneration at component group level 0.0 – 874.9 0.7 33.3 6.7
Number of native tree and/or shrub species 827.3 0.7 57.4 5.1 23.6 8.0
Deadwood volume (m3 per ha) 672.7 1.0 173.5 2.8 62.0 4.5
Vertical structure 373.6 1.7 393.2 1.7 141.5 3.4
Veteran trees 907.2 0.7 0.4 67.5 0.6 35.7
Age distribution of tree species 633.4 1.1 265.9 2.4 9.0 13.8
Nativeness of occupancy 908.3 0.7 0.0 – 0.0 –
Proportion of open space 723.0 1.0 191.9 2.7 0.6 20.5
Proportion of woodland / favourable habitat 18.0 10.9 58.6 5.7 831.7 0.7
Size of woodland parcel 31.6 7.8 45.3 6.2 831.4 0.7
Regeneration at population level 99.7 4.2 719.8 1.0 88.8 4.3
Overall ecological condition score 52.9 5.3 862.1 0.7 0.5 67.4
Intermediate Favourable
Non native
Unfavourable

NFI woodland condition classifications
21 NFI Condition Statistics
Figure 6.1 The proportion of each woodland ecological condition class, for each
WEC indicator type in non-native woodland stands in Scotland
Notes:
1. ’Non-native’ is defined in Section 1.3.6.
2. Woodland ecological condition classification categories and indicators are defined in methodology
report.
3. For more information refer to the methodology report.
4. Classification thresholds for ground flora; favourable, unfavourable and intermediate are adjusted for
different woodland NVC types, with ‘more’ being expected of nutrient rich types than nutrient poor
types.

NFI woodland condition classifications
22 NFI Condition Statistics
7 Condition scoring distribution Figure 7.1 The overall distribution of ecological condition class by woodland type in Scotland
Notes: 1. Native = native woodland area, Near native and fragments = Near native woodland area and fragments, non-native = non-native
woodland area. 2. The NFI calculator is used to score each of the 15 ecological condition indicators that can then be combined and used to
give an overall score, and classification as favourable (fav) score 36-45, intermediate (int) score 26-35 or unfavourable (unfav) score 16-25
by woodland type. 3. Dashed line = threshold of each condition classification. To inform where to set the thresholds for each of the three
classification categories published evidence was used. 4. Woodland types are defined in Section 1.3.6. 5. Refer to the methodology report
for more information.

NFI woodland condition classifications
23 NFI Condition Statistics
8 Discussion The EC Habitats Directive requires Member States to report on the conservation status of
habitats and species. This report presents the first evaluation of the condition of
woodland in Scotland and represents a decade of work for the NFI team and its partners.
The methodology used to assess and classify woodland area is evidence based,
systematic and objective. Most of the scores presented are based on statistics derived
from simple, objective measures of woodland such as tree counts, deadwood diameters
and species identification, as such the statistical estimates and their classification scores
have a great degree of certainty associated with them. Other indicators use more
complex measures, such as the level of herbivore browsing damage or squirrel stripping
high in the canopy. These can be harder to assess in the forest. For example, herbivore
impacts may be seasonal, and it is difficult to evaluate bark stripping from squirrels
many metres above the ground. Such factors have a greater degree of uncertainty in the
estimates and may be somewhat under-reported, but overall the broad trends identified
are thought to be accurate and have stood up to validation against comparable data
sources (where they exist*) and expert opinion. With these caveats in mind, these
results are Britain’s first systematic and repeatable assessment of woodland ecological
condition.
8.1 Woodland habitat area One of the most notable results from this study was that the total area of native
woodland in Great Britain is estimated to be 1.51 million hectares, about 50% more than
the previous estimate (986 thousand hectares, estimated in the 2008 priority habitat
assessment). The majority of the newly recorded native woodland is in the lowlands and
most woods are smaller than 2 ha in extent. Similarly, the native woodland area
estimate in Scotland has also risen. In Scotland circa 443 hectares is now classified as
native woodland, an increase of 132 thousand hectares on the previous estimate
reported in the 2012 NWSS assessment. Most of this increase in native woodland
resource is in North East and West Scotland. Recent advances in earth observation
technology have enabled the identification of such smaller areas of woodland than was
previously possible. Furthermore, the NFI has used smaller minimum area thresholds
than previous assessments (≥0.1 hectares within larger woods and >0.5 hectares as
discrete stands), so small areas of native woodland within other woodland habitat types
have been identified for the first time.
In addition to the increase in the estimate of native woodland area in Scotland,
estimations of the area of other woodland habitats have also generally increased pro
rata. However, increases in estimated areas are higher for some habitats compared to
* Independent surveys of deer presence, squirrel presence, invasive species and disease presence and levels of deadwood and veteran trees were available for comparison- see methodology paper.
NFI woodland condition classifications
24 NFI Condition Statistics
others. For example, the area classified as lowland mixed deciduous woodland has
increased to 82 thousand hectares in Scotland as compared to the 23 thousand hectares
previously estimated in the 2012 NWSS NVC assessment. This is most likely a result of
the fact that this habitat tends to dominate patches of smaller, lowland woods that are
harder to identify and thus weren’t incorporated into previous assessments.
Another factor that resulted in a disproportionate (but correct) increase in the estimated
relative area of one habitat type, was the NFI reduction in the minimum area of a
‘qualifying stand’ of a woodland habitat within a woodland from ≥0.1 ha to ≥0.01 ha
(refer to the methodology for more information). Therefore, woodland types such as
wet woodland, which naturally occur in smaller localised patches (of wetter land), have
been recorded and included in estimates for the first time, where previously they will
have been included in the counts of other woodland types. This has resulted in an
estimated wet woodland cover of around 63 thousand hectares compared with circa 45
thousand hectares that was recorded in the 2012 NWSS assessment in Scotland.
The area classified as native pine wood (124 thousand hectares) is greater than the 87.6
thousand hectares reported by the NWSS.
This study also suggests that there is a shift in the relative proportions between Upland
Oakwood and Upland Birchwood when compared to previous estimates in NWSS. This
study estimates 33 thousand hectares of Upland Oakwood in Scotland compared to the
NWSS estimate of 20 thousand hectares and estimates 120 thousand hectares of Upland
Birchwood in Scotland compared to the NWSS estimate of 91 thousand hectares. This
change in estimates is likely to be as a result of methodological differences between this
study and NWSS and how these two habitats are separated in situations where the two
habitats overlap.
8.2 Classification of woodland condition The WEC covers all of Scotland’s woodlands, native and non-native, semi-natural and
plantation alike. The results present a robust evidence base, comparing all woods to a
single benchmark, and providing the first systematic measure of woodland ecological
condition. Each woodland stand was scored for each of the 15 woodland ecological
condition indicators, and the scores combined to give an overall score of favourable,
intermediate or unfavourable. The scoring method was to take each woodland stand and
compare each of the 15 indicators to the characteristics of a benchmark, namely ‘semi-
natural woodland in favourable condition’ (refer to the Methodology report for more
information). Scoring thresholds were set using published evidence where possible or, if
this was unavailable, expert opinion. For example, to determine a ‘favourable’ number of
seedlings, saplings and small trees in a woodland, a combination of published evidence
and expert opinion was used.
NFI woodland condition classifications
25 NFI Condition Statistics
Each indicator measures a different aspect of woodland condition and can be used to
indicate the likely health of specific elements of biodiversity. For example, volume of
deadwood can be used as an indicator of the potential presence of associated taxa, such
as saproxylic fungi or invertebrates. Limiting the list of woodland ecological condition
indicators to 15 measures is a simplification of an exceptionally complex ecosystem,
however, it is a compromise between the resources necessary to carry out the survey
work and the data required to describe condition comprehensively. The WEC provides a
good indication of where potential issues may lie or where potential positive trends may
occur, but the results are not an absolute measure of ecological condition status.
As might be expected, non-native woods do not score as highly as native woods. In
particular, they scored lower on parameters such as natural regeneration (of natives and
non-natives). Whilst ecological condition is not the primary objective of management for
productive woodlands, the application of a consistent benchmark to all woodland types
provides a transparent and consistent measure, allowing all woodland types to be
compared equally, as well as highlighting where non-native woodland scores well. This
consistent application of a single benchmark of condition has reflected positively on non-
native plantations in Scotland, as 6% of non-native woodland were classified as
‘unfavourable’ overall, compared to just 2.5% of native woodlands. Non-native stands
also scored equally to or higher than some native woods for some of the indicators, for
example, a higher proportion of non-native stands were ‘favourable’ for deadwood and
invasive species.
The results suggest that the indicators with the greatest area of native woodlands that
score poorly (>20% of native woodland scoring unfavourable) are:
1. Age distribution of trees
2. Veteran trees and deadwood volume
3. Herbivores/grazing pressure
4. Proportion of open space
Other indicators of particular importance in native woodlands, including invasive species
and pests and diseases, affect a smaller total area of stands across the country.
However, they have a major impact on ecological condition where present. Future
iterations of the NFI will be important to monitor trends and changes in these indicators.
The study has also highlighted some positive results for woodland ecology in Britain:
1. There is now evidence to classify more woodland in Britain as native than
previously evidenced
2. Some habitats that were previously thought to be rare, such as wet woodland, are
in fact more extensive than previously evidenced
NFI woodland condition classifications
26 NFI Condition Statistics
3. 3% of native woods fall into favourable ecological status overall
4. Most non-native woodlands are classified favourable for size of woodland parcel
and proportion of favourable habitat in the locality
5. 81% of native woods achieving favourable status for native canopy occupancy
6. 60% of native woods achieved favourable or intermediate status for the number
of native trees and shrubs species in the canopy
8.3 Conclusion This is the largest and most in-depth study of ecological condition of any habitat in
Scotland to date. The results present a valuable insight into the current ecological
condition of woodland habitat in Scotland and provide a foundation and reference data
set for future work and added value. The reader is pointed towards the companion
reports for additional information on the methodology and statistics.
8.4 Future work NFI plan to repeat this exercise for data collected in the NFI second cycle of survey 2015
to 2020. This repeated survey using consistent techniques will provide two data points of
woodland condition from which trends and changes in woodland condition can be
assessed.
Further detailed analysis of each indicator will reveal areas of potential research and
indicate topic areas where existing guidance may need to be reviewed or improved.
NFI woodland condition classifications
27 NFI Condition Statistics
9 References See methodology report.
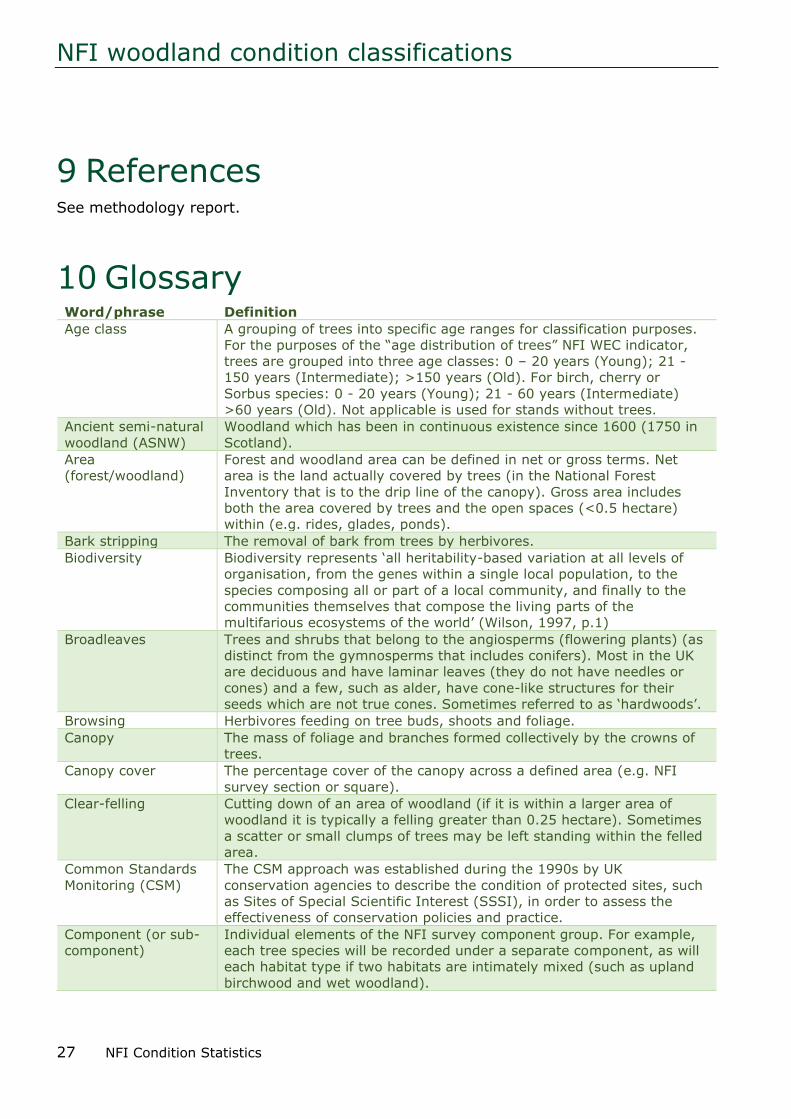
10 Glossary Word/phrase Definition
Age class A grouping of trees into specific age ranges for classification purposes.
For the purposes of the “age distribution of trees” NFI WEC indicator,
trees are grouped into three age classes: 0 – 20 years (Young); 21 -
150 years (Intermediate); >150 years (Old). For birch, cherry or
Sorbus species: 0 - 20 years (Young); 21 - 60 years (Intermediate)
>60 years (Old). Not applicable is used for stands without trees.
Ancient semi-natural
woodland (ASNW)
Woodland which has been in continuous existence since 1600 (1750 in
Scotland).
Area
(forest/woodland)
Forest and woodland area can be defined in net or gross terms. Net
area is the land actually covered by trees (in the National Forest
Inventory that is to the drip line of the canopy). Gross area includes
both the area covered by trees and the open spaces (<0.5 hectare)
within (e.g. rides, glades, ponds).
Bark stripping The removal of bark from trees by herbivores.
Biodiversity Biodiversity represents ‘all heritability-based variation at all levels of
organisation, from the genes within a single local population, to the
species composing all or part of a local community, and finally to the
communities themselves that compose the living parts of the
multifarious ecosystems of the world’ (Wilson, 1997, p.1)
Broadleaves Trees and shrubs that belong to the angiosperms (flowering plants) (as
distinct from the gymnosperms that includes conifers). Most in the UK
are deciduous and have laminar leaves (they do not have needles or
cones) and a few, such as alder, have cone-like structures for their
seeds which are not true cones. Sometimes referred to as ‘hardwoods’.
Browsing Herbivores feeding on tree buds, shoots and foliage.
Canopy The mass of foliage and branches formed collectively by the crowns of
trees.
Canopy cover The percentage cover of the canopy across a defined area (e.g. NFI
survey section or square).
Clear-felling Cutting down of an area of woodland (if it is within a larger area of
woodland it is typically a felling greater than 0.25 hectare). Sometimes
a scatter or small clumps of trees may be left standing within the felled
area.
Common Standards
Monitoring (CSM)
The CSM approach was established during the 1990s by UK
conservation agencies to describe the condition of protected sites, such
as Sites of Special Scientific Interest (SSSI), in order to assess the
effectiveness of conservation policies and practice.
Component (or sub-
component)
Individual elements of the NFI survey component group. For example,
each tree species will be recorded under a separate component, as will
each habitat type if two habitats are intimately mixed (such as upland
birchwood and wet woodland).

NFI woodland condition classifications
28 NFI Condition Statistics
Word/phrase Definition
Component group Homogeneous areas of the NFI survey that are too small (<0.05 ha) to
practically map using Geographic Information System (GIS) software in
the field, but with most of the same defining characteristics as a
section. Component groups can be subdivided into components.
Condition Shorthand for Woodland Ecological Condition.
Conifers Trees and shrubs that belong to the gymnosperms, as distinct from the
angiosperms that include broadleaves). Conifers mostly have needles or
scale-like leaves and are usually evergreen. Sometimes referred to as
‘softwoods’.
Convention on
Biological Diversity
(CBD)
A multilateral treaty to develop national strategies for the conservation
and sustainable use of biological diversity.
Crown dieback The death of branches within a tree’s crown.
Deadwood Non-living woody biomass not contained in the litter, either standing or
lying on the ground (the NFI ‘volume of deadwood’ indicator does not
include data on stumps).
Diameter at breast
height (DBH)
The diameter on the stem of a tree at ‘breast height’, defined as 1.3 m
from ground level.
Drip line The drip line is the furthest tip of the widest branch in the crown; the
last point from which the tree can drip if wet. If two treed sections have
drip lines that cross over each other use the centre line of the cross
over.
Earth observation The collection of information about the physical, chemical, and
biological systems of the planet via remote-sensing technologies.
Ecology The relations of organisms to one another and to their physical
surroundings.
Establishment The formative period that ends once young trees are of sufficient size
that, given adequate protection, they are likely to survive at the
required stocking. This varies for species and according to
environmental condition, but is typically from around five to twenty
years.
EU Habitats Directive The EU Habitats Directive (Directive 92/43/EEC) aims to promote the
maintenance of biodiversity by requiring Member States to take
measures to maintain or restore natural habitats and wild species listed
on its Annexes to a favourable conservation status (JNCC, 2018).
(Vegetation) field
layer
Vegetation 10 cm to 2 m tall measured as part of the NFI vegetation
assessment.
Flora The plants of a particular region, habitat, or geological period.
Forest (or woodland) See woodland
Forestry Commission
(FC)
The government department responsible for regulating forestry,
implementing forestry policy and managing state forests in England. It
was formerly also responsible for Forestry in Wales and Scotland,
however on 1 April 2013 the Forestry Commission's functions in Wales
transferred to a new organisation, Natural Resources Wales. From 1
April 2019, forestry was fully devolved, except for common issues
addressed on a GB or UK basis, such as international forestry, plant
health and forestry standards. Following devolution, two new Scottish
Government agencies were created, Scottish Forestry and Forest &
Land Scotland.
Forestry and Land
Scotland (FLS)
The Scottish Government agency responsible for managing Scotland’s
national forests and land.

NFI woodland condition classifications
29 NFI Condition Statistics
Word/phrase Definition
Fragments Small areas of woodland with 50% or more native tree species
occupancy in the upper canopy, but that fall in the size range 0.05 ha
to 0.099 ha.
Geographic
Information System
(GIS)
A system designed to capture, store, manipulate, analyse, manage, and
present spatial or geographic data.
Global Positioning
System (GPS)
A satellite-based global navigation satellite system that provides
geolocation and time information to a GPS receiver.
Great Britain (GB) England, Scotland and Wales.
(Vegetation) ground
layer
Vegetation 0 – 10 cm tall measured as part of the NFI vegetation
assessment.
Habitat Action Plan
(HAP)
For all UK BAP priority habitats classified between 1995 and 1999, a
Habitat Action Plan (HAP) was created (45 in total). For the habitats
added to the priority habitats list in 2007, no UK action plans have
been, or will be, produced, as conservation action is now primarily
carried out at a country-level, rather than a UK-level, in response to the
generation of country-level biodiversity strategies and aims (JNCC,
2019a).
Herbivore An animal that is adapted to eating plant material for the main
component of its diet.
Hectare (ha) Unit of area defined as 10,000 square metres (100 m by 100 m),
approximately equivalent to 2.47 acres.
Indicator A quantitative or qualitative parameter that synthesises complex
information and can be periodically measured to assess trends over
time. 15 stand level indicators were selected to assess the condition of
woodlands as part of the NFI WEC approach.
Invasive species A species that is not native to a location, where it is likely to cause
ecological or economic harm.
Invertebrate A cold-blooded animal that does not have a backbone.
Lichen A composite organism that arises from algae or cyanobacteria living
among filaments of multiple fungi species in a mutualistic relationship.
National Forest
Inventory (NFI)
National forest inventories are carried out in GB by the FC to provide
accurate, up-to-date information about the size, distribution,
composition and condition of the forests and woodlands. The current
NFI, which began in 2009, is a multi-purpose operation that has
involved the production of a forest and woodland map for GB and a
continuing programme of field surveys of the mapped forest and
woodland areas.
National Forest
Inventory map
An earth observation-based programme that monitors and maps the
extent and location of woodlands across GB on an annual basis.
National Forest
Inventory field
survey
A field survey of a large, stratified-random sample (15,100 sites) of
woodlands across GB on a 5-year rolling cycle using a standardised
protocol.
Native species Species that have arrived and inhabited an area naturally, without
deliberate assistance by man. For trees and shrubs in the United
Kingdom usually taken to mean those present after post-glacial re-
colonisation (around 11,000 years ago) and before historic times. Some
species are only native in particular regions - hence locally native.
Natural England (NE) The government’s adviser for the natural environment in England.
Natural England is an executive non-departmental public body,
sponsored by Defra.

NFI woodland condition classifications
30 NFI Condition Statistics
Word/phrase Definition
Naturalised species A species that, once it is introduced outside its native distributional
range, establishes self-sustaining populations.
Natural Resources
Wales (NRW)
The organisation responsible for advising the Welsh Government on the
environment, created on 1 April 2013. NRW is responsible for the
functions previously carried out by the Environment Agency in Wales,
the Countryside Council for Wales and Forestry Commission Wales.
National Vegetation
Classification (NVC)
Vegetation classification system commonly used in Great Britain.
Native woodland Woodland with 50% or more native tree species occupancy in the upper
canopy that either:
- Forms a discrete woodland parcel with a minimum area of 0.5 ha.
- Forms a woodland stand with a minimum area of 0.1 ha that is part
of a woodland that is 0.5 ha or larger.
Native Woodland
Survey of Scotland
(NWSS)
A survey of all native woodlands, nearly native
woodlands and non-native plantations on ancient woodland sites in
Scotland.
Near native
woodland
‘Nearly’ native woodland with 40% to 49% native species canopy cover.
NFI Condition
Calculator
An analytical GIS tool developed to automatically produces the
component group-level NFI WEC indicator results per woodland type
and aggregated statistics for the reporting area.
NFI WEC working
group
The expert committee that was established to develop the NFI WEC
indicator approach. This group consists of representatives from
(former) FC England and Scotland, Scottish Natural Heritage, Natural
England, Natural Resources Wales and the Welsh Government.
Non-native woodland Woodland with less than 40% native species occupancy.
(Woodland) parcel Discrete blocks of woodland that are separated from other woodland
parcels by gaps of at least 20 m in length.
Private sector estate Forests and woodlands in the UK not managed by the Forestry
Commission, Natural Resources Wales or Forest Service. In the context
of the National Forest Inventory, ‘Private sector’ is used for convenience
although it includes land owned or managed by bodies such as local
authorities and charities.
(Natural)
Regeneration
The regeneration of existing woodland by natural means, i.e. without
sowing or planting.
(Ecological) resilience The ecological resilience of woodland ecosystems refers to their ability
to absorb disturbance while maintaining the major habitat-forming
species that define their structure and ecosystem functioning.
Resilience incorporates both the woodland ecosystem’s ability to resist
changes in response to disturbance or, failing this, its capacity to
recover functioning via adaptation.
(NFI) sample square The one-hectare (100 m by 100 m) square plots, which may be entirely
within woodland or may overlap the woodland edge, used for the NFI
field survey.
Sapling Young tree ≥50 cm tall and <4 cm in diameter.
Saproxylic Dependent on deadwood.
(NFI WEC) score An ordinal score is assigned to the individual indicator classes of
‘unfavourable’ (1), ‘intermediate’ (2) and ‘favourable’ (3). The scores
are summed for all 15 indicators to provide each stand’s overall
ecological condition score, which has a maximum value of 45.

NFI woodland condition classifications
31 NFI Condition Statistics
Word/phrase Definition
Scottish Natural
Heritage (SNH)
The public body responsible for protecting and promoting Scotland's
natural heritage, especially its natural, genetic and scenic diversity. To
be renamed ‘NatureScot’ from May 2020.
Section Within each NFI sample square, the forest was stratified into different
woodland ‘sections’. Sections are defined by individual strata at least
0.05 ha in size that are differentiated on basis of forest type, habitat,
land use, silviculture system, tree and shrub composition, age and
structure.
Seedling Young tree <50 cm tall.
Shrub Woody plants often (but not always) branching abundantly from the
base that are between 2-5 m tall.
(Vegetation) shrub
layer
Vegetation 2-5 m tall measured as part of the NFI vegetation
assessment.
Site of Special
Scientific Interest
(SSSI)
A formal conservation designation that is applied to areas of particular
interest to science because of the geology/geomorphology features or
species it contains or supports.
(Woodland)
Stand
A distinct area of woodland (from either planting or natural
regeneration), generally composed of a uniform group of trees in terms
of species composition and spatial distribution, and age and size class
distribution.
Standard error (SE) The measure of the margin of error associated with an estimate as a
result of sampling from a population with statistical variability. Larger
standard errors indicate less precision in the estimate. Standard errors
in this report are quoted in relative terms (i.e. as percentages of the
value of the estimate). In this report, any standard error greater than
25% is reported in amber italics and represents a lower degree of
assurance in the estimates.
Stocking The density of trees within a woodland.
Stump The above-ground base part of a tree that would usually remain after
felling.
Transect A path along which a survey is carried out.
Transition woodland Land classified as woodland area that is in transition between no tree
cover and tree cover. Examples include clear-fell sites, restock sites,
new planting sites and land with natural regeneration.
UK Biodiversity
Action Plan (UK BAP)
The UK government's national biodiversity action plan that was
developed in response to the Convention on Biological Diversity and
replaced by the ‘UK Post-2010 Biodiversity Framework’ in 2012
following new international targets. It described the biological resources
of the UK and provided detailed plans for conservation of these
resources (JNCC, 2019a). The UK BAP priority habitats were identified
as the most threatened habitats requiring conservation action under the
UK BAP.
UK Forestry Standard
(UKFS)
The reference standard for sustainable forest management across the
UK that applies to all woodland to ensure that international agreements
and conventions on areas such as sustainable forest management,
climate change, biodiversity and the protection of water resources are
applied in the UK.
United Kingdom (UK) Great Britain and Northern Ireland.
NFI woodland condition classifications
32 NFI Condition Statistics
Word/phrase Definition
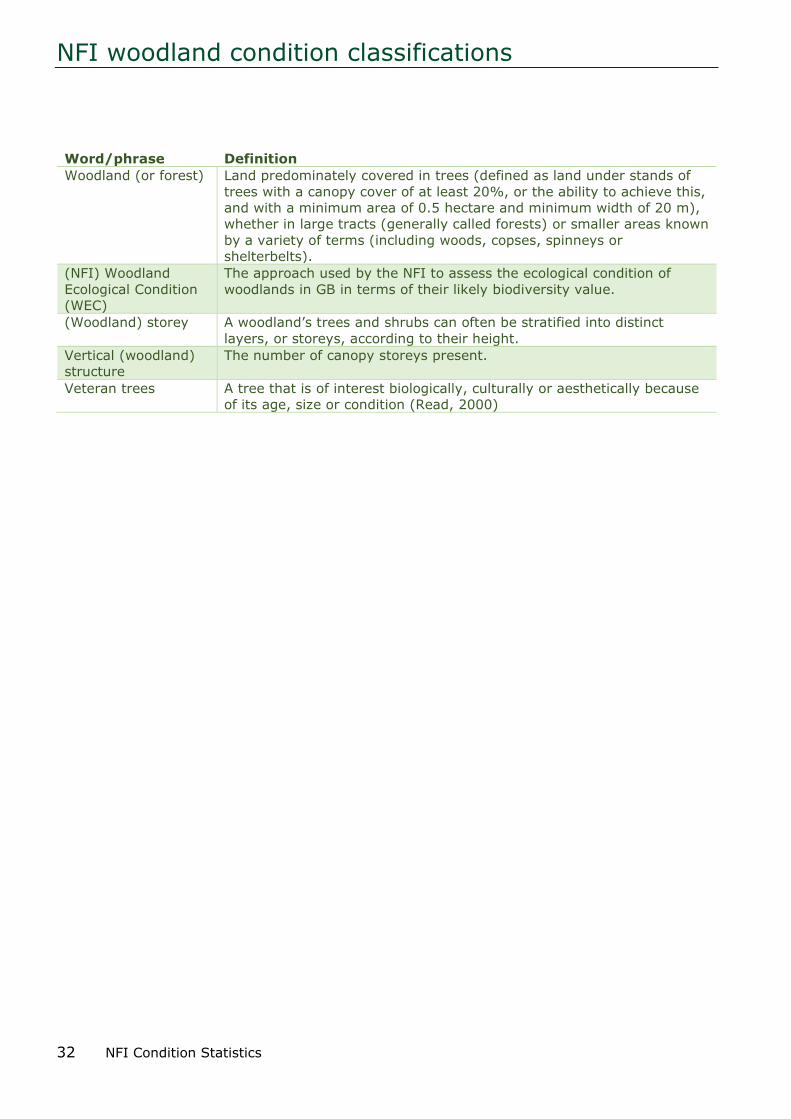
Woodland (or forest) Land predominately covered in trees (defined as land under stands of
trees with a canopy cover of at least 20%, or the ability to achieve this,
and with a minimum area of 0.5 hectare and minimum width of 20 m),
whether in large tracts (generally called forests) or smaller areas known
by a variety of terms (including woods, copses, spinneys or
shelterbelts).
(NFI) Woodland
Ecological Condition
(WEC)
The approach used by the NFI to assess the ecological condition of
woodlands in GB in terms of their likely biodiversity value.
(Woodland) storey A woodland’s trees and shrubs can often be stratified into distinct
layers, or storeys, according to their height.
Vertical (woodland)
structure
The number of canopy storeys present.
Veteran trees A tree that is of interest biologically, culturally or aesthetically because
of its age, size or condition (Read, 2000)

NFI woodland condition classifications
33 NFI Condition Statistics
11 Annex Table 11.1 Classification threshold summary

NFI woodland condition classifications
34 NFI Condition Statistics
12 NFI national reports
This inventory report is one of a series of publications reporting the outputs of the
Forestry Commission National Forest Inventory.
These and NFI data can be found on the NFI website
www.forestresearch.gov.uk\inventory.
Official Statistics This is not an Official Statistics publication, but it does include two tables of official
statistics (Tables 3.1 and 3.2). More information about Official Statistics and the UK
Statistics Authority is available at www.statisticsauthority.gov.uk
National Forest Inventory Statistician: David Ross
Survey design B. Ditchburn and A. Brewer
Authors B. Ditchburn, T. Wilson, L. Henderson, K. Kirby and P. Steel.
Publication support V. Correia, D. Ross, L. Halsall, W. Peden, H. Stephenson and C. Bellamy
Reviewers and steer For a list of those who assisted in the quality assurance of these statistics, please see
the Forest Research statistics webpages.
Lead Reviewers: Colin Edwards, Emma Goldberg, Jeanette Hall, Rebecca Isted, Fiona Macfarlane, Neil Riddle and Chris Tucker
For more information and to view and download Forest Research publications, visit:
www.forestresearch.gov.uk/publications
We will consider all requests to make the content of our publications available in
alternative formats. Please email: [email protected]